Welcome message from author
This document is posted to help you gain knowledge. Please leave a comment to let me know what you think about it! Share it to your friends and learn new things together.
Transcript
Contents
Cover
Series
TitlePage
Copyright
Dedication
Foreword
Preface
Acknowledgments
AbouttheAuthor
Chapter1:Introduction1.1LESSONSFROMACRISIS1.2FINANCIALRISKANDACTUARIALRISK1.3SIMULATIONANDSUBJECTIVEJUDGMENT
Chapter2:InstitutionalBackground2.1MORALHAZARD—INSIDERSANDOUTSIDERS2.2PONZISCHEMES2.3ADVERSESELECTION

2.4THEWINNER'SCURSE2.5MARKETMAKINGVERSUSPOSITIONTAKING
Chapter3:OperationalRisk3.1OPERATIONSRISK3.2LEGALRISK3.3REPUTATIONALRISK3.4ACCOUNTINGRISK3.5FUNDINGLIQUIDITYRISK3.6ENTERPRISERISK3.7IDENTIFICATIONOFRISKS3.8OPERATIONALRISKCAPITAL
Chapter4:FinancialDisasters4.1DISASTERSDUETOMISLEADINGREPORTING4.2DISASTERSDUETOLARGEMARKETMOVES4.3DISASTERSDUETOTHECONDUCTOFCUSTOMERBUSINESS
Chapter5:TheSystemicDisasterof2007–20085.1OVERVIEW5.2THECRISISINCDOSOFSUBPRIMEMORTGAGES5.3THESPREADOFTHECRISIS5.4LESSONSFROMTHECRISISFORRISKMANAGERS5.5LESSONSFROMTHECRISISFORREGULATORS5.6BROADERLESSONSFROMTHECRISIS
Chapter6:ManagingFinancialRisk6.1RISKMEASUREMENT6.2RISKCONTROL

Chapter7:VaRandStressTesting7.1VARMETHODOLOGY7.2STRESSTESTING7.3USESOFOVERALLMEASURESOFFIRMPOSITIONRISK
Chapter8:ModelRisk8.1HOWIMPORTANTISMODELRISK?8.2MODELRISKEVALUATIONANDCONTROL8.3LIQUIDINSTRUMENTS8.4ILLIQUIDINSTRUMENTS8.5TRADINGMODELS
Chapter9:ManagingSpotRisk9.1OVERVIEW9.2FOREIGNEXCHANGESPOTRISK9.3EQUITYSPOTRISK9.4PHYSICALCOMMODITIESSPOTRISK
Chapter10:ManagingForwardRisk10.1INSTRUMENTS10.2MATHEMATICALMODELSOFFORWARDRISKS10.3FACTORSIMPACTINGBORROWINGCOSTS10.4RISKMANAGEMENTREPORTINGANDLIMITSFORFORWARDRISK
Chapter11:ManagingVanillaOptionsRisk11.1OVERVIEWOFOPTIONSRISKMANAGEMENT11.2THEPATHDEPENDENCEOFDYNAMICHEDGING11.3ASIMULATIONOFDYNAMICHEDGING

11.4RISKREPORTINGANDLIMITS11.5DELTAHEDGING11.6BUILDINGAVOLATILITYSURFACE11.7SUMMARY
Chapter12:ManagingExoticOptionsRisk12.1SINGLE-PAYOUTOPTIONS12.2TIME-DEPENDENTOPTIONS12.3PATH-DEPENDENTOPTIONS12.4CORRELATION-DEPENDENTOPTIONS12.5CORRELATION-DEPENDENTINTERESTRATEOPTIONS
Chapter13:CreditRisk13.1SHORT-TERMEXPOSURETOCHANGESINMARKETPRICES13.2MODELINGSINGLE-NAMECREDITRISK13.3PORTFOLIOCREDITRISK13.4RISKMANAGEMENTOFMULTINAMECREDITDERIVATIVES
Chapter14:CounterpartyCreditRisk14.1OVERVIEW14.2EXCHANGE-TRADEDDERIVATIVES14.3OVER-THE-COUNTERDERIVATIVES
References
AbouttheCompanionWebsite
Index

Founded in 1807, John Wiley & Sons is the oldest independent publishingcompanyintheUnitedStates.WithofficesinNorthAmerica,Europe,Australia,andAsia,Wiley is globally committed to developing andmarketing print andelectronic products and services for our customers' professional and personalknowledgeandunderstanding.TheWileyFinanceseriescontainsbookswrittenspecifically for financeand
investmentprofessionalsaswell as sophisticated individual investorsand theirfinancial advisors. Book topics range from portfolio management to e-commerce, risk management, financial engineering, valuation, and financialinstrumentanalysis,aswellasmuchmore.Foralistofavailabletitles,visitourWebsiteatwww.WileyFinance.com.


Coverimage:JohnWiley&Sons,Inc.Coverdesign:©TomFewsteriStockphoto,©samxmegiStockphoto
Copyright©2013byStevenAllen.Allrightsreserved.PublishedbyJohnWiley&Sons,Inc.,Hoboken,NewJersey.
PublishedsimultaneouslyinCanada.TheFirstEditionofthisbookwaspublishedin2003byJohnWiley&Sons,Inc.Nopartofthispublicationmaybereproduced,storedinaretrievalsystem,ortransmittedinanyformorbyanymeans,electronic,mechanical,photocopying,recording,scanning,orotherwise,exceptaspermittedunderSection107or108
ofthe1976UnitedStatesCopyrightAct,withouteitherthepriorwrittenpermissionofthePublisher,orauthorizationthroughpaymentoftheappropriateper-copyfeetotheCopyrightClearanceCenter,Inc.,222RosewoodDrive,Danvers,MA01923,(978)750-8400,fax(978)646-8600,orontheWebatwww.copyright.com.RequeststothePublisherforpermissionshouldbe
addressedtothePermissionsDepartment,JohnWiley&Sons,Inc.,111RiverStreet,Hoboken,NJ07030,(201)748-6011,fax(201)748-6008,oronlineat
http://www.wiley.com/go/permissions.LimitofLiability/DisclaimerofWarranty:Whilethepublisherandauthorhaveusedtheirbesteffortsinpreparingthisbook,theymakenorepresentationsorwarrantieswithrespecttotheaccuracyorcompletenessofthecontentsofthisbookandspecificallydisclaimanyimpliedwarrantiesofmerchantabilityor
fitnessforaparticularpurpose.Nowarrantymaybecreatedorextendedbysalesrepresentativesorwrittensalesmaterials.Theadviceandstrategiescontained
hereinmaynotbesuitableforyoursituation.Youshouldconsultwithaprofessionalwhereappropriate.Neitherthepublishernorauthorshallbeliableforanylossofprofitoranyothercommercialdamages,includingbutnotlimited
tospecial,incidental,consequential,orotherdamages.Forgeneralinformationonourotherproductsandservicesorfortechnical
support,pleasecontactourCustomerCareDepartmentwithintheUnitedStatesat(800)762-2974,outsidetheUnitedStatesat(317)572-3993orfax(317)572-
4002.Wileypublishesinavarietyofprintandelectronicformatsandbyprint-on-
demand.Somematerialincludedwithstandardprintversionsofthisbookmaynotbeincludedine-booksorinprint-on-demand.Ifthisbookreferstomedia
suchasaCDorDVDthatisnotincludedintheversionyoupurchased,youmaydownloadthismaterialathttp://booksupport.wiley.com.Formoreinformation
aboutWileyproducts,visitwww.wiley.com.LibraryofCongressCataloging-in-PublicationData:
Allen,Steven,1945–Financialriskmanagement[electronicresource]:apractitioner'sguideto
managingmarketandcreditrisk/StevenAllen.—2nded.
1onlineresource.Includesbibliographicalreferencesandindex.
DescriptionbasedonprintversionrecordandCIPdataprovidedbypublisher;resourcenotviewed.
ISBN978-1-118-17545-3(cloth);978-1-118-22652-0(ebk.);ISBN978-1-118-23164-7(ebk.);ISBN978-1-118-26473-7(ebk.)1.Financialriskmanagement.2.Finance.I.Title.
HD61658.15'5—dc23
2012029614

ToCarolineForallthewaysshehashelpedbring
thisprojecttofruitionAndformuch,muchmore
Foreword
RiskwasaloteasiertothinkaboutwhenIwasadoctoralstudentinfinance25years ago. Back then, risk was measured by the variance of your wealth.Loweringriskmeant loweringthisvariance,whichusuallyhadtheunfortunateconsequenceofloweringtheaveragereturnonyourwealthaswell.In those halcyon days, we had only two types of risk, systemic and
unsystematic.Thelatteronecouldbeloweredforfreeviadiversification,whiletheformeronecouldonlybeloweredbytakingahit toaveragereturn.Inthatidyllic world, financial risk management meant choosing the variance thatmaximizedexpectedutility.Onemerelyhad tosolveanoptimizationproblem.Whatcouldbeeasier?I started to appreciate that financial riskmanagement might not be so easy
when I moved from theWest Coast to the East Coast. The NewYork–basedbanksstartedcreatingwholedepartmentstomanagefinancialrisk.Whydoyouneeddozensofpeopletosolveasimpleoptimizationproblem?AsItalkedwiththedenizensofthosedepartments,Inoticedtheykeptintroducingtypesofriskthatwerenotinmyfinanciallexicon.Firsttherewascreditrisk,atermthatwasto be differentiated from market risk, because you can lose money lendingwhetheramarketexistsornot.Fine,Igotthat,butthencameliquidityriskontop ofmarket and credit risk. Just as Iwas struggling to integrate these threetypesofrisk,peoplestartedworryingaboutoperationalrisk,basisrisk,mortalityrisk,weatherrisk,estimationrisk,counterpartycreditrisk,andeventheriskthatyourmodelsforalltheseriskswerewrong.Ifmodelriskexisted,thenyouhadtoconcedethatevenyourmodelformodelriskwasrisky.Sincetheproposedsolutionforallthesenewriskswerenewmodelsandsince
the proposed solution for the model risk of the new models was yet moremodels, it was no wonder all of those banks had all of those people runningaroundmanagingallofthoserisks.Well,apparently,notquiteenoughpeople.AsIwrite thesewords, themedia
arehavingafielddaydenouncingJPMorgan'sroughly$6billionlossrelatedtotheLondonwhale'sill-fatedforayintocreditdefaultswaps(CDSs).As the flagbearer for theTVgeneration, Ican'thelpbut thinkof revivinga
1970s TV show to star Bruno Iksil as the Six Billion Dollar Man. As eye-popping as these numbers are, they are merely the fourth largest trading loss
since the first editionof this bookwas released. Ifwe ignoreBernieMadoff's$50 billion Ponzi scheme, the distinction for the worst trade ever belongs toHowieHubler,wholost$9billiontradingCDSsin2008foranotherbankwhosenameI'drathernotwrite.However,ifyoureallyneedtoknow,thenhere'sahint.The present occupant of Mr. Hubler's old office presently thinks that riskmanagementisacomplicatedsubject,verycomplicatedindeed,andhastoadmitthatasimpleoptimizationisnottheanswer.Sowhatistheanswer?Well,whenthe answer to a complicated question is nowhere to be found in the depths ofone's soul, then one can always fall back on asking the experts instead. TheDanishscientistNielsBohr,oncedeemedanexpert,saidanexpertis,“Apersonthathasmadeeverypossiblemistakewithinhisorherfield.”Asanexpertinthefieldofderivativesecuritiesvaluation,IbelieveIknowa
fellow expert when I see one. Steve Allen has been teaching courses in riskmanagement at New York University's Courant Institute since 1998. SteveretiredfromJPMorganChaseasamanagingdirectorin2004,cappinga35-yearcareerinthefinanceindustry.Giventhewidepraiseforthefirsteditionofthisbook, theauthorcouldhaverestedonhis laurels,comfortedby theknowledgethat thewisdomof theages iseternal. Instead,hehas taken ituponhimself towriteasecondeditionofthistimelessbook.Most authors in Steve's enviable situationwould have contented themselves
withexploiting thecrisis toelaborateonsomeextendedversionof“I toldyouso.”Instead,Stevehasaddedmuchinthewayoftheoreticaladvancesthathavearisenoutofthenecessityofensuringthathistorydoesnotrepeatitself.Theseadvances in turnraise the increasingdegreeofspecializationwesee inside theriskmanagementdepartmentsofmodern financial institutionsand increasinglyin the public sector aswell.Alongwith continued progress in the historicallyvitalproblemofmarking tomarketof illiquidpositions, there is an increasingdegreeofrigorinthedeterminationofreservesthatariseduetomodelrisk, inthelimitsusedtocontrolrisktaking,andinthemethodsusedtoreviewmodels.Thenecessityoftestingeveryassumptionhasbeenmadeplainbythestressthatthe crisis has imposed on our fragile financial system. As the aftershocksreverberate around us, we will not know for many years whether the presentsafeguardswillservetheirintendedpurpose.However,thetimingforanupdatetoSteve'sbookcouldnotbebetter.Itrulyhopethatthecurrentgenerationofriskmanagers,whethertheybegrizzledorgreen,willtakethelessonsontheensuingpagestoheart.Oursharedfinancialfuturedependsonit.

PeterCarr,PhDManagingDirectoratMorganStanley,GlobalHeadofMarketModeling,and
ExecutiveDirectorofNewYorkUniversityCourant'sMastersinMathematicalFinance
PrefaceThis book offers a detailed introduction to the field of risk management asperformedat large investmentandcommercialbanks,withanemphasison thepracticesofspecialistmarketriskandcreditriskdepartmentsaswellastradingdesks.Alargeportionofthesepracticesisalsoapplicabletosmallerinstitutionsthatengageintradingorassetmanagement.The aftermath of the financial crisis of 2007–2008 leaves a good deal of
uncertainty as to exactlywhat the structure of the financial industrywill looklikegoingforward.Someofthebusinesscurrentlyperformedininvestmentandcommercialbanks,suchasproprietarytrading,maymovetootherinstitutions,atleast in some countries, based on new legislation and new regulations.But inwhatever institutional setting this business is conducted, the riskmanagementissues will be similar to those encountered in the past. This book focuses ongenerallessonsastohowtheriskoffinancialinstitutionscanbemanagedratherthanonthespecificsofparticularregulations.Myaiminthisbookistobecomprehensiveinlookingattheactivitiesofrisk
management specialists aswell as tradingdesks, at the realmofmathematicalfinanceaswellasthatofthestatisticaltechniques,and,mostimportant,athowthesedifferentapproachesinteractinanintegratedriskmanagementprocess.This second edition reflects lessons that have been learned from the recent
financialcrisisof2007–2008(formoredetail,seeChapters1and5),aswellasmanynewbooks,articles,andideasthathaveappearedsincethepublicationofthefirsteditionin2003.Chapter6onmanagingmarketrisk,Chapter7onvalueat risk (VaR) and stress testing, Chapter 8 onmodel risk, and Chapter 13 oncreditriskarealmostcompletelyrewrittenandexpandedfromthefirstedition,andanewChapter14oncounterpartycreditriskisanextensiveexpansionofasectionofthecreditriskchapterinthefirstedition.Thewebsiteforthisbook(www.wiley.com/go/frm2e)willbeusedtoprovide
bothsupplementarymaterialstothetextandcontinuousupdates.Supplementarymaterials will include spreadsheets and computer code that illustratecomputations discussed in the text. In addition, there will be classroom aidsavailable only to professors on theWiley Higher Education website. Updateswill include an updated electronic version of theReferences section, to alloweasycut-and-pastelinkingtoreferencedmaterialontheweb.Updateswillalsoinclude discussion of new developments. For example, at the time this book

wenttopress,thereisnotyetenoughpublicinformationaboutthecausesofthelarge trading losses at JPMorgan's London investment office to allow adiscussionofriskmanagementlessons;asmoreinformationbecomesavailable,I will place an analysis of riskmanagement lessons from these losses on thewebsite.This book is divided into three parts: general background to financial risk
management, the principles of financial risk management, and the details offinancialriskmanagement.
Thegeneralbackgroundpart(Chapters1through5)givesaninstitutionalframeworkforunderstandinghowriskarisesinfinancialfirmsandhowitismanaged.Withoutunderstandingthedifferentrolesandmotivationsoftraders,marketers,seniorfirmmanagers,corporateriskmanagers,bondholders,stockholders,andregulators,itisimpossibletoobtainafullgraspofthereasoningbehindmuchofthemachineryofriskmanagementorevenwhyitisnecessarytomanagerisk.Inthispart,youwillencounterkeyconceptsriskmanagershaveborrowedfromthetheoryofinsurance(suchasmoralhazardandadverseselection),decisionanalysis(suchasthewinner'scurse),financetheory(suchasthearbitrageprinciple),andinoneinstanceeventhecriminalcourts(thePonzischeme).Chapter4providesdiscussionofsomeofthemostprominentfinancialdisastersofthepast30years,andChapter5focusesonthecrisisof2007–2008.Theseserveascasestudiesoffailuresinriskmanagementandwillbereferencedthroughoutthebook.Thispartalsocontainsachapteronoperationalrisk,whichisnecessarybackgroundformanyissuesthatariseinpreventingfinancialdisastersandwhichwillbereferredtothroughouttherestofthebook.Thepartonprinciplesoffinancialriskmanagement(Chapters6through8)firstlaysoutanintegratedframeworkinChapter6,andthenlooksatVaRandstresstestinginChapter7andthecontrolofmodelriskinChapter8.Thepartondetailsoffinancialriskmanagement(Chapters9through14)appliestheprinciplesofthesecondparttoeachspecifictypeoffinancialrisk:spotriskinChapter9,forwardriskinChapter10,vanillaoptionsriskinChapter11,exoticoptionsriskinChapter12,creditriskinChapter13,andcounterpartycreditriskinChapter14.Aseachrisktypeisdiscussed,specificreferencesaremadetotheprincipleselucidatedinChapters6through8,andadetailedanalysisofthemodelsusedtopricetheserisksandhowthesemodelscanbeusedtomeasureandcontrolriskispresented.
Sincethe1990s,anincreasedfocusonthenewtechnologybeingdevelopedto

measureandcontrol financial riskhas resulted in thegrowthofcorporatestaffareasmannedbyriskmanagementprofessionals.However, thisdoesnotimplythatfinancialfirmsdidnotmanageriskspriorto1990orthatcurrentlyallriskmanagement is performed in staff areas. Senior linemanagers such as tradingdesk and portfolio managers have always performed a substantial riskmanagementfunctionandcontinuetodoso.Infact,confusioncanbecausedbythetraditionofusingthetermriskmanagerasasynonymforaseniortraderorportfolio manager and as a designation for members of corporate staff areasdealingwith risk.Although this book covers riskmanagement techniques thatareusefultobothlinetradingmanagersandcorporatestaffactingonbehalfofthefirm'sseniormanagement,theneedsoftheseindividualsdonotcompletelyoverlap.Iwilltrytoalwaysmakeacleardistinctionbetweeninformationthatisuseful to a trading desk and information that is needed by corporate riskmanagers,andexplainhowtheymightintersect.Books and articles on financial risk management have tended to focus on
statistical techniques embodied inmeasures such as value at risk (VaR).As aresult, risk management has been accused of representing a very narrowspecialty with limited value, a view that has been colorfully expressed byNassim Taleb (1997), “There has been growth in the number of ‘riskmanagement advisors,' an industry sometimes populated by people with anamateurish knowledge of risk. Using some form of shallow technical skills,these advisors emit pronouncements on such matters as ‘risk management'without a true understanding of the distribution. Such inexperience andweaknessbecomemoreapparentwiththevalue-at-riskfadortheoutpouringofbooksonriskmanagementbyauthorswhonevertradedacontract”(p.4).Thisbookgives amorebalancedaccountof riskmanagement.Less than20
percentof thematerial looksatstatistical techniquessuchasVaR.Thebulkofthebookexaminesissuessuchasthepropermark-to-marketvaluationoftradingpositions,thedeterminationofnecessaryreservesagainstvaluationuncertainty,the structuringof limits tocontrol risk taking, and the reviewofmathematicalmodels and determination of how they can contribute to risk control. Thisallocation of material mirrors the allocation of effort in the corporate riskmanagementstaffareaswithwhichIamfamiliar.Thisisreflectedinthestaffingofthesedepartments.Morepersonnelisdrawnfromthosewithexperienceandexpertise in trading and building models to support trading decisions than isdrawnfromastatisticaloracademicfinancebackground.Althoughmanyreadersmayalreadyhaveabackgroundintheinstruments—

bonds, stocks, futures, and options—used in the financial markets, I havesupplieddefinitionseverytimeIintroduceaterm.Termsareitalicizedinthetextat thepoint theyaredefined.Anyreader feeling theneedforamore thoroughintroduction tomarket terminology should find the first nine chapters ofHull(2012)adequatepreparationforunderstandingthematerialinthisbook.Mypresentationofthematerialisbasedbothontheoryandonhowconcepts
areutilizedinindustrypractice.IhavetriedtoprovidemanyconcreteinstancesofeitherpersonalexperienceorreportsIhaveheardfromindustrycolleaguestoillustrate these practices. Where incidents have received sufficient previouspublicscrutinyoroccurredlongenoughagothatissuesofconfidentialityarenotaconcern,Ihaveprovidedconcretedetails.Inothercases,Ihavehadtopreservethe anonymity of my sources by remaining vague about particulars. Mypreservation of anonymity extends to a liberal degree of randomness inreferencestogender.Athoroughdiscussionofhowmathematicalmodelsareused tomeasureand
control risks must make heavy reference to the mathematics used in creatingthese models. Since excellent expositions of the mathematics exist, I do notpropose to enter intoextensivederivationsof results that can readilybe foundelsewhere. Instead, I will concentrate on how these results are used in riskmanagement and how the approximations to reality inevitable in anymathematicalabstractionaredealtwithinpractice.Iwillprovidereferencestothe derivation of results. Wherever possible, I have used Hull (2012) as areference,sinceitistheoneworkthatcanbefoundontheshelfofnearlyeverypractitionerinthefieldofquantitativefinance.Although the material for this book was originally developed for a course
taughtwithinamathematicsdepartment,Ibelievethatvirtuallyallofitsmaterialwillbeunderstandabletostudentsinfinanceprogramsandbusinessschools,andtopractitionerswithacomparableeducationalbackground.Akeyreasonforthisis that whereas derivatives mathematics often emphasizes the use of moremathematicallysophisticatedcontinuous timemodels,discrete timemodelsareusually more relevant to risk management, since risk management is oftenconcerned with the limits that real market conditions place on mathematicaltheory.This book is designed to be used either as a text for a course in risk
managementorasa resource for self-studyor reference forpeopleworking inthefinancialindustry.Tomakethematerialaccessibletoasbroadanaudienceaspossible, I have tried everywhere to supplement mathematical theory with

concreteexamplesandhavesuppliedspreadsheetsontheaccompanyingwebsite(www.wiley.com/go/frm2e) to illustrate these calculations.Spreadsheetson thewebsite are referenced throughout the text and a summary of all spreadsheetssuppliedisprovidedinthe“AbouttheCompanionWebsite”sectionatthebackofthebook.Atthesametime,Ihavetriedtomakesurethatallthemathematicaltheorythatgetsusedinriskmanagementpracticeisaddressed.Forreaderswhowant to pursue the theoretical developments at greater length, a full set ofreferenceshasbeenprovided.

Acknowledgments
The views expressed in this book are my own, but have been shaped bymyexperiences in the financial industry. Many of my conclusions about whatconstitutesbestpracticeinriskmanagementhavebeenbasedonmyobservationof and participation in the development of the risk management structure atJPMorgan Chase and its Chemical Bank and Chase Manhattan Bankpredecessors.Thegreatestinfluenceonmyoverallviewofhowfinancialriskmanagement
shouldbeconductedandonmanyofthespecificapproachesIadvocatehasbeenLesleyDanielsWebster.Myclose collaborationwithLesley tookplaceover aperiodof20years,duringthelast10ofwhichIreportedtoherinherpositionasdirector of market risk management. I wish to express my appreciation ofLesley'sleadership,alongwiththatofMarcShapiro,SuzanneHammett,BlytheMasters,andAndyThreadgold,forhavingestablishedthestandardsofintegrity,openness, thoroughness, and intellectual rigor that have been the hallmarks ofthisriskmanagementstructure.ThroughoutmostoftheperiodinwhichIhavebeeninvolvedinthesepursuits,
Don Layton was the head of trading activities with which we interacted. Hisrecognition of the importance of the risk management function and strongsupport for a close partnership between riskmanagement and trading and thefreedom of communication and information sharing were vital to thedevelopmentofthesebestpractices.Throughtheyears,myideashavebenefitedfrommycolleaguesatChemical,
Chase, JPMorgan Chase, and in consulting assignments since my retirementfrom JPMorgan Chase. At JPMorgan Chase and its predecessors, I wouldparticularly like to note the strong contributions that dialogues with AndrewAbrahams,Michel Araten, Bob Benjamin, Paul Bowmar, George Brash, JuliaChislenko,EnricoDellaVecchia,MikeDinias, FawazHabel,BobHenderson,JeffKatz,BobbyMagee,BlytheMasters,MikeRabin,BarrySchachter,VivianShelton,PaulShotton,AndyThreadgold,MickWaring,andRichardWisehaveplayed in the development of the concepts utilized here. In my consultingassignments,IhavegainedmuchfrommyexchangesofideaswithRickGrove,Chia-Ling Hsu, Neil Pearson, Bob Selvaggio, Charles Smithson, and othercolleagues at Rutter Associates, and Chris Marty and Alexey Panchekha at

Bloomberg. In interactionswith riskmanagers atother firms, I havebenefitedfrommyconversationswithKenAbbott,JohnBreit,NoelDonohoe,andEvanPicoult.ManyofthetradersIhaveinteractedwiththroughtheyearshavealsohad a major influence on my views of how risk management should impactdecision making on the trading desk and the proper conduct of relationshipsbetween traders and riskmanagement specialists. I particularly want to thankAndy Hollings, Simon Lack, Jeff Larsen, DinsaMehta, Fraser Partridge, andDonWilsonforprovidingmewithprototypesforhowtheriskmanagementoftrading should be properly conducted and their generosity in sharing theirknowledge and insight. I also wish to thank those traders, who shall remainanonymous here, who have provided me equally valuable lessons in riskmanagementpracticestoavoid.This book grew out of the riskmanagement course I created as part of the
MathematicsinFinanceMSprogramatNewYorkUniversity'sCourantInstituteofMathematicalSciences in1998.Forgivingme theopportunity to teachandfor providing an outstanding institutional setting in which to do it, I want tothank the administration and faculty of Courant, particularly Peter Carr, NeilChriss, Jonathan Goodman, Bob Kohn, and Petter Kolm, with whom I haveparticipated in the management of the program, and Caroline Thompson,GabrielleTobin,andMelissaVacca, theprogramadministrators. Ihavegainedmany insights that have found their way into this book by attending othercourses in theprogram taughtbyMarcoAvellaneda, JimGatheral,BobKohn,andNassimTaleb.Ken Abbott began participating in the risk management course as a guest
lecturer, later became my co-teacher of the course, and now has fullresponsibilityfor thecoursewithmyparticipationasaguest lecturer.ManyoftheinsightsinthisbookhavebeenlearnedfromKenorgeneratedaspartofthedebates and discussions we have held both in and out of the classroom. Thestudentsinmyriskmanagementcoursehavehelpedclarifymanyoftheconceptsinthisbookthroughtheirprobingquestions.IparticularlywanttothankKarimBeguir,whobeganasmystudentandhassincegraduatedtobecomeaFellowofthe program and a frequent and valued contributor to the risk managementcourse.Severalofhisinsightsarereflectedinthesecondeditionofthebook.Ialsowish to thankOtelloPadovaniandAndreaRaphael,studentswhobecamecollaborators on research that appears on the website for the book(www.wiley.com/go/frm2e). Mike Fisher has provided greatly appreciatedsupportasmygraduateassistantinhelpingtoclarifyclassassignmentsthathave
evolvedintoexercisesinthisbook.Thedetailedcommentsandsuggestions Ihave received fromNeilChrisson
large portions of thismanuscript far exceed the norms of either friendship orcollegiality. In numerous instances, his efforts have sharpened both the ideasbeing presented and the clarity of their expression. I alsowish to thankMichAraten, Peter Carr, BobbyMagee, Barry Schachter, Nassim Taleb, and BruceTuckman for reading the text and offering helpful comments. For the secondedition, I would like to thank Ken Abbott and Rick Grove for reading newchaptersandofferinghelpfulsuggestions.I alsowish to extendmy thanks toChuck Epstein for his help in finding a
publisher for this book. Bill Falloon, Meg Freeborn, and Michael Kay, myeditors at JohnWiley & Sons, have offered very useful suggestions at everystageof theediting.AtMacAllisterPublishingServices,AndyStonewasveryhelpfulasproductionmanagerandJeanneHenningwasathoroughandincisivecopyeditorforthefirsteditionofthisbook.TheindividualtowhombothIandthisbookowethegreatestdebtismywife,
CarolineThompson.Thenumberofwaysinwhichherbeneficialinfluencehasbeenfeltsurpassmyability toenumerate,butIat leastneedtoattemptabriefsample.ItwasCarolinewhointroducedmetoNeilChrissandfirstplantedtheidea ofmy teaching at Courant. She has been a colleague ofNeil's, JonathanGoodman's,andmineinthecontinueddevelopmentoftheCourantMathematicsinFinanceMSprogram.Fromthestart,shewasthestrongestvoiceinfavorofbasingabookonmyriskmanagementcourse.Atfrequentbottlenecks,onboththe first and second editions,when I have beendaunted by an obstacle tomyprogress that seemed insurmountable, it was Caroline who suggested theapproach,organizedthematerial,orsuggestedthejointeffortthatovercamethedifficulty.Shehasmanagedallaspectsoftheproductionformat,andstyleofthebook, including efforts from such distant ports as Laos, Vietnam, India, andHolland.

AbouttheAuthor
SteveAllen isa riskmanagementconsultant, specializing in riskmeasurementand valuation with a particular emphasis on illiquid and hard-to-value assets.Until his retirement in 2004, he was Managing Director in charge of riskmethodology at JPMorgan Chase, where he was responsible for modelvalidation, risk capital allocation, and the development of new measures ofvaluation,reserves,andriskforbothmarketandcreditrisk.Previously,hewasin charge ofmarket risk for derivative products at Chase. He has been a keyarchitectofChase'svalue-at-riskandstresstestingsystems.Priortohisworkinrisk management, Allen was the head of analysis and model building for allChasetradingactivitiesforovertenyears.Since1998,Allenhasbeenassociatedwith theMathematics in FinanceMasters' program at New York University'sCourant Institute ofMathematical Sciences. In this program, he has served asClinical Associate Professor and Deputy Director and has created and taughtcoursesinriskmanagement,derivativesmathematics,andinterestrateandcreditmodels. He was a member of the Board of Directors of the InternationalAssociation of FinancialEngineers and continues to serve as co-chair of theirEducationCommittee.

CHAPTER1
Introduction
1.1LESSONSFROMACRISISI began the first edition of this book with a reference to an episode of thetelevision series Seinfeld in which the character George Costanza gets anassignmentfromhisbosstoreadabooktitledRiskManagementandthengiveareport on this topic to other business executives.Costanza finds the book andtopicsoboringthathisonlysolutionistoconvincesomeoneelsetoreaditforhim and prepare notes. Clearly, my concern at the time was to write aboutfinancial riskmanagement in away thatwould keep readers from finding thesubject dull. I could hardly have imagined then that eight years later DemiMoore would be playing the part of the head of an investment bank's riskmanagement department in a widely released movie,MarginCall. Even lesscouldIhaveimaginedtheterribleeventsthatplacedfinancialriskmanagementinsuchaharshspotlight.Myconcernnowisthattheglobalfinancialcrisisof2007–2008mayhaveled
totheconclusionthatriskmanagementisanexcitingsubjectwhosepractitionersand practices cannot be trusted. I have thoroughly reviewed the material Ipresented in the first edition, and it still seems to me that if the principles Ipresented,principlesthatrepresentedindustrybestpractices,hadbeenfollowedconsistently, a disaster of themagnitudewe experiencedwould not have beenpossible. In particular, the points Imade in the first edition about using stresstestsinadditiontovalueatrisk(VaR)indeterminingcapitaladequacy(seethelast paragraphs of Section 7.3 in this edition) and the need for substantialreservesanddeferredcompensationforilliquidpositions(seeSections6.1.4and8.4 in this edition) still seem sound. It is tempting to just restate the sameprinciplesandurgemorediligenceintheirapplication,butthatappearstoocloseto the sardonic definition of insanity: “doing the same thing and expectingdifferent results.” So I have looked for places where these principles needstrengthening(you'llfindasummaryinSection5.4).ButIhavealsoreworkedtheorganizationofthebooktoemphasizetwocoredoctrinesthatIbelieveare
thekeystotheunderstandingandproperpracticeoffinancialriskmanagement.The first core principle is that financial risk management is not just risk
management as practiced in financial institutions; it is risk management thatmakesactiveuseoftradinginliquidmarketstocontrolrisk.Riskmanagementisa discipline that is important to a wide variety of companies, governmentagencies,andinstitutions—oneneedonlythinkofaccidentpreventionatnuclearpower plants and public healthmeasures to avoid influenza pandemics to seehowcriticalitcanbe.Whiletheriskmanagementpracticedatinvestmentbanksshares some techniques with risk management practiced at a nuclear facility,thereremainsonevitaldifference:muchof theriskmanagementat investmentbankscanutilizeliquidmarketsasakeyelementinriskcontrol;liquidmarketsareofvirtuallynousetothenuclearsafetyengineer.Myexpertiseisinthetechniquesoffinancialriskmanagement,andthatisthe
primarysubjectof thisbook.Somerisksthatfinancialfirmstakeoncannotbemanagedusingtradinginliquidmarkets.Itisvitallyimportanttoidentifysuchrisksandtobeawareofthedifferentriskmanagementapproachesthatneedtobe taken for them.Throughout the book Iwill be highlighting this distinctionandalsofocusingonthedifferencesthatdegreeofavailableliquiditymakes.Asshorthand, I will refer to risk that cannot be managed by trading in liquidmarketsasactuarialrisk, since it is the typeof risk thatactuariesat insurancecompanies have been dealing with for centuries. Even in cases that must beanalyzedusingtheactuarialriskapproach,financialriskmanagementtechniquescan still beuseful in isolating the actuarial risk and in identifyingmarketdatathat can be used as input to actuarial risk calculations. I will address this ingreaterdetailinSection1.2.The second core principle is that the quantification of risk management
requiressimulationguidedbybothhistoricaldataandsubjectivejudgment.Thisis a common feature of both financial risk and actuarial risk.The timeperiodsimulatedmayvarygreatly,fromvalueatrisk(VaR)simulationsofdailymarketmoves for very liquid positions to simulations spanning decades for actuarialrisk.ButIwillbeemphasizingsharedcharacteristicsforallofthesesimulations:thedesirabilityoftakingadvantageofasmuchhistoricaldataasisrelevant,theneedtoaccountfornonnormalityofstatisticaldistributions,andthenecessityofincludingsubjectivejudgment.MoredetailsontheserequirementsareinSection1.3.

1.2FINANCIALRISKANDACTUARIALRISK
Themanagementoffinancialriskandthemanagementofactuarialriskdosharemanymethodologies,apoint thatwillbeemphasized in thenextsection.Bothrely on probability and statistics to arrive at estimates of the distribution ofpossible losses. The critical distinction between them is the matter of time.Actuarialrisksmaynotbefullyresolvedforyears,sometimesevendecades.Bythe timethe trueextentof losses isknown, theaccumulationofriskmayhavegone on for years. Financial risks can be eliminated in a relatively short timeperiodbytheuseofliquidmarkets.Continuousmonitoringofthepriceatwhichrisk can be liquidated should substantially lower the possibility of excessiveaccumulationofrisk.Two caveats need to be offered to this relatively benign picture of financial
risk.Thefirstisthattakingadvantageoftheshortertimeframeoffinancialriskrequires constant vigilance; if you aren't doing a good job ofmonitoring howlarge your risks are relative to liquidation costs, you may still acquire moreexposurethandesired.ThiswillbedescribedindetailinChapter6.Thesecondis the need to be certain that what is truly actuarial risk has not beenmisclassifiedasfinancialrisk.Ifthisoccurs,itisespeciallydangerous—notonlywillyouhavethepotentialaccumulationofriskoveryearsbeforetheextentoflosses is known, but in not recognizing the actuarial nature, you would notexercise thecaution that theactuarialnatureof the riskdemands.Thiswillbeexamined more closely in Sections 6.1.1 and 6.1.2, with techniques formanagementofactuarialriskinfinancialfirmsoutlinedinSection8.4.Ibelievethatthisdangerousmuddlingoffinancialandactuarialriskwasakeycontributortothe2007–2008crisis,asIargueinSection5.2.5.Ofcourse, it isonlyanapproximationtoviewinstrumentsasbeingliquidor
illiquid.Thevolumeof instrumentsavailablefor tradingdifferswidelybysizeand readiness of availability.This constitutes the depth of liquidity of a givenmarket.Oftenafirmwillbefacedwithachoicebetweentherisksofreplicatingpositions more exactly with less liquid instruments or less exactly with moreliquidinstruments.Onethemeof thisbookwillbe thetrade-offbetweenliquidityriskandbasis
risk.Liquidityriskistheriskthatthepriceatwhichyoubuy(orsell)somethingmaybesignificantly lessadvantageousthanthepriceyoucouldhaveachieved
undermoreidealconditions.Basisriskistheriskthatoccurswhenyoubuyoneproduct and sell another closely related one, and the two prices behavedifferently.Let's lookatanexample.Supposeyouareholdingalargeportfolioofstocksthatdonottradethatfrequentlyandyouroutlookforstockpricesleadstoadesiretoquicklyterminatetheposition.Ifyoutrysellingthewholebasketquickly, you face significant liquidity risk since your sellingmay depress theprices atwhich the stocks trade.An alternativewould be to take anoffsettingposition inaheavily traded stock futurescontract, suchas the futurescontracttiedtotheStandard&Poor's™S&P500stockindex.Thislowerstheliquidityrisk,but it increasesthebasisrisksincechangesinthepriceofyourparticularstockbasketwillprobablydifferfromthepricechangesinthestockindex.Oftentheonlywayinwhichliquidityriskcanbereducedistoincreasebasisrisk,andtheonlywayinwhichbasisriskcanbereducedistoincreaseliquidityrisk.Theclassificationofriskasfinancialriskoractuarialriskisclearlyafunction
of the particular type of risk and not of the institution. Insurance againsthurricane damage could be written as a traditional insurance contract byMetropolitan Life or could be the payoff of an innovative new swap contractdesigned byMorgan Stanley; in either case, itwill be the same risk.What isrequiredineithercaseisanalysisofhowtradinginliquidmarketscanbeusedtomanage the risk. Certainly commercial banks have historically managedsubstantial amounts of actuarial risk in their loan portfolios. And insurancecompanies have managed to create some ability to liquidate insurance riskthroughthereinsurancemarket.Evenindustrialfirmshavestartedexploringthepossible transformation of some actuarial risk into financial risk through thetheory of real options. An introduction to real options can be found in Hull(2012,Section34)andDixitandPindyck(1994).A useful categorization to make in risk management techniques that I will
sometimesmakeuseof,followingGumerlock(1999),istodistinguishbetweenrisk management through risk aggregation and risk management through riskdecomposition.Riskaggregationattemptstoreduceriskbycreatingportfoliosofless than completely correlated risk, thereby achieving risk reduction throughdiversification.Riskdecompositionattemptstoreduceariskthatcannotdirectlybepricedinthemarketbyanalyzingitintosubcomponents,allorsomeofwhichcan be priced in the market. Actuarial risk can generally be managed onlythroughriskaggregation,whereasfinancialriskutilizesbothtechniques.Chapter7 concentrates on risk aggregation,while Chapter 8 primarily focuses on riskdecomposition;Chapter6addressestheintegrationofthetwo.
1.3SIMULATIONANDSUBJECTIVEJUDGMENT
Nobodycanguaranteethatallpossiblefuturecontingencieshavebeenprovidedfor—thisissimplybeyondhumancapabilitiesinaworldfilledwithuncertainty.But it is unacceptable to use that platitude as an excuse for complacency andlack of meaningful effort. It has become an embarrassment to the financialindustry to see thenumberof events that aredeclared “once in amillennium”occurrences,basedonananalysisofhistoricaldata,when theyseeminfact totake place every few years. At one point I suggested, only half-jokingly, thatanyone involved in riskmanagementwhoused thewordsperfectandstorm inthe same sentence should be permanently banned from the financial industry.More seriously, everyone involved in riskmanagementneeds tobe aware thathistorical data has a limited utility, and that subjective judgment based onexperienceandcarefulreasoningmustsupplementdataanalysis.Thefailureofriskmanagerstoapplycriticalsubjectivejudgmentasacheckonhistoricaldataintheperiodleadingtothecrisisof2007–2008isaddressedinSection5.2.5.Thisbynomeansimpliesthathistoricaldatashouldnotbeutilized.Historical
data,ataminimum,suppliesacheckagainst intuitionandcanbeused tohelpformreasonedsubjectiveopinions.Butriskmanagersconcernedwithprotectinga firm against infrequent but plausible outcomes must be ready to employsubjectivejudgment.Letusillustratewithasimpleexample.Supposeyouaretryingtodescribethe
distributionofavariableforwhichyouhavealotofhistoricaldatathatstronglysupportsanormaldistributionwithameanof5percentandstandarddeviationof 2 percent. Suppose you suspect that there is a small but nonnegligiblepossibility that therewill be a regime change thatwill create a very differentdistribution.Let'ssayyouguessthereisa5percentchanceofthisdistribution,which you estimate as a normal distribution with a mean of 0 percent andstandarddeviationof10percent.If all you cared about was the mean of the distribution, this wouldn't have
much impact—lowering themean from5percent to4.72percent.Even ifyouwereconcernedwithbothmeanandstandarddeviation,itwouldn'thaveahugeimpact: the standard deviation goes up from 2 percent to 3.18 percent, so theSharpe ratio (the ratio of mean to standard deviation often used in financialanalysis)would drop from2.50 to 1.48.But if youwere concernedwith how

largealossyoucouldhave1percentofthetime,itwouldbeachangefromagain of 0.33 percent to a loss of 8.70 percent. Exercise 1.1will allow you tomake these and related calculations for yourself using the Excel spreadsheetMixtureOfNormalssuppliedonthebook'swebsite.This illustrates the point that when you are concerned with the tail of the
distributionyouneedtobeveryconcernedwithsubjectiveprobabilitiesandnotjustwithobjectivefrequencies.Whenyourprimaryconcernisjustthemean—oreventhemeanandstandarddeviation,asmightbetypicalforamutualfund—thenyourprimaryfocusshouldbeonchoosingthemostrepresentativehistoricalperiodandonobjectivefrequencies.Whilethisexamplewasdrawnfromfinancialmarkets,theconclusionswould
look very similar ifwewere discussing an actuarial risk problem like nuclearsafetyandweweredealingwithpossibledeathsratherthanfinanciallosses.Thefact that risk managers need to be concerned with managing against extremeoutcomes would again dictate that historical frequencies need to besupplementedbyinformedsubjectivejudgments.Thisreasoningisverymuchinlinewiththeprevailing(butnotuniversal)beliefsamongacademicsinthefieldsofstatisticsanddecisiontheory.AgoodsummaryofthecurrentstateofthinkinginthisareaistobefoundinHammond,Keeney,andRaiffa(1999,Chapter7).Rebonato (2007) isa thoughtfulbook-length treatmentof these issues fromanexperienced and respected financial risk manager that reaches conclusionsconsistentwiththosepresentedhere(seeparticularlyChapter8ofRebonato).Theimportanceofextremeeventstoriskmanagementhastwootherimportant
consequences.Oneisthatinusinghistoricaldataitisnecessarytopayparticularattentiontotheshapeofthetailofthedistribution;allcalculationsmustbebasedon statistics that take into account any nonnormality displayed in the data,including nonnormality of correlations. The second consequence is that allcalculations must be carried out using simulation. The interaction of inputvariables in determining prices and outcomes is complex, and shortcutcomputationsforestimatingresultsworkwellonlyforaverages;assoonasyouarefocusedonthetailsofthedistribution,simulationisanecessityforaccuracy.Theuseof simulationbasedonbothhistoricaldata and subjective judgment
andtakingnonnormalityofdataintoaccountisarepeatedthemethroughoutthisbook—in the statement of general principles inSection6.1.1, applied tomoreliquid positions throughout Chapter 7, applied to positions involving actuarialrisk inSection8.4, andapplied to specific riskmanagement issues throughoutChapters9through14.

EXERCISE1.1TheImpactofNonnormalDistributionsonRisk
UsetheMixtureOfNormalsspreadsheettoreproducetheriskstatisticsshowninSection1.3(youwillnotbeabletoreproducetheseresultsprecisely,duetotherandomelementofMonteCarlosimulation,butyoushouldbeabletocomeclose).Experimentwithraisingtheprobabilityoftheregimechangefrom5percentto10percentorhighertoseethesensitivityoftheseriskstatisticstotheprobabilityyouassigntoanunusualoutcome.Experimentwithchangesinthemeanandstandarddeviationofthenormaldistributionusedforthislower-probabilityeventtoseetheimpactofthesechangesontheriskstatistics.
CHAPTER2
InstitutionalBackgroundAfinancialfirmis,amongotherthings,aninstitutionthatemploysthetalentsofa variety of different people, each with her own individual set of talents andmotivations. As the size of an institution grows, it becomesmore difficult toorganize these talents and motivations to permit the achievement of commongoals.Evensmallfinancialfirms,whichminimizethecomplexityofinteractionof individuals within the firm, must arrange relationships with lenders,regulators,stockholders,andotherstakeholdersinthefirm'sresults.Since financial risk occurs in the context of this interaction between
individualswith conflicting agendas, it shouldnot be surprising that corporateriskmanagersspendagooddealoftimethinkingaboutorganizationalbehavioror that their discussions aboutmathematicalmodels used to control risk oftenfocuson theorganizational implicationsof thesemodels. Indeed, ifyou takearandomsampleof theconversationsof senior riskmanagerswithina financialfirm,youwill findasmanyreferences tomoralhazard,adverseselection,andPonzischeme(termsdealingprimarilywithissuesoforganizationalconflict)asyouwillfindreferencestodelta,standarddeviation,andstochasticvolatility.Foranunderstandingoftheinstitutionalrealitiesthatconstitutetheframework
inwhich risk ismanaged, it is best to startwith the concept ofmoral hazard,whichliesattheheartoftheseconflicts.
2.1MORALHAZARD—INSIDERSANDOUTSIDERS
ThefollowingisadefinitionofmoralhazardtakenfromKotowitz(1989):Moral hazardmay be defined as actions of economic agents inmaximizingtheir own utility to the detriment of others, in situationswhere they do notbear the full consequences or, equivalently, do not enjoy the full benefits oftheiractionsduetouncertaintyandincompleteorrestrictedcontractswhichpreventtheassignmentoffulldamages(benefits)totheagentresponsible....Agents may possess informational advantages of hidden actions or hiddeninformation or there may be excessive costs in writing detailed contingent
contracts. . . .Commonlyanalyzedexamplesofhiddenactionsareworkers'efforts,whichcannotbecostlesslymonitoredbyemployers,andprecautionstakenbytheinsuredtoreducetheprobabilityofaccidentsanddamagesduetothem, which cannot be costlessly monitored by insurers. . . . Examples ofhidden information are expert services—such as physicians, lawyers,repairmen,managers,andpoliticians.In the context of financial firm risk, moral hazard most often refers to the
conflict between insiders and outsiders based on a double-edged asymmetry.Information is asymmetrical—the insiders possess superior knowledge andexperience.Theincentivesarealsoasymmetrical—theinsidershaveanarrowersetofincentivesthantheoutsidershave.Thisthemerepeatsitselfatmanylevelsofthefirm.Let's begin at the most basic level. For any particular group of financial
instruments that a firmwants to deal in,whether it consists of stocks, bonds,loans, forwards, or options, the firm needs to employ a group of expertswhospecialize in this group of instruments. These experts will need to have athoroughknowledgeof the instrument thatcan rival theexpertiseof the firm'scompetitors in this segment of the market. Inevitably, their knowledge of thesectorwillexceedthatofotheremployeesofthefirm.Evenifitdidn'tstartthatway,theexperiencegainedbyday-to-daydealingsinthisgroupofinstrumentswill result in information asymmetry relative to the rest of the firm. Thisinformation asymmetry becomes even more pronounced when you considerinformation relative to theparticular positions in those instruments intowhichthefirmhasentered.Thefirm'sexpertshavecontractedforthesepositionsandwillcertainlypossessafarmore intimateknowledgeof themthananyoneelseinsideoroutside the firm.Agenericnameusedwithin financial firms for thisgroupofexperts is the frontoffice.A largefrontofficemaybedividedamonggroupsofspecialists: thosewhonegotiate transactionswithclientsof thefirm,whoareknownassalespeople,marketers,orstructurers;thosewhomanagethepositionsresultingfromthesenegotiatedtransactions,whoareknownastraders,positionmanagers,orriskmanagers;andthosewhoproduceresearch,models,or systems supporting the process of decision making, who are known asresearchersortechnologists.However,thisgroupofexpertsstillrequiresthebackingoftherestofthefirm
inordertobeabletogeneraterevenue.Someofthisdependencemaybeaneedtousethefirm'sofficesandequipment;specialistsinareasliketax,accounting,law,andtransactionsprocessing;andaccesstothefirm'sclientbase.However,
theseareservicesthatcanalwaysbecontractedfor.Thevitalneedforbackingisthefirm'sabilitytoabsorbpotentiallossesthatwouldresultifthetransactionsdonotperformasexpected.AforcefulillustrationofthisdependenceisthecaseofEnron,whichin2001
wasadominantforceintradingnaturalgasandelectricity,beingapartytoabout25 percent of all trades executed in thesemarkets. Enron's experts in tradingthese products and the web-enabled computer system they had built to allowclients to tradeonlinewerewidely admired throughout the industry.However,when Enron was forced to declare bankruptcy by a series of financing andaccountingimproprietiesthatwerelargelyunrelatedtonaturalgasandelectricitytrading,theirdominanceinthesemarketswaslostovernight.Why?Thetradersandsystemsthatweresowidelyadmiredwerestillinplace.
Their reputationmayhavebeendamaged somewhat basedon speculation thatthecompany'sreportingwasnothonestanditstradingoperationwasperhapsnotas successful as had been reported. However, this would hardly have beenenoughtoproducesuchalargeeffect.Whathappenedwasanunwillingnessoftrading clients to deal with a counterparty that might not be able to meet itsfuturecontractualobligations.Without thebackingof theparentfirm'sbalancesheet,itsstockholderequity,anditsabilitytoborrow,thetradingoperationcouldnotcontinue.So now we have the incentive asymmetry to set off the information
asymmetry. The wider firm, which is less knowledgeable in this set ofinstruments than the group of front-office experts,must bear the full financiallossifthefrontoffice'spositionsperformbadly.Themoralhazardconsistsofthepossibility that the front officemay bemorewilling to risk the possibility oflarge losses in which it will not have to fully share in order to create thepossibilityof largegains inwhich itwillhaveafullshare.Andtherestof thefirmmaynothavesufficientknowledgeofthefrontoffice'spositions,duetotheinformationasymmetry,tobesurethatthishasnotoccurred.What are some possible solutions? Could a firm just purchase an insurance
contractagainsttradinglosses?Thisishighlyunlikely.Aninsurancefirmwouldhave even greater concerns aboutmoral hazard because it would not have asmuchaccesstoinformationasthosewhoareatleastwithinthesamefirm,evenif they are less expert.Could the firmdecide to structure the pay of the frontoffice so that it will be the same no matter what profits are made on itstransactions,removingthetemptationtotakeexcessiverisktogeneratepotentiallargegains?Thefirmcould,butexperienceinfinancialfirmsstronglysuggests

theneedforupsideparticipationasanincentivetocallforththeeffortsneededtosucceedinahighlycompetitiveenvironment.Inevitably,thesolutionseemstobeanongoingstruggletobalancetheproper
incentivewiththepropercontrols.Thisistheveryheartofthedesignofariskmanagementregime.Ifthefirmexercisestoolittlecontrol,theopportunitiesformoralhazardmayprovetoogreat.Ifitexercisestoomuchcontrol,itmaypassupgoodprofitopportunitiesifthosewhodonothaveasmuchknowledgeasthefrontofficemakethedecisions.Totrytoachievethebestbalance,thefirmwillemployexpertsinriskmanagementdisciplinessuchasmarketrisk,creditrisk,legalrisk,andoperationsrisk.Itwillsetupindependentsupportstafftoprocessthetradesandmaintaintherecordsofpositionsandpayments(thebackoffice);report positions against limits, calculate the daily profit and loss (P&L), andanalyzethesourcesofP&Landrisk(themiddleoffice);andtakeresponsibilityfortheaccuracyofthefirm'sbooksandrecords(thefinancefunction).However,thetwo-sidedasymmetryofinformationandincentivewillalwaysexist,asthepersonnel in these control and support functions will lack the specializedknowledgethatthefrontofficepossessesintheirsetofinstruments.The two-sided asymmetry that exists at this basic level can be replicated at
other levels of the organization, depending on the size and complexity of thefirm.The informationaldisadvantageof themanagerof fixed-incomeproductsrelative to the front office for European bonds will be mirrored by theinformationaldisadvantageofthemanagerofalltradingproductsrelativetothemanageroffixed-incomeproductsandthefirm'sCEOrelativetothemanagerofalltradingproducts.Certainly, the two-sided asymmetry will be replicated in the relationship
betweenthemanagementof thefirmandthosewhomonitor thefirmfromtheoutside.Outsidemonitorsprimarilyrepresentthreegroups—thefirm'screditors(lendersandbondholders),thefirm'sshareholders,andgovernments.Allthreeofthesegroupshaveincentivesthatdifferfromthefirm'smanagement,astheyareexposedtolossesbasedonthefirm'sperformanceinwhichthemanagementwillnotfullyshare.Theexistenceof incentive asymmetry for creditors is reasonablyobvious. If
thefirmdoeswell,thecreditorsgettheirmoneyback,buttheyhavenofurtherparticipationinhowwellthefirmperforms;ifthefirmdoesverybadlyandgoesbankrupt, thecreditorshavesubstantial,possiblyeventotal, lossoftheamountlent.Bycontrast,thefirm'sshareholdersandmanagementhavefullparticipationwhenthefirmperformswell,butliabilityinbankruptcyislimitedtotheamount

originallyinvested.WhenweexaminecreditriskinSection13.2.4,thiswillbeformallymodeledasthecreditorssellingaputoptiononthevalueofthefirmtotheshareholders.Sincealloptionscreatenonlinear(henceasymmetric)payoffs,wehaveaclearsourceofincentiveasymmetryforcreditors.It is less clear whether incentive asymmetry exists for shareholders. In
principle, their interests are supposed to be exactly aligned with those of thefirm's management, and incentives for management based on stock value areused to strengthen this alignment. In practice, it is always possible thatmanagement will take more risk than shareholders would be completelycomfortablewithinthehopeofcollectingincentive-basedcompensationingoodperformanceyears thatdoesnothave tobereturnedinbadperformanceyears.Kotowitz(1989)quotesAdamSmithfromWealthofNations:“Thedirectorsofsuchcompanies,however,beingmanagers ratherofotherpeople'smoney thanoftheirown,itcannotwellbeexpected,thattheyshouldwatchoveritwiththesameanxiousvigilancewithwhichthepartnersinaprivatecompanyfrequentlywatchovertheirown.”Government involvement arises from the asymmetric dangers posed to the
health of theoverall economyby the failure of a financial firm. If an implicitgovernmentguarantee isgiven to rescue large financial firms frombankruptcy(the notion of “too big to fail”), then moral hazard is created throughmanagement'sknowledgethat itcantry tocreateprofitopportunities, inwhichthegovernmenthasonly limitedparticipation through taxes,by takingrisksoflossesthatwillneedtobefullyabsorbedbythegovernment.Ifthegovernmentisnotwillingtopreventthefailureoflargefinancialfirms,thenitwillwanttoplacerestrictionsontheexternalitiesthatthosefirmscancreatebynothavingtobear their share of the cost to the overall economy of a firm's potentialbankruptcy.Inallthreecasesofmoralhazardinvolvingoutsidemonitors,theinformation
asymmetry is even more severe than when the information asymmetry takesplacewholly inside the firm. Seniormanagement and its riskmonitors are atleast on the premises, are involved in day-to-day business with more juniormanagers, andcanutilize informalmeasures, suchas the rotationofmanagersthroughdifferentsegmentsofthefirm,toattempttodiffusebothincentivesandknowledge. Outsidemonitors will have only occasional contact with the firmandmustrelymostlyonformalrequirementstoobtaincooperation.Letus lookat someof theoutsidemonitors that creditors, shareholders, and
governmentsrelyon:

Inadditiontotheirowncreditofficers,creditorsrelyonratingagenciessuchasMoody'sInvestorsServiceandStandard&Poor's(S&P)toobtaininformationaboutandmakejudgmentsonthecreditworthinessofborrowers.Shareholdersandcreditorsrelyoninvestmentanalystsworkingforinvestmentbankersandbrokeragefirmstoobtaininformationaboutandmakejudgmentsonthefutureearningsprospectsandsharevaluesoffirms.Althoughneitherratingagenciesnorinvestmentanalystshaveanyofficialstandingwithwhichtoforcecooperationfromthefirmstheyanalyze,theirinfluencewithlendersandinvestorsinbondsandstocksgivesthemtheleveragetoobtaincooperationandaccesstoinformation.Governmentscanusetheirregulatorypowerstorequireaccesstoinformationfromfinancialfirmsandemploylargestaffstoconductexaminationsofthefirms.Forexample,fortheU.S.government,theFederalReserveSystemandtheComptrolleroftheCurrencyconductexaminationsofcommercialbanks.AsimilarfunctionisperformedbytheSecuritiesandExchangeCommission(SEC)forinvestmentbanks.Creditors,shareholders,andgovernmentsallrelyonindependentaccountingfirmstoconductauditsofthereliabilityofthefinancialinformationdisclosuresthatarerequiredofallpubliclyheldfirms.
Over the years, many critical questions have been raised about how trulyindependentthejudgmentoftheseoutsidemonitorsreallyis:
Creditratingagencieshavebeenaccusedofbeingtooslowtodowngraderatingsinresponsetoadversechangesinafirm'sfinancialconditionbecausetheirsourceofrevenuecomesfromthefirmswhosedebttheyrate.Similarly,independentauditorshavebeensuspectedofbeingtoodeferentialtothefirmstheymonitorsincethesefirmsaretheoneswhopaytheirauditfeesandhirethemforconsultingservices.Thefearisthatthedesireformorerevenuewillbluntobjectionstocompanieschoosingaccountingmethodsthatcasttheirresultsinafavorablelight.Investmentbankshaveabuilt-inconflictofinterestfromcompetingforthebusinessofthefirmswhoseperformancetheirinvestmentanalystsaremonitoring.Ithaslongbeennotedthatanalysts'buyrecommendationsfaroutnumbersellrecommendations.Accusationshavebeenleveledthatgovernmentregulatoryagenciesaremoreconcernedwithprotectingtheinterestsofthefirmsbeingmonitoredthanwithprotectingthepublicinterest.Thesechargeshaveparticularforce

whenpersonnelflowfreelybetweenemploymentintheregulatoryagenciesandinthefirmstheyregulate.
All of these criticisms seemed to be coming to a head in 2002 amid thescandals involving the now-defunct auditing firmofArthurAndersen,Enron'sdeclarationofbankruptcyonly aweekafterbeing rated investmentgrade, andthemassive declines in the stock values of technology firms highly touted byinvestment analysts. Some useful reforms have been undertaken, such asforbiddingauditingfirmstosellconsultingservicestofirmstheyauditandnotallowing the bonuses of investment analysts to be tied to investment bankingfeescollectedfromclientswhosestockstheycover.However,thebasicsourcesofconflictofinterestremain,andinvestorsandlenderswillcontinuetoneedtoemployaskepticalfilterwhenutilizinginputfromoutsidemonitors.Although the conflicts between insiders and outsiders due to the two-sided
asymmetryofmoralhazardcannotbeeliminated,afrankunderstandingbybothsides can lead to a cooperative relationship. In a cooperative relationship,insiderswillacknowledgetheneedtohaveoutsidersexercisecontrolsandwillvoluntarily share information and knowledge with outsiders. In a cooperativerelationship,outsiderswillacknowledgetheirneedtolearnfromtheinsidersandwilleasecontrolsinresponsetoatrackrecordofopenness,althoughbothmustrecognize the need to always have some level of controls (the ancient folkwisdom states that “I trustmygrandmother, but I still cut the cardswhen shedeals”).A lack of understanding of moral hazard can lead to an uncooperative
relationshipfueledbymutualresentmentsbetweenaninsider,suchasatraderorstructurer,with an outsider, such as a corporate riskmanager or regulator.Aninsiderwhodoesnotunderstandthepurelysituationalneedtohavesomeonelessknowledgeable“lookovermyshoulder”willattribute it toaninsultinglackofpersonal trust, an arrogant assumption of more knowledge than the otherpossesses,orasimpledesirebytheoutsidertocreateajoborgrabpower(whichisnottosaythatsomeofthesemotivationsdonotexistinreality,mixedinwiththeneedtocontrolmoralhazard).Theinsider'sresponsewillthenprobablybetowithhold information, obfuscate, andmislead,whichwill drive the outsider toevencloserscrutinyandmorerigidcontrols,whichisclearlyaprescriptionforavicious circle of escalation. An outsider who lacks an understanding of thesituation may defensively try to pretend to have more knowledge than heactually has or may denigrate the knowledge of the insider, which will onlyexacerbateanysuspicionsoftheprocesstheinsiderhas.

Moralhazardhaslongbeenakeyconceptintheanalysisofinsurancerisks.Atypical example would be an insurance company's concern that an individualwhohaspurchasedinsuranceagainstautotheftwillnotexerciseasmuchcareinguardingagainsttheft(forexample,parkinginagarageratherthanonthestreet)as one who has not purchased insurance. If the insurance company coulddistinguishbetweenindividualswhoexerciseextracareandthosewhodon't,itcouldsellseparatecontracts to the twotypesof individualsandprice theextralosses into just the type sold to those exercising less care. However, theinformation advantage of an individual monitoring his own degree of carerelativetotheinsurancecompany'sabilitytomonitoritmakesthisprohibitivelyexpensive.Sotheinsurancecompanyneedstosettleforcrudermeasures,suchasestablishingadeductiblelossthattheinsuredpersonmustpayintheeventoftheft,therebyaligningtheinterestsoftheinsuredmorecloselywiththeinsurer.Ithasbecomeincreasinglycommonformoralhazardtobecitedinanalysesof
theeconomicsoffirmsingeneral,particularlyinconnectionwiththeimpactofthe limited liability of shareholders willing to take larger gambles. Theshareholdersknowthatif thegamblesucceeds,theywillavoidbankruptcyandshareintheprofits,butwillsuffernogreaterlossinalargebankruptcythaninasmallerone.ToquoteW.S.Gilbert:Youcan'tembarkontradingtootremendous,It'sstrictlyfairandbasedoncommonsense,Ifyousucceed,yourprofitsarestupendous,Andifyoufail,popgoesyoureighteenpence.
(fromGilbertandSullivan'sUtopia,Limited)A firm's creditors can exercise somecontrol over their actions andmightbe
able to forbid such gambles, assuming they have sufficient knowledge of thenature of the firm's investments.This iswhere the informational advantage ofthemanagersoverthecreditorswithrespecttothefirm'sinvestmentscomesin.What sort of actions can we expect from a trader based on the concept of
moral hazard? We can certainly expect that the trader may have a differentdegreeof riskaversion than thefirm'smanagement,since traders'participationinfavorableresultsexceedstheirparticipationindownsideresults.Taleb(1997,66)referstothisasthetrader“owninganoptiononhisprofits”andstatesthatinsuch circumstances “it is always optimal to take asmuch risk as possible.Anoptionisworththemostwhenvolatilityishighest.”Thiswillprobablybecomeevenmorenoticeableifthetraderhasbeenhavingapooryear.Knowingthatshe

isheadedtowardaminimalbonusandpossibledismissalmayinclinethetraderto swing for the fencesand takea large risk.The traderknows that if the riskturns out favorably, it might be enough to reverse previous losses and earn abonus.Ifitturnsoutpoorly,then“youcan'tgetlessthanazerobonus”and“youcan't get fired twice.” (You can damage your reputation in the industry, butsharing information about a trader's track record between competitor firmscannotbedonethatefficiently—moreinformationasymmetry.)Forthisreason,firmsmayseverelycutthetradinglimitsofatraderhavingapooryear.Beyond thedifferences in risk aversion,moral hazard can even result in the
perverse behavior (for the firm) of having a trader willing to increase riskexposure when faced with a lower expected return. Consider the followingadvicetotradersfromTaleb(1997,65):Howaggressiveatraderneedstobedependshighlyonhisedge,orexpectedreturnfromthegame:Whentheedgeispositive(thetraderhasapositiveexpectedreturnfromthegame,asisthecasewithmostmarketmakers),itisalwaysbesttotaketheminimumamountofriskandletcentrallimitslowlypushthepositionintoprofitability.Thisistherecommendedmethodformarketmakerstoprogressivelyincreasethestakes,inproportiontotheaccumulatedprofits.Inprobabilityterms,itisbettertominimizethevolatilitytocash-inonthedrift.Whentheedgeisnegative,itisbesttobeexposedaslittleaspossibletothenegativedrift.Theoperatorshouldoptimizebytakingasmuchriskaspossible.Bettingsmallwouldensureaslowandcertaindeathbylettingcentrallimitcatchuponhim.
The mathematics and economic incentives that this advice is based on arecertainlysound.Itisadvicethatisknowntoeverygambler(oroughttobe)andiswellfoundedinstatisticaltheory.Whentheoddsareinyourfavor,placemanysmallbets;whentheoddsareagainstyou,placeonelargebet.Essentially,whentheoddsareagainstyou,youareattemptingtominimizethelengthoftimeyouare playing against the house since you are paying a tax, in the form of anexpectedloss,fortheprivilegeofplaying.However,although thismakesperfecteconomicsensefromtheviewpointof
the individual trader, it is hardly the strategy the firmemploying these traderswouldwant to see them follow.The firm,whoseP&Lwill be the sumof theresultsofmanytraders,wouldliketoseetraderswithanegativeexpectedreturn

not takeanypositionsatall rather thanhavethesebe the traders takingonthemostrisk.Totheextentthefirm'smanagementcanfigureoutwhichtradershavea negative edge, it will restrict their risk taking through limits and thereplacementofpersonnel.However,theindividualtradershavetheinformationadvantageinknowingmorethanthefirmabouttheirexpectedreturns.Theyalsohave the asymmetrical incentive to take larger risks in this case, even thoughdoing sowill probablyhurt the firm.The traderswill notderivemuchbenefitfrom the firmdoingwell if theydonot contribute to that result, but theywillbenefitiftheydoincreasetheirriskandwinagainsttheodds.Moral hazard helps to explain the valuation that investors place on the
earningsvolatilityof financial firms.Youcould argue that firms shouldworryjust about the expectedvalueandnot aboutvolatility, since themarket shouldplacea riskpremiumonlyon risk that it cannothedgeaway (an investorwhowants less risk will just take the stock with the highest expected return anddiversify by mixing with government bonds). However, empirical evidenceshows that themarketplacesa stiffdiscountonvariable tradingearnings.Thereasonmaybeinformationasymmetry.Itishardforoutsiderstotellwhetherafirmis takingsoundgambles tomaximizeexpectedvalueor ismaximizing itsinsiders'optiononone-waybets.Perold(1998)states:Iviewfinancial intermediariesasbeingspecial inseveralways:First, thesefirms are in credit-sensitive businesses, meaning that their customers arestrongly risk-aversewith respect to issuerdefaultoncontractuallypromisedpayoffs. (For example, policyholders are averse to having their insuranceclaimsbesubjecttotheeconomicperformanceoftheissuingfirm,andstrictlyprefertodobusinesswithahighlyratedinsurer.)Thecreditworthinessoftheintermediary is crucial to its ability to write many types of contracts, andcontractguaranteesfeatureimportantlyinitscapitalstructure.Second,financialfirmsareopaquetooutsiders.Theytendtobeinbusinessesthat depend vitally on proprietary financial technology and that cannot beoperatedtransparently.Inaddition,thebalancesheetsoffinancialfirmstendtobeveryliquid,andaresubjecttorapidchange.Financialfirms,thus,aredifficult to monitor, and bear significant deadweight costs of capital.Guarantorsfacecostsrelatedtoadverseselectionandmoralhazard....Third, financial firms are also internally opaque. Information tends to beprivateatthebusinessunitlevel,orevenatthelevelofindividualemployeessuchastraders.Efficientmanagementofthesefirmsthusinvolvessignificant

use of performance-related compensation to mitigate against monitoringdifficulty.Moralhazardcancreateabattlegroundoverinformationbetweeninsidersand
outsiders.Insidersarefearfulthatanyinformationobtainedbyoutsiderswillbeusedasatooltotightencontrolsoverinsiders'actions.Insiderscanbeexpectedto have an inherent bias against tighter controls, partly because narrowing therange of actions available leads to suboptimal solutions and partly becauseincentive asymmetry makes riskier action more rewarding to insiders than tooutsiders. One of the most common ways in which insiders can misleadoutsidersabouttheneedforcontrolsistermedaPonzischeme.
2.2PONZISCHEMESIn its original meaning, a Ponzi scheme is a criminal enterprise in whichinvestors are tricked into believing that theywill receive very high returns ontheirinvestments,buttheearlyinvestorsarepaidoutathighratesofreturnonlywiththepaymentscomingfromthecashinvestedbylaterinvestors.Theillusionofhighreturnscanbeprettyconvincing.Afterall,youcanactuallyseetheearlyinvestors receiving their high returns in cash, and the conmen running theseschemes can produce very plausible lies about the purported source of thereturns. As a result, the pace of new investment can be intense, enabling theillusionofprofit tobemaintainedovera fairly long timeperiod. It'saviciouscycle—theeagernessofnewinvestorstoplacemoneyintheschemeleadstotheheightenedabilitytomakeinvestmentsappearhighlyprofitable,whichleadstoevengreatereagernessofnewinvestors.However,ultimately,anyPonzischememust collapse, as there is no ultimate source of investment return (in fact,investmentreturnisquitenegative,astheflowofnewinvestmentmustalsobepartially diverted to the criminals profiting from it). Ponzi schemes are alsosometimescalledpyramidschemesandbearacloseresemblancetochainletterfrauds.WhenIwrotetheimmediatelyprecedingparagraphforthefirsteditionofthis
book in 2003, I felt the need to thoroughly explain what a Ponzi scheme is.Today,itisprobablynotnecessary,asBernieMadoffhasregrettablygivenusallanexhaustivelessoninhowaPonzischemeisrun.TheoriginalmeaningofPonzischemeshasbeenbroadenedbyriskmanagers
to include situations in which firms are misled as to the profitability of a
business linebytheinadequatesegregationofprofitsonnewlyacquiredassetsandreturnsonolderassets.Let's consider a typical example. Suppose a trading desk has entered into
marketinganewtypeofpath-dependentoption.Thedeskexpectssubstantiallymore customer demand for buying these options than for selling them. Theyintend tomanage the resulting riskwith dynamic hedging using forwards andmorestandardoptions.Aswewillseewhendiscussingpath-dependentoptionsinSection12.3,itisverydifficulttotrytoestimateinadvancehowsuccessfuladynamichedgingstrategyforpath-dependentoptionswillbe.Insuchcircumstances,thepricingoftheoptiontotheclientmustbebasedon
an estimate of the future cost of the dynamic hedging, applying someconservatismtotrytocovertheuncertainty.Let'sassumethatatypicaltradehasaseven-yearmaturity,andthatthecustomerpays$8millionandthefirmpays$5 million to purchase the initial hedge. Of the remaining $3 million, we'llassumethatthedeskisestimatingdynamichedgingcostsof$1millionoverthetwo years, but the uncertainty of these costs leads to setting up a $2 millioninitialallowance(orreserve)tocoverthehedgingcosts,leaving$1milliontobebookedasup-frontprofit.Suppose the tradingdeskhasmadea seriouserror inpredicting thehedging
costs,andthehedgingcostsactuallyenduparound$5million,leadingtoanetloss of $2 million on every transaction booked. You may not be able to doanything about deals already contracted, but you would at least hope to getfeedbackfromthelossesencounteredonthesedealsintimetostopbookingnewdealsorelseraiseyourpricetoamoresustainablelevel.ThisshouldhappenifP&Lreportingisadequatelydetailed,soyoucanseethelossesmountinguponthehedgingofthesetrades(thisiscalledhedgeslippage).However, it isoftendifficult tokeep trackofexactlyhowtoallocateaday's
tradinggainsandlossestothebookofdealsbeinghedged.Youwanttoatleastknow that trading losses are occurring so you can investigate the causes. Themost severe problem would be if you didn't realize that trades were losingmoney.Howcouldthishappen?IfP&Lreportingisnotadequatelydifferentiatedbetween the existing business and new business, then the overall tradingoperation can continue to look profitable by just doing enough new business.Every time a new deal is booked, $1million goes immediately into P&L.Ofcourse,themoredealsthatarebooked,thelargerthehedginglossesthatmustbeovercome, so evenmore new trades are needed to swamp the hedging losses.TheresemblancetoaPonzischemeshouldnowbeobvious.

One key difference is that in its original meaning, the Ponzi scheme is adeliberate scam. The financial situation described is far more likely to arisewithoutanydeliberateintent.However,thoseinthefrontoffice,basedontheircloseknowledgeofthetradingbook,willoftensuspectthatthissituationexistsbeforeanyoutsidersdo,butmaynotwanttoupsettheapplecart.Theywouldbejeopardizingbonusesthatcanbecollectedupfrontonpresumedearnings.Theymayalsobewillingtotaketheriskthattheycanfindawaytoturnthesituationaroundbasedontheirgreaterparticipationinfutureupsidethanfuturedownside.Theymaychoose tohide thesituation fromoutsiderswho theysuspectwouldnot give them the latitude to take such risks. So moral hazard can turn anaccidentallyoriginatedPonzischemeintoonethatisveryclosetodeliberate.As a historical footnote, the Ponzi scheme derives its name from Charles
Ponzi,aBoston-basedswindlerof the1920s(though itwasnot thefirstPonzischeme—William “520 Percent”Miller ran one in Brooklyn around 1900; anexcellent1905playbyHarleyGranville-Barker,TheVosey Inheritance,whichhas been revived frequently over the past decade, revolves around a lawyerspecializing in trusts and estates trying to train his son to take over themanagement of hisPonzi scheme).The following account ofCharlesPonzi isdrawnfromSifakis(1982):[Ponzi]discoveredhecouldbuyupinternationalpostal-unionreplycouponsat depressed prices and sell them in theUnited States at a profit up to 50percent. It was, in fact, a classic get-rich-slowly operation, and as such, itboredPonzi.Sohefiguredoutabettergimmick.Ponzi figured out that telling people hewasmaking themoney and howhe
couldmake itwas just as good as actuallymaking it.He advertised a rate ofreturnof50percentinthreemonths.Itwasanofferpeoplecouldn'trefuse,andmoneystartedtocomerollingin.WhenPonzi actually started paying out interest, a deluge followed.Ononemonumentaldayin1920,Ponzi'sofficestookinanincredible$2millionfromAmerica'snewestgamblers,thelittlepeoplewhosqueezedmoneyoutofbankaccounts, mattresses, piggy banks, and cookie jars. There were days whenPonzi's office looked like a hurricane had hit it. Incoming cash had to bestuffed in closets, deskdrawersandevenwastebaskets.Of course, themorethatcamein,themorePonzipaidout.As long as new funds were coming in, Ponzi could continue to make
payments.However, aswith all pyramid schemes, the bubble had to burst. A

newspaper published some damaging material about his past, including timespentinprison.Newinvestorsstartedtohesitate.Ponzi'sfragileschemecollapsed,sinceitrequiredanunendingflowofcash.Hisbooks,suchastheywere,showedadeficitofsomewherebetween$5and$10million,orperhapsevenmore.Nooneeverknewforsure.
2.3ADVERSESELECTIONLet'sreturntothesituationdescribedpreviously.Supposeouraccountingisgoodenough to catch the hedge slippage before it does toomuch damage.We stopbookingnewdealsofthistype,butwemayfindwehavebookedadisturbinglylargenumberofthesedealsbeforethecutoff.Ifourcustomershavefiguredoutthedegree towhichweareunderpricing the structurebeforewedo, then theymaytrytocompleteasmanydealsastheycanbeforewewiseup.Thispatternhas frequently been seen in the financialmarkets. For example, the last firmsthatfiguredouthowtocorrectlypricevolatilityskewintobarrieroptionsfoundthat their customershad loadedupon trades that the less correctmodelswereunderpricing.Acommonconventionistolabelthissituationasadverseselectionasaparalleltoasimilarconcernamonginsurancefirms,whichworrythatthosecustomers with failing health will be more eager to purchase insurance thanthosewithbetterhealth,takingadvantageofthefactthatapersonknowsmoreabout his ownhealth than an insurance company can learn (Wilson1989). Soadverse selection is like moral hazard since it is based on informationasymmetry; thedifferenceis thatmoralhazardisconcernedwiththedegreeofrisk thatmightbe takenbasedon thisasymmetry,whereasadverseselection isconcernedwithadifference inpurchasingbehavior. In2001,GeorgeAckerlof,MichaelSpence,andJosephStiglitzwontheNobelPrizeineconomicsfortheirwork on adverse selection and its application to a broad class of economicissues.Concern about the risk from adverse selection motivates risk managers'
concern about the composition of a trading desk's customer base. The keyquestion is:Whatproportionof trades iswith counterpartieswhoare likely topossess an informational advantage relative to the firm's traders?As ageneralrule, you prefer to see a higher proportion of trades with individuals andnonfinancialcorporations thatare likely trading tomeethedgingor investmentneeds rather than seeking to exploit informational advantage. Alarm is raised
when an overwhelming proportion of trades iswith other professional traders,particularly ones who are likely to see greater deal flow or have a greaterproportion of trades with individuals and nonfinancial corporations than yourfirm's traders. Seeing greater deal flow can give a firm an informationaladvantagebyhavingamoreaccuratesenseofsupply-and-demandpressuresonthemarket.Agreaterproportionofcustomerswhoarenotprofessional tradersyieldstwofurtherpotentialinformationaladvantages:
1. At times youworkwith such customers over a long period of time tostructure a large transaction. This gives the traders advance knowledge ofsupplyanddemandthathasnotbeenseeninthemarketyet.2. Working on complex structures with customers gives traders a moreintimateknowledgeofthestructure'srisks.Theycanchoosetoretainthoserisks that this knowledge shows them are more easily manageable andattempttopasslessmanageablerisksontoothertraders.Tradersmaytendtounderestimatethedegreetowhichtheirprofitabilityisdue
to customer deal flow and overestimate the degree to which it is due toanticipatingmarketmovements.Thiscanbedangerousifitencouragesthemtoaggressively take risks inmarkets inwhich they do not possess this customerflow advantage. A striking example I once observed was a foreign exchange(FX)traderwhohadaphenomenallysuccessfultrackrecordofproducingprofitsat a largemarket-making firm.Convincedofhisprowess inpredictingmarketmovements,heacceptedalucrativeoffertomovetoafarsmallerfirm.Hewasbackathisoldjobinlessthanyear,confessinghesimplyhadnotrealizedhowmuchofhissuccesswasduetotheadvantagesofcustomerdealflow.Apithy, if inelegant,statementof thisprinciplewasattributed to theheadof
mortgage-backed trading at Kidder Peabody: “We don't want tomakemoneytrading against smart traders; we want to make money selling to stupidcustomers.”Ofcourse,stupidneedstobeunderstoodhereasmachoWallStreetlingoforinformationallydisadvantaged. It's thesortof talk that ismeant tobeheardonlyinlockerroomsandontradingfloors.AnunfriendlyleakresultedinhisquoteappearingonthefrontpageoftheWallStreetJournal.It isdelightfultoimaginethedialogueofsomeofhissubsequentconversationswiththefirm'scustomers.
2.4THEWINNER'SCURSE

Inresponsetotherisksofadverseselection,tradersmayexhibitconfidencethatthis is not something they need to worry about. After all, adverse selectionimpactsonlythosewithlessknowledgethanthemarket.Itisararetraderwhoisnotconvincedthatshepossessesfarmoreknowledgethantherestofthemarket—belief in one's judgment is virtually a necessity for succeeding in thisdemanding profession. Whether the firm's management shares the trader'sconfidencemaybeanotherstory.However,evenifitdoes,thetradermuststillovercomeanotherhurdle—thewinner'scurse, theeconomicanomaly that saysthatinanauction,eventhosepossessing(insider)knowledgetendtooverpay.The winner's curse was first identified in conjunction with bidding for oil
leases, but has since been applied tomany other situations, such as corporatetakeovers.Myfavoriteexplanationof themechanismthat leadstothewinner'scursecomesfromThaler(1992):Nexttimeyoufindyourselfalittleshortofcashforanightonthetown,trythefollowingexperimentinyourneighborhoodtavern.Takeajarandfillitwithcoins, noting the total value of the coins. Now auction off the jar to theassembledmasses at the bar (offering to pay thewinning bidder in bills tocontrolforpennyaversion).Chancesareveryhighthatthefollowingresultswillbeobtained:1. The average bid will be significantly less than the value of the coins.(Biddersareriskaverse.)2.Thewinningbidwillexceedthevalueofthejar.Inconducting thisdemonstration,youwillhavesimultaneouslyobtained thefunding necessary for your evening's entertainment and enlightened thepatronsofthetavernabouttheperilsofthewinner'scurse.When applied to trading, the winner's curse is most often seen in market
makingforlessliquidproducts,whereopinionsonthetruevalueofatransactionmayvarymorewidely.Marketmakers are in competitionwithone another inpricingtheseproducts.Thefirmthatevaluatesaparticularproductashavingahighervaluethanitscompetitionismostlikelytobewinningthelion'sshareofthesedeals.Consideramarketforoptionsonstockbaskets.Aswewilldiscussin Section 12.4, a liquidmarket rarely exists for these instruments, so pricingdepends on different estimates of correlation between stocks in a basket. Thefirmthathasthelowestestimateforcorrelationbetweentechnologystockswillwindupwiththemostaggressivebidsforbasketsoftechnologystocksandwillbookalargeshareofthesedeals.Anotherfirmthathasthelowestestimatefor

correlationbetweenfinancialindustrystockswillbookthelargestshareofthosedeals.An anecdotal illustration comes fromNeil Chriss.WhenChrisswas trading
volatilityswapsatGoldmanSachs,theywouldlineupfiveorsixdealerstogivethemquotes andwould alwayshit thehighest bidor lift the lowest offer.Thedealersknew theyweredoing this andwereveryuneasyabout it, limiting thesize of trades they would accommodate. One dealer, on winning a bid, toldChriss, “Iamalwaysuncomfortablewhen Iwina tradewithyou,as IknowIwasthebestbidontopoffiveothersmartguys.WhatdidIdowrong?”Adverse selection can be controlled by gaining expertise and increasing the
proportion of business donewith ultimate users rather thanwith othermarketmakers.However, thewinner'scursecanbecontrolledonlybyeitheravoidingauctionenvironmentsor adequately factoring in a furtherpricingconservatismbeyond risk aversion. It provides a powerful motivation for conservatism inpricingandrecognizingprofitsforthosesituationssuchasone-waymarkets(seeSection6.1.3)inwhichitisdifficulttofindpricesatwhichriskscanbeexited.Wedemonstratethemechanismofthewinner'scursewithasimplenumerical
example involving amarketwithonly three firms, twobuyers, andone seller.TheresultsareshowninTable2.1.TABLE2.1TheWinner'sCurse

Weconsidertwodifferentsituations.Inthefirst,directnegotiationoccursonthe price between the seller and a single buyer. In the second, both buyersparticipateinanauction.Thereare10 transactions that thesellermightsell to thebuyers.Neither the
buyers nor the seller is certain of the true value of these transactions (forexample,theymightdependonfuturedynamichedgingcosts,whichdependonthe evolution of future prices, which different firms estimate using differentprobabilitydistributions).Afterthefact,weknowthetruerealizedvalueofeachtransaction, as shown in column 2 of the table. Buyer 1's knowledge of thismarketissuperiortobuyer2's,andbothhavesuperiorknowledgecomparedtotheseller.Thiscanbeseenbythecorrelationsbetweenrealizedvalueandeachparty'sestimateoftransactionvalue(83.3%forbuyer1,72.2%forbuyer2,and63.2%fortheseller).Theconsequencesofthisinformationaladvantagearethat
both buyer 1 and buyer 2make a profit at the expense of the seller in directnegotiations, and that buyer 1's profit in this situation is higher thanbuyer 2'sprofit.Inthedirectnegotiationsituation,weassumethatthebuyer,beingriskaverse,
hassuccessfullybiasedhisbidsdowntobeonaveragelower thantherealizedvalue,andtheseller,beingriskaverse,hassuccessfullybiasedhisaskedpricesuptobeonaveragehigherthanrealizedvalue.Weassumenotransactiontakesplaceifthebuyer'sbidislowerthantheseller'sasked.Ifthebuyer'sbidexceedsthe seller's asked, we assume the transaction takes place at the average pricebetween these two prices.As a result, buyer 1 has a total P&L of +1.09, andbuyer2hasatotalP&Lof+0.55.Nowconsiderwhathappensin theauctionwhenthebuyershavetocompete
for the seller's business, a situation very typical formarketmaking firms thatmust offer competitive price quotations to try to win customer business fromothermarketmakers.Thesellerno longer reliesonhisownestimateofvalue,but simply does business at the better bid price between the two firms. Eventhoughbothfirmscontinuetosuccessfullybiastheirbidsdownonaveragefromrealizedvalues,bothwinduplosingmoneyintotal,withbuyer1havingaP&Lof–0.86andbuyer2havingaP&Lof–0.84.Thisisbecausetheynolongerhavegainson trades that they seriouslyundervalued tobalanceout losseson tradesthattheyseriouslyovervalued,sincetheytendtolosetradesthattheyundervaluetotheotherbidder.Thisillustratesthewinner'scurse.The spreadsheet WinnersCurse on the course website shows the
consequencesofchangingsomeoftheassumptionsinthisexample.
2.5MARKETMAKINGVERSUSPOSITIONTAKING
An important institutional distinction between participants in the financialmarkets that we will refer to on several occasions throughout this book isbetweenmarketmakingandpositiontaking:
Marketmaking(alsocalledbookrunningorthesellside)consistsofmakingtwo-waymarketsbyengagingin(nearly)simultaneousbuyingandsellingofthesameinstruments,attemptingtokeeppositionholdingstoaminimumandtoprofitprimarilythroughthedifferencebetween(nearly)simultaneousbuyandsellprices.
Positiontaking(alsocalledmarketusing,pricetaking,speculation,orthebuyside)consistsofdeliberatelytakingpositionsononesideortheotherofamarket,hopingtoprofitbythemarketmovinginyourfavorbetweenthetimeofpurchaseandthetimeofsale.Positionsmaybetakenonbehalfofafirm(inwhichcaseitisoftenlabeledproprietarytrading)oronbehalfofanindividualclientoragroupofclients,suchasamutualfund,hedgefund,ormanagedinvestmentaccount.
Sometimelagnearlyalwaysoccursbetweenthepurchaseandsaleinvolvedinmarketmaking.Dependingonthelengthoftimeanddegreeofdeliberatechoiceoftheresultingpositions,thesemaybelabeledposition-takingaspectsofmarketmaking.Marketmakingalmost always involves riskbecauseyoucannotoftenbuyandsellexactlysimultaneously.Themarketmakermakesaguessonmarketdirection by its posted price, but the bid-ask spread can outweigh even apersistenterrorindirectionalguessaslongastheerrorissmall.(InExercise9.1,you'llbeaskedtobuildasimulationtotestoutthedegreetowhichthisistrue.)The experience and information gained from seeing somuch flowmeans youmostlikelywilldeveloptheabilitytoberightondirectiononaverage.However,thepositiontakerhastheadvantageoverthemarketmakerofnotneedingtobein themarket every day.Therefore, the position taker can stay away from themarketexceptwhenpossessedofastrongopinion.Themarketmakercannotdothis;stayingawayfromthemarketwouldjeopardizethefranchise.The different objectives of market makers and position takers tend to be
reflected in different attitudes toward the use of models and valuationtechniques.Apositiontakergenerallyusesmodelsasforecastingtoolstoarriveatabestestimateofwhatapositionwillbeworthat theconclusionofa timeperiod tied toananticipatedevent.Theposition takerwillpayattention to themarketpriceofthepositionduringthattimeperiodtodeterminethebesttimetoexit the position and to check whether new information is coming into themarket. However, a position taker will generally not be overly concerned bypricesmovingagainsttheposition.Sincethepositiontakerisusuallywaitingforaneventtooccur,pricemovementspriortothetimetheeventisexpectedarenotthatrelevant.Afrequentlyheardstatementamongpositiontakersis:“IfIlikedthepositionatthepriceIboughtit,Ilikeitevenbetteratalowerprice.”By contrast, a market maker generally uses models to perform risk
decompositioninordertoevaluatealternativecurrentpricesatwhichapositioncanbeexited.Themarketmakerwillpaycloseattentiontocurrentmarketpricesasthekeyindicatorofhowquicklyinventorycanbereduced.Thedirectionin
which prices willmove over the longer term is of little concern compared todeterminingwhatpricewillcurrentlybalancesupplyanddemand.An amusing analogy can be made to gambling on sports. Position takers
correspondtothegamblerswhoplacetheirbetsbasedonananalysisofwhichteam is going to win and by what margin. Market makers correspond to thebookmakerswhosesoleconcernistomovetheoddsquotedtoapointthatwilleven out the amount bet on each side. The bookmaker's concern is not overwhichteamwinsorloses,butovertheevennessoftheamountswagered.Closeto even amounts let the bookmakers come out ahead based on the spread orvigorish in the odds, regardless of the outcomeof the game.Uneven amountsturnthebookmakerintojustanothergamblerwhowillwinorlosedependingontheoutcomeofthegame.As explained in Section 1.1, the focus of this book is on the active use of
trading in liquidmarkets tomanage risk.Thisview ismoreobviouslyalignedwith market making than with position taking. In fact, the arbitrage-basedmodels that are so prominent in mathematical finance have been developedlargely to supportmarketmaking.Position takers tendmore toward theuseofeconometric forecasting models. In Section 6.1.7, we will further discuss theissueof the extent towhichposition takers should adopt the riskmanagementdisciplinethathasbeendevelopedformarketmakers.Someauthorsdistinguish a third typeof financialmarketparticipantbesides
marketmakersandpositiontakers—thearbitrageurs.Ibelieveitismoreusefultoclassifyarbitragetradingasasubcategoryofpositiontaking.Purearbitrage,in itsoriginalmeaningof takingoffsettingpositions inclosely relatedmarketsthatgeneratearisklessprofit,israrelyencounteredincurrentfinancialmarkets,giventhespeedandefficiencywithwhichliquidpricesaredisseminated.Whatisnowlabeledarbitrageisalmostalwaysatradethatoffersalowbutrelativelycertain return.Themotivationsandusesofmodelsby thoseseeking tobenefitfromsuchpositionsareusuallycloselyalignedwithotherpositiontakers.A good example is merger arbitrage (sometimes misleadingly called risk
arbitrage). Suppose that Company A and Company B have announced aforthcomingmergerinwhichtwosharesofA'sstockwillbetradedforoneshareof B's stock. If the current forward prices of these stocks to the announcedmergerdateare$50forAand$102forB,anarbitragepositionwouldconsistofaforwardpurchaseoftwosharesofAfor$100andaforwardsaleofoneshareofBfor$102.Onthemergerdate,thetwosharesofApurchasedwillbetradedforoneshareofB,whichwillbedeliveredintotheforwardsale.Thisnetsasure
$2,butonly if themergergoes throughasannounced. If themerger fails, thistradecouldshowasubstantialloss.Mergerarbitrageursarepositiontakerswhoevaluatetheprobabilityofmergersbreakingapartandstudythesizeoflossthatmight result. They are prototypical forecasters of events with generally littleconcernformarketpriceswingspriortotheoccurrenceoftheevent.For further reading on the economics and institutional structure of market
making andposition taking, a book Iwould recommendvery highly isHarris(2003).Anyoneinvolvedinriskmanagementshouldattempttogaininsightintohowriskmanagement isviewedby traders.While friendshipandconversationare the best way to approach this, it is also helpful to read about riskmanagement from a trader's perspective. The best book of this type I haveencounteredisBrown(2012).
CHAPTER3
OperationalRiskOperational risk is usually defined in thenegative—it includes all of the risksthatarenotcategorizedaseithermarketorcreditrisk.Theindustrydoesnotyethaveconsensusonthisterminology.Somefirmsusethetermoperationalrisktocover a subset of the risks other than market and credit risk. For furtherdiscussion, see Jameson (1998a). Broadly speaking, these risks are the mostdifficulttoquantify.Oneattemptatamorepositivedefinitionthathasbeengainingsomecurrency
has beenmade by theBasel Committee onBanking Supervision: “the risk ofdirect or indirect loss resulting from inadequate or failed internal processes,people,orsystems,orfromexternalevents.”Anotherattemptwouldbetobreakapart risk into three pieces. View a financial firm as the sum total of all thecontractsitentersinto.Thefirmcansufferlossesonthecontractsinoneofthreeways:
1. Obligations in contracts may be performed exactly as expected, butchanges in economic conditions might make the sum of all contractedactionsanundesiredoutcome.Thisismarketrisk.2. The other parties to some of the contracts may fail to perform asspecified.Thisiscreditrisk.3. The firm may be misled about what the contracted actions are or theconsequencesoftheseactions.Thisisoperationalrisk.Operationalriskisvirtuallyallriskthatcannotbemanagedthroughtheuseof
liquidmarkets, so, as argued inChapter1, it doesnot fallwithin the scopeoffinancialriskmanagement.Inthisway,itisverymuchliketheriskstraditionallymanagedbyinsurancecompanies.Indeed,oneoftheprimarytoolsformanagingoperational risk is to try to buyprotection from insurance companies, aswe'lldiscussinSection3.8.But,eventhoughthefinancialriskmanagementapproachdoes not apply, these are risks that arise as a result of trading and so areintertwinedwith financial riskmanagement, justifying a quick surveyof theseissuesinthisbook.Operationalriskcanbesubdividedintothefollowingcategories:Operationsriskistheriskthatdeficienciesininformationsystemsorinternalcontrolswillresultinunexpectedloss.Operationsriskcanbe
furthersubdividedintotheriskoffraud,riskofnondeliberateincorrectinformation,disasterrisk,andpersonnelrisk.Legalriskistheriskthatthetermsorconditionsofacontractoragreementwillproveunenforceableduetolegaldefectsinthecontractorinrelateddocumentationandprocedures.Anothertypeoflegalriskistheriskthatactionsofthefirm'semployeeswillhavebeenfoundtobeillegalandsubjectthefirmtosubstantialpenalties.Legalriskincludesregulatoryrisk.Reputationalriskistheriskthattheenforcementofcontractprovisionswillprovetoocostlyintermsofdamagetothefirm'sreputationasadesirablefirmforcustomerstodofuturebusinesswith.Accountingriskistheriskthatanerrorinaccountingpracticewillnecessitatearestatementofearnings,whichadverselyaffectstheinvestors'orcustomers'perceptionofthefirm.Fundingliquidityriskistheriskthataninstitutionwillhavetopayhigherthanprevailingmarketratesforitsfundingduetoeithertheinvestors'perceptionthatthecreditqualityoftheinstitutionisimpaired(possiblyduetoearningsproblemsorcapitalstructureproblems)ortheoverlyheavyuseofparticularfundingsourceswithinagiventimeperiod,withthelargesizeoftransactionsimpactingfundingcost.Enterpriseriskistheriskoflossduetochangeintheoverallbusinessclimate,suchastheneedsofcustomers,actionsofcompetitors,andpaceoftechnologicalinnovation.
This chapter briefly discusses each of these risks and possible controls, andthenpresentsanoverviewofhowtheseriskscanbeidentifiedandtheextenttowhichtheycanbequantified.Avaluable source of ideas on operational risk and control procedures is the
TradingandCapital-MarketsActivitiesManualoftheFederalReserveSystem.Ihave used it as a foundation for several of the points in this chapter andrecommend that readers interested in this topic look closely at the followingsections: 2050.1 and 2060.1 (Operations and Systems Risk), 2070.1 (LegalRisk), 2150.1 (Ethics), 3005.1 (Funding Liquidity Risk), and 2040.1 (thesubsectiononNewProducts).
3.1OPERATIONSRISKOperations risk can be further subdivided into the risk of fraud, risk of

nondeliberateincorrectinformation,disasterrisk,andpersonnelrisk.
3.1.1TheRiskofFraudThe actual diversion of cash can take the form of creating unauthorizedpayments, conducting transactions at prices that are not the best available inreturn for bribes, or utilizing one's position to engage in profitable personaltradingattheexpenseofthefirm'sprofits.Deception about earnings, in order to generate unearned bonuses or further
one'scareer(orsimplyavoidbeingfired),cantaketheformofrecordingtradesatincorrectpricesormisreportingthecurrentvalueofpositions.We'llencounterexamples of such deceptions that occurred atKidderPeabody,Barings,AlliedIrish Bank (AIB), and Société Générale in Section 4.1. Section 4.1, coveringfinancial disasters that were due to misleading reporting, should be read inconjunctionwiththissection.Deception about positions, in order to appear to be operating within limits
whenanindividualisactuallyoutsidethemortomisleadmanagementaboutthesizeofpositionsbeing taken, isdone inorder topreserve freedomofaction—avoidingrequirementstoclosedownpositions.Thiscanbebecauseatraderhasadifferentbeliefaboutmarketmovementsthanmanagementoradifferentviewtowardriskthanmanagement(themoralhazardissuediscussedinSection2.1).Deception about positions can entail the outright misreporting of positionsthroughthefailure toenter transactions(tickets in thedrawer)ormanipulationof management reporting, or hiding positions by arranging for them to betemporarily held by another party with an unrecorded promise to take thepositionback(parking).Goingback30yearsorso, theoral traditionwithincontrol functionswas to
worryaboutpositionfalsificationprimarilybytraderssimplynotenteringsomeof their trades onto the firm's books and records (tickets in the drawer). Thisapproachseemstobeonthedecline,presumablybecausethepossibilityofthefraud being exposed through an inquiry from a counterparty to an unrecordedtradeistoogreat.Whatseemstohavereplaceditistheentryoffictitioustradesdesigned either tooffset the riskpositionof actual trades,making thenet risklooksmall,ortocreatebogusprofitandloss(P&L)todisguiseactualearnings.Sincefictitioustradeslackarealcounterparty, theycannotbeexposedthroughaction of a counterparty but can be uncovered only by internal controls. Thecreator of fraud is in an ongoing battle with control personnel—the control

personnel have the advantage that uncovering only one clear-cut case offalsificationisenoughtouncoverthefraud;theadvantageofthecreatorofthefraud is themultiplicity ofmethods the creator can employ to discourage thisdiscovery.The most fundamental control for preventing fraud is by separating the
responsibilities between the front office and the support staff (middle office,back office, and controllers), making sure that all entries of transactions andmanagement reporting systems are under the complete control of the supportstaff. Tomake this separation of responsibilities work, the support staff musthave a separate line of reporting from the front-office staff and compensationthatisreasonablyindependentofthereportedearningsofthebusinessareabeingsupported.Asmuchaspossible, thereportinglinesandcompensationstructureshouldalign support staff interestswith thoseofmanagement rather thanwiththoseofthefrontoffice.However,eventhebest-designedstructuresofthistypeare subject to pressures in the direction of alignment of support staff interestswith front-office interests. Constant vigilance is required to fight against this.Thesepressuresinclude:
Supportstaffcompensationcannotbecompletelyindependentfromtradingperformance.Ataminimum,unsuccessfulresultsfortradingmayleadtotheshrinkingoreliminationofatradingoperationalongwithassociatedsupportstaffpositions.Sincetradingprofitsaretheultimatesourcefromwhichexpensesgetpaid,itisdifficulttoavoidsomelinkagebetweenthetradingperformanceandlevelofcompensation.Section4.1.4presentsavividexampleofhowthispressurewasfeltinpracticeatAIB.Front-officepersonnelalmostalwayscommandhighercompensationandprestigethanmembersofthesupportstaff,usuallyconsiderablyhigher.Often,supportstaffmembersarehopingtoeventuallymoveintofront-officepositions.Front-officestaffcanaffordtoofferinformalincentivestothesupportstaffforcooperationsuchashelpingthemseekfront-officejobs,givingaccesstoperkssuchaslavishmealsandfreeticketstootherwiseunavailablesportsevents,andevenofferingoutrightcashbribes.Thehigherprestigeoffront-officepositionsandtherealityofthegreatermarketexperienceoffront-officepersonnelrelativetosupportpersonnelcanbeutilizedtoplacetremendouspressureonthesupportstafftoadoptfront-officeviews.Sincethesupportstaffhasresponsibilitiesforsupportingthefrontofficeaswellasforsupportingmanagement,theirratingsforjobperformanceare

oftenheavilydependentontheviewsoffront-officepersonnel,whoarelikelytobeworkingfarmorecloselywiththemthanmanagementpersonnel.
Inadditiontotheseparationofresponsibilities,controlsinclude:Supportstaffproceduresshouldbethoroughlydocumented.Makingtheseasunambiguousaspossiblelessensthescopeforfront-officeinfluence.Traderlinesshouldberecordedtocreateapotentialsourceforspottingevidenceofcollusionwithbrokersortradersatotherfirms.Makesurethattradesareenteredintothefirm'ssystemsasclosetoexecutiontimeaspossible.Thefurtherawayfromexecutiontimeyouget,thegreaterthepossibilitythatsubsequentmarketmovementswillcreateatemptationtohideorotherwisemisrepresentthetransaction.Reviewalltradestolookforpricesthatappearoff-market,andperformathoroughinvestigationofanytradesidentifiedassuch.Makesurethatallmarketquotesusedtovaluepositionscomeintosupportstaff,notfront-officepersonnel,andarepolledfromaslargeauniverseofsourcesaspossible.Providedailyexplanationsofprofitandloss(P&L)changeandcashneedsproducedbythesupportstaff.IncorrectreportingofpositionscanoftenbeidentifiedbytheinabilitytoexplainP&Landcashmovementsbasedonthereportedpositions.Everycustomerconfirmationofanewtradeorapaymentrequiredbyaprevioustradeshouldbereviewedbythesupportstaffforconsistencywithtransactionsandpositionsbeingreported.Allcustomercomplaintsshouldbereviewedbythesupportstaff,notjustfront-officepersonnel.Theconfirmationprocessshouldbeconductedonlywithsupportpersonnelatotherfirms,notwithfront-officepersonnelatotherfirms.Haveclearpoliciesaboutunacceptablepracticesthatareconsistentlyenforced.Deliberateactionstohideapositionmustentailstrongpenalties,withoutexceptionsforstartraders.Personaltradingofbothfront-officeandsupportpersonnelshouldbecloselymonitored.Tightcontrolsshouldbeplacedonafter-hoursandoff-premisestradingtoensurethattransactionscannotbeomittedfromthefirm'srecords.Brokerusageshouldbemonitoredforsuspiciouspatterns—undueconcentrationsofbusinessthatmightbecompensationforsupplyingoff-marketquotesordirectbribery.
Firmsshouldinsistonperformingthoroughbackgroundchecksofapotentialcustomer'screditworthinessandbusinessreputationbeforeenteringintotransactions.Inotherwords,theyshouldrefusetodealwithcustomerstheydonotknow,evenonafullycollateralizedbasis.Unknowncustomerscouldbeincollusionwiththefirm'spersonnelforoff-markettradingorparking.Systemssecuritymeasuresshouldbeinplacetoensurethatnooneotherthanauthorizedsupportpersonnelcanmakeentriesorchangestomanagementinformationsystems.Inparticular,nofront-officepersonnelshouldhavesuchaccess.Thefirm'sauditorsshouldperformaperiodicreviewofalloperatingprocedures.Controlfunctionsmustbudgetsomesparecapacityforinvestigativework.Theadvantageofthecontrolfunctionsrelativetoanattemptatconcealingpositionsisthatonlyoneclear-cutinstanceofconcealmentneedstobeuncoveredtoexposeafraudandthatanysignificantattemptatconcealmentwillcreatealargenumberofwarningindicatorsthatcanpotentiallytriggeraninvestigation.Butthedisadvantageofcontrolfunctionsrelativetoanattemptatconcealingpositionsisthataskillfulperpetratoroffraudcanbeexpectedtobeadroitatofferingsuperficiallyplausibleexplanationsofunusualpatterns.
Ifaninvestigationisbeingdoneinalittlesparetimeofcontrolpersonnelwithafullplateofdailyresponsibilities,itwillbetooeasyforthemtotrytowrapitupquicklybyacceptingaplausibleexplanation.Ifcontrolpersonnelhavesomebudgeted time for conducting such investigations and know that thethoroughnessofperformanceofthistaskwillbepartoftheirjobevaluations,itis farmore likely that theywillperform theextraworkneeded touncover thetrue situation. This will lead to other benefits as well, since thoroughinvestigationofunusualpatternsmayturnupothergaps in thecontrolsystem,such as the need for new risk measures or accidental errors in recordingpositions.
Controlfunctionsshouldmaintainsomecentralregistryofinvestigationstheyhaveconducted(alongwithoutcomes).Evenifaperpetratoroffraudhasbeensuccessfulinfoolingcontrolpersonnelinseveralinvestigations,theunusualnumberofinvestigationsthattheperpetrator'sactivityisengenderingmayitselfbeacluethatleadstoamorethoroughinvestigation.Anoverridingconcernmustbetoprotectcontrolpersonnelagainstbullying.
Tohaveagoodchanceofuncoveringfrauds,investigationsneedtobelaunchedbasedonwarningindicatorsthatwillcreatemanyfalsepositives.Thismeansthatthecontrolpersonnelwillgointotheinvestigationknowingthatthemostlikelyoutcomewillbeafindingthatnothingiswrong.Theveryfactthattheyareconductinganinvestigationislikelytoberesentedbytraders(asawasteoftimeandasanindicatorthattheirhonestyisbeingquestioned).Ifcontrolpersonnelfeeltheyaregoingtobeberatedbythetraderswhentheirinvestigationfindsnothingwrong,thentheyarelikelytoconductfewerandmoresuperficialinvestigations.Tradingmanagementneedstomakesurethattheygivecontrolpersonneltheproperbackingandtrytoexplaintotradersthemotivationforsuchinvestigations.Thecarefuldocumentationofmajorincidentsoffraudandthedifficultyindetectingthemcanprovidetradingmanagerswithtoolstouseinmakingthiscase.
3.1.2TheRiskofNondeliberateIncorrectInformationIt is farmore common tohave incorrectP&Landposition informationdue tohuman or systems error than incorrect P&L and position information due tofraud.Manyofthecontrolsfornondeliberateincorrectinformationaresimilartothe controls for fraud. The separation of responsibilities is effective in havingseveral setsof eyes lookingat the entryof a trade, reducing the chance that asingle individual's error will impact positions. Checking confirmations andpayment instructionsagainstpositionentries,P&Landcashreconciliation,andtheinvestigationofoff-markettradesarejustaseffectiveinspottinginadvertenterrorsastheyareinspottingfraudulententries.Equallycloseattentionneedstobepaidtomakingsurecustomershavepostedcollateralrequiredbycontractstoavoid inadvertently takingunauthorized credit risk. (For further discussions oftheroleofcollateralinmanagingcreditrisk,seeSections4.1.1,10.1.4,14.2,and14.3.3.)It is every bit as important to have front-office personnel involved in
reconciliation (to take advantage of their superior market knowledge andintuitive feel for the size of their P&L and positions) as it is to have supportpersonnel involved (to take advantage of their independence). Front-officepersonnelmustbeheldresponsiblefortheaccuracyoftherecordsoftheirP&Landpositions,andcannotbeallowedtoplacealltheblameforincorrectreportson support personnel, in order to ensure that they will place sufficientimportance on this reconciliation. Front offices should be required to produce
daily projections of closing positions and P&L moves based on their owninformal records,prior toseeing theofficial reportsofpositionsandP&L,andshouldreconcilesignificantdifferencesbetweenthetwo.Toprevent incorrectP&Landposition information, it is important to ensure
that adequate support personnel and system resources are available, both inquantity and in quality, relative to the size and complexity of trading.Carefulattention needs to be paid to planning staff and system upgrades to anticipategrowth in trading volume.Management needs to be ready to resist prematureapproval of a new business if support resources cannot keep pacewith front-officedevelopment.Shouldmodelriskberegardedasanoperationsrisk issue?Theviewpointof
this book is thatmodel risk is primarily amarket risk issue, since the properselection and calibration to market prices of models and the provision foradequate reserves againstmodel uncertainty are best dealtwith by themarketrisk discipline. Chapter 6 will elucidate this view. However, the properimplementationofmodelsandtheassurancethatsystemchangesareundertakenwiththepropercontrolsarebestdealtwithbytheoperationsriskdiscipline.Anareaindependentofmodelandsystemdevelopersandthefrontofficeshouldbeestablished to performquality assurance testing of system implementation andmodifications,andtoreviewtheadequacyofsystemdocumentation.
3.1.3DisasterRiskTheadequacyofsupportpersonnelandsystemresourcesforreportingP&Landpositionsmustalsobeensuredin theeventofaphysicaldisaster.Examplesofsuchdisasterswouldincludeapowerfailure,fire,orexplosionthatclosesdowna trading facility and/or its supporting systems. Another example would be acomputer system problem, such as a virus or error with consequences far-reaching enough to jeopardize the entire support structure (the most famousexample is the Y2K crisis). Resource adequacy cannot be limited to just theabilitytokeeptrackofexistingpositions.Itisalsonecessarytoallowcontinuedtrading in a sufficiently controlled environment, at least at a level that willpermittheongoingmanagementofexistingpositions.Thesteps todealwithdisaster riskbeginwith thedevelopmentofadetailed
contingencyplan,whichincludesplansforbackupcomputersystems,frequentlyupdatedbackupdatasets,backuppowersources,andabackuptradingfloor.Theadequacyofcontingencyplansmustbe judgedagainst the likelihood thatboth

the primary and backup facilities will be impacted by the same event. ThisconcernwassharpenedbythetragiceventsofSeptember11,2001,whenBankofNewYorkhadboth itsprimaryandsecondary trading systems,whichwerelocatedinseparatebutnearbybuildings,knockedoutatthesametime.Thishascausedmanyfinancialfirmstorethinkthedegreeofgeographicseparationthatshouldberequiredbetweenalternativesites.Widespreadcomputererrorsthatcutacrossallsystemsofthefirm(backupas
wellasprimary)areparticularlyworrisome.Forexample,theonlywayaroundtheY2Kbugwastogetacompletefixinplaceandthoroughlytestedpriortotheonsetofthepotentialproblem.
3.1.4PersonnelRiskInvestmentbankingfirmshaveahistoryofraidingacompetitor'spersonnelandhiring,enmasse,anentiregroupoftradersalongwithkeysupportstaff.Thiscanhavethesameimpactontheraidedfirmasaphysicaldisaster,butithasalongerrecovery time, since replacement personnel must be identified, hired, andtrained. Protective steps are to utilize cross-training and occasional backupduties as widely as possible to ensure that personnel are available to at leasttemporarily take over the duties of departed personnel. The requirements forthoroughdocumentationofsystemsandproceduresarealsoimportant.
3.2LEGALRISKThere are two types of legal risk: (1) the risk that contracts will proveunenforceableand(2)theriskthatactionsofthefirm'semployeeswillbefoundtobeillegal,subjectingthefirmtosubstantialpenalties.Wewillexaminebothinturn.
3.2.1TheRiskofUnenforceableContractsThelegalriskthatthetermsorconditionsofacontractwillproveunenforceableduetolegaldefectscanproveamoreseriousproblemthanthecreditriskthatacounterpartydoesnothavethefinancialcapacitytoperformonacontract.Ifacontract is found to be unenforceable, it may simultaneously impact a largenumberofcontractsandhaveexactlythesameimpactonatradingfirmasifalargenumberof counterpartiesdefaulted simultaneously.Aclassic caseof this

was the finding by British courts that derivative contracts with Britishmunicipalities were ultra vires; that is, they were not contracts that themunicipalities were legally authorized to enter into. This simultaneouslycanceled all outstanding derivatives contracts that financial firms had withBritishmunicipalities.Formoredetail,seeMalcolm,Sharma,andTanega(1999,149–150).Anotherreasonwhylegalriskcanbemoreseriousthancreditriskisthat it suffers more from adverse selection. Counterparty default is generallyunrelatedtowhetherthecounterpartyowesmoneyorisowedmoney.However,lawsuitsoccuronlywhencounterpartiesowemoney.Themajormitigantstolegalriskare:Thoroughlyreviewingcontracttermsbyexperiencedlawyerstoensurethatlanguageisproperlydraftedandthatthecontractedactivitiesareauthorizedforthecontractingparties.Thoroughlydocumentingwhattermshavebeenagreedto.Restrictingdealingstoreputablecounterparties(knowyourcustomer).Placinglimitsonexposuretolegalinterpretations.Ensuringthatcontractsspecifythatlegaljurisdictionresideswithcourtsystemsthathaveexperienceindealingwiththeparticularissuesinvolvedandhavepreviouslydemonstratedfairnessindealingwithsuchcases.
A thorough review of contract terms may require lawyers with specializedlegalknowledgeofparticularsubjectareasoflawandlegaljurisdiction(suchaslawsofparticular countries, states, anddistricts), includingknowledgeofhowcourtsandjuriesinajurisdictiontendtointerpretthelawaswellasapplicableprecedents.Thisoftenrequiresthatlegalworkbecontractedtooutsidecounselwho specialize in certain areas and jurisdictions. However, care must beexercised to prevent front-office areas, which have a vested interest in seeingthatatransactiongetsdone,fromusingthisprocesstoshopforalegalopinion,hiringa legal firm that canbecountedon toprovidea favorableopinion.Theprocess of outside contracting of legal opinions must be controlled by an in-houselegaldepartmentorasingletrustedoutsidelegalfirmthatcanbecountedon tooffer independent judgments in the interestof the tradingfirmwhen thisconflictswiththeinterestofindividualfront-officeareaswithinthefirm.Adequate and clear legal language may prove useless if sufficient
documentation has not been obtained showing customer agreement to thelanguage.Themostimportantmeasureinthisregardisastrongcommitmenttofollowingupverbal tradeagreementswithwell-documentedconfirmationsandsignedlegalagreements.Thisrequiresadequatedocumentationstaffwithintrade
supportfunctionsandthedisciplinetoturndownpotentiallyprofitablebusinessfromcounterparties thatdonot follow throughon the requireddocumentation.The enforcement of these rules is often placedwithin the credit risk function.Documentationshould includewrittenconfirmation thatacounterparty'sboardof directors and senior management have knowledge of the activities beingcontractedandhaveauthorizedtheofficersofthecounterpartyfirmwithwhichthe trading firm is dealing to enter into such contracts on behalf of thecounterparty firm. It is also useful to record all conversations between thecounterpartiesandtradingfirmpersonnelsothatdisputesastowhattermswereverbally agreed to can be settled equitably, without resorting to costly legalproceedings.Firmshavestartedtoworryaboutwhatmaybetermed legal-basisrisk.This
ariseswhenafirmtreatstransactionswithtwodifferentcustomersasoffsettingand hencewithoutmarket risk (although notwithout credit risk).However, itmayturnoutthatslightlydifferentwordinginthetwocontractsmeansthattheyare not truly offsetting in all circumstances. Although carefully vettingcontractuallanguageisanecessarycountermeasure,anevenbetterpreventativeistousestandardizedcontractuallanguageasmuchaspossibletomakeiteasiertospotdifferences.TheInternationalSwapsandDerivativesAssociation(ISDA)has been working to develop standardized language that can be used inderivativescontracts.SeeSection13.1.1.2formoredetails.In addition to enforcing documentation rules, the credit risk function also
needs to restrict the extension of credit to reputable counterparties. It isnecessarytorecognizethatthewillingnessofacounterpartytomeetcontractualobligations is every bit as important as its financial ability to meet thoseobligations. A counterparty that does not have a good business reputation toprotectmayfeelfreetolookfortheslightestpretexttoenteralegalchallengetomeet its contractual obligations. Even if a firm has legal right strongly on itsside, dealing with such a client may be very costly due to the expense oflitigationandthethreatofusingalawsuitasanexcuseforafishingexpeditiondiscovery process designed to uncover internal corporate information that cancausepublicembarrassment.Thethreatofsuchcostsmayinclineafirmtosettleforlessthanthefullamountcontractuallyowed,whichservesasanincentiveforunscrupulous firms todelay the settlementof legitimate claims.Bycontrast, afirmoranindividualwhosereputationforethicalbusinessdealingsisoneofitsassets will actually lean in the direction of making payments that meet itsunderstanding of its obligations, even when the formal contract has been

imperfectlydrawn.Becauseitisextremelydifficulttoquantifylegalrisk,firmsmayoverlookthe
usefulnessofquantitative limits tocontrolexposure.Consideranexampleofaparticular legal interpretation that has the potential to void all contracts of aspecific type.The firm's legal consultants can issue opinions on the degree oflikelihood that suchan interpretationwillbe issued in the futurebyacourtorregulatory body. Ultimately, business management must make a judgment onwhether the economic benefits of the contract, relative to alternative ways ofachievingthedesiredfinancialresult,outweighthisrisk.Onasingledeal,thisisabinarydecision—eitheryouenterintothecontractoryoudon't.Therearefewcircumstances under which protection against an unfavorable contractinterpretationcanbepurchased,makinglegalriskverydifferentfrommarketorcreditrisk.However,thisisallthemorereasontoplaceaquantitativelimitonthetotalsizeofcontractssubject toallbeingvoidedbyasingle interpretation,wherethesizeofthecontractcanbequantifiedbythepotentiallossfrombeingvoided.Quantitative limits place a control on risk, can be sized based on thedegreeofeconomicbenefitrelativetotheperceiveddegreeoflegaluncertainty,andprovideaframeworkforensuringthatindividualdealapprovalislimitedtothosewiththegreatestpotentialbenefitrelativetopotentialloss.Oneparticularissueoflegalriskthatoftencausesconcernishowbankruptcy
courtswilltreatcontractualobligations.Whenacounterpartygoesintodefault,the counterparty's reputation and desire to deal fairly no longer serve as abulwarkagainstlitigationrisk.Inbankruptcy,allofthebankruptfirm'screditorsbecomecompetitorsinlegalactionstogainasmuchofashareoftheremainingassetsaspossible.Evenwhenlegaldocumentshavebeenwelldrawntoprovidespecificcollateralagainstanobligationorspecificnettingarrangementsbetweenderivativecontractsonwhichthebankruptfirmowesandisowedmoney,othercreditors may try to convince bankruptcy courts that it is only fair that theyreceive a share of the collateral or derivatives on which the bankrupt firm isowedmoney.Bankruptcycourtshavebeenknowntoissuesomeverysurprisingrulingsinthesecircumstances.Contractualintentioncanbevoidednotonlybycourts,butalsobyregulatory
authoritiesor legislatures,whichmay issue rules thatmakecertain contractualprovisions unenforceable. Financial institutions can and do mount lobbyingcampaignsagainstsuchchanges,butotherpartiesmaybeaseffectiveormoreeffective in lobbying on the other side. Financial firms often need to analyzewhat they believe is the prospect for future regulatory actions in order to

determinewhethercertaincurrentbusinesswillprovetobeworthwhile.Moredetailon legal riskandhowtocontrol itcanbefound inChapter7of
Malcolmetal.(1999).
3.2.2TheRiskofIllegalActionsThe possibility of a firm's employees engaging in actions found to be illegalbearsaverycloserelationshiptoreputationalrisk,whichisexaminedinthenextsection.Any legalproceedingsagainsta firmhave thepotential todamage thefirm'sreputationandthewillingnessofclientstoengageitsservices.Evenwhenlegalproceedingsdon'tresultinajudgmentagainstthefirm,thepublicityabouttheallegationsandembarrassingdisclosures in the legaldiscoveryprocesscanstillimpairreputation.Andactionsthatcangeneratenegativepress,evenifnotrisingtothelevelofillegality,canhaveasimilareffectonreputation.Oneofthemosteffective screens foracceptablebehavior remains theclassic“WouldyoubecomfortableseeingadescriptionofthispracticeonthefrontpageoftheWallStreetJournal?”The primary focus of legal and reputational risk has always been on the
fiduciary responsibilities owed by a firm to its clients, particularly its lesssophisticatedclients.Butrecentcaseshaveextendedconcerntodamagesthattheclientmayinflictonothersthatthefirmmaybeseenashavingabetted.Section4.3.2onthelossesinlawsuitsofJPMorganChaseandCitigroupforhavingbeenpartytotheEnrondeceptionofinvestorsisagoodcasestudyinthisrespect.
3.3REPUTATIONALRISKFirmsneedtobesurenotonlythatcontractprovisionsare legallyenforceable,but also that the process of enforcing their legal rights will not damage theirbusiness reputation. Even if a contract is strictly legal and enforceable, if itstermsseempalpablyunfairorcanbeportrayedastakingadvantageofaclient,theenforcementofthelegalclaimsmaybeasdamagingtothefirm(ormoreso)astheinabilitytoenforcetheclaimswouldhavebeen.Alltransactionsneedtobereviewedbybusinessmanagersfromtheviewpointofwhetherthetransactionisonethattheclientfullyunderstandsanditcanreasonablybeinterpretedasasensibleaction for theclient to take.Ever since theBankersTrust (BT) fiascowithProcter&Gamble(P&G)andGibsonGreetings,describedinSection4.3.1,allfirmshaveplacedincreasedemphasisonprocessestoensurethattransactions

areappropriateorsuitablefortheclient.Thefollowingprocessesareincluded:Conductacarefulreviewofallmarketingmaterialstomakesurethattransactionshavebeenfullyexplained,nomisleadingclaimshavebeenmade,andnoambiguityexistsastowhetherthefinancialfirmissimplyactingasdealstructurerorisalsoactingasanadvisertotheclientwithfiduciaryresponsibilityforthesoundnessofitsadvice.Afullexplanationoftransactionsmayneedtoincludesimulationsofpossibleoutcomes,includingstresssituations.Makecertainthatanyrequestfromaclientforamark-to-marketvaluationofanexistingtransactionissuppliedbysupportpersonnelusingobjectivestandardsandnotbymarketingpersonnelwhomayhavemotivationstomisleadtheclientastothetrueperformanceofthetransaction.Further,allvaluationssuppliedneedtobeclearlylabeledastowhethertheyareactualpricesatwhichthetradingfirmispreparedtodealorsimplyindicationsofthegeneralmarketlevel.Rankclientsbytheirdegreeoffinancialsophisticationandtransactionsbytheirdegreeofcomplexity,andensurethataproperfitexistsbetweenthetwo.Incaseswherecomplextransactionsarenegotiatedwithlesssophisticatedclients,extracareneedstobetakentoensurethatanyadvicegiventotheclientbymarketingpersonnelisconsistentwiththeirknowledgeoftheclient'sneeds.Verifythatclientsfullyunderstandthenatureofthetransactionstheyareundertaking,includingwrittenconfirmationofsuchassurancesfromseniormanagersinsomecases,basedonthesizeandcomplexityofdeals.Thesestepstoensureappropriatenessandsuitabilityareimportantnotonlytoguardatradingfirm'sreputation,but,inextremecases,toalsoserveasprotectionagainstlitigation.Notethattheneedtoensurethesuitabilityoftransactionstoclientsandtheneedtoprovideclientswithevaluationsthatthetradingfirmcancertifyasreliablelimitatradingfirm'sabilitytosimplyserveasacreditintermediarybetweentwocounterpartiesusingback-to-backderivatives.
3.4ACCOUNTINGRISKAccounting risk can be viewed as a form of reputational risk. When a firmmakes serious accounting errors, requiring the restatement of past earnings, itdoesnotleadtoanynetlossofcashtothefirm,asincasesoffraud,operations
errors,orincorrectlydrawncontracts.However,itcandamageinvestor,creditor,and regulator confidence in the accuracy of information that the firm suppliesabout its financial health. This loss of confidence can be so severe that itthreatens the firm's continued existence, as the Kidder Peabody financialdisaster,discussedinSection4.1.2,illustrates.Measures to control accounting risk are similar in nature to those needed to
control legalrisk. Insteadofneedingknowledgeof legal issuesandprecedentsand how courts tend to interpret the law, knowledge of generally acceptedaccounting principles (GAAP) and how accounting boards of standards andregulatoryauthorities tend to interpret theseprinciples isneeded.Theneedforspecialized knowledge by accounting jurisdiction is similar to the need forspecialized knowledge by legal jurisdiction. The need to obtain independentaccountingopinions and avoidopinion shoppingparallels those considerationsfor legal risk. The need for thorough documentation showing that accountingrules are being followed parallels the need for thorough documentation ofcontractual understandings. The need for limits on exposure to accountingpoliciesopentointerpretationparallelstheneedforlimitsonexposuretolegalinterpretation.
3.5FUNDINGLIQUIDITYRISKFundingliquidityriskshouldbeclearlydifferentiatedfromtheliquidityriskwediscussedaspartofmarketriskinSection1.2,whichissometimescalledassetliquidityrisk.Fundingliquidityriskhastwofundamentalcomponents:1.Theriskthatinvestors'perceptionofthefirm'screditqualitywillbecomeimpaired, thereby raising the firm's funding costs relative to the costs ofcompetitorsacrossallfundingsourcesutilized.2. The overly heavy use of a particular funding source in a given timeperiod,raisingthefirm'sfundingcostrelativetothatofcompetitorsforthatparticularfundingsourceonly.Controllingthecostofthefirm'sliabilitiesbymanaginginvestors'perceptions
ofthefirm'screditqualityistheflipsideofthecoinofcreditrisk'smanagementofthecreditqualityofthefirm'sassets.Crisesininvestorconfidenceareusuallytriggered by problemswith earnings or the inadequacy of capital.As a result,theyare functionsof theoverallmanagementof the firm'sbusiness.Thechief
financialofficerofthefirmhasparticularresponsibilityforcontrollingfundingliquidityriskbyexplainingtheearningssituationtofinancialanalystsandratingagenciesandensuringthatcapitallevelsaremaintainedtomeetbothregulatoryguidelines and the expectations of financial analysts and rating agencies.Specific funding liquidity responsibilities of the treasury function of the firminclude ensuring that any such crisis is not exacerbatedbyhaving to raise toomuchfundingfromthemarketatatimeofcrisis.Preferably,thefirmshouldbeabletoreducetoabareminimumitsfundingduringacrisisperiodtogaintimeforthefirmtoimproveitsfundamentalfinancialconditionandtellitssideofthestoryeffectivelytofinancialanalysts,ratingagencies,andindividualinvestors.Theabilitytoavoidtoomuchmarketfundinginthesecircumstancesrequires:Long-termplanstogetmorefundingfromstablesourceslesssensitivetoafirm'screditrating(suchasretaildepositsandtransactionbalances),tolengthenthematurityofmarketfunding,tocreatecushionsofmarketfundingtotapinemergenciesbyraisinglessthanthefullamountofpotentialfundsavailable,andtoarrangebackuplinesofcredit.Informationsystemstoprojectperiodsoflargefundingneedsinordertospreadouttheperiodoftimeoverwhichsuchfundingisraised.Ofparticularimportanceistheuseoffundingneedsprojectionstoavoidhavingfundingrequirementsoverashortperiodbeingsoheavythattheytriggeracrisisofinvestorconfidence.Well-developedcontingencyplansforhandlingafundingcrisis,whichcouldincludestepssuchassellingliquidassets,unwindingliquidderivativespositionsthattieupcollateral,andutilizinguntappedcushionsoffundingandbackuplinesofcredit.
The treasury function's management of particular funding sources to avoidoveruseisalsotiedtoinformationsystemsthatcanprojectfuturefundingneeds.It may be necessary to restrict particular types of investment or derivativetransactionsthatdependonaccesstoparticularfundingsourcestobeprofitable.For example, some transactions are profitable only if off-balance-sheetcommercialpaperfundingcanbeobtained,bypassingtheneedforcapitaltobeheldagainston-balance-sheetassets.However,thetreasuryfunctionmayneedtolimit the total amountof commercial paperbeing rolledover in anyparticularperiodtoreducetheriskofhavingtopayapremiumforsuchfunding.

3.6ENTERPRISERISKEnterpriseriskcanbetiedtothefixednatureofmanyofthecostsofengaginginaparticular lineofbusiness.Evenheavilypersonnel-intensivebusinesses,suchas trading, still have fixed cost components such as buildings, computer andcommunications equipment, and some base level of employee compensationbelow which a firm loses its ability to remain in the business line throughdownturnsinactivity.However,thesefixedcostsentailtheriskoflossestotheextent that the amount of business that can be attracted in a downturn cannotcoverthefixedcosts.By its nature, the management of enterprise risk belongs more naturally to
individualbusinessmanagersthantoacorporate-wideriskfunction.Usually,thecorporate-wide operational risk function will restrict itself to attempting toinclude some measurement of enterprise risk in the risk-adjusted return oncapital(RAROC)orshareholdervalueadded(SVA)measures.
3.7IDENTIFICATIONOFRISKSInDamonRunyon'sshortstoryonwhichthemusicalGuysandDollsisbased,agamblernamedSkyMastersonrelatesthefollowingadvicehereceivedfromhisfather:Son, nomatter how far you travel or how smart you get, always rememberthis:Someday,somewhere,aguyisgoingtocometoyouandshowyouanicebrand-newdeckof cardsonwhich the seal is neverbroken, and thisguy isgoingtooffertobetyouthatthejackofspadeswilljumpoutofthedeckandsquirtciderinyourear.But,son,donotbethim,forassureasyoudoyouaregoingtogetanearfullofcider.Theequivalentof thisstoryforariskmanager is the traderormarketerwho
informs you that “There is absolutely no risk of loss on this product.”Asmyexperiencewithmarketshasgrown,Ihavecometorecognizethisassertionasasureharbingerofpainfullossestocome,eithersoonerorlater.However,myfirstencounterwiththestatementcamewellbeforeIwasinvolvedwiththefinancialsideofbanking,whenIwasworkinginChaseManhattan'soperationsresearchdepartment on projects like the simulation of the truck routes that deliveredchecks from branches to the head office and the sorting machines that thenprocessedthechecks.

One day on the subway, I ran into someone I had worked with on thesesimulations, but hadnot seen in a fewyears.He toldme about thewonderfulnewjobhehadheadingupaunitofthebankthatmatchedfirmsthatwantedtoborrowsecuritieswiththosethatwantedtolendthem.Thebankreceivedanicefee for the service and hewas aggressively growing the business. The key toprofitabilitywasoperationalefficiency,atwhichhewasanexpert.He toldmethat since thebankwasnot a principal to anyof these transactions, therewasabsolutelynoriskoflossontheproduct.Thelossescameafewyearslater.WhenDrysdaleSecurities,alargeborrower
of government securities, could not repay its borrowings, it turned out thatconsiderable ambiguity existed about whether the lenders of the securitiesunderstood they were being borrowed by Chase or by Drysdale with Chasemerely arranging the borrowing. The legal contracts under which thetransactionshadbeenexecutedwereopen to the interpretation thatChasewastheprincipal.Chaselost$285millioninsettlingtheseclaims(seeSection4.1.1foramoredetaileddiscussion).Myacquaintance,needlesstosay,losthisjob.Before a risk can be controlled, it must first be recognized. Often, the
management teamthat is involvedwith the introductionofanewproductmaylack theexperience toperceiveapossibilityof riskandasa resultmay fail tocallintheexpertiseneededtocontroltherisk.Forexample,ifanewlegalriskisnotrecognized,thefirm'slegalexpertsmayneverthoroughlyreviewtheexistingcontracts.This iswhyithasbecometheacceptedbestpractice in thefinancialindustry toestablishanew-product reviewprocess inwhichmoreexperiencedbusiness managers and experts in risk disciplines (such as market risk, creditrisk, reputational risk, legal, finance, and audit) vet proposals for products tomakesurerisksareidentifiedandcontrolsareinstituted.
3.8OPERATIONALRISKCAPITALWe started this chapter by stating that operational risks do not fall under thescope of financial risk management, since they could not be managed usingliquidmarkets.Thisisnottosaythatquantitativemeasurescannotbedevelopedfor operational risk, just that the tools to do sowill come from the traditionalinsurance industry andwill be close to the tools used tomanage exposure tophysicaldisasters, suchashurricanesandnuclearplantbreakdowns.Therearecertaincommonitemsinthetoolkitoffinancialriskandinsurancerisk,giventhat theyareboth tryingtomeasureexposures in theextremetailofevents,as

discussed inSection1.3.Forexample,youwillseeuseofsimulation,extremevaluetheory,andstressscenariosinboth.Butthespecifictechniquesdiscussedin this book, very closely tied to relating loss estimation and control to liquidmarketpricemovements,cannotbeapplied.Theprimaryimpetusfordevelopingquantitativemeasuresofoperationalrisk
has been a desire to develop a methodology for operational risk capital tocomplementthemeasuresofcapitalallocatedformarketriskandcreditrisk.Inparticular, the push by the Basel Committee on Banking Supervision topromulgateinternationalstandardsrequiringallbankstoallocatecapitalagainstoperational risk has spurred much work on how to quantify this capitalrequirement.Operationalriskcapitalcanbeapproachedintwoways—fromthebottomup
and from the top down. The bottom-up approach emphasizes quantitativemeasuresoffactorsthatcontributetooperationalrisk.Somepossibilitiesare:
Auditscoresasameasureofoperationsrisk.Countsofunreconcileditemsorerrorratesasameasureofoperationsrisk.Measuresofdelayinobtainingsignedconfirmationsasameasureoflegalrisk.
Althoughthesemeasuresprovidegoodincentives,tyingreductionincapitaltodesirableimprovementsincontrols,itisverydifficulttoestablishlinksbetweenthese measures and the possible sizes of losses. Some firms are pursuingresearchonthis,butsupportingdataisscarce.The top-downapproachemphasizes thehistoricalvolatilityofearnings.This
measure provides a direct link to the size of losses and can include alloperational risks, even enterprise risk. But what incentive does this measureprovidetoreducingoperationalrisk?Nocreditisgiventoaprogramthatclearsupback-officeproblemsorplacesnewcontrolsonsuitability.Neither of these approaches bears much resemblance to the use of actual
market prices for reduction of risk, which we discussed in Chapter 1 as thehallmarkoffinancialriskmanagement.Totheextentmarketpricesareavailableforsomeoperationalrisks,itwouldcomefromtheinsurancemarket,sinceitispossible to purchase insurance against some types of risk of fraud, operationserrors,disasters,lossofpersonnel,legalliability,andaccountingerrors.An up-to-date and thorough introduction to methodological approaches to
quantifyingoperationalriskcapitalandtheregulatorybackgroundof theBaselCommittee initiativescanbefound in thecloselyrelatedbooksMoosa(2007),

particularlyChapters5,6,and7,andMoosa(2008),particularlyChapters4,5,and6.
CHAPTER4
FinancialDisastersOneofthefundamentalgoalsoffinancialriskmanagementistoavoidthetypesofdisastersthatcanthreatentheviabilityofafirm.Soweshouldexpectthatastudy of such events that have occurred in the past will prove instructive. Acomplete catalog of all such incidents is beyond the scope of this book, but Ihavetriedtoincludethemostenlighteningexamplesthatrelatetotheoperationoffinancialmarkets,asthisisthebook'sprimaryfocus.Abroadcategorizationoffinancialdisastersinvolvesathree-partdivision:1.Casesinwhichthefirmoritsinvestorsandlenderswereseriouslymisledaboutthesizeandnatureofthepositionsithad.2. Cases in which the firm and its investors and lenders had reasonableknowledgeofitspositions,buthadlossesresultingfromunexpectedlylargemarketmoves.3.Casesinwhichlossesdidnotresultfrompositionsheldbythefirm,butinsteadresultedfromfiduciaryorreputationalexposuretopositionsheldbythefirm'scustomers.
4.1DISASTERSDUETOMISLEADINGREPORTING
Astrikingfeatureofall thefinancialdisasterswewillstudyinvolvingcasesinwhich a firmor its investors and lenders havebeenmisled about the size andnatureofitspositionsisthattheyallinvolveasignificantdegreeofdeliberationonthepartofsomeindividualstocreateorexploitincorrectinformation.Thisisnot to say situations do not exist in which firms are misled without anydeliberation on the part of any individual. Everyone who has been in thefinancialindustryforsometimeknowsofmanyinstanceswheneveryoneatthefirmwasmisledaboutthenatureofpositionsbecauseaticketwasenteredintoasystem incorrectly.Most typically, this will represent a purchase entered as asale, or vice versa. However, although the size of such errors and the time ittakestodetectthemcansometimesleadtosubstantiallosses,Iamnotawareofanysuchincident thathasresultedin losses thatwerelargeenoughto threaten

theviabilityofafirm.An error in legal interpretation can also seriously mislead a firm about its
positions without any deliberate exploitation of the situation. However, suchcases, although they can result in large losses, tend to be spread acrossmanyfirmsratherthanconcentratedatasinglefirm,perhapsbecauselawyerstendtocheckpotentiallycontroversiallegalopinionswithoneanother.Thebest-knowncaseofthistypewaswhenderivativescontractedbyBritishmunicipalitieswerevoided.SeeSection3.2.Ifweacceptthatallcasesoffinancialdisasterduetofirmsbeingmisledabout
their positions involve some degree of complicity on the part of someindividuals,wecannot regard themcompletelyascasesof incorrectly reportedpositions.Someoftheindividualsinvolvedknowthecorrectpositions,at leastapproximately,whereasothersarethoroughlymisinformed.Understandingsuchcasesthereforerequiresexaminingtwodifferentquestions:
1.Whydoesthefirstgrouppersistintakinglargepositionstheyknowcanleadtolargelossesforthefirmdespitetheirknowledgeofthepositions?2.Howdotheysucceedinkeepingthisknowledgefromthesecondgroup,whowe canpresumewouldput a stop to theposition taking if theywerefullyinformed?Iwill suggest that theanswer to the firstquestion tends tobe fairlyuniform
acrossdisasters,whiletheanswertothesecondquestionvaries.Thewillingnesstotakelargeriskypositionsisdrivenbymoralhazard.Aswe
sawinourdiscussionofmoralhazardinSection2.1,itrepresentsanasymmetryinrewardstructureandanasymmetryininformation;inotherwords,thegroupwith the best information on the nature of the risk of a position has a greaterparticipation in potential upside than potential downside. This often leadsinsiders to desire large risky positions that offer them commensurately largepotentialgains.Theideaisthattradersownanoptionontheirprofits;therefore,they will gain from increasing volatility, as we discussed in Section 2.1. Thenormalcounterweightsagainstthisaretheattemptsbyrepresentativesofseniormanagement,stockholders,creditors,andgovernmentregulators,whoallownalargershareof thepotentialdownsidethanthetraders, toplacecontrolsontheamount of risk taken. However, when those who could exercise this controlsubstantiallylackknowledgeofthepositions,thetemptationexistsfortraderstoexploitthecontrolweaknesstoruninflatedpositions.Thisactionoftenleadstoanothermotivationspurringthegrowthofriskypositions—thePonzischeme,as
discussedinSection2.2.Sometraderswhotakeriskypositionsthatareunauthorizedbutdisguisedbya
controlweaknesswillmakeprofitsonthesepositions.Thesepositionsarethenpossibly closed down without anyone being the wiser. However, someunauthorizedpositionswillleadtolosses,andtraderswillbestronglytemptedtotake on even larger, riskier positions in an attempt to cover up unauthorizedlosses.ThisiswherethePonzischemecomesin.Ithinkithelpstoexplainhowlosses from unauthorized positions can grow to be so overwhelmingly large.Stigum (1989) quotes an “astute trader” with regard to the losses in theChase/Drysdalefinancialdisaster:“IfinditpuzzlingthatDrysdalecouldlosesomuchsofast.Ifyouchargedmetoloseone-fourthofabillion,Ithinkitwouldbehardtodo;IwouldprobablyendupmakingmoneysomeofthetimebecauseIwouldbuysomethinggoingdownand itwouldgoup.Theymusthavebeenextraordinarily good at losingmoney.” Iwould suggest that the reason traderswhose positions are unauthorized can be so “extraordinarily good at losingmoney”isthatnormalconstraintsthatforcethemtojustifypositionstooutsidersarelackingandsmallunauthorizedlossesalreadyputthematriskoftheirjobsand reputations.With no significant downside left, truly reckless positions areundertaken in anattempt tomakeenoughmoney to cover theprevious losses.This is closely related to double-or-nothing betting strategies, which can startwithverysmallstakesandquicklymushroomtoextraordinarylevelsinanefforttogetbacktoeven.This snowballing pattern can be seen in many financial disasters. Nick
Leeson'slossesonbehalfofBaringswerejust$21millionin1993,$185millionin 1994, and $619million in just the first twomonths of 1995 (Chew 1996,Table 10.2). John Rusnak's unauthorized trading at Allied Irish Bank (AIB)accumulated losses of $90 million in its first five years through 1999, $210million in 2000, and $374million in 2001 (Ludwig 2002, SectionH). JosephJett'sphantomtradesatKidderPeabodystartedoffsmallandendedwithbookedtradesinexcessofthequantityofallbondstheU.S.Treasuryhadissued.Thekeytopreventingfinancialdisastersbasedonmisrepresentedpositionsis
therefore the ability to spot unauthorized position taking in a timely enoughfashion to prevent this explosive growth in position size. The lessonswe canlearnfromthesecasesprimarilycenteronwhyittooksolongforknowledgeofthe misreported positions to spread from an insider group to the firm'smanagement.Wewillexamineeachcasebyprovidingabriefsummaryofhowtheunauthorizedpositionarose,howitfailedtocometomanagement'sattention,

andwhatlessonscanbelearned.Ineachinstance,Iprovidereferencesforthoseseekingmoredetailedknowledgeofthecase.GeneralconclusionsbasedonthecasesinthissectioncanbefoundinSection3.1.1.
4.1.1ChaseManhattanBank/DrysdaleSecurities
4.1.1.1IncidentIn three months of 1976, Drysdale Government Securities, a newly foundedsubsidiaryof anestablished firm, succeeded inobtainingunsecuredborrowingofabout$300millionbyexploitingaflawinthemarketpracticesforcomputingthe value of U.S. government bond collateral. This unsecured borrowingexceeded any amountDrysdalewould have been approved for, given that thefirmhadonly$20millionincapital.Drysdaleusedtheborrowedmoneytotakeoutrightpositionsinbondmarkets.Whenthetraderslostmoneyonthepositionstheyputon,theylackedcashwithwhichtopaybacktheirborrowings.Drysdalewentbankrupt,losingvirtuallyallofthe$300millioninunsecuredborrowings.ChaseManhattan absorbed almost all of these losses because it had brokeredmost ofDrysdale's securities borrowings.AlthoughChase employees believedtheywereonlyactingas agentson these transactionsandwerenot takinganydirect risk on behalf of Chase, the legal documentation of the securitiesborrowingsdidnotsupporttheirclaim.
4.1.1.2ResultChase'sfinancialviabilitywasnotthreatenedbylossesofthissize,butthelosseswere large enough to severely damage its reputation and stock valuation forseveralyears.
4.1.1.3HowtheUnauthorizedPositionsAroseMisrepresentationinobtainingloansisunfortunatelynotthatuncommoninbanklending.AclassicexamplewouldbeAnthonyDeAngelis,the“SaladOilKing,”who,in1963,obtained$175millioninloanssupposedlysecuredbylargesaladoilholdings,whichturnedouttobevastdrumsfilledwithwaterwithathinlayerof salad oil floating on top. Lending officers who came to check on theircollateralwerebamboozledintoonlylookingatasamplefromthetopofeachtank.

ThefollowingaresomereasonsforfeaturingtheDrysdaleshenanigansinthissectionratherthandiscussinganynumberofothercasesofmisrepresentation:
Drysdaleutilizedaweaknessintradingmarketstoobtainitsfunds.Drysdalelosttheborrowedmoneyinthefinancialmarkets.Itishighlyunusualforasinglefirmtobearthislargeaproportionofthislargeaborrowingsting.
There is not much question as to how Drysdale managed to obtain theunsecured funds. The firm took systematic advantage of a computationalshortcutindeterminingthevalueofborrowedsecurities.Tosavetimeandeffort,borrowed securitieswere routinely valued as collateralwithout accounting foraccruedcouponinterest.Byseekingtoborrowlargeamountsofsecuritieswithhigh coupons and a short time left until the next coupondate,Drysdale couldtakemaximumadvantageofthedifferenceintheamountofcashtheborrowedsecuritycouldbesoldfor (which includedaccrued interest)and theamountofcashcollateralthatneededtobepostedagainsttheborrowedsecurity(whichdidnotincludeaccruedinterest).
4.1.1.4HowtheUnauthorizedPositionsFailedtoBeDetectedChaseManhattanallowedsuchasizablepositiontobebuiltuplargelybecauseitbelieved that the firm's capital was not at risk. The relatively inexperiencedmanagers running the securities borrowing and lending operation wereconvinced they were simply acting as intermediaries between Drysdale and alarge group of bond lenders. Through their inexperience, they failed both torealizethatthewordingintheborrowingagreementswouldmostlikelybefoundbyacourttoindicatethatChasewastakingfullresponsibilityforpaymentsdueagainst the securities borrowings and to realize the need for experienced legalcounseltoreviewthecontracts.
4.1.1.5HowtheUnauthorizedPositionsWereEventuallyDetectedTherewassomelimittothesizeofbondpositionsDrysdalecouldborrow,evengiven the assumption that the borrowings were fully collateralized. At somepoint, the size of the losses exceeded the amount of unauthorized borrowingsDrysdalecouldraiseandthefirmhadtodeclarebankruptcy.

4.1.1.6LessonsLearnedThesecuritiesindustryasawholelearnedthatitneededtomakeitsmethodsforcomputingcollateralvalueonbondborrowingsmoreprecise.Chase,andotherfirms that may have had similar control deficiencies, learned the need for aprocess that forced areas contemplatingnewproduct offerings to receivepriorapproval fromrepresentativesof theprincipal riskcontrol functionswithin thefirm(seeSection3.7).
4.1.1.7FurtherReadingChapter14ofStigum(1989)givesadetaileddescriptionoftheChase/Drysdaleincident,somepriormisadventuresinbondborrowingcollateralization,andthesubsequentmarketreforms.
4.1.2KidderPeabody
4.1.2.1IncidentBetween1992and1994,JosephJett,headofthegovernmentbondtradingdeskatKidderPeabody,enteredintoaseriesoftradesthatwereincorrectlyreportedinthefirm'saccountingsystem,artificiallyinflatingreportedprofits.Whenthiswas ultimately corrected in April 1994, $350 million in previously reportedgainshadtobereversed.
4.1.2.2ResultAlthoughJett'stradeshadnotresultedinanyactuallossofcashforKidder,theannouncementofsuchamassivemisreportingofearningstriggeredasubstantiallossofconfidenceinthecompetenceofthefirm'smanagementbycustomersandGeneralElectric,whichownedKidder. InOctober1994,GeneralElectric soldKiddertoPaineWebber,whichdismantledthefirm.
4.1.2.3HowtheUnauthorizedPositionsAroseA flaw in accounting for forward transactions in the computer system forgovernmentbond trading failed to take intoaccount thepresentvaluingof theforward. This enabled a trader purchasing a cash bond and delivering it at aforward price to book an instant profit.Over the period between booking and

delivery, the profit would inevitably dissipate, since the cash position had afinancing cost that was unmatched by any financing gain on the forwardposition.Hadthecomputersystembeenusedasitwasoriginallyintended(forahandful
of forward tradeswith only a few days to forward delivery), the size of errorwould have been small. However, the system permitted entry not only ofcontractedforwardtrades,butalsoofintendedforwarddeliveryofbondstotheU.S.Treasury,whichdidnot actuallyneed tobeactedon,but couldbe rolledforward into further intentions to deliver in the future. Both the size of theforwardpositionsandthelengthoftheforwarddeliveryperiodwereconstantlyincreasedtomagnifytheaccountingerror.ThispermittedaclassicPonzischemeofever-mountinghypotheticalprofitscoveringthefactthatpreviouslypromisedprofitsnevermaterialized.Although ithasneverbeencompletelyclearhow thoroughlyJettunderstood
thefullmechanicsoftheillusion,hehadcertainlyworkedoutthelinkbetweenhisentryofforwardtradesandtherecordingofprofit,andincreasinglyexploitedtheopportunity.
4.1.2.4HowtheUnauthorizedPositionsFailedtoBeDetectedSuspicionsregardingthesourceofJett'sextraordinaryprofitperformancewerewidespread throughout the episode. Itwas broadly perceived that no plausibleaccountwasbeingofferedofasuccessfultradingstrategythatwouldexplainthesize of reported earnings. On several occasions, accusations were made thatspelledoutexactlythemechanismbehindtheinflatedreporting.Jettseemedtohavehadatalentfordevelopingexplanationsthatsucceededintotallyconfusingeveryone (including, perhaps, himself) as towhatwas going on.However, hewasclearlyaidedandabettedbyamanagementsatisfiedenoughnottotaketooclosealookatwhatseemedlikeamagicalsourceofprofits.
4.1.2.5HowtheUnauthorizedPositionsWereEventuallyDetectedLarge increases in the size of his reported positions and earnings eventuallytriggeredamorethoroughinvestigationofJett'soperation.

4.1.2.6LessonstoBeLearnedTwo lessons can be drawn from this: Always investigate a stream of largeunexpected profits thoroughly and make sure you completely understand thesource.Periodicallyreviewmodelsandsystemstoseeifchangesinthewaytheyarebeingusedrequirechangesinsimplifyingassumptions(seeSection8.2.8).
4.1.2.7FurtherReadingJetthaswrittenadetailedaccountofthewholeaffair(seeJett1999).However,histalentforobscurityremainsanditisnotpossibletotellfromhisaccountjustwhathebelievesgeneratedeitherhislargeprofitsorthesubsequentlosses.Foranaccountofthemechanicsofthedeception,onemustrelyontheinvestigationconductedbyGaryLynchonbehalfofKidder.SummariesofthisinvestigationcanbefoundinHansell(1997),Mayer(1995),andWeiss(1994).
4.1.3BARINGSBANK
4.1.3.1IncidentTheincidentinvolvedthelossofroughly$1.25billionduetotheunauthorizedtradingactivitiesduring1993to1995ofasingle,relativelyjuniortradernamedNickLeeson.
4.1.3.2ResultThe size of the losses relative to Barings Bank's capital along with potentialadditional losses on outstanding trades forced Barings into bankruptcy inFebruary1995.
4.1.3.3HowtheUnauthorizedPositionsAroseLeeson, who was supposed to be running a low-risk, limited return arbitragebusiness for Barings in Singapore, was actually taking increasingly largespeculativepositionsinJapanesestocksandinterestratefuturesandoptions.Hedisguised his speculative position taking by reporting that he was taking thepositions on behalf of fictitious customers. By booking the losses to thesenonexistent customer accounts, he was able to manufacture fairly substantialreportedprofitsforhisownaccounts,enablinghimtoearna$720,000bonusin

1994.
4.1.3.4HowtheUnauthorizedPositionsFailedtoBeDetectedA certain amount of credit must be given to Leeson's industriousness inperpetrating a deliberate fraud.Heworked hard at creating false accounts andwasabletoexploithisknowledgeofweaknessesinthefirm'scontrols.However,anyonereadinganaccountoftheincidentwillhavetogiveprimarycredittothestupendous incompetence on the part of Barings'management, which ignoredevery known control rule and failed to act on myriad obvious indications ofsomething being wrong.What is particularly amazing is that all those tradeswere carried out in exchange-traded markets that require immediate cashsettlementofallpositions,therebyseverelylimitingtheabilitytohidepositions(althoughLeesondidevenmanage togetsomefalse reportingpast thefuturesexchangetoreducetheamountofcashrequired).Themost blatant ofmanagement failureswas an attempt to savemoney by
allowingLeesontofunctionasheadoftradingandthebackofficeatanisolatedbranch.Evenwhenauditors'reportswarnedaboutthedangerofallowingLeesontosettlehisowntrades,therebydeprivingthefirmofanindependentcheckonhisactivities,Barings'managementpersistedintheirfolly.Equallydamningwasmanagement'sfailuretoinquirehowalow-risktradingstrategywassupposedlygenerating such a large profit. Even when covering these supposed customerlossesontheexchangesrequiredBaringstosendmassiveamountsofcashtotheSingaporebranch,noinquireswerelaunchedastothecause.Alargepartofthisfailurecanbeattributedtotheverypoorstructuringofmanagementinformationso that different risk control areas could be looking at reports that did not tietogether.Thefundingareawouldseeareportindicatingthatcashwasrequiredtocover lossesofacustomer,not the firm, therebyavoidingalarmbellsaboutthe trading losses.A logical consequence is that credit exposure to customersmustbelargesincethesupposedcoveringofcustomerlosseswouldentailaloanfromBaringstothecustomer.However,informationprovidedtothecreditriskarea was not integrated with information provided to funding and showed nosuchcreditextension.
4.1.3.5HowtheUnauthorizedPositionsWereEventuallyDetected

The size of losses Leeson was trying to cover up eventually got toooverwhelmingandhetookflight,leavingbehindanadmissionofirregularities.
4.1.3.6LessonstoBeLearnedOnemightbe tempted to say that theprimary lesson is that thereare limits tohow incompetent you can be and still hope tomanage amajor financial firm.However,totrytotakeawaysomethingpositive,themajorlessonswouldbetheabsolute necessity of an independent trading back office, the need to makethoroughinquiriesaboutunexpectedsourcesofprofit(orloss),andtheneedtomakethoroughinquiriesaboutanylargeunanticipatedmovementofcash.
4.1.3.7FurtherReadingAconciseandexcellentsummaryoftheBaringscaseconstitutesChapter10ofChew(1996).Chapter11ofMayer (1997)contains less insighton thecauses,but isstrongonthefinancialandpoliticalmaneuversrequiredtoavoidseriousdamage to the financial system from theBarings failure.Leesonhaswritten afull-length book that appears to be reasonably honest as to how he evadeddetection (Leeson1996).Fay (1996) andRawnsley (1995) are also full-lengthaccounts.
4.1.4AlliedIrishBank(AIB)
4.1.4.1IncidentJohnRusnak,acurrencyoptiontraderinchargeofaverysmalltradingbookinAIB's Allfirst First Maryland Bancorp subsidiary, entered into massiveunauthorizedtradesduringtheperiod1997through2002,ultimatelyresultingin$691millioninlosses.
4.1.4.2ResultThisresultedinamajorblowtoAIB'sreputationandstockprice.
4.1.4.3HowtheUnauthorizedPositionsAroseRusnakwassupposedtoberunningasmallarbitragebetweenforeignexchange(FX)optionsandFXspotandforwardmarkets.Hewasactually running largeoutrightpositionsanddisguisingthemfrommanagement.
4.1.4.4HowtheUnauthorizedPositionsFailedtoBeDetectedTo quote the investigating report, “Mr. Rusnak was unusually clever anddevious.”He invented imaginary trades that offset his real trades,making histradingpositionsappearsmall.Hepersuadedback-officepersonnelnottocheckthesebogustrades.Heobtainedcashtocoverhislossesbysellingdeep-in-the-moneyoptions,whichprovidedcashupfrontinexchangeforahighprobabilityofneedingtopayoutevenmorecashatalaterdate,andcovereduphispositionby offsetting these real trades with further imaginary trades. He entered falsepositions into the firm's system for calculating value at risk (VaR) tomisleadmanagersaboutthesizeofhispositions.Inmanyways,Rusnak'spatternofbehaviorwasaclosecopyofNickLeeson's
atBarings,using similar imaginary transactions to coverup realones.RusnakoperatedwithoutLeeson'sadvantageofrunninghisownbackoffice,buthadtheoffsetting advantage that he was operating in an over-the-counter market inwhich therewasnot an immediateneed toputupcashagainst losses.Healsowasextremelymodestintheamountoffalseprofitheclaimedsohedidnotsetoff the warning flags of large unexplained profits from small operations thatLeesonandJettatKidderPeabodyhadtriggeredintheirdesiretocollectlargebonuses.LikeBarings,AIB'smanagementandriskcontrolunitsdemonstratedafairly
startlinglevelofincompetenceinfailingtofigureoutthatsomethingwasamiss.AIBatleasthastheexcusethatRusnak'sbusinesscontinuedtolooksmallandinsignificant,soitneverdrewmuchmanagementattention.However,thescopeand length of time over which Rusnak's deception continued provided ampleopportunityforeventhemostminimallevelofcontrolstocatchupwithhim.Themostegregiouswasthebackoffice'sfailuretoconfirmalltrades.Rusnak
succeededinconvincingback-officepersonnelthatnotallofthesetradesneededto be confirmed. He relied partly on an argument that trades whose initialpaymentsoffsetoneanotherdidn'treallyneedtobecheckedsincetheydidnotgiverisetonetimmediatecashflow,ignoringthefactthatthepurportedtradeshaddifferenttermsandhencesignificantimpactonfuturecashflows.Hereliedpartlyonbookingimaginarytradeswithcounterparties in theAsiantimezone,making confirmation for U.S.-based back-office staff a potentially unpleasanttask involving middle-of-the-night phone calls, perhaps making it easier to

persuade them that this work was not really necessary. He also relied onargumentsthatcostsshouldbecutbyweakeningoreliminatingkeycontrols.Once this outside controlwasmissing, thewaywasopened for theongoing
manipulation of trading records.Auditors could have caught this, but the spotaudits performed used far too small a sample. Suspiciousmovements in cashbalances,dailytradingprofitandloss(P&L),sizesofgrosspositions,andlevelsofdailyturnoverwereallignoredbyRusnak'smanagersthroughacombinationofinexperienceinFXoptionsandoverrelianceontrustinRusnak'ssupposedlyexcellentcharacterasasubstituteforvigilantsupervision.Hismanagementwastoowilling to withhold information from control functions and too compliantwithRusnak's bullying of operations personnel as part of a general culture ofhostility towardcontrol staff.This isprecisely the sortof front-officepressurethatreducessupportstaffindependence,whichwasreferredtoinSection3.1.1.
4.1.4.5HowtheUnauthorizedPositionsWereEventuallyDetectedIn December 2001, a back-office supervisor noticed trade tickets that did nothaveconfirmationsattached.Wheninformedthattheback-officepersonneldidnot believe all trades required confirmations, he insisted that confirmation besought for existing unconfirmed trades. Although it took some time for theinstructions to be carried out, when they finally were carried out in earlyFebruary 2002, despite some efforts byRusnak to forgewritten confirmationsandbully the backoffice into not seeking verbal confirmations, his fraudwasbroughttolightwithinafewdays.
4.1.4.6LessonstoBeLearnedThisincidentdoesnotprovidemanynewlessonsbeyondthelessonsthatshouldalreadyhavebeenlearnedfromBarings.Thiscasedoesemphasizetheneedtoavoidengaginginsmallventuresinwhichthefirmlacksanydepthofexpertise—there is simply toomuch relianceon theknowledge andprobityof a singleindividual.On the positive side, the investigative report on this fraudhas provided risk
controlunitsthroughoutthefinancialindustrywithasetofdeliciousquotesthataresuretobetrottedoutanytimetheyfeelthreatenedbycost-cuttingmeasuresorfront-officebullyingandlackofcooperation.ThefollowingareafewchoicesamplesfromLudwig(2002):
Whenoneriskcontrolanalystquestionedwhyariskmeasurementsystemwastakingmarketinputsfromafront-office-controlledsystemratherthanfromanindependentsource,shewastoldthatAIB“wouldnotpayfora$10,000datafeedfromReuterstothebackoffice.”Whenquestionedaboutconfirmations,“Mr.Rusnakbecameangry.Hesaidhewasmakingmoneyforthebank,andthatifthebackofficecontinuedtoquestioneverythinghedid,theywoulddrivehimtoquit....Mr.Rusnak'ssupervisorwarnedthatifMr.Rusnakleftthebank,thelossofhisprofitabletradingwouldforcejobcutsinthebackoffice.”“Whenrequired,Mr.Rusnakwasabletouseastrongpersonalitytobullythosewhoquestionedhim,particularlyinOperations.”Hissupervisors“toleratednumerousinstancesofseverefrictionbetweenMr.Rusnakandtheback-officestaff.”Rusnak'ssupervisor“discouragedoutsidecontrolgroupsfromgainingaccesstoinformationinhisareaandreflexivelysupportedMr.Rusnakwheneverquestionsabouthistradingarose.”“[I]nresponsetogeneraleffortstoreduceexpenseandincreaserevenues,theAllfirsttreasurerpermittedtheweakeningoreliminationofkeycontrolsforwhichhewasresponsible....Mr.Rusnakwasabletomanipulatethisconcernforadditionalcostcuttingintohisfraud.”
4.1.4.7FurtherReadingIhavereliedheavilyontheverythoroughreportissuedbyLudwig(2002).
4.1.5UnionBankofSwitzerland(UBS)
4.1.5.1IncidentThisincidentinvolveslossesofbetween$400millionand$700millioninequityderivatives during 1997, which appear to have been exacerbated by lack ofinternalcontrols.Alossof$700millionduring1998wasduetoalargepositioninLong-TermCapitalManagement(LTCM).
4.1.5.2ResultThe 1997 losses forced UBS into a merger on unfavorable terms with SwissBankCorporation (SBC) at the end of 1997. The 1998 losses came after that
merger.
4.1.5.3WerethePositionsUnauthorized?LessisknownabouttheUBSdisasterthantheotherincidentsdiscussedinthischapter.Eventhesizeofthelosseshasneverbeenfullydisclosed.Considerablecontroversy exists about whether the 1997 losses just reflected poor decisionmaking or unlucky outcomes or whether an improper control structure led topositionsthatmanagementwouldnothaveauthorized.The1998lossesweretheresultofaposition thatcertainlyhadbeenapprovedby theUBSmanagement,butevidencesuggeststhat itfailedtoreceiveadequatescrutinyfromthefirm'sriskcontrollersandthatitwasnotadequatelydisclosedtotheSBCmanagementthattookoverthefirm.Whatseemsuncontroversial is that theequityderivativesbusinesswasbeing
run without the degree of management oversight that would be normallyexpected in a firm of the size and sophistication of UBS, but there isdisagreementabouthowmuchthissituationcontributedtothelosses.Theequityderivativesdepartmentwasgivenanunusualdegreeofindependencewithinthefirmwith littleoversightby,or sharingof informationwith, thecorporate riskmanagers.Thepersonwithseniorriskmanagementauthorityforthedepartmentdoubled as headof quantitative analytics.Asheadof analytics, hewasboth acontributor to thebusinessdecisionshewasresponsible for reviewingandhadhis compensation tied to trading results, which are both violations of thefundamentalprinciplesofindependentoversight.Theequityderivativelossesappeartohavebeenprimarilyduetofourfactors:1. A change in British tax laws,which impacted the value of some long-datedstockoptions.2. A large position in Japanese bank warrants, which was inadequatelyhedged against a significant drop in the underlying stocks (see the fullerdescriptioninSection11.4).3.Anoverlyaggressivevaluationof long-datedoptionsonequitybaskets,utilizing correlation assumptions thatwere out of linewith those used bycompetitors.4.Lossesonotherlong-datedbasketoptions,whichmayhavebeenduetomodelingdeficiencies.ThefirsttwotransactionswereoneswhereUBShadsimilarpositionstomany
of its competitors so itwould be difficult to accuse the firmof excessive risk
taking,althoughitsJapanesewarrantpositionsappeartohavebeenunreasonablylarge relative tocompetitors.The last twoproblemsappear tohavebeenmoreunique to UBS.Many competitors made accusations that its prices for tradeswereoffthemarket.The losses related to LTCM came as the result of a position personally
approved by Mathis Cabiallavetta, the UBS CEO, so they were certainlyauthorized inone sense.However, accusationshavebeenmade that the tradeswere approvedwithout adequate review by risk control areas andwere neverproperlyrepresentedinthefirm'sriskmanagementsystems.Althoughabout40percentoftheexposurerepresentedadirectinvestmentinLTCMthathadlargepotentialprofitstoweighagainsttherisk,about60percentoftheexposurewasanoptionwrittenonthevalueofLTCMshares.However,therewasnoeffectiveway in which such an option could be risk managed given the illiquidity ofLTCM shares and restrictions that LTCM placed on UBS delta hedging theposition(seethenext-to-lastparagraphinSection11.1).Theimbalanceinrisk/rewardtrade-offforanoptionthatwasthatdifficultto
risk manage had caused other investment banks to reject the proposed trade.UBS appears to have entered into the option because of its desire for a directinvestmentinLTCM,whichLTCMtiedtoagreementtotheoption.Agreeingtothistypeofbundledtransactioncancertainlybealegitimatebusinessdecision,butitisunclearwhetherthefullriskoftheoptionhadbeenanalyzedbyUBSorwhetherstresstestsofthetwopositionstakentogetherhadbeenperformed.
4.1.5.4LessonsLearnedThisincidentemphasizestheneedforindependentriskoversight.
4.1.5.5FurtherReadingThe fullest account of the equity derivative losses is contained in a book bySchutz (2000),whichcontainsmany luridaccusationsabout improperdealingsbetween theequityderivativesdepartmentandseniormanagementof the firm.Schutzhasbeenaccusedofinaccuracyinsomeofthesecharges—seeDerivativeStrategies (1998) fordetails.There is alsoagoodsummary in the January31,1998,issueoftheEconomist.A good account of the LTCM transaction is Shirreff (1998). Lowenstein
(2000), an account of theLTCMcollapse, also covers theUBS story in somedetail.
4.1.6SociétéGénérale
4.1.6.1IncidentInJanuary2008,SociétéGénéralereportedtradinglossesof$7.1billionthatthefirmattributedtounauthorizedactivitybyajuniortrader,JérômeKerviel.
4.1.6.2ResultThelargelossseverelydamagedSociétéGénérale'sreputationandrequiredittoraisealargeamountofnewcapital.
4.1.6.3HowtheUnauthorizedPositionsAroseIn this section and the next, I am drawing primarily on the Société GénéraleSpecialCommitteeoftheBoardofDirectorsReporttoShareholdersofMay22,2008 (I'll abbreviate references to it as SpecComm) and its accompanyingMissionGreenReport of theSociétéGénéraleGeneral InspectionDepartment(I'llabbreviateitasMG).Kervieltookverylargeunauthorizedpositionsinequitiesandexchange-traded
futures,beginning in July2005andendingwhenhis concealmentofpositionswas uncovered in January 2008. His primary method for concealing theseunauthorizedpositionswastoenterfictitioustransactionsthatoffsettheriskandP&L of his true trades. The fictitious nature of these transactionswas hiddenmostlybycreatingtransactionswithforwardstartdatesandthen,relyingonhisknowledge of when control personnel would seek confirmation of a forward-dated trade, canceling the trade prior to the date that confirmation would besought (Kervielhadpreviouslyworked in themiddleofficeof the firm,whichmay have provided him with particular insight into the actions of controlpersonnel). Not surprisingly, given his need to constantly replace canceledfictitioustransactionswithnewones,therewerealargenumberofthesetrades,947transactionsaccordingtoMGFocus4.HowwasKervielabletoenterthismanyfictitioustradesbeforediscoveryofhisfraud?
4.1.6.4HowtheUnauthorizedPositionsFailedtoBeDetected

TradeCancellationThere was no procedure in place that required control functions to confirminformationenteredforatradethatwasthencanceledandKervielknewthis,norwas there a system in place for red-flagging an unusual level of tradecancellations.SpecComm,point10,notesthatthebackandmiddleofficegave“priority to the correct execution of trades” and showed “an absence of anadequatedegreeofsensitivitytofraudrisks.”TheheadofequityderivativesataEuropeanbankisquotedassaying,“Ifhewasabletocancelatradeandbookanewonebeforetheconfirmwassentout,theclock[forobtainingconfirmation]would start again. But at our bank, we actively monitor cancel-and-correctactivityforeachtrader,whichisstandardpracticeatmostinstitutions.Itwouldstickoutlikeasorethumbifyouhadonetraderwhowasperpetuallycancellingand correcting trades” (Davies 2008). Hugo Banziger, chief risk officer ofDeutscheBank, isquotedassaying,“Routine ITcontrolscanmonitorunusualtradesputonandcancelled—thisisaparticularlyeffectivecontrolmechanism”(Davies 2008). It certainly appears from the account in MG that no suchprocedureswere inplaceatSociétéGénérale, andeven the inquiry toconfirmthecounterpartyonacanceledtradethateventuallyledtoKerviel'sdownfallinJanuary2008appearstohavebeenamatterofchance(MGFocus6).

SupervisionKerviel's immediate manager resigned in January 2007. For two and a halfmonths, until themanagerwas replaced,Kerviel's positionswere validated byhisdesk'sseniortrader.Day-to-daysupervisionofKervielbythenewmanager,whostartedinApril2007,wasweak(SpecComm,point9;MG,page6).WhileKervielhadbegunhisfraudulentactivitiespriortoJanuary2007,thesizeofhisunauthorizedpositionsincreasedexplosivelyatthistime(MGFocus10).

TradingAssistantThe trading assistantwhoworkedwithKerviel in entering trades,whowouldhavethemostimmediatepotentialaccesstoseeinghowhewasmanipulatingthetradingsystem,mayhavebeenoperatingincollusionwithKerviel.Thishasnotbeenconfirmed(MG,page3,notesthatthisisanallegationunderinvestigationby the courts), but, in any case, the trading assistant appears tohave acceptedKerviel's directions without questioning. This would have helped Kerviel'scredibilitywithcontrolfunctions,sincethetradingassistantreportedtoacontrolfunction and was the primary point of contact of other control functionsregardingKerviel'spositions(MG,page4).

VacationPolicyThe normal precaution of forcing a trader to take two consecutive weeks ofvacationinayear,duringwhichtimehispositionswouldbemanagedbyanothertrader,wasnotfollowed(MG,page7).Thiscontrolcouldeasilyhavecausedthecollapse of a scheme based on constant rolling forward of fraudulent tradingentries.

GrossPositionsTherewereno limitsorothermonitoringofKerviel'sgrosspositions,onlyhisnetpositions(SpecComm,point10,notesthe“lackofcertaincontrolsliabletoidentifythefraudulentmechanisms,suchasthecontrolofthepositions'nominalvalue”). Had gross positions been monitored, this would have revealed theabnormally large size of his activities andmight have raised suspicions as towhatthepurposewasofsuchlargepositions.HenningGiescke,chiefriskofficeroftheUniCreditGroup,isquotedassaying,“Inhigh-volumebusinesses,bankshavetolookatgrossaswellasnetposition.Thisallowsaninstitutiontolookateach trader's book to seewhether they are taking toomuch risk, regardless ofwhetherthenetpositionisneutral”(Davies2008).ThechiefriskofficerofaUKbankisquotedassaying,“Toeffectivelymanagebasisrisk,youhavetobeabletoseehowtheoutrightposition—thenotional—performsagainstthehedge.Itisinconceivable such a sophisticated institution could havemissed this.Modernsystemsareable to stress-testpositions, and todo thisyouautomaticallyneedthe notional amount” (Davies 2008). Kerviel's unusually high amount ofbrokerage commissions (MG, page 6), related to his high level of grosspositions,couldalsohaveprovidedawarningsign.
CashandCollateralTheuseoffictitioustransactionstoconcealpositionswilloftencreatepositionsofunusualsizeincashandrequiredcollateral—sincethefictitioustradesdonotgenerate anycashor collateralmovements, there isnothing tobalanceout thecashandcollateralneedsoftherealtrades.Thisprovidesgoodopportunitiesforfraud detection. The reason that Société Générale's control functions did notrespondtothesecluesisthatcashandcollateralreportsandinquiryprocedureslackedsufficientgranularitytodetectunusualmovementsatthelevelofasingletrader(MGFocus13).
P&LConcealment of trading positions will not always lead to unusual earningspatterns. A trader who is trying to conceal losses may be satisfied simply toshow a small positive P&L. But some fraudulent traders will show unusualprofits, eitherbecause theirunauthorizedpositionshave resulted in largegainsforwhichtheywanttobecompensatedorbecausetheirsuccessinhidinglosingpositionsencourages them toalsoclaimsomephantomgains to fundbonuses.Kervielwas reporting tradinggains in excess of levels his authorizedpositiontakingcouldhaveaccountedfor,andthisshouldhavegivenhismanagementandthe control functions a warning sign to investigate closely the source of hisearnings(MGFocus12).Thesewarningsignswereapparentlynotpursued.
4.1.6.5HowtheUnauthorizedPositionsWereEventuallyDetectedOne of Kerviel's fictitious trades was identified as fabricated by controlpersonnel as part of routine monitoring of positions, leading to a thoroughinvestigation.Kerviel'sattemptstodeflect theinquirybyforgingconfirmationsprovedfruitless.Itappearsthatitwasjustamatterofchancethatthisparticularinquiryledtoidentificationofthefraud.
4.1.6.6LessonstoBeLearnedWhat new lessons can we draw from this control failure? From one point ofview, the answer is not much—Kerviel's methods for eluding scrutiny of hispositionswere very close to those used in previous incidents such as those of

KidderPeabody,Barings, andAllied IrishBank.But, fromanotherviewpoint,wecanlearnquiteabit,sinceclearpatternsareemergingwhenwelookacrossepisodes.Theobvious lessonsforcontrolpersonnelare to tightenprocedures thatmay
leadtodetectionoffictitioustradeentries.CorrespondingtothepointsraisedinSection4.1.6.4,thespecificlessonsfollow.

TradeCancellationInstitute systems formonitoring patterns of trade cancellation. Flag any traderwhoappears tobeusinganunusuallyhighnumberof suchcancellations.Anytrader flagged should have a reasonably large sample of the cancellationschecked tomakesure that theyrepresent real tradesbycheckingdetailsof thetransactionwiththecounterparty.

SupervisionControl personnel should be aware of situations in which traders are beingsupervisedbytemporaryornewmanagers.Tightenedcontrolproceduresshouldbeemployed.

TradingAssistantControl personnel must remember that even in situations where there is nosuspicionofdishonesty,tradingassistantsareoftenunderintensepressurefromthe traders with whom they work closely. Their job performance ratings andfuture career paths often depend on the trader, regardless of official reportinglines.Thegreaterprestige,experience,andpossiblebullying tacticsofa tradercanoftenconvinceatradingassistanttoseethingsfromthetrader'sviewpoint.Other control personnelmust be cognizant of these realities andnot place toomuchrelianceonthepresumedindependenceofthetradingassistant.

VacationPolicyRulesformandatorytimeawayfromworkshouldbeenforced.
GrossPositionsGross positionsmust bemonitored and highlighted in control reports. This isparticularlyimportantsinceunusuallyhighratiosofgrosstonetpositionsareawarning sign of potentially inadequately measured basis risk as well as apossible flag for unauthorized activities. TheKidder Peabody andAllied IrishBank frauds could also have been uncovered by investigating unusually highratiosofgrosstonettrading.

CashandCollateralCash and collateral requirements should bemonitored down to the individualtrader level.Bettermonitoring of cash and credit flowswould have also beeninstrumentalinuncoveringtheBaringsandAlliedIrishBankfrauds.
P&LAny patterns of P&L that are unusual relative to expectations need to beidentified and investigated by both management and the control functions.Identificationofunusualpatternscanbecomparisonstohistoricalexperience,tobudgeted targets, and to the performance of traders with similar levels ofauthority. Investigation of suspicious earnings patterns could also have led toearlierdiscoveryoftheKidderPeabodyandBaringsfrauds.
4.1.6.7FurtherReadingIhavereliedprimarilyontheSociétéGénéraleSpecialCommitteeoftheBoardof Directors Report to Shareholders (2008) and its accompanying SociétéGénéraleMissionGreenReport(2008).
4.1.7OtherCasesOther disasters involving unauthorized positions are covered more briefly,becausetheyhadlessofanimpactonthefirminvolved,becauseitishardertouncover details onwhat occurred, or because they do not have any lessons toteachbeyondthoseofthecasesalreadydiscussed:
ToshihidaIguchiofDaiwaBank'sNewYorkofficelost$1.1billiontradingTreasurybondsbetween1984and1995.Hehidhislossesandmadehisoperationappeartobequiteprofitablebyforgingtradingslips,whichenabledhimtosellwithoutauthorizationbondsheldincustomeraccountstoproducefundshecouldclaimwerepartofhistradingprofit.HisfraudwasaidedbyasituationsimilartoNickLeeson'satBarings—Iguchiwasheadofbothtradingandtheback-officesupportfunction.Inadditiontothelosses,DaiwalostitslicensetotradeintheUnitedStates,butthiswasprimarilyduetoitsfailuretopromptlydisclosethefraudonceseniorexecutivesofthefirmlearnedofit.AmoredetailedaccountofthisbyRobJamesonofERiskcanbefoundontheirwebsite,www.erisk.com.

TheSumitomoCorporationofJapanlost$2.6billioninafailedattemptbyYasuoHamanaka,aseniortrader,tocornertheworld'scoppermarket—thatis,todriveuppricesbycontrollingalargeportionoftheavailablesupply.SumitomomanagementclaimedthatHamanakahademployedfraudulentmeansinhidingthesizeofhispositionsfromthem.Hamanakaclaimedthathehaddisclosedthepositionstoseniormanagement.Hamanakawassenttojailforhisactions.Theavailabledetailsaresketchy,butsomecanbefoundinDwyer(1996),Asiaweek(1996),Kooi(1996),andMcKay(1999).AskinCapitalManagementandGraniteCapital,hedgefundsthatinvestedinmortgagesecurities,wentbankruptin1994withlossesof$600million.ItwasrevealedthatDavidAskin,themanagerofthefunds,wasvaluingpositionswithhisownmarkssubstitutedfordealerquotesandusingthesepositionvaluesinreportstoinvestorsinthefundsandinmarketingmaterialstoattractnewclients.Forabriefdiscussion,seeMayer(1997).MerrillLynchreportedlylost$350millionintradingmortgagesecuritiesin1987,duetoriskreportingthatuseda13-yeardurationforallsecuritiescreatedfromapoolof30-yearmortgages.Althoughthisdurationisroughlycorrectforanundividedpoolof30-yearmortgages,thecorrectdurationis30yearswhentheinterest-only(IO)partissoldandtheprincipal-only(PO)partiskept,asMerrillwasdoing.SeeCrouhy,Galai,andMark(2001).NationalWestminsterBankin1997reportedalossoninterestratecapsandswaptionsofabout$140million.Thelosseswereattributedtotradesdatingbackto1994andhadbeenmaskedbydeliberateusebytradersofincorrectvolatilityinputsforlessliquidmaturities.ThelossofconfidenceinmanagementcausedbythisincidentmayhavecontributedtoNatWest'ssaletotheRoyalBankofScotland.Ihaveheardfrommarketsourcesthatthetradersweretakingadvantageofthemiddle-officesavingcostsbycheckingonlyasampleofvolatilitymarksagainstmarketsources,althoughitisunclearhowthetraderswereabletodetermineinadvancewhichquoteswouldbechecked.AmoredetailedaccountisWolfe(2001).ThelargeSwissbankUBSin2011reportedalossof$2.3billionduetounauthorizedtradingbyKwekuAdoboli,arelativelyjuniorequitytrader.ThisincidentcosttheCEOofUBShisjob.Adoboli'sabilitytoenterintounauthorizedtradesappearstohavebeenengineeredbymeansverysimilartothoseofKervielintheSociétéGénéraleincidentdiscussedinSection4.1.6.Hetookadvantageofintimateknowledgeofback-officecontrolprocedurestoidentifyaloophole.Tradeswithforwardsettlementgreater

than15dayswerenotbeingimmediatelyconfirmedwithcounterparties;confirmationwasdelayeduntilclosertothesettlementdate.Ifthetradewascanceledpriortothedateonwhichtheconfirmationwouldhavebeenconfirmed,noconfirmationevertookplace.Adoboliappearstohavebeenabletoutilizethisloopholetodisguisehisrealpositionsbyenteringbogusoffsettingforwardpositionsandthencancelingthefictitiouspositionspriortothedatetheywouldhavebeenconfirmed,replacingthemwithnewfictitiousforwards.Forthistohavegoneonforanyperiodoftime,theremusthavealsobeenflawsinUBS'smonitoringofexcessivecancellations.DuetoanongoingcriminalprosecutionagainstAdoboliatthetimeofmywriting,notmanypublicdetailsareavailable.Wilson(2011)isagoodsummaryofwhatisknownaboutthemechanicsoftheunauthorizedtrades,andBroom(2011)summarizesthedevastatingimpacttherevelationofthisfaultycontrolenvironmenthadonUBS.
4.2DISASTERSDUETOLARGEMARKETMOVES
Wewillnowlookatfinancialdisastersthatwerenotcausedbyincorrectpositioninformation,butwerecausedbyunanticipatedmarketmoves.Thefirstquestionthatshouldbeasked is:Howisadisasterpossible ifpositionsareknown?Nomatter what strategy is chosen, as losses start to mount beyond acceptablebounds,whyaren'tthepositionsclosedout?Theanswerislackofliquidity.Wewillfocusonthisaspectofthesedisasters.
4.2.1Long-TermCapitalManagement(LTCM)The case we will consider at greatest length is that of the large hedge fundmanaged by Long-Term Capital Management (LTCM), which came close tobankruptcyin1998.Inmanyways,itrepresentsanidealexampleforthistypeofcase sinceallof itspositionsweremarked toamarketvaluedaily, themarketvalues were supplied by the dealers on the other end of each trade, noaccusations have been made of anyone at LTCM providing misleadinginformationaboutpositionstaken,andthenearfailurecameinthemidstofsomeofthelargestmarketmovesinrecentmemory.To review the facts, LTCM had been formed in 1994 by about a dozen

partners. Many of these partners had previously worked together at SalomonBrothersinahighlysuccessfulproprietarytradinggroup.Overtheperiodfrom1994untilearly1998,theLTCMfundproducedquitespectacularreturnsforitsinvestors.Fromthebeginning,thepartnersmadeclearthattheywouldbehighlysecretiveabouttheparticularsoftheirinvestmentportfolio,evenbythestandardofotherhedgefunds.(Sincehedgefundsareopenonlytowealthyinvestorsandcannotbepubliclyofferedthewaymutualfundsare,theyarenotsubjecttolegalrequirementstodisclosetheirholdings.)Within thefirm,however, themanagementstyle favoredsharing information
openly,andessentiallyevery investmentdecisionwasmadebyall thepartnersacting together, anapproach thatvirtuallyeliminates thepossibilityof a roguetradermakingdecisionsbasedoninformationconcealedfromothermembersofthefirm.Althoughitistruethatoutsideinvestorsinthefunddidnothaveaccesstomuchinformationbeyondthemonth-endvaluationofitsassetsandthetrackrecordof itsperformance, it isequally true that the investorsknew these rulespriortotheirdecisiontoinvest.Sincethepartnerswhomanagedthefundweresuchstrongbelieversinthefundthattheyhadinvestedmostoftheirnetworthinit (severalevenborrowed to investmore than theirnetworth), their incentiveswere closely alignedwith investors (in otherwords, therewas little room formoralhazard).Ifanything,theconcentrationofpartnerassetsinthefundshouldhaveledtomorerisk-aversedecisionmakingthanmighthavebeenoptimalforoutsideinvestors,whoinvestedonlyasmallportionoftheirwealthinthefund,withtheexceptionofUBS,discussedinSection4.1.5.Infact,evenif investorshadbeengivenaccesstomoreinformation, thereis
littletheycouldhavedonewithit,sincetheywerelockedintotheirinvestmentsfor extended time periods (generally, three years). This reflected the basicinvestmentphilosophyofLTCM,whichwastolocatetradingopportunitiesthatrepresented what the partners believed were temporary disruptions in pricerelationshipsduetoshort-termmarketpressures,whichwerealmostcertaintobereversedoverlongertimeperiods.Totakeadvantageofsuchopportunities,theyneededtoknowtheyhadaccesstopatientcapitalthatwouldnotbewithdrawnifmarkets seemed to be temporarily going against them. This also helped toexplainwhyLTCMwassosecretiveaboutitsholdings.Thesewerenotquickin-and-out trades,but long-termholdings,and theyneeded topreventother firmsfromlearningthepositionsandtradingagainstthem.ThefollowingaretwoexamplesofthetypesofpositionstheLTCMfundwas
taking:
1. LTCM was long U.S. interest rate swaps and short U.S. governmentbondsatatimewhenthesespreadswereathistoricallyhighlevels.Overthelifeofthetrade,thispositionwillmakemoneyaslongastheaveragespreadbetween theLondon InterbankOfferedRate (LIBOR) atwhich swaps arereset(seeSection10.1.6)andtherepurchaseagreement(RP)ratesatwhichgovernment bonds are funded (see Section 10.1.2) is not higher than thespread atwhich the tradewas entered into.Over longer time periods, therangefortheaverageofLIBOR-RPspreadsisnotthatwide,butintheshortrun,swapspreadscanshowlargeswingsbasedonrelativeinvestordemandfor the safety of governments versus the higher yield of corporate bonds(withcorporatebondissuersthendemandinginterestrateswapstoconvertfixeddebttofloatingdebt).2.LTCMsold equityoptions at historicallyhigh impliedvolatilities.Overthelifeofthetrade,thispositionwillmakemoneyiftheactualvolatilityislower than the impliedvolatility,but in theshort run, investordemand forprotectionagainststockmarketcrashescanraiseimpliedvolatilitiestoveryhighlevels.Perold(1999a)presentsfurtheranalysisofwhyLTCMviewedthese trades as excellent long-term investments and presents several otherexamplesofpositionsitenteredinto.OneadditionalelementwasneededtoobtainthepotentialreturnsLTCMwas
looking for. LTCMneeded to be able to finance positions for longer terms inordertobeabletoensuretherewasnopressureonthemtosellpositionsbeforetheyreachedthepricerelationshipsLTCMwaswaitingfor.However,thebanksand investment banks who financed hedge fund positions were the verycompetitors that they leastwanted toshare informationonholdingswith.Howweretheytopersuadefirmstotakecreditriskwithoutknowingmuchaboutthetradingpositionsofthehedgefund?To understand why the lenders were comfortable in doing this, we need to
digress a moment into how credit works in a futures exchange. A futuresexchange (see Section 14.2) represents the extreme of being willing to lendwithout knowledge of the borrower. Someone who purchases, for example, abondforfuturedeliveryneedstodepositonlyasmallpercentageoftheagreedpurchase price as margin and does not need to disclose anything about one'sfinancial condition. The futures exchange is counting on the nature of thetransaction itself to provide confidence that money will not be lost in thetransaction.Thisisbecauseanytimethevalueofthebondfalls,thepurchaserisrequired to immediately provide added margin to fully cover the decline in
value.If thepurchaserdoesnotdoso,thepositionisclosedoutwithoutdelay.Loss is possibleonly if thepricehasdeclined somuch since the last time theprice fell and margin was added that the incremental price drop exceeds theamountofinitialmarginorifclosingouttheoptionresultsinalargepricemove.The probability of this occurring is kept low by setting initial margins highenough,restrictingthesizeofpositionthatcanbetakenbyanyoneinvestor,anddesigningfuturescontractstocoversufficientlystandardizedproductstoensureenoughliquiditythattheclosingoutofatradewillnotcauseabigpricejump.LTCM wanted to deal in over-the-counter markets as well as on futures
exchangespartlybecauseitwantedtodealinsomecontractsmoreindividuallytailored than those available on futures exchanges and partly because of thepositionsizerestrictionsofexchanges.However,themechanismusedtoassurelenders inover-the-countermarkets is similar—there is a requirement tocoverdeclinesinmarketvaluebyimmediatelyputtingupcash.Ifafirmfailstoputupthe cash, thenpositions are closedout.LTCMalmost alwaysnegotiated termsthatavoidedposting the initialmargin.Lendersweresatisfiedwith the lackofinitialmarginbasedonthesizeoftheLTCMfund'sequity,thetrackrecordofitsexcellent returns, and the firm's recognized investment management skills.Lenders retained theoptionofdemanding initialmargin if fundequity fell toomuch.This dependence on short-term swings in valuation represented a potential
Achilles' heel for LTCM's long-term focused investment strategy.Because thefirmwasseekingopportunitieswheremarketpressureswerecausingdeviationfromlong-runrelationships,astrongpossibilityalwaysexistedthat thesesamemarket pressures would push the deviation even further. LTCM would thenimmediatelyneedtocomeupwithcashtofundthechangeinmarketvaluation.Thiswouldnotbeaproblemifsomeofthetradesweremovinginitsfavoratthesametimeasothersweremovingagainstit,sinceLTCMwouldreceivecashonupswingsinvaluetobalancehavingtoputupcashondownswings(again, thesamestructureasexchange-tradedfutures).However,ifmanyofitstradesweretomove against it in tandem, LTCMwould need to raise cash quickly, eitherfrominvestorsorbycuttingpositions.IntheactualeventsofAugustandSeptember1998,thisisexactlywhatledto
LTCM's rapid downfall. The initial trigger was a combination of the RussiandebtdefaultofAugust,whichunsettledthemarkets,andtheJune1998decisionby Salomon Brothers to liquidate proprietary positions it was holding, whichweresimilartomanyofthoseheldbyLTCM.TheLTCMfund'sequitybeganto
decline precipitously from $4.1 billion as of the end of July 1998, and itwasveryreluctanttocutpositionsinaturbulentmarketinwhichanylargepositionsalecouldeasilymovethevaluationsevenfurtheragainstit.Thislefttheoptionofseekingnewequity frominvestors.LTCMpursued thispathvigorously,buttheveryactofdoingsocreated twoperverseeffects.First, rumorsofLTCM'spredicamentcausedcompetitorstodrivemarketpricesevenfurtheragainstwhattheyguessedwereLTCM'spositions, inanticipationofLTCMbeing forced tounloadthepositionsatdistressedprices.Second,topersuadepotentialinvestorsto provide newmoney in themidst of volatilemarkets, LTCMwas forced todisclose information about the actual positions it held.As competitors learnedmoreabouttheactualpositions,theirpressureonmarketpricesinthedirectionunfavorabletoLTCMintensified.As market valuations continued to move against LTCM and the lack of
liquiditymade itevenmoreunlikely that reducingpositionswouldbeaviableplan,itbecameincreasinglyprobablethatintheabsenceofatrulylargeinfusionofnewequity,theLTCMfundwouldbebankrupt.ItscreditorsstartedtopreparetocloseoutLTCM'spositions,butquicklycametofearthattheyweresolargeandthemarketsweresoilliquidthatthecreditorswouldsufferseriouslossesinthe course of doing so. The lenders were also concerned that the impact ofclosingout thesepositionswoulddepressvalues in thealready fragilemarketsandtherebycauseconsiderabledamagetootherpositionsheldbythecreditorsandotherinvestmentfirmstheywerefinancing.Ultimately, 14 of the largest creditors, all major investment banks or
commercialbankswithlargeinvestmentbankingoperations,contributedafresh$3.65billioninequityinvestmentintotheLTCMfundtopermitthefirmtokeepoperatingandallowforasubstantialtimeperiodinwhichtocloseoutpositions.Inreturn,thecreditorsreceivedsubstantialcontroloverfundmanagement.Theexistinginvestorshadtheirinvestmentsvaluedatthethencurrentmarketvalueof$400million,sotheyhadonlya10percentshareinthepositionsofthefund.Although some of the partners remained employed to help wind downinvestments, itwas the consortiumof 14 creditorswho now exercised controlandinsistedonwindingdownallpositions.As a result, themarkets calmed down. By 2000, the fund had been wound
downwiththe14creditorshavingrecoveredalloftheequitytheyhadinvestedandhavingavoidedanylossesontheLTCMpositionstheyhadheldatthetimeof the bailout. This outcome lends support to two propositions: LTCM waslargely right about the long-term values underlying its positions, and the

creditors were right to see the primary problem as one of liquidity, whichrequiredpatiencetorideout.PleasenotethatthebailoutwasnotprimarilyarescueofLTCM'sinvestorsor
management, but a rescue ofLTCM's creditors by a concerted action of thesecreditors. Even recently, I continue to encounter the view that the bailoutinvolved the use of U.S. government funds, helped the LTCM investors andmanagementavoidtheconsequencesoftheirmistakes,andthereforecontributedtoanattitudethatsomefirmsare“toobigtofail”andsocanaffordtotakeextrarisksbecausetheycancountonthegovernmentabsorbingsomeoftheirlosses.Idonotthinkevidenceisavailabletosupportanyoftheseclaims.Interested
readerscanformtheirownconclusionsbylookingatthedetailedaccountofthenegotiations on the rescue package in Lowenstein (2000). An opposingviewpoint can be found in Shirreff (2000). The only government involvementwassomecoordinationbytheFederalReserve,actingoutoflegitimateconcernforthepotentialimpactonthefinancialmarkets.TheLTCMcreditorstookariskby investingmoney in thefund,butdidso in theirownself-interest,believing(correctly,asitturnsout)thattheyweretherebyloweringtheirtotalriskofloss.LTCM'sinvestorsandmanagershadlittlelefttoloseatthepointofthebailoutsince they could not lose more than their initial investment. It is true that,withoutarescue,thefundwouldhavebeenliquidated,whichwouldhavealmostcertainlywiped out the remaining $400millionmarket value of the investors.However,inexchangeforthisrescue,theywereabletoretainonlya10percentinterest in the fund's positions, since the $3.65 billion in new investmentwasexplicitly not being used to enable new trades, but only to wind down theexistingpositions.LTCMmanagementwascertainlyawareofthepotentialforshort-termmarket
movements to disrupt the fund's fundamental trading strategy of focusing onlonger-term relationships. The firm tried to limit this risk by insisting that itspositionspassvalue at risk (VaR) testsbasedonwhetherpotential lossesoveronemonthdue to adversemarketmoveswould reduce equity to unacceptablelevels.WhereLTCMseemstohavefallenshortofbestpracticeswasafailuretosupplement VaRmeasures with a full set of stress test scenarios (see Section11.2).ItdidrunstressversionsofVaRbasedonahigherthanhistoricallevelofcorrelations,butitisdoubtfulthatthisoffersthesamedegreeofconservatismasasetoffullyworked-throughscenarios.AlessonthatallmarketparticipantshavelearnedfromtheLTCMincidentis
that a stress scenario is needed to look at the impact of a competitor holding

similar positions exiting themarket, aswhenSalomondecided to cut backonproprietarytrading.However,evenbybestpracticestandardsofthetime,LTCMshould have constructed a stress test based on common economic factors thatcouldcauseimpactsacrossitspositions,suchasaflighttoqualitybyinvestors,which would widen all credit spreads, including swap spreads, and increasepremiumsonbuyingprotectionagainst stockmarket crashes,hence increasingoptionvolatility.Another point on which LTCM's risk management could be criticized is a
failure toaccount for the illiquidityof its largestpositions in itsVaRor stressruns.LTCMknewthatthepositionvaluationsitwasreceivingfromdealersdidnotreflecttheconcentrationofsomeofLTCM'spositions,eitherbecausedealerswere not taking liquidity into account in their marks or because each dealerknewonlyasmallpartofLTCM'stotalsizeinitslargestpositions.Two other criticisms have been made of LTCM's management of risk with
which I disagree. One is that a simple computation of leverage would haveshownthatLTCM'spositionsweretoorisky.However,aswillbeseeninSection13.2.4,leveragebyitselfisnotanadequatemeasureofriskofdefault.Itmustbemultipliedbyvolatilityofthefirm'sassets.Butthisjustgetsusbacktotestingthrough VaR or stress scenarios. The second criticism is that LTCM showedunreasonable faith in theoutcomeofmodels. I seenoevidence tosupport thisclaim.MajorpositionsLTCMenteredinto—U.S.swapspreadstonarrow,equityvolatilities to decline—were ones that many proprietary position takers hadenteredinto.Forexample,thebiasinequityimpliedvolatilitiesduetodemandfordownsideprotectionbyshareholdershad longbeenwidely recognizedasafairly certain profit opportunity for investorswith long-enough time horizons.That some firmsmademore use ofmodels to inform their trading judgmentswhileothersreliedmoreontraderexperiencetellsmenothingabouttherelativequalityoftheirdecisionmaking.MostofthefocusofLTCMstudieshasbeenonthedecisionmakingofLTCM
managementandthelossesoftheinvestors.Ibelievethisemphasisismisplaced.Itisafairlycommonoccurrence,andtobeexpected,thatinvestmentfundswillhaveseveredropsinvaluation.Thebankruptcyofaninvestmentfunddoesnotordinarilythreatenthestabilityofthefinancialsystemthewaythebankruptcyofafirmthatmakesmarketsorisacriticalpartofthepaymentssystemwould.Itjust represents the lossesof a small numberof investors.Nor is there amajordifference in consequences between bankruptcy and a large loss short ofbankruptcy for an investment fund. It shouldn't matter to investors whether a
fundinwhichtheyhaveinvested$10milliongoesbankruptorafundinwhichtheyhaveinvested$30millionlosesathirdofitsvalue.Bycontrast,lossesshortof bankruptcy hurt only the stockholders of a bank, whereas bankruptcy of abankcouldhurtdepositorsandleadtolossofconfidenceinthebankingsystem.The reason that an LTCM failure came close to disrupting the financial
markets and required amajor rescueoperationwas its potential impact on thecreditorstoLTCM,soweneedtotakeacloserlookattheirroleinthestory.Inretrospect,thecreditorstoLTCMbelievedtheyhadbeentoolaxintheircreditstandards, and the incident triggered amajor industry studyof credit practicesrelatingtotradingcounterparties(CounterpartyRiskManagementPolicyGroup1999).Some suggestions for improved practices, many of which are extensively
addressedinthisstudy,havebeen:Agreaterreluctancetoallowtradingwithoutinitialmarginforcounterpartieswhoseprincipalbusinessisinvestingandtrading.Acounterpartythathasothersubstantialbusinesslines—forexample,automanufacturingorretailbanking—isunlikelytohaveallofitseconomicresourcesthreatenedbyalargemoveinfinancialmarkets.However,afirmthatisprimarilyengagedinthesemarketsisvulnerabletoilliquidityspreadingfromonemarkettoanotherasfirmscloseoutpositionsinonemarkettomeetmargincallsinanothermarket.Forsuchfirms,initialmarginisneededasacushionagainstmarketvolatility.Factoringthepotentialcostsofliquidatingpositionsinanadversemarketenvironmentintoestimatesofthepriceatwhichtradescanbeunwound.Theseestimatesshouldbebasedonthesizeofpositionsaswellasthegeneralliquidityofthemarket(seeSection6.1.2).Thesepotentialliquidationcostsshouldimpactestimatesoftheamountofcreditbeingextendedandrequirementsforinitialmargin.Apushforgreaterdisclosurebycounterpartiesoftheirtradingstrategiesandpositions.Relianceonhistoricalrecordsofreturnasanindicatorofthevolatilityofaportfoliocanbeverymisleadingbecauseitcannotcapturetheimpactofchangesintradingstyle(seeSection7.1).Increasedallowanceforliquidationcostsofpositionswillbeveryinexactifthecreditoronlyknowsthepositionsthatacounterpartyholdswiththecreditorwithoutknowingtheimpactofotherpositionsheld.Totrytodealwithcounterparties'legitimatefearsthatdisclosureoftheirpositionswillleadtotakingadvantageofthisknowledge,creditorsareimplementing

morestringentinternalpoliciesagainstthesharingofinformationbetweenthefirm'screditofficersandthefirm'straders.Betteruseofstresstestsinassessingcreditrisk.Tosomeextent,thisinvolvesusingmoreextremestressesthanwerepreviouslyusedinmeasuringrisktoreflecttheincreasedmarketvolatilitythathasbeenexperiencedinrecentyears.However,amajoremphasisisalsoonmoreintegrationofmarketriskandcreditriskstresstestingtotakeintoaccountoverlapinrisks.IntheLTCMcase,thiswouldhaverequiredrecognitionbyacreditortoLTCMthatmanyofthelargestpositionsbeingheldbyLTCMwerealsobeingheldbyotherinvestmentfundstowhichthefirmhadcounterpartycreditexposure,aswellasbythefirm'sownproprietarytraders.Afullstresstestwouldthenlookatthelossesthatwouldbeincurredbyalargemarketmoveandsubsequentdecreaseinliquidityacrossallofthesesimilarpositions.
AcompleteaccountoftheLTCMcasecoveringallaspectsofthehistoryofthefundanditsmanagers,theinvolvementofcreditors,andthenegotiationsoveritsrescuecanbe found inLowenstein (2000).TheHarvardBusinessSchoolcasestudiesofPerold(1999a,1999b)provideadetailedbutconciseanalysisof thefund'sinvestmentstrategyandthedilemmathatitfacedinAugust1998.
4.2.2Metallgesellschaft(MG)The disaster at Metallgesellschaft (MG) reveals another aspect of liquiditymanagement. In 1992, an American subsidiary of MG, MetallgesellschaftRefiningandMarketing(MGRM),beganaprogramofentering into long-termcontracts to supply customers with gas and oil products at fixed costs and tohedge these contracts with short-term gas and oil futures. Although somecontroversy exists about how effective this hedging strategywas from a P&Lstandpoint, aswe'll discuss in just amoment, the fundamental consequenceofthisstrategyforliquiditymanagementiscertain.Thefuturesbeingusedtohedgewereexchange-tradedinstrumentsrequiringdailycashsettlement,asexplainedinSection10.1.4.Thelong-termcontractswithcustomersinvolvednosuchcashsettlement. So no matter how effective the hedging strategy was, theconsequenceofalargedownwardmoveingasandoilpriceswouldbetorequireMGRMtopaycashagainstitsfuturespositionsthatwouldbeoffsetbymoneyowedtoMGRMbycustomerswhowouldbepaidinthefuture.A properly designed hedgewill reflect both the cash paid and the financing

costofthatcashduringtheperioduntilthecustomerpaymentisdueandhencewill be effective from a P&L standpoint. However, the funding must still beobtained,whichcanleadtofundingliquidityrisk(seeSection3.5).Aswewilldiscuss in Section 6.1.6, such cash needsmust be planned in advance. Limitsneed to be set on positions based on the amount of cash shortfall that can befunded.ItappearsthatMGRMdidnotcommunicatetoitsparentcompanythepossible
needforsuchfunding.In1993,whenalargedecreaseingasandoilpriceshadresultedinfundingneedsofaround$900million,theMGparentrespondedbyclosing down the futures positions, leaving unhedged exposure to gas and oilprice increases through thecustomercontracts.Facedwith thisopenexposure,MGnegotiatedunwindsof thesecontractsatunfavorable terms.ItmaybethatMG,with lackofadvancewarningas topossiblecashneeds, respondedto thedemand for cashas a sign that the trading strategywasdeeply flawed; ifonlyBarings'managementhadreactedsimilarly.As mentioned earlier, the MG incident spurred considerable debate as to
whether MGRM's trading strategy was reasonable or fundamentally flawed.Most notably, Culp and Miller (1995a) wrote an article defending thereasonableness of the strategy, andMello and Parsons (1995)wrote an articleattacking theCulpandMiller conclusions,whichwere thendefendedbyCulpandMiller(1995b).Althoughitisdifficulttosettlethefactualargumentsaboutthe particular events in the MG case, I believe the following lessons can bedrawn:
Itisoftenakeycomponentofamarketmaker'sbusinessstrategytoextendavailableliquidityinamarket(seeSection10.2.2).Thisrequirestheuseofshorter-termhedgesagainstlonger-termcontracts.Experienceshowsthatthiscanbesuccessfullycarriedoutwhenproperriskcontrolsareapplied.Theuncertaintyofrollcostisakeyriskforstrategiesinvolvingshorter-termhedgesagainstlonger-termrisk.AsexplainedinSection10.2.2,thisrequirestheuseofvaluationreservesbasedonconservativeassumptionsoffuturerollcost.MGRMdoesnotappeartohaveutilizedvaluationreserves;itjustbaseditsvaluationonthehistoricalaveragesofrollcosts.Afirmrunningshort-termhedgesagainstlonger-termriskrequirestheflexibilitytochoosetheshorter-termhedgethatoffersthebesttrade-offbetweenriskandreward.Itmaylegitimatelychoosetofollowahedgingstrategyotherthanatheoreticalminimumvariancehedge,orchoosenottohedgewiththelongestfutureavailable,basedonliquidityconsiderations,or
takeintoaccounttheexpectationofpositiverollcostaspartofpotentialreturn.Itisnotreasonabletoconclude,asMelloandParsons(1995)do,thatthesechoicesindicatethatthefirmisengagedinpurespeculationratherthanhedging.Atthesametime,regardlessofafirm'sconclusionsaboutprobablereturn,itsassessmentofriskshouldincludevaluationreserves,asinthepreviouspoint,andvolumelimitsbasedonreasonablestresstestingofassumptions.
4.3DISASTERSDUETOTHECONDUCTOFCUSTOMERBUSINESS
Inthissection,wefocusondisastersthatdidnotinvolveanydirectfinanciallosstothefirm,butwerecompletelyamatterofreputationalriskduetotheconductofcustomerbusiness.
4.3.1BankersTrust(BT)Theclassiccaseof this type is theBankersTrust (BT) incidentof1994,whenBTwassuedbyProcter&Gamble(P&G)andGibsonGreetings.BothP&GandGibsonclaimedthattheyhadsufferedlargelossesinderivativestradestheyhadenteredintowithBTduetobeingmisledbyBTastothenatureofthepositions.These were trades on which BT had little market or credit risk, since it hadhedged themarket riskon themwithotherderivativesand therewasnocreditissueofP&GorGibsonbeingunable topay theamount theyowed.However,theevidenceuncovered in thecourseof legaldiscoveryfor these lawsuitswasseverely damaging to BT's reputation for fair business dealing, led to theresignation of the firm'sCEO, and ultimately had such negative consequencesfor the bank's ability to do business that it was forced into an acquisition byDeutscheBank,whichessentiallyamountedtoadismembermentofthefirm.The exact terms of these derivative trades were quite complex and are not
essential tounderstanding the incident. Interested readersare referred toChew(1996,Chapter2)fordetails.Thekeypointis thatthetradesofferedP&GandGibson a reasonably probable but small reduction in funding expenses inexchange for a potentially large loss under some less probable circumstances.P&GandGibsonhadbeen entering into such trades for several years prior to1994withgoodresults.Thederivativeswerenottailoredtoanyparticularneeds

of P&G or Gibson in the sense that the circumstances under which thederivativeswouldlosethemmoneywerenotdesignedtocoincidewithcasesinwhichotherP&GorGibsonpositionswouldbemakingmoney.Theirobjectivewasjusttoreduceexpectedfundingcosts.Sincetheonlywaytoreducecostsinsomecasesistoraisetheminothers,P&GandGibsoncanbepresumedtohaveunderstoodthattheycouldlosemoneyundersomeeconomiccircumstances.OnwhatbasiscouldtheyclaimthatBThadmisledthem?OneelementthatestablishedsomeprimafaciesuspicionofBTwasthesheer
complexityofthestructures.ItwashardtobelievethatBT'sclientsstartedoutwithanyparticularbeliefaboutwhethertherewasasmallenoughprobabilityoflossinsuchastructuretobecomfortableenteringintoit.BTwouldhavehadtocarefully explain all the intricaciesof thepayoffs to the clients for them tobefullyinformed.Since it was quite clear that the exact nature of the structures hadn't been
tailored tomeet client needs,why hadBT utilized so complex a design? Themost probable reason was that the structures were designed to be complexenough to make it difficult for clients to comparison shop the pricing tocompetitor firms.However, thisalsomade theclientshighlydependentonBTonanongoingbasis.Iftheywantedtounwindtheposition,theycouldn'tcountongettingacompetitivequotefromanotherfirm.BTclaimedthatithadadequatelyexplainedallthepayoffsandriskstoP&G
and Gibson. But then came the discovery phase of the lawsuit. BT, like alltrading firms, recorded all phone linesof traders andmarketers as ameansofresolvingdisputesaboutverbalcontracts(seeSections3.1.1and3.2).However,thisrecordingalsopickedupinternalconversationsamongBTpersonnel.Whensubpoenaed, they produced evidence of BT staff boasting of how thoroughlytheyhad fooled theclientsas to the truevalueof the tradesandhow little theclientsunderstoodthetruerisks.Further,theinternalBTrecordingsshowedthatpricequotes toP&GandGibsonwerebeingmanipulated tomislead them.Atfirst,theyweregivenvaluationsofthetradesthatweremuchtoohightomaskthe degree of profit BT was able to book up front. Later, they were givenvaluationsthatweretoolowbecausethiswasBT'sbidatwhichtobuybackthetrade or swap it into a new trade offering even more profit to BT. For moredetails on what was revealed in the recordings, see Holland and Himelstein(1995).TheBT scandal caused all financial firms to tighten up their procedures for
dealing with customers, both in better controls on matching the degree of
complexityoftradestothedegreeoffinancialsophisticationofcustomersandinprovidingforcustomerstoobtainpricequotesfromanareaindependentofthefrontoffice.ThesemeasuresweredetailedinSection3.3.Anotherlessonthatyouwouldthinkwouldbelearnedistobecautiousabout
how you use any form of communication that can later bemade public. BT'sreputationwascertainlyhurtbytheobjectivefactsaboutitsconduct,butitwasevenfurtherdamagedbythearrogantandinsultingtonesomeofitsemployeesused in referring to clients, which could be documented through recordedconversations.However, evenwith such an instructive example,wehave seenMerrillLynch'sreputationbeingdamagedin2002byremarksitsstockanalystsmadeine-mailsandtape-recordedconversations(seethearticle“ValueofTrust”in the June 6, 2002, Economist) along with a number of similar incidentssurroundingWallStreet'srelationswithEnron(seethearticle“BanksonTrial”intheJuly25,2002,Economist).
4.3.2JPMorgan,Citigroup,andEnronFollowingtheBankersTrustincident,investmentbanksputincontrolstoguardagainst exploitation of customers. But it was not seen as part of a bank'sresponsibility to safeguard others from actions by the customer. This haschanged as part of the fallout from Enron's 2001 bankruptcy. As part of theprocess leadingup to thebankruptcy, itwas revealed thatEnronhad foryearsbeenengagingindubiousaccountingpracticestohidethesizeofitsborrowingsfrominvestorsandlenders(itwastheirpartintheseshenanigansthatbroughtanendtothemajoraccountingfirmArthurAndersen).OneoftheploysthatEnronhadusedwastodisguiseaborrowingasanoilfuturescontract.As a major player in the energymarkets, it was to be expected that Enron
wouldbeheavilyengagedinfuturescontractsonoil.Buttheseparticularfuturescontractsdidnotinvolvetakinganypositiononoilpricemovements.Enronsoldoil for futuredelivery,gettingcash,and thenagreed tobuyback theoil that itdelivered fora fixedprice.So, ineffect,nooilwaseverdelivered.Whenyoucanceledout theoilpartof thetrades,whatwasleftwasjustanagreementforEnrontopaycashlaterforcashithadreceivedupfront—inpractice, ifnot inlegalterms,aloan.TheadvantagetoEnronwasthatitdidnothavetoreportthisinitspublicstatementsasa loan,makingthefirmappearmoredesirableasaninvestmentandasaborrower.When this was finally disclosed, JPMorgan Chase and Citigroup, Enron's
principal counterparties on these trades, justified their activities by saying thattheyhadnotharmedEnron,theirclient,inanyway,andthattheyhadnopartindetermininghowEnronhadaccountedforthetransactionsonitsbooks;thatwasan issue between Enron and Arthur Andersen. JPMorgan and Citigroup hadtreated these transaction as loans in their own accounting and reporting toregulators,sotheyhadnotdeceivedtheirowninvestorsorlenders.But both JPMorgan and Citigroup clearly knew what Enron's intent was in
entering into the transaction. In the end, they agreed to pay a combined $286million for “helping to commit a fraud” on Enron's shareholders. They alsoagreedtoputnewcontrolsinplacetoascertainthattheirclientswereaccountingforderivativetransactionswiththeminwaysthatweretransparenttoinvestors.Theprecedentofthissuccessfullegalactioncausedotherinvestmentbanksto
commit to similar new controls. And yet we have recently witnessed chargesagainstGoldmanSachsforhelpingGreecehideitslevelofindebtednessfromitsEuropean Union partners by disguising debt as an interest rate swap, amechanismverysimilar to that in theEnroncase.Thedetailshereare that theswapwasdeliberatelydoneatanoff-marketrate,creatinganup-frontpaymenttoGreece thatwouldof courseneed to bepaidbackbyGreece,with suitableinterest,overthecourseoftheswap'slife.Theonlyreasonforcreatingtheswapatanoff-marketratewouldappeartobelettingGreecetakeoutaloanthatdidn'tneedtoshowuponitsbooks.DetailsontheEnroncasecanbefoundinMcLeanandElkind(2003,159–160,
407–408). Details on theGreek case can be found in Dunbar andMartinuzzi(2012).
4.3.3OtherCasesThefollowingaresomeexamplesofothercases inwhichfirmsdamagedtheirreputationsbythemannerinwhichtheydealtwithcustomers:
Prudential-BacheSecuritieswasfoundtohaveseriouslymisledthousandsofcustomersconcerningtheriskofproposedinvestmentsinlimitedpartnerships.Inadditiontodamagingitsreputation,Prudential-Bachehadtopaymorethan$1billioninfinesandsettlements.AnaccountofthisincidentcanbefoundinEichenwald(1995).In1995,afundmanageratMorganGrenfellAssetManagementdirectedmutualfundinvestmentsintohighlyspeculativestocks,utilizingshellcompaniestoevadelegalrestrictionsonthepercentageofafirm'sstockthat

couldbeownedbyasinglefund.Inadditiontodamagetoitsreputation,MorganGrenfellhadtopayroughly$600milliontocompensateinvestorsforresultinglosses.AbriefcaseaccountcanbefoundinGarfield(1998).JPMorgan'sreputationwasdamagedbyallegationsthatitmisledagroupofSouthKoreancorporateinvestorsastotheriskinderivativetradesthatlosthundredsofmillionsofdollarsbasedontheprecipitousdeclineintheThaibahtexchangerateagainstthedollarin1997.AnaccountofthesetradesandtheensuinglawsuitscanbefoundinGillen,Lee,andAustin(1999).Manyinvestmentbankshadtheirreputationsdamagedintheeventsleadinguptothelargefallinvalueoftechnologystocksin2001and2002.Evidenceshowedthatsomewidelyfollowedstockmarketanalystsworkingatinvestmentbankshadissuedfavorablerecommendationsforcompaniesasaquidproquoforunderwritingbusiness,withanalystbonusestiedtounderwritingbusinessgenerated.Regulatorsrespondedwithfinesforfirms,bansfromtheindustryforsomeanalysts,andrequirementsforseparationofthestockanalysisfunctionfromtheunderwritingbusiness.AsummaryaccountwithreferencescanbefoundinLowenstein(2004,212–213).
Reputationalriskincidentsthataroseinconnectionwiththe2007–2008crisisarecoveredinSections5.2.1,5.2.2,and5.2.3.

CHAPTER5
TheSystemicDisasterof2007–2008
5.1OVERVIEWThere can be little question that the global financial disaster of 2007–2008stemmed fundamentally from events in the market for collateralized debtobligations(CDOs)backedbysubprimemortgages.FirmsthatfailedorneededgovernmentrescueeitherhadlargelossesintheseCDOsorelsegotcaughtupinevents triggeredby thedifficultiesof firms thatdidhave large losseson theseCDOs.Inexaminingthecrisis,thischapterthereforebeginswithasection(5.2)focusingonCDOsbackedbysubprimemortgages.Section5.3looksathowthiscrisisthenspreadfromtheinstitutionswithheavylossesintheCDOmarkettoother institutions—by contagion through credit exposure and by contagionthroughimpactonmarkets.Then,Sections5.4and5.5examinelessonsfromthecrisis for, respectively, risk managers and government regulators. Section 5.6takes a brief look at lessons from the crisis that go beyond the scope of riskmanagersandgovernmentregulators.Justtoattempttoclearuponeconfusingbitofnomenclatureatthebeginning
—CDOsonsubprimemortgagesweretermedasset-backedsecurities(ABSs),sowhatwerecalledABSCDOswereactuallyCDO-squaredproducts(seeSection13.4.2 for explanation of a CDO-squared). In fact, as documented in Cordell,Huang, andWilliams (2012), a very substantial portion of subprimemortgagesecurities were CDO-squared products. But since the economic and analyticcharacteristicsofCDO-squaredproductsdonotdiffermaterially fromprimaryCDOproducts,asdiscussedinSection13.4.2,Iwillignorethisdistinctionintheremainderofthischapter.CDOswere thegenesisof thiscrisis, and theywerealsoat the rootofwhat
madeitsodamagingtotheworldeconomy.Largelossesatbanksduetolendingin boom times that later goes sour under more challenging economiccircumstancesareapartofafairlypredictablecycle.Despitetheseperiodiclargelosses,lendingtendstobeaprofitablebusinessovertime,aconclusionthatthestudieson theexcessofcredit spreadsover long-term loss rateswould tend tosupport(seeHull2012,Section23.5,andAmatoandRemolona2003).Norwere
lossesonmortgagelendingoverthiscrisisperiodconfinedtoholdersofCDOs;large banks like Countrywide and Washington Mutual and government-sponsoredagencieslikeFannieMaeandFreddieMacmanagedtobebigloserswithout much participation in CDOs. See the Financial Crisis Inquiry Report(2011, 106–109, 248–250, 305–307) onCountrywide andWashingtonMutual;seeAcharyaetal.(2011)onthegovernment-sponsoredagencies.What was different about credit losses that resulted fromCDOs rather than
from loans? The illusion that CDOs were bringing more liquidity to themortgage lendingmarket resulted in an exacerbation ofwhatmight otherwisehavebeenafarmoremanageabledownturn.Aswe'llseeinSection5.2,treatingtheCDOsasiftheywereliquidsecuritiesratherthanilliquidloanshelpedtofuelanexpansioninlendingfarbeyondwhatprobablywouldhaveoccurredwithoutit.Then,whenitbecameclearthat theallegedliquiditywasn'treallythere, thecommitment of the investment banks to accounting forCDOs as if theywereliquid assets turnedwhatwouldhavebeen longer-term losses to bedealtwithover the length of a credit cycle into immediate requirements for raising newcapital.Thisquicklyledtocontagioninwhichmarkets,securities,andfirmsnotoriginally involved in the CDO market got heavily impacted as well. We'llfollowthisaspectofthestoryinSection5.3.Thefocusinthischapterisonthoseaspectsofthecrisisthataremostdirectly
relevanttoriskmanagement.Forthoselookingforabroaderviewofthecrisis,theFinancialCrisis InquiryReport (2011), referencedasFCIR(2011),and theguidetotheliteratureinLo(2012)aregoodstartingpoints.In my narrative and analysis and my lessons for risk managers section, I
acknowledge that I cannot draw upon the firsthand detailed familiarity thatwouldcomefromworkinginriskmanagementatoneoftheaffectedinstitutionsduring the crisis period—I retired from JPMorgan Chase in 2004 and wasworking during the crisis period primarily as an educator. I have based myaccountonacombinationofwhat is in thepublic record,what Ihavegleanedfrom conversationswith peoplewhowere on the inside during the crisis, andwhatIhaveseenasanindependentconsultanttosomeoftheimpactedfirmsintheaftermathofthecrisis.Balancingthis,mylackofparticipationinthecrisisleavesmerelativelyfreeofanyaxestogrind,positionstodefend,orconstraintsduetoconfidentiality(thoughIcan'tidentify,eitherexplicitlyorbyimplication,specificclientsIworkedforafterthecrisis).Inmyanalysisoflessonsforregulators,Isummarizethemajorproposalsthat
have been offered, but restrict my own suggestions to those where my
experienceandjudgmentasariskmanageroffersomedirectbenefit.ThismeansthatIneedtoleavetoothersanalysisofcriticalissueswheremyknowledgeisless germane. To take one typical example, a good deal of policy discussionfollowingthecrisishastodowithissuessurroundinghownarrowyouwanttomake the role of commercial banks—proposals like the Volcker rule banningproprietary trading by any firm with implicit government guarantees orsuggestionsaboutreimpositionofGlass-Steagall-likerestrictionsonthemixingofcommercialbankingandinvestmentbanking.Theseproposalsinvolvetrade-offs between reducing the probability of future disasters versus the possiblenegative impacts on a country's economic growth by reducing financialinnovationorbyhurting the lendingcapacityofcommercialbanksby limitingtheir sources of revenue.As a riskmanager, I have been trained in analyzingrisks that arisewithin a given institutional structure and not in evaluating theeconomic impact of different institutional structures. On that which I cannotspeakwithinsight,Iwillremainsilent.
5.2THECRISISINCDOSOFSUBPRIMEMORTGAGES
Itisnotsurprisingthatadisasterofthemagnitudeofthe2007–2008CDOcrisishadmanycausesandhasledtoasizableliteratureofexposition.WhileIdrawonmanybooksandarticlesinwhatfollows,Iwouldliketoparticularlydrawthereader'sattentiontofourrelativelyshortarticlesthatIfindespeciallyincisiveintheiranalysis:Davidson(2007),AshcroftandSchuermann(2008),Hull(2009),and Brunnermeier (2009). For those interested in further reading about thecausesofthecrisisandimplicationsforthefuture,Lo(2012)isaconciseguidetothebestoftheacademicandjournalisticliteratureonthetopic,whileOyama(2010, Chapter 3) provides an excellent summary of reports that have beenissuedbyvariousregulatoryagenciesandindustrygroups.AlsorecommendedistheFCIR(2011)compiledbytheFinancialCrisisInquiryCommissionthatwasauthorizedbytheU.S.Congress.Intryingtolookatallthecauses,Ihavedividedupthenarrativeintoseparate
sectionsontheinstitutionswithdifferentrolesintheCDOprocess.Section5.2.1covers the originators of subprimemortgages, Section 5.2.2 the issuers of theCDOsbackedbythesemortgages,Section5.2.3theratingagencieswhoseinputwas critical in the decision making of investors buying the mortgages, and
Section5.2.4investorswhosufferedtheactuallosseswhentheCDOslostvalue.Section 5.2.5 looks at those investment banks that had substantial directexposure to the CDO losses, a subset of the CDO issuers studied in Section5.2.2.Inmanywaystheinvestmentbanksthat,asweshallsee,hadbyfarthemost
catastrophic losses in the crisis are the most puzzling of the institutionalgroupings. First, the “originate to distribute” paradigm of investment bankingwould call for only temporary use of a firm's balance sheet, yet the CDOpositions on which they were exposed were long-standing and seeminglypermanent.Second,thesophisticationthatshouldhaveresultedfromoriginationoftheCDOsshouldhavemadetheinvestmentbanksfarlessvulnerabletobeingmisled as to their value and riskiness than ordinary investors would be. Andthird,theirwell-establishedriskmanagementprocessesshouldhaveservedasacheck on such large and reckless exposures. We will spend some time inunderstandinghowallthesebarrierswerebreeched.Finally, in Section 5.2.6, we will consider the AAA-rated insurance
companies,AmericanInternationalGroup(AIG)andthemonolineinsurers,whobecameentangledinthecrisisandwhowreckedvaluablefranchisesinpursuitofbusinesscompletelytangentialtotheircorecompetencies.
5.2.1SubprimeMortgageOriginatorsOnepointonwhicheveryoneexaminingthecrisiscanagreeisthatasignificantcontributorwasthelaxstandardsandmisalignedincentivesoftheoriginatorsofsubprimemortgages.Sincetheoriginatorsknewthemortgagesweregoingtobebundledforpurchasebyaninvestor,theoriginatorshadnodirectfinancialstakeintheultimatevalueofthemortgages.Buttheoriginatorshadastrongincentivetooriginateasmanyloansaspossible,giventhattheywerebeingpaidafeefororiginationsandgiventheheavydemandbyCDOcreatorsfornewproduct.Totakejustafewexcerptsfromthepostmortems:Brunnermeier(2009):Mortgagebrokersofferedteaserrates,no-documentationmortgages,piggybackmortgages(acombinationoftwomortgagesthateliminatestheneedforadownpayment),and“noincome,nojoborassets”(NINJA)loans.Hull(2009):“Mortgagebrokersstartedtoincreasetheirlendingstandardsinabout2000....Howcouldmortgagebrokersandmortgagelenderskeepincreasingtheirprofits?Theirproblemwasthatashousepricesroseitwas

moredifficultforfirst-timebuyerstoaffordahouse.Inordertoattractnewentrantsintothehousingmarket,theyhadtofindwaystorelaxtheirlendingstandardsevenmore—andthatisexactlywhattheydid.Theamountlentasapercentageofthehousepriceincreased.Adjustableratemortgages(ARMs)weredevelopedwheretherewasalow‘teaser'rateofinterestthatwouldlastfortwoorthreeyearsandbefollowedbyaratethatwasmuchhigher....Lendersalsobecamemuchmorecavalierinthewaytheyreviewedmortgageapplications.Indeed,theapplicant'sincomeandotherinformationreportedonthemortgageformwerefrequentlynotchecked.”Evenloan-to-valueratiosandFICOscores(thecreditscoreofthehomebuyer)reportedtoinvestorsbecamesuspectas“thepropertyassessorswhodeterminedthevalueofahouseatthetimeofmortgageapplicationsometimessuccumbedtopressurefromlenderstocomeupwithhighvalues”and“potentialborrowersweresometimescounseledtotakecertainactionsthatwouldimprovetheirFICOscores.”MichaelYoungblood,headofasset-backedsecuritiesresearchatFriedman,Billings,Ramsey,isquotedbyPeterCoyintheMarch2,2007,issueofBusinessWeekasstatingthattherewas“asuddenbutlittle-noticedshiftinlenders'strategythatoccurredattheendof2005:Lenderswentfromcompetingforcustomersonprice(byloweringrates)tocompetingforcustomersoneasyterms(byloweringlendingstandards).”
The incentives and the results seem clear. What is less clear is why otherparties didn't perceive this incentive structure andbegin to exercise caution asevidenceoflaxstandardsstartedtomount.Tocitejustoneexampleofconcernsexpressed at the time, a July 15, 2005, New York Times article by EdmundAndrewsstatesthattheareasthatbankregulatorsfindmostworrisome“includegrantingloansequalto100percentofthevalueofhomes;grantinglargeloanswithoutdueattentiontothelikelihoodofhighermonthlypaymentsinthefuture;andgranting‘no-doc'(nodocumentation)or‘low-doc'loansthatrequirelittleornoproofofincomeorassets.”ThisarticlequotesBarbaraGrunkemeyer,deputycontrollerforcreditriskattheOfficeoftheComptrolleroftheCurrency:“Youhavetoaskyourself,whywould[aborrower]bewillingtopayaquarter-percentmorewhenhecouldhavegottena lowerratebygivingacopyofhispaystubandaW-2form.There'sareasonthey'vebeencalled‘liar'sloans.'”According to Davidson (2007), “mortgage market participants have long
recognizedthatthereissubstantialriskinacquiringloansoriginatedbysomeoneelse” and so require representations andwarrants from the originator. If loans

sold are later foundnot tomeet theguidelinesof thepurchaser, theoriginatormustrepurchasetheloans.ButasthepushformorenewproducttofeedCDOissuanceintensified,moremarginaloriginatorsbecamepartofthepipeline.Thethin capitalization of these newer originators decreased the value of anypromises to repurchasemortgages thatwere not as represented. But theCDOcreators, the rating agencies, and the more sophisticated investors should allhave been aware of this thinner capital cushion.Why didn't this lead tomorecaution? We look at some specific reasons in the sections that follow. Onegeneral possibility, suggested by Brunnermeier (2009), is that the assumptionthat“backgroundchecksareunnecessarybecausehousepricescouldonlyrise,andaborrowercouldthusalwaysrefinancealoanusingtheincreasedvalueofthehouse”mayhavecausedbothoriginators andpotentialwatchdogs to relaxtheirvigilance.
5.2.2CDOCreatorsMuch of the blame for the problemswith subprimemortgage CDOsmust beallocated to the investment banks that created the CDOs. They certainlypossessed thegreatest amount of expertise,withhighly compensated andveryexperienced structurers, marketers, traders, researchers, and risk managersspecializing in mortgage markets and securitization. If any party was wellpositioned tobeawareof the shortcuts thatwerebeing takenby themortgageoriginatorsandtospotthepotentialdangers,theCDOcreatorswereit.Certainly,theCDOcreatorscannotclaimthattheyweremisledbytherating
agencies.Aswewillseeinthenextsection,theinvestmentbankshadfullaccesstothemodelstheratingagenciesusedindeterminingratings.Intheprocessofplayingwith thosemodels todeterminehowtooptimallystructurenewissues,the CDO creators probably gained more intimate knowledge of these modelsthan thepeoplewithin theratingagencieswhobuilt them.And the investmentbankscouldbringfarmoreresourcesthantheratingagenciesintoplay,intermsofabilitytopayhighcompensationtoattractthebestmodelingtalent(seeTett2009,100).Theeasyanswer is just tofocuson incentives.Since theCDOcreatorswere
operatingonanoriginatetodistributebusinessmodelinwhichalltheCDOriskwouldeventuallyendupelsewhere,theirincentives,likethoseofthemortgageoriginators,weretocreateasmuchproductaspossible,sincefeesearnedweretied to volume sold, and to do their best to minimize anyone's perception of

possible loss.Onecouldargue that this is failing togive the investmentbankssufficientcreditforconcernfortheirlonger-termreputationswithinvestorsandfuturelossesthroughpossiblelawsuits,butaftertheircollectivelydismalrecordinhypingtechnologyinitialpublicofferings(IPOs)inthelate1990s,itwouldbehardtotakethatargumentveryseriously.But incentives can't be the whole story, for two reasons. One is that the
investors should have been aware of these incentives and the track record theinvestmentbankshadshownwhenfacedwiththesetemptationsinthepast,andso shouldhaveexercised their ownduediligence.The second is thatmanyofthese investment banks failed to execute their desired originate to distributestrategysoegregiouslythat theywoundupbeingthelargest loserswhenCDOvaluesstartedtodecline.We'lllookathowthisoccurredinSection5.2.5;first,let'sseewhytheinvestorswerewillingtotrusttheCDOcreatorstothedegreetheydid.Partof thereasonfor this trustwasundoubtedlycomfort thatcamefromthe
supposedly independent reviewroleof the ratingagencies.Why that trustwasmisplaced we'll examine in the next section. Part came from the skillfulmarketing of the investment banks,which did their best to convince investorsthatgainsandlossesonCDOswouldallbeaboutesotericissueslikecorrelationassumptions,onwhichtheinvestmentbankswouldbehappytogivetutorialstoinvestors, ignoring issues like quality of underlying loans onwhich the CDOcreators possessed insider knowledge that investors could not hope to obtain.Andpartofthereasonforthistrustwasastructuralfeaturethatwassupposedtoalign the interests of the CDO creator with the interests of investors: theretentionof thefirst-losspieceof theCDOby thecreator, theso-calledequitytranche.The retention of this first-loss piecemeant that this part of theCDOwould
absorballof the lossesup to somegivenpoint and that investorscould sufferlosses only if the equity tranche was wiped out. The theory was that theinvestment banks had to closely monitor the quality of assets going into theCDOtoavoidlargelossesonthisfirst-losspiece.TheproblemwasthatprofitsfromthetranchesthatweresoldtoinvestorsbecamesolucrativethattheCDOcreators stopped caring about how much they lost on the equity tranche.According to Hull (2009), “the equity tranche was often regarded as a ‘freegood.' The originators had obtained adequate compensation for themortgagesfrom the sales of the other tranches to investors.” So much profit had beengeneratedthattheycouldaffordtotakeafulllossontheequitytrancheandstill

come out ahead, or they could afford to purchase protection on the equitytranchefromahedgefund.
5.2.3RatingAgenciesTheratingagencies—Standard&Poor's(S&P),Moody'sInvestorsService,andFitch—allbadlydamagedtheirreputationsbytheroletheyplayedinprovidingratingsonCDOsbackedbysubprimemortgages.Theyhavebeenthesubjectsofmajor investigations, and their role inCDO ratings has led to questions beingraisedabouttheroletheyplayinallratings,includingtheirlong-establishedcorebusinessofratingcorporatedebt.Insomeways,theirstoryresemblesthatoftheinsurers we will look at later in Section 5.2.6 who jeopardized their corefranchiseinpursuitofnewbusiness.Andyet, the ratingagencieshadamoreplausiblecase than the insurers that
thisnewbusiness linewas related toexistingcompetency.Unlike the insurers,whoenteredamarketthatcouldhavesurvivedwithoutthem,theratingagencieshad a role that was critical to the existence of the CDO business.Most debtinvestors,fromlonghabit,wouldhavebeenextremelyuncomfortableinvestingwithoutanagency rating;manywere legallyprohibited from investing indebtthat did not have a particular minimum rating—it was considered too risky.Ratings tied to probability of repayment were the rating agencies' bread andbutter. And they did have several decades' worth of successful experience inrating structured debt that related to mortgages, credit cards, auto loans, andCDOsbased on corporate debt.But in 2007 and 2008, the ratings on existingCDOs were downgraded far more violently than any other class of ratedsecuritieseverhadbeen,sowingwidespreaddistrustintheagencies.Wheredidthisbusinessmodelbreakdown?ManycriticsinthewakeoftheCDOcrisispointtoconflictofinterestasthe
mainflawintheratingagencystructure:theratingagencieswerebeingpaidbythefirmswhosebondstheywererating.Butthatflawhasalwaysexistedforallagency ratings, including the core business of rating corporate debt. What isprobably more germane is the very close relationship developed between therating agencies and the investment bank structurers creating the bonds.Structurers had full access to the agency ratings models and a great deal offreedom in deciding whatmortgages would go into a CDO. They could playwith the structure until they optimized the disconnect between the riskrepresented by the rating and the true risk, maximizing their profits (see
Brunnermeier 2009, 82). There is no comparable freedom to easily changecorporate structure. Furthermore, a corporation that does not get the rating itwants will still continue in business and somay choose to pay for the ratinganyway.ACDOnotgettingtheratingitwantswillnotcometomarket,sotheonly way rating agencies could get paid is if CDOs did come to market; forfurther discussion of this point, seeDavidson (2007, 4).There is considerableevidencethathascometolightsincethecrisisthatratingagenciesdidsuccumbtothepressuretofindwaystogiveCDOstructurestheratingstheyneeded(see,for example, McLean and Nocera 2010, Chapter 8, and Lowenstein 2010,Chapter4).Anothersignificantflawintheanalogybetweentraditionalagencyratingsof
corporatedebtandagencyratingsofCDOswasthattheratingsmethodologyforCDOs required the agencies tomake forecasts about the state of the economywhereascorporatedebtratingsdidnot.ThispointismadewellbyAshcroftandSchuermann (2008, Section 5.5): CDO ratings “rely heavily on a forecast ofeconomicconditions.Notethatacorporatecreditratingisbasedontheagency'sassessmentthatafirmwilldefaultduringneutraleconomicconditions(i.e.,fullemploymentatthenationalandindustrylevel).”(ThiscorrespondstothepointmadeinSection13.2.1.1,aboutagencyratingsbeingthrough-the-cycleandnotpoint-in-the-cycle.)InCDOmodeling,bycontrast,“uncertaintyaboutthelevelof loss in the mortgage pool is driven completely by changes in economicconditions”(suchastheexpecteddefaultratesofmortgages,whicharecloselytied to forecasts of real estate prices). Furthermore, CDO ratings “dependheavily on quantitative models while corporate debt ratings rely heavily onanalyst judgment.” This meant that rating agency senior management,experiencedincorporatedebtratings,hadlittleintuitionforwhatwasgoingonin theCDO ratings.And neither rating agencymanagement nor investors hadbeen warned about the precipitous decline in ratings a change in economicoutlook could entail, in contrast to the farmore steady corporate debt ratings.(CDO ratings aremore volatile than corporate debt ratings both because theydepend on economic forecasts and because the CDO tranching processconcentratessensitivitytotheeconomyinthehigher-ratedtranches—seeSection13.4.4.)While these are probably the twomost important factors in the ratingagencyfailure,otherissuesofsomeweightwere:
Thefailureofratingagenciestomonitorthedeterioratingcreditstandardsofthesubprimemortgageoriginators.Therewascertainlyenoughpublicityaboutthisissuethatratingagenciesshouldhavebeenawareofaneedto

performsomeduediligence.FormerMoody'smanagingdirectorJeromeFonsintestimonytotheFinancialCrisisInquirystatedthat“neveroncewasitraisedtothisgroup[Moody'shigh-levelStructuredCreditcommittee]orputonouragendathatthedeclineinqualitythatwasgoingintopools,theimpactpossiblyonratings...”(FCIR2011,121).Eveniftheratingagenciesdidn'tbelieveitwastheirresponsibilitytocheckonthemortgageoriginators,theyshouldatleasthavebeenquestioningtherelevanceofhistoricaldefaultdatatoarapidlychangingsituation.Itwasn'tjustissuesbeingraisedaboutslippingcreditstandardsthatshouldhavetriggeredsuchquestioning,butthesheerexplosivegrowthofthemarket,whichshouldhavebeenenoughtomaketherelevanceofdatafrompriorerasdoubtful(comparewithSection8.2.8.2).
Theratingagencies'responsetothesecriticismswastoclaimthetransparencyof their CDO ratings models as a virtue (see, for example, Tett 2009, 100).Anyonecould seeexactlywhat themodelwasdoing, theagencies implied, sowhy blame us if you were later disappointed in the results? This wasdisingenuous in two directions. First, as emphasized by Tett, it was the veryopenness and transparency of the models that made them so easy forsophisticated structurers to manipulate. And second, the vast majority ofinvestors certainly lacked the sophistication to understand theworkings of themodels and had far less capability than the rating agencies for checking loanqualityandrelevanceofhistoricaldata.Why hadn't these issues surfaced in the reasonably long history of agency
ratings of other structured securities? I haven't seen an analysis of this, but Isuspect that while some of these issues were present for other structuredsecurities, they did not have as strong an impact as they did on the subprimemortgage CDOs. For example, subprime mortgage CDOs are particularlydependentonthestateofthenationalrealestatemarket.
5.2.4InvestorsInmanyways,theinvestorsinCDOscanberegardedasthekeyplayersinthewholestructure.ItwasthelargeappetiteofinvestorstoownCDOtranchesthatdrove thegrowthof themarketandset the incentives forall theotherplayers.There was a large and diverse universe of these investors, including mutualfunds, pension funds, insurance companies, hedge funds, high net worthindividuals,andsmallerbanks(thosenot involvedin thecreationofCDOs).It

was the CDO investors who were the claimed victims of fraud andmisrepresentationby theotherplayers.And itwas theCDO investorswho, intheory,shouldhavebeentheonestosufferthebulkoflossesthatoccurredinthemarketmeltdown.Butsomehow,itdidnotworkoutthatway.Themajorinstitutionsthatsuffered
thegreatest reversesandeitherwentbankruptor requiredgovernmentbailoutswerenotprimarilytheinvestorsbutrathertheinvestmentbanksthatcreatedtheCDOs.Thebestoverallsummary that isavailableof lossesdue to thecrisis istheInternationalMonetaryFundanalysisofApril2009(InternationalMonetaryFund2009,Table1.3)thatconcludedthatoutofroughly$1trillioninlossesonU.S.-originatedmortgageCDOs, 60 percentwas lost by banks, 25 percent byU.S.government-sponsoredenterprises(GSEs),10percentbyinsurers,andonly5 percent by hedge funds, pension funds, and other nonbank financialinstitutions.Still,theinvestorsdidsuffersubstantiallosses,ascanbeseenbyjustlooking
at the damage claims in lawsuits filed againstmortgage originators and CDOcreators. The FCIR (2011, 225) asserts that “as of mid-2010, court actionsembroiledalmostallmajorloanoriginatorsandunderwriters—thereweremorethan400lawsuitsrelated tobreachesofrepresentationsandwarranties,byoneestimate”;foranupdatedaccountofthemanylawsuitsthathavebeenfiled,seethe Structured Finance Litigation blog: www.structuredfinancelitigation.com).Thetheoryoftheselawsuitsandofmanyarticlesthathavebeenwrittenonthecrisisisthatdeliberatelymisleadingactionwastakentoenticeinvestorstobuythese securities.Theprevious three sections containmuchevidence to supportsuch claims, so there is at least a significant extent to which investors weremisled.Thequestion Iwant toaskhere is:Towhatdegreewas that theentirestoryandtowhatextentwereinvestorsknowinglytakingonsignificantrisk?This question is one that hasmuch relevance for riskmanagers in trying to
learnlessonsfromthecrisis.Iftherewereclearsignsofriskinessthatinvestorsfailedtounderstandorchosenottofocuson,thenwehavematerialthatcanbeused in designing better risk management procedures for the future. Theprincipalargumentsthatinvestorsweretoatleastsomesignificantdegreeawareof the risk they were taking on are first that CDO tranches were yieldingconsiderablyhigherreturnsthancorporatebondswithcomparablecreditratingsandsecondthattheveryilliquidityofthetranchesshouldhavebeenawarningsignagainstplacingtoomuchfaithinwhattheywerebeingtold.ThehistoricaldataIhavebeenabletoaccessshowsasteadyyieldadvantageofabout80basis

pointsforAAA-ratedsubprimeCDOtranchesoverAAA-ratedcorporatebondsthroughouttheperiodfrom2000to2006.
5.2.5InvestmentBanksAsalreadynotedinSection5.2.4,investmentbanksthatwereamongthemajorcreators of CDOswere also the group that suffered the heaviest losses in the2007–2008meltdown.ThiscanbeseenfromthepreviouslycitedInternationalMonetary Fund (IMF) analysis that found that 60 percent of the $1 trillion inlossesonU.S.originatedmortgageCDOscamefrombankswhileonly5percentcame from themutual funds, pension funds, hedge funds, and other nonbankfinancialinstitutionsthatweretheprimaryclientstowhichtheinvestmentbanksmarketed theCDO tranches. It is true that10percentof the lossescame frominsurance companies andmany insurance companieswere among the primaryclients to whom CDO tranches were marketed. But a good portion of theinsurancecompanylossisattributabletoAIGandthemonolineinsurers,and,aswedetailinSection5.2.6,AIGandthemonolineinsurerscanmorereasonablybeviewedaspartnersoftheinvestmentbanksinCDOcreationthantheycanbeviewedasclients.ItisalsotruethattheIMFanalysisdoesnotdistinguishhowmuchofthe$600
billioninlossescamefrominvestmentbanksthatwereCDOcreatorsandhowmuchwasduetosmallerbanksthatmayhavebeenclients.ButananalysisbytheFederalReserveBankofPhiladelphia(Cordelletal.2012,Table11)showslossesof72%onthe$223billionofmortgage-backedCDOsoriginatedin2006and84%onthe$163billionofmortgage-backedCDOsoriginatedin2007.Withloss levels this high, a substantial portionof the losses had to be going to thesuper-seniortranchesthatwereprimarilyheldbytheinvestmentbanksthatwereCDOcreators,andTable12(b)fromthesamereportshows67%lossesonseniorAAA tranches originated in 2006 and 76% losses on senior AAA tranchesoriginated in2007.At the levelofan individual investmentbank,UBS,whichmadeapublicandthoroughreporttoshareholdersinApril2008ofthefalloutofthecrisis,reported2007lossesrelatedtotheU.S.residentialmortgagemarketof$18.7 billion, with about $12 billion due to CDO positions. By early 2009,estimates of total write-downs and credit losses onU.S. financial assets were$48.6billionforUBS,$67.2billionforCitigroup,and$55.9billionforMerrillLynch(seeZandi2009,Table11.2).This is both unfortunate and surprising: unfortunate, because concentrated

losses by large banks are far more damaging to the economy than the sameamount of losses spread out over smaller banks and investors; surprising,becausethesophistication,intimatefamiliaritywiththeproduct,andoriginatetodistribute business model should all have worked to protect the investmentbanks.How then did investment banks wind up with so much mortgage CDO
exposure? The initial mechanics of the situation are fairly straightforward.ClientswereeagertopurchaseCDOtranches,therebysellingprotectionagainstmortgagedefaults,buttheywereinterestedonlyinthemezzanine tranches thatcarried intermediate expected loss.The highest expected loss tranches, the so-called equity tranches, attracting the first losses, could not have achievedinvestment-grade ratings andwere not considered suitable investment vehiclesformostclients(thoughsomehedgefundsdidtakeonthisrisk,mostlythroughderivatives).Also, itwasconsideredappropriate that theCDOcreatorhold theequity tranche, as explained in Section 5.2.2. The tranches with the lowestexpected loss, termed super-senior because they supposedly had a statisticalprobabilityoflossevenlowerthanAAA-ratedcorporatebonds,didnothaveastrong client demand.Because of their very low loss expectation, they carriedverylowcreditspreads,justafewbasispoints,anditwasvirtuallyimpossibletofind a client that wanted to use valuable balance sheet room to earn such ameager return. (It might be thought that super-senior tranches would be apossibly attractive investment as an alternative to Treasury securities that hadsimilarly lowreturns,butTreasurysecuritieshadmanyadvantages in termsofliquidityandattractive repurchase rate fundingopportunities that super-seniorslacked.)Here was a dilemma for the investment banks. To create more mezzanine
tranches for which there was high demand, they also needed to create super-senior tranches for which there was virtually no demand. Of course, onealternativewouldhavebeentosubstantiallyraisetheyieldonthesuper-seniorstothepointthatdemandwascreated,butthiswouldhavesoseverelycutintotheprofitabilityof theoverall transaction that itwasn't seriouslyconsidered.Theironlyalternativeswere to stop the flowof lucrativenewbusinessor topileupsuper-senior tranches on their own balance sheets. They almost all chose thelatteroption.AsChuckPrince,thesoon-to-be-ex-CEOofCitigroup,infamouslysaid in July 2007, “As long as themusic is playing, you've got to get up anddance.We'restilldancing”(FCIR2011,175).Itwasthiscontinuousbuildupofsuper-seniors,totallylackingaliquidmarket,thatwasthesourceofalmostallof

the largeCDOlossessufferedby the investmentbanks.Forexample, theUBSreporttoshareholdersshowedthatabout$9billionofits$12billion2007lossesonCDOsweredue tosuper-senior tranches.Other large investmentbanks thatfollowed this pattern included Citigroup,Merrill Lynch,Morgan Stanley, andBear Stearns (see Tett 2009, Chapter 9). Writing generally about investmentbanksthatexperiencedlargelossesin2007,theSeniorSupervisorsGroupreportofMarch 2008 on page 8 states that “some firms continued to underwrite orincrease their exposures until the summer of 2007 despite an array of dataindicating rising stress in the subprimemortgagemarket andworsening creditmarketconditions.”Ifmanagementofthesebankshadplacedsensiblelimitsonthesizeofsuper-
seniorholdingsorhadinsistedonmark-to-marketvaluationsoftheholdingsthatreflected their total lackof liquidity (thereby lowering theprofit that couldberecognized on new CDO issuance and shrinking bonus pools), the entiremortgageCDOcreationprocesswouldhavecometoahaltatafairlyearlystageandthedamagetothefinancialindustryandtheworldeconomywouldnothavebeen nearly as severe. As Richard Bookstaber, an experienced senior riskmanager,putitinhistestimonybeforetheFinancialCrisisInquiryCommission,“Aseverybodyinanybusinessknows,ifinventoryisgrowing,thatmeansyou'renot pricing it correctly. . . . It was a hidden subsidy to the CDO business bymispricing” (FCIR 2011, 196). What stopped reasonable action from beingtaken?Thebanksseemedtobeoperatingasiftheypossessedasplitpersonality.Inonepartofthefirm,theCDOcreationteamswerebehavingasifallriskwasbeing taken on by clients, as if the originate to distribute mechanism wasoperating smoothly. This left them free to ignore warning signs about theincreasingly poor quality of the mortgages being originated and about thepotential impacton losses if thehousingpricebubbleburst. Inanotherpartofthefirm,super-seniortrancheholdingsweregrowingbyleapsandbounds.One possible answer is that the traders and structurerswho had the greatest
degreeofknowledgeofthesituationjustdidn'tcareaboutthehealthofthefirmandsodidtheirbesttomisleadseniormanagersandriskmanagersaboutwhatwas really going on. All they cared about was generating onemore round ofspectacularbonuses.Theytreatedriskmanagersandseniormanagementasjustanother setofclients towhomproductneeded tobe sold—in thiscase, super-seniortranches.Whilethisnodoubtcontainsanelementoftruth,itcan'tbetheentirestory.Riskmanagementofinvestmentbankshasalwaysbeenbuiltuponahealthyskepticismaboutthemotivationsoffront-officepersonnel,aswesawin

Section2.1andaswewill consideratgreater length inChapter6.So let's trylookingat someotherpossibleexplanations.We'll lookat supportingevidencefor them in this section, and then draw on this material to examine riskmanagementlessonsinSection5.4.5,usingthesameheadingsinbothsections.Beforegoinganyfurther,letmeclearuponepossiblesourceofconfusion.In
themidstof thecrisis, thereweremanynewsreportsconcerningdisputesoverthemarking-to-marketofdistressed securities—should firmsholding securitiesexperiencingwhatwashopedtobeatemporaryboutofilliquidityshowlossesbasedonthefire-salepricesatwhichthesesecuritiesweretradinginthemarket?Since these disputes occurred during the same period that large losses werebeingrecordedbytheinvestmentbanksontheirsuper-seniortranches,itmighthave seemed that the super-senior losseswere at least partially an accountingfiction.Butaswe'vejustrecounted,thesuper-seniortranchesneverhadaliquidmarketatanytime,sotheirmarkswerealwaysbasedjustonthebestjudgmentas toultimate losses.Whatever themerits of the accountingdebateoverothersecuritiesthatwerecaughtupinthecrisis(we'llhavemoretosayaboutthisinSection 5.3.2), the losses reported on super-seniors always represented bestestimatesoftrueultimatecost.
5.2.5.1RelianceonInadequateDerivativesProtectionOnefairlycommonresponse to the inability tofindclients tobuysuper-seniortranches was to hold on to the super-senior tranches but hedge the risk withderivatives. This should clearly have been viewed with suspicion by riskmanagers—if you couldn't find clientswilling to buy super-seniors,whywereyouable to findclientswilling to takeon the risk throughderivatives?Wasn'tthere some substantial difference in the amount of risk being shed in the twodifferenttransactions?Bysayingthatsuspicionshouldhavebeenaroused,Idonotmeanthatitwas
obvious that the risk was not being fully hedged, just that thorough analysisshouldhavebeeninitiated.Ihaveseencasesinwhichfirmswerewillingtofullyabsorbriskbuthadlimitationsonbalancesheetusage,perhapsbecauseoflackof access to good funding sources or perhaps due to statutory restrictions.Analysis in these cases showed that the sellers of derivative protection wereproviding sufficient collateral and margining to keep risk very close to whatwouldhavebeenachievedwithanoutrightsale, thoughwithdifferent fundingrequirements. (Discussionofcollateralandmarginingwillbe found inSection

14.3.3.)Hadthoroughanalysisbeenperformedinthecaseof thederivativeshedging
super-seniors, a very different picture would have emerged. Manycollateralization andmargining agreements were either nonexistent or of verylimited value. For example,Lowenstein (2010,Chapter 9) reports thatVikrimPandit,on takingoverasCEOofCitigroup,was“stunned tohear” fromNewYorkState'stopinsuranceregulatorthat“Citigroup'sinsurancedidnotentitleittopayments as thepricesofCDOsdeclined.”Citi had“insuranceondefaults,notonmarketvalue.”Giventhelong-datednatureoftheCDOs,“Citi(andeveryother bank with insurance) would have to wait years to file claims, at whichpointtheinsurerscouldbeoutofbusiness.”Thiswasverytypicalofinsurancepurchased(whetherthroughinsurancecontractsorthroughderivatives)fromthemajor suppliers of super-senior insurance, AIG and the monoline insurers(whose role we will look at more closely in the next section). AIG did offersomecollateralization,partly togaina competitiveadvantageon themonolineinsurers,whichofferednone(McLeanandNocera2010,190–191).Butsomeofthis was weak collateralization that would be triggered only under extremecircumstances, by which time AIG might already be facing difficulties (asprovedtobethecase).WhenwelookatriskmanagementlessonsinSection5.4,we'lldoadetailed
analysisofall thealarmbells thisarrangementshouldhavesounded.But,as Iwilldetailthere,theriskmanagementmethodologyforidentifyingthelargegapinriskreductionbetweenoutrightsaleandinsuranceprotectionwaswellknownand thoroughly disseminatedwell before these dealswere booked. If thiswasnot highlighted to senior management and regulators, it constituted a majorbreachofriskmanagers'responsibilities.
5.2.5.2RelianceonOff-Balance-SheetVehiclesIfyoucouldn't findclients interested inholding super-seniorsbecauseof theirvery thin spreads over funding costs, there was one more trick that could beused: Ifyousetupanentity thatcouldhold the super-seniorsand issue short-datedAAA-rateddebtagainstthem,thenormalupwardslopeoftheyieldcurvewouldprovideenoughcushiontogeneratesomeextraspreadtoenticeinvestorsinshort-datedAAAdebt(Tett2009,Chapter6).The primary practioner of this bit of financial legerdemain was Citigroup,
whichbeganplacingitssuper-seniorsintostructuredinvestmentvehicles(SIVs).
SIVs were officially independent enterprises whose commitments Citi had nolegalresponsibilityforandsodidnothavetobeconsolidatedontoCiti'sbalancesheet (leading to their classification as off-balance-sheet vehicles). But SIVswerefundedbycommercialpaper(CP),andcommercialpaperinvestorswouldinvestonlyinAAA-ratedentities.Eveniftheratingagenciesregardedthesuper-senior tranches as AAA, the short-dated funding and long-dated assets of theSIVs raised the issue of what would happen to the CP holders if new CPinvestorscouldnotbefoundwhentheoldCPmatured.ToobtainanAAAratingfor theSIV,Citineededtooffer liquidityputs thatwouldallowtheSIVtosellthesuper-seniorsbacktoCitiatparif theSIVranintoproblemsfundingthem(McLean and Nocera 2010, 240–241). Citi wrote about $25 billion of theseliquidityputs.Thekeyriskmanagementquestionwouldnowbewhatprobabilityoflossto
assigntotheseliquidityputs.TheattentivereaderwillnotbesurprisedthatCiti'sinternalriskmodelsestimatedsoremoteapossibilityoftheliquidityputsbeingtriggered that theyonlyneeded tohold0.16%incapitalagainst theput (FCIR2011,138).Henceonly$40million incapitalwouldbe requiredagainstCiti's$25billioninliquidityputs.AndthereseemsnoevidencethatCiticontinuedtoview thesuper-seniorsplaced into theSIVsas stillbeingpartof its riskbook.Butclearly,placingthesuper-seniorsintoanSIVmadepracticallynodifferenceto Citi's risk position. In the event that there would be losses on the super-seniors, itwouldbevirtually certain that the liquidityputwouldbe exercised.Thisisanotherclearcaseofviolationofoneofthewell-establishedrulesofriskmanagement, the need to account for wrong-way risk (see Section 14.3.4 formoreexplanationofwrong-wayrisk).
5.2.5.3UseofFaultyCDOModelsFelixSalmon'sFebruary2009 story forWiredmagazine, “Recipe forDisaster:TheFormulaThatKilledWallStreet”(Salmon2009)broughtDavidLi'sversionoftheVasicekmodeltotheattentionofawideraudiencethanfinancialindustryquants (see Section 13.3.3 for a description of themodel). The article led offwithstatementssuchas:“Oneresultofthe[2008financialsystem]collapsehasbeen the endof financial economics as something tobe celebrated rather thanfeared. And Li's Gaussian copula formula will go down in history asinstrumentalincausingtheunfathomablelossesthatbroughttheworldfinancialsystemtoitsknees.”Withthisasbackground,Iwassomewhatsurprisedinmysurveyoftheprincipalbook-lengthwritingsandjournalarticlesonthecrisisto

seescantmentionofeithertheLimodelortheVasicekmodel.DidfaultyCDOmodelingplayasignificantroleinthecrisis?The case for faulty CDOmodels playing, at best, aminor role in the crisis
wouldgoasfollows:TheLimodelwasprimarilybeingusedasaninterpolationtoolfrommorecommontranchesforwhichpricequotescouldbeobtainedtolesscommontranches.Assuch,itsusewasverysimilartothatoftheBlack-Scholesmodelininterpolationofoptionspricesandtheuseoffittingtoacorrelationskewimpliedbythemarket(seeSection13.4.2)aspartoftheinterpolationshowsthattheGaussiancopulaassumptionsoftheLimodelwerenotbeingtakenveryseriouslybythetradersusingit.TheLimodelwasalsobeingusedasanaidtointuition(seeSection13.3.3)andassuchitdiditsjobadmirably.Infact,itwasparticularlyvaluableinlettingusersseethedegreeofsystematicriskembeddedindifferenttranches,whichshouldhavedirectedattentiontotheriskinessofsuper-seniortranches(seeSection13.4.4).Theemphasisonthecorrectestimationofcorrelationlevelsandtheshapeofthecorrelationcopulawasveryimportantfortradersmakingdecisionsonthevalueoftranches.Hadthetranchesbeenliquid,thiswouldalsohavebeenimportantforriskmanagers,inestimatingwhereliquidpositionscouldbeexited.Butgiventheilliquidityofsuper-seniortranches,stresstestinglargechangesinthecommonfactor,closelylinkedtorealestateprices,wasoverwhelminglymoreimportantforriskmanagersthanstresstestingofeithercorrelationlevelorcopulashape.Wheninvestmentbankswantedtoperformmorefundamentalanalysisoftranchepricingandrisk,theywerehardlylackingformoresophisticatedversionsofCDOmodels,asthediscussioninSections13.3.3and13.4.2clearlyshow.Manyofthemodelscitedinthesesectionsdatefromthefirsthalfofthe2000sdecadeandwerewidelyavailable—oftenreferencedandexplainedinpaperspublishedbyinvestmentbankresearchteams,inthewell-knownbookbySchonbucher(2003),andinmanyissuesofRiskmagazinefromthatperiod.
Andyet there is one keyway inwhichCDOmodels utilizedby investmentbanksinthisperiodweremisleading.Toomuchemphasiswasplacedonfittingmodelparameters toobservedmarketpriceswithoutanadequateconsiderationofthedegreeofilliquiditythatpervadedmanysectorsofthismarket,includingtheentiresuper-seniorsector.Thismayhavehelpedencourage thedefinitively

faultyanalysiswediscussinSections5.2.5.6and5.2.5.8.
5.2.5.4RelianceonExternalRatingsItisuncontroversialthattheratingagenciesplayedasignificantroleinfuelingthedemand forCDOtranchesby investors.Butcould theyhavealsoplayedarole in thewillingnessof investment banks to tolerate so large an exposure tosuper-seniors?Atfirstglance, thisseemspreposterous.AswenotedinSection5.2.2, the investment banks in their role as CDO creators had intimateknowledgeoftheratingagencymodelsandknewtheextenttowhichtheyhadmanipulated thosemodels.How could they then rely on thosemodels to takecomfortwiththeirexposure?AndyetonefindsintheMarch2008UBSreporttoshareholders(UBS2008,
Section 5.3.2) that the UBS market risk control group's “VaR methodologiesrelied on the AAA ratings of the Super Senior positions. The AAA ratingsdeterminedtherelevantproduct-typetimeseriestobeusedincalculatingVaR....Asaconsequence,evenunhedgedSuperSeniorpositionscontributedlittletoVaRutilization.”Tett(2009,139)quotesPeterKurer,amemberofUBS'sboard,assaying,“Franklymostofushadnotevenheardtheword‘super-senior'untilthesummerof2007.WewerejusttoldbyourriskpeoplethattheseinstrumentsareTriple-A,likeTreasurybonds.”AnecdotalaccountsIhaveheardfromotherinvestmentbankriskmanagersindicatethatUBSwasnotaloneinutilizingAAAratingsoftranchesasaninvitationtocalculateriskstatisticsforthembasedontime series of price moves of AAA-rated corporate bonds. The March 2008SeniorSupervisorsGroupreportontheriskmanagementpracticesofinvestmentbanks leading up to the crisis states that at some firms “internal risk capitalmeasuresthatreliedtoomuchonagencyratingsunderestimatedthetruepriceoftheriskofsuchpositions”andthatsomefirms“tendedtoassumethattheycouldapplythelowhistoricalreturnvolatilityofcorporatecreditsratedAaatosuper-seniortranchesofCDOs”(p.5).Itfurtherstates,“Giventhatthefirmssurveyedforthisreviewaremajorparticipantsincreditmarkets,somefirms'dependenceon external assessments such as ratings agencies' viewsof the risk inherent inthesesecuritiescontrastswithmoresophisticatedinternalprocessestheyalreadymaintainedtoassesscreditriskinotherbusinesslines”(p.3).Theimpressionleftisconsistentwiththepictureoffront-officepersonnelnot
sharingtheirknowledgeofratingagencymodellimitationswithriskmanagers.WeaddressthelessonsforriskmanagersinSection5.4.1.

5.2.5.5OverrelianceonVaRMeasuresAswehavejustseen,UBS(and,anecdotally,someotherinvestmentbanks)usedtheAAAratingsof super-seniors as a shortcut inVaRcalculations, essentiallytreatinganyAAA-ratedsecurityasifitspricemovementscouldberepresentedby a time series drawn fromAAAcorporate bond prices. Thiswas clearly anerror—asdiscussedinSection13.4.4,thevolatilityoftranchepricesisexpectedto be quite different from the volatility of corporate bondsof the same rating.But an even more important question is: Why were firms even bothering tocalculateVaR,ameasureofvulnerabilitytoshort-termpricefluctuations,foraninstrumentasilliquidassuper-seniors?Now,perhapsthiswasjustacalculationofVaRforaliquidproxyhedgeofthe
super-seniors, and thebulkof the riskwasgoing tobeevaluatedelsewhere (ameasure Iwill strongly advocate, inSections6.1.2 and8.4, forhighly illiquidinstruments). If this was the case, then even the use of the computationalshortcut might be justified—you would be choosing a portfolio of AAAcorporatebondsasyourliquidproxyhedge.Itmaynotbethebestchoice,butaslongasyouarecalculating the long-termriskof thehedgeseparatelynogreatharmwillbedone.ButthisdoesnotappeartobethewayUBS(or,anecdotally,some other investment banks) were operating. VaR was intended to be theprimaryriskmeasureforthesuper-seniors.QuotingUBS(2008,Section6.3.2),“Investmentbankbusinessplanning relieduponVaR,which appears tobe thekey risk parameter in the planning process. When the market dislocationunfolded, it became apparent that the risk measure methodology had notappropriately captured the risk inherent in the businesses having Subprimeexposure.” Dash and Creswell (2008) relate that “when examiners from theSecurities and Exchange Commission began scrutinizing Citigroup's subprimemortgage holdings afterBear Stearns's problems surfaced, the bank told themthattheprobabilityofthesemortgagesdefaultingwassotinythattheyexcludedthemfromtheirriskanalysis.”Thisbringsustothebroaderquestionoftheextenttowhichtheilliquidityof
thesuper-seniorswasbeingfactoredintoriskmeasurement.
5.2.5.6FailingtoAccountfortheIlliquidityofSuper-SeniorTranchesThe illiquidity of super-senior tranches should have been evident to anyone

involvedininvestmentbanking,eventhosemostremotefromdirecttradingandmarketingofCDOs, justby thefact that itwassuchaproblemtofindwillingbuyers.ButtheSeniorSupervisorsGroupreportofMarch2008findsthat“firmsthat facedmore significant challenges in late 2007 . . . continued to price thesuper-seniortranchesofCDOsatorclosetopardespiteobservabledeteriorationin the performance of the underlying . . . collateral and declining marketliquidity”(p.3).TheUBSreporttoshareholdersSection6.3.6.4statesthat“TheSuperSeniornoteswerealwaystreatedastradingbook(i.e.,thebookforassetsintendedforresaleintheshortterm),notwithstandingthefactthattheredoesnotappear tohavebeena liquidsecondarymarketand that thebusiness tended toretaintheSuperSeniortranche.”Whywerefirmstreatingsuchclearlyilliquidinstrumentsasliquid?Oneclear
motivationisalludedtointhesamesectionoftheUBSreport:“Treatmentunderthe‘bankingbook'wouldhavesignificantlychangedtheeconomicsoftheCDOdesk business as this would have increased the required regulatory capitalcharges.”Classifyingassetsinthetradingbook,availableforresaleintheshortterm,attractedmore favorablecapital treatment than the sameassetsplaced inthe banking book, intended to be held. Note that this is just a statement ofintention—nothingstopsyoufromsellingassetsinthebankingbook;loansalesoccurallthetime.Butthisstatementofintentionwasallowedtoimpactrequiredregulatorycapital,amajordriverof theeconomicsofaproduct.This loopholewas closed after theCDO-fueled crisis revealed its shortsightedness; theBankforInternationalSettlements(BIS)IncrementalRiskCapitalGuidelinesofJuly2009madecapitalrequirementsforcreditproductsheldinthetradingbookandbanking book essentially equivalent—see PricewaterhouseCoopers (2011,Section4.6.3.5).Italsoimpactedthebalancesheetreportingthatmightimpactpublicperceptionofthedegreeofliquidityofthefirm'sassets.Myguess,and it'sonlyaguess, is that themechanismthatoperatedatsome
firmswasthatthepotentialliquidityofCDOs,includingsuper-seniors,hadbeenemphasizedinordertoobtainthefavorablecapitaltreatment—securitiesare,ingeneral,moreliquidandlikelytobesoldthanloansare.Whilethisaccountingdecision shouldnothave forced a similar classificationby riskmanagers, it isnot uncommon for this kind of distinction between accounting principles andriskmanagementprinciplestogetblurred.
5.2.5.7InadequateStressTests

Another possibility is that there was widespread conviction that risks thatthreatenedmezzaninetranchescouldnotspreadtosuper-senior tranches.Ifindthisdifficulttoaccept,sincethesimplestpossibleCDOmodelcouldeasilyshowthe vulnerability of even super-senior tranches to a large downturn in housingprices, the sort of economic stress scenario that risk management groups aresupposed to run routinely (seeSection13.4.4on theusefulnessof theVasicekmodelinanalyzingvulnerabilityofseniortranchestosystematicrisk).One viewpoint I have frequently encountered in conversations with risk
managers who were caught up in the crisis goes something like this: “Placeyourselfbackin2006andsupposeyouweretostresstestyourCDOportfolio.SupposethatyouchosetoshockU.S.housepricesdown30percenttoevaluatetheimpactonthepricesofsuper-seniortranchesthatyouheld.Youwouldhavebeenlaughedoutoftheroom—noonewouldhavefoundthisaplausiblestresstestscenario.”ApublishedaccountofacloselyrelatedincidentcanbefoundinLewis(2011,211–212).WithallduedeferencetothefactthatIwasnotactivelyinvolved in riskmanagement of any of the impacted firms during this criticalperiod,Imustrespectfullybutstronglydissentfromthisview.First, lookingat thehistoryofsuper-senior tranchesatmanyof the impacted
firms,youfindanactiveinterestinpurchasingprotectiononthesetranchesfromAIG(seeTett2009,134–136;FCIR2011,139–142,202–204).It isonlywhenAIG's appetite for selling protection dried up that firms turned to eitherabsorbingtheriskcompletelyorutilizingclearlyinadequatesubstitutes,suchasbuying uncollateralized protection from inadequately capitalized monolineinsurers. If losses on super-seniorsweren't going to occur under anyplausibleshock,whyspendmoneyandeffortonbuyingprotection?Therejoindermightbe that this was “just to keep the risk managers (or the accountants or theregulators) happy.” But keeping risk managers or accountants or regulatorshappymeansaddressingashockthattheywouldfindplausible;whatmadethemstop finding it plausible at just themoment the protection could no longer bepurchased?Second,itisnotdifficulttofindmainstreameconomicanalysisthatvieweda
largedrop inhousingpricesasnot justplausiblebut reasonablyprobable. JustusingtheEconomistmagazineasarepresentativevoice,onefindsarticlesintheissuesofDecember9,2004(“FlimsyFoundations”);December8,2005(“HearThatHissingSound?”);andSeptember7,2006(“CheckingtheThermostat”),alltalkingaboutU.S.housepricesbeingovervaluedbyamounts ranging from20percentto50percentandalltalkingabouttheseriouspossibilityofthe“bubble

bursting.” This was not some then-unknown junior economist crying in thewilderness; this was in a prominent mainstream publication that is requiredweeklyreadingforvirtuallyeveryoneinthefinancialindustry.Andtheopinionswerebackedbydetailedstatisticalanalysisofhistoricalrelationshipsofhousingprices to rental prices and to incomes. At the same time, the Yale economistRobertShiller,alreadyprominentforthetimelyconcernshehadexpressedabouttheInternetbubbleandnotedforhisexpertiseinthefieldofhousingprices,wasquoted by David Leonhardt in the New York Times on August 21, 2005, as“arguingthat thehousingcrazeisanotherbubbledestinedtoendbadly, justaseveryotherreal-estateboomonrecordhas....Hepredictsthatpricescouldfall40percentininflation-adjustedtermsoverthenextgeneration.”Nowcertainlythereisroomfordisagreementamongeconomistsandfinancial
analysts.Someonemakingastronganddetailedargumentforagivenviewpointis no reason it can't be rejected as amost likely or even reasonably probableview.ButtorejectitasaplausibleviewIfinddisingenuous.Myguesswouldbethat it is far more likely that risk managers were buying into a whollyunsupportableviewof the liquidityof the super-seniors, as documented in thepreceding subsection. And if you are treating super-seniors as liquid, then ofcourseadropof40percentinhousingpricesoverthenextgenerationisnoneofyourconcernsinceyouonlyneedtobeworriedaboutwhatmightbereflectedinthemarketoveraperiodofafewweeks.
5.2.5.8InadequateAnalysisofStatisticalHedgingFaced with the inability to fully eliminate super-senior exposure, someinvestment banks very sensibly began seekingmore liquid hedges that wouldeliminateatleastsomeoftheexposure.Thequestionisnotwhetherthiswasaprudent strategy (it was), but whether risk managers adequately analyzed theresulting risk.Onecase inwhich theyconspicuouslydidnotdo so is atUBS.Section 4.2.3 of UBS (2008) states that the Amplified Mortgage Portfolio(AMPS)consistedofsuper-seniorpositions“wheretheriskoflosswasinitiallyhedgedthroughthepurchaseofprotectiononaportionofthenominalposition... . This level of hedging was based on statistical analyses of historical pricemovements that indicated that such protection was sufficient to protect UBSfrom any losses on the position.” In Section 6.2.3, the report states that oncehedged throughAMPS trades, thesuper-seniorpositionswereconsidered fullyhedged and therefore did not appear in either VaR or stress test reports. Thereport further notes, in Section 6.3.6.1, that even though an internal audit had
“identified certain risks in theSubprime trading books, senior risk control didnotappeartotakethoseissuesintoaccountwhenconcludingthatpositionswerehedged.”Togetabetterunderstandingofstatisticalhedging,weneedtoaddjustabitof
complexitytothebasicpicturewehavepaintedoftradinginmortgageCDOs.Inaddition to the tranches that were based on dividing up actual pools ofmortgages,somesynthetictranchesbasedonreferenceportfoliosbegantotrade(see Section 13.4.1 for details on synthetic tranches). To some extent, thesesynthetic tranches were just side bets between investors who wanted to sellprotectiononmezzaninetranches(thevastmajority)andafewinvestorslookingtobuyprotection,eitherasanoffsettoprevioussalesorbecauseofabeliefthatmortgage defaults were going to exceed market expectations. The investmentbanks'involvementwiththesesidebetswouldhavebeenthatofmarketmakerinareasonablyliquidmarket.Buttosomeextent,thesesynthetictranchesofferedan opportunity to investment banks looking to reduce their exposures tomortgagetranches.AnentertainingandinformativebookfocusedonthemarketforsynthetictranchesofsubprimemortgagesisLewis(2011).Lewisprovidesadetailednarrativeoftherolethesesynthetictranchesplayedingeneratinglargeprofitsbyhedgefundmanagers,suchasJohnPaulsonandSteveEisman,aswellas traders for investment banks, such asDeutscheBank'sGregLippmann, onbetsthatmortgagedefaultswouldexceedexpectations.Thesamemarketfundamentalsdrovethismarketasdrovethemarketforpool
tranches,namelythestronginvestordemandforsellingprotectiononmezzaninetranches and little interest in either equity or super-senior tranches. So thesynthetic tranches did not offer a direct offset to warehoused super-seniorexposure.But synthetic tranches didmake it possible for investment banks tobuymore protectiononmezzanine tranches than theyhad created through thepool tranching process. So they could consider offsetting some of their super-senior position in a particular portfolio by buying mezzanine protection on areferenceportfolioeitheridenticaltoorcloselyrelatedtotheportfoliothesuper-seniorswereexposedto.Here'swherethestatisticalanalysiscamein:Whatwasthebestdollarvolumeofamezzanine tranche tobuyprotectionon tohedgeagivenvolumeofsuper-seniortranche,andjusthowlargewastheriskoffset?As you would expect from the large difference between hedging against
changes in credit spread and hedging against changes in default exposure,illustratedinSection13.1.2.2,therewasgoingtobealargeresidualriskinsomedirection.Andgiventhatitwouldhavebeenprohibitivelyexpensivetopurchase
truedefault protection for super-seniors usingmezzanine tranches, you canbecertain that thehedgesactuallyemployedwereprimarilyhedgesagainstcreditspread movement, not against default. This highlights just how misleading itwas, and how easy it should have been to spot the error of UBS treatingstatistical hedges as fully eliminating risk. Even in the farmore liquid vanillaoptionsmarket,noonetreatspositionsthatare“neutralintheGreeks”ashavingnoresidualrisk(seeSection11.4,particularlythediscussionofTable11.6).
5.2.5.9TooBigtoFailFinally,thereisthequestionofwhy,leavingasideanyprobabilisticanalysisofrisk,thesheersizeofthepositionsdidn'ttriggeralarms.Letmeofferananalogydirectlyfrommyownexperience.Duringthelate1990s,Iwasinchargeofriskmanagement forChase's derivatives business.A very conspicuous part of thatbusinesswasthenew,rapidlygrowing,andveryprofitableCDObusiness,basedon commercial loans, not residential mortgages. But like the residentialmortgageCDOsofthemid-2000sdecade,thecommercialloanCDOsofthelate1990swerestartingtorunintoanaccumulationofsuper-seniorriskthatthebankwas finding difficult to buy protection on.While I was, whether correctly orincorrectly,quiteconvincedthattheprobabilityoflossonthissuper-seniorriskwasextremelylow,makingpresentationstothefirm'sriskcommitteesupportingthis view, I was just as strong in my opposition to the continued buildup ofsuper-seniorriskonthefirm'sbooks.Eventhoughlimitationsonthegrowthofsuper-seniorsultimatelymeant limitationson thegrowthof theveryprofitableCDO business as a whole (for reasons similar to those discussed earlier formortgage CDOs), the skeptical views of me and my similarly minded riskmanagement colleagues prevailed. Super-seniors were piling on exposure towhatwasalreadythefirm's largestvulnerabilityasamajorcommercial lender,exposure to a drastic economicdownturn.Nomatter how remote a possibilitywe might have regarded such a downturn, it was not a scenario we couldcompletely dismiss. Tett (2009, 65–66) reports a similar decision-makingprocess around the same time at JPMorgan, prior to the merger with Chase.While all anecdotal recollections of past risk management triumphs, perhapsincluding my own, should be taken with a grain of salt, what I saw ofJPMorgan'sexposuresgoingintothemergerwereconsistentwithTett'saccount.Arguments were offered by a few front-office people at the time of this
decision that “in the case of that drastic an economic downturn, the firmwillneedtoberescuedbytheFederalReserveanyway,sowhatdifferencedoesthe

size of the rescue make?” These arguments were considered wholly withoutmeritbybothriskmanagersandseniormanagement.Butonewondersifperhapsthiskindofviewwasbehindsomeofthedecisionmakingin2005–2007.In the wake of the 2007–2008 collapse, suspicions have certainly been
expressed that this confidence that regulators and the government owned thedownside on big bets was explicitly or implicitly part of the calculation thatdrove the CDO-creation machine past reasonable limits. “Moral hazard,”“Greenspan put,” and “too big to fail” have all become part of the commonvocabularyusedinthepostmortemanalysesofthesedecisions(see,forexample,FCIR2011,57,61,341,356).Itiscertainlyinlinewiththemoralhazardstorywe told in Section 2.1. And the greater the belief that your firm's outrageouspositionsarenotoutof linewith theoutrageouspositionsofyourcompetitors,thegreaterthetendencyforargumentsbasedonultimateregulatorrescuetogaintraction.Theusualcounterof thosewhofind theseargumentsspecious, leavingaside
considerations ofmorality thatmight not be shared by all discussants, can besummedupinawell-circulated,butpresumablyapocryphal,storythatgoesbackatleasttothe1970s.Inthisstory,theCEOofalargecommercialbankattendinganindustryconferencefindshimselfatamen'sroomurinalnexttothecrotchetyandbrusquechairmanof theFederalReserve (in thosedays, allFedchairmenwere expected to be crotchety and brusque—and male). Looking around andseeingnooneelseintheroom,hewhisperstothechairman,“Justbetweenus,would theFedcome toour rescue inacrisis?”Thechairman,without lookingup,responds,“ThatisaquestionIwouldneedtodiscusswithyoursuccessor.”Themoralofthestoryissupposedtobethatthepenaltiesforputtingyourfirm
in the position of being rescued are personally severe.And certainly one seesevidenceof theregulatorsattemptingtoenforce this,goingoutof theirwaytodemandthatthepriceJPMorganpaidforBearStearnswaspunitivetotheBearStearnsstockholders,whichincludedmostofthefirm'slongtimeemployees(seeMcLeanandNocera2010,347).Andthoseofuswhofoughtagainsta“toobigto fail” mentality can point to the benefits to firms like Goldman Sachs,JPMorgan, and Deutsche Bank, whose need for government assistance wasmuch less pronounced than Citigroup or Merrill Lynch or UBS. But in themodern era of outsized compensation for senior executives and star traders,which may include so-called golden parachutes protecting them against thepersonalconsequencesoffailure,isthegovernmentownershipofthedownsidebecomingtoogreatatemptationforrisktakers?
5.2.6InsurersComparedtothevoluminousliteratureabouttheinvestmentbanksintheCDOmeltdown,farlesshasbeenwrittenabouttheinsurancecompanieswhosesaleofprotection for super-senior tranches led to thedestructionof valuable businessfranchises.Andwhathasbeenwrittenabouttheinsurancecompaniesismostlyfromthestandpointoftheerrorsinvestmentbanksmadeintheirrelianceonthisinsurance.MyprimarysourceforwhatfollowsisFCIR(2011),whichaddressesAIG on pages 139–142, 200–202, 243–244, 265–274, 344–352, and 376–379andthemonolineinsurancecompaniesonpages204–206and276–278.For the most part, these insurance companies appear to have regarded the
super-senior tranches of subprime mortgage CDOs as being virtually withoutrisk of loss. Their analysis can therefore be subject to the same criticalexaminationwehavejustbeenthroughintheprevioussectionfortheinvestmentbanks.Butthereisonemajordifference:Theinvestmentbankspossessedsomegenuine expertise in evaluation and modeling of subprime mortgages and ofCDOstructures.Theinsurancecompaniespossessednoneofthisexpertiseandjust relied on analysis by the investment banks and rating agencies for theirassurancethatriskoflosswaspracticallynonexistent.AtellingquotecomesfromAlanRoseman,CEOofACAInsurance,oneofthe
monoline insurers: “We were providing hedges on market volatility toinstitutional counterparties. . . .Wewere positioned, we believed, to take thevolatilitybecausewedidn'thavetopostcollateralagainstthechangesinmarketvalue to our counterparty . . . [and]wewere told by the ratings agencies thatratedusthatmark-to-marketvariations[were]notimportanttoourrating,fromafinancialstrengthpointofviewattheinsurancecompany”(FCIR2011,276).Ifthis attitudewas typical, then the insurerswere operating on the premise thattherewasnogenuineriskoflossonthesuper-seniors,justannoyingfluctuationsin mark-to-market accounting, presumably due to technical liquidity factors.This viewwould see the insurers collecting a fee for providing an accountingarbitrageasopposed tobeingpaid forabsorbing risk (theaccountingarbitragewouldarisefromanuninsuredsuper-seniorholdingataninvestmentbankbeingsubjecttomark-to-marketearningsfluctuations;onceinsured,itwouldnolongerneed to be marked to market and the insurers did not have mark-to-marketaccounting).Ifyouarejustbeingpaidforanaccountingarbitrage,thenyoudon'trequireanyexpertiseinassessingrisk,justaknowledgeofaccountingrules.Whiletheevidenceforhowtypicalthisviewwasisnotclear,itcertainlydoes

appearthatlittleconcernwasshownbyanyoftheinsurersinvolvedformakingtheirownassessmentofcreditrisk.Theonlyoneoftheseinsurersthatdidbeginto showsomeconcernabout thevolumeofexposure theywere takingonwasAIG(FCIR2011,200–201),butitsslowdownintakingonCDOriskstillleftitholding $79 billion in CDO exposure. MBIA, Inc., another of the monolineinsurers,stated,accordingtoNorris(2009),that“‘theduediligencestandardfora monoline insurer, which MBIA followed,' did not involve looking into thequalityofthesecuritiesunderlyingthesecuritiesbeinginsured. . . itprimarilyreliedontheassurancesbyMerrillLynchandthecreditratingsofMoody'sandStandard&Poor's.”WhilethiswaspartofanMBIAsuitbroughtagainstMerrillLynchandsomightbeexpectedtoexaggerateMBIA'slackofsophistication,itisstillrevealingthatsuchaclaimwouldbeevenplausiblerelativetoabusinesslineinwhichtheinsurershadbettheirentirefranchises.
5.3THESPREADOFTHECRISISThecrisisthatbeganinthesubprimemortgageCDOmarketspreadtomarkets,instruments, and institutions that had no direct involvement with eithermortgagesorCDOs.Therewere twoprimarypaths throughwhich thisspread:contagion through credit exposure to impacted firms, which we examine inSection 5.3.1, and contagion through market impact, which we examine inSection5.3.2.
5.3.1CreditContagionThemostdirectwayforacrisistospreadisthroughcreditexposuretoimpactedfirms.Thiswascertainlyaprimeingredientinthe2007–2008crisis.One of the major paths for credit contagion was the great extent to which
financialfirmshadlargecounterpartycreditexposuretooneanotherthroughthederivatives markets. I am not including in this the CDO-related counterpartyexposureofmanyfirmstoAIGandthemonolineinsurers,sincethiswaspartofthefundamentalprocesscreating thecrisis.Butmanyfirmsthatmayhavehadno dealings in CDOs had heavy exposure to firms that did have large CDOlosses on other derivative contracts such as interest rate and foreign exchangeswaps.And thiswas a decidedworry for regulators, as they had to decide onhow to handle firms approaching bankruptcy.One can see in the reporting onregulators'decisionsduring thisperiod justhowbigaworry thiswas (see, forexample, FCIR 2011, 291, 329). Some contracts would not be backed by

collateral and would result in outright loss; even where there was collateral,there would still be losses resulting from the market impact of so manycounterparties simultaneously rushing to sell the collateral and to replace thedefaultedderivativespositions.Notonlydidregulatorsneedtoworryaboutthedirectimpactonderivativescounterpartiesofadefault,buttheyalsohadtobeconcerned about the potential freezing of derivatives markets as worry aboutdefaultswouldcause reluctance toenter intonewcontracts.This in turncouldworsen the situation for counterparties of a defaulting firm, since they mighthave difficulty finding a replacement for a defaulted derivative contract,exacerbatingtheoriginalloss.Thebankruptcyofonefirmmightthendriveotherfirmsintobankruptcyinaneverwideningcircle.It is easy to understand the frustration of regulators at being placed in this
position.Derivatives tradinghadoriginally been almost exclusively conductedon exchanges that had well-developed procedures for minimizing creditexposure.Amajor argument of large investment banks in setting up over-the-counter derivativesmarkets as alternatives to exchange-traded derivativeswasthattheyhadthecreditsystemsandexpertisethatwerecapableofmanagingtheextracredit risk thatwouldarise.Butnowtheyhadapparentlydonesopoorajob ofmanaging this that they needed to be bailed out by regulators, and thisonly a decade after theLong-TermCapitalManagement crisis had supposedlyled to reforms in counterparty creditmanagement (seeSection4.2.1).Anothermajorpathforcreditcontagionwasthroughfinancialfirmsthathadmadedirectloans to firms whose CDO positions threatened them with bankruptcy. Thisdirect lending was primarily in very short maturity instruments, such ascommercial paper. Because of the short maturity and the previous soundfinancialstatusofmajorfinancialfirms,thispaperwasveryhighlyratedbytheratingagenciesandwassupposed tobeaverysafe investment.Moneymarketmutualfundsthatboughtadiverseportfolioofthispaperwereconsiderednearlyassoundasgovernment-guaranteedbankdeposits,andregulatorsworriedabouttheimpactonsmallinvestorsifdefaultsoncommercialpaperdrovebigmoneymarket funds to thepointof“breaking thebuck,” that is,nothavingsufficientfunds to pay back investors' principal. This, too, was a major concern forregulators as they considered how to dealwith firms close to bankruptcy (seeSorkin2010,Chapter17).
5.3.2MarketContagion
Ifyou lookatTable13.6,youwillsee thenormalcyclicpatternofdefaultsofcorporate borrowers. Lending institutions have survived this cyclic pattern fordecades,buildingupreservesandcapitalduringtimesoflowdefaultsthatcanbeused as a buffer against times of higher defaults. But providing credit is abusiness that requires patience—on the part of bank management, of bankregulators,andofthosewhoinvestinbanks.Whendefaultsstartoccurringatanacceleratedpace,bankswillstartcuttingbackonthevolumeofnewloans,buttheywon'tstartpanickingandtryingtoselloff largeblocksof theirremainingloans.Credit derivatives, such as credit default swaps and CDOs, brought the
promise of increased liquidity to the business of bank lending. When usedreasonably, these instrumentscanbepartofablendedstrategy, inwhichsomeportionsoftheloanportfolioarejudgedliquidandmanagedaccordinglywhileother portions continue to be viewed as illiquid,with amanagement approachthat matches their lack of liquidity. Chapter 13 of this book, and particularlySection13.3,outlineswhatIconsideranappropriateblendoftoolsformanagingaportfoliothatcontainsbothliquidandilliquidcreditexposure.ByfalselylabelingallofthesubprimemortgageCDOsasliquidintheirdesire
to obtain more favorable regulatory capital treatment, the investment bankscreated a dilemma. When falling housing prices started to threaten wideningdefaultsontheseCDOs,therewasnocushionofreservesorcapitaltoallowforpatience, as would have been the case if a large portion had properly beenlabeledilliquid.Andtheaccountingforliquidinstrumentsmeantthatbankshadto recognize earnings losses immediately through mark-to-market accountingand therefore needed to immediately take action to get capital ratios back toallowablelevels,sinceearningsgainsandlossesimmediatelyimpactcapital.When a truly liquid position suffers a mark-to-market loss that requires an
increase in capital, there is a readily available remedy: sell someof the liquidposition to reduce the need for capital and also reduce a possible source offurther losses requiring capital. This is whymark-to-market accounting, stop-losslimits,andcapitalallocationsdesignedtoallowliquidationofpositionsovera temporaryperiodof illiquidity fit sowellwith liquidpositions (discussed atgreater length in Section 6.1.1). But if you have been only pretending that apositionisliquid,youdon'thavethisoption.Sincelargelossesusuallyoccurinperiodsofeconomicstress,whenraisingnewcapitalfrominvestorsisdifficultand costly, your only remaining choice is selling other positions that truly areliquidtoreducetheneedforcapital.Butthatdoesn'tgettheilliquidpositionsoff

yourbooks,andiftheycontinuetolosemoney,youwillneedtogothroughthiscyclealloveragain.Thisisasketchofhowlossesonilliquidpositionstreatedasliquid can spread a crisis to other markets by continued forced selling ofpositionsthatwerenotrelatedtotheilliquidpositions.This is roughly what occurred during the 2007–2008 period, but it was
exacerbatedbytherealizationthatpositionsthathadbeenlabeledasliquidandasvirtuallyimmunetolosseswereinfactveryvulnerable.Thisraisedthelevelofsuspicioninthemarketsaboutanyassetorderivativethatmightconceivablyhavesometypeofhiddenrisk.Thiswasanotherfactor indrivingdownpricesanddryingupliquidityinothermarkets(see,forexample,Greenlawetal.2008,Section2.1).The full mechanics through which depressed asset values lead to market
contagion, with many illustrations from the 2007–2008 crisis, are covered inmoredetailinDuffie(2011,Chapter3).ThediscussionofthisinBrunnermeier(2009,92–94)isalsouseful.
5.4LESSONSFROMTHECRISISFORRISKMANAGERS
My numbering of subsections is designed to allow easy reference to thediscussionofthemechanicsofthecrisisinSections5.2and5.3.Sections5.4.1through 5.4.6 correspond to sections 5.2.1 through 5.2.6, respectively, whileSection 5.4.7 corresponds to Section 5.3.1, and Section 5.4.8 corresponds toSection5.3.2.
5.4.1SubprimeMortgageOriginatorsFrom the viewpoint of internal risk management, the lessons of the crisisregardingbothsubprimemortgageoriginatorsandCDOcreatorscenteronissuesof legal and reputational risk.Thesenonquantitativeareasof riskmanagementdonotalignwiththefocusofthisbook,whichisonrisksthatcanbemanagedthroughliquidmarkets.Thecomments thatIdohaveonlegalandreputationalriskcanbefoundinChapters3and4,particularlySections3.2.2and3.3.
5.4.2CDOCreatorsMy comments forCDO creators are identical to those for subprimemortgage

originatorsinSection5.4.1.
5.4.3RatingAgenciesKeyriskmanagementlessonsthatarereinforcedbytheratingagencyexperienceleadinguptothecrisisaretheneedforastrongseparationbetweenmodelsusedfor riskmanagementand input from tradersandstructurers (seeSection8.4.3)andtheneedtohavedataanalysisberesponsivetolargechangesinthemarketenvironment(seeSection8.2.8.2).
5.4.4InvestorsThekeyriskmanagementlessonwecandrawfromtheexperienceofinvestorsis theneed forextremeskepticism in lookingatmarketingclaims thatyouaregettingsuperiorreturnswithouttakingonadditionalrisk,particularlywhenyourability to exit trades is limitedby illiquidity.Thispoint isdiscussedat greaterlengthwhenlookingat theexperienceof insurers inSection5.4.6—everythingsaidtherecanbeappliedhere.
5.4.5InvestmentBanksThe numbering of these subsections has been designed to correspond to therelateddiscussioninSections5.2.5.1through5.2.5.9.
5.4.5.1RelianceonInadequateDerivativesProtectionThe tools needed to analyze the risk of uncollateralized and weaklycollateralized derivatives protection were well known both in the academicliterature and in commonpracticewell before these transactionswerebooked.First, evenwell-collateralized protection of illiquid transactions leaves a greatdealofremainingrisk,sinceintheeventofcounterpartydefaultyoumayhavegreat difficulty in finding a substitute insurance provider (see the bullet pointregarding derivatives with actuarial risk in Section 14.3.3). Second, lack ofcollateralizationorweakcollateralizationneeds tobepartof thecalculationofcounterpartycredit risk,asemphasized throughoutSection14.3.3.Third, thesetrades were classical examples of wrong-way risk, since the circumstances inwhich the counterparties would need to make insurance payments would bemajor economic downturns likely to impact the creditworthiness of thecounterparties themselves. These trades were also wrong-way because it was

wellknownthattheinsurancefirmsenteringintothemwereenteringintomanybillions of dollars of similar trades with other investment banks; thecircumstances thatwouldcause them tohave topayonone tradewerehighlylikely to make them pay on similar trades, and they clearly did not have thefinancial resources tomakepaymentsunderallof thesecontracts(thispoint isfurther elaborated in Section 5.2.6). See Section 14.3.4 for a discussion ofwrong-wayriskandhowtoaccountforitincalculationsofcounterpartycreditrisk. Indeed, some of these trades border on being the types of transactionsSection14.3.4discussesasbeingsowrong-waythattheyshouldbecountedasofferingnoprotectionatall—lookatthediscussionof“endoftheworld”tradesandextremecollateralizationtriggers.
5.4.5.2RelianceonOff-Balance-SheetVehiclesTheproperriskmeasurementofliquidityputsisverysimilartothemeasurementofwrong-waycounterpartyriskandisaddressedinSection14.3.4.
5.4.5.3UseofFaultyCDOModelsTheonlypointonwhichIwouldfaulttheuseofCDOmodelswasthattherewastoo much emphasis on fitting market input and not enough emphasis onmodelingthattookintoaccounttheilliquidityofcertainsectors,particularlythesuper-seniorsector.Section8.4addressesmodelriskfor illiquidinstruments ingeneral, andSection13.4addresses this issue specificallyas it relates toCDOtranches.
5.4.5.4RelianceonExternalRatingsInSection13.2.1.1wediscusstheproperuseofratingagencyinputintheriskevaluations of a bank. Rating agency evaluations should always be used as acheckoninternalassessments,butneverasareplacementforthem.Thisshouldapplyjustasmuchtocreditriskarisingthroughsecuritiesholdingsasitdoestocredit risk arising through traditional bank loans. By similar reasoning, riskmanagersshouldalwaysrelyontheirowninternalmodelsofcreditportfolioriskand not on rating agency models. The credit portfolio models developed toassessbank loans,discussed inSection13.3, areexactly the samemodels thatareused toevaluateCDOs,as ismadeclear inSection13.4. In fact, theCDOmodelsweresimplyadaptedfrompreexistingloanportfoliomodels.

5.4.5.5OverrelianceonVaRMeasuresAsismadeclearinSections6.1.2and8.2.6,VaRcanplayaproperroleintheriskmanagementofilliquidinstruments,aslongasitisclearlyunderstoodthatwhat is being represented in the VaR is a liquid proxy and that a separateanalysisof thehedgingriskof theilliquidinstrumentbytheliquidproxyisanabsolutenecessity.
5.4.5.6FailingtoAccountfortheIlliquidityofSuper-SeniorTranchesOne point that is stressed several times in this book is that risk managementmeasures must be arrived at independently, without deference to the wayaccountingisdoneforinternalbusinessdecisionsorforreportingtothepublic.Riskmanagersneedtoconfirmclaimsofliquidityforaninstrumentbylookingattradinghistory(bothpurchasesandsales),asemphasizedinthelastparagraphof Section 6.1.2. Risk calculations and stress test scenarios for super-seniorsrequired long-term (life of the security) thinkingbasedon the lackof a liquidmarket.As is emphasized inSection 8.4, illiquid assets require long-term riskmeasures,evenwhenaccountingprinciplesinsistonmark-to-markettreatment.
5.4.5.7InadequateStressTestsThe key point here is that the illiquidity of the positions required longer-termstresstestsofthetypediscussedinSections8.4.3,13.3.2,and13.4.3.
5.4.5.8InadequateAnalysisofStatisticalHedgingAs discussed in detail in Sections 8.2.6 and 8.4, when dealing with illiquidinstrumentsitisvitalthatriskmeasuresandreservesutilizedetailedsimulationsof potential hedging costs over the life of the instrument to arrive at aconservativeestimate.ThespecificcaseofhedgingilliquidCDOtrancheswithmoreliquidCDOtranchesisdiscussedinSection13.4.3.
5.4.5.9TooBigtoFailRisk managers should be vigilant in arguing against reasoning that relies onindifference to the size of losses in the event of serious economic downturns.However,manypeoplemotivatedbythisreasoningwillnotarticulateitbutwill

lookforotherargumentsthatwilldisguisetheirtrueincentives.Oneoutcomeofthe crisis is to recognize that thedesignof trader and executive compensationschemes has an important risk management component. See, for example,Turner Review (2009, 79): “In the past neither the FSA [the British bankregulator] nor bank regulators in other countries paid significant attention toremunerations structures. And within firms, little attention was paid to theimplicationsofincentivestructuresforrisktaking,asagainsttheimplicationsforfirmcompetitivenessinthelabourmarketandforfirmprofitability.Inretrospectthislackoffocus,bybothfirmsandregulators,wasamistake.Thereisastrongprima facie case that inappropriate incentive structures played a role inencouraging behaviour which contributed to the financial crisis.” See alsoFinancialStabilityForum(2008,RecommendationII.19).Towhatdegreethisisworkableinpracticeremainstobeseen.Muchoftheburdenforpropercontrolson asymmetric incentives will probably rest with government legislation andregulation,aswewillinvestigatemorecloselyinSection5.5.5.
5.4.6InsurersThekeyriskmanagement lessonwecangainfromtheexperienceofAIGandthemonolineinsurersissimilartothelessonwecantakefromtheexperienceofinvestors—theneedforextremecautionintakingonilliquidrisksinanareainwhichyoulackexpertise.Thislessonisevenmorepointedfortheinsurers,sincethey took on levels of risk that destroyed their franchises, something that fewinvestorsdid.Asweemphasized inSection2.3onadverseselection, riskmanagersshould
alwaysbeespeciallyvigilantwhentradersaredealingintransactionsforwhichtheydonotpossessaninformationaladvantage.Thetemptationtogetinvolvedmaybegreatwhenaplausiblecasehasbeenmadethatreturnsarehighrelativeto risk,butevenwhen thiscaseseemsoverwhelming, thesizeof riskmustbekept proportional to liquidity. The riskmanager's greatest friend is always thestop-loss limit, asdiscussed inSection6.1.1.Even for risks that the firmdoesnotunderstandwell,alimitcanbeplacedontolerablelossesandanexitstrategyplanned.Butwhen lackof liquiditymeansyouwon't be able to exit as lossesmount, no degree of promised return should be allowed to jeopardize a firm'sfranchise. If anopportunity just seems toogood to pass up, then invest in theexpertise to manage it knowledgeably. Relying on regulatory constraints oradvisory services, such as rating agencies, cannot be considered in anyway a
substituteforthisexpertisewhenilliquiditypreventseasyexit.
5.4.7CreditContagionMostoftheideasforreducingtheriskofcreditcontagionarebeingaddressedatthe regulatory level and are covered in Section 5.5.7. Chapter 14 addressescounterpartycreditriskmanagementatthelevelofthefirm.
5.4.8MarketContagionThe2007–2008experienceonthedegreetowhichmarketilliquidityspreadandthelengthanddepthofthisilliquiditywillneedtoimpactthehistoricalmeasuresofVaRrisk(Section7.1)andtheseverityofstresstests(Section7.2)thatwillbeutilizedgoingforward.
5.5LESSONSFROMTHECRISISFORREGULATORS
The numbering of subsections, as in Section 5.4, is designed to allow easyreferencetothediscussionofthemechanicsofthecrisisinSections5.2and5.3.Sections 5.5.1 through 5.5.6 correspond to Sections 5.2.1 through 5.2.6,respectively,whileSection5.5.7correspondstoSection5.3.1,andSection5.5.8correspondstoSection5.3.2.Throughout this section, I have relied as much as possible on
recommendations from the Financial Stability Board and its predecessororganization,theFinancialStabilityForum.ThisorganizationisajointeffortoffinanceministersandcentralbankersfromtheG-20countries,aswellasmajorglobal public institutions such as the InternationalMonetary Fund, theWorldBank, and the Bank for International Settlements. It was established tocoordinate financial regulation and standards setting globally. Many of itsrecommendations carry the endorsement of theG-20, the group of 20 leadingeconomies that account for over 80 percent of global gross domestic product(GDP).TheG-20fosterscooperationandconsultationonmattersrelatingtotheinternational financial system. As such, I believe it represents the broadestconsensusviewsof the regulatorycommunity.TheFinancialStabilityForum's2008 recommendations for enhancingmarket and institutional stabilitywill bereferredtoasFSF(2008).Iwillbringinviewsofotherregulatorybodiesandofacademics where there are significant disagreements or where a particular
document has expressed a view with particular clarity. Two sources that thissection utilizes often are the Turner Review of 2009, a broad review ofregulatorypolicyauthorizedbytheBritishgovernment,andthe2009reportonfinancial reform by theGroup of Thirty, the same private, nonprofit group ofleading representatives of the international business, regulatory, and academiccommunitieswhoseinfluentialreportonderivativesrisksImakeheavyuseofinSection6.1.1.
5.5.1MortgageOriginatorsThere has not been as much focus on mortgage originators in therecommendationsarisingfromthecrisisastherehasbeenonCDOcreatorsandrating agencies. Davidson (2007) does have a persuasive suggestion: “Thereneeds to be capital at the origination end of the process. Without capital,representations and warranties have no value. To achieve this, brokers (orwhoever has direct contactwith the borrower) should be licensed and bondedandfirmsinthechainofrepsandwarrantsneedtomaintainsufficientreservesto support their financial promises. This capital would be available to assessdamagesinthecaseoffraudulentorpredatorypracticesthathurtborrowersandhomeowners.”Oneotherinterestingrecommendationistorestructuremortgagestoavoidthe
impactofnegativehomeequityonhomeownerdefaults.Shiller(2008,Chapter6) has several interesting suggestions along this line, including real estatederivatives, home equity insurance, and continuous-workout mortgages. AmortgagemarketthatbuildsinthisprotectionexistsinDenmark.GeorgeSoros,in aWall Street Journal article on October 10, 2008, explained the Danishmortgagesasfollows:“Everymortgageisinstantlyconvertedintoasecurityofthesameamountandthetworemaininterchangeableatalltimes.Homeownerscan retire mortgages not only by paying them off, but also by buying anequivalent face amount of bonds atmarket price.Because thevalueof homesand the associated mortgage bonds tend to move in the same direction,homeownersshouldnotendupwithnegativeequityintheirhomes.Tostateitmoreclearly,ashomepricesdecline,theamountthatahomeownermustspendtoretirehismortgagedecreasesbecausehecanbuythebondsatlowerprices.”
5.5.2CDOCreatorsRecommendations have focused on trying to better align incentives between
CDO creators and investors. For example, the Group of Thirty (2009,Recommendation 13) states that “regulators should require regulated financialinstitutions to retainameaningfulportionof thecredit risk theyarepackagingintosecuritizedandotherstructuredcreditproducts.”Arequirementofthistypeis a part of both the Dodd-Frank legislation in the United States and rulesproposed by European authorities (see Global Legal Group 2011, Chapter 3:“EU and US Securitization Risk Retention and Disclosure Rules—AComparison”).Allsuchproposalsfacethreelargechallenges:
1.Howtomeasurecredit riskretentiongivenallof theways thatarenowavailable foroffsettingrisk throughcreditderivatives, including theuseofcreditindexes.2. How to avoid the situation discussed in Section 5.2.2 in which CDOcreatorsviewedthetotalpackageassolucrativethattheycouldregardtheretained equity as a “free good” to whose credit performance they wereindifferent. Proposals to deal with this are combinations of raising theportionofriskretainedandofrequiringthataportionofriskberetainedinalltranchessold,notjustinasingletranchewhoselossesmightnotbewellcorrelatedwiththetranchessold.3. How to avoid making retention requirements so onerous that theydiscourageorraisethecostsofsecuritizationthatisconsideredbeneficialtothegeneralpublic(e.g.,homeowners).
5.5.3RatingAgenciesFSF(2008,SectionIV)containsseveralproposalstodealwiththeratingagencyissuesthatwereraisedbythecrisis.Iwouldhighlightthefollowing:
Ratingagencies“shouldclearlydifferentiate,eitherwithadifferentratingscaleorwithadditionalsymbols,theratingsusedforstructuredproductsfromthoseforcorporatebonds.”Thiswouldclarifythegreaterrelianceofstructuredproductratingsonmodelsandeconomicassumptionsandtheir“potentialforsignificantlyhigherratingsvolatility.”Ratingagencies“shouldenhancetheirreviewofthequalityofthedatainputandoftheduediligenceperformedonunderlyingassetsbyoriginators,arrangersandissuersinvolvedinstructuredproducts.”Regulatoryauthoritiesshould“reviewtheiruseofratingsintheregulatoryandsupervisoryframework”toencourageinvestorsto“makeindependentjudgmentofrisksandperformtheirownduediligence”andreduce
“uncriticalrelianceoncreditratingsasasubstituteforthatindependentevaluation.”“Investorassociationsshouldconsiderdevelopingstandardsofduediligenceandcreditanalysisforinvestinginstructuredproducts.”Ratingagenciesshouldrevisetheircodesofconducttobetterdealwithconflictofinterestissuesand“demonstratethattheyhavetheabilitytomaintainthequalityoftheirserviceinthefaceofrapidexpansionoftheiractivities.”Ratingagencies“shoulddisclosepastratingsinamoresystematicway,andimprovethecomparabilityoftheirtrackrecords.”
Many of these points are echoed in the Group of Thirty (2009,Recommendation14)andRichardsonandWhite(2009).RichardsonandWhitealso suggest as an alternative that financial regulations be changed todeemphasize the use of rating agencies. In this approach, “regulated financialinstitutionswouldthusbefreetotakeadvicefromsourcesthattheyconsideredtobemostreliable—basedonthetrackrecordoftheadvisor,thebusinessmodelof the advisor (including the possibilities of conflicts of interest), the otheractivitiesoftheadvisor(whichmightposepotentialconflicts),andanythingelsetheinstitutionconsideredrelevant.”But“theinstitutionwouldhavetojustifyitschoice of advisor to its regulator.” This alternative could lead to morecompetitionandnewapproachesintheratingsadvisorymarket.
5.5.4InvestorsMost regulatory discussion concerning investors has been tied to protectinginvestorsfromCDOcreatorsandratingagenciesortocontrollingthespreadoffinancialcrises throughcredit contagionormarketcontagion.These issuesareaddressed inother sections—5.5.2 forCDOcreators,5.5.3 for ratingagencies,5.5.7forcreditcontagion,and5.5.8formarketcontagion.One attempt to address regulatory concerns for investors directly is in the
Squam Lake Report (Squam Lake Group 2010, Chapter 4: “Regulation ofRetirementSavings”).Given thatmanyof the investorswhohad losses in the2007–2008disasterwerepensionfundsreachingforexcessreturnsinexchangeforrisksthatmayhavebeenverypoorlyunderstoodbytheemployeeswhowerethe ultimate recipients of these losses, this is a timely concern. Among therecommendationsinthischapterare:
Requiringsimplestandardizeddisclosureforproductsofferedindefinedcontributionretirementplans.
Requiringsimpleandmeaningfulstandardizeddisclosureofmeasuresoflong-termriskandofinvestmentcosts.Anyadvertisementofaveragepriorreturnsshouldalsoincludeastandardizedmeasureofuncertainty.Thestandardpartofadefinedcontributionplanshouldberestrictedtowell-diversifiedproductswithlowfees.
5.5.5InvestmentBanksThe regulatory responses to the default and near default of several majorinvestment banks in the 2007–2008 crisis can be roughly divided into fourcategories. The first consists ofmeasures to require tightening of internal riskmanagementprocedures,combinedwithgreaterscrutinyoftheseproceduresbyregulatory authorities. The second is a new focus on regulatory oversight ofcompensation policy. The third is significantly higher requirements for bankcapital to serve as a buffer against losses before they impact depositors, andtherefore governments and taxpayers. And the fourth consists of proposedrestrictionsonthesizeandrangeofactivitiesofinvestmentbanks.Weconsidereachinturn.
5.5.5.1TightenedInternalRiskManagementProceduresIt is natural for part of the regulatory response to the crisis to be to call forstronger internal risk management procedures within investment banks. Butwithouteitherveryspecificguidanceonhowproceduresshouldchangeornewongoing regulatory scrutiny to ensure compliance, this will just be emptyexhortation.This book addresses specific regulatory guidance on particular risk
management issuesat thosepointswhere it ismost relevant:newguidanceonmodelreviewinChapter8;newguidanceonoversightofcompensationpolicylater in this section; new guidance on stress tests as part of the discussion ofincreased capital later in this section; new guidance on counterparty risk inSection 5.5.7 on stemming credit contagion; new guidance on valuation inSection 5.5.8 on stemming market contagion. This subsection addressesproposalsforincreasedregulatoryscrutinytoensurecompliance.The most comprehensive set of recommendations for changes in regulatory
scrutiny of investment bank internal controls is in theGroup ofThirty (2009)Recommendations 1, 2b, 6, 7, and 8. Some of the key points in theserecommendationsare:

Atanationallevel,countriesshould“eliminateunnecessaryoverlapsandgapsincoverage...removingthepotentialforregulatoryarbitrage,andimprovingregulatorycoordination.”TheSquamLakeReport(SquamLakeGroup2010,Chapter2)goesfurther,callingforasingleregulatoryauthorityineachcountrytobe“responsibleforoverseeingthehealthandstabilityoftheoverallfinancialsystem.”Attheinternationallevel,nationalregulatoryauthoritiesshould“bettercoordinateoversightofthelargestinternationalbankingorganizations”and“movebeyondcoordinatedrulemakingandstandardsetting”toconvergenceinapplicationandenforcementofstandardsandclosingofregulatorygaps.Incountrieswherethecentralbankisnottheprimaryregulatorofbanks,thecentralbankneedstobecomemoreinvolvedinregulation,particularlywithregardtothelargestsystemicallysignificantfirmsandcriticalpaymentandclearingsystems.
Saunders, Smith, and Walter (2009) call for a dedicated regulator in eachcountry for “large complex financial institutions (LCFIs),” arguing that thesefirmsaredifferent incharacterandposeagreater threat to theglobal financialsystemthansmallerandmorespecializedfirms.“Mostimportantly,theregulatorwould have the power and the obligation to ensure that LCFIs operateconsistentlywithpriorityattentiontotheinstitution'ssafetyandsoundness,evenifthiscanonlybeachievedatthecostofreducedgrowthandprofitability.”
5.5.5.2CompensationPolicyThe quotation from theTurnerReview (2009) in Section 5.4.5.9 indicates thechangeinregulatoryattitude towardthecompensationstructuresof investmentbanks. The 2007–2008 crisis has led regulatory authorities to switch fromregardingcompensationaspurelyaninternalmatterforbankstoregardingitasakeycomponentofriskcontrol.TheFinancialStabilityBoardissuedaseparatereport on sound compensation practices, FSF (2009b), which states that the“perverse incentives” of generous bonus payments for high short-term profits“withoutadequateregardto thelonger termrisks theyimposedontheirfirms”“amplifiedtheexcessiverisk-takingthatseverelythreatenedtheglobalfinancialsystem and left firms with fewer resources to absorb losses as risksmaterialized.”SomekeyprincipleselucidatedinFSF(2009b)are:
Compensationmusttakeintoaccountbothprofitgeneratedandriskentailed.Thefirm'sboardofdirectorsmustactivelyoverseethedesignandoperationofcompensationpolicyandmustensurethatthecompensationpolicyaddressesthebalancebetweenprofitandrisk.“Compensationmustbeadjustedforalltypesofrisk,”includingdifficult-to-measureriskssuchasliquidityriskandreputationalrisk.Thisnecessitatesthatbothquantitativemeasuresandhumanjudgmentplayaroleindeterminingriskadjustments.(Thisisconsistentwiththisbook'semphasisontheneedforsubjectivejudgmentinriskmanagement;seeSections1.3and6.1.1.)Compensationoutcomesshouldbesymmetricwithriskoutcomes,withbonusesdiminishingordisappearingintheeventofpoorfirm,divisional,orbusinessunitperformance.“Compensationpayoutschedulesmustbesensitivetothetimehorizonofrisks,”withcompensationdeferredwhenrisksarerealizedoverlongperiods.(ThisisconsistentwiththedistinctionmadeonthedifferingriskmanagementapproachesforliquidandilliquidpositionsinSection1.2and6.1.1.Themixofcashandequityincompensationalsoneedstobeconsistentwiththenatureandtimehorizonofrisksgenerated.)“Firmsshoulddiscloseclear,consistentandtimelyinformationabouttheircompensationpractices”tomakesurethatallstakeholders,includingcustomers,creditors,andregulatorsaswellasstockholders,canmakeinformeddecisions.Regulatorsmustincludereviewofcompensationpracticesaspartoftheirsupervisoryroleandbepreparedtotakepromptactionwhencompensationpracticesaredeemeddeficient.“Compensationisanincentivesystem,notsimplyamarketwage”andsomustbesubjecttoregulatoryreview.Giventhecompetitivenatureofthelabormarketforfinancialinstitutions,“Marketparticipantsarepessimisticabouttheeffectivenessofchangeunlessitisindustry-wideandglobal....Changingcompensationpracticewillbechallenging,time-consumingandinvolvematerialcosts.Therefore,intheabsenceofsustainedexternalpressure,firmsmayfailtocarrythroughonoriginallygoodintentions.Althoughsomemarketparticipantsarewaryofregulatorypressure,manybelievethatawidespreadchangeinpracticecanbeachievedonlywiththehelpofsupervisoryandregulatoryagencies,whichshouldcoordinateatthegloballevel.”
OtherregulatorypublicationsinresponsetothecrisisarequiteconsistentwithFSF(2009b).See,forexample,TurnerReview(2009,Section2.5(ii)).Clementietal.(2009)provideanacademicanalysisverysupportiveofthisapproach.TheFSF(2009b)compensationproposalsareprimarilyaimedatthosedirectly
involvedin thecreationandmanagementofriskpositions—traders,marketers,andstructurers.TheSquamLakeReport(SquamLakeGroup2010,Chapter6)suggests an interesting approach aimed at the compensation of seniormanagementoffinancialinstitutions.Since“governmentswillbailoutfinancialfirmsduringacrisis,”“thestakeholdersinfinancialfirms—executives,creditors,andshareholders—donotfacethefullcostoftheirfailure.Thisinturnincreasesthe likelihood of bank failures, the potential for systematic risk, and expectedtaxpayer costs.” Along with other measures, a “mechanism for inducingfinancialfirmstointernalizethecostsoftheiractions”wouldbeholdbacksofafixeddollar amount of compensation thatwouldbe forfeited “if the firmgoesbankrupt or receives extraordinary government assistance” over some definedfuturetimeperiod.Somefurtherpointsraisedaboutthisproposalare:
“Morefamiliarformsofdeferredcompensation,suchasstockawardsandoptions”helpalignmanagerincentiveswithstockholders'interestsbutdonotalignthemwithtaxpayers'interests.“Resignationfromthefirmshouldnotacceleratepaymentofanemployee'sholdbacks,”sincethiswould“weakentheirconcernaboutthelong-termconsequencesoftheiractions....Inthesamespirit,managersshouldnotberewardedfortakingtheirfirmsintobankruptcy.Ifafirmdeclaresbankruptcy,itsmanagersshouldreceivetheirholdbacksonlyafteritsothercreditorshavebeenmadewhole.”“[D]eferredcompensationleansagainstmanagement'sincentivetopursueriskystrategiesthatmightresultingovernmentbailouts.Similarly,ratherthanwaitforabailoutduringafinancialcrisis,themanagementofatroubledfirmwouldhaveapowerfulincentivetofindaprivatesolution,perhapsbyboostingthefirm'sliquiditytopreventarun,raisingnewcapital,orfacilitatingatakeoverbyanotherfirm.”
Rajan(2010)Chapter7andthesectionon“ReducingtheSearchforTailRisk”inChapter8offerstrongsupportingargumentsforboththeFSFandtheSquamLakeproposals.
5.5.5.3CapitalRequirements
Regulatorshavecertainlytakenmanystepssincethecrisistoraisethelevelsofcapital required. They have taken steps both to increase the level of risk-weightedassetsthatwillbecalculatedagainsttradingpositionsandtoincreasethecapitalrequiredforagivenlevelofrisk-weightedassets.AgoodsummaryofthestepstakenbytheBISisPricewaterhouseCoopers(2011),inwhichChapter4 covers increases in risk-weighted asset calculations and Chapter 3 coversincreasesincapital.Whilethedirectionoftheregulatoryresponseisclearlycorrect,thespecifics
of the approach are troubling. Though regulators have enhanced stress-testingrequirements(PricewaterhouseCoopers2011,Sections11.1and11.3),thereisnodirecttiebetweenthesestresstestsandcapitalrequirements.ItistruethatthereisnowastressedVaRcalculationthatimpactscapital(PricewaterhouseCoopers2011,Sections4.6.3.3and11.2.3),butthisjuststressesVaRparameters,aformofstresstestingthathasbeenshowntobeinadequate(seeSection7.2.1andthediscussionoftheuseofstresstestsbyLong-TermCapitalManagement(LTCM)inSection4.2.1;asIstatethere,LTCM“didrunstressversionsofVaRbasedonahigherthanhistoricallevelofcorrelations,butitisdoubtfulthatthisoffersthesamedegreeofconservatismasasetoffullyworked-throughscenarios”).What I find most troubling is that the degree of complexity of capital
computationshasgrowntothepointthatthereisgreatdangerofriskmanagersandregulatorslosingsightofthelargestriskexposuresthroughthedistractionofenlarged reporting requirements. PricewaterhouseCoopers (2011) expresses asimilar apprehension in Section 4.7: “A particular area of concern is theintroductionofmanysystemswithinthemarketriskprocess.Previouslymarketriskdepartmentshavebeen reliantonone regulatory risksystem,but theycannowhaveup to five systems tomanage.This in itself is likely to increase theoperational risk associated with market risk. Even though these measures arebeingintroducedtoensuremorecomprehensivemeasurement,theircomplexitymaycausebankstomisspositionsand,asalways,therewillbeloopholesinthesystems,hardertofindbutalsohardertocatch.”By contrast, capital requirements directly tied to stress-test scenarios would
focus management and regulatory attention in exactly the right place: on theimpactoflargemovesinmajoreconomicvariables,exactlythetypesofeventsthathaveledtotheeventsthatchallengethehealthoffinancialfirmsandofthefinancialsystem.It isthistypeofevent,significantdropsinpriceofimportantassetclasses, forwhichcapitalcushionsareneeded.Myarguments supportingthisapproachcanbefoundinSections7.2.2and7.3,particularlytowardtheend

of 7.3 where I discuss the reasons that Chase Manhattan moved to basinginternalcapitalrequirementsonstresstestsinthelate1990s.There may be two objections to basing regulatory capital on stress-test
scenarios.Thefirstisthatthelimitednumberofindividuallytailoredscenariosthatcanbeconsideredmayallowsomerisks thatavoidattractingcapital.ThiscanbedealtwitheitherbyhavingsomepartofthecapitalrequirementbasedonVaRorbyutilizingstatisticallydrivenstresstestsassupplementstoindividuallytailored ones, as described in Section 7.2.3. The second objection is theinevitable subjectivity of stress-test scenarios. Some element of subjectivity isunavoidable and, in fact,welcome, as emphasized inSections6.1.1 and7.2.2.U.S. and European regulators have had no trouble specifying stress-testscenarios in thecapitaladequacy testsmandated in thewakeof thecrisis (see,forexample,FederalReserveBoard2009).Iadvocateutilizingthesecrisistestsasaprecedentforanongoingprocess,forthefollowingreasons:
Whateverlevelofpossiblestressmarketmovecorrespondstothecapitalrequirement,therewillalwaysbesomepossibilitythatanextrememarketmovewillexceedthislevelandrequiresomeabsorptionoflossbytaxpayersonbehalfofdepositors.Sinceitistheregulatoryauthoritiesthatrepresentthetaxpayers'interests,theyshouldbetheonestodeterminethelevelofprotection.Thereareinevitabletrade-offsbetweencapitalrequirementsthataretoohighandhurteconomicactivityandcapitalrequirementsthataretoolowandcreatetoohighariskofpotentialcrisis.Itistheregulatoryauthoritiesactingonbehalfofgovernmentthatshouldbeweighingtheseconsequencesanddecidingonthecorrectbalance.Regulatoryauthoritiescouldsignaltheirwillingnesstosupportcertainmarketsinaliquiditycrunchbydifferentiatingbyinstrumentbetweenthetimeperiodsoverwhichstresstestsneedtoberun.Forexample,atwo-weekstresseventmightbeconsideredadequateforgovernmentbondandspotforeignexchangemarkets,signalinggovernmentreadinesstointervenetoquicklyrestoreliquidityinthesemarkets,butathree-monthstresseventmightberequiredforstructuredsecuritiesinwhichthegovernmentwishedtoindicatelessurgencytointervenetorestoreliquidity.Theriskmanagersofafirmshouldpossessspecializedknowledgeregardingthetradingpositionsandactivitiesofthatfirm.Thereisnoreasontothinktheywouldpossessanyspecializedexpertiseabouttheprobabilityofmacroeconomicevents,suchaslargemovesinastockindexes,governmentbondrates,orhousingprices.SoIdonotseeanycomparative

advantageargumentinfavorofhavingthesestresslevelsbesetbyfirmriskmanagementasopposedtogovernmentregulators.Whenfirmriskmanagerssetthestresslevels,thereisaninevitablecompetitivepressuretosetlevelslowertofreeupcapitalandimprovereturns.Acommonlevelsetbyregulatoryauthoritieswouldeliminatethecompetitiveadvantageafirmcouldgetbyhiringmoreoptimisticriskmanagers.Ifpoliticalpressurespreventregulatoryauthoritiesfromsettingtheselevelsonaregularbasis,Iwouldurgefinancialinstitutionstoseekawaythatacommonlevelcouldbesetbyanindustryassociation.
5.5.5.4LimitationsonSizeandAllowableActivitiesThe other regulatory proposals considered in this section, regarding tightenedrisk management procedures, capital requirements, and compensation, do notseek to fundamentally change the structure of the financial industry. Somesuggestedactionsdoaddressfundamentalstructuredirectly,tryingtoeliminatea“toobigtofail”mentalityeitherbyplacinglimitsonthesizeoffinancialfirmsorbycreatingastrongseparationbetweenfirmsthatcanengageincertaintypesofactivitiesandfirmsthatreceiveanykindofgovernmentsupport.NoproposalsofthistypewerepartoftheFSF(2008)recommendations,and
the Turner Review explicitly rejected proposals for separation of activities,stating inSection2.9 that“Itdoesnot thereforeseempractical toworkon theassumption thatwecanorshouldachieve thecomplete institutional separationof‘utilitybanks'from‘investmentbanks.'...Largecomplexbanksspanningawide range of activities are likely to remain a feature of theworld's financialsystem.”PointsinsupportofthisviewofferedbytheTurnerReview(2009)are:
AreimpositionofGlass-Steagalltypeseparationbetweencommercialandinvestmentbankingisimpractical,giventhatmanyactivitiesthatusedtobeconductedsolelybyinvestmentbanks,suchastheunderwritingofcorporatebonds,arenow“coreelementswithinanintegratedservicetocorporatecustomersinaworldwhereasignificantelementofdebtissecuritized.”Manyso-callednarrowbanksthatfocusedalmostentirelyontraditionalcommercialandretailbankingactivities,suchasNorthernRock,WashingtonMutual,andIndyMac,alsofailedduringthecrisis.Theinternationalintegrationoffinancialmarketswouldmakeitdifficulttoachievesuchaseparationwithoutabroadconsensusamonggovernments,whichisunlikelytobeachieved.

Another point in support of this view comes from Rajan (2010, 173):“Proprietary trading . . . is another activity that has come in for censure. . . .Criticsarguethatproprietarytradingisrisky.Itishardtoseethisasanimportantcauseofthecrisis:banksdidnotgetintotroublebecauseoflargelossesmadeontradingpositions.They failedbecause theyheldmortgage-backed securities tomaturity,notbecausetheytradedthem.”Rajan'sanalysisofthecausesofbankfailureinthecrisisiscertainlysupportedbySection5.2.5ofthisbook.A major proponent of at least considering fundamental changes to industry
structureistheGroupofThirty(2009),whichinitsRecommendation1proposesthat “Large, systemically importantbanking institutions shouldbe restricted inundertakingproprietaryactivities thatpresenthighrisksandseriousconflictofinterest” and states that “nationwide limits on deposit concentration should beconsidered.” It is perhaps not coincidental that the steering committee for thisreport was chaired by Paul Volcker, whose “Volcker rule” (see McLean andNocera2010,366)forthebanonmuchproprietarytradingactivitybydeposit-takingbankshasbeenoneoftheprincipallegislativeeffortsinthisdirection.Insupportofitsproposalforrestrictionsonproprietarytrading,theGroupofThirtyreportstates that“What isat issue is theextent towhich theseapproachescansensibly be combined in a single institution, and particularly in those highlyprotected banking institutions at the core of the financial system. Almostinevitably, the complexity ofmuchproprietary capitalmarket activity, and theperceived need for confidentiality in such activities, limits transparency forinvestorsandcreditorsalike.Inconcept,therisksinvolvedmightbereducedbylimiting leverage and attaching high capital standards and exceptionally closesupervision.SomemembersoftheG30feelsuchanapproachcouldbesufficienttodealwith these risks. . . .Experiencedemonstrates thatunder stress,capitaland credit resourceswill be diverted to cover losses,weakening protection ofclient interests. . . .Moreover, to theextent that theseproprietaryactivitiesarecarriedoutbyfirmssupervisedbygovernmentandprotectedfromthefullforceof potential failure, there is a strong element of unfair competitionwith ‘free-standing'institutions.”OtherproponentsoflimitsonindustrystructureareRoubiniandMihm(2011),
who advocate both limits on size (223–230) and a reimposition of a (greatlyexpanded)Glass-Steagall (230–233),andStiglitz (2010,164–168),whoquotesformerBankofEnglandgovernorMervynKing:“Ifsomebanksarethoughttobetoobigtofail...thentheyaretoobig.”Rajan(2010,169–176)providesaveryincisiveanalysisoftheseproposals.I
wouldhighlyrecommendthistoanyoneinterestedinthistopic.WhileRajanisskepticalofmostofthevalueofmostofthesesuggestions,heissympathetictothe ideaof limitingproprietary trading,notbecause itwill reduce riskofbankfailure,butbecauseoftheinherentconflictofinterestbetweenbanks'proprietarytrading and the interests of their customers.Rajan argues that “Banks that areinvolvedinmanybusinessesobtainanenormousamountofprivateinformationfrom them. This information should be used to help clients, not trade againstthem.”ButRajandoesclarifythathesupportslimitingbankproprietarytrading,not eliminating it, because “some legitimate activities, including hedging andmarketmaking,couldbehardtodistinguishfromproprietarytrading.”Myownexperience supportsRajan on this point; seemy account ofmarketmaking inSection9.1.
5.5.6InsurersFSF (2008, Recommendation II.8) calls for insurance regulators to strengthenthe regulatory and capital framework for monoline insurers in relation tostructuredcredit.
5.5.7CreditContagionIn response to the large role that counterparty credit risk on over-the-counter(OTC) derivatives played in credit contagion in the 2007–2008 crisis, it isnaturalthatamajorfocusofregulatoryconcernhasbeentoattempttominimizefuture use of OTC derivatives and increase the use of exchange-tradedderivatives. Section 14.2 will review many of the advantages that exchange-traded derivatives have relative to OTC derivatives in minimizing creditexposure:
Theeliminationofcreditexposurebetweencounterparties,withallcreditexposurecentralizedwiththeexchange(orassociatedclearinghouse).Therelativelyautomaticmechanismsformargining,postingofcollateral,andclosingoutofpositionsthatminimizethecreditexposureoftheexchange.Themutualizedsharingoftheresidualcounterpartyriskamongallmembersoftheexchange.Theeasewithwhichcounterpartiescanextinguishexistingpositions,reducingcreditexposurelevels.Thegreatertransparencyandinformation-sharingthatareencouragedbythe

exchange'slackofanymarketexposure.The Squam Lake Report (Squam Lake Group 2010, Chapter 9) does an
excellentjoboflayingouttheseargumentsconciselyinthecontextofreducingtheriskofcreditcontagioninacrisis.AparticularpointtheSquamLakeReportraisesrelativetocrisesisthattheeasewithwhichcounterpartiescanextinguishexisting positions also reduces demand for collateral, “a precious resource,especiallyduringafinancialcrisis.”Inresponsetothesearguments,regulatorybodieshavebeenhighlymotivated
to push regulated institutions in the direction of reducing their use of OTCderivatives relative to exchange-traded derivatives.While almost all observersagreethatthisisamoveintherightdirection,somecautionshavebeensoundedontwogrounds:(1)Intheprocess,someoftheadvantagestocustomersofOTCderivativesrelativetoexchange-tradedderivatives,detailedinSection14.3,willbelost,and(2)asmoretradingvolumeisfunneledtoexchanges,theexchangesmaygrow to the pointwhere theywill become a potential source of systemicriskthatcouldtriggerorexacerbateacrisis.Before looking at these warnings, let's first summarize the actions being
contemplated. InNovember 2009, theG-20 summit issued a recommendationthat“AllstandardisedOTCderivativecontractsshouldbetradedonexchangesor electronic tradingplatforms,where appropriate, and cleared through centralcounterparties by end-2012 at the latest” (seeFinancial StabilityBoard 2010).Obviouslymuchof theforceof this recommendationwill turnonexactlyhowthe word “standardised” is interpreted. In addition to those contracts that arebeingmandatedtobetradedonexchanges,powerfulincentivesarebeingputinplace to encourage the replacement of OTC derivatives by exchange-tradedderivatives, by mandating more stringent capital requirements on OTCderivatives. These actions are covered in PricewaterhouseCoopers (2011,Chapter5).Section5.3.1.7ofPricewaterhouseCoopersexplainsthat“newrulesprovide bankswith strong incentives tomove trades to a central counterpartyclearinghouse(‘CCP')withexposurestoCCPsassignedfairlylowriskweights.Tocomplementthis,the[Basel]Committeesupportsenhancedcapitalstandardsand rigorous risk management for CCPs. It has therefore specified that thefavourable treatment of exposures to CCPs applies only where the CCPcomplies”withregulatorystandards.Now let's turn to possible objections. The first is the possible loss of the
advantages of OTC derivatives over exchange-traded derivatives for somecontracts.Asdetailed inSection14.3, theseareprincipally theability tomore

closely customize OTC derivatives to client needs, less stringent operationalrequirements, and the willingness of OTC market makers to extend creditbeyondwhatexchangesoffer,alongwithoccasionalrestrictionsontradingthatdisadvantage somecustomers,mentioned inSection14.2.How theseconcernswill be dealtwith depends verymuch on implementation. For example, if theterm “standardised” in theG-20 recommendation of the previous paragraph isinterpreted narrowly, it will not hamper customizationmuch, but will leave asubstantialportionofOTCderivativesoutsideclearinghouses.Thesecondpossibleobjectionisthatconcentratingmorederivativestradingin
exchangeswill increase the risk that the exchanges themselveswill become apotential source of systemic risk. The clearest exposition of this argument iscontainedinPirrong(2011).Whileexchangeshavewell-developedmechanismsfor containing credit risk, these are not perfect.As explained in Section 14.2,exchanges are exposed to counterparty risk in betweenmargin calls, and theirprotectionagainstthisismuchthesametypeofVaRandstress-testcalculationsthat have failed to prevent banks frombeing a source of systemic risk.Whileexchangeshaveavoidedexposuretotheilliquidinstrumentsthathavefrequentlybeen the source of problems for banks, this has been achieved by limitingexchange trading to themost liquid contracts; the price of concentratingmorederivatives trading in exchangesmay be to expose exchanges tomore illiquidinstruments.Abalancedapproachtothetrade-offbetweenreductionofcreditriskonOTC
derivatives and avoiding the potential for systemic risk at exchanges is theFederalReserveBankofNewYorkstaff report,Duffie,Li,andLubke(2010).While calling formeasures that will increase the use of exchange trading formore liquid derivatives, a number of measures short of exchange trading areproposed to reduce the systemic risk of less liquid OTC derivatives. Theseinclude:
Increasedcapitalrequirementsreflectingnotjustabank'sexposuretocounterpartydefaultbutalso“therisksthatitimposesonothers”byitsownriskofdefault.Increasedpublictransparencyofaggregatepriceandvolumeinformationand“goingprices,”closertotheleveloftransparencyavailableforexchange-tradedderivatives.Aggressivetradecompression,alongthelinesdiscussedinSection14.3.5ofthisbook.
One further area that regulators have considered for containing credit

contagion is regulation of money market funds. The Group of Thirty (2009,Recommendation3)callsfor“Moneymarketmutualfundswishingtocontinuetoofferbank-likeservices,suchastransaction-accountservices,withdrawalondemandatpar,andassurancesofmaintaininganetassetvalue(NAV)atpar...to reorganize as special-purpose banks, with appropriate prudential regulationand supervision, government insurance, and access to central bank lender-of-last-resort facilities.” Any money market fund not willing to subject itself tothese requirements would not be permitted to offer “explicit or implicitassurances to investors that funds can be withdrawn on demand at a stableNAV.”
5.5.8MarketContagionThreetypesofmeasureshavebeenproposedtolimitthespreadofproblemsforanyone firm toother firms throughmarket contagion.The first is to limit thepressuresonfinancialfirmsfacingdifficultiestoquicklyshrinkbalancesheets,therebyreducingdownwardpressureonmarketsfromdistressedselling.Thesemeasuresareclassifiedasonestoreduceprocyclicality.Thesecondistoprovideforamoreorderlyprocessforplacingafirminbankruptcy,allowingmoretimefor positions to be unwound. The third is to provide regulatory oversight forfinancial entities that might be impacted by financial contagion, to provideregulators with greater knowledge about positions that could be impactedthroughmarketcontagion.We'llconsidereachinturn.
5.5.8.1ReducingProcyclicalityTheprimaryregulatoryeffortinthisdirectionhasbeentorequirecapitalbuffersthat should be built up in periods of good profitability and drawn down inperiods of stress. By having some portion of required capital that it ispermissible todrawupon inacrisis, the intention is to relieve thepressureonbanks to sell off assets in response to a sharp fall in market valuation. FSF(2009a, Section III) calls for “the capital framework . . . [to] be enhanced toprovide stronger capital buffersduring strongeconomic conditions that canbedrawndowntoacredibleminimumrequirementduringperiodsofeconomicandfinancial stress.” Group of Thirty (2009, Recommendation 10) calls formandated capital ratios to “be expressed as a broad range . . . with theexpectationthataspartofsupervisoryguidance,firmswilloperateintheupperendofsucharangeinperiodswhenthemarketisexuberantandtendenciesfor
underestimatingandunderpricingriskaregreat.”Theserecommendationshavebeenactedonby theBasel regulators through requirements for capital buffersthat can be drawn down during periods of economic stress. Details of theserequirements can be found in PricewaterhouseCoopers (2011, Sections 10.3.3and10.3.4).While capital buffers have been the focus of the regulatory response to
procyclicality, some thought has alsobeengiven to reducing the cyclicalityofaccountingrules.Withregardtoprovisionsforloanlosses,theGroupofThirty(2009, Recommendation 12(c)) calls for accounting principles that are “moreflexible in regard to the prudential need for regulated institutions tomaintainadequate credit-loss reserves sufficient to cover expected losses across theirportfolios over the life of the assets in those portfolios,” while maintainingtransparent disclosure of reserve methodology. This recommendation runscounter to much of the past decade's tendencies in accounting for loan lossprovisions, which have emphasized provisioning only when loss potential onspecific loans starts to become apparent (the “incurred loss” model). FSF(2009a, Section IV) also recommends reconsideration of the “incurred lossmodelbyanalyzingalternativeapproachesfor recognizingandmeasuring loanlossesthatincorporateabroaderrangeofavailablecreditinformation.”TheFSFstates thatsuchalternativeapproachesmighthave identified loan lossesearlierin the credit cycle andpotentially reducedprocyclicality.TheBasel regulatorshave begun promoting a longer-run approach toward accounting for loan lossprovisions, based on long-term data series for default probabilities andhistorically conservative assumptions for loss given default. These actions aredetailedinPricewaterhouseCoopers(2011,Sections10.3.1and10.3.2).Itwouldbeconsistentwiththislonger-termapproachtoloan-lossprovisioning
to move to a longer-term approach to valuation of illiquid securities andderivativepositions.Thiswouldhave the same impactofbuildingup reservesduring buoyant markets that would reduce the pressure to liquidate assets intimesofstress(foramoredetaileddiscussion,seeSection8.4.4).TheGroupofThirty (2009, Recommendation 12) calls for a move in this direction. In thesupportingdiscussion,theGroupofThirtyarguesfor“morerealisticguidelinesfor addressing valuation issues for illiquid investments.” FSF (2008, SectionIII.3)alsocontemplateschangesinthisdirection.Zandi (2009, 258–259) makes a similar suggestion: that to keep banks'
survival frombeing threatened in financial crises, “mark-to-market accountingrulescouldbetweakedmostimportantlyforsecuritiesthatfinancialinstitutions
don't ever plan on selling. . . . It is reasonable for institutions to value thesesecuritiesbasedonexpectationsofanylossestheymighteventuallysuffer,butitisn'treasonabletovaluethesesecuritiesusingpricestheywouldgetiftheysoldthem today.”Wheremyproposalwoulddiffer fromZandi's is thatmycriteriawouldbe liquidityandnot intentionof sale,and for illiquidsecurities Iwouldreplace the prices at which they could be sold today with very conservativeestimatesof losses, asopposed to expected losses. I believe large reserves areneededagainstilliquidinstruments,butconservatismshouldmakeforrelativelystablereservelevelsthatwouldonlyrarelyneedtobeincreasedinacrisis.
5.5.8.2MoreOrderlyBankruptcyTheGroup of Thirty (2009, Recommendation 16) calls for legislation to giveregulatorsgreaterauthoritytoprovidefor“orderlyclosingsofregulatedbankingorganizations,andothersystemicallysignificantregulatedfinancialinstitutions.”Thereasoningbehindthisrecommendationstatesthat“Marketdisciplineworksbest inasysteminwhichfailurescanhappenwithoutbeingasourceofmajordisruptionandcontagion.”“Tobefullyeffective,thelegalregimesthatoperateoncea failure is triggered shouldbemodified,withaview toplacingprimaryimportanceonthecapacityoftheauthoritiestotakeactionstoprotectthehealthofthesystem.”PricewaterhouseCoopers (2011, Chapter 15) provides a summary of actions
that have been taken by international regulators along these lines, particularlywithregardtorequiringeachlargefinancialinstitutiontopreparea“resolutionplan” for the firm's orderly liquidation in the event of insolvency.TheSquamLake Report (Squam Lake Group 2010, Chapter 8) provides specificrecommendations for preparing resolution plans. Huertas (2011, Chapter 7)providesdetailed analysisby a seniormemberofBritain's financial regulatoryagencyofhowtoimprovetheresolutionprocess.
5.5.8.3BroaderRegulatoryOversightTheGroupofThirty(2009,Recommendation4)callsfor“managersofprivatepoolsofcapital thatemploysubstantialborrowedfunds”(i.e.,hedgefundsandprivate equity funds) above someminimum size to register with and provideperiodicreportstobankingregulators.Thesereportsshouldincludeinformationon “size, investment style, borrowing, and performance of the funds undermanagement.” The regulators should also “have authority to establish
appropriatestandardsforcapital,liquidity,andriskmanagement”forthosefunds“above a size judged to be potentially systemically significant.” This isrecognized as being a clear break from the prevailing approach to fundregulation,whichhasprimarilyfocusedonregulationoflenderstohedgefunds,anapproachthathasbeenjustifiedbythefact thathedgefundsdonotemployanysortofgovernmentguarantee,whereastheircreditorsdo.ButtheGroupofThirtynotesthat“theincreasedemphasisonfinancialstabilityinthemandates”ofregulators“pointstotheneedforgreater,moresystemicaccesstoinformationcrucial to understanding the growing risk imbalances in the system.” StrongacademicargumentssupportingtheapproachofthisrecommendationhavebeensuppliedbyLo(2008).
5.6BROADERLESSONSFROMTHECRISISWhen aswidely respected a figure in the financialmarkets asPaulVolcker ismovedtosaythatthesinglemostimportantcontributionofthefinancialindustryinthepast25yearswastheautomatictellermachine,whichatleasthadprovenuseful,thereissomethingwrongwiththeindustrythatneedstobeaddressedatlevels beyond risk managers and government regulators. (Volcker made thisremarkaddressing an audienceof senior finance industry figures inDecember2009. It was widely reported—for example, in a Daily Telegraph article byLouiseArmitsteadonDecember9.)I don't doubt that comments like Volcker's overstate the case—many of the
innovationsinmarkets,derivatives,andsecuritizationofthepast25yearshavegenuinelymadeeasierfinancing,broaderinvestmentopportunities,andvaluablerisk management tools available to firms and people who were worthyrecipients;goodnarrativesoftheseadvances,fromdifferentperspectives,canbefoundinShiller(2003)andBrown(2012).Butclearlymanyreasonablepeoplearestartingtofeelthereisanimbalance—toomanyinnovationsthatjustprovidetaxandaccountinggimmicksorintroduceunnecessarycomplicationsrelativetotoofewinnovationsaddressingrealeconomicissues.Somesuggestiveideasfornewdirectionsare:
TheprominenteconomistRobertShillerhasbeenfocusingonthequestionofidentifyingfinancialinnovationsthatwillmorecloselymatchgenuinesocialneeds(inhiswords,address“risksthatreallymatter”).Shiller(2008)givesabriefaccountoftheseideasinthecontextofthe2007–2008crisis;Shiller(2003)providesamorethoroughexplication.Someofthe

innovationsheadvocateswouldbewaysofhedgingthecostofhousing,providinghomeequityinsurance,beingabletoinsureagainsttheeconomicriskofcareerchoice,andhedgingagainsttheeconomicperformanceofacountry.RichardBookstaber,anexperiencedriskmanager,inBookstaber(2007)advocatesaredesignoffinancialproductsinthedirectionofgreatersimplicityandgreatertoleranceforsurvivalofdisruptions.
CHAPTER6
ManagingFinancialRiskThe management of financial risk can be divided into two parts: riskmeasurementandriskcontrol.Ingeneral,theindustryagreesmoreonhowriskshouldbemeasuredthanonhowitshouldbecontrolled.
6.1RISKMEASUREMENT
6.1.1GeneralPrinciplesAs stated in Chapter 1, the key characteristic that distinguishes financial riskmanagement from other types of risk management is that financial riskmanagementcantakeadvantageofliquidmarketsaspartofariskmanagementstrategy.Inthischapterweexaminethestructureoffinancialriskmanagementinmoredetail,andagoodstartingpoint is toconsider thehypotheticalcaseinwhichamarketissoliquidthatanypositioncanbeliquidatedinstantaneously.While this is obviously an extreme that does not exist in reality, it will stillprovideaninstructivebackgroundagainstwhichtoconsidermorerealisticcases.Withsuchperfectliquidity,riskmanagementcould,inprinciple,justconsistof
settinglosslimitsforeachtraderandeachtradinggroup(theindustryjargonforthisisastop-losslimit).Assoonasatraderreachedthelimitforaposition,theentire position could be liquidated with no further loss. Or if managementdecidedthat itsrisktolerancehadchangedbecauseofchangesintheirviewoftheeconomyortheinstitutionalenvironment,positionscouldbeliquidatedwithno further losses.Even in such an extremecase, the following ruleswouldbeneeded.
Carefulandcontinuoustrackingofmarketpricesofexistingpositions.Otherwise,youwouldnotknowwhenatraderwasthroughastop-losslimit.Tradersmaybetemptedtohidethesizeoftheirlosses,knowingthatbeingthroughalimitwillcausethepositiontobeclosedoutandeliminatetheirchanceofmakingfuturegains.Anoptimisticmarkofthepositioncoulddelaytherecognitionoflosses.Andtraderswhoknowtheyarethroughalimitwhenmanagementdoesnotareverydangerous,sincetheywillbe

temptedtoswingforthefences(asdiscussedinSection2.1).So,nomatterhowliquidthemarket,correctandindependentvaluationofcurrentpositionsisattheheartofallgoodriskmanagement.Sensiblechoicesoflimitsizerelativetotraderexpertiseandtradingstrategy.Agoodexamplewouldbeapositionbeingtakenthatwillbenefitfromapolicychange,suchastheliftingofgovernmentalforeignexchange(FX)controls.Suchpositionsoftenhavepredictabledailylossesforaslongasthecurrentpolicyremainsinplacebuthavealargeprofitpotentialifthepolicyischanged.Ifmanagementisconvincedthatthisisasensiblegamble,orhassufficienttrustinagiventrader'sjudgmenttoallowhertomakethatdecision,itwouldbeself-defeatingtoimplementitwithaverysmallstop-losslimitthatwould,withhighprobability,causethepositiontobeclosedoutbeforethepolicychangeoccurs.Positionsthatrequirepatiencetomakemoneyshouldbeundertakenonlyifthefirmhastheriskappetitetoallowforthatpatience.Goodproceduresforreviewofrequesttoexceedlimits.Whenatraderreaches(orisapproaching)astop-losslimit,thereisanexcellentchancethathewillwanttomakeacasetohismanagementforatemporaryexpansionofthelimit.Hemaybelievethatamarketshiftinhisfavoris“justaroundthecorner.”Astrictandfirmpolicytocloseoutallpositionsthatreachastop-losslimitwithnopossibilityforreviewwouldbefoolish—thetradermayhaveexcellentinformationandresearchtobackuphisbeliefandautomaticclosingofthepositionwouldmeanpassingonaprofitopportunitywithouttheabilitytoreviewthelimitinthelightofthelatestinformation.
I've rarely seen trading managers make this type of error, but an equallyseriouserrorintheotherdirectionisunfortunatelymorecommon.Requestsfortemporarystop-losslimitincreasesbyatraderreachingorapproachingthelimitmay get approved without serious thought by a busy manager. They may betreated as bureaucratic box-checking exercises, particularly when the requestcomes froma respected traderwithagood track record, rather thanagenuinedecision point. But this renders the stop-loss limit useless, as it will neveractuallybeenforced(ofcourse,theremaybesomelimitbeyondwhicheventhemostblasémanagerwillstopapprovingincreases,butthenitwouldbebettertoacknowledge this as the true limit in advance, since this will lead to betterrecognitionoftheactualmaximumlossesthefirmfaces).A genuinely productive stop-loss limit review requires thorough discussion
between traders and theirmanagersof the factors thathave led to the existinglossandthelatestinformationonprospectsfortheposition.Sometimesevenanexperiencedtraderwithagreattrackrecordneedstimeawayfromthemarkettoconsider whether new factors have come into play that require a change inapproach. Considerations of moral hazard, as discussed in Section 2.1, willcertainly influence the discussion. Traders own more of the upside than thedownside of their positions and so have an incentive to argue for raising thelimit,andtheycantakeadvantageoftheirintimateknowledgeofthemarkettocherry-pickdataandargumentswithwhichtomakeapersuasivecase.Managersneed to be aware of this informational asymmetry and employ a reasonabledegreeofskepticismwhiledrawingontheirexperienceofsimilarpastsituationsand their outcomes. It also helps if the manager has been getting regularindependent analyses of the causes of large gains and losses in the tradingpositions.Thisbringsustoournextpoint.
Analysisofreasonsforlargelossesandlargegainstoputthemanagerinagoodpositiontounderstandthelogicofthetradingstrategyandtobeabletoreviewextensionrequestsintelligently.InSections3.1,3.2,and4.1.6,wehavealreadydiscussedtheadvantagesforcontroloffraudandreportingerrorsofhavingcontrolpersonneldevelopthoroughexplanationsoflargemovesinprofitandloss(P&L),whethergainsorlosses.HereIwanttoemphasizehowarobustP&Lexplanationprocesscanalsoserveasexcellentinputforamanagerwhomayneedtoreviewrequestsforstop-losslimitextensions.Sincedecisionmakingonstop-losslimitextensionrequestsmustoftenbedoneundertighttimelimitsinastressfulmarketenvironment,timethatcanbedevotedbeforehandtogivingmanagementdeeperinsightaboutthedriversofP&Linatradingbookcanhavesignificantreturnoninvestedeffort.Financingplans.Evenwhentradinglossesarewellwithinstop-losslimits,managementstillneedstobeconcernedthatithasadequatefinancingforthecashneedsofmaintainingpositions,astheMetallgesellschaftcaseillustrates(seeSection4.2.2).Thereisthusaneedtounderstandandforecastfundingneedsandplanfortheirfinancing.
It is now time to drop our unrealistic assumption that positions can beliquidated instantaneously. In virtually every case, when positions need to beliquidated, therewill be some lapse of time between the decision to liquidatebeingmadeandtheexecutionoftheliquidationduringwhichmarketpricescanmove.Stop-losslimitsneedtobesetinlightoftheknowledgeofsuchpossible

marketmoves.Forexample,ifyouwanttobesurethatyoudon'tlosemorethan$100 million on a given position and you estimate that you could lose $20million in the courseof liquidation, youneed to set $80million as the triggerpointforthestop-losslimit.All five of the points just made about stop-loss limits under conditions of
instantaneous liquidation continue to apply, perhaps even more strongly, butotherriskcontrolmeasureswillbeneededaswell.Thepointsmadealreadyarestillneededtomakethestop-losslimitseffective,but,withlessliquidity,failureto know currentmarket prices can be evenmore damaging. To deal with theadditional costsof liquidation, an estimateof liquidation costswill need tobeavailable tomanagers, in the form of both a statistical probability analysis oflikelymarketmovesduringaperiodof liquidation—calledvalueatrisk (VaR)analysis—and of stress scenarios tomeasure potential liquidation costs duringperiodsofunusualilliquidity.The risk control requirements we have outlined here are very close to the
recommendationsformanagingderivativesriskthatwereissuedbytheGroupofThirty (G-30) in July 1993. These recommendations have proved veryinfluential, not just for themanagement of derivatives risk, but for all tradingrisk. The Group of Thirty is a private, nonprofit organization that studiesinternational economic and financial issues and is headed by 30 seniorrepresentatives of the international business, regulatory, and academiccommunities.Therecommendationsthatrelatemostdirectlytothemeasurementoftradingriskareshowninthebox,withtheoriginalnumberingtheyhadintheG-30report.While the G-30 requirements and the approach being outlined here were
developed in conjunction with market-making trading operations, they havemuchwiderscopeandshouldbeusedforanytypeoffinancialriskmanagement—thatis,anytypeofriskmanagementthatreliesonliquidinstrumentstohelpmanagerisk. Ifyouareplanning touse liquid instruments to limityour losses,youneedtoestimatethelikelihoodthat(anddegreetowhich)theliquiditywillbe there when needed. So if you are managing credit exposure by havingcounterparties postmargin, you need tomake estimates of how effective thatmarginwill be in limiting losses (see Section 14.3.3 for details). If you run ahedge fund and hedge positionswith liquid instruments or you run a pensionfundandarecountingontheabilitytoliquidatepositionstoassurenotdippingbelow funding requirements for future payouts (a contingent immunizationstrategy), you need to take possible limitations on liquidity into account (see

Section6.1.7fordetails).
GROUPOF30RECOMMENDATIONSRELATINGTOTHEMEASUREMENTOFTRADINGRISKHerewereviewselectrecommendationsbytheGroupof30ontradingrisk.
Recommendation2:MarkingtoMarketDealersshouldmarktheirderivativespositionstomarket,onatleastadailybasis,forriskmanagementpurposes.
Recommendation3:MarketValuationMethodsDerivativesportfoliosofdealersshouldbevaluedbasedonmid-marketlevelslessspecificadjustments,oronappropriatebidorofferlevels.Mid-marketvaluationadjustmentsshouldallowforexpectedfuturecostssuchasunearnedcreditspread,closeoutcosts,investingandfundingcosts,andadministrativecosts.
Recommendation4:IdentifyingRevenueSourcesDealersshouldmeasurethecomponentsofrevenueregularlyandinsufficientdetailtounderstandthesourcesofrisk.
Recommendation5:MeasuringMarketRiskDealersshoulduseaconsistentmeasuretocalculatedailythemarketriskoftheirderivativespositionsandcompareittomarketrisklimits.
Marketriskisbestmeasuredas“valueatrisk”usingprobabilityanalysisbaseduponacommonconfidenceinterval(e.g.,twostandarddeviations)andtimehorizon(e.g.,aone-dayexposure).Componentsofmarketriskthatshouldbeconsideredacrossthetermstructureinclude:absolutepriceorratechange(delta);convexity(gamma);volatility(vega);timedecay(theta);basisorcorrelation;anddiscountrate(rho).
Recommendation6:StressSimulationsDealersshouldregularlyperformsimulationstodeterminehowtheirportfolioswouldperformunderstressconditions.
Recommendation7:InvestingandFundingForecastsDealersshouldperiodicallyforecastthecashinvestingandfundingrequirementsarisingfromtheirderivativeportfolios.
Source:GroupofThirty,GlobalDerivativesandPrinciples(1993).
Therestofthischapterdealswithhowtheserecommendationsshouldbeputintopractice,withmanyreferencestodetaileddiscussioninsubsequentchapters.Butbeforegettingtothesespecifics,IwanttofirstlayoutwhatIthinkaretheessential components of any risk management framework that will meet the

needsidentifiedearlier.Ibelievetherearesevenkeyprinciplesthatneedtobeconsidered:
1.Recognitionofthenonnormaldistributionoffinancialvariables.Itisanempiricalfactthatnearlyeveryfinancialdataseriesexhibitsfattails(seetheRatiosworksheetof theVaR spreadsheeton thewebsite andExercise7.3 based on this worksheet for illustrative examples). Part of theexplanation for this is the psychology of markets—a tendency for a bigmove to create panic that exacerbates the size of the move. Part of theexplanationisthatfinancialvariablesaremostlyhumancreationsratherthannaturalphenomena.AsNassimTalebsaysinTheBlackSwan,“Moneyinabankaccountissomethingimportant,butcertainlynotphysical.Assuch itcantakeanyvaluewithoutnecessitatingtheexpenditureofenergy.Itisjustanumber!”(Taleb2010,33).Toputitanotherway,whentheworld'stallestman walks into a room full of many people, he will change the averageheight of the people in the room by only a small amount. But when BillGateswalks into a room full ofmany people, hewill change the averageincomeofthepeopleintheroombyalargeamount.Whatever the explanation, risk managers need to recognize that financialdataseriesaremostlikelyfattailed.Theyalsoneedtorecognizethatlargemarketmovesinonefinancialvariableoftenoccuratthesametimeaslargemarketmoves inother financialvariables,probablybecause investorswillspread panic in onemarket to othermarkets. Therefore linear correlationsareoftenverypoorrepresentationsoftherelationshipbetweenfinancialdataseries.Any risk management process chosenmust allow for handling fat-tailedseriesthathaveclusteringoflargemoves.2. The need for simulation. The need to handle fat-tailed series andclustering of large moves, as emphasized in the previous point, virtuallydictates the need for using computer simulation to generate estimates ofpotentialliquidationcosts.MoredetailcanbefoundinSection7.1,butthebasic argument is that simulation handles fat tails and clustering of largemovesinasimpleandtransparentfashion,whileotherstatisticalestimationtechniques are far clumsier and more opaque in how they handle thesefeaturesoffinancialseries.Simulation consists of an initial specification of the distribution ofunderlying financial variables, followed by a calculation of the earningsimpactofeach instanceof thedistribution.Thedistributionof liquidationscosts is then simply computed as the aggregation across individual cases.
Since the step in which the distribution of the variables is specified isseparate from the step in which earnings impact is calculated, there iscomplete freedom to specify the distribution in the most accurate waypossible. Furthermore, simulation offers many other advantages, some ofwhichwillbeelaboratedoninSections7.1and7.3:
Many financial products, such as options, involve nonlinear returns.Simulation can handle this easily, since each path of the simulationcomputestheearningsimpactindependentlyfromthecomputationsonother paths and separately from the initial specification of thedistribution of variables. Statistical techniques that mix together thespecification of variables distribution and the calculation of earningsimpactaremuchmorevulnerabletoerror.Simulation makes it easy to generate a rich set of statistics on thedistributionofliquidationlosses,byaggregationofresultsacrosspaths.Simulationmakesiteasytoattributeriskofpotentialliquidationlossestoindividualtradingdesksandindividualpositions.Simulation methodology can easily handle a range of desiredcalculationsinadditiontothebasiccalculationofliquidationcosts.Forexample,considerthepointmadeearlierinthissectionconcerningthedesirabilityoffittingstop-losslimitstotradingstrategies.Inadvanceofsetting a stop-loss limit, a manager should get some idea of theprobability that the stop-loss limit will be activated by a particulartrading strategy. This is straightforward for a simulation, since eachindividualcasecanbefollowedoverasimulated timeperiod,keepingtrackofwhetherastop-losslimithasbeenhitalongtheway.Simulation methodology makes design of computations easy. Sinceeach individual case of the simulation calculates earnings based on asingle specification of the underlying variables, earnings calculationscould be performed on each individual transaction by the exact sameproduction models the firm uses for its official mark-to-marketcomputations.Where this is computationally infeasible,due to a largenumber of individual simulation cases, approximations to productionmodels are relatively easy to design and check against the officialcalculations. It is also easy to break up earnings calculations in eachindividual case by trading desk or product type. Since the earningsdistributionisjustasimplesummationacrossindividualcases,itisnoweasy tocalculate theriskcontributionsof individual tradingdesksand
producttypes.Checking is made easy by the separation of specification ofdistributions and the calculation of earnings into two separate stages.Control personnel and front-office personnel who may not beknowledgeable about probability distributions can focus on checkingthe earnings calculations, using the firm's mark-to-market models foreach individual transaction,asdiscussed in theprecedingbulletpoint.Byparallel reasoning, thespecificationofprobabilitydistributionscanbe easily checked by economists and statisticians who may not beknowledgeableaboutearningscalculations.
All of the advantages of simulation apply not just to the value-at-riskcomputationsforrelativelyliquidpositionsdiscussedinChapter7,butalsoto the modeling of relatively nonliquid positions discussed in Chapter 8.ThispointwillbeelaboratedinSection8.4.2.3.The need to consider subjective probabilities as well as objectivefrequencies. Aswas discussed in Section 1.2, assessments of risk cannotafford to rely solely on historical frequencies. Subjective assessments ofprobabilitiesby the riskmanagersmustbeallowed toplaya role.Even incomputing historical frequencies, the risk managers must rely on somedegree of subjective judgment regarding the length of historical period touse and the weight that should be placed on more recent historicalexperience relative to a longer period of history. These issues will bediscussedinmoredetailinSections7.1.1and7.2.1.The need to utilize subjective judgment causes concern for many riskmanagers.Withoutanythingobjectivesuchasahistoricaldataset topointto,howcantheycountontheirrecommendationscarryingconviction?Whywill they be accepted as having expert opinions on a subjective matter?Thesearequestionsthatmustbeconfronted—whensubjectivejudgmentisrequired,itisbesttobefrankaboutit.Theonlywayforariskmanager'ssubjectivejudgmentstobeacceptedistohavewell-researchedandwell-reasonedargumentsbackingthemup.Foragoodexampleofwhatsuchanargumentlookslike,seeSection5.2.5.7forthe articles in which to find the arguments presented by the Economistmagazine in 2004 through 2006 to support a belief that therewas a goodcasetobemadeforalargedropinrealestateprices.Itisveryimportantinpresentingsuchanargumenttoexplaincarefullythatabeliefthatthereisasignificant probability that an eventwill occur is very different from, and

requires a very different type of evidence from, a belief that an event ishighlyprobabletooccuroristhemostlikelyoutcome.Particularlywhenitcomestosubjectivejudgments,ultimatedecisionswillrestwithmanagement.Itisextremelyrareforriskmanagerstocarryenoughpoliticalclouttobeabletoforceacceptanceoftheirsubjectiveviews.Butitis surely not acceptable for risk managers to just state their views, havemanagementdisagree,andthenshrugtheirshouldersandsaynothingmore.Riskmanagersmust make their arguments forcefully and, if they believethatmanagement is being unreasonable in its judgments, consider optionssuchastakingtheirconcernstotheriskcommitteeoftheboardofdirectorsortoregulators.Afirmthatdoesnotallowaseniorriskmanagerfreedomtodothis(onoccasionalsignificantpointsofdisagreement)withoutdamaginghercareerprospectsisnotahealthyworkingenvironment.And,whenlargedisagreementsoccurmorethanoccasionallyorwherethefreedomtoappealis not part of the culture, riskmanagersmust consider “voting with theirfeet,”toprotecttheirreputationsandintegrity.I will relay one anecdotewith respect to votingwith your feet, though itprecededthedaysofdedicatedriskmanagementdepartments.Aneconomistwith whom I had worked closely at Chase in connection with theintroduction of options products had left to take a good offer at a smallerfirm.Helaterrelayedhisexperienceinjoiningthatfirm:Whenheaskedforsome orientation on how they measured their options risk, managementrespondedbysayingtheyhadnoneedforsuchmeasuresandcouldnotbepersuaded that such measures were needed—they just made “holistic”judgments about the positions they wanted to take. My former colleaguereported thinking to himself, “I see—have a hunch, bet a bunch,” andimmediatelydecidedtostartseekingotheremployment.4.The distinction between diversifiable and nondiversifiable risk. Thedifference between systematic, diversifiable risks and idiosyncratic,nondiversifiablerisksisoneofthecornerstonesofmodernfinancetheory,asdevelopedbyHarryMarkowitz,WilliamSharpe,StephenRoss,andothers.Discussion of this critical distinction can be found—in the context ofexpositionsofportfoliotheory,thecapitalassetpricingmodel(CAPM),andarbitragepricingtheory(APT)—inanytextbookoninvestmenttheory(see,for example, Bodie, Kane, and Marcus 2009, Chapters 8 and 9); oncorporate finance (see, for example, Brealey, Myers, and Allen 2011,Chapter 8); or on asset pricing theory (see, for example, Cochrane 2001,

Section1.4).A diversifiable risk position can be reduced in several ways, by directhedgingbutalsobydiversificationthroughinvestinginotherpositionsthathave low correlation with it. A nondiversifiable risk position, such asexposuretotheStandard&Poor'sS&P500indexortointerestratelevels,needstorelyalmostentirelyondirecthedgingtoreducerisk.Financetheoryemphasizestheresultingmarketdemandforhighreturnsonnondiversifiablerisks.Riskmanagersneedtoensurethattradingmanagementisespeciallyawareof sizableexposures tonondiversifiable risk,bothbecause itmaybemoredifficult to reduce such positions and because management will want toensureitisreceivingadequatereturnsfortakingontheserisks.Thiswasaparticularly important issue in the2007–2008financialcrisis (seeSections13.4.4,5.2.4,and5.2.5.3).Diversifiable riskcanbeeliminated throughhedging;nondiversifiable riskcannot be eliminated but can only be transferred to someone else. Riskmanagersneedtobeverysuretheyunderstandthisrisktransferprocess,tomakecertainthattheriskistrulybeingtransferredandnotjustreappearingelsewhereonthefirm'sbooks.WewilldiscussthisfurtherinSection14.3.4onwrong-waycounterpartyrisk.5.Theuseofarbitragetheorytodecomposerisks.Supposethatyouhavesome exposure to euro interest rates through interest rate derivatives andalso someexposure toeuro rates through forwardU.S.dollar-euro foreignexchange contracts. If these two positions were treated as completelydifferent types of exposure, you might miss offsetting exposures to eurointerestratesor,evenworse,failtomeasureadangerousriskconcentrationbynotaddingtogethertheeurointerestrateexposuresinthetwopositions.(This is not simply a hypothetical example—this treatment of interest rateexposures from interest rate swaps and foreign exchange forwards asseparate exposures was often encountered in the 1980s in the riskmanagementofmajor institutions.)Arbitrage theory forderivatives,whichhas been well developed over the past 40 years, as exemplified in thematerialinHull(2012)andsimilartextbooks,hasprovidedavaluabletoolkitforunifyingsuchpositions.IwillbedrawingheavilyonarbitragetheoryforunifyingpositionsthroughoutChapters10through14.6. The need to consider periods of reduced liquidity. All of us whoparticipateinfinancialmarketshaveexperiencedseveralperiodsofseverely

reduced liquiditywhen the ability to trade at anything other than fire saleprices dries up for a prolonged period of time. Estimation of potentialliquidation costs associated with stop-loss limits must account for thepossibilitythatliquidationwillberequiredduringsuchastressfulperiod.Infact,itisoftenduringsuchperiodsthatstop-losslimitsarebreached,sincelowered liquidity is often associated with sharp price swings andmanagements may need to cut risk limits in a crisis period. I argue inSection7.2.1thatdetailedscenariosbasedonsubjectivejudgmentmustplaythekeyroleinthisanalysisbutthatthereisstillroomforusingsimulationbasedonhistoricaldataasasupplement.7.Theneed to distinguish degrees of illiquiditywith different tools tohandle each type. Given that projecting possible liquidation costs of aposition are such an important part of riskmanagement, it is natural thatdifferenttoolsarerequiredbasedonthedegreeofliquidityofaposition.Inteachingclassesonthistopic,I liketouseavariationofaquotationfrom
Shakespeare,whosaid,“Somemenareborngreat,someachievegreatness,andsome have greatness thrust upon them” (Twelfth Night, Act 2, Scene 5). Myvariantis“Somepositionsarebornilliquid,someachieveilliquidity,andsomehave illiquidity thrust upon them,” and each of these three types of positionsrequiresadifferenttypeofriskmanagement.Positionsthathaveilliquiditythrustuponthemarepositionsininstrumentsfor
whichfrequentliquidmarketquotationsareavailable,andtheyarenotofsuchlargesizethatliquidationofthepositionwillsignificantlyimpactmarketprice.These positions will become illiquid only under conditions of extreme andunusualmarket stress.Theseare the typeofpositionswellhandledbynormalmark-to-market pricing (Section 6.1.3) and VaR calculations (Section 7.1),supplementedbystresstests(Section7.2)toconsiderthepossibleimpactofanunusualmarket stress thatcausesanormally liquidposition tobecome illiquidoveraperiodofafewweeksduringalargemarketmove.Those positions that achieve illiquidity are also positions in instruments for
which frequent liquidmarket quotations are available, butwhere position sizehasgrowntothepointthatliquidationwillsignificantlyimpacttheprice.Insuchcases,therisktoolsjustreferredtomustbesupplementedbyawayofmeasuringtheimpactofthislargerpositionsize.Notethatanilliquidpositionsizeshouldimpact both VaR calculations (since liquidation even in normal marketconditionswillcomewithaddedcost)andstress-testcalculations(sinceonceaperiodofunusualmarket stresshasbeenweatheredandmorenormal liquidity
has returned to themarket therewill still be addedcosts to liquidatinga largeposition).Mysuggestedapproachforhandlinglargepositionsisaseparateandsupplementary simulation of the distribution of possible costs to be incurred,explainedinSection6.1.4.Positionsthatarebornilliquidarepositionsininstruments that lackliquidity
evenduringthebestofmarketconditions.TheyarethepositionsreferredtoinSection1.1ashavingactuarialrisk.Thiscouldbeatransactionthatcompletelylacksamarketcomponent;we'lldiscussanexampleatthebeginningofthenextsection.Oritcouldbeaninstrumentwithverylimitedliquidity;agoodexampleis aposition in aone-waymarket, asdiscussed inSection6.1.3. It couldbe aposition that is so large relative to the size of daily trading that it cannot beliquidatedevenoveranextendedperiod;anexamplewouldbetheloanbooksofmostbanks,asdiscussedintheintroductiontoChapter13.Itcouldbeapositionthatcanonlybesoldundercertainconditions,suchasrestrictedstock.Itcouldbe an instrument that is so complex that liquidation in any reasonable timeperiodisunlikely.(OneofthefirstconsultingassignmentsIhadinthewakeofthe 2007–2008 crisis was for a large bank looking to find amethodology forvaluationofcollateralizeddebtobligation(CDO)tranchesitwasholding.WhenIaskedwhetherthevaluationwasjustforaccountingpurposesorwasmeanttodrive decisionmaking on possible sales, the somewhat testy responsewas: “Icouldn'tpossiblysellanyofthesetranches—itwouldtakemesixmonthsjusttoexplain all the cash flows to a potential buyer.” Even allowing for hyperbolebornoffrustration,thereislikelytoenoughtruthinthiscommenttoserveasawarningaboutassumingliquidityonhighlycomplexpositions.)It is the management of positions in instruments that lack liquidity that
presentsoneofthegreatestchallengestofinancialriskmanagement,ashasbeenconfirmed by the 2007–2008 crisis that was largely due to inadequate riskmanagement of illiquid CDO tranches (see the discussion in Section 5.2.5). Iwill therefore address a recommended approach to this issue in a separatesection.
6.1.2RiskManagementofInstrumentsThatLackLiquidity
When a market component is completely lacking, financial risk managementtechniquesmay bewholly inappropriate and itmay be proper tomanage riskutilizing the type of actuarial techniqueswe discussed in Section 1.1.A good

example of how to identify instruments for which a market component iscompletely lacking and how to manage this type of risk can be found in theexcellent discussion of weather derivative options in Jewson, Brix, andZiehmann (2005, Section 1.4). They declare that “for locations where the[weather]swapisnottraded,andwhicharenothighlycorrelatedwithlocationsonwhichswapsaretraded,actuarialvaluationoftheoptionsistheonlychoice.”Theyspecifythatactuarialvaluationis“fundamentalanalysis”ofthetypeusedin pricing insurance contracts, based on “historical meteorological data andmeteorologicalforecaststopredictthedistributionofpossibleoutcomes.”Whenweather swaps are traded for the location to which the option is tied, or onlocations whose weather is highly correlated with this location, then theyadvocate valuation based onmarket prices and arbitrage pricingmodels (e.g.,Black-Scholes).This is a good illustration of the approach I support. Positions that have no
liquidly traded instruments that canmeaningfullybeusedashedges shouldbeevaluatedandmanagedjustasiftheywerepositionsofaconventionalinsurancecompany. The general principles of riskmanagement referred to inChapter 1apply;thefinancialriskmanagementprinciplesthatarethesubjectofthisbookare irrelevant. But when liquidly traded instruments can be used to hedge ameaningfulportionoftherisk,thenwecanutilizefinancialriskmanagement.Forthislattercase,theapproachIstronglyfavoristo(1)setupaliquidproxy
thatallowsthetotalrisktobesplitintoliquidriskandilliquidrisk;(2)usetheliquidproxy in all standard risk reports and limits (e.g., position reports,VaR,stress tests); and (3) use a separate simulation to manage the risk of themismatch.Asanillustration,considertheexamplediscussedinSection10.2.2,a40-yearinterestrateswapinamarketthathasinterestrateswapliquidityouttoonly30years.A30-yearswapwouldbeassignedastheliquidproxyandusedinallstandardriskreports,whileaseparatesimulationwouldbeusedtoassesstheriskofusinga30-yearswapasahedgeagainsta40-yearswap.ThereasonsIfavortheuseofaliquidproxytorepresentpositionsinilliquid
instrumentsare:Someoftheriskinanilliquidinstrumentcanbemanagedbyliquidinstruments,andtheuseoftheliquidproxyensuresthatthispossibilitycanbeexploited.Tocontinuewithourexampleofthe40-yearswap,thebookingof40-yearswapscertainlyexposesthefirmtointerestrateriskoverthefirst30yearsoftheswapinadditiontotheexposureforyears31through40.Useoftheliquidproxyassuresthatthisexposuretothefirst30
yearsshowsupinpositionreportsandlimitcalculationsproperlyaddedintoliquidinstrumentexposurestakeninthesamedirection.Thiswillalertmanagementtoconcentratedexposuresandgivetradersandmarketersproperincentivesforhedgingthatportionoftheriskthatcanbehedgedthroughliquidinstruments.If40-yearswapsweretreatedasacompletelyseparatecategoryfromswapsof30yearsorless,thesegoalsmightstillbeaccomplished,butitwouldrequirethebuildingofacompletelyseparatereportingstructureandthereisalwaysthepossibilityofgapsoccurringinthedesignofnewreportingstructures.Thesimpleactofinsistingonaliquidproxytakesadvantageofallexistingreportingstructures,suchasmark-to-market,VaR,stresstests,andpositionlimits(e.g.,maturitybucketlimits),withnofurthereffortbeyondthecalculationscurrentlyinplaceforthesereports.Basingreservesandlimitsfortheilliquidriskjustonthevariabilityofthemismatchbetweentheilliquidpositionanditsliquidproxyshouldoftenleadtoreducingtheneedforreservesandlimits.Continuingwithourexample,managingtheriskonthedifferencebetweena40-yearswapanda30-yearliquidproxyoverthe10-yearperiodthatyoumustwaituntilthe40-yearswapbecomesliquid(after10yearsithasonly30yearslefttomaturity)willalmostcertainlybecomputedassignificantlylowerthanthevariabilityofreturnonanunhedged40-yearswap.Butthislattercomputationwouldbeanoverstatementoftheriskofthetrade,sinceuseofahedgeinvolvingtheliquidproxyisalwaysachoicethetradingdeskcanmake.Computationusingtheliquidproxydoesnotinanywayrequiretradingdeskstomakeuseofthisactualhedge—but,iftheydon't,theadditionalriskwillshowupasauseoftheirtradinglimitsforVaR,stresstests,andpositions.Lesscompelling,butstillofsomeweight,isthatmakingsurethatevenilliquidpositionsmakeanappearanceinstandardreports,suchasVaRandstresstests,makesitlesslikelythatmanagerswillforgetabouttheseriskpositions.Itservesasareminder.Buttruemeasurementoftheriskofanilliquidpositioncannotbeaccomplishedsolelythroughstandardreportsdesignedforliquidpositions.Theremustalsobeaseparateandwell-thought-throughreportonthepotentialcostofthemismatchbetweentheilliquidpositionandtheliquidproxy.Thiswillbeournextpointofdiscussion.
Modeling thepotential impactof thedifferencebetween theactual tradeand

theliquidproxyshouldusesimulationforthesimilarreasonsasgivenforusingsimulationsinSection6.1.1—toreflectafullrangeofpossibleoutcomesandtogenerate a statistical distribution that can be used in assessing issues such ascapitaladequacy.Butsimulationsofthedifferencesbetweentheactualtradeandits liquid proxy cannot just be for the short periods used inVaR calculations;theymustgoall theway to finalpayoutor towhen the tradebecomes liquid.Simulations must reflect the possibility that the model used for pricing andtrading the product may be wrong. All of these issues in simulation of thedifference between the actual trade and the liquid proxy will be discussed indetailinSection8.4.Morecontroversially,Idonotbelieveinusingmark-to-marketpricingonthe
differencebetweentheactualilliquidtradeandtheliquidproxy.Reservelevelsshould be adequate to protect against extreme events, and it is extremely rarethatshort-termmarketchangesrevealnewinformationaboutthepotentialdepthof an extreme event.Mark-to-market pricing is designed tomeasure prices atwhich risk can be exited in the near future. Since an illiquid trade cannot beexitedinthenearfuture,mark-to-marketpricingisnottrulyreflectingchangesthatimpacttheposition.I know that tomany people this will seem as if I am trying to go easy on
illiquidpositions,whichwouldbeparticularly foolish in lightof all thehavocoverindulgenceinilliquidproductsbyfinancialfirmscausedintherecentcrisis.ButIdonotbelievethisproposalismovinginthedirectionofeasiertreatmentofilliquidtrades.ThesizeofreservesIwanttokeepisquitesubstantial,andmyexperiencewith this reservemethodology leadsme tobelieve itwould lead tolessuseandmorecautioususeof illiquidproducts than thewholly inadequatereservingprocessesthatappeartohavebeenoperatingintherun-uptotherecentcrisis.Iwillaskreaderstowithholdjudgmentuntiltheycanseemyargumentindetail in Section 8.4.4. I discuss how my proposal might have mitigated thespread of the crisis in the discussion of reducing procyclicality in Section5.5.8.1.Given the very different treatment I am advocating for illiquid instruments
relativetoliquidinstruments,itisvitaltohavegoodtestsavailabletodistinguishbetween illiquid and liquid instruments. When trading desks make suspectclaimsof liquidity, independent riskmanagersneed to insistonevidence fromreliable external sources or from a history of actual trading tickets. Tradinghistory that is overwhelmingly in one direction, extremely sporadic, orconcentratedwith just one or two counterparties, or that has been executed at

pricessubstantiallydifferentfrominternalvaluationsneedstoberegardedwithextremewariness.Tradingdesksthatwanttoovercomesuchsuspicionshouldbepreparedtodemonstratetheabilitytoliquidatesignificantblocksofinventoryatpricesclosetointernalvaluations.
6.1.3MarketValuationThe policy ofmarking tomarket all trading positions, at least as often as thecloseofbusinesseachday,aspertheG-30'sRecommendation2,constitutestheessentialfoundationformeasuringtradingriskbecauseofthreeprimaryreasons.First,withoutanearlycontinuousmarkingtomarket, itwouldbepossible thatineffectivehedgingstrategieswouldnotberecognizeduntillongafterbeingputinplace.Second, theanalysisof revenuewillyield insightonly if the revenuefiguresbeinganalyzedaretiedtogenuinechangesinvalue.Third,inmeasuringtheriskexposuretomarketmoves,itisfareasiertomakegoodjudgmentsaboutpossibleshort-termmovesthanit isaboutlonger-termmoves.Butif tradesarenot revalued frequently, it becomes necessary to measure risk exposure overlongerperiods.When highly liquid external prices are available for marking a position to
market,thentheissuesinvolvedinperformingthemarkarelargelyoperational.An examplemight be a position in spot foreign exchange (FX) for the dollarversusJapaneseyen.Thisisamarketforwhichquotationsarereadilyavailableontradingscreens,withmarketconventionsthatensurethatfirmspostingpricesare prepared to actually deal in reasonable size at these prices.Quotations formark-to-marketpurposescanbecapturedelectronicallyfromtradingscreensorentered by hand and later checked against printouts from screens—the choiceshould be based on the operational cost versus error rate and the cost ofcorrectingerrors.Anotherexamplewouldbeapositioninawell-tradedstockorexchange-tradedfuturesoptionforwhichthelastpriceatwhichanactualtradeoccurredisreadilyavailablefromanexchangeticker.Formanypositions,mark-to-marketpricingisnotthisstraightforward.Either
themarketitselfdoesnothavethistypeofliquidquoteavailableorthesizeofthe position held is so large that closing it outmight impact themarket. Theprice atwhich theposition canbe exitedwill beuncertain to somedegree. Insuchcases,twointerrelatedquestionsmustbeasked:
1.Howshouldamostlikelyexitpricebearrivedat?2. Should some markdown of the price be used to account for the

uncertaintyand,ifso,howshouldtheamountofreservebedetermined?Establishing themost likelyexitpricemay requireamodel tocreateamark
basedonmore readilyavailablepricesofother instruments.Modelscan rangefromverysimplecomputations,suchastheinterpolationofanilliquidtwo-and-a-half-year bond from prices on more liquid two-and three-year bonds, tocomplex theoretical constructions. A discussion of how to use models in themarkingprocessandhowtoestablishreservesagainsttheassociateduncertaintycanbefoundinChapter8.Whatifpricequotesareavailable,butarenotsufficientlyliquidforareadily
agreed-uponexternalvaluation?This implies thatderiving themost likelyexitprice from these quotes requires an understanding of the relative quality ofavailable quotes. For each quote, questions like the following need to beanswered: Is thequote one atwhich the firmor broker providing thequote isoffering to do business, or is the quote just provided as a service to indicatewherethemarketisbelievedtobetoday?Ifthequoteisanoffertodobusiness,howlargeatransactionisitgoodfor?Whatisthetrackrecordofthequotationprovider in supplying reliable information? Are there possible motivations toprovidemisleadinginformationinanattempttoinfluencepricingtomoveinadirection that favors a quote provider's position? How frequently are quotesupdated?Withsuchamultiplicityofinformationbearingontheissue,thereisnodoubt
that traders of an instrument have the best judgment on determining thisvaluation.Theircontinuouscontactwithotherfirms'tradersandbrokersenablesthemtobuildtheexperiencetomakethesejudgments.Theabilitytomakesuchjudgments is a major factor in determining a trader's success, so traders whohavebuiltasuccessfulearningstrackrecordcanmakeastrongclaimofhavingtheexpertisetodeterminemostlikelyexitprices.Unfortunately,relianceontraders'judgmentraisesmoralhazardconcerns.As
discussedinSection2.1,tradersareoftentemptedtomisleadmanagementaboutpositionexitpricesinordertoinflatereportedprofitsortoincreaseflexibilityinthe positions they are allowed to hold. Outsiders, from corporate riskmanagement, corporate finance, or the middle office, need to be involved inmaking these judgments to preserve independence. However, designingmechanismsforresolvingdisputesbetweentradersandcontrolpersonnelraisesmanydifficultissues:
Howcancontrolpersonnelobtainasufficientknowledgebasetochallenge
traders'judgments?Ataminimum,tradersshouldberequiredtomakepublictheinformationonwhichjudgmentsaremade.Thiscanbeaccomplishedbyinsistingthatquotesbesenttothefirminwriting(whetherthroughtradingscreens,e-mail,orfax).Alternatively,controlpersonnelshouldhavetherighttoselectivelylisteninonphoneconversationsinwhichquotesaremade.Ideally,controlpersonnelshouldhavearangeofexperiencethatenablesthemtoarriveatindependentconclusionsregardingquotations,perhapsevenpriortradingexperience.Recordsshouldbekeptofpriorexperiencewiththereliabilityofaparticulartrader'svaluationsbytrackingthepathofinternalmarksleadinguptoanactualpurchaseorsalepriceandnotingsuspiciouspatterns.Controlpersonnelshouldadjusttheirdeferencetotradervaluationsbythedegreeofprovenreliability.Atrader'sultimateweaponforbringingcredibilitytoavaluationistoactuallyexitpartoftheposition.Arecordedpricenarrowsdisputesdowntothesinglequestionofwhetherthesizeofthetraderelativetotheretainedpositionislargeenoughtobeareliableindicatoroftheexitpricefortheremainder.
Despitebesteffortstodesigndisputeresolutionprocessesthatbalancepowerbetween traders and control personnel, traders inevitably retain a strongadvantagebasedoninformationasymmetry.Theycanutilizetheirknowledgeofawidevarietyofsourcesofpricequotestoselectivelypresentonlythosethatarethe most advantageous to their case. They sometimes use friendships andexchanges of favors to influence other market participants to provide quotesbiasedtowardtheirvaluations.Tradersalsooftenrelyonanaggressivepersonalstyleandinternalpoliticalpowerbasedon theirprofitability toprevail throughintimidation.Toremedythispowerasymmetry,somefirmsprefertorelyonmoreobjective
computations fordeterminingvaluations, evenwhere this reduces accuracybylessening the role of judgment. A typical approach would be to average thequotesobtained froma setpanelofother firmsorbrokers,perhapsdiscardingoutliers before averaging (discardingoutliers is a possible protection against afew quotes that have been biased by friendship or favor). Changes in panelmembershipshouldbedifficulttomakeandrequireagreementbetweentradersandcontrolpersonnel.A promising development toward more objective valuations for less liquid
instrumentsistheTotemMarketValuationsservice.Thisserviceisdesignedtoshare information among firmsmakingmarkets in less liquid products. Firmscanobtainaccesstoquotesononlythoseproductsforwhichtheyarewillingtoprovidequotes.Theiraccesstoquotescanbecutoffifthequotestheyprovidearefrequentlyoutliers,indicatingeitheralackofexpertiseoranattempttobiasquotations.Althoughtheextensivemachineryofthisprocessmeansitcanmakequotesavailableonlyonceamonthandwithalagofafewdays,itstillprovidesavaluablecheckonthevaluationsofafirm'straders.Thefollowingaresomepitfallstobewaryofwhensettingupaprocedurefor
derivingvaluationsfromlessthanfullyliquidmarketquotes:Model-derivedquotes.Hereisanillustrationofafrequentlyencounteredproblem.Youneedavaluationforaparticularbondandyouhaveachoice:eitheruseamodeltocomputethevaluebasedonobservedpricesofmoreliquidbondswithsimilarmaturitiesandcreditratingsorusepricequotesfortheparticularbondobtainedfrombrokers.Beforechoosingthelatter,askthefollowingquestion:Arethebrokersprovidingaquotespecifictothisbondoraretheyjustprovidingtheoutputoftheirownmodelbasedonpricesofmoreliquidbonds?Ifyourexternalsourceismodelbased,mightyoubebetteroffusingyourownmodel?Thefollowingaresomeadvantagestousingamodel-basedexternalquote:
Youmaybeabletogetmodel-basedquotesfromseveralsourceswiththehopethaterrorswillaverageout.Theexternalmodelsarebeingtestedbytheuseofthequotesbymanydifferentfirms,soitismorelikelythatobjectionswillberaisedifthemodelismissingsomething.Itislesslikelythattraderswillinfluencetheoutcomewhenanexternalsourceisbeingused.Thequotesmaybecomesowidelyusedastobeagoodindicatorofwherethemarketistrading.Theprimarydisadvantagetousingamodel-basedexternalquoteisthatyoumaynotbeabletoobtaindetailsofthemodelused,soitishardertoestimatepotentialerrorandbuildadequatereservesforuncertaintythanwhenusingyourownmodel.
Revealingpositions.Whenquotesarenotavailableonregularlydisplayedscreensorreports,firmsseekingquotesmayneedtomakespecificinquiriestoobtainquotes.Theirinquiriesrevealinformationaboutthepositionsthe

firmholdsthatcanbeusedtothefirm'sdisadvantagebyothermarketparticipants.Thisisparticularlytrueiftheconventionsofthemarketrequireanindicationofeitherbuyorsellinteresttoobtainaquotation,asopposedtoobtainingabid-askquote.Evenwhenyoudonotneedtorevealthedirectionofyourinterest,insomemarketsthedirectionofafirm'spositioniswellknowntootherparticipantsandtheexpressionofinterestinaparticularinstrumentishighlyrevealingofholdings.Itisalwayspossibletodisguisepositionsbyrequestingquotesforarangeofinstruments,includinginstrumentsheldandnotheld.However,thequalityoftheresponsemaysufferaseffortstoprovidequotesgetdiffusedovertoomanyinstruments.Marketconventionsconcerningthetoleratedratioofinquiriestoactualtransactionsalsolimittheamountofinformationthatcanbeobtained.Iftraderreluctancetorevealpositionslimitstheextentoftheexternalquotesobtained,modelsmayneedtobereliedonmoreheavilytoinfervaluations.One-waymarkets.Younotonlyneedtoworrywhetherthesizeoftransactionforwhichanobtainedquoteisvalid,butyoumustalsoworryaboutwhetherthequoteisvalidforyourfirm.Marketsthattendtobeone-way,withcustomerdemandstronglyononesideandmarketmakersupplyontheother,mayleadtoquotationsthataregoodforcustomersonly.Atypicalexamplewouldbeanoptionsmarketinwhichalmostallcustomerinterestinoptionsbeyondfiveyearswastoselloptions,notbuythem.Amarketmaker,insuchcircumstances,mightsupplyreasonablyliquidquotesforthepurchaseoflong-termoptionstocustomers,butbeunwillingtobuyonthesametermsfromothermakers.Theprincipleistoreservethelimitedcapacitytotakeonrisktoencouragecustomerrelationships,nottohelpcompetitorsforthiscustomerbusinessbyallowingthemtodistributesomeoftheirrisk.Thisisnottosaythatmarketmakerswillneverbuylonger-termoptionsfromoneanotherinsuchcircumstances,buttheymaydosoonlyonanegotiatedbasis,withnoactionablequotesavailable,eventhroughbrokers.
Amarketmakermaystillsucceed infindingout theprices thatothermarketmakersarepayingcustomersfor longer-termoptions,sincecustomersoftenletthem know what bids they are seeing from other firms. It will be a definitesourceofcomfort toknowthat the firm'spricesare in thesamerangeas theircompetitors'prices,sincethisisanindicationthatthefirm'smodelsandtradingstrategiesarenotsufferingfromsomemajorerror,suchasoverlookingasourceofrisk.Equivalently,afirmderivescomfortfromseeingthatitwinsitsfairshare

ofdealsinagivencategory,neithertoomanynortoofew.Althoughthiscomfort isgenuine, itshouldnotbeconfusedwithobtaininga
priceatwhichthefirmcanexititsriskpositions.Intheabsenceofquotedpricesatwhichthefirmitselfcantransact, it isprudenttoanticipatetheneedtoholdrisk longerand toutilizemodels toestimate longer-termprofitand loss (P&L)and reserves, and limits to control the associated risk, as discussed in Section8.4.
6.1.4ValuationReservesWhenthereissubstantialdoubtaboutthepriceatwhichapositioncanbeexited,asafetymargincanbeprovidedbycalculatingavaluationreserve thatcanbesubtractedfromthemostlikelyexitprice.Theissueofhowlargereservesshouldbeforvaluationuncertaintyisprobably
thesingleissuethatleadstothegreatestconflictsbetweentradersandcorporateriskmanagers.Basedon theirexperienceandknowledgeof themotivationsofthe creators of market quotes, traders tend to believe they know the price atwhichpositionscanbeexitedwithafairdegreeofcertainty.Withsomejustice,theywillpointoutthattheuncertaintyismostlyonthepartoftheoutsiders,suchascorporateriskmanagersandthecorporatefinancefunction,whodonothavethetraders'accesstoinformation.ReserveslowerthereportedP&L,whichistheultimatescorecardforthetraders,determiningbonuses,promotions,thesizeofpositions management will allow, and, ultimately, continued employment.Understandably, traders will push to minimize reserves. (The one universalexception to this tendency isa traderwho inheritsabook fromanother trader.Invariably, the new trader will want to increase reserves for the inheritedpositions.Icallthistheprinciplethatnoprofitshouldfundonlyasinglebonus.)Occasionally,though,oneencountersatraderwhoclaimstobeaproponentof
large reserves. I came across one when a trading book of exotic options wasbeingestablishedforwhichIwastoberesponsiblefortheriskmanagement.Thehead trader expounded on his philosophy of avoiding any appearance ofclaiming too much P&L before achieving certainty of the results. He wantedreservelevelstobegenerouslyhigh.Here,I thought,wassomeoneIcouldgetalongwithwell.And so I did, throughmanymonths inwhich both P&L andreserve levels were high, with easy agreement between the two of us on thereserves.Then came the unfortunate daywhen an operations error in booking a trade

wasdiscoveredseveralmonthsafterthetradehadbeenbooked.Rebookingthetrade correctly would lead to a large loss, large enough that the trading deskwouldshowitsfirstnegativeP&Lforamonth.Theheadtrader,althoughdulyupsetbytheoperationsfailure,wasunfazedbytheP&Lconsequence.Now,heinformed me, was the time to release some of that reserve that had beenaccumulating—just enough to make P&L for the month come out positive. Iprotested.Firstofall,thereserveshadbeencreatedforvaluationuncertainty,notasahedgeagainstpossibleoperatingerrors.Second,theamountofuncertaintyinthevaluationwasexactlythesameonthedayaftertheerrorwasdiscoveredas it was on the day before it was discovered. So how could a lowering ofreservesbejustified?Theeraofgoodfeelingshadcometoanabruptend.This experience illustrates why a great deal of suspicion exists around
valuationreserves,whichisoftenexpressedbyregulators,suchastheSecuritiesandExchangeCommission(SEC)andauditors.Aren'treservesjustacushiontoallowreportedearningsofatradingbooktobesmoothed,creatinganillusionoflessuncertaintyofreturnthanactuallyexists?Toavoidthis,adefiniteprinciplemust be in place that reserves are strictly for uncertainty concerning currentvaluation and never for uncertainty concerning futuremarket variation.As anexample, take a position in a liquid instrument, such as the dollar versusJapaneseyenspotFXwepreviouslycited.Thefuturemovementsofthishighlyvolatile exchange rate (and hence the P&L) may be surrounded by greatuncertainty,but there shouldbeno reserve, since theposition canbe exited atshortnoticeataknownprice.Areserveshouldbeconsideredonlyifthepositionreachesasizethatplacesalimitonthisfreedomofexitandthereforecallsintoquestionthevaluationsofthecurrentposition.Tomakesure that thisprincipleofusingreservesonlyfor theuncertaintyof
current valuation and not for the uncertainty of future market variation isfollowed, clear independence of reserve determination from the control ofinsiders with a motivation to show smoothed earningsmust be demonstrated.This requires the final decision authority to be with an independent businessunit, such as corporate risk management or corporate finance, and relativelyobjectivestandardsfordeterminingreservestobeutilized.Theuncertaintyofcurrentvaluationcouldbeduetotheilliquidityofavailable
price quotes or it could be due to reliance on a model to obtain a valuation.Section 8.4 discusses how to establish objective standards for reserves againstmodel uncertainty.We now focus on how to establish objective standards forreservesagainstpositionsforwhichonlyilliquidpricequotationsareavailable.

Themostdirectmethodforreservingagainstanilliquidpositionistoestimatethe degree to which exiting this position in the market might cause prices tomove.Thiscanaccommodatefairlyobjectivestandardsbyusinghaircut tablesonvaluation.Thesehavesetpercentagediscountstiedtothesizeofthepositionheldrelativetosomemeasureofthemarketsize,suchastheaverageamountofdaily trades. This method takes proper account of both types of possibleilliquidity, since this ratio could be high based on either a small denominator(indicatinganilliquidmarket)oralargenumerator(indicatingabigpositioninaliquid market). The downside to this method is that it may be difficult toestablish reasonable haircut percentages to use. Rarely do firms keep goodhistoricalrecordsoftheimpactofexitinglargepositions,anditwill,inanycase,be very difficult to sort out such impacts fromother effects onmarket prices.This leaves the determination of haircut percentages to a subjective debate inwhichthetraders'greaterexperiencewillbedifficultforoutsiderstoquestion.Amethodthatlendsitselftoamoreevenlymatcheddebateistofirstestimate
theamountof time itwill take toexit apositionwithout substantiallymovingprices and then reserve against a possiblemarketmove over this time period.Thisexit timeestimatewillalsobebasedonaratioofsizeofpositionheld todailytradingvolume.Itthussharesthepreviousmethod'sadvantagesoftakingproper account of both types of possible illiquidity and also the previousmethod's disadvantage of making it difficult for outsiders to debate traderjudgment. However, the potential price move estimate allows for outsiderobjectivity,sinceitisverysimilartothesortofcalculationthatgoesintoVaR.Italsoenablesreservelevelstobecalibratedtomanagement-determinedlevelsofuncertaintythatshouldbereservedagainst.Auniformuncertaintylevelusedfordifferenttradingdeskscanhelptoensurethecomparabilityofresultsacrossthefirm.Forexample,considera$500millionpositioninastockinwhichtheamount
thatcanbetransactedinonedaywithoutadverselyimpactingpricesisestimatedtobe$50million.So$500million/$50million=10daysofpricemovesshouldbereservedagainst,whichimpliesthatonaveragetherewillbe10/2=5daysofpricemovespriortosale.Ifthedailystandarddeviationofpricemovesis1.5%,and ifmanagement decides on a reserve to a 95% confidence level, which isequivalentto1.65standarddeviationsofanormaldistribution,thenthereservelevelshouldbe:(6.1)Itshouldbereiteratedthatdespitetheappearanceofatermthatistiedtothe

uncertaintyoffuturemarketvariation,thisremainsareservemethodologybasedoncurrentvaluationuncertainty.Futuremarketvariationisbeingreservedonlyto the extent it is outside management control, due to a large position sizepreventingexitatthedesiredtime.A thirdmethod,which can be used as a complement to the other two, is to
createa reserveagainstagedpositions.Thismethodestablishesa formula thatmarksapositiondownbyacertainpercentagethelongeritisheld.Thiscanonlybe used as a complement to one of the other two methods, since it will notestablishanyreserveagainstalargeilliquidpositionrecentlyenteredinto.Why should there be uncertainty about position valuation just because a
positionhasbeenheldforalongtime?Itisbasedontheobservationthattradersmay delay exiting a positionwhen they suspect that itwill cause a decline invalue from the level they are currently marking it at. Although I have heardmuchanecdotalevidencesupporting thisobservation, itwouldbe intriguing toperforma statistical studyon the correlationbetween the length that positionsareheldandthesizeanddirectionofthepricemovebetweenthelastmarkandactual sale. An aging reserve policy can also be justified on the pragmaticgrounds that it isproviding traderswith the right incentives—to realizeprofitsandcutlossesinareasonablyshorttimeperiod.As was stated at the beginning of this section, reserving against valuation
uncertainty is probably the leading cause of the greatest conflicts betweentradersandcorporateriskmanagers.Theriskmanagersneedtoprovideadegreeof conservatism thatwill assure investors, lenders, and government regulatorsthatP&Lisnotbeingoverstatedandmustprovideadegreeofindependencetoallaysuspicionsthatreservesarebeingusedasameansforsmoothingearningsresults. However, this leads traders to suspect that too much conservatism isbeing applied to protect risk managers against any possibility of criticism. Areserve that is too conservative hurts not only the trader, but also the ultimateprofitability of the firm by limiting the amount of business that can betransacted.Inmyexperience, tradersoftenmisunderstandtheneedforconservatismand
independence. One argument I've frequently encountered when specifying thereserve I think needs to be placed on an illiquid position goes something likethis:“Ifyouwantthefirmtovaluetheassetatthatlowavalue,thenyouwouldbe happy if I went massively short the asset at that price.” However, thismistakesconservatismforaviewonfairprice—ifthetraderwastogoshortthisilliquidasset,Iwouldwantreservestoestablishaconservativelyhighvaluefor

theshortposition.Inotherwords,reservesareusedtoestablishabid-askspreadonanilliquidposition,andthegreatertheilliquidity,thewiderthespread.I'vealso encountered the argument from traders that they have excellent insideinformation as towhere a positionwill trade, but they don't currentlywant toenter into the trade at that price. I need to point out that unless they can findsomemeansoftranslatinginsideinformationintosomethingpubliclyverifiable,wecannotaskthefirm'sshareholdersanddepositorstobeartheriskthattheyarewrong.Ofcourse,mydialoguewithtradersisfarfromaone-waystreet.Oftenitisa
caseof theireducatingmeonsourcesof informationoraspectsofhedges thatcausemetochangemyinitialview.Overtime,withalmostallofthetradersI'vedealt with, we've come to an accommodation of mutual respect, but with arealization thatour interestssometimesdiffer.However, Istillwonderat timeswhether other risk managers have found better ways to avoid initialcontentiousness.IwasthereforeabitamusedatsomedialogueIoverheard.Iwasmeetingwiththeheadofmarketriskatamajorinvestmentbank,oneof
themostrespectedindividualsintheindustry.Ourconversationwasinterruptedbyanurgentphonecallfromoneofhisstaff.Iheardonlyhissideofthephoneconversation,whichwentsomethinglikethis:“Well,certainlyyouneedtoputareserve on a trade like that. . . . I don't carewhether the trader likes it. If hedoesn't,lethimsellsomeofthepositionandshowuswhereitshouldbepriced... . You can't accept a statement like that from him. The fact that the reserveyou'vecalculatedwouldmakehimbookanup-frontlossdoesn'tprovethatyourreserve is stupid.Tellhim thatyour reservecalculationshows thathisprice isstupid.”
6.1.5AnalysisofRevenueThe G-30 study states, in support of Recommendation 4 to identify revenuesources, that “measuring the components of profit helps participants tounderstand the profitability of various activities over time relative to the riskundertaken,aswellastogaininsightintotheperformanceofhedges.”Abasicjustificationofusingmark-to-marketvaluationinthemanagementofriskisthatitwillleadtoanearlyidentificationofineffectivehedgingstrategies,whichcantrigger experimentation with alternative hedges or changes in the mix ofproducts being offered. This can happen only if an effective and frequentanalysisismadeofwhatiscausingchangesinP&L.Inparticular:

P&Lmustbesegregatedbyproductlinetoidentifywhichproductsmaybeencounteringhedgingdifficulties.P&Lmustbebrokenoutintothatpartattributabletonewlybookedbusinessversusthatpartattributabletohedgingactivityonexistingbusiness.Thisensuresthathedgingproblemswillnotbemaskedbytheoffsetofprofitsfromnewbusiness,leadingtoaPonzischeme,asdiscussedinSection2.2.Apersistentpatternofprofitablenewbusinessoffsetbyhedginglossesisanindicationthateithertradershavechosentotakepositionsthat(atleasttemporarily)havehadbadresultsorvaluationreserveshavebeeninadequate.Todistinguishbetweenthesetwocases,itisimportanttoidentifywhatportionofhedgingprofitsisduetomovementsagainstspecificriskfactors,suchasdelta,gamma,vega,andtheta.Inthisway,lossesstemmingfromdeliberatelytakenpositionscanbedistinguishedfromthosethatarisefromriskssuchascorrelationexposure,whichthetradercannotcompletelyhedge.Thisanalysisisalsoimportantinconfirmingthatriskpositionsarereportedcorrectly.IfdailyP&Lswingscannotbeaccountedforbythereportedsizeofriskpositionsandthedailychangesinmarketvariables,itisawarningthatthereportedriskmeasurementsmaybeincorrect.Thisshouldleadtoinvestigationsofwhethersometransactionshavebeenmisrepresentedinthereportingsystemsorwhetheradditionalormoredetailedriskmeasuresarerequired.ParticularattentionshouldbepaidtounexplainedP&Lswingsthattakeplacearoundadateonwhichapaymentismadeordetermined.Ifamodelisnotproperlyvaluingapaymentthathasalreadybeendeterminedorisveryclosetodetermination,theprobabilityisveryhighthatthetradehasbeenmisrepresented.MoredetailonthispointwillbefoundinSection8.2.7.1.ItisextremelyimportanttohighlightanyP&Lchangesduetochangesinthoseassumptionsthatcannotbedirectlytestedagainstavailablemarketpricesorchangesinmodels.ThiseliminatesthepossibilitythatP&Lduetosuchchangeswillmasktheresultsofineffectivehedgingstrategies.SignificantdifferencesbetweenofficialP&Lchangesandtheinformaltradingdeskestimationofthesechangesshouldbeinvestigated.Thesedifferencescanbeindicatorsofhedgesthatarenotperformingasexpected.
6.1.6ExposuretoChangesinMarketPrices

The need for measuring exposure to market changes is emphasized in G-30Recommendations 5, 6, and 7. Proper daily mark-to-market valuation, asdiscussed in Section 6.1.3, is the key to properly measuring the exposure tochanges inmarket prices. The correct daily valuation ensures that exposure isbeing evaluated from the correct starting point and also serves as a basis fortranslating changes in observable market prices into changes in portfoliovaluation. Since the daily mark-to-market needs to relate valuation to someobservable external prices, possibly through the use of models, this samerelationshipcanbeused to takeachange inmarketpriceandconvert it intoachangeininstrumentvalue.To take a concrete example, consider an option position on the Standard&
Poor'sS&P500indexwithanexpiryinfivemonths.Whenconsideringhowtovalueit,decisionsmustbemadeaboutwhatmodeltouseandwhattheinputstothe model should be. Let us say a Black-Scholes model is chosen, requiringinputforthepriceoftheunderlyingandanimpliedvolatility.Fortheunderlyingprice,wemightdecidetouseanaverageofone-thirdoftheclosingthree-monthS&Pfuturespriceandtwo-thirdsoftheclosingsix-monthS&Pfuturesprice.Fortheimpliedvolatility,wemightdecidetouseanaverageconsistingofone-thirdof the impliedvolatilityof theclosing three-monthS&Poptionpriceand two-thirdsoftheimpliedvolatilityoftheclosingsix-monthS&Poptionprice.Thesechoiceswill bemadebasedon trade-offs betweenbasis risk and liquidity riskandcould include reserveadjustments for lackof liquidity.However,once thechoices are made for valuation, they become simple recipes for translatingchanges in market prices of the three-month S&P futures, six-month S&Pfutures, three-month S&P implied volatility, and six-month S&P impliedvolatility into a change in the five-month option price, utilizing the Black-Scholesmodel.Oncethesepieceshavebeenestablished,theremainingtaskistodecideonthe
marketpriceshiftsonwhichtocalculateexposure.Threeprimarytypesofshiftsareused:
1.Standardshiftssuchasa1basispointinterestratemove,a1percentstockpricemove,ora1percentimpliedvolatilitymove.Theadvantageof standard shifts is that they easily convey a precisemeaning to a widegroupofusers.Themainissuetobedecidedwhenusingstandardshiftsiswhichmarketprices togrouptogether—doyouwant toreportexposure toeach individual stockpricemoving, all stockpricesmoving together, or aparticular industry shifting relative to all others? These detailed decisions

are best examined in the context of specific risks. We address thesedecisions more closely in subsequent chapters, particularly Section 7.1,Section8.4,andSection9.4.2.Shiftsbasedonthestatisticalanalysisoftheprobabilityofthesizeofthechange.Theadvantageofstatisticallybasedshifts is that theymake iteasier to compare the size of exposures in different risk classes. Forexample,it'shardtosaywhethera$5millionlossfora1percentchangeinstockpricesismoreofadangerorlessofadangerthana$2millionlossfora1percentchangeinimpliedinterestratevolatilities.However,a$5millionlossforastockpricechangethathasa5percentprobabilityofoccurringisclearlymoreworrisome than a $2million loss for an implied interest ratevolatility change that has a 5 percent probability. Probability distributionsalso make it possible to combine shifts in unrelated asset classes into asinglemeasure, suchas the95thpercentileVaR,definedas theamountofloss thatwill be exceeded only 5 percent of the time, based on all of thepositions within a portfolio. The difficult issue with statistically basedmeasures of risk is how to determine the probability distributions. ThesemeasuresandthemeansofdecidingondistributionsarediscussedinSection11.1.3.Shifts based on scenarios determined by economic insight into thepotential size of different shifts and the relation between them. Anexamplewouldbea stress scenario for the impactof thedebtdefaultofaparticular large developing economy, which might be judged to result in,say,a5percentdecline inall stockprices, a largerdecline in the stockofcompanieswithlargeinvestmentinthateconomy,a10percentdeclineinallemergingmarketFXrates,a15percent increasein thecreditspreadofallemerging market debt, and so on. We study alternative approaches todefining such shifts in Section 11.2. Scenario analysis is needed for cashflowaswellas forP&Ltoanticipate funding liquidityproblems,which isconsistentwith theG-30Recommendation 7, as discussed in Sections 3.5and4.2.2.
6.1.7RiskMeasurementforPositionTakingIt can be argued that the G-30 recommendations should apply to themarket-makingfunctionoftradingwithanemphasisonkeepingpositionholdingstoaminimum, but not to the position-taking function of trading, where positions
maybeheld forvery long timeperiodsbasedon fundamentalviewsofwheremarket prices are headed (refer to Section 2.5 for the distinction betweenpositiontakingandmarketmaking).Isitreallyimportanttomeasureshort-termpricefluctuationsinpositionsbeingheldforthelongterm?Inthiscontext,itisinteresting to note an SEC letter (December 8, 1999) that emphasized theobligation ofmutual funds to value assets based on fairvalue, the amount anarm's-length buyer would currently pay for a security. The SEC letterspecificallystatesthatfairvaluecannotbebasedon“whatabuyermightpayatsome later time, such aswhen themarket ultimately recognizes the security'struevalue as currentlyperceivedby theportfoliomanager”or “prices that arenotachievableonacurrentbasisonthebeliefthatthefundwouldnotcurrentlyneedtosellthesesecurities.”TheseviewsreflecttheG-30principles.Arguments for applying current market valuation and short-term price
exposuremeasurestopositionsbeingheldforthelongterminclude:Thedesiretoholdpositionsforthelongtermmayreflectthemotivationoffundorproprietarypositionmanagers,buttheymaynotbetheonlyconstituencyforvaluationinformationonthefund.Fundinvestors,lenderstothefund,seniormanagersofthefirmofwhichtheproprietarypositionmanagersareapart,andregulatorsmayallhaveaninterestinknowingpricesatwhichthepositionsmaybeexitedinthenearfuture.Investorsmaywanttoexitthefund.Lendersmayneedassurancethatmargincallscanbemet.Seniormanagerscoulddecidethattheywanttoreducetheamountofrisk-takingauthoritybeingallocatedtothepositiontakers.Seniorfirmmanagementwillalsowanttoviewintegratedriskreportsfortheentirefirm,whichwillcoverbothmarketmakingandproprietarypositioningfunctions.Regulatorsmaybeseekingassurancethatfundwithdrawalscantakeplaceinanorderlymanner.AllthesepointswereparticularlyemphasizedbytheLong-TermCapitalManagement(LTCM)experiencediscussedinSection4.2.1.Itispossibletofindanecdotalevidenceofsuccessfulfundmanagersandproprietarytraderswhodonotdesireanyfeedbackfrommarketpricechanges.Theyviewthemselvesasinvestingforthelongrun,andtheyseeshort-termpricechangesasdistractingnoisethatdoesnotreflectchangesinfundamentalvalues,butonlyshort-livedshiftscausedbysupplyanddemandimbalances.However,itispossibletocounterthiswithanecdotalevidenceofsuccessfulfundmanagersandproprietarytraderswhowanttoreceiveconstantfeedbackfromthemarket.Eventhoughtheyareinvesting
forthelongterm,theywanttobeconstantlyawareofthepriceatwhichriskpositionscanbeunwound.Theyattempttomakemoneybyhavingafewpositionsonwhichtheyarerightandearnalargeamount,andavoidhavinganypositionsonwhichtheylosealargeamount.Theconstantfeedbackofmarketpricesatwhichpositionscanbeexitedprovidesbothameanstoensurethatalimitisplacedontheamountthatmaybelostonanyonepositionandasignalthatmarketsaremovinginwaystheydonotfullyunderstand.Insuchcircumstances,theyseektoexitthemarketandwaituntiltheycangainabetterunderstandingbeforereentry.
Analternativebutrelatedargumentwouldbethatfundmanagersdonotneedtobeconcernedwithtailriskbutonlywiththetrade-offbetweenexpectedreturnandstandarddeviationofreturn(theSharperatio),sinceprudentinvestorswillutilizeafundasjustonesmallpartoftheiroverallinvestmentsandthatitisuptoeachinvestortomanageindividualtailrisk.Thisisessentiallytheargumentwe considered in Section 4.2.1 on the LTCM disaster: “Nor is there a majordifference in consequences between bankruptcy and a large loss short ofbankruptcy for an investment fund. It shouldn't matter to investors whether afundinwhichtheyhaveinvested$10milliongoesbankruptorafundinwhichthey have invested $30million loses a third of its value.”And, aswe saw inSection1.3,ifallweneedtobeconcernedaboutistheSharperatio,manyoftheelements of financial risk management, such as the inclusion of subjectivejudgment,arenotasstronglyneeded.Whilethereissometruthtothisargument,italsohassomedeficiencies.Firms
thathavecreditrisktothefund,oftenthroughcounterpartyriskonderivatives,maycareverymuchaboutafund'stailrisk.Regulatorsareshowingincreasingconcernaboutpotentialdestabilizingeffectsofinvestmentfundbankruptcy.Andinvestorsmaybeconcerned that theyarenot receivingadequate return for tailrisks the fund is taking, if these tail risks are unmonitored. There is a strongargumentforatleastmeasuringafund'stailrisks,evenifitisagreatertoleranceforaninvestmentfundtakingrecognizedandadequatelycompensatedtailrisks.Thusweareseeingmoreuseof financial riskmanagement techniquessuchasVaRand stress testing for investment funds (for example,Duc andSchorderet2008).Investment funds inwhich investors are expected to have concentrated risk,
mostparticularlypensionfunds,arecertainlyexpectedtobeconcernedwithtailrisk.Thisisespeciallytruewhentheypursueastrategythatexplicitlydependsonliquidity.Agoodexample iscontingent immunization,astrategydeveloped
byLeibowitzandWeinberger(1981,1982,1983). Incontingent immunization,youconstantlymonitorhowmuchexcessyouhaveinfundassetsrelativetotheamountneededto invest inperfectlysafeassets,suchaszerocouponTreasurybonds, tomeet theminimum payout requirements of the fund.As long as anexcessexists,fundmanagersarefreetoengageinanyinvestmentstrategytheywishandstillbeabletoassuremeetingtheminimumpayoutrequirements—assoonas thesurplusreduces tozero, theywouldswitch thefundassets into thesafeportfolio.Butcalculationofthissurplusrequiresconstantmonitoring,bothastotheamountofsafeassetsneededtomeettheminimumpayout,whichwillchangeaszerocouponTreasuryratesfluctuate,andastotheliquidationvalueofthe current portfolio in the event this switch needs to be made. Constantcalculation of liquidation value requires all of themachinery of financial riskmanagement: accurate, independent, and continuous marking to market; VaRandstresstestcomputationstoassesspotentiallossinliquidation;andvaluationreserves against illiquid positions. O'Kane (2008, Section 22.2) has a gooddiscussionofthegapriskinconstantproportionalportfolioinsurance,aproductwhosedesignisverysimilartoacontingentimmunizationstrategy.
6.2RISKCONTROLOnceanadequatemeasurementofriskisavailable,thenextlogicalquestionishow to control it. Two fundamental and complementary approaches areavailable.Thefirstisforhigherlevelsofmanagementtoplacedetailedlimitsontheamountandtypeofriskthatlowerlevelsofmanagementcantake—limitsonVaR,positionsize,vega,gamma,andsoon.Thesecondisforhigherlevelsofmanagement to provide incentives to lower levels ofmanagement to optimizethetrade-offbetweenreturnandrisk.Thelatterapproach,basedonincentives,giveslowerlevelsofmanagement,whichareclosertotheinformationrequiredtomakeinformedtrade-offdecisions,theflexibilitytofindcombinationsofrisksthat can maximize the return for a total risk level approved by seniormanagement. However, the incentive approach can also lead to unacceptablerisks in the aggregate if too many traders decide to take a similar position,pointingtowardamixeduseofbothapproaches.Thisisthepatternthatcanbefoundatalmostall investmentbanksandwillbe theapproachfollowedin thisbookfordiscussionsofcontroltechniquesforspecificriskclasses.Themostextremeformofanincentive-basedapproachistorestrictcontrolsto
assigningtoeachtradingdeskamaximumamountoftradinglossesthetraders

will be allowed to take before their positions are closed out. This gives thetradingdeskmaximumflexibilityindecidingwhatpositionstoputonandgivescomplete freedom as long as unacceptable losses are avoided. Everyoneconcerned—thetraders,seniormanagers,andriskmanagers—canagreeonsuchstop-loss limits as a bare minimum for risk control. If all positions could beinstantaneouslyliquidatedatanytimeatthevaluesreflectedonthefirm'sbooks,itcouldbeargued that this isanadequate limitstructure.However, therehavebeen toomany instanceswherea traderhasbuiltupa large riskexposure thatprovedcostlytoexitwhenmanagementdecidedtostopoutlosses.Thetimethattradersexceedlosslimitsisoftenalsothetimewhenmarketsaremovingwildly,decreasing liquidity and subjecting positions to large P&L moves even whencloseout can be accomplished in the relatively short time of a day or two.Atleastsomeadditionalformofriskcontrolisneeded.Historically,addedriskcontrolshavemostoftenbeenquitedetailedlimitson
thesizesofspecificexposuresthatcouldbetaken,withlimitsizescloselytiedtoboth the liquidity of exiting the exposure and the degree of managementconfidenceinthetrader.WhentheVaRmeasurewasfirstintroduced,itwasinitiallyseenasapossible
supplementforlimitingrisk.However,soontraderscametoseeitasatoolforgainingaddedflexibility,sinceittreatsallriskasfungibleinarrivingatasinglerisknumber.Sincethisrisknumberisastatisticalestimateofthelossthatcouldoccurduringtheperiodinwhichapositionisbeingcloseddown,anargumentcould then bemade for using this as the only supplement to a stop-loss limit,allowing control on the loss that can occur after management has decided tocloseoutariskpositionwithouttheneedtoplacedetailedcontrolsonparticularexposures.Thiscontrolcan take theformofa limiton the totalVaRexposurethatatradingdeskcantakeand/orameasureofriskinacalculationofreturnonrisk or risk-adjusted return that can be used to compare the performance ofdifferent trading desks against targets and against one another to decide oncompensation,promotion,andcontinuedemployment.The following are arguments favoring an incentive approach, with senior
managementinputreducedtobroadmeasuressuchasstop-losslimitsandVaRlimitsorrisk-returntargets,givinggreatflexibilityindecidingontherisk-takingprofiletothebusiness:
Anincentiveapproachenablestradingdeskstorespondquicklytonewopportunitieswithoutslowingdowndecisionmakingbyneedingtomaketheircasetoseniormanagement.
Bynotrestrictingagiventradingdesktopositionsinaparticularassetclass,anincentiveapproachencouragesbroadthinkingacrossassetclasses,searchingforinterrelationships.Whenatradingdeskisconfinedtoaparticularmarketatatimewhenthereisashortageofgoodtradingopportunitiesinthatmarket,tradersareoftentemptedtopursueriskieropportunitiesinthatmarketastheonlyhopeforearningabonus.Givingtradingdeskstheflexibilitytotradeinothermarketswhentheonetheyspecializeinislesspromisingisawaytoavoidthistemptation.Itislessriskytohavemanytraderswiththeabilitytotakepositionsinagivenmarketthantorestrictpositiontakingtoasingletradingdesk.Inmostcircumstances,positionstakenbyonedeskwillbeoffsetbypositionstakenbyadeskwithadifferentopinion.Whenenoughdesksalllineupinthesamedirectiontocreateasizablenetposition,itisagoodindicationofparticularlyfavorablereturn-on-riskcircumstances.
Thefollowingareargumentsfavoringamoredetailedlimitapproach:Amoredetailedlimitapproachenablesmanagementtorestrictpositiontakinginaparticularmarkettoonlythosetradingdeskspossessingsufficientknowledgeandexpertiseinthemarkettobeabletomakereasonedjudgments.Asacorollarytothepreviousargument,itforcestradingdeskstofocustheirattentiononthoseareasinwhichtheyareexpertwithouthavingthisfocusdistractedbytryingtofindopportunitiesinothermarkets.Therealdangeristhatatradingdeskthatdoesnothaveasuccessfulstrategyinitsprimarymarketcanobscuremanagementrecognitionofthisfactbytryingtobuildaprofitabletradingrecordinanothermarket.ThiscanbeparticularlyharmfulifithelpstoperpetuateaPonzischemeinwhichthefirmisdelayedinrecognizingthemispricingofatransactionwithlong-termconsequences.Ifadeskisallowedtoplayinanothermarket,itisimportanttomakesurethatP&LattributionfirmlyseparatestheresultsfordifferentproductsforthesamereasonwehaveseenthatitisimportanttoseparateP&LinnewlybookeddealsfromP&Lonmanagementofexistingdeals.Asaparticularcase,ifanoptionstradingdeskisallowedtotakesubstantialoutrightpositionsintheunderlyingasset,theP&LfromunderlyingpositionsmustbeclearlyseparatedfromtheP&Lonmanagementofvolatilityandconvexityrisk.Likewise,ifanexoticoptionstradingdeskisnotforcedtolayoffthesubstantialpartofthevanillaoptionsriskit

generates,thentheP&Lfromvanillaoptionsriskmustbeclearlyseparatedfromthatontheresidualexoticoptionsrisk.Thefinalargumentgiveninfavorofmoreflexiblepositiontakingisactuallyquitemisleadingintwodirections.First,itunderestimatesthedegreetowhichopinionscanbeinfectiousandcreatebandwagoneffects,particularlyamongtraderswhoarenotexpertsinaparticularmarket.Theriskisthatwhenthetradingdeskwiththemostexpertiseinaparticularmarketputsonaposition,othertradingdeskswillpileontogetapieceoftheaction.Asaresult,thefirmasawholewillwindupwithamuchlargerpositionthanthetradingdeskwiththeexpertisewouldhavethoughtprudent.Second,whensituationswithlesscertaintyariseandtradingdesksputonoffsettingpositions,thefirmasawholewindsupbeingarbitraged—ithasflatP&Lifthemarketmovesineitherdirection,butmustpayabonustothewinningtradingdeskineithercase.Thispointstotheneedfortradingmanagementtoinsistontradingdesksutilizingdiversestylestoavoidthisformofarbitrage,anddetailedlimitscanplayanimportantroleinenforcingthediversityoftradingstyle.Managementmaydistrusttheexcessiverelianceonstatisticalmeasuresofrisk.Statisticsarebasedonhistoryandmaynotreflectmanagementjudgmentaboutrisk.Thismaybeparticularlytrueinmarketsthattendtowardinfrequentbutlargejumps,suchaspeggedFXrates,which,duetogovernmentintervention,mayshowalonghistoryofverylittlemovementfollowedbyonesharpbreak.Whenthegovernmentresourcesarenolongeradequatetoholdthedesiredpeg,thetendencyisfortheresultingmovetobeverylargetoreflectthemarketpressureswhosereflectioninthepricehasbeensuppressedbygovernmentintervention.Inaperiodwhenthepegstillholds,historicallybasedVaRwillshowverylittlerisk,butthiswillnotadequatelyreflectthepossibilityofajumpmove.Insteadofhistoricalrelationships,VaRcanbebasedonimpliedvolatilities,whichreflectamarketjudgmentoffutureuncertainty,oronmanagementestimatesofrisk.Amoredirectapproachistoexplicitlylimitexposurestomanagement-designedstressscenarios.
Theissueofwhethertopermitatradingdesktotakepositionsininstrumentsoutsideitsprimaryexpertiseisnotjustaquestionofwhetheradeskshouldbeallowedtoactivelyseeksuchpositions.Thisissuealsocomesupasaquestionof whether a desk should be forced to close out positions that result as by-productsofitsprimaryproductfocus.

Consider anFXoptionsmarket-makingdesk.Theirprimaryexpertisewouldbeonissuessuchasthepropermanagementofvolatilityrisk.However,outrightFXpositionsarisenaturallyinthecourseofitsbusiness,aschangesinexchangerate levels lead to changing deltas on its option positions. Should the optionsdesk be forced to close out these outright FX positions, leaving the firm'spositioningofoutrightFXtothespot-and-forwardFXmarketmakers,thefirm'sexpertsatmanaging thesepositions?Orshould theoptionsdeskbeallowed totakeitsownviewonthesepositions?Thesamearguments,proandcon,thatwehavepresentedpreviouslyapplyhereaswell,withaparticularemphasisonthesecondargumentproflexibilityandthethirdargumentagainstflexibility.Thosewho favor flexibility point to the broader view of economics and the
marketsthatwillcomefromthetradingdesklookingatitsoptionspositionsasawhole, rather than trying tobreak themapart into aposition in theunderlyingand a position in volatility. They will point out that this encourages thinkingaboutcorrelationsbetweenunderlyingpricesandvolatility levels thatcanbestbetakenadvantageofbybeingabletomanagepositionsinboththeunderlyingandvolatility.Thesearepowerfularguments,asdiscussedinChapter11.Those suspicious of the consequences of flexibility point to cases in which
poorpricingofvolatilityrisksandpoormanagementofoptionspositionsweredelayed in being recognized by profits that came from taking positions in theunderlying(perhapsjustbycopyingpositionsthat theprimaryunderlyingdeskwasputtingon).This certainly indicates theneed tohave, at aminimum, riskreportingthatclearlybreaksoutP&LattributabletotheunderlyingpositionfromP&Lattributabletovolatilitypositions.Even if management decides in favor of the less flexible approach with
specificlimitsonoptionstraderstakingpositionsintheunderlying,somedegreeofflexibilityshouldberetainedfromapuretransactionalefficiencyviewpoint.For example, if an options trading desk is never allowed any position inunderlyingassets, itwill need to spend toomuchof its timewriting tickets toclose out delta shifts arising from underlying price changes and will lose toomuchofitsP&Linbid-askspreads.(Evenif theseareonlyinternalandhencenotlosttothefirm,itwillstillbedemotivatingtothetraders.)Theargumentswehavepresentedhereforoptionstradersandtheirpositions
intheunderlyingapplyequallytoforwardtradersandtheirpositionsinthespotmarket,basis tradersand theirposition in legsof thebasis, andexoticoptionstradersand theirpositions invanillaoptions thatcanhedgepartof theexotics'risk.

Thisdiscussiononriskcontrolshasimportantimplicationsfortheuseofriskdecomposition techniques throughout the remainder of this book. It explainswhy I place such a strong emphasis on utilizing risk decomposition to breakapartlessliquidtransactionsintoconstituentparts—usuallyamoreliquidpieceand a less liquid residual. Identifying themore liquid constituents enables theseparationofP&Lattributionandencouragesclosingoutpositionswiththedeskthatcancreatethemaximumliquidityforthefirm.Italsoavoidsthebookingofphantom P&L by having a different valuation technique used for the sameposition depending on whether it was created directly or created as part of amore complex transaction. Finally, it also avoids the firm's unknowinglybuildingalargepositioninaparticularproduct.Forexample,thismotivatestheuseofaformulaforvanillaoptionsthatdoesallthepricingandrepresentationofriskintermsofforwardpricesderivedfromthetradingdeskthatistheprimarymarketmakerinthatproduct(seeChapter11)andmotivatestheattempttopriceand represent the risk of exotic options to the greatest extent possible as acombinationofvanillaoptionspricesderived from the tradingdesk that is theprimarymarketmakerinthatproduct(seeChapter12).A closely related question is whether trading books that take positions in a
productinwhichtheyarenotaprimarymarketmakershouldbeforcedtodoalltheir transactions through the firm's primary market-making desk for theproduct. As a concrete example, consider a trading desk specializing in FXoptions, which will certainly need to transact hedges in underlying spot andforwardFX. Should the traders be forced to transact all such hedgeswith thefirm'sspotandforwardFXtradingbook,orshouldtheybegiventhechoiceofdealingdirectlyinthemarket?Notethatthisissuearisesregardlessofwhethertradinglimitsareusedtoforce
the options desk to restrict its outright FX positions to a small size. In eithercase, thedeskwillbetransactingat leastsomehedgeseitherinternallyorwiththemarket.Theargumentsforrequiringinternalhedgingarepowerful:Itenablesthedeskwiththegreatestexpertiseandadvantageintradingaproducttobetheoneinitiatingallexternaltransactions.Itreducestheamountoftransactioncoststhefirmmustpaybyencouragingtradesinoppositedirectionstobeclosedoutwithinthefirmandenablinginternaltradestobecrossedwithcustomertransactions.Nothingpleasestradersmorethantobeabletoboastoftheprofitstheyhavemadebystandinginthemiddleoftradesinoppositedirectionsputonbydifferent

desksofarivalfirm.Evenifpositionsarenotcompletelyoffsettingorexactlysimultaneous,funnelingthetradesthroughasingledeskenablesthatdesktoseethetotalflowofthefirm'sdealingsintheproduct.Thisdeskcanbuildonobservedpatternsofusagetoforecastandanticipateflowsandminimizetransactioncosts.Theuseofacommoncentraltradingdeskforcesalldeskswithinthefirmtovaluepositionsinthesameproductatacommonprice.Thisavoidsphantomprofitsarisingfromtheinternalarbitragethatcanoccuriftwodesksvaluetheirpositionsinthesametradeusingdifferentbrokerquotesordifferentmodels.Propervaluationdisciplinecaneliminatethisevenifapolicyofforcingalltradesthroughasingledeskisnotemployed,butthisistheeasiestmechanismforenforcingthisrule.
Theargument forpermittingseveraldesks to trade thesameproductdirectlywithotherfirmsisthatcompetitionforbusinesswillcreateenoughefficienciestoovercomethesestrongadvantagesofacommoncentraltradingdesk.Thefearisthatcreatinganinternalmonopolyinaproductwillpermitthemonopolisttotrytocollectmonopolyrentsfromtheotherdesks tradingin theproduct—thatis, topriceatexcessivebid-askspreads thatwill increaseprofitsof thecentraldesk, but decrease the firm's overall profit by discouraging optimal use of theproductbyotherdesks.Avoiding this situationmay require adifficult internalpolicing effort (it's not always easy tomeasure the sizeof thebid-ask spreadsbeingused,sincetradesindifferentdirectionsdonotcomeinsimultaneously).
CHAPTER7
VaRandStressTestingInthestatementofrequirementsforrobustriskmanagementinSection6.1.1,theestimationof losses thatcouldresultfromliquidationofpositionsfiguredveryprominently.Thisshowedupundertheheadings“Theneedforsimulation”and“The need to consider periods of reduced liquidity.” The need for simulation,whichcloselycorrespondstotheG-30Recommendation5,“MeasuringMarketRisk,” isdiscussed indetail in thischapterasvalueat risk(VaR).Theneed toconsider periods of reduced liquidity, which closely corresponds to the G-30Recommendation6, “StressSimulations,” isdiscussed in this chapter as stresstesting.These twomethods formeasuring the total risk exposure of a portfolio still
needtobesupplementedbymoredetailednonstatisticalriskmeasures,suchasthevalueofthebasispoint,delta,orvega,forreasonsgiveninSection6.2.Butmeasures of total portfolio risk do offer advantages that detailed nonstatisticalriskmeasuresdonot:
Nonstatisticalmeasuresdonotallowseniormanagerstoformconclusionsastowhicharethelargestriskscurrentlyfacingthefirm.Itisnotpossibletomeaningfullycomparethevalueofabasispointintwodifferentcurrencies,sincethiscomparisondoesnotreflecttherelativesizeofpotentialinterestratemovesinthetwocurrencies.BothVaRandstresstestinggiveameasurethatcombinesthesizeofpositionandsizeofpotentialmarketmoveintoapotentialimpactonfirmprofitandloss(P&L).Moreover,bothproduceameasurethatcancomparerisksbetweendisparatebusinesses,suchasinterestratesandequities.Nonstatisticalmeasuresdonotinteractwithoneanother.Shouldyouadduptherisksunderdifferentmeasuresintosometotalrisk?Clearlythiswouldbewrongbecauseitwouldignoretheeffectofcorrelationbetweenmarketfactors.BothVaRandstresstestingaccountdirectlyforcorrelationbetweenmarketfactors.
We will first discuss the methodology of statistical measurement, VaR, andthendiscussthemethodologyfornonstatisticalmeasurement,stresstesting.A book-length treatment of the topics discussed in this chapter is Dowd
(2005),whichoffersawealthofdetailandcoversallthemethodsthatIconsider

bestpracticesinthisarea.ThisisabookIrecommendhighlyforthoseworkingon implementationofVaRmethodology.Youwill seemany references to it inthischapter.WhatIofferherearetheaspectsofVaRthataremostimportantforeveryone involved with risk management to know, and those methodologicalconsiderationsforimplementationthatmyexperienceinthefieldhasshowntobeofgreatestconsequence.
7.1VARMETHODOLOGYStrictlyspeaking,VaRisameasureof theworst loss thatcanoccuratagivenconfidencelevel.ButthestatisticalmethodologyusedtodetermineVaRcanalsobeused tocalculatebroadermeasuresof thedistributionofpotential losses. InSection7.1.1we'llfirstlookatthemethodologyforcalculatingthedistributionandinSection7.1.2we'llturntothequestionofhowbesttosummarizeit.Since statistical riskmeasures first began tobe calculatedby financial firms
(about20yearsago),threemethodshavedominated:1.DirectmeasurementofP&Ldistribution.2.CalculationofP&Ldistributionbasedonhistoricalstatisticsrepresentingthe variance and covariance of market variables and the current size ofpositionexposurestoeachofthesemarketvariables.Soifsi represents thefirm'sexposure toeachmarketvariable,σi represents thevolatilityofeachmarketvariable,andρi,j represents thecorrelationcoefficientbetweeneachpairofmarketvariables,thevolatilityofoverallfirmP&Liscalculatedas:
TheP&Ldistributioncannowbecalculatedfromthisvolatility.3.SimulationofP&Ldistributionsbasedonaselectedsetofpossiblemovesofmarketvariablesandthecurrentsizeofpositionexposuretoeachofthosemarket variables. So if si represents the firm's exposure to each marketvariable,mi,j represents the size of move of eachmarket variable in eachconsidered scenario, and pj represents the probability assigned to eachscenario,with:
ThentheP&Lmovementineachscenarioiscalculatedby:
AndtheP&Ldistributioniscalculatedbymultiplyingeachofthesetermsby
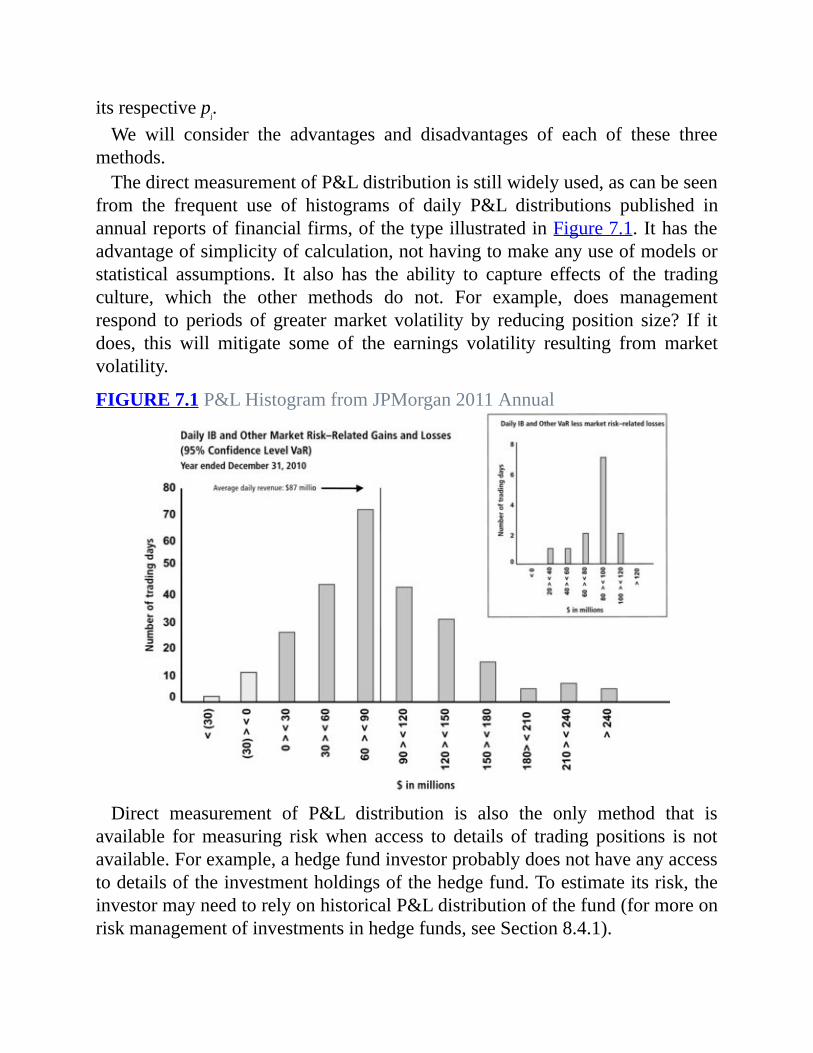
itsrespectivepj.We will consider the advantages and disadvantages of each of these three
methods.ThedirectmeasurementofP&Ldistributionisstillwidelyused,ascanbeseen
from the frequent use of histograms of daily P&L distributions published inannualreportsoffinancialfirms,ofthetypeillustratedinFigure7.1.Ithastheadvantageofsimplicityofcalculation,nothavingtomakeanyuseofmodelsorstatistical assumptions. It also has the ability to capture effects of the tradingculture, which the other methods do not. For example, does managementrespond to periods of greatermarket volatility by reducing position size? If itdoes, this will mitigate some of the earnings volatility resulting from marketvolatility.
FIGURE7.1P&LHistogramfromJPMorgan2011Annual
Direct measurement of P&L distribution is also the only method that isavailable formeasuring riskwhen access to details of trading positions is notavailable.Forexample,ahedgefundinvestorprobablydoesnothaveanyaccesstodetailsoftheinvestmentholdingsofthehedgefund.Toestimateitsrisk,theinvestormayneedtorelyonhistoricalP&Ldistributionofthefund(formoreonriskmanagementofinvestmentsinhedgefunds,seeSection8.4.1).

However, directmeasurement of P&Ldistributions cannot take into accountthe possibility that current position taking may be radically different fromhistoricalpositiontaking(inthefundmanagementworld,thisisknownasstyledrift).Corporate riskmanagersand regulatorswill insiston riskmeasures thatfully reflect current portfolio composition, whenever available. This rendersdirectmeasurementoftheP&Ldistributionclosetouselessasastand-aloneriskmeasure,thoughitisstillvaluableasacomplementtoothermeasures.Theuseofthevariance-covariancemethodhasnowbeenvirtuallyabandoned
by sophisticated financial firms in favor of simulation methods. The primaryreasonforthisisthatrelativetothesimulationmethod,thevariance-covariancemethodprovidesverylittleflexibilityinevaluatingthecontributionofnonlinearpositions, notably options positions, to P&L distributions. As we will see,simulationgives theflexibility to tailor thedegreeofdetailused incalculatingnonlinearpositions to thedegreeofaccuracy required forparticularportfolios.Detailcanrangefromsimplefactorapproximations(usingdelta,gamma,vega,etc.)tofullvaluationofeachindividualoption,withseveralgradationsavailablein between. By contrast, variance-covariance can't go beyond factorapproximation.Secondaryreasonsare:
Thegreaterdifficultythatthevariance-covariancemethodhasindealingwiththefat-taileddistributionsnormallyencounteredinfinancialmarkets.Theinabilityofvariance-covariancetopickupthephenomenon,oftenobservedinfinancialmarkets,thatthelargestchangesinvariablesoftenclustertogether(e.g.,thehighcorrelationbetweenstockmarketsindifferentcountriesinthe1987stockcrash)toagreaterdegreethanwillbeindicatedbycorrelationcoefficients(i.e.,thejointdistributionisnotbivariatenormal).Therealizationthatalmostallthebenefitsofsimplicityandspeedofcomputationclaimedforvariance-covariancerelativetosimulationwerebasedonfallaciouscomparisons.Aswillbeseeninourdiscussionofsimulationmethodology,thedegreeofsimplicityandspeedofcomputationarelargelydeterminedbythechoiceoftheuser.Achievingalevelofaccuracysimilartothatobtainedbyvariance-covariance,simulationisatleastassimpleandfasttocomputeasvariance-covariance.Simulationofferstheflexibility,whichvariance-covariancedoesnot,ofincreasingaccuracyasatrade-offagainstsimplicityandcomputationtime,buthavingmoreflexibilitycansurelynotcountasadisadvantage.
Currently, theprimaryusersofvariance-covariancearesmaller firms thatdo
notholdsignificantoptionspositionsandthatwishtooutsourcethemarketdatacomponentoftheirVaRcomputations.Forsuchfirms,variance-covariancedoesoffer the distinct advantage that they only need to obtain volatilities andcorrelationsratherthantheday-by-daypricinghistoriesrequiredforsimulation,aconsiderablesavingsintheamountofdatatobetransferred.InExercise7.1,youwillhaveachance to seeanexampleofhowvariance-
covariance computes VaR and why a simulation calculation that is as simplecomputationallyandissuperiorinflexibilityisalwaysavailable.Iwillthereforenotspendanymoretimeonvariance-covarianceorthevarioustricksthathavebeen devised to provide capability to approximate option positions andincorporate fat tailswithin it. For readerswhowish topursue this approach, IrecommendChapters6and10ofDowd(2005).
7.1.1SimulationoftheP&LDistributionRemember that the simulation approach consists of determining a number ofpossible scenarios, to be indexed by j, determining the size of move of eachmarketvariableineachscenariomi,j,andthencalculating:
as the firm's total P&L movement in each scenario. The steps in a P&Lsimulationconsistof(1)determiningasetofscenariosspecifiedbythesizeofmove in each of a set of underlyingmarket variables and a probability to beassigned to each set and (2) translation from the size of move of underlyingmarket variables to size of move for all market variables. For example, theunderlyingmarketvariablesforasetofbondpositionscouldbeinterestratesfor10keytenors,andthefullsetofmarketvariablescouldbepricesforindividualbonds. There are two alternative approaches to the first step—historicalsimulationandMonteCarlosimulation.Thedecisionstobemadeforthesecondstepdonotdependon thechoicemadefor thefirststep.Wewilldiscusseachstepinsomedetail.
7.1.1.1Step1:DetermineUnderlyingMarketProbabilitiesThehistoricalsimulationapproachisquitesimple;agroupofhistoricalperiodsis chosen and the observed sizes of market moves in each of these historicalperiods constitute the scenarios. So, for example, you could choose 1,200

scenariosconsistingofall themost recentone-business-daychanges inmarketvariables—thechangesinmarketvariablesfrom6/7/99to6/8/99wouldbeonescenario,thechangefrom6/8/99to6/9/99anotherscenario,andsoforth.Oronecouldchooseallthe10-business-daychanges.The most commonly used method for historical simulation assigns equal-
probability weights to all of these possible market moves. This makescalculation of VaR very simple, since it is just equivalent to one particularscenario (for example, if you wanted the 99th percentile VaR and you areworkingwith1,200scenarios,the12thworstlossinanyofthesescenariosisthe99th percentile VaR). When we explain the calculation of measures of P&Ldistribution in Section 7.1.2, we will discuss the possible advantages of andmethodologyforassigningunequalprobabilityweightstothesemarketmoves.Historical simulation offers a large advantage in terms of simplicity—
simplicity of implementation, simplicity of assumptions, simplicity ofexplanation. The advantage in terms of assumptions is that no modelingassumptionneedstobemadebeyondtheassumptionthattheimmediatefuturewill resemble the past. There is no parameterization of either variance orcorrelationandnoassumptionsaboutdistributionshape(e.g.,normality). If fattailsorclusteringoflargemovesbetweenvariablesarepresentinthehistoricaldata,theywillbereflectedinthesimulation.Theadvantageintermsofexplanationisthatanyquestionsraisedbytradersor
managersconcerningaVaRthatseemstoohighcanbeeasilytracedtoasubsetofspecifichistoricaldatesthatwouldshowlargelossesagainstthecurrentfirmholdings.Disagreement can be quickly focused on accuracy of data for a fewspecificdatesoronargumentsabouttheprobabilitiestobeassignedtorepetitionof particular historical events. By contrast, both the variance-covarianceapproachandtheMonteCarlosimulationapproachmakeitfarmoredifficulttoresolvesuchquestions.Thisadvantageofsimplicityofhistoricalsimulationalsounderliesitsprimary
disadvantage—the VaR produced is dominated by market moves on a fewspecific historical days. If a particular combination of market events did notoccurinthehistoricalperiodbeingconsidered,itcannotcontributetoVaR.Itisdifficult to overcome this problemby just expanding the historical period youareconsidering.Dataavailabilitytendstogetsparseonceyougobackmorethana few years, because of failure to retain data, because data becomes moredifficult to clean the further back you go in time, and because some currentlytradedinstrumentsmaynothavehistoriesthatgobackthatfar.

ThisdisadvantageofgeneratingscenariosutilizingthehistoricalmethodistheprimaryargumentinfavoroftheMonteCarlomethod.TheMonteCarlomethodstartswith a specification of the underlyingmarket variables that is similar tothatofthevariance-covarianceapproach,butmayhavearicherspecificationofeach single variable than just a volatility—for example, a multiparameterspecification that allows thegenerationofdistributions that are skewedor fat-tailed.MonteCarlogenerationofdistributionsthatfitspecifiedparameterscanbeachievedinseveralways:
Bymixingtogethernormaldistributions,distributionsthatareskewedandfat-tailedcanbegenerated.ThiscanbedoneusingtheMixtureOfNormalsspreadsheetweencounteredinChapter1.Mixingnormaldistributionswiththesamemeananddifferentvolatilitiesproducesfattailsbutnoskew.Thelargerthedifferenceinvolatilities,thegreaterthekurtosis,ameasureofhowfat-tailedthedistributionis.Mixingnormaldistributionswithdifferentmeansanddifferentvolatilitiesproducesbothfattailsandskew.MoredetailcanbefoundinDowd(2005,Section6.5.3)andWang(2001).Byusingstochasticvolatilityandjumpprocessspecifications,similartothosewediscussinSections11.6.2and12.3.2.SeealsoHull(2012,Sections26.1and26.2)andDowd(2005,Sections6.5.4and6.5.5).ByusingprocessesspeciallydesignedtogenerateMonteCarlodistributionsthatmatchgivenskewandkurotsisparameters,suchasthosediscussedinShaw(1997).MonteCarlotechniquesarethenusedtogenerateasetofscenariosthatfitthedesiredstatisticalspecifications.Shaw(1997)discussesbuildingMonteCarlosimulationsfollowingthealgorithmofRambergetal.(1979).Animplementationofthisalgorithmcanbefoundonthewebsiteforthisbook(thisalgorithmonthewebsiteiscalled“Quasifit”).
Usually, users of Monte Carlo simulation want to take advantage of theflexibility it offers to generate many more scenarios than can be practicallygeneratedwithhistoricalsimulation.ThishasledtotheincorrectassertionthatMonteCarlosimulationrequiresmorescenariosthanhistoricalsimulationdoes.Rather, Monte Carlo simulation offers the flexibility of achieving greateraccuracy if the greater expense of running more scenarios is justified by theincreaseinaccuracy.Standardcomputerizedtechniquesforimprovingthetrade-off between accuracy and speed for Monte Carlo simulation can also beemployed (e.g., stratified sampling, importance sampling, low-discrepancysequences; see Hull 2012, Section 20.7; Dowd 2005, Section 8.4; and Jackel2002,Chapters8and10).

AdvantagesthatMonteCarlosimulationoffersare:Abilitytoselectthemostsuitabletechniquetoestimateeachparameter.Volatilitiesandcorrelationscanbeforecastusingstatisticaltechniquessuchasweightedmovingaveragesandgeneralizedautoregressiveconditionalheteroscedasticity(GARCH).Foradiscussionofthemostcommonstatisticalmethodsusedinforecastingvolatilitiesandcorrelations,seeHull(2012,Chapter22),Dowd(2005,Chapter5),andJorion(2007,Chapter9).Statisticalmethodsforadjustingparametersderivedfromhistoricaldatatobemorerobust,includingrandommatrixtheoryandshrinkageestimation,canbefoundinFabozzi,Focardi,andKolm(2006,Chapters8and9).ValuablediscussionofthistopiccanalsobefoundinMeucci(2005,Chapter4).Swensen(2000,Chapter5)isavaluableapproachwithlessemphasisonstatisticalmethodologyandmoreoneconomicinsight.Whereimpliedvolatilitiesareavailable,theycanbesubstitutedfororblendedwithstatisticalmeasures.(Shouldimpliedvolatilityalwaysbeusedwhenavailable?We'llexaminethisquestionattheendofthissubsection.)Thechoicecanbeseparatelymadeforeachvariable,thoughyoudoneedtobecarefulnottogenerateimpossibleorimplausiblecombinationsofcorrelationcoefficients;fordiscussionofhowtoavoidcreatingimpossiblecorrelationmatrices,seeDowd(2005,Section5.3).Abilitytoselectthemostrelevantdatasetforestimatingeachparameter.Youmighthave10yearsofgoodhistoricaldataforonevariableandonlytwoyearsforanother.Historicalsimulationwouldforceyoutouseonlytwoyears'worthofdataforboth.MonteCarlosimulationletsyouchoosethedatasetindividuallyforeachvariable.Youcanalsochoosethemostappropriateweightstoassigntodifferenthistoricalperiodsforeachvariable,withmorediscountingofolderhistoricaldataforsomevariablesthanforothers.Historicalsimulationcanonlyutilizeasingleweightingschemethatappliesequallytoallvariables(seethediscussionofthisweightingofhistoricalsimulationinSection7.1.2).Abilitytoselectthemostrelevantdatasetforestimatingdifferentaspectsofasinglevariable.Forexample,volatilitycouldbebasedonrecentdataorderivedfromanimpliedvolatilitywhilehigher-orderparametersofthedistributionareestimatedfromlongerdataperiods.Recentdataisoftenconsideredabetterpredictorofnear-termfuturevolatility,butshapeparameters,suchasfatnessoftails,arehardtodiscernfromasmalldataset.
Greaterflexibilityinhandlingmissingdata.Dataforindividualdatescanbemissingbecauseaparticularmarketwasclosedforaholidayorbecauseoferrorsindatagathering.Infact,allsourcesofmarketdata,whetherdatavendors,brokers,ordatabasesinternaltothefirm,arenotoriouslypoorinqualityandrequiremajordatascrubbingefforts.Butsomedatawillnothavesufficientduplicationofsourcestoscrubsuccessfullyandmustberegardedasunavailable.MonteCarlosimulationcanexcludeperiodsforwhichaparticulardataseriesismissingfromthecalculationofeachindividualvariablewithoutexcludingthisperiodfromthecalculationofothervariablesforwhichthedataareavailable.Historicalsimulationlacksthisflexibility—itmusteithercompletelyincludeorcompletelyexcludeaparticularday'sdata.Greaterflexibilityinhandlingnonsynchronousdata.Correlationsobservedbetweenvariablesthataresampledatdifferenttimesofthedaycanbehighlymisleadingandresultinsignificantmisstatementsofrisk.MonteCarlosimulationhastheflexibilitytomeasurecorrelationforeachindividualpairofvariablesbasedonquotationsfromthebesttimeofdaytorepresentthatparticularpair,orbybasingthecorrelationonamultidaytimeinterval,whichwilltendtosmoothoutnonsynchronouseffects.Formoredetailonstatisticalmethodsthatcanbeusedinestimatingcorrelationsbetweennonsynchronousdata,seeRiskMetricsGroup(1996,Section8.5)andHolton(2003,Section6.3).Abilitytocombinehistories.Consideracorporatebondheldinthefirm'sportfolio.Byhistoricalexperience,oneknowsthatsomeofthesebondsmaysufferaratingsdowngradeandsubsequentlargefallinprice.Butitmaybethatnoneofthebondscurrentlyheldhassufferedsuchadowngradesincethefirmavoidsholdingsuchbonds.Historicalsimulationwouldshownoratingsdowngradeeventsforthesebonds.ButMonteCarlosimulationcouldbeusedtocombineratingsdowngradepossibilitiesbasedonthehistoryofalargepoolofbondswithspecificpricinghistoryofactualbondsheld.Anotherexamplewouldbeaforeignexchange(FX)positionheldinacurrencythathasbeenpeggedatafixedexchangeratetothedollarbygovernmentintervention.Youmayhavenohistoricalexampleofthisparticularcurrencydevaluing,yetwanttoincludesomeprobabilityofdevaluation.MonteCarlosimulationcouldincorporateadevaluationevent,possiblyparameterizedbydevaluationexperienceinothercurrencies,asa

jumpprocesssuperimposedonthespecifichistoryofthisFXrate.Stillanotherexamplewouldbetwostocksthathavebeguntradinginaverytightlyrelatedfashionsinceamergerannouncement.YouwouldnotwanttoreflecttheirpreviousmorevolatilearrangementaspartofthehistorythatdeterminesVaR.Soyoumustgeneratethepriceofonestockasafunctionoftheother,butwitharandomelementintroducedtorepresenttheriskofasharpbreakinthepricerelationshipifthemergerfailstogothrough.Thisrandomelementshouldbebasedonthepricehistoryofalargepoolofstockpairsfollowingamergerannouncement.Finally,MonteCarlosimulationallowsusersgreatflexibilityindecidingonthemosteffectiveapproachtospecifyingeachindividualvariable.Considerasanexamplespecifyingparametersforcreditdefaultswaps(CDSs)(seeSection13.1.1.2formoredetailsonCDSs).CDSpricesforsomecorporationsmayhavesufficientliquiditythatyouwanttoestimatetheparametersforthispricebasedsolelyonthepricehistoryofthisparticularCDS.ForothercorporationswithlessliquidityinCDSprices,youcanchoosetobreaktheCDSpriceupintoacreditspreadonabondissuedbythatcorporationplusaspreadbetweentheCDSspreadandthebond'screditspread(we'llcallthistheCDSbasis).Theparametersforthecreditspreadonthebondmightbebasedsolelyonthehistoryofcreditspreadsforthiscorporation'sbonds,whiletheparametersfortheCDSbasismightbebetterestimatedfromobservationsofCDSbasishistorydrawnfromalargeruniverseofsimilarcorporations.EventhoughyouareestimatingtheCDSbasisforseveraldifferentcorporationsfromthesamedatasource,youdon'texpectthemtobeperfectlycorrelated,butyoucanestimateacorrelationcoefficientfromhistoricalobservationsofhowchangesinCDSbasisdifferbetweencorporations.
It is straightforward to reproduce any desired correlationmatrix in aMonteCarlosimulationusingtheCholeskydecompositionmethoddescribedinDowd(2005, Section 8.3). But covariance matrices employ correlations based onmultivariatenormaldistributionsandthereforedonotcaptureanyrelationshipsthat are extremely unlikely under this hypothesis (e.g., the clustering of largechanges in variables). Addressing these concerns requires more refined dataanalyses.Forexample,differentcorrelationmatricescouldbeuseddependingonthesizeofpricemoves(seeKimandFinger2000).Daysinwhichpricemovesare largerwould use a correlationmatrix derived from a sample of dayswithlargemoves.TheMixtureOfNormalsspreadsheetcanproducecorrelationswith
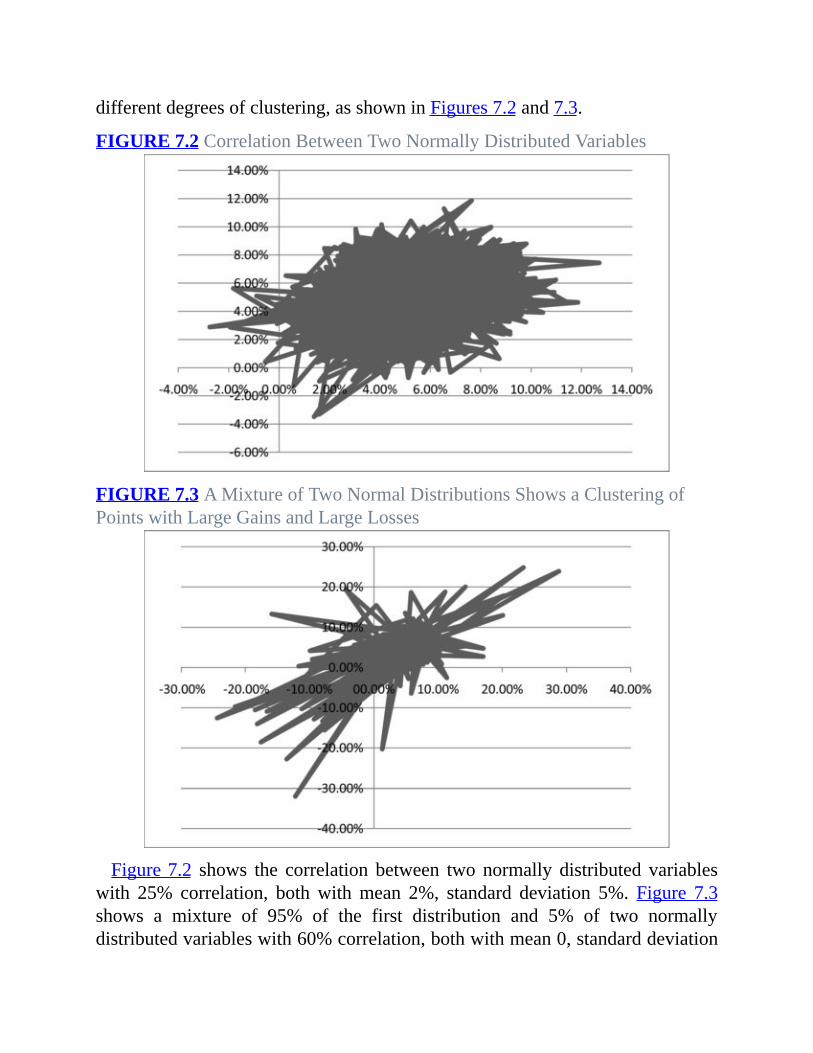
differentdegreesofclustering,asshowninFigures7.2and7.3.
FIGURE7.2CorrelationBetweenTwoNormallyDistributedVariables
FIGURE7.3AMixtureofTwoNormalDistributionsShowsaClusteringofPointswithLargeGainsandLargeLosses
Figure7.2 shows the correlation between two normally distributed variableswith 25% correlation, bothwithmean 2%, standard deviation 5%. Figure 7.3shows a mixture of 95% of the first distribution and 5% of two normallydistributedvariableswith60%correlation,bothwithmean0,standarddeviation

10%.NotetheclusteringofpointswithlargelossesinbothvariablesandlargegainsinbothvariablesinFigure7.3.Thisclusteringdoesnotappear inFigure7.2,whichdisplaysamultivariatenormaldistribution.More general methods for analyzing nonlinear correlations and generating
Monte Carlo distributions based on this analysis have been widely studied inrecent years.This is knownascopulamethodology; seeDowd (2005,Section6.8)fordetails.Given all these advantages to Monte Carlo simulation in its flexibility to
handle data and estimation issues, it is preferable, and sometimes evenunavoidable,tostillemploysomeMonteCarlosimulationtechniqueswhenyouhavechosenhistoricalsimulationasyourprimarymethodology.Considertheseexamples:
Acertainstockheldinyourportfoliohasonlyrecentlybeenissued.Todevelopapasthistoryforthepriceofthisstockforuseinhistoricalsimulation,youmayrepresentitbysomeformulabasedonaselectedstockindex.Butifyouarelongthisstockandshortthisindex,youwouldmeasureyourpositionashavingnoriskduringtheperiodwhenitisrepresentedbytheindex.Toavoidthis,youneedtointroducearandomelementintoyourgenerationofthestock'sbackpricehistory,basingthesizeoftherandomelementonobservedchangesduringtheperiodsincethestockbegantrading.ButthisispreciselytheMonteCarloapproach.Theratingsdowngraderiskcase,theFXdevaluationriskcase,themergerarbitrageriskcase,andtheCDSbasiscasediscussedinthebulletpointheaded“Abilitytocombinehistories”underadvantagesofMonteCarlosimulationaregoodexamplesofwherearandomelementneedstobeintroducedintothehistoricalseries.
Incaseslikethese,howshouldarandomelementbeintroducedintohistoricalsimulation? One method that is sometimes used is to randomly assign thedistribution of the random element among the days of historical data. Forexample, if there is a 1 in 250 chance of a ratings downgrade for a bond, thepricedropthatwouldresultfromadowngradewouldberandomlyassignedtofourdaysoutofa1,000-dayhistoricalsimulation.Butthishasalargechanceofhaving no impact on the VaR measurement since the four days randomlyselected would likely miss the days of largest losses that determine the VaRmeasure,butasmallprobabilityofhavingalargeeffectifithappensthatoneofthefourdaysselectedatrandomcorrespondstooneof thedaysof largest lossthatdeterminetheVaRmeasure.

IbelievethatthisrandomnessincontributingtoVaRcontributesnothingtotheaccuratemeasurementofrisk.ItisfarbettertosimplyacceptthatthispartoftheVaRmeasurementmust be performedbyMonteCarlo simulation, even if youhavechosen todo thebulkofyourVaRmeasurementbyhistoricalsimulation.Thehistoricalsimulationresultsforthemainbodyoftheportfolioaretreatedasa single series as input to the Monte Carlo simulation, with a uniformdistribution assigning an equal probability to each day's simulated result (forexample,ifthereare1,000simulateddaysinthehistoricalsimulation,eachpathintheMonteCarlosimulationhasa1in1,000chanceofpickingeachofthesedays).Theelementsthatcannotbetreatedbyhistoricalsimulationwouldbetheremaining series in theMonteCarlo simulation, parameterized as discussed inthe section on Monte Carlo simulation. Correlations between factors will bechosenbasedonbesthistoricalevidenceandeconomicintuition.ThereareotherareasinwhichhistoricalsimulationcanusefullyborrowMonte
Carlo simulation techniques. For example, historical simulations can bemodified tochooseavolatility for aparticular instrumentbasedonanyof thetechniquesmentionedinthefirstbulletpointunderadvantagesofMonteCarlosimulation.Allthatisrequiredistomultiplyeachhistoricalobservationfortheinstrumentbytheratiobetweenthedesiredvolatilityandthevolatilityoverthehistorical period. This transformation leaves all shape characteristics of thehistorical distribution, such as fatness of tails and correlation structure, intact.ThisapproachisillustratedintheVaRspreadsheet,usingthevolatilityoverrideinputexplainedinthedocumentationforthehistoricalsimulationportionofthespreadsheet.Dowd(2005,Section4.4.2)outlinesasimilaridea.When it comes todealingwithmissingor nonsynchronousdata, theoptions
forhistorical simulationarevery limited.Somewayneeds tobe identified formodifyingdatabeforeitisinputintothesimulation.Formissingdata,sometypeofstatisticalinferencemustbeusedtoarriveata
mostlikelyvalueforthemissingdatabasedonthelastpriorgooddatapoint,thenextfollowinggooddatapoint,andgooddatapointsforrelateddataseries(forexample,ifdataismissingforaninterestrateforatwo-yeartenor,relateddataserieswould be interest rates for the one-year tenor and the three-year tenor).Thesimplestmethods involveaveragingbetween the lastpriorgoodpointandnext following good point, but overlook valuable information from other dataseries.Ataminimum,oneshouldmodifysimpleaveragingtofollowthepatternofchangethattookplaceinrelateddataseriesbetweenthelastpriorgooddatapoint and next following good data point. Possibly, more advanced statistical
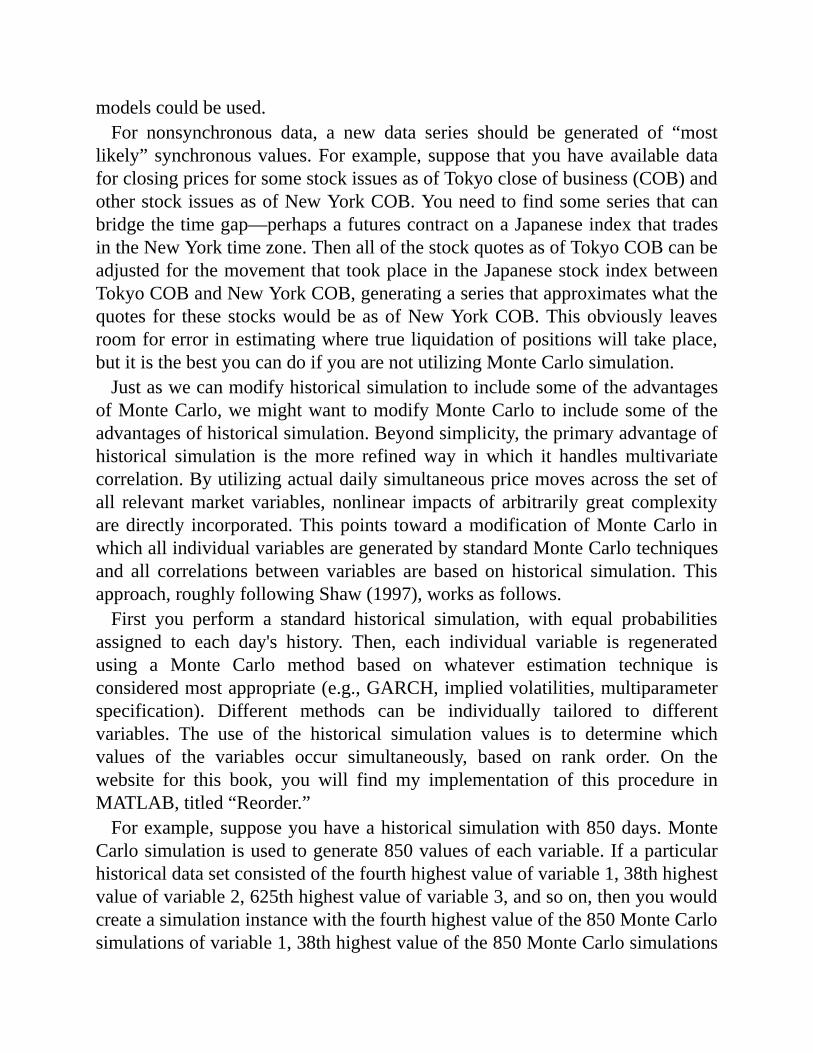
modelscouldbeused.For nonsynchronous data, a new data series should be generated of “most
likely”synchronousvalues.Forexample,suppose thatyouhaveavailabledataforclosingpricesforsomestockissuesasofTokyocloseofbusiness(COB)andotherstockissuesasofNewYorkCOB.Youneedtofindsomeseriesthatcanbridgethetimegap—perhapsafuturescontractonaJapaneseindexthattradesintheNewYorktimezone.ThenallofthestockquotesasofTokyoCOBcanbeadjustedforthemovementthattookplaceintheJapanesestockindexbetweenTokyoCOBandNewYorkCOB,generatingaseriesthatapproximateswhatthequotes for thesestockswouldbeasofNewYorkCOB.Thisobviously leavesroomforerrorinestimatingwheretrueliquidationofpositionswilltakeplace,butitisthebestyoucandoifyouarenotutilizingMonteCarlosimulation.Justaswecanmodifyhistoricalsimulationtoincludesomeoftheadvantages
ofMonteCarlo,wemightwanttomodifyMonteCarlotoincludesomeoftheadvantagesofhistoricalsimulation.Beyondsimplicity,theprimaryadvantageofhistorical simulation is themore refinedway inwhich it handlesmultivariatecorrelation.Byutilizingactualdailysimultaneouspricemovesacrossthesetofall relevantmarket variables, nonlinear impacts of arbitrarily great complexityaredirectly incorporated.Thispoints towardamodificationofMonteCarlo inwhichallindividualvariablesaregeneratedbystandardMonteCarlotechniquesand all correlations between variables are based on historical simulation. Thisapproach,roughlyfollowingShaw(1997),worksasfollows.First you perform a standard historical simulation, with equal probabilities
assigned to each day's history. Then, each individual variable is regeneratedusing a Monte Carlo method based on whatever estimation technique isconsideredmostappropriate(e.g.,GARCH,impliedvolatilities,multiparameterspecification). Different methods can be individually tailored to differentvariables. The use of the historical simulation values is to determine whichvalues of the variables occur simultaneously, based on rank order. On thewebsite for this book, you will find my implementation of this procedure inMATLAB,titled“Reorder.”Forexample,supposeyouhaveahistoricalsimulationwith850days.Monte
Carlosimulationisusedtogenerate850valuesofeachvariable.Ifaparticularhistoricaldatasetconsistedofthefourthhighestvalueofvariable1,38thhighestvalueofvariable2,625thhighestvalueofvariable3,andsoon,thenyouwouldcreateasimulationinstancewiththefourthhighestvalueofthe850MonteCarlosimulationsofvariable1,38thhighestvalueofthe850MonteCarlosimulations

ofvariable2,625thhighestvalueoftheMonteCarlosimulationsofvariable3,andsoon.While this approach retains many of the advantages of Monte Carlo
simulation, it cannot incorporate themall. It lacks the flexibility to base somecorrelationsononedatasetandothercorrelationsonanotherdataset.Itrequirescomplete data for every variable in every day to be included in the datesdeterminingthecorrelationstructure.Andithasthesameproblemsashistoricalsimulationwithnonsynchronousdata.Finally,let'sexaminethequestionofwhetherimpliedvolatilityshouldalways
bepreferredtohistoricalvolatilitywhenitisavailable.InChapters11and12ofthis book, “Managing Vanilla Options Risk” and “Managing Exotic OptionsRisk,” I argue strongly for always valuing options at volatilities implied fromliquid market prices. But this is a pricing argument—we need to determineprices at which longer-term volatility risk can be exited in order to convertlonger-term risks into shorter-term risks. VaR is already dealing with shorter-termrisks,usuallyovernight. It isalsodoubtful that thereare liquidprices foroptionstomanageriskoversuchshorttimeperiods.Impliedvolatilitiescanbeused as indicators of overnight volatility, and there may be arguments forbelieving they carry a great deal of information.But there are also argumentsagainstgivingmuchweight to impliedvolatilities—theysometimeshavemoreto do with supply and demand factors than forecasts of price variation, asdiscussed in Section 11.6.2. The decisionmust be based on belief about theirpredictivevalue,asthereisnopricingargumentforusingthem.
7.1.1.2Step2:DetermineAllMarketVariablesThis section discusses various approaches to representation of the firm'sexposuretomarketvariables.MoredetailsforspecificpositionscanbefoundinSections9.2,9.3,9.4,10.4,11.4,and13.1.3.Dowd(2005,Chapter12)isalsoagoodsourceforrecommendationsonthispoint.Whateverchoicesaremadeforhowpositionsshouldbestoredandrepresented, themost importantpointwithregardtorepresentationoffirmpositioninVaRandstresstestcalculationsistheneed for basing all position inputs on data that is entered and controlled bysupportstaffindependentofthefrontoffice(asperSection3.1.1).TheVaRandstresstestreportsarekeyelementsforcontrollingandmanagingthefirm'srisk,and it is justas important forposition information feeding thesesystems tobeimmune from front-office manipulation as it is to have independent P&L
reporting. Indeed, someof themost recentmajor fraudsby rogue tradershavebeen perpetrated primarily through manipulation of risk reporting rather thanthroughthemanipulationofP&Lreporting(asperSection3.1.1).Falsificationof P&L reporting can lead to stop-loss limits being missed, but the equallyimportantlimitsonbuildupoflargepositionsthatcanbeverycostlytoliquidatedependonVaRandstresstestreports.Nearly as important is to have checks in place to ensure that the position
informationthatfeedsP&Lcalculationsanddesk-levelriskreportsisidenticaltothepositioninformationthatfeedsVaRandstresstestreports.Notonlyisthisavitalcheckonaccuracyofriskreporting,butitisalsoneededtomaintaingooddialogue between risk managers and front-office personnel. Nothing is asdestructiveofgooddialogueasVaRorstresslimitviolationsthatmakenosensetotradersbecausetheycontradictdesk-levelriskreports.When computing VaR for spot positions, the translation from underlying
marketvariablestothefullsetofmarketvariablesthatyouwanttomultiplybythefirm'spositionsisquitedirect.SpotpositionssuchasspotFXortheholdingof an individual stock or stock index or spot gold or spot oil is just directlymultipliedbythegeneratedpricechangefromStep1.Computationforforwardpositionsislessstraightforward.Ifyouarecurrently
holdingaTreasurybillmaturingonemonthfromnow,youdon'twanttoapplytoitthepricemoveyouobservedforthatTreasurybillonadatesixmonthsago,sinceatthatpointtheTreasurybillhadsevenmonthstomaturity,andyouexpectseven-month instruments to demonstrate much larger price changes than one-monthinstruments.Soyouwanttoutilizeyieldcurveparametersasunderlyingmarket variables and then multiply those yield curve parameters by theappropriate value of a basis point measure of forward position. This has theimportant added advantage of not having to separately price each interest rateinstrument but instead working with a summary description of the entireposition.Issues are most complex for option positions (in which we include any
nonlinear payoff positions). The conceptually simplest and most accurateapproach would be to value each individual option separately based on thechanges in the underlying market variables of forward price and impliedvolatility. Even such a simple approach has complications, since for eachscenario it is necessary to choose a volatility atwhich to evaluate the option.Thisrequiresdecidingwhichpointontheimpliedvolatilitysurfaceistherightone to apply. Suppose you are repricing an optionwith one year to expiry, a
strikepriceof100,andcurrentunderlyingpriceof80.Whichimpliedvolatilityshift do you use when sampling from a period six months ago when theunderlyingpricewas100?Mostpractitionerswouldoptforlookingattheshiftinoptionswithaone-yearexpiryandastrikeof125,sincethatwouldgivethesame “moneyness” (i.e., a strike 25 percent above current spot). But this isclearly open to interpretation and a variety of theories onwhat drives optionspricing(seeDerman1999).Verysimilarconsiderationsapplytooption-adjustedspreadsonmortgageandmortgage-backedsecurities,whichshouldberelatedtothesecurity thathadacomparable relationship to theprevailingnewmortgagerate.Thereasoningissimilar,sinceoption-adjustedspreadsrepresentthemarketpricingofuncertaintyinoptionsexercisedbyhomeowners.While the simplest approach is themost accurate, it is clearly also themost
costly,andtheheavyexpenseofdoingfullindividualrevaluationofeachoptionposition iswhatwasprimarily responsible for incorrect claims that simulationmethodology forVaRwas inherentlyexpensive toperform. In fact, simulationmethodologycanachievebetteraccuracythanvariance-covarianceatnogreatercostbytheeasytrickofrepresentingoptionportfoliosbysummarystatisticsofdeltas, gammas, and vegas and multiplying these by the appropriate pricechange,halfthesquareofchangeinprice,andthechangeinimpliedvolatility,respectively. This simplified representation makes options positions no morecomputationallydifficultforsimulationthanlinearpositions.Soitisamatteroftrade-off in desired accuracy versus cost to be determined for each optionsposition.There are also intermediate approaches.One that can provide quite accurate
approximations is to interpolate results based on a price-vol matrixrepresentation of the options portfolio, as per Section 11.4. If a reasonablydetailedprice-volmatrixisalreadybeingcalculatedaspartofthetradingdesk'sownriskreporting,thisisagoodwayoftakingadvantageofalargenumberoffullrevaluationrunsthatarealreadybeingmade(sinceeachbucketofthematrixrequiresalloptionsintheportfoliotoreceiveafullrevaluation)withoutneedlessduplication of effort. As we note in Section 11.4, the price-vol matrix canpotentially capture all higher-order terms in the Taylor series of both theunderlyingpriceandthevolatility,aswellascross-termsbetweenthem.Itwillnot capture impacts such as nonparallel shifts in volatility surface, so thesesensitivitieswillneedtobeseparatelyaccountedfor.Whateverapproximationsareusedshouldbetestedoccasionallyagainstafull
revaluationbyindividualoptiontoseeifafinerdegreeofdetailisneeded.The

scenariosinvolvingtheverylargestshiftsshouldprobablyalwaysbeevaluatedbyfullrevaluationbyindividualoption.Thisisaformofimportancesampling(seeDowd2005,Section8.4.3).Onepossibleimplementationwouldbetofirstuseaselectedapproximationtechniquetosimulateallpossibleshifts,thenfocusontheonesthatproducethehighestP&Lchanges,whichwillhavethegreatestinfluence on the VaRmeasure, and recalculate these using full revaluation ofeachoption.Choices as to whether to work with full revaluation of individual option
positions,aprice-volmatrix,or summarysensitivity statistics shouldbe solelymotivatedbytrade-offsbetweencomputationtimeandexpenseversusaccuracy.Inallcases, theultimateaccuracyofP&Lsimulationsrestsontheaccuracyofthemodelsthefirmusestovaluetransactions.Thisis truewhetherthemodelsare used directly in full revaluation or indirectly in supplying the deltas,gammas, vegas, and price-vol matrices, which are multiplied by positions insimulationsor invariance-covariancecalculations.Reviewsof accuracyof thefirm'smodels shouldalwaysconsider their impacton riskcalculations suchasVaRandstresstestsalongwiththeirimpactonvaluationsandlimitcalculations(seeSection8.2.3).Another importantdeterminantof thecostofcalculatingsimulationsand the
cost of storing the data needed as input to these simulations is the degree ofdetailwithwhichpositions andmarketprices are recorded.Atoneextreme, itwould be foolish not to keep separate prices and positions for each differentcurrency for spot FX—there just are not that many different currencies, andmovementsbetweenthemcanbesignificant.Attheotherextreme,itwouldbeequallyfoolishtostoremarketdataonforwardratesforallpossibletenors(i.e.,365 days × 30 years). Most of these rates are just being produced byinterpolationanyway,soyoumightaswellstorejustthe20to50liquidratesonthecurvethatalltheothersarecalculatedfrom.Inbetween,therearetrade-offdecisionstobemade.Forexample,doyouwanttotrackindividualhistoriesonevery stock you hold, or do you want to keep track of just indexes withindividual stocks represented through their betas relative to the index? If youchoosethelatterapproach,thenaseparateestimateneedstobemadeoftheVaRduetoidiosyncraticstockrisk.Finally,wenotethatsomeofthedeterminantsofexoticderivativepricesare
notmarketvariableswhosepricehistorycanbeobservedandsoarenotsuitablefor inclusion inaVaRanalysis.Consideranoptiononabasketof stocks.Theimpactof changes in thepricesof the stocks and in the impliedvolatilitiesof
eachstockinthebasketcanbecomputedandincludedintheVaR.Buttherewillprobablybeno liquidmarketquotations for the impliedcorrelations impactingthisoption.Analystsareoccasionallytemptedtosubstitutechangesinhistoricalcorrelationforunobservablechanges in impliedcorrelation. Iwouldargue thatthisisanerror.Ifthebasketoptionhasthreeyearsremaining,youshouldpresumablylookat
the change from one business day to the next of a change in the three-yearhistorical correlation.But since these two three-year periodswill share all butonedayatthebeginningandendincommon,thechangeincorrelationthatyouwillmeasuremustbetiny.Weknowfromexperiencethatimpliedvolatilitycanchangefarmorerapidlythanasimilarlycomputedchangeinhistoricalvolatility,andIdonotknowofanyreasonwhycorrelationsshouldbehavedifferently.If,ontheotherhand,youdecidedtochooseamuchshorterperiodforcomputingthe historical correlation in order to increase the potential size of the changefrom day to day, howwould the choice of period be justified? I believe it isbetter to acknowledge that such nonmarket observables cannot be included inVaR analyses and that their risks should be accounted for separately throughreservesandstresstests,asdiscussedindetailinSection6.1.2.Another factor that some riskmanagershavebeen trying to incorporate into
VaRisliquidityconsiderations(seeDowd2005,Chapter14).Ratherthanusingovernightpricemoves to representeach instrument,pricemovesovera longerperiodwill be used to represent less liquid instruments. If this is not handledcarefully,itcanresultinunderrepresentationofilliquidrisks.Forexample,youmighthaveashortpositioninaveryliquidgovernmentbondandasmallerlongpositioninalessliquidcorporatebond.IfyoucomputeVaRbasedonaone-daymoveforthegovernmentbondandatwo-daymoveforthecorporatebond,thiscouldshowlessriskthanaone-daymoveforboth,sincethelargermovesforthecorporatebondhavethesameeffectinthecomputationasincreasingthesizeoftheposition.Abetterapproachistoseparatelycalculatealiquiditypenalty,asanadd-on to VaR, for the cost of exiting less liquid positions, using a formulasimilartothatproposedforliquidityreservesinSection6.1.4.
7.1.2MeasuresoftheP&LDistributionSimulationisideallysuitedtoproducingfullP&Ldistributions,sinceindividualcases are simulated and probabilities assigned to each case. While the fulldistributioncanberepresentedgraphically,forexamplebyahistogramlikethat

in Figure 7.1, some type of summary statistics are desirable to conveyinformation succinctly. Inpractice, theprimary focushasbeenonproducingasinglesummarymeasure, thepercentile loss.Forexample, theVaRat the99thpercentilewouldbetheamountoflossthatwillbeequaledorexceededonly1percent of the time.While lesswell known, another summarymeasure that isveryuseful is theshortfallVaR,whichis theaveragelossconditionalonbeingbeyondagivenpercentile.Forexample,theshortfallVaRatthe99thpercentileistheprobability-weightedaverageofalllossesgreaterthantheVaRatthe99thpercentile.ComputationofbothVaRandshortfallVaRatanyselectedpercentileisvery
directfromasimulation.Ifwehavesimulated1,000equallyprobableP&Ls,weonlyneedtosortthem.The990thP&Linthesortisthe99thpercentileVaR.theaverageofthe991stP&Lthrough1,000thP&Linthesortisthe99thpercentileVaR shortfall. The VaR spreadsheet on the book's website demonstrates thiscalculationforbothhistoricalandMonteCarlosimulation.DespitetheVaRmeasurebeingbetterknownthantheshortfallVaRmeasure,
the latter has several advantages that recommend it as a superior summarystatistic.Theadvantagesare:
ShortfallVaRissensitivetotheentiretailofthedistribution,whereasVaRwillnotchangeeveniftherearelargeincreasesinsomeofthelossesbeyondthecutoffpercentileatwhichtheVaRisbeingmeasured.ThiscanbequitedangerousifitencouragesbusinessestotailorproductstoproducerisksthatescapetheVaRmeasurebybeingtoofaroutinthetail.Inpractice,shortfallVaRhasprovedamorestablemeasurethanVaRinshowinglesssensitivitytodataerrorsandlessday-to-daymovementduetoseeminglyirrelevantchangesininputdata.Presumably,thisisduetoagreatertendencytoaverageoutthenoiseinthedata.WithVaR,apparentlynegativediversificationeffectscanarise,asshowninTable7.1,inwhichthe99thpercentileofthecombinedportfolios,alossof42million,isgreaterthanthesumofthe99thpercentilelossesinthetwoseparateportfolios,20million+20million=40million.ShortfallVaRneverdisplaysnegativediversificationeffects.
TABLE7.1NegativePortfolioEffects
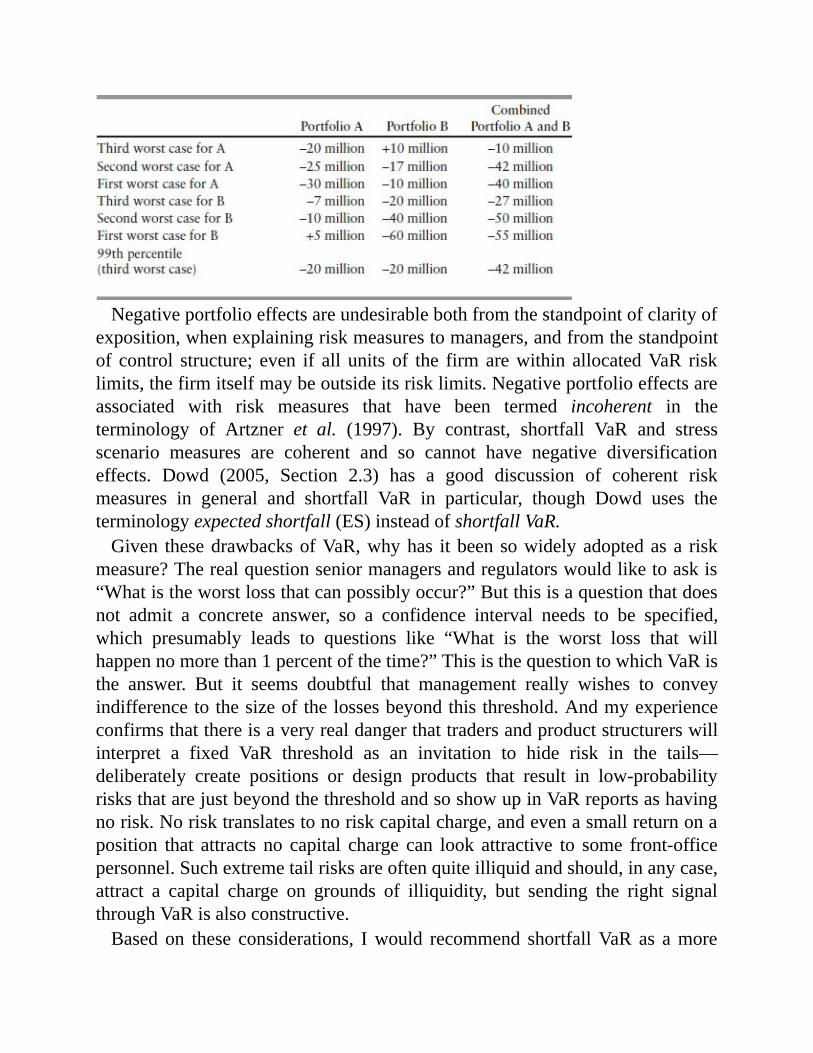
Negativeportfolioeffectsareundesirablebothfromthestandpointofclarityofexposition,whenexplainingriskmeasurestomanagers,andfromthestandpointof control structure; even if all units of the firmarewithin allocatedVaR risklimits,thefirmitselfmaybeoutsideitsrisklimits.Negativeportfolioeffectsareassociated with risk measures that have been termed incoherent in theterminology of Artzner et al. (1997). By contrast, shortfall VaR and stressscenario measures are coherent and so cannot have negative diversificationeffects. Dowd (2005, Section 2.3) has a good discussion of coherent riskmeasures in general and shortfall VaR in particular, though Dowd uses theterminologyexpectedshortfall(ES)insteadofshortfallVaR.Given thesedrawbacksofVaR,whyhas itbeensowidelyadoptedasa risk
measure?Therealquestionseniormanagersandregulatorswouldliketoaskis“Whatistheworstlossthatcanpossiblyoccur?”Butthisisaquestionthatdoesnot admit a concrete answer, so a confidence interval needs to be specified,which presumably leads to questions like “What is the worst loss that willhappennomorethan1percentofthetime?”ThisisthequestiontowhichVaRisthe answer. But it seems doubtful that management really wishes to conveyindifferencetothesizeofthelossesbeyondthisthreshold.Andmyexperienceconfirmsthatthereisaveryrealdangerthattradersandproductstructurerswillinterpret a fixed VaR threshold as an invitation to hide risk in the tails—deliberately create positions or design products that result in low-probabilityrisksthatarejustbeyondthethresholdandsoshowupinVaRreportsashavingnorisk.Norisktranslatestonoriskcapitalcharge,andevenasmallreturnonaposition that attracts no capital charge can look attractive to some front-officepersonnel.Suchextremetailrisksareoftenquiteilliquidandshould,inanycase,attract a capital charge on grounds of illiquidity, but sending the right signalthroughVaRisalsoconstructive.Based on these considerations, Iwould recommend shortfallVaR as amore

desirablesummarystatistic.IfmanagementorregulatorsstillwishtoknowtheVaR,thenIwouldrecommendestimatingitbyaproperlyselectedshortfallVaR.Forexample,agoodestimateofthe99thpercentileVaRisthe97.6thpercentileshortfall VaR. The two measures are almost exactly equal for normaldistributions, and using the 97.6th percentile shortfall VaR as an estimatorprovidesgreaterstability,avoidsnegativediversificationeffects,andeliminatesincentivestohideriskinthetails.TheVaRspreadsheetillustratestheestimationofVaRbyaproperlyselectedshortfallVaR,asdetailedinthedocumentationforthecalculationofthehistoricalsimulationVaR.When Monte Carlo simulation is utilized, all simulation runs are assigned
equalprobabilityweights,sinceanydifferencesinweightingsofhistoricaldatahasalreadybeentakenintoaccountintheestimationofinputparameterstothesimulation.Butforhistoricalsimulations,ifyouwanttoassigndifferentweightstodifferenthistoricalperiods,youneed todo itat thepointatwhichVaRandshortfallVaRarecomputed,byconsideringtheprobabilitiesthatareassignedtoeachsimulationrun.Utilizingdifferentweightsfordifferenthistoricalperiodsinhistoricalsimulationcanhelptoovercomeoneofitsleastattractivefeatures,thewayinwhichtheVaRcalculationcanshiftsuddenlywhenaparticularlyvolatiledayleavesthedataset.Forexample,ifyouareusingthepast1,000daysofdatafor your VaR calculations and June 20, 2010, was a very volatile day, VaRcalculationsonJune20,2014,mightincludethatday,andVaRcalculationsonJune21,2014,andsubsequentdaysmightexclude it. Ifyouassignweights tohistoricalperiodswithagradualdropinweightsasadatebecomesmoredistant,this shift will take place far more smoothly. Dowd (2005, Section 4.4) has agooddiscussionofthisissueandofavarietyofreasonableweightingschemestoconsider.Ifyouwanttousesimulationresultstoprojectpossibleextremeresults(i.e.,at
very largepercentiles), thenyouneed toextrapolatebeyond thehistoricaldataset.Forexample,ifyouwanttoproduceaVaRorshortfallVaRat99.99percent,youneedtoforecastwhatwillhappen1outofevery10,000days.Butyouwillalmostcertainlybeworkingwithfarlessthan10,000daysofhistoricaldata.Wewilldiscusslater,inSection7.3,thereasonablenessofcalculatingsuchextrememeasures,butfornow,let'sseehowitcanbedoneifneeded.Extrapolation beyond the historical data set requires statistical tools from
extreme value theory (EVT). A very brief summary of the principal EVTtechniquesmostoftenusedinVaRanalysisappearsinthebox.
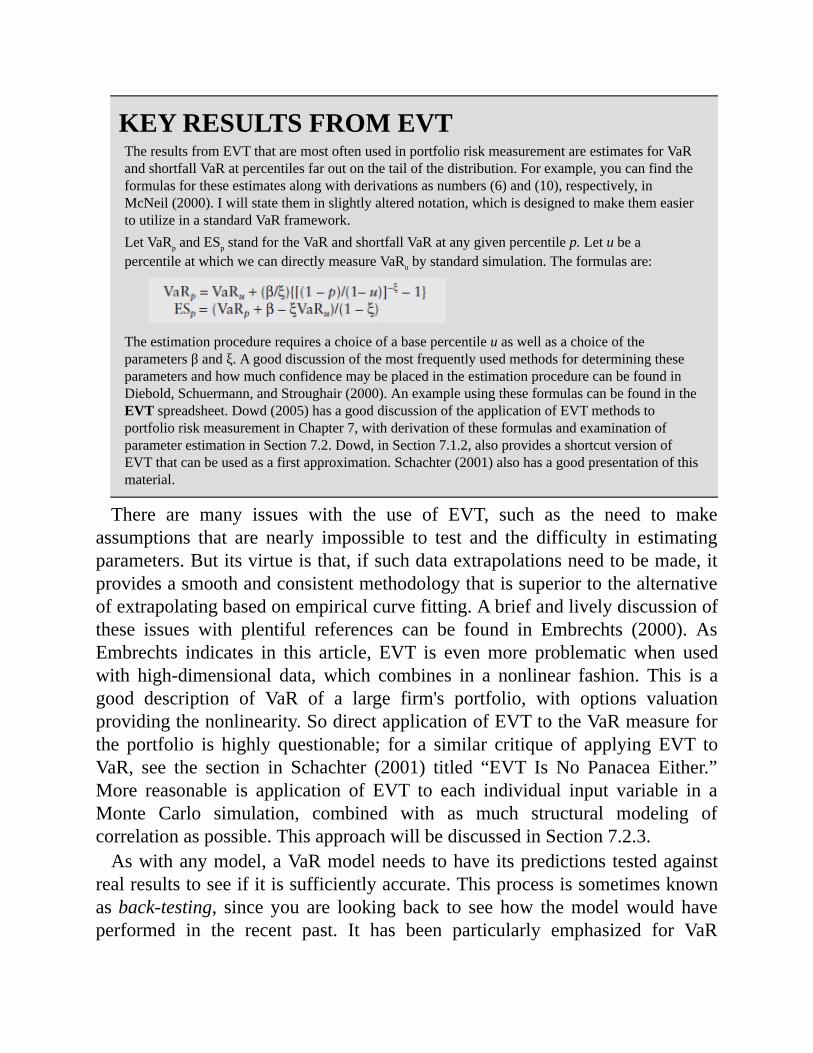
KEYRESULTSFROMEVTTheresultsfromEVTthataremostoftenusedinportfolioriskmeasurementareestimatesforVaRandshortfallVaRatpercentilesfaroutonthetailofthedistribution.Forexample,youcanfindtheformulasfortheseestimatesalongwithderivationsasnumbers(6)and(10),respectively,inMcNeil(2000).Iwillstatetheminslightlyalterednotation,whichisdesignedtomakethemeasiertoutilizeinastandardVaRframework.LetVaRpandESpstandfortheVaRandshortfallVaRatanygivenpercentilep.LetubeapercentileatwhichwecandirectlymeasureVaRubystandardsimulation.Theformulasare:
Theestimationprocedurerequiresachoiceofabasepercentileuaswellasachoiceoftheparametersβandξ.AgooddiscussionofthemostfrequentlyusedmethodsfordeterminingtheseparametersandhowmuchconfidencemaybeplacedintheestimationprocedurecanbefoundinDiebold,Schuermann,andStroughair(2000).AnexampleusingtheseformulascanbefoundintheEVTspreadsheet.Dowd(2005)hasagooddiscussionoftheapplicationofEVTmethodstoportfolioriskmeasurementinChapter7,withderivationoftheseformulasandexaminationofparameterestimationinSection7.2.Dowd,inSection7.1.2,alsoprovidesashortcutversionofEVTthatcanbeusedasafirstapproximation.Schachter(2001)alsohasagoodpresentationofthismaterial.
There are many issues with the use of EVT, such as the need to makeassumptions that are nearly impossible to test and the difficulty in estimatingparameters.Butitsvirtueisthat,ifsuchdataextrapolationsneedtobemade,itprovidesasmoothandconsistentmethodologythatissuperiortothealternativeofextrapolatingbasedonempiricalcurvefitting.Abriefandlivelydiscussionofthese issues with plentiful references can be found in Embrechts (2000). AsEmbrechts indicates in this article, EVT is evenmore problematicwhen usedwith high-dimensional data, which combines in a nonlinear fashion. This is agood description of VaR of a large firm's portfolio, with options valuationprovidingthenonlinearity.SodirectapplicationofEVTtotheVaRmeasureforthe portfolio is highly questionable; for a similar critique of applying EVT toVaR, see the section in Schachter (2001) titled “EVT Is No Panacea Either.”More reasonable is application of EVT to each individual input variable in aMonte Carlo simulation, combined with as much structural modeling ofcorrelationaspossible.ThisapproachwillbediscussedinSection7.2.3.Aswithanymodel,aVaRmodelneedstohaveitspredictions testedagainst
realresultstoseeifitissufficientlyaccurate.Thisprocessissometimesknownasback-testing, since you are lookingback to see how themodelwould haveperformed in the recent past. It has been particularly emphasized for VaR
models,owingtoinsistencebyregulatorsthatiffirmsaretobeallowedtouseinternallybuiltmodelsforcalculationofregulatorycapital,theymustbeabletodemonstratethatthemodelsfitrealresults.Thesuggestedregulatoryback-testisa straightforward comparison between the 99th percentile produced by aVaRmodel on each day during a specified period (since it is this percentile thatdetermines regulatory capital) and the actual P&L on each day. Themodel isconsidered satisfactory (or at least erring acceptably on the side of toomuchcapital) if the number of days on which P&L exceeds the predicted 99thpercentile is not statistically significantly greater than 1 percent. While thisapproachhasthevirtueofsimplicity, it isstatisticallyquiteablunt instrument.MuchmoreinformationcanbeextractedbycomparingVaRprojectionstoactualresults at many different percentiles. More sophisticated methods for back-testing are very well presented in Chapter 15 of Dowd (2005). Chapter 6 ofJorion(2007)alsocoverssomealternativeback-testingmethods,withparticularemphasisonhowVaRinteractswiththeBaselcapitalrules.Amethodologicalquestioniswhethertoback-testagainstactualreportedP&L
or against P&L that has been adjusted for components that the VaR cannotreasonably be expected to pick up. Such components are revenue from newlybooked transactions, revenue from intraday or (when runningVaR for periodslonger than a day) intraperiod trading, and gains or losses due to operationalerror(e.g.,tradesincorrectlybooked).TheargumentinfavororusingunadjustedP&Lin thecomparison,besidessimplicityofcomputation, is that theseareallrealcomponentsofP&Lthatcanbequitedifficulttoidentify,soitisbettertobeawareoftheextenttowhichyourmodelisunderpredictingactualreportedlossevents.Anargument in favorofmakingat least the largestadjustments is thatwithoutgetting the targetdata to lineupwith the forecastingprocess, youareworkingwithasuboptimaldiagnostictool.
7.2STRESSTESTING
7.2.1OverviewAs stated in Section 6.1.1, risk assessment must include an evaluation of thepotential impactofaperiodofseverelyreducedliquidity,stress tests forshort.There are two fundamental approaches thathavebeenproposed toperformingstress tests: relianceonhistoricaldataand relianceoneconomic insight. Iwillargue that strict reliance on historical data is not a viable option—economic
insightmustbeutilized.ButIwillalsoarguethateconomicinsightcanusefullybesupplementedbyhistoricaldata.From a computational standpoint, stress testing is simply another variant of
simulation;itjustusesadifferentmethodtogeneratethescenariosofunderlyingmarket variables. But after that, the other two steps in simulation analysis—translationtoallmarketvariablesandcalculationoffirmP&L—canbecarriedoutexactlyaspersimulationVaR;indeed,theexactsamesystemcanbeusedforboth.Aswewillsee,theuseofeconomicinsightrequiresagreatdealofextraeffort
and introduces a substantial amount of subjective judgment. So why botherdepartingfromstatistics?Couldn'twejustrelyonMonteCarlosimulationbasedonhistoricaldata togeneratehighlyunlikelybut stillplausible scenarios?Theanswerisclearlyno,forseveralreasons:
Thedistributionofmarketmovesinacrisiseventmaynotresemblethedistributionofmarketmovesinnormalmarketcircumstances.Experienceindicatesthatyoucannotsafelyassumethatmarketmovesinacrisiseventsimplyrepresentextremevaluesofordinarymarketdistributions.Inparticular,correlationsoftenswingtoextremevaluesinacrisis(Dowd2005,introductiontoChapter13).Forexample,inaflighttoqualitytriggeredbyamajorcreditscare,otherwiseuncorrelatedassetpricesmaymovesharplydownatthesametime.Somescenariosrepresentsuchsharpbreakswithhistorythatnoanalysisofpastexperiencecanofferacompletestory.Economicforecastingbasedonhard-to-quantifyjudgmentisrequired.Whenfirmswereworriedin1999aboutthepotentialimpactonthefinancialmarketsoftheY2Ksystemsbug,nopurelyhistoricalanalysiscouldofferanyguidance.WhenmanyofthenationsofEuropeadoptedacommoncurrency,ascenariobasedonthepossiblecollapseofthatcurrencycouldnotbebasedonanyclearhistoricalprecedents.Somescenariosdonotrelatetopublicpriceobservationsatall,socannotbebasedonhistoricalrecordsofpricechanges.Ifafirmhasaninventoryofoptionsonstockbasketswhosepricingdependsonlong-termcorrelationsforwhichnoliquidpublicpricesexist,ascenarioforamarketeventthatwouldcausetheportfoliotoberevaluedmustbeformedbasedonmarketknowledge.Forexample,awaveofmergersmightdriveuptheinputlevelofcorrelationsusedinvaluations.Boththejudgmentsabouthowplausibleagivenlevelofmergeractivitymightbeandhowmuchthismightimpactthe

firm'sinternalvaluationpoliciesmustbebasedontheknowledgeandexperienceofindividuals.Manyscenariosrequirejudgmentabouttheimpactoflargedeclinesinmarketliquiditythatoftenaccompanyextremepricemoves.Recordkeepingonpriceliquidityisextremelysparserelativetorecordkeepingonpricelevels,soitisdoubtfulthatanysuchscenariocouldbeconstructedbasedonhistoricalstatistics.Todealwiththislimitation,itisgenerallynecessarytoestimatethelengthoftimeitwilltaketoliquidateapositioninacrisis.Sincethisbearslittleresemblancetothetimeittakestoliquidateapositioninnormalcircumstances,itrequiresananalysiscompletelyindependentfromthatwhichgoesintoVaRcalculations.Somescenariosfocusontheplausibilityofcontagion(chainreactionsofchangesinonemarketspillingoverintoothermarketsthroughinvestorbehavior).Anexamplemaybefearthatastockmarketcrashwillspursalesofbondsbyfirmsneedingtomeetmargincalls.ReferbacktothediscussioninconnectionwithLong-TermCapitalManagementinSection4.2.1.Suchscenariosmustbeconstructedbasedonknowledgeofthecurrentcompositionofinvestorportfolios.Historicalstatisticalanalysisislikelytobeoflimitedvalue.Somescenariosneedtoemphasizetheinteractionsamongmarketrisk,creditrisk,fundingliquidityrisk,andreputationalrisk(seeBaselCommitteeonBankingSupervision2009a,PrinciplesforBanks10and14).Historicaldatawillbeoflittleusehere.Whatisrequirediseconomicinsightbasedonthoroughexaminationofpreviousstressperiodsandcreativethinkingaboutsimilaritiesbetweenwhathasoccurredinthepastandcurrenteconomicandinstitutionalcircumstances.AsemphasizedinSections1.3and6.1.1,whenattemptingtoestimatelow-probabilityevents,itisimportanttoincludesubjectivejudgment.Estimatingtheimpactofinfrequentepisodesofdiminishedliquidityisaparadigmofestimatinglow-probabilityevents.Useofscenariosbasedoneconomicinsightisasystematicwaytoensurethatsubjectivejudgmentisutilized.
7.2.2EconomicScenarioStressTestsTheuseofeconomicinsightmaybenecessaryforstresstesting,butitdoesposedifficulties.Workingoutplausible combinationsof the entire set ofunderlyingvariables
thatcanimpactalargefirm'stradingpositionishardworkandrequiresalotofattentiontodetail.While inprinciple subjectiveprobability judgments couldbeused to specify
probabilities for scenarios, oncewe leave the realm of historical distributions,different people are likely to havewide differences in subjective probabilitiesthataredifficulttoreconcile.Inpractice,astandardofplausibilityissubstitutedforoneofprobability,andplausibilityisaverysubjectivenotion.But,howeversubjective, plausibility must still be insisted upon. Without such a standard,stress testingbecomesequivalent to thechild's (andchildish)game,“Whocannamethelargestnumber?”Nooneeverwins,becauseonecanalwaysbeaddedto the last number.Andyou can always specify a stress test that is one shademoreextremethanthelastonespecified.Herearesomepointsthatshouldbeconsideredinscenariogenerationtotryto
dealwithboththeamountofeffortinvolvedandthedegreeofsubjectivity.Oneaidistosplittheworkupbetweenaseniorgroupthatdeterminesaglobalscenarioforthemostimportantvariablesandspecialistgroupsthatworkouttheconsequencesofthatglobalscenarioforlessimportantvariables.Globalscenariosgenerallyreflectmajorshiftsineconomicconditions:astockmarketcrash,anoilembargo,aseriesoflargecreditdefaults.Itisimportanttobesurethatsplittingtheworkamongspecialistgroupsdoesnotallowinconsistentrelationshipstodevelopintheoverallscenario.Forexample,ifonegroupdevelopsthegovernmentbondyieldcurveandanothergroupdevelopstheAAA-ratedcorporatebondcurve,youdon'twanttheretobeanytenorsatwhichthegovernmentbondyieldishigherthantheAAAcorporatebondyield.ThiscanbeavoidedbyhavingthesecondgroupdevelopacurveforthespreadsbetweenAAAcorporatebondsandgovernmentbonds,ratherthandevelopingacurvefortheabsolutelevelofAAAcorporatebondyields.Schachter(2001),inthesectionon“ImplementingUsefulStressTests,”hasmanyvaluablesuggestionsalongtheselines,including:
Usingproportionalshocksratherthanabsoluteshocksforvolatilities,toavoidthepossibilityofspecifyingnegativevolatilities.Specifyingshockstoyieldcurveshapeandtovolatilitysurfaceshape,ratherthanindividualshockstoeachinterestrateandvolatility,toavoidunreasonableshapes.Checkingthatarbitragerelationships,suchascostofcarryrelationships

betweencashandfuturesprices,aremaintained.Giventhedifficultyofdevelopinghypotheticalscenarios,itisunreasonabletothinkthatmorethanahandful(saybetween10and20)canbeinuseatanyonetime.Givenallthepotentialcombinationsofeventsinmarkets,itisimportanttofocusonthosepossibilitiesthataremostsignificanttothetypesofpositionsyourfirmgenerallyholds.Anchoringtheassumptionsforthemoveofaparticularvariabletothelargestmovepreviouslyobservedhistoricallyisagoodpreventativeagainstplayingthe“Whocannamethelargestnumber?”gameandovercomingsomeoftheinherentsubjectivity.Butcareshouldbetakentoconsiderabroadenoughrangeofevidence.Forexample,ifthelargestpreviousdailydeclineinonecountry'sbroadstockmarketindexhasbeen10percentandthatofthestockindexinanothercountrywithasimilarlevelofeconomicdevelopmenthasbeen15percent,thereisapresumptioninfavorofusing15percentasahistoricalworstcaseforboth.Acknowledgingtheneedforsubjectivityandplausibilityratherthanprobabilitymustneverbeusedasanexcuseforjustutilizingtheopinionsofanarrowlydrawngroup.Infact,subjectivityandplausibilityarestrongmarkersofthedesirabilityandnecessityofconsideringawiderangeofviewpoints.Whenyouencounter(or,evenbetter,seekout)aviewwithwhichyoustronglydisagreebutthatisbackedbyreasonablearguments,youneedtotakeitintoaccount.Ifyouwerejustproducingamostlikelyscenarioordecidingonexpectedreturn,youwouldneedtofinallyrelyonyourbestjudgmentandnotonviewsyoustronglydisagreedwith.Butasearchforplausibilitymustcastawidernet,andyoucaneasilyincludeviewsyoudon'tagreewithasbeingimprobablebutstillhavingasmallprobabilityofoccurring,andsoworthyofconsiderationwhendegreeofprotectionisbeingmeasured.SeeSection5.2.5.7foraspecificillustration.Themostimportantchoicesarealwaysaboutwhichvariablescanplausiblymovetogether,notaboutthesizeofmoves.Historycanbesomeguide,particularlyexperienceinpriorlargemoves;historyofstatisticalcorrelationsisvirtuallyworthless.Itisimportanttoconsiderlinkagesthatarecausedbyinvestorsaswellaslinkagescausedbyeconomics.Forexample,considerthecorrelationsexperiencedbetweenseeminglyunrelatedmarketswhenLong-TermCapitalManagementwasforcedtobeginliquidatingitsholdings.Buildinginsuchcorrelationsrequiresmarketintelligenceonthetypeofholdingsthatlargeinstitutionalplayersmayhave
accumulated.Largemovesinvariablesarecloselyassociatedwithmarketilliquidity.Thesizeofvariablemoveschosenshouldcorrespondtomovesthatoccurfromthetimealiquiditycrisisbeginstothetimeitends;pricesrecordedinbetweenthesetimesoftenhavelittlemeaning,sinceyoucan'treallydoanysignificantsizeofbusinessatthoseprices.Sincerecordkeepingrelatedtomarketliquidityisusuallysparse,choiceofthestartingandendingpointsforaliquiditycrisisusuallydependsontheinstitutionalmemoryofpeopleinvolvedinthetradingbusiness.Onepointofcontentionbetweentradersononesideandriskmanagersandregulatorsontheothersideistheassumptionthatnodeltarehedgingofoptionspositionswilltakeplaceduringtheunfoldingofastressscenario(thereisaparallelcontentionaboutthesameassumptionwhenusedforthelargestmovesseeninVaRsimulation).Tradersrightlypointoutthattheyoftenhavefirmrulesandlimitsthatwouldrequirethemtoperformadeltarehedgewhenunderlyingpricesmovesufficiently.However,thereasonthatriskmanagersandregulatorsofteninsistonassumingnorehedgingisthefearthatleakofmarketliquidityinacrisiswillpreventrehedgingfrombeingexecutedsuccessfully.Creatinglinkagesbetweenlargemarketmovesandrelatedlossesduetocreditrisk,fundingliquidityrisk,andreputationalriskisdifficult;forsomeguidance,BaselCommitteeonBankingSupervision(2009a)isagoodsource.Astartingpointcouldbeaninternaldatabaseofdifficult-to-quantifyriskfactors,asdiscussedinSection8.2.6.5.Particularfocusshouldbeonsituationsinwhich:
Creditexposure(mostusuallycounterpartycreditexposure)ishighlycorrelatedwithmarketprices,suchasstockmarketlevels,interestratelevels,orforeignexchangerates;orcreditexposurewillbeimpactedbyachangeinacounterparty'screditrating(seefurtherdiscussioninSection14.3.4).Thefirm'sabilitytoholdpositionsthroughaliquiditycrisismaybeimpactedbyactionsofthefirm'screditorsorbychangesinaccountingtreatment.Reputationalconcernscombinedwithlargemarketmovesmaycausethefirmtovoluntarilytakelossesonpositionsforwhichthefirmhasnolegalresponsibility.
Ithasbeenmyexperiencethatsomeofthetimeandeffort thatgoesintothe

generationofascenarioproduceslittlebenefitandmayevendecreasethevalueof theresults.Toomuchattentionto tryingtoproducevaluesforeverymarketvariablethatcomprisesaparticularscenariocanbeself-defeating.Forexample,suppose you start with an assumption that there will be a big drop in stockmarketsglobally.Bothhistoricalexperiencewithpreviousstockmarketcrashesandeconomic insightabout the responsesofcentralbanks to sucheventsmayleadtoincorporatingalargedropinshort-termgovernmentbondrateswiththisevent.Buthistoricalexperiencewithpreviouscrashesmayshowmixedresultsaboutthedirectionofforeignexchangeratechanges,andeconomicinsightmaynotofferclearguidance.Tospendalotoftimearguingoverwhichdirectionofexchangeratemoveis
moreplausiblegiventhemaincharacteristicsofthescenarioisunproductive.Itmayactuallyreducethevalueofthescenariobychoosingadirectionthat,giventhefirm'sportfolio,reducesthesizeoftheoverallP&Limpactwheninfactitisjust as likely that exchange rates would move in the opposite direction andexacerbatethefirm'slosses.Onepossibleremedywouldbetosplitthescenariointwo:onethathasexchangeratesgoingupandonewithexchangeratesgoingdown. But there may be several such choices to make, and multiplication ofscenariosmayquicklygetoutofhand.AbettersolutionistoutilizeMonteCarlosimulationon somevariables to supplement the scenarioanalysisof themajorvariables.Forexample,thedecisioncouldbemadethatthestresslosswouldbeconsideredtheworst16thpercentileloss(roughlyonestandarddeviation)orallcases thatconsistof thespecifiedscenario levels for themajorvariablesandanormalVaR-typeMonteCarlosimulationoftheothervariables.
7.2.3StressTestsRelyingonHistoricalDataSupplementing hypothetical scenarios with those developed primarily onhistoricaldataisdesirableforafewreasons.Theintensityofeffortthatgoesintodeveloping a hypothetical scenario limits the number that can be used at anygiventime,whichleavesopenthepossibilitythatsomeplausiblelargeriskshavebeenignored.Whileexposurestosystematicriskfactors,suchasalargechangein stockmarket prices or a large shift in interest rate levels,will be captured,largeexposurestoidiosyncraticriskfactors,suchasalongpositioninonesetofstocksandashortpositioninanothersetofstocks,arelikelytoshownostressexposure in generated scenarios (review Section 6.1.1 for the definition ofsystematicandidiosyncraticriskasusedhere).Butsuchpositionsaresubjectto

losses in some periods of extreme reduction in liquidity.Also, having amoremethodical process in place for searching for plausible extreme events maylessensomeoftheconcernaboutthesubjectivenatureofscenariogeneration.Wecandistinguishtwogeneralapproachestoforminghypotheticalscenarios
basedonhistoricaldata:1. A complete replay of a previous stressful event, like the 1987 stockmarket crash or the 1997 Asian crisis. The fact that such an event hasactuallyoccurredisastrongargumentfortheplausibilityofasimilareventoccurring in the future.While there are always some arguments along thelinesofcircumstanceshavingchangedsomuchsincethetimeoftheeventtomakeasimilareventunlikely,itshouldberememberedthatthestandardisplausibility,notprobability,soargumentsagainstreoccurrenceshouldbefairly overwhelming in order to rule it out. The simulation process for apriorevent ispretty simple: select theproper start andenddatesbasedonwhen market liquidity was restored, make sure you've stored or haveresearchedthehistoricalvaluesofthemarketvariables,anddosomeartfulcreationofvalues forvariables forwhichyoudon'thavehistoricalvalues.Forexample,therewasnosignificantliquidemergingmarketdebtin1987,soyouhave to createpricesbasedonhowemergingmarket debt fared insubsequentlargestockmarketdownturns.Butevenutilizingspecificpasthistoricaleventsisveryresourceintensiveinresearchingtheneededhistoricaldata,determiningappropriatestartandenddates, and creating values for some variables, so the number of separatescenarios that can be considered will not be large. Idiosyncratic riskpositions, such as the long-short stock position described earlier,will stillprobablynothave theirvulnerability to liquiditycrisesproperlymeasured.Thisshowstheneedforsomerelianceoncomputationmethods,whichwillbeournexttopic.2.Useofacomputationalapproachinwhichalargenumberofscenariosisgenerated. This approach ismuch closer in spirit toVaR calculations, butfocuses on trying to determine largemoves outside the range of standardVaR.Therestofthissectionisdevotedtodifferentideasforimplementingthiscomputationalapproach.It is not difficult to specify plausible largemoves for individual parameters.
Often these have already been specified as part of stress scenarios based oneconomic insight. Even when they haven't, similar techniques to thoserecommendedforeconomicscenarioscanbeused,lookingatalongrunofpast

historical data, but alert to larger moves that may have occurred for similarvariables. This is also a good place to apply the extreme value theory (EVT)techniques outlined in Section 7.1.2, since EVT is most appropriate whenapplied to individual parameters. The difficult question is how to combineplausible large moves for individual variables into plausible large moves forcombinationsofvariables.Oneapproachistousehistoricaldatatodetermineacorrelationmatrix,apply
MonteCarlosimulationstogenerateadistributionofreturns,andestablishsomeprobabilitythresholdasaquantitativemeasureofplausibility.Anotherapproachis to find amoremechanical rule for determiningwhich combinationswill beconsideredplausible.Themostpopularofthesemechanicalrulesisthe“factor-push” methodology, which starts by defining any possible combination ofplausible largemovesof individualvariablesasaplausible largemove for thecombinationoffactors.ThemajordrawbackfortheMonteCarloapproachisthediscomfortmanyrisk
managersfeelfortranslatingthenotionofplausibilityintoaspecificprobabilitythreshold.Themajordrawbackofthefactor-pushmethodologyisthatassumingthatallvariablesmakeaworst-casetypeofmovesimultaneouslymaystrainthelimitsofwhat is legitimatelyconsideredplausible.Andbothapproachesentailsignificantcomputationalchallenges.Intheremainderofthissectionwelookatthespecificsofthesetwoapproaches,alongwithsomesuggestedvariants,andsee how these drawbacks might be mitigated and how the computationalchallengesmightbemet.Weconsiderthemoremechanicalfactor-pushapproachfirst.
7.2.3.1Factor-PushStressTestsFactor-push stress testing involvesdeterminingaplausiblemaximumupmoveanddownmoveforeachvariable,andthenevaluatingallpossiblecombinationsof these up and down moves. Those that produce the largest negative P&Lsbecome plausible stress scenarios. The advantage of this approach is that itinvestigates a large number of possible scenarios (2fwhere f is the number offactors)while requiring decisionmaking or statistical analysis around a smallnumberof inputs, theplausibility ranges for each factor.Dowd (2005,Section13.3.1)providesausefulanalysisoffactor-pushstresstesting.Twoprincipal criticismsof factor-pushmethodologyhavebeenoffered.The
firstisthatitdoesnotfollowfromeachindividualfactormovebeingplausible

that each combination of these factor moves is plausible. This would beparticularly trueforcloselyrelatedfactors—itwouldbe totally implausible forthetwo-yearTreasuryratetomakeitslargestplausibleupmovewhilethethree-yearTreasuryrateismakingitslargestplausibledownmove.Thesecondcriticismoffactor-pushmethodologyisthatitassumesthatworst-
caseP&Lalwaysoccursattheextremesofthefactorrange.Whiletrueforlinearproducts,itmaynotbetrueonceoptionsareinvolved(e.g.,Dowd'sexampleofalongstraddleoptionpositionwherethegreaterthemove,upordown,thegreaterthegain,somaximumlossoccursfarfromtheextremes).The second criticism is easier to overcome than the first. Mechanically, it
wouldbeeasytodesignaMonteCarlosimulationthatuniformlytakessamplesfromallpossiblemovesoftheindividualvariablesbetweentheagreedplausibleupanddownextremes.Sinceallpossiblecombinationsofplausible individualmovesareregardedasplausible,whatevercombinationshowsupwiththeworstP&L of all these runs is regarded as a plausible worst case. In practice, thisinvolves a very large number of runs, so a number of methods have beenproposedforfindingtheworstcasewithfewerrunsundercertainconditions;seeDowd(2005,Sections13.3.2and13.3.3) foran introduction tomaximumlossoptimizationandcrashmetricsandBreuerandKrenn(2000,Sections2.3.2and2.3.3)forimplementationdetails.Attempts to deal with the criticism that not all combinations of plausible
individualmovesareplausiblecombinationshasfosteredavarietyofsuggestedapproaches for selecting some combinations as plausible without relying onprobabilities.Forexample,asimpleapproachwouldbe tosumuptheseverity(measured by the percentage of the largest plausible moves) of all individualvariablemovesandcreateaboundaryonthistotalbeyondwhichacombinationis considered implausible. Approaches along this line are discussed in BreuerandCsiszar(2010).
7.2.3.2MonteCarloStressTestsThealternativeapproachistoaccepttheidentificationofplausibilitywithsometypeofprobabilitymeasure.Partoftheresistancetothisidentificationistheideathatcorrelationrelationsaretotallydestroyedincrisisevents.But,aspointedoutbyKimandFinger(2000),“Thewell-knowntendencyofcorrelationstochangeabruptly in stress events is no valid argument against the inclusion ofcorrelations in the formulation of plausibility standards. For the plausibility
standards can be based on crisis correlations aswell as correlations in calmerperiods.”The greater resistance is to how to identify plausibility with a specific
probabilitylevel.Riskmanagershavegoodreasontoresistattemptstoidentifynumericalprobabilityestimateswithastandardofplausibility;giventhelackofhistoricaldatatosupportestimationofsuchlow-probabilityevents,itwouldbeeasytotrytooverridesensiblecautionbyridiculingthelowprobabilitiesoftheeventsthatarebeingguardedagainst.SoIwouldsuggestsubstitutingastandardof“relativeplausibility.”Forexample,suppose that riskmanagershaveagreedto some plausible economic scenarios that, judged by historical data, have a0.005% chance of occurring (sincemany economic scenarios are tied to largemoves in a single keyvariable, such as a stockmarket crashor a spike in oilprices,itisnotanunreasonabletasktoestimatesuchaprobability).Thenacceptas plausible any losses generated by Monte Carlo simulation that have thatdegree of probability or greater.No one needs to concede the accuracy of theprobability estimate; it is quite probable that historical data leads to severeunderestimatesofthetrueprobabilitygiventhenumberoftimesmarketsarehitwith what were declared “once in 10,000 years” events. But we arehypothesizing that events that come outwith the samemeasure of probabilitybasedonhistoricaldatahaveroughlysimilardegreesofplausibility.Operationally,thismethodologyworkssimilarlytoaMonteCarlosimulation
ofVaR,withtheexceptionthattheparametersforindividualvariableshasbeenspecifiedsoastoincludelargeplausiblemoveswithintheprobabilityrangethathas been agreed on as the cutoff for plausibility (for example, this is easy toaccomplish with a mixture of normal approaches). Correlation matrices arespecified based on historical data, probably weighted toward data from crisisperiods.Manycaseswillneedtoberuninordertobeabletomakeareasonableestimateof lossesatanextremeprobability level, sosomeformof importancesamplingwillbeneededtokeeptoareasonableusageofresources,possiblybyfirstusingquickestimatesforP&Landthenmakingmoredetailedestimatesforonly cases that have thehighest preliminary loss estimate.ApaperbyAndreaRafael that illustrates this methodology can be found on the website for thisbook.The advantage of this approach is that it does not have any of the absurd
combinationsofthefactor-pushmethodology(useofcorrelationmatrices,evenonesdrawnfromcrisisperiods,won'tallowextremeupmovesin thetwo-yearTreasuryratealongwithextremedownmovesinthethree-yearTreasuryrate).

But all positions will get stressed, including positions like one long in somestocksandshortinothers,atroughlysimilarlevelsofseverity.Itshouldproducea loss levelassevereasorgreater thanmostof theeconomicstressscenarios,sincetheplausibilitylevelisdirectlyderivedfromthesescenarios.
7.3USESOFOVERALLMEASURESOFFIRMPOSITIONRISK
Inanexcellentarticle,Wilson(1998)distinguishesseveralpossibleusesofVaR:preventing embarrassing losses, setting operational risk limits, riskcomparability,determinationofcapitaladequacy,andperformancemeasurement(seeSection3.2ofWilson'sarticle).IwilluseWilson'sframework,statingmyownopinionsontheusefulnessofbothVaRandstresstestingforthesepurposes,andcomparingmyviewstohis.CertainlyamajorconcernthatfirmshavelookedtoVaRandstresstestingto
help mitigate is the risk of embarrassing losses such as those discussed inChapter4,“FinancialDisasters.”IwouldagreewithWilsonthatmanyofthosedisastersareduetoissuesofimpropercontrols(e.g.,Barings,AlliedIrishBank)orimpropervaluation(e.g.,KidderPeabody,UBS)thatcannotbecontrolledbyVaR or stress testing. Improper controls and valuation lead to positions beingincorrectly reported, and VaR and stress testing cannot overcome issues ofdeliberateor inadvertenterrors in input. Ifyou lookat thedisasterscovered inChapter4,onlytworesultedfromunexpectedlylargemarketmovesinteractingwith correctly reported positions: Long-Term Capital Management andMetallgesellschaft.Evenforcaseslikethese,IshareWilson'sskepticismabouttheusefulnessofstandardVaRasacontrollingmechanismsincemarketmovesthat cause losses of sufficient size to threaten a firm's stability are generallyradicaldeparturesfromrecenthistoricalexperience.This still leaves the possibility of using stress testing or an extreme value
versionofVaRasagoodcontrollingmechanismfor thoseembarrassinglossesthatarebasedon largemarketmoves.For the reasons Ihavegiven inSection7.2, I believe stress tests based on economic insight are far more likely thanstatisticalmethods to produce usefulmeasures for controlling extrememarketmoves.Whenitcomestoriskcomparability,bothVaRandstressoffertheadvantages
Iemphasizedatthebeginningofthischapter—allowingmeaningfulcomparison
andaggregationbetweendifferentbusinesses.AsWilsonstates, traditionalriskmeasures,suchasvalueofabasispointorvega,“providelittleguidancewhentrying to interpret the relative importance of each individual risk factor to theportfolio's bottom line or for aggregating the different risk categories to abusiness unit or institution level.” The ability that VaR and stress provide tomakesuchcomparisonsandaggregation,Wilsonsays,correctlyallowsaninstitutiontogainadeeperunderstandingoftherelativeimportanceofitsdifferentriskpositionsandtogaugebetteritsaggregateriskexposure relative to its aggregate risk appetite. VaR accomplishes theseobjectivesbydefiningacommonmetricthatcanbeapplieduniversallyacrossall risk positions or portfolios: the maximum possible loss within a knownconfidence interval over a given holding period. Besides being able to beapplied universally across all risk categories, including market, credit,operational,andinsurancerisks,thismetricisalsoexpressedinunitsthatare(or should be)meaningful at all levels ofmanagement: dollars (or pounds,francs,etc.).Itthereforeservesasarelevantfocalpointfordiscussingrisksatall levels within the institution, creating a risk dialogue and culture that isotherwise difficult to achieve given the otherwise technical nature of theissues.Wilson's words on this issue square very closely with my own experience.
From the very firstVaR runs and stress test runs our riskmanagement groupperformedforChaseManhattan,managementinterestwasasstrongorstrongerinwhattheyrevealedabouttherelativeriskofindividualpositionsasitwasinthe measurement of total firm risk. Of particular interest were positions thatmanagement had regarded as relatively insignificant contributors to the firm'sriskthatshowedupasamongthelargestcontributorstoVaRandstresstests—small absolute position size was outweighed by large price volatility. It's theability of VaR and stress tests to combine position size, price volatility, andcorrelationwiththerestofthefirm'sportfoliointoasinglemeasure,comparableacross all business lines, that makes them valuable tools in conveying riskinformationtomanagement.This informationonrelativeriskofpositionshasmanypotentialuses. Itcan
provideinputformanagementdiscussionswithtradingdesksonthepropersizeof stop-loss limits. It identifies business lines and positions that require extramanagement attention. It can be used in calculations of risk versus return inperformancemeasurement.When there is a need to reduce riskbecause limitsarebeingbreached,ithelpsidentifyactionsthatwillhavethequickestimpact.

GiventheimportanceofreportsonthecontributionsofriskpositionstoVaRand stress tests, careful attention to thedesignof these reportswill have largepayoffsinbettermanagementprocessesandinappreciationofthevalueoftherisk function.Theclassicwork in this area remains theGoldmanSachs report“HotSpotsandHedges”byLitterman(1997a,1997b).Section11.2.2ofDowd(2005) provides a succinct précis of these ideas.Here ismy take on themainpointstoconsider:
Reportingisneededforseveraldifferenttypesofdecomposition—businesslinesandtradingdesksforperformancemeasurement,tradingpositionsthatmaygoacrosstradingdesksforunderstandingofthefirm'sriskstructure,andtoidentifytargetsforriskreduction.Reportingneedstobeabletoaccommodatebothorganizationstructureandhighlightingofcriticalrisks.Somereportswillneedtobeorganizedinahierarchalfashion,sothatreportingmatchesthewaymanagementisusedtothinkingofthebusinesses.Butotherreportsshouldbeorganizedinalargesttosmallestriskfashiontobesurethatthereissufficientawarenessofthelargestrisksandtofacilitateriskreduction.Allreportsshouldbedesignedwithdrill-downcapability,sothatrisksthatneedextraattentioncanbefurtherbrokendown.Abilitytotakequickactionstoreduceriskandmanagementunderstandingofriskarebothenhancedbyreportingrisksusingcategorizationthatismeaningfultobusinessesandtomanagement.ThesameguidancethatwillbegiveninSections9.2,9.3,9.4,10.4,11.4,and13.1forinformativereportingofnonstatisticalpositionsshouldbefollowedhere.Forexample,VaRandstresstestriskofinterestratepositionsshouldbereportedbyexposuretoparallelshiftsoftheyieldcurveandexposuretochangesinsteepnessofthecurveasinSection11.4.DesignofoptimizationprocedurestoidentifysmallportfoliosofafewinstrumentsthatcanreplicatealargeportionoftheVaRorstresstestriskisusefulbothasadesignforaquickhedgeandasawaytoconveyanintuitiveunderstandingofthemajorcomponentsofthefirm'sposition.
In reporting the contribution of product lines, trading desks, and riskcomponentstooverallfirmrisk,severalapproachesmustbeconsidered:
Eachcomponentcanberepresentedbythescenarioriskmeasureitwouldhaveasastand-aloneportfolio.Thisistheeasiestapproachtoimplementandcertainlygivesagoodindicatorofrelativerisk,butfailstocaptureanycorrelationeffectswithotherriskcomponentsthatcontributetooverallfirm
risk.Eachcomponentcanberepresentedbytheimpactontotalfirmriskthefulleliminationofthatriskcomponentwouldhave.Thiscapturescorrelationeffects,butmaybeunrealisticinthatfulleliminationofabusinesslinemaynotbeafeasiblealternative.Eachcomponentcanberepresentedbyitsmarginalimpactontotalfirmrisk.Thiscapturescorrelationeffectsandgivesagoodmeasureoftheimmediateimpactonfirmriskofaddingtooroffsettingsomeofacomponent'srisk,butitisverydependentonthecurrentmixtureofriskcomponents.Averyriskybusinesslinemaygetrepresentedashavingasmallcontributiontoriskjustbecauseithaslowcorrelationwiththecurrentmixofriskforthefirm.Itmaybebesttouseastand-aloneriskmeasureinconjunctionwithamarginalimpactmeasuretomakesurethatcomponentsthatcanpotentiallymakelargecontributionstoriskreceivetimelymanagementfocus.
The marginal impact measure has a nice side benefit—when you take theweighted sum ofmarginal impact, weighted by current positions, you get thetotalriskmeasureforthefirm.ComparethediscussionherewithDowd(2005,Section11.2.1)—notethatDowdusestheterminologycomponentVaRforwhatIamcallingmarginal impact.Thismakes themarginal impactaconvenient toolforexercisessuchasallocationtobusinesslineoffirmcapitalwhereyouneedthe sumof the parts to equal thewhole. In order to have this property, a riskmeasureneedonlysatisfytheconditionthatitscalesdirectlywithpositionsize;thatis,apositionthathasthesamecompositionbutisktimesaslargehasariskmeasurektimesaslargeastheoriginalposition.ThishomogeneityconditionisclearlymetbybothVaRandstresstestingmeasures.Toseethattheweightedbypositionsumofmarginalimpactsequalstotalrisk,
first write the riskmeasure of the portfolio asR(x1, x2, . . ., xn) where xi is acomponentoftheportfolio.Byhypothesis,R(kx1,kx2,...,kxn)=kR(x1,x2,...,xn).Taking thederivativeofboth sideswith respect tok, the left-hand sideby thechainrule,weobtain:
Settingk=1,
whichstates that thesumof themarginal impactsweightedbypositionequals
totalrisk.Given this ability to place different risks on a common footing, it is quite
natural towant toplace limitsonbusinessesbasedonVaRandstressscenariolosses. Stress scenario losses offer the added benefit of controlling against atleastsomeformsoffinancialdisaster.However,thisdoesnotprovideacompletesolution to control of a trading business, and other (nonstatistical) limits areneeded as well. Wilson emphasizes speed of calculation and ease ofunderstandingandcommunicationasthereasonsforneedingotherlimitsbesidesVaR.Iwouldemphasize,asinSection6.2,theneedtomatchpositiontakingtoexpertiseandtoassureadequatediversityoftradingstyle.Asupplementtotheuseoflimitstocontrolriskistheprovisionofanadequate
capital cushion against potential losses. This cushion is required for bothearnings volatility and market moves. Earnings volatility measurement alignswellwithVaR,whiletheimpactoflargemarketmovesisariskbettermeasuredby stress scenarios. While I believe this to be a sound argument for basinginternalmeasures of capital adequacy on bothVaR and stress loss, regulatorshavestronglyfavoredVaRasthemeasureonwhichtobasecapitalrequiredforregulatory purposes. Since capital required for regulatory purposes can have adirect impacton thefirm'sstockpriceperformance,regulatorshavebeenwaryofanytietoameasuresuchasstress,whichdirectlyreliesonhumanjudgment,forfearthatmanagementwillmanipulateit.VaRhasbeenviewedaspreferablebased on the relative difficulty of manipulating a statistical measure. VaR isviewedasatleastcapturingrelativedifferencesinlevelofrisk.Translationintoarequiredcapitalcushionagainstlarge,unexpectedmovesisthenapproximatedthroughmultiplicationbyanessentiallyarbitraryconstant.ForamoredetaileddiscussionoftheregulatorycapitalstandardsrevolvingaroundVaR,seeChapter3ofJorion(2007).For performance measurement, the critical objective is to have a means of
adjustingtheP&Lperformanceofthefirmandofbusinessunitsforthelevelofrisk taken in achieving this performance.Aswith the capital cushion, the risktaken is both a function of earnings volatility and of vulnerability tounexpectedlylargemarketmoves,arguingforusingamixofVaRandstresslossin developing thismeasure. But the subjectivity of stress scenarios, combinedwiththesolerelianceofregulatorycapitalonVaR,hasledalmostallfirmstothedecision to base this riskmeasure completely onVaR.The firmwhere I haveworkedforthepastseveralyears,ChaseManhattan(nowJPMorganChase),hasbeenveryunusualinutilizingbothVaRandstressinthismeasure.Iwillrelate

someofthehistorythatledChasemanagementtoconcludethatstresslosswasworthutilizingdespitethedisputesbetweenthecentralriskmanagementgroupand business units, which are inevitable when experience and judgment aresignificantdeterminantsofaperformancemeasure.When the Asian credit crisis of the fall of 1997 started to spread to other
emergingmarket economies, we noticed that the losses being experienced byChase trading desks very closely matched the projections of the hypotheticalflight-to-qualitystressscenariowehadconstructed.Thematchwasnotjustforthefirmasawholebutforindividualbusinessunits.Thisexperiencepersuadedmanagement to experiment with tying the risk adjustment of business unitsrelative to stress losses,asan incentive to reducevulnerability to largemarketshocks.Asbusinessadjustedtothenewperformancemeasureinearly1998,wenoticed a significant impact in terms of strategies to continue to meet P&Ltargetswithlessrelianceonpositionsthatwerevulnerabletotheseshocks.TheresultwasthatChaseweatheredthefall1998marketshockduetotheRussiandefault and the unraveling of Long-Term Capital Management with muchsmaller losses than in the fall1997crisisandsmaller losses thanalmostallofour largest competitors (see O'Brien 1999). Continued experience with theimpactofthisdecisionsincethenhascontinuedtoconfirmitsvalue.ThemechanismsforadjustingP&Lreturnforrisk,whichincludecalculating
risk-adjustedreturnoncapital(RAROC)andshareholdervalueadded(SVA),arenottopicsaddressedinthisbook.InterestedreadersarereferredtoChapters20and21ofCulp(2001)andChapter16ofJorion(2007).
EXERCISES
7.1Vaule-at-riskcomputationsUsingthedataintheVaRspreadsheet(withequalweightsonalldays)anda10percentpositionineachofthe10variables,calculatethe99thpercentileVaRusingthefollowingfivemethods:1.Variance-covariance.2.Historicalsimulationusingasingle-pointestimateofthe99thpercentile.3.Historicalsimulationusing2.33×thestandarddeviationofthedailytotalportfoliovaluationsasthe99thpercentile.4.Historicalsimulationusingasinglepointestimatorofthe99thpercentileandsubstitutingthehistoricalvolatilityover themost recent100businessdaysfor thehistoricalvolatilityover thefulldataset,butusingthefulldatasettosimulateresults.5.AMonteCarlosimulation.
Youranswersto1,3,and5shouldbeveryclosetoequal.Why?Whatdoesthistellyouaboutthe

relativeeaseofimplementationofthethreemethods?
7.2MaximizingdiversificationTrythesameexerciseasin7.1withacombinationofinvestmentpercentagesthatyouchooseyourself.Canyoufindacombinationwithoutanyshortpositions(allinvestmentpercentagespositive)thatgivesahighdiversificationbenefit(cellD24oftheVar-CovVaRworksheetintheVaRspreadsheet)?
7.3MeasuringfattailsinhistoricaldataLookattheRatiosworksheetintheVaRspreadsheet.Whatdoesittellyouabouthowfattailedthetimeseriesusedinthesecalculationsis?Atwhatpercentileleveldoyoubegintoseeasignificantimpactofthefattails?
7.4GeneratingfattailsinMonteCarlosimulationsExperimentwiththeMixtureOfNormalsspreadsheetandseehowdifferentselectionsofinputparametersproducedifferentdegreesofkurtosisandclusteringoflargechanges.

CHAPTER8
ModelRiskAnybookon financial riskmanagementneeds toaddress thesubjectofmodelrisk, the risk that theoretical models used in pricing, trading, hedging, andestimating risk will turn out to produce misleading results. This book, whichemphasizes quantitative reasoning in riskmanagement, pays particularly closeattention to how models can be used and misused in the risk managementprocess.Since the publication of the first edition of this book, the financial risk
managementfocusonmodelriskhasintensified.Inthewakeofthe2007–2008crisis,aswediscussinSections5.1and5.2.5.3,therehavebeenaccusationsthatmodel failure was one of the root causes of the meltdown. When a widelydiscussed article has the title “Recipe for Disaster: The Formula That KilledWallStreet”(Salmon2009),itisclearthatmodelriskneedstobeaddressedwithasenseofurgency.Fortunately,inadditiontothissenseofcrisissurroundingmodelrisk,thepast
severalyearshavewitnessedgreaterattentiontoanalysisofhowmodelriskcanbe controlled. Concise, excellent articles by Derman (2001) and Rebonato(2003)arenowrecognizedastouchstonesfortheanalysisofmodelrisk.Morini(2011) is the first thorough book-length treatment ofmodel risk. The FederalReserve and Office of the Comptroller of the Currency joint document for“SupervisoryGuidanceonModelRiskManagement,”whichIwillreferenceasFRB (2011), and theBaselCommittee onBankingSupervision's “SupervisoryGuidance for Assessing Banks' Financial Instrument Fair Value Practices,”which I will reference as Basel (2009b), provide regulatory responses to thelesson of the 2008 events for model risk. I find the joint FederalReserve/ComptrolleroftheCurrencydocumenttobeparticularlythoroughandpersuasiveinitsanalysisofthemanyaspectsofmodelrisk.Thischapterbegins,inSection8.1,withanoverviewfocusingonthevariety
ofopinions thathavebeenexpressedabout the importanceofmodels,or theirunimportance, inmanagingfinancial risk.Section8.2examines theproceduresthatoughttobeusedforriskevaluationandcontrolformodelsofalltypes.Thefollowing three sections give a more detailed analysis of model reviewstandards,distinguishingamongthreetypesofmodels:thoseusedforvaluation
and risk measurement of liquid instruments in Section 8.3, those used forvaluationandriskmeasurementofilliquidinstrumentsinSection8.4,andthoseusedformakingtradingdecisionsinSection8.5.
8.1HOWIMPORTANTISMODELRISK?Whenexaminingmodelrisk,oneimmediatelyencountersaverywiderangeofviewsontherolethatmodelscanplayincontrollingriskandcreatingnewrisks.These vary all the way from viewing model error as the primary cause offinancialrisktoviewingmodelsaslargelyirrelevanttorisk.Theview thatmodels are largely irrelevant to risk canoftenbe encountered
amongtraderswhoviewmodelsasjustconvenientmathematicalshorthandwithnorealmeaning.Allthatreallymattersarethepricestheshorthandstandsfor.Agood example is the yield of bonds as calculated by Securities IndustryAssociation standards. This includes many detailed calculations that have notheoretical justification, but can only be explained historically (for example,some parts of the calculation use linear approximations, which made sensebeforecalculationsweredoneoncomputers).Noonewouldclaimthatthisyieldhasaprecisemeaning—youdon'tnecessarilypreferowningabondyielding7percenttooneyielding6.90percent.However,youcantranslatebetweenyieldandprecisepricegiventheindustrystandardrules.Itisconvenientshorthandtoconvey approximate values. The degree to which these calculations givemisleadingyieldshurtsintuitiveunderstanding,butdoesnotresultinmispricing.Those who view models as playing no real role in pricing and risk
managementviewalmostallmodelsusedinfinancialfirmsasplayingasimilarroletothatofbondyieldcalculation.Atypicalclaimwouldbethat theBlack-Scholesoptionmodel,probablythemodelmostfrequentlyusedinthefinancialindustry,isjustamathematicalconveniencethatprovidesshorthandforquotingoptions prices as implied volatilities rather than as cash prices. In this view,impliedvolatilitiesareanattractivewayofprovidingquotations,bothbecauseofcommonusageandbecausetheyprovidemoreintuitivecomparisonsthanacashprice, but they should not be regarded as having any meaning beyondrepresentingthepricethattheytranslatetousingtheBlack-Scholesformula.If thisviewpoint iscorrect,modelswouldplayanextremelyminimalrole in
controlling risk, and model testing would consist of little more than rotecheckingtoseeifindustry-standardformulashavebeenproperlyimplemented.

However,thisextremeaviewcannotexplainallthewaysinwhichtradingfirmsusemodelssuchasBlack-Scholes.Thevaluationofunquotedoptionsisderivedby interpolating the implied volatilities of quoted options. The Black-Scholesmodelisusedtotranslatepricestoimpliedvolatilitiesforthequotedoptionsandimplied volatilities to prices for the unquoted options. The risk reports ofpositionexposuresusetheBlack-Scholesmodeltocomputetheexpectedimpactofchangesinunderlyingpricesonoptionprices.Scenarioanalysespresentedtosenior management quantify the impact of changes to the implied volatilitysurface.Formoredetails,seeChapter11onmanagingvanillaoptionsrisk.Thisbehavior is inconsistent with a claim that the model is being used purely toprovide convenient terminology.By contrast, the industry standard bond yieldformulas are not used in comparable calculations—interpolations and riskreports are based on amore sophisticatedmodel of separately discounting theindividual cash flows that constitute a bond, with a different yield applied toeach cash flow. In this computation, none of the linear approximations of theindustry standard formulasareutilized.Formoredetailson thesecalculations,seeChapter10onmanagingforwardrisk.The view that models are the primary cause of financial risk is often
encountered in articles describing major trading losses, which are frequentlyascribed to the firm having the wrong model.What is often unclear in theseclaims is whether “having the wrong model” just means making incorrectforecastsaboutthefuturedirectionofmarketpricesorifitmeansmisleadingthefirm's traders andmanagers about thenature of positionsbeing taken.Agoodillustration is thediscussion inSection4.2.1ofwhether the reliancebyLong-TermCapitalManagement (LTCM)onmodels shouldbeviewedas a primarycauseof the collapseof the fund.And after the2007–2008crisis inmortgagecollateralizeddebtobligations (CDOs), onebegan to encounter claims suchas“[David]Li'sGaussiancopulaformulawillgodowninhistoryasinstrumentalincausing the unfathomable losses that brought theworld financial system to itsknees”(Salmon2009).Of course, once products start encountering losses, modelers who had been
promoting a view of the importance of models may now wish to take theopposingview.Morini(2011,Preface)quotesmodelers,speakingafterthecrisis,tellinghim“Modelswerenotaproblem.Theproblemwas in thedataand theparameters! The problem was in the application!” Morini's response is that“Models in finance are tools to quantify prices or risks. This includesmathematical relations, a way to use data or judgment to compute the

parameters, and indicationsonhow to apply them topractical issues.Onlybytakingallthesethingstogethercanwetalkof‘amodel.'Modellersshouldstayaway from the temptation to reducemodels toa setofmathematical functionsthatcanbethoughtofseparatelyfromthewaytheyarespecifiedandfromthewaytheyareapplied. If thiswere thecase,modelswouldreallybeonlyblankmathematicalboxesandpeoplewouldbe right toconsider themuseless,whennot outright dangerous.” Iwould add that anymodelerswhowant to separatetheirworkfromchoicesondataorparametersarebasicallysayingthattheyareprogrammers. There's nothing wrong with being a programmer—it's a highlydemandingprofession.Butwith rareexceptions (a fewpeoplewhoareable topioneeranextraordinaryspeedupofexistingcalculations),programmersarenotcompensatedatthelevelmodelersareanddonothavethedegreeofinfluenceinmakingdecisionsaboutinnovationsinproductsthatmodelersdo.In the final analysis, whether model builders take the responsibility or the
tradersand riskmanagerswhouse them take the responsibility,modelsplayakeyroleinmanagingriskandwemustdevelopclearguidelinestoseethattheroletheyplayistoclarifyissuesratherthantoobscurethem.Thisisthetasktowhichwenowturn.
8.2MODELRISKEVALUATIONANDCONTROLIn this section, we look at those procedures that ought to be used for riskevaluation and control for all typesofmodels—thoseused formaking tradingdecisionsaswellas thoseusedforvaluationandriskmeasurement. InSection8.2.1,wediscuss the scopeofmodel reviewand in8.2.2 theproper roles andresponsibilitiesthatneedtobeestablishedaroundmodelreviewandcontrol.InSection8.2.3,welookatthoseproceduresthatcheckwhetherthemodelselectedhas been correctly implemented—whether the model actually performs asspecified; Morini (2011) calls this model verification. In Sections 8.2.4 and8.2.5,we examine twoparticularly important pieces ofmodel verification, theverification that contractual arrangements have been correctly specified in themodel and the evaluation of approximations. In Section 8.2.6, we turn toproceduresthatcheckwhetherthemodelselectedisappropriatefortheproductortradingstrategybeingmodeled;Morini(2011)callsthismodelvalidation.TheproceduresinSections8.2.3,8.2.4,8.2.5,and8.2.6areprimarilydesigned
fortheinitialevaluationofmodelsleadinguptothedecisionwhetherthemodelshouldbeapprovedforuse,andwhatrestrictions,ifany,shouldbeplacedonits
use.In8.2.7and8.2.8,welookatthoseaspectsofmodelevaluationandcontrolthatshouldtakeplacecontinuouslyorperiodicallyduringthelifeofthemodel'suse tosee ifanynewinformation isavailable tochange the initialconclusionsaboutthemodelapprovalortosuggestmodelmodificationorreplacement.
8.2.1SCOPEOFMODELREVIEWANDCONTROLThefirstpointthatneedstobeestablishediswhatdeterminesthatsomethingisamodel that requires review and control. FRB (2011, Section III) casts the netverywide,statingthat“Forthepurposesofthisdocument,thetermmodelreferstoaquantitativemethod,system,orapproachthatappliesstatistical,economic,financial,ormathematicaltheories,techniques,andassumptionstoprocessinputdata into quantitative estimates. . . .Models meeting this definitionmight beusedforanalyzingbusinessstrategies,informingbusinessdecisions,identifyingand measuring risks, valuing exposures, instruments or positions, conductingstress testing,assessingadequacyofcapital,managingclientassets,measuringcompliancewithinternallimits,maintainingtheformalcontrolapparatusofthebank, or meeting financial or regulatory reporting requirements and issuingpublicdisclosures.”It is important that a definition this broad be used. A computation may be
madebyasimpleformulainaspreadsheetandstillgiverisetoasgreatadangerof incorrect estimation as a computation requiring a complex mathematicalderivationandasupercomputerchurningawayforhours toproduce theresult.Simplyaveragingobservedtwo-andthree-yearinterestratestoobtainatwo-and-a-half-year interest rate alreadyentails an assumption that requires reviewandcontrol(we'lldiscussthisexamplefurtherinSection8.2.6.1).Thementalimagemanyofushaveofamodelasacomplexpieceofmathematicsandcomputerengineering can create blinders when we are looking for potential sources ofmodelrisk.A second point made in FRB (2011, Section V) is that “Vendor products
should nevertheless be incorporated into a bank's broader model riskmanagement framework following the same principle as applied to in-housemodels,althoughtheprocessmaybesomewhatmodified.”Whetheramodelhasbeen created in-house or by a vendor, the consequences of the model beingincorrect still affect the profit and loss (P&L)of the firmusing themodel, sothere should be no variation in the standards applied for model review andcontrol.TheFederalReservegoeson topointout thechallengesof reviewing
vendormodels since they “may not allow full access to computer coding andimplementationdetail”andthereisaneedfor“contingencyplansforinstanceswhen the vendormodel is no longer available or cannot be supported by thevendor.”Themodel reviewprocedures of this chapter can be used for vendormodels, but I have encountered instanceswhere a vendormodel is so opaquethat I have needed to insist that it be replaced by an in-house model or byanothervendormodelthatpermittedmoretransparency.After establishing the scope of the definition of amodel, the next step is to
agree on what needs to be included in a review. Some key points from FRB(2011,SectionIII):
“Modelsareofnecessitysimplifiedrepresentationsofreal-worldrelationshipsandsocanneverbeperfect.”Asaresult,modeluseinvariablyresultsinmodelrisk,whichcanbedefinedas“financialloss,poorbusinessandstrategicdecisionmaking,ordamagetoabank'sreputation”basedon“incorrectormisusedmodeloutputsandreports.”Modelriskcanresultfromeitherfundamentalerrorsinthemodelorinappropriateuseofamodel,particularlytheuseofamodeloutsidetheenvironmentforwhichitwasdesigned.“Modelriskshouldbemanagedlikeothertypesofrisk.Banksshouldidentifythesourceofriskandassessthemagnitude.Modelriskincreaseswithgreatermodelcomplexity,higheruncertaintyaboutinputsandassumptions,broaderuse,andlargerpotentialimpact.”Theintensityandrigorofmodelreviewsneedtobematchedtothedegreeofmodelriskidentified.Modelriskcannotbeeliminated,soitneedstobecontrolledthroughlimitsonmodeluse,monitoringofmodelperformance,adjustingorrevisingmodelsovertime,andinformedconservatismininputs,design,andoutputs.Butwhileconservatism“canbeaneffectivetool”itcannotbe“anexcusetoavoidimprovingmodels.”
8.2.2RolesandResponsibilitiesforModelReviewandControl
I havebeen involvedwith thedesign and approval of several firmwidemodelreview policies. In every case, I have insisted on a prominent statement that“Riskmanagementservesasasecondsetofeyesformodelreview.”Thismeans

thatthebusinessunitthatdevelopsandutilizesthemodelhasfirstresponsibilityforreviewingthemodelandassessingitsrisks.Theroleoftheriskmanagementfunction isvery important inensuring thatan independentunitwithout insiderincentives reviews the model and in creating a uniform model reviewenvironmentthroughoutthefirm.Buttheknowledgethatanindependentreviewwillbeperformedbyriskmanagementcannotbeusedbythebusinessunitasanexcuse for not performing its own thorough review. Having two sets of eyesreviewing themodel is important both forproviding an extra layerof securityandinobtainingthebenefitofinsiderproductexpertisetocomplementoutsiderindependenceandmodelreviewprocessexpertise.FRB(2011)supportsthisviewpointonbusinessunitresponsibility.InSection
VI it states: “Business units are generally responsible for the model riskassociated with their business strategies. The role of model owner involvesultimate accountability for model use and performance. . . . Model ownersshould be responsible for ensuring that models are properly developed,implemented, and used . . . [and] have undergone appropriate validation andapprovalprocesses.”Juststatingthatbusinessunitshaveresponsibilityformodelreviewisonlythe
firststep.Incentivesneedtobeproperlyalignedtomakesurethisresponsibilityistakenseriously.Stepstoassurethisinclude:
Thebusinessunitresponsibilityformodelreviewisjustasmuchaboutclearcommunicationasitisaboutclearthinking.AsMorini(2011,Section1.4.1)emphasizesstrongly:“Thechoiceofavaluationmodelmustbebasedonananalysis...reportedtoseniormanagementinanaggregatedandunderstandableform.”“Quants,traders,andothertechnicallystrongpractitioners”mustfindwaystocommunicatetechnicalideasinnontechnicallanguage“comprehensibleforseniormanagement.”Technicallystrongpractitionerswhohavedifficultyindoingthisshouldseekhelpfromcolleagueswhohavestrongercommunicationskillsorfromcorporateriskmanagementpersonnelwhohavemoreexperienceinthisaspectofmodelreview.Butnooneshouldbeundertheillusionthattheywillescaperesponsibilityforconsequencesbecause“theseniorguysjustweren'tcapableofunderstandingwhatweweredoing.”Ifyoutrulycan'tgetseniormanagerstounderstandthepotentialconsequences,evenwithrenewedeffortatclevercommunications,thenthisisaproductyourbusinessunitshouldnotbetrading.Acleardistinctionshouldbemadebetweenlossesduetomarket

uncertaintiesthatwereclearlyidentifiedandadvertisedaspartofthebusinessunit'smodelreviewandlossesduetomarketuncertaintiesthatwereignoredinthemodelreview.Thelattershouldhavemoreseriousconsequencesforperformancereviewandcompensationthantheformer,andthispolicyshouldbewidelyadvertisedwithinthefirm.Tomakesurethatthepolicyinthepreviousbulletpointissuccessfullyimplemented,ananalysisofsignificanttradinglossesneedstobeconductedbycontrolpersonnelindependentofthebusinessunittodeterminehowlossesarerelatedtomodelreviews.Theindependentmodelreviewconductedbytheriskmanagementareashouldincludeidentificationofweaknessesinthebusinessunitmodelreview.Patternsofweaknessesneedtobeaddressedbycorrectiveaction,aswellasconsequencesforperformancereviewandcompensation.
Ihavenotaddressedheretheissueofhowbusinessunitmodelresponsibilityshouldbedividedbetweenmodelbuildersandtraders.Thiswillhavedifferentsolutionsfordifferentbusinessunitsanddifferentmodels.IwilljustnoteagainmycommentsinSection8.1thatanyfunctionseekingtoshunresponsibilityformodelerrorshouldacceptthatreducedresponsibilityandreducedcompensationopportunitiesgohandinhand.Thisemphasisonbusinessunitaccountability formodel review isconsistent
with placing themain responsibility formodel developmentwith the businessunit and allowing them as much freedom in structuring models as possible.Models need to take advantage of asmuch inside information, in the form oftraderbeliefsaboutthefuture,aspossible.Firmsmusttrytobeopentoasmanytradingideasaspossibleandnotdismissideasonthegroundsthat theydonotline up with some approved theory (for example, rational expectations ormarketplaceefficiency).However, a cullingprocessmust alsobeavailable formeasuring thesuccessof trading ideasandeliminating those ideas thatarenotproving successful. Insiders should be given latitude in the theories used indecidinghowtotrade,butnotinthetheoriesusedindecidingwhentorecognizeP&L. Profits should not be booked and bonuses not be paid out until theforecastsofthetradingmodelshaveprovencorrect.FordecisionsonwhentobookP&L,it isbettertorelyonoutsiderstoavoid
bias. You may lose accuracy by not having access to the insiders' marketknowledge,butthiswillonlyresultindelaysinrecognizingearnings,whichisnotasseriousaproblemastakingthewrongpositions.InsidersmayobjectthatthisdelayinrecognizingP&Lwillcausethemtoturnawaygoodbusiness,but

they have two alternatives: find others in themarketwho share their opinionsandsellofftheriskrecognizingtheprofits,or,iftheyaresufficientlyconfident,waittorecognizetheP&Luntilaftertheriskpositionhasmatured.Theriskmanagementunitsthatarepartofcontrolfunctionsandthatconstitute
theindependent“secondsetofeyes”inmodelreviewdonothavethebusinessunits'incentiveissues.Itisverycleartothemthatunidentifiedmodelrisksthatlead to trading losseswill cost them incompensationandmaycost them theirjobs and even their careers. The incentive problem here runs in the oppositedirection: the negative consequences of approving a model that later provesdefective are so clear that there is a danger of playing it safe by creatingunreasonably high barriers tomodel approval.After all, a rejectedmodelwillnever have a chance to show how it would have performed, so there mightappear to be little danger in being proved wrong by being overly cautious.Fortunately, in most firms, business units will press their case with sufficientpassion and sound analysis to overcome such unreasonable barriers to newbusiness.Butmanagers of independentmodel reviews need to be alert to thistemptation toward caution, and need to be constantly challenging modelreviewerstomakesuretherightbalanceisbeingstruck.Theproblemsforindependentriskmanagersaremorelikelytorestwithissues
ofexpertiseandaccessthantheyarewithissuesofincentive.Asoutsiders,theyhavelesschancetobuildupthethoroughknowledgeofmodelsandmarketsthatbusinessunitspossess.Thiscansometimesbeaddressedbyemploying formermodelbuildersasindependentreviewers,butthisisacareermovethatappealsto only a small subset of model builders. Other techniques for trying toovercome this gap in expertisewill be addressed throughout the remainder ofthischapterandthisbook.Forissuesofaccess,rulesneedtobeputinplaceandenforced to see that business units are forced to share model code,documentation,andsupportingdatawithindependentreviewers.Claimsofneedforsecrecytoprotectproprietarymodelfeaturesmustbeviewedwithsuspicion—theseareoftenjustexcusestotrytoavoidindependentscrutiny.Whenfoundlegitimate, suchclaimsneed tobeaddressedbycontrols that restrict access toonlythoseactuallydirectlyinvolvedintheindependentreview;theymustneverbeusedasareasontolimitthescopeoftheindependentreview.Independent model reviewers need to clearly identify steps that need to be
taken when they find issues with models. As FRB (2011, Section VI) states,“Controlstaffshouldhavetheauthoritytorestricttheuseofmodelsandmonitorany limits on model usage. While they may grant exceptions to typical

procedures ofmodel validation on a temporary basis, that authority should besubjecttoothercontrolmechanisms,suchastimelinesforcompletingvalidationworkandlimitsonmodeluse.”Inallcaseswherefollow-upactioniscalledfor,thereshouldbedefinitedatesforfurtherreviewestablishedandawell-organizedprocedure formaking certain that a follow-up review is performed evaluatingthesefollow-upactions.The role just specified for independent model review is consistent with the
guidingprincipleofFRB(2011,SectionIII)of“effectivechallenge”ofmodels—“critical analysis by objective, informed parties who can identify modellimitations and assumptions and produce appropriate changes.” Requirementsfor effective challenge outlined by the Federal Reserve are separation of thechallengefromthemodeldevelopmentprocess,knowledgeandmodelingskillsadequate toconductappropriateanalysisandcritique,andsufficient“influencetoensurethatactionsaretakentoaddressmodelissues.”Towhatextentshouldexternalresources(i.e.,consultants)beusedaspartof
theindependentmodelreviewprocess?Therearemanyreasonsforwantingtominimize the use of external resources: the desire for confidentiality ofproprietary models, the desire to build up in-house expertise through theexperiencegainedbyconductingmodelreviews,andthefearsofdiscontinuityifan external resource becomes unavailable or proves unsatisfactory. There stillmay be timeswhen use of external resources is desirable, either because of alack of in-house expertise within the independent model review group orbecausemanpoweravailableisnotsufficienttomeetthedemandofnewmodelsneedingreview.Whenexternalresourcesareutilized,careshouldbetakenthatadesignatedin-housereviewerbecomesasfamiliaraspossiblewiththeworkoftheconsultant.Thisservesthefunctionofacquiringsomein-houseexpertisethatcan be utilized in subsequent model reviews, as well as having someone in-house who canmonitor and coordinate the work of the consultant, provide apointofcontactforsubsequentdiscussionoftheconsultant'swork,andbeabletorampupinvolvementincaseofdiscontinuity.(Comparethediscussioninthisparagraphwiththesegmentheaded“ExternalResources”inFRB[2011,SectionVI]).Finally,allmodelreviewactivities,both thoseofbusinessunitsand thoseof
independent reviewers, must be properly documented. This covers bothdocumentation of the model itself and of the model review process. Modeldevelopersareoftenanxioustogetontothenextproject,andbusinessunitsareanxioustodevelopthenextmodel;modeldocumentationcangetshortchanged

intheprocess.Poorlydocumentedmodelsarelikelytocostmoneyinthelongrun, by making model revisions more difficult and time-consuming and byincreasingthelikelihoodthatmodelerrorswillbemissed.Ifnecessary,businessunits may need to establish separatemodel documentation teams to completedocumentationbasedoninterviewswithmodeldevelopers.Standardsfordocumentationofmodelsandmodelreviewsshouldincludethe
following:Areviewoftheadequacyofbusinessunitdocumentationbytheindependentmodelreviewershouldbeincluded,withrecommendationsforgapsthatneedtoberemedied.“Documentationandtrackingofactivitiessurroundingmodeldevelopment,implementation,useandvalidationareneededtoprovidearecordthatmakescompliancewithprocesstransparent”(FRB2011,SectionVI).Aninventoryofallmodelsthatrequirereviewshouldbemaintained,bothbybusinessunitandfirmwide.Thisinventorycanserveasacentralcontrolpointforschedulingmodelreviews,keepingtrackofdocumentation,providinginformationoncontacts,andschedulingupdatesofmodelreviews(FRB2011,SectionVI,“ModelInventory”).Documentationisalsorequiredforthepoliciesgoverningmodelreviewandtherolesandresponsibilitiesofbusinessunitsandindependentreviewers(FRB2011,SectionVI,“PoliciesandProcedures”).
Whatistherolefortheseniormanagementofthefirminmodelreview?FRB(2011, Section VI) emphasizes senior management responsibility for assuringthataprocessisinplacethatmeetsthestandardsoutlinedinthissectionandinSection 8.2.1. This certainly includes providing adequate funding for thesefunctions. Basel (2009b) has a similar statement in its Principle 1 and, inPrinciple 2, emphasizes that the review capacity has to be adequate to handleconditionsofstress.Thisisobviouslyaresponsetothestressedconditionsofthe2008crisis.In addition to thesemore formal requirements, seniormanagementmust be
preparedtounderstandtheaggregatelevelofmodelriskthatthefirmisexposedto and to set limits on this risk. Having a requirement that business unitscommunicatemodel risk in an aggregated and comprehensible form to seniormanagers, as we have at the start of this section, entails a correspondingresponsibilityofseniormanagerstomakeuseofthisinformation.Therewill,ofcourse,becasesofconflictingpresentationtoseniormanagement—oftenamoresanguineviewofriskfromthebusinessunitandamorecautiousviewfromthe

riskmanagementgroups.Seniormanagersmust insist thatbothsidesgetafairhearing, preferably in the same roomat the same time, and that arguments bepresented in a comprehensiblemanner. At the end of the process, it is seniormanagementthatownstheriskandmustreachadecision.Boards of directors in principle exercise an oversight role over senior
management in controlling model risk, as in all other critical aspects of thebusiness.Inpractice,itisverydifficultfordirectors,whoseinvolvementisonlyfor a small part of eachmonth, to havemuch impact, particularly since theiraccesstoinformationisoftentightlycontrolledbyseniormanagement.Theonecourseofaction Iwould recommend is thatdirectorson the riskcommitteeoftheboardinsistonprivatemeetingswithseniorriskmanagementpersonnel.Thiswill at least provide a forum for concerns to be expressed that could givedirectorsenoughinformationtoposequestionstoseniormanagement.
8.2.3ModelVerificationMost model problems are related to the fit between the product or tradingstrategybeingmodeledand themodelselected.This issueofmodelvalidationwe will address in Section 8.2.6. Here we deal with the simpler question ofwhether themodel selectedhas actuallybeenproperly implemented—does themodel actually do what it claims to do? This can be controlled by adequatemodeldocumentationandthoroughcheckingbycompetentreviewersbeforethemodelisputintoproduction.Hereareafewrulesthatshouldbeborneinmindtomakesurethisgetsdoneproperly(moredetailonthesepointscanbefoundinFRB[2011,SectionV]andMorini[2011,Section1.5.1,“ModelVerification”]):
Thoroughdocumentationofwhatthemodelistryingtoachieve,modelassumptions,andderivationofformulasmustbeinsistedon.Allformuladerivationsshouldreceiveanindependentcheck.UsefuladvicefromMorini(2011,Section1.5.1)is:“Whenamodelisusedforthefirsttimethepassagesfromdynamicstoclosed-formformulasortheotherwayaroundshouldbeverified.Thisshouldbethecaseforanynewmodeldevelopedbyafrontofficequant,alsoforanynewmodelthatsimplyappearsontheInternet—orinajournal.Thereareerrorseveninpublishedliterature,neverbetootrusty.”Systemsimplementationofthemodelshouldbesubjecttorigorousstandardsofdocumentation,changecontrolprocedures,andsystemstesting.Thebestcheckonanimplementationistoperformanindependent

implementationandseeiftheresultsagree.Itistemptingtocutcostsbyconfiningcheckingtohavinganindependentanalystreadthroughthedocumentation,equations,andcodeofthemodelbuilderandconfirmitiscorrect.Butitismucheasiertomissanerrorinreadingthroughsomeoneelse'sequationsorprogrammingcode;itismuchmoreunlikelyfortwoanalystsworkingindependentlyofoneanothertomakethesameerror.Wheneverpossible,theindependentimplementationusedasacheckshouldemployadifferentsolutionmethodologythantheimplementationbeingtested.Forexample,iftheimplementationbeingtestedhasusedaMonteCarlosimulation,thetestshouldbemadesolvingbackwardsonatree,wherethisisfeasible.Usingdifferentimplementationmethodologiesreducesfurtherthechancesthatthetwoimplementationswillhavethesameflaw.Modelsshouldbetestedondegeneratecasesthathaveknownsolutions.Forexample,adown-and-outcallwithabarrierofzeroisequivalenttoavanillacall,sosettingthebarriertozeroinadown-and-outcallmodelshouldproducethestandardBlack-Scholesresult.Otherexampleswouldbe:(1)toalwayscheckthatput-callparityforEuropean-styleoptionsispreservedforanymodelusedtopriceoptions,and(2)toalwayscheckexoticoptionmodelsagainstknownanalyticsolutionsforflatvolatilitysurfaces(seetheintroductiontoSection12.1andSection12.3.1).ModelsshouldbetestedfortheirimpactonVaRandstresstestcalculationsaswellasonvaluationandlimitcalculations.Modelsshouldbetestedonextremeinputstoseethattheyhandlethesecasesproperly.Forexample,interestratesmuchlowerandmuchhigherthanhaverecentlybeenexperiencedshouldbeinputtoseethatthemodelcanproducereasonableresults.Formoredetailsonthismodelstresstesting,seeMorini(2011,Section3.1).Producegraphsofmodeloutputplottedagainstmodelinputsandexploreanyinstanceswheretheydonotmakeintuitivesense.Thisisanothergoodcheckonthemodel'sabilitytohandleextremeinputs,asperthepreviousbulletpoint.Theimpactofvaryingseveralinputssimultaneouslyshouldbecomparedtothesumoftheindividualimpactstocheckiftheinteractionsofvariablechangesproducereasonableresults.Whenanewmodelisreplacinganexistingmodel,athoroughbenchmarkingprocessshouldbeusedtocompareresultsofthetwomodelsforanidenticalsetofinputs.Modeldifferencesshouldbecheckedfor
reasonablenessandunreasonabledifferencesinvestigated.Thesamebenchmarkingstandardsshouldbeutilizedwheneveronesystemsimplementationofanexistingmodelisbeingreplacedorsupplementedbyanothersystemsimplementationofthatmodel.Modelerrorduetoincorrectrepresentationoftransactionsisjustasworrisomeasmodelerrorduetoincorrectequations.ThiswillbeaddressedinSection8.2.4.Aparticularpointofconcernisapproximationerrorintroducedbytheneedforfastresponsetimeinaproductionenvironment.ThiswillbeaddressedinSection8.2.5.
Be careful about the degree of complexity introduced into models. Is theresufficientgaininaccuracytojustifythereductioninintuitiveunderstandingthatresults from added complexity? To illustrate with an example from my ownexperience:Ihadrecentlytakenanewjobandfoundthatmymostpressingproblemwas
widespread user dissatisfaction with a model upgrade that had recently beenintroduced. The old model had been easy for traders and risk managers tounderstand; the new one was supposed to be more accurate, but could beunderstood only by the model development group. My initial examinationshowed that, on theoretical grounds, the difference between answers from thetwomodelsshouldbetoosmalltomakeanactualdifferencetodecisionmaking,soI tried topersuade themodelbuilder toswitchback to theoriginal, simplermodel. Finding him adamant on the need for what he viewed as theoreticalcorrectness, I examined the new model more closely and found a majorimplementationerror—afactorof2hadbeendroppedintheequationderivation.Thisisthesortofmechanicalerrorthatwouldcertainlyhavebeenpickedupassoon as a formal model review was performed. But a similar error in a lesscomplexmodelwouldhavebeencaughtlongbefore,bythepeopleusingitonaday-to-daybasis.
8.2.4ModelVerificationofDealRepresentationVerification of transaction details that serve as input tomodels can be just asimportant in avoidingvaluation and riskmeasurement errors asverificationofthemodelitself.The quote from FRB (2011) in Section 8.2.1 that “Models are of necessity
simplified representations of real-world relationships and so can never be

perfect”appliesjustasmuchtotherepresentationoftransactionsinmodelsasitdoes to the models themselves. A single transaction confirmation documentoften runs to tens of pages and its representation in the model is just a fewnumbers,soinevitablysomesimplificationandapproximationarebeingutilized.Insomeways,thisisamoredifficultissuetodealwiththanverificationofthe
modelitself,becauseofthelargenumberoftransactionsthatareofteninputtoasingle model. Reconciling transaction details between confirmations andposition entries to models is an important middle-office control function, asemphasizedinSections3.1.1and3.1.2,andwillcertainlybeexpectedtocatchnumericalerrorsindataentryanddetailssuchascorrectdaycountconvention.Butmiddle-officepersonnellacktheintimateknowledgeofthemodelthatmightallowthemtoidentifyanimportantcontractdetailthatisnotbeingcapturedinthewaythetransactionisbeingrepresentedinthemodel.Somestepsthatshouldbetakentocontrolthisriskare:
Whilemodelbuildersandindependentmodelreviewerswhodohaveintimatemodelknowledgewon'thavethetimetorevieweverytransactionconfirmation,theyshouldreviewalloftheverylargesttransactionsandasampleoftheremainder,tolookforbothindividualerrorsandpatternsoferrors.Samplesshouldbeselectedatrandom,butwithsomeweightingschemethatmakesitmoreprobablethatlarge-impacttransactionshavemoreofachanceofbeingpartofthereviewedsamplethanthoseoflesserimpact.Reviewshouldconsistofathoroughreadingoftheconfirmation,comparisonwithhowtheconfirmationhasbeenrepresentedinthemodelinput,andconsiderationofanypossiblegapsintherepresentation.Middle-officepersonnelshouldbestronglyencouragedtoimmediatelyraiseanyquestiontheyhaveaboutadequaterepresentationwithanindependentmodelreviewer.InthedailyP&Lverificationprocess,discussedinSection8.2.7.1,anytransactionthatmakesapaymentsignificantlyoutoflinewiththepaymentprojectedbythemodelshouldbeinvestigated.Thismayuncoveranoutrighterrorindataentry,butmayalsoidentifyafacetofthecontractthathasnotbeenadequatelyrepresentedinthemodelinput.Somewordingdifferencesbetweendifferentvariantsofcontractsmaybeverysubtle(forexample,seethediscussionoflegalbasisriskoncreditdefaultswapsinSection3.2andSection13.1.1.2).Thebestapproachinthistypeofcasemaynotbetotrytocaptureallthesevariantsinthemodelinput.Itmaybebettertohaveaseparateofflinecalculationoftherisks

arisingfromwordingdifferencesandtoestablishlimitsandreservesagainstthisriskonthebasisofthisofflinecalculation.Thiscanberegardedasatypeofliquidproxy,perourdiscussioninSection8.4,withthemostcommoncontracttypeservingastheliquidproxyinallstandardriskcalculations,suchasVaRandstresstests,butwiththeseparateofflinecalculationcapturingthenonliquidrisk.
8.2.5ModelVerificationofApproximationsThe quote from FRB (2011) in Section 8.2.1 that “Models are of necessitysimplified representations of real-world relationships and so can never beperfect”couldbeparaphrasedas saying that“Allmodelsareapproximations.”But formodel review it isvery important todistinguishbetween twodifferenttypesofapproximations:
1.Approximationsinwhichsomesourceofriskordriverofvaluehasbeenomittedtoreducemodelcomplexity.2.Approximationsinwhichacomputationalapproximationisbeingusedinordertospeedcalculationsandreducecost.Approximationsinvolvingtheomissionofariskfactorposegreaterchallenges
formodelreview,sinceitcanbeverydifficult toestimate thepotential impactonearningsandrisk.ThisissuedominatesourdiscussionofmodelvalidationinSection 8.2.6 and in Sections 8.3, 8.4, and 8.5. Approximations involvingcomputationalapproximationaremucheasiertocontrol,sincethemodelreviewprocess can create a detailed comparisonbetween the productionmodel and amore thorough model that is run less often or only on a selected sample oftransactions.Thissectionfocusesontechniquesfordealingwithcomputationalapproximations.We begin by looking at a set of suggested controls for computational
approximation and then illustratewith a detailed example. Suggested controlsare:
Modelreviewsshouldexplicitlyrecognizethetrade-offsbetweenmodelaccuracyandinvestmentofresources.Modelsusedinproductionmustbesufficientlyfasttoproduceanswerswithinthetimeframerequiredforprovidingquotestocustomersandprovidingriskanalysistothetradingdeskandseniormanagementortheywillproveuseless.Theirdevelopmentcostmustbereasonablyrelatedtotherevenuethatcanberealizedontheproductstheysupport.Thetimerequiredfordevelopmentmustbe

consistentwithoverallbusinessplans.Evaluationsoftheinaccuracyofaproductionmodelneedtobemadebycomparisontoamorethoroughmodel.Sincemodeltestingcanbeperformedoveraperiodofdaysorweeks,ascomparedtotheminutesorsecondsrequiredofaproductionmodel,thereisampleroomtodevelopmuchmorethoroughmodelsintestingenvironments.Comparisonofresultstotheproductionmodelwillshowjusthowmuchaccuracyisbeinglost.Comparisonsoftheproductionmodeltoamorethoroughmodelneedtobeperformednotjustforcurrentmarketconditions.Testsshouldbeperformedtoanticipatetheimpactonapproximationofpotentialfuturemarketconditions.Wherethistestshowssignificantlossofaccuracy,thisidentifiesagoodtargetforimprovedapproximations.Untilsuchimprovementscanbeimplemented,remediescanincludevaluationreservesagainstinaccuracyalongwithperiodicrevaluationswithaslowerbutmoreaccuratemodel,aswellastradersexercisingadegreeofconservatisminpricingandhedging.Improvedapproximationscanbeachievedby“throwingmoremoney”attheproblem—buyingmorehardwaretoincreasethenumberofcalculationsthatcanbeperformedinagivenperiodoftime.Butmorecanusuallybeaccomplishedbythedesignofcleverapproximationalgorithms.Indeed,oneofthedirtylittlesecretsofindustryquantsisjusthowmuchoftheeffortofpeoplewithPhDsgoesintoapplyingadvancedmathematicstocreatingbetterapproximationalgorithms,ratherthantothecreationofnewideasforfinancialmodeling.Forexample,seeSection13.3.3.Insomecases,thethoroughmodelcanbesocomputationallyintensivethatitcanbeevaluatedononlyasampleoftransactions.Thisisclearlyalessdesirabletestofaccuracythanonethatlooksatthefullportfolio,butwhenthisisnecessarythereviewedsampleshouldincludealloftheverylargesttransactionsandarandomselectionoftheremainder.Therandomselectionshouldbechosenwithsomeweightingschemethatmakesitmoreprobablethatlarge-impacttransactionshavemoreofachanceofbeingpartofthereviewedsamplethanthoseoflesserimpact.Approximationsneedtobereevaluatedperiodically,sinceapproximationinaccuracycanbestronglyrelatedtoportfoliosizeandcomposition.ThispointwillbediscussedinmoredetailinSection8.2.8.1.Acleardistinctionneedstobemadebetweenthedegreeofaccuracyneededtospecifyinitialmarketconditionsandthedegreeofaccuracyneededto

specifytheevolutionofmarketconditions.Forexample,aswewillseeinSection12.5.2,amultifactormodelfortheevolutionofinterestratesdoesnotoffermuchaddedaccuracyoverasingle-factormodelforthevaluationofBermudanswaptions.Butaspecificationoftheshapeoftheinitialyieldcurvethatdoesnotutilizeafullsetofliquidpointsontheyieldcurvecanhaveaverysignificantimpactonthisvaluation.
Asanillustrativeexample,IwanttoconsiderasituationIwasinvolvedwithas a model reviewer. It involved a large portfolio of illiquid interest ratederivatives, all of which required Monte Carlo simulation for valuationcalculations and for calculationsof riskparameters.Thenumberof simulationpathsbeingrunhadbeenveryclearlyselectedbythetradersasthenumberthatwouldallowalloftheneededcalculationstobeperformedbetweenthecloseofbusinessandtheopeningoftradingthenextday.Totestfortheimpactofthischoiceonaccuracy,Ifirstsetupasimulationfor
thewholeportfolio thatwouldruncontinuouslyforaboutaweekinanofflineenvironment.Theresultsfromthisverymuchlargernumberofrunsallowedmetoestimatethenumberofrunsneededtodetermineaccuratevaluationtowithinthe tolerance required for financial significance (see, for example, Hull 2012,Section 20.6, “Number ofTrials”). Iwas also able to see howmuch variancefrom this accurate valuation resulted from the smaller sample being used inproductionruns.Inextusedthelargersampletoestimatetheimpactoftheselectionofdifferent
sets ofMonteCarlo simulationpaths on theproduction run. I determined thattherewasreasonablestabilityoverasufficientlysmalltimeframe;asetofpathsthatproducedaccuratevalueswhencomparingresultsfromthesmallernumberofpathsintheproductionruntothelargernumberofpathsusedintheofflinerunwouldalsobefairlyaccurateoverthenextfewdays.Butasthetimeperiodlengthened from days to weeks, a set of paths that had previously producedaccurate values lost accuracy, both as a result of shifts in composition of theportfolioasnewtransactionswereaddedandoldertransactionshadlesstimelefttoexpiry,andasaresultofchangesinmarketparameters.I therefore set up the following process. Once a month, a new offline run
wouldtakeplaceandwouldbeusedtodeterminethesetofpathsthatwasgoingto be used in the production runs for the next month. These production runsdeterminedvaluationsandsensitivities reported forP&Land riskmanagementpurposes.Eachmonth,theshiftfromonesetofpathsusedintheproductionrunsto a new set of paths would cause a change in P&L. These changes were

randomly distributed, as likely to be increases in P&L as decreases, with astandarddeviationthatcouldbeestimatedfromcomparisonsbetweenvaluationsofdifferentsubsetsofpathsintheofflinerun.Iarguedthatwhile thesechangeswererandomlydistributed, thefirmshould
have a reserve against negative changes so that we were reporting toshareholdersonlyvaluationswecouldbefairlysurewereactuallyachievableinthe long run (since the portfolio consisted of illiquid positions, it was notpossible to realize a current value just by liquidation—wewere committed toholding the portfolio for a longer time period). Therefore, each time newtransactions were added, the reserve would be increased to reflect addeduncertainty,whileasoldertransactionsgotclosertoexpiry,thereservewouldbereducedtoreflect lessuncertainty.Eachmonth,whenthechangeinpaths tookplace,theresultinggainorlosswouldimpactthereserveandwouldnotimpactP&L(thereservewouldhavehadtobeexhaustedtoimpactP&L,butthisneveroccurred in practice). I was able to get agreement from the firm's financefunctionandaccountingfirmtomakethisprocesspartoftheofficialbooksandrecordsofthefirm,andnotjusttheriskmanagementreports.Note that this process had a built-in set of controls against changes in the
market environment or portfolio composition, since the monthly offline runwouldautomaticallypickupanysuchimpacts;thesizeofrequiredreservewasrecomputed each month by recomputation of the standard deviation betweenvaluationsofdifferentsetsofpaths.Theissueofcomputationalapproximationsisparticularlyimportantforcredit
portfolio models and the closely related collateralized debt obligation (CDO)models. These will be covered in some detail in Sections 13.3.3 and 13.4.2.Another area in which computational approximation plays a major role is inmultifactorinterestratemodels.ThisisdiscussedingreatdepthinMorini(2011,Section 6.2), which includes extensive examination of the accuracy of theseapproximations.
8.2.6ModelValidationWe must now move beyond the tests of internal model consistency we havefocusedoninSections8.2.3,8.2.4,and8.2.5tolookatthefitbetweenthemodeland the product or trading strategy being modeled, what Morini (2011) callsmodel validation. It is not surprising that thismore challenging task does notlend itself to the easy consensus and process-oriented approach of these last

three sections. We will distinguish between three basic approaches to modelvalidation: one focusedon interpolation, one focusedon the long-termcost ofhedging,andonefocusedondiscoveringtheprevailingmarketmodel.Thesearenot completely competitive approaches—there is someoverlap among them—but theydohavedistinctlydifferentemphases.Aswewillsee, theappropriateapproachhasmuch todowith thepurpose themodelwillbeused forand theliquidityoftheproductbeingmodeled.Wewillalsolookattheissueofhowtodealwith risks thatmay not be evident tomodel reviewers. I would stronglyrecommend comparingmy approach in this section toMorini (2011, Sections1.5.1and1.5.2).
8.2.6.1InterpolationApproachIn the interpolation approach, models are viewed as primarily serving asinterpolation tools from observable to unobservable prices. This is closelyrelated to the viewdiscussed in Section 8.1 that downplays the importance ofmodels. Viewing models as interpolation tools provides valuable insight intowhy certainmodels have been able to achieve a high degree of acceptance infinancial management. It is much easier to agree on an interpolationmethodology than it is to agree on a fundamental method for pricing aninstrument.Thedangeristhatthisviewleadstounwarrantedcomplacency,sincemodel builders often regard interpolation as being amathematically trivial oruninteresting task. The result can be uncritical acceptance of what seems aplausibleinterpolationmethodoraviewthatthechoiceofinterpolationmethodsissomehowamatteroftaste.A closer examination will show that every choice of interpolation method
entails significant financial assumptions. The interpolation of an unobservableprice based on a set of observable prices amounts to the theory that theinstrument with the unobservable price can be well hedged by the set ofinstrumentswithobservableprices.Aswithanytheory,thisshouldbesubjectedto empirical testing and competition with alternative hedging proposals. Eventhesimplest-sounding interpolationproposal (forexample,calculating the two-and-a-half-yearrateasa50–50averageofthetwo-andthree-yearrates)shouldbe regarded as a model subject to the same tests as more mathematicallycomplex models.We examine this in more detail in Sections 8.3 and 10.2.1.Models rarely cost firms money because modelers have made an error incomplexmathematics; they frequently cost firmsmoneybecause they embodyfinancialassumptionsthatarenotborneoutbyfutureevents.

8.2.6.2CostofHedgingApproachBasingmodel validationon an examinationof thepossible costs of hedging atransaction over the long term is closely related to the approach advocated inSection6.1.2ofestablishinga liquidproxy foran illiquid instrumentand thensimulating the difference between the liquid proxy and the actual trade. ThisviewpointhasbeenlaidoutveryeloquentlyinDerman(2001):It's never clear what profit and loss will result from hedging a derivativesecurity to its expiration.Marketswillmove inunexpectedways, sometimesintensifying transactions costs and often dismantling what seemed areasonable hedging strategy. These effects are rarely captured by theconventionalmodelsusedinfront-officevaluationsystems....Therefore,forilliquidpositions,itisimportanttoestimatetheadjustmentstoconventionalmarkedvaluesthatcanoccurasaresultoflong-termhedging.OneshouldbuildMonteCarlomodelsthatsimulatebothunderlyerbehaviorandatrader'shedgingstrategytocreatedistributionsoftheresultantprofitorloss of the whole portfolio. These distributions can be used to determine arealistic adjustment to the trading desk's conventional marks that can bewithheld until the trade is unwound and their realized profit or lossdetermined....MonteCarloanalysisprovidesagoodsenseofthevariationin portfolio value that will be exhibited over the life of the trade due totransactions costs, hedging error andmodel risk.Ultimately, such analysesshouldbepartofthedesk'sownfront-officevaluationsystem.Note: There is a rough equivalence between Derman's use of “underlyer”
liquidinstrumentsbeingusedtohedgetheilliquidinstrumentandmyemphasisonarepresentativeliquidhedge.AsDermansays:“Derivativemodelsworkbestwhen they use as their constituents underlying securities that are one levelsimplerandonelevelmoreliquidthanthederivativeitself.”
8.2.6.3PrevailingMarketModelApproachRebonato(2003)emphasizesmodelvalidationbasedonthemodelthatprevailsinthemarketplaceandanticipationofdirectionsinwhichtheprevailingmarketmodelmightevolve:“Model risk is the riskofoccurrenceof a significantdifferencebetween the
mark-to-model value of a complex and/or illiquid instrument, and the price atwhichthesameinstrumentisrevealedtohavetradedinthemarket.”

“Fromtheperspectiveoftheriskmanagerthefirstandforemosttaskinmodelriskmanagementistheidentificationofthemodel(‘right'or‘wrong'asitmaybe)currentlyusedbythemarkettoarriveattradedprices.”
“[M]arketintelligenceandcontactswiththetradercommunityatotherinstitutionsareinvaluable.”Requiresavarietyofmodelstoreverse-engineerobservedprices.Requiresinformationaboutasmanyobservedpricesaspossible.“Nomatterhowgoodorconvincingatheoreticalmodelmightbe,fewstatesofaffairsshouldworryariskmanagermorethanthetraderwho,usingthismodel,consistentlybeatsallcompetingbanksinacompetitive-tendersituation.”
“Thenextimportanttaskoftheriskmanageristosurmisehowtoday'sacceptedpricingmethodologymightchangeinthefuture”(includingchangestomodel,changestocalibration,andchangestonumericalimplementation).“Beingawareofthelatestmarketdevelopments,andofacademicpaperscanbeveryusefulinguessingwhichdirectionthemarketmightevolvetomorrow.”“Toalargeextent,themodelriskmanagementtaskcanbedescribedasaninterpolationandextrapolationexercisethatsimplycannotbecarriedoutinaninformationalvacuum...withoutatleastsomeanchorpointsofsolidknowledgeaboutthelevelsandnatureofactualmarkettransactions.”
HullandSuo(2001)presentanapproachtomodelvalidationcloselyrelatedtoRebonato's.Theyquantify theriskofamodelbeingusedbya tradingdeskbyestimatinghowmuchofalossthetradingdeskwouldsufferifadifferentmodelturnedouttobecorrect.
8.2.6.4MatchingModelValidationtoModelPurposeTherearetwodimensionstomatchingmodelvalidationtomodelpurpose.Thefirst relates to the degree of liquidity of the instrument being modeled. Thesecondrelatestodifferencesbetweenmodelsbeingusedformanagingthefirm'soverall risk, the models of valuation and position measurement described inSection6.1,andmodelsbeingusedtomaketradingdecisions.The key to designing a propermodel valuation procedure formodels being
usedtomanagethefirm'sriskistofitthemodelreviewtothedegreeofliquidityof the instrument for which the model is being used. Essentially, we need toworkoutthemodelreviewimplicationsoftheliquiditydifferencesdiscussedin

Section6.1.1.Pleasenotethatthedistinctionhereisbetweenliquidandilliquidinstruments,
notliquidandilliquidpositions.Ifapositioninaliquidinstrumentissolargeastocreateanilliquidposition,thisneedstobedealtwithbymodifyingVaRandstress test calculations, as discussed in Section 6.1.4, but does not require adifferentmodelormodelreviewthanwouldbeneededforasmallerpositioninthesameinstrument.Theinterpolationapproachtomodelvalidationisusuallyveryreasonablefor
liquid instruments. We will look at the details of applying the interpolationapproach to liquid instruments in Section 8.3. For illiquid instruments, theinterpolation approach has little relevance; the kind of frequent checks ofinterpolationmethodologywiththemarketrecommendedinSection8.3arenotpossible because of illiquidity. Given that interpolation will be of little use,modelverificationforilliquidinstrumentsmustthereforerelyoneitherthecostof hedging approach or the prevailing market model approach or somecombination of the two. We explore this issue in detail in Section 8.4. Formodels used inmaking tradingdecisions, discussed further inSection8.5, theprevailing market model approach is the most salient, as the next exampleillustrates.Tobetterunderstandtheimplicationsofdifferenttypesofmodeluse,consider
thecaseofthe1998breakdownofthehistoricalrelationshipbetweenthepricingof interest rate caps and interest rate swaptions, discussed in detail inMorini(2011, Sections 11.3 and 11.4). For models utilized for managing the firm'soverall risk on liquid instruments, this breakdown was probably a nonevent.Sincebothcapsand swaptionshadadequate liquidity inexternalpricequotes,most firms would be using some form of interpolation model to value andcomputeriskstatisticsfortheircapsjustusingmarketcapprices,andaseparateinterpolationmodeltovalueandcomputeriskstatisticsfortheirswaptionsjustusingmarketswaptionprices.Therewouldhavebeennointeractionbetweenthetwomodels.(Somepossibleexceptionswhereliquidpricesinonemarketwouldbe allowed to override liquid prices in another market will be examined inSection8.3.)Theremayhavebeenadifferentstoryformodelsusedinmanagingthefirm's
overall riskon illiquidproducts.Someproducts, suchasBermudanswaptions,knock-out caps, and forward-start interest rate options (see Section 12.5.2 fordetails),mayhavebeenpricedusingmodels that incorporatedbothmarketcapprices and market swaption prices as inputs. Would the breakdown in the
historical relationship have caused problems for these models? Using theapproachwediscussinSection8.4,thereshouldbeaverysignificantdegreeofconservatism relative to historical relationships built into the reserves keptagainstmodelriskand,inanycase,therelationshipthatisimportantiswhatwillhappenover the livesof thedeals.Coulda temporaryperiodofbreakdown inhistorical relationships be enough to call into question the adequacy of thesereserves?WediscussthisfurtherinSection8.4.But models being used by the trading desk to determine trading strategies
involvingcaps and swaptionswoulddefinitelyhavebeen impacted.Here's thedescription by Morini (2011): “No matter whether or not the long termequilibriumwasgoingtocomeback,themarkethadgonetoofarfromitfortoolong for a bankor a fundwith a riskmanagementunit to stand it.”Here it isclearlythecasethattheprevailingmarketmodelapproachmustgovern.
8.2.6.5CapturingRisksThatAreDifficulttoIdentifyI once heard a senior risk manager for an investment bank say, “I don't stayawake at night worrying about the risks I know, but about the risks I don'tknow.”This is a sentimentwithwhich I could readily identify. In performingmodelvalidation, thegreat fear is that therewill be someexposure that isnotbeingcapturedby themodeland thatyou,as the independentmodel reviewer,don't even know about. For example, there might be some potential piece oflegislationor judicialdecision thatwouldhaveabig impactof the transactionbeingmodeled,butithasneverbeendiscussedintheliteratureyouhaveaccessto.Thistypeofpotentialexposureisprobablyknowntothefront-officepersonnel
who specialize in the product. Ideally, they should consider it in their internalmodelreviewandsharetheirconcernswiththeindependentmodelreviewer.Buttheusualmoralhazardconcernscomeintoplay,withtheincentivesdiscussedinSection 2.1, motivating front-office personnel to be reluctant to shareinformationthatmightleadtotightenedcontrols.JPMorgan in the late 1990s instituted an internal system called Risk
IdentificationforLargeExposures(RIFLE)totrytoaddressthisissue.Itisstillin operation, as can be seen from the following quote from JPMorgan's 2010annualreport:IndividualswhomanageriskpositionsintheInvestmentBankareresponsibleforidentifyingpotentiallossesthatcouldresultfromspecific,unusualevents,
suchasapotentialchange in tax legislation,oraparticularcombinationofunusual market events. This information is aggregated centrally for theInvestment Bank. Trading businesses are responsible for RIFLEs, therebypermittingtheFirmtomonitor furtherearningsvulnerabilitynotadequatelycoveredbystandardriskmeasures.(p.145)But even with a mechanism like this in place, the incentive issue remains.
Traderswhodoanhonest jobof reporting these risksmay thereby lower theirreturnonriskmeasuresandattractaddedscrutinyofpositionsizes.Toattempttoovercomethis,afirmneedstomakecleardistinctionsinperformanceevaluationbetween losses thatoccurreddue toanevent that the tradershadmadecertainreceivedadequatefirmwideattentioninadvanceofthetradebeingapprovedandlossesthatoccurredduetoaneventwherethis typeofadvancenoticewasnotprovided.
8.2.7ContinuousReviewFRB (2011, Section V) calls for “validation activities [that] continue on anongoingbasisafteramodelgoesintouse.”Threemajorcomponentsofongoingvalidationactivitiesare(1)dailyP&Lreconciliationformodelsbeingusedforvaluationandrisk-reportingpurposes,(2)back-testingforstatisticalforecastingmodels,and(3)analysisofoverridesforcaseswheremodeloutputneedstobealteredbasedontheexpertjudgmentofmodelusers.Weconsidereachinturn.
8.2.7.1DailyP&LReconciliationInSections3.1.1and3.1.2westressedtheimportanceofadailyexplanationofP&Lproducedby independent support staff as a controlmeasure against bothfraudandnondeliberateincorrectinformation.Here,wewanttostressitsequalimportanceasatoolforidentifyingmodelweaknesses.ThebasicapproachofP&Lreconciliationistotakepositionreportsfromthe
closeofbusiness(COB)ofthepriordayandcombinethemwithactualmarketmovements fromthepreviousday'sCOBto thecurrentday'sCOBtoestimateP&L for the day. The idea is that since position reports show sensitivities tochanges in market variables (e.g., option “greeks”), multiplication of thesesensitivities by actual price changes should produce a reasonable estimate ofP&L.Ofcourse,thisappliesonlytothosepositionsthatwereinplaceasoftheCOBof the previous day, so it is first necessary to identify and segregate theP&Ldue to tradesbookedduring theday (this includeshedges thatmayhave

beenputonduring theday in response tomarketmoves).This segregationofP&LbetweenthatduetopreviousCOBpositionsandthatduetotradesbookedduring the day is already valuable as a tool in avoiding inadvertent Ponzischemes inwhich profits on newly booked trades cover up hedge slippage onexistingtrades(comparewiththediscussioninSection2.2).If theinitialestimateofP&LissignificantlydifferentthanactualP&L,what
can be the possible causes? Incorrectly recorded positions are certainly apossibility;thisiswhyP&Lreconciliationisavaluabletoolinuncoveringfraudand incorrect information. It's true that an incorrectly reported positionmightimpactboththeCOBpositionreportandthedailyP&Lrecord,butatsomepointthere will be an actual payment on the position, and at this point, when thepaymentbecomespartofthedailyP&L,adiscrepancybetweenprojectedP&LandactualP&Lwillshowup.Another possibility is that the COB position has not been reported with
sufficientdetail.Forexample,anoptionpositionmightbereportedusingjustthefirst-ordergreeks,suchasdeltaandvega,andnotthesecond-ordergreeks,suchasDdelVandtheprice-volmatrix(seeSection11.4foradetaileddiscussionofoptionsensitivitymeasuresandhowtheycanbeusedinP&Lreconciliation).Inthis case, the P&L reconciliationwill identify the need formore detail in thepositionreport,whichwillenhancemanagement'sabilitytoaccuratelymeasureexposure.Athirdpossibilityisadeficiencyinthemodel.Forexample,itcouldbethat
eventhoughthecontractdetailsofapositionarecorrectlyentered,themodelisnotusingthesedetailscorrectlyincomputingP&Lorincomputingtheposition.Again,wemightworrythatthemodelflawwillimpactbothP&Landpositionreportingandsowillnotbespottedinreconciliation.Butwhenapaymentdateis reached and actual payment becomes part of the daily P&L, a discrepancyshouldappear.Morelikely,themodelismissingormishandlingsomekeyfactorof risk, and a position that appears hedged is actually suffering some hedgeslippage.AnexamplemightbeaBermudanswaptionmodelthatfailstoidentifysome circumstances in which early exercise becomes more profitable for thecounterparty. So daily P&L reconciliation should form an important part ofidentifying model problems that may have been missed in initial modelvalidation.
8.2.7.2Back-Testing

Anystatisticalforecastingmodelneedstohavecontinuousmonitoringofactualperformance. The best-known example in risk management is back-testing ofVaRmodels, discussed in detail in Section 7.1.2. Since VaRmodels producestatistical distributions of the size of losses that can be expected to occur atdifferent percentiles (e.g., 1 percent of the time, 2 percent of the time), theseprojecteddistributionsneed tobecontinuouslycompared to actual experience.Statisticalanalysisshouldbeappliedtoresults,andwhenthisanalysisindicatesa strong probability that the actual distribution differs from the projecteddistribution, corrections to themodel need to be considered.Until correctionscanbemade,anextralayerofconservatismmaybenecessaryinutilizinglimitsandreportsbasedontheexistingmodel.Similarback-testingiscalledforinanystatisticalmodelbeingusedtosuggest
a trading strategy. In hedge funds and on trading desks, one frequently findstrading strategies employed based on statistical studies of how the strategywould have performed historically (see Fabozzi, Focardi, and Kolm 2010,Chapter 7). Continuous back-testing is needed to update evaluation of themodel's performance and identify changes inmarket environment that requirealterationorevenabandonmentofthemodel.
8.2.7.3AnalysisofOverridesWhenhedgefundsandtradingdesksemploystatisticalmodelsfortrading,therewill occasionally be the need for a trader to override the trading strategyrecommendedbythemodelbecauseofeconomicinsightsthatcausethetradertodoubt the advisability of themodel's recommendation. It is important that allsuch overrides be recorded and analyzed, with performance of the modelstrategynotpursuedcomparedtosuccessoftheoverride,tospotpossibleneedsformodelmodification.It is less common for models used for valuation and risk reporting to be
overridden, but there are examples. One typical case is the representation ofbinaryoptionsinoptiongreeks.WhentradingdesksdonotusetheliquidproxyrepresentationofbinaryoptionsbyacallspreadrecommendedinSection12.1.4,itoftenhappensthatthetradingdeskmustcometotheriskmanagersandaskforanoverrideonthelargedeltaandgammapositionsproducedbyabinaryoptionnearing expiry at a price close to the strike.Riskmanagerswill bewilling togranttheserequests,sincethetradingactionthatwouldberequiredtogetbackwithin the limit would be a foolish position to take, as discussed in Section

12.1.4.Butanysuchoverridesshouldberecordedandanalyzed.It is justsuchanalysis thathaspersuaded some firms tomove to theuseof the liquidproxyrepresentation, since amodel that is producing position reports thatwould befoolishtoactonisclearlyflawed.
8.2.8PeriodicReviewOnceamodelhasbeenapprovedandisinproduction,ongoingvalidationisstillrequired. FRB (2011, Section V) reiterates what has been a long-standingregulatoryrequirement thatexistingmodelsshouldbereviewedat leastonceayear, but also calls for continuous monitoring of model performance. We'llexamine periodic review in this section and ongoing monitoring in the nextsection.To be productive, the periodic (generally, annual) reviewof existingmodels
mustbecarefullydesigned.Merelyreplicatingprevioustestsislikelytobebothunlikelytoproducenewinsightsandwastefulofresources.Reviewsneedtobefocused on changes to the environment inwhich themodel is being used thatshould trigger new testing and possibly new conclusions.We'll focus on fourtypes of environment changes that should be investigated: (1) changes in thepopulation of transactions the model is being applied to, (2) changes in themarket environment, (3) changes in the academic literature or in marketpractices,and(4)changesintechnology.Inaddition,theperiodicreviewshouldexamine any patterns that have been revealed by the ongoing monitoring wedescribeinthenextsection.
8.2.8.1ChangesinthePopulationofTransactionsConsider the Kidder Peabody disaster, discussed in Section 4.1.2, as anillustration. Whatever your opinion about whether Joe Jett was deliberatelygaming the system, there is no doubt that the firmwas ill-served by having amodel that computed the value of forward transactions without properdiscounting. But Kidder Peabodywas hardly alone in the industry in using amodel that omitted discounting of forwards. This is not due to a widespreadignoranceof this fundamental principle of finance.What doesoftenhappen—andthisisapatternIhaveseenoverandoveragain—isthatasensibledecisionismadeat the timeamodel isbuiltbut isnotsubjected toadequate reviewascircumstanceschange.So a model might be set up for valuing forwards that at the time of

implementationisbeingusedtoevaluatetradesthatareofmoderatesizeandnomore than a few days forward. The added accuracy that comes from correctforwarddiscountingmightbequitesmallandthuseasilyjustifyadecisionnottodevotetheaddedprogrammingtimeandcomputationalresourcestoincludethisfactor.Thesituationchangesas larger transactionswithlongerforwardperiodsareadded.Asthesituationchangesthroughtime,therecomesapointatwhichthe proper decision would be to change to a more accurate model. But thedecision to invest the resources needed to improve accuracy canbe a difficultone,involvingconsiderableexpense,diversionofresourcesfromimportantnewventures,andperhapsa limitationon tradingvolumeuntil thechange ismade.The environment may be changing gradually, so that no single point in timestandsoutasthetimeatwhichtoswitch.This is the kind of situation in which a periodic review of the impact of
changes in the population of transactions being valued by amodel can be oftremendousvalue.Note that the change inpopulationof transactions couldbeduetochangesinnumberoftransactions(anapproximationthathadlittleimpactwhenthemodelwasbeingusedtovaluejustafewdealscausesmoreconcernwhenthemodelisbeingusedtovaluemanydeals);sizeoftransactions(maybethemodelisbeingusedtovaluejustafewdeals,buttheaveragesizeofdealshasgrown to thepoint thatapproximationshavebecomeworrisome); termsoftransactions(forexample,thelargeincreaseinthelengthoftheforwardperiodinthecasediscussedpreviously,oranincreaseintimetomaturity,orthemorefrequent use of features that are difficult to evaluate); or a combination of allthree.Morini (2011, Section 1.4.1) explains the reasoning behind this policy very
well:Abank cannot expend big resources for a small exposure; and additionallybanksandtraderslearnbytrialanderror,anewmodelneedstobetestedforawhiletoreallyknowitsrisks.Whentheexposurestartsgrowing,apreviousmodel validation must not automatically be considered valid: a surplus ofeffort can be spent on themodel used, an effort that was not economicallymeaningfulinthepastbutiscrucialinthefaceoftheincreasedexposure.When faced with a large change in deal population, an independent model
reviewgroupmustthinkverycarefullyaboutwhatisbehindthechange.Isitjusta newmarket taking off tomeet a customer need, or is it a structuring grouplooking to arbitrageadeficiency in thewaya transaction isbeingvaluedor ariskisbeingmeasured?Iftradersandstructurersarehiredbecauseoftheirskills
inuncoveringcomplexarbitrageopportunities inmarkets,oneshouldn'tbe tooshocked if they sometimes use the same skill set to try to find arbitrageopportunities in regulations, whether external (government) regulations orinternal (riskmanagement) regulations.When independent reviewers see signsthat such an opportunity is possibly being exploited, they must expend extraeffortontryingtouncoverthemotivationandpossibleconsequences.If a reviewer does spot a loophole being exploited, there should be no
hesitancy inquickly improving thevaluationprocedureor riskmeasure.Therewill inevitably be cries of foul play from structurers who can no longer takeadvantage of the old system and complaints that “The rules of the gamehavebeen changedwithoutwarning.”Those complaining need to be reminded thatriskmanagement isnotagamebutaseriousendeavor toprotect shareholders,depositors,andtaxpayers.Keepingafixedsetofrulesandallowingstructurerstoexperimentandseewhere theweaknessesare isa recipefordisaster,as therating agencies amplydemonstratedbypublishing fixedmodels for evaluatingtheriskofCDOtranchesandlettingbankstructurersplaywiththemodelsuntilthey had designed trades that optimized the degree to which the modelsunderreporteddealrisk(seeSection5.2.3forfurtherdiscussionofthisexample).
8.2.8.2ChangesintheMarketEnvironmentAn example of a change in market environment would be a risk factor thatpreviouslycouldnotbepricedbasedonmarketobservationbutnowhasliquidprices available. This could change previous conclusions about which modelinputsneedtobederivedfrommarketprices.Intheotherdirection,deteriorationin the liquidityof apricing sourcemightprompt theneed fornew reservesorlimits.Anotherexamplewouldbechangesinlevelsofprevailingmarketpricesthat
mightpromptrerunsofsensitivityanalysesandmodelstress tests.FRB(2011,Section V) states, “Sensitivity analysis and other checks for robustness andstabilityshouldlikewiseberepeatedperiodically....Ifmodelsonlyworkwellfor certain ranges of input values, market conditions, or other factors, theyshould be monitored to identify situations where these constraints areapproachedorexceeded.”Another instanceofchangeinmarketenvironmentwouldberapidgrowthin
the size of a market. This should prompt reexamination of the relevance ofhistorical data, since rapid growthmay be the result of major changes in the
nature of the market. A recent example was the explosive growth in U.S.subprime mortgages. The use of historical data on default rates for subprimemortgages should have then been treated with extreme caution. As it soonbecameclear,underwritingstandardsforapprovingthesemortgageshadbecomedrasticallymore lax than in previous eras,which contributed to steeply risingdefaultrates(seeSection5.2.1).Apriorexamplewastheprecipitousgrowthinnon-investment-gradebondsinthelate1970sandearly1980s.ThisgrowthwaslargelyduetotheeffortsofMichaelMilkenatDrexelBurnhamLambert,andamajorcontributorwasstudiesbyMilkenandothersshowingtheveryfavorablehistoricalreturnsofthesebondsafteradjustingfordefaultlosses.Butassoonastherewas a large increase in the issuance of these bonds, it should have beensuspected(asturnedouttobethecase)thatthegrowthwaslargelybeingfueledbytypesoftransactionsthathadrarelybeendonepreviouslyandforwhichthehistoricaldatawasofdubiousrelevance.Bruck(1988)isagoodaccountoftheMilkenstory;seeparticularlypage28–29onhistoricalreturnstudies,andpages266–270onskepticismabouttheircontinuedrelevance.
8.2.8.3ChangesintheAcademicLiteratureorinMarketPracticesPeriodic reviews offer a good opportunity to consider any new approaches tomodeling a particular type of transaction that have appeared in the academicliterature,havebeendiscussedatconferences,orhavebeguntobeusedbyothermarketparticipants.ThisiswheretheemphasisinRebonato(2003)on“marketintelligenceandcontactswiththetradercommunityatotherinstitutions”andthereverse engineering of observed prices from other firms can be of particularvalue.
8.2.8.4ChangesinTechnologyIncreasedcomputationalcapacitymaychangetheconditionsonwhichpreviousdecisions about approximation techniques have been made. Increasedcomputationalcapacitycouldbeduetonewlypurchasedorupgradedhardwareor to advances in computational theory. New conditions should lead to areassessment of prior decisions—replacing existing approximation techniqueseitherwithmoreaccurateonesorwithfullcomputations.

8.3LIQUIDINSTRUMENTSModels for liquid instruments are robust and easy to test, since they canconstantlybecheckedagainstactualliquidmarketquotes.ThisiswhytheylendthemselvessoreadilytotheinterpolationapproachtomodelvalidationoutlinedinSection8.2.6.1.Riskreportsonlyneedtolookatexposures,suchasdeltaandvega,measuredagainstcurrentmarketprices.Ifchangesinpricelevelsleadtonewexposurelevelsthatconcernseniormanagers,theliquidityoftheinstrumentwill allow for reduction in positions at the time the exposure exceeds desiredlevels.Weillustratewithanexampleofamodelreviewforaveryliquidinstrument.
Consider a portfolio ofU.S. dollar interest rate instruments (e.g., interest ratefutures,forwardrateagreements,interestrateswaps,governmentbonds)withnooptioncomponent(seeChapter10foradetaileddiscussionofhowtheriskonsuch a portfolio is managed). There will be liquid market quotes availablethroughoutthedayfortradesonalargesubsectionofthesepositions.Butmanyinstrumentswillneed some formofmodeling forvaluation, sinceevenaveryliquid (“on-the-run”) instrument at the time of original transaction may soonbecomelessliquid(“off-the-run”)throughthepassageoftime(e.g.,afive-yearswap,forwhichdirectmarketquotesarereadilyavailable,soonbecomesafour-year11-monthswap,whose liquidationpriceneeds tobe inferredfrommarketquotes for on-the-run instruments). The models used for this off-the-runvaluationwillalsobeneededforcomputingthechangeoftheportfolio'svalueinVaRandstresstestsimulations.Themodelsneeded for thesecomputationsarequite standard throughout the
financial industry by now, but there are still choices in interpolationmethodology that need to be made that constitute forecasts of relativemovements between instruments (Section 10.2.1 provides details). Thesemodeling choices are best made by the front-office personnel who have theproduct expertise and superiordata access. In addition, it is the frontoffice towhom the profits from correct forecasting decisions (and losses from poorforecastingdecisions)properlybelong.Model validation by outside reviewers only requires periodic checking of
model valuations against actual market prices. Close agreement shows modeladequacy; significant differences indicate the need to establish limits and/orvaluationreservesandmayserveasclues formodel revision.Themost robustprice checks come when there is an actual transaction in an off-the-run

instrument,butpricecheckscanalsobeperformedbypollingbrokers,dealers,and other independent sources of pricing information (issues involved inobtainingsuchquotesareaddressed inSection6.1.3).Whileactualconductofthepricechecksmaybeperformedbysupportstaff,modelreviewersandothersenior control personnel should be involved in the design of the price checkprocedures,with regard to frequency and standards for confirmation ofmodeladequacy.The typeofpricecheck justdiscussedshouldbecomplementedby thedaily
P&Lexplanationexercisesdiscussed inSection8.2.7.1.Asobservedthere, theP&L explanation process often identifies model deficiencies when there areunexplained P&L changes, particularly around transaction dates and dates forscheduled payments and resets. But even a thorough daily P&L explanationprocessshouldnotberegardedasafullsubstituteforpricechecking;itmaybethat a model performs very well in handling on-the-run transactions frominception through maturity and is rarely tested on off-the-run transactionsbecausethetradingdeskalmostalwaystransactsonon-the-rundates.Butwhathappensifthedeskgoesthroughastop-losslimitorifthefirm'sappetiteforriskdecreases? A reduction in positions may need to take place by reversingpreviously booked transactions that are now off-the-run. Risk managers willwanttohavepreparedforthiseventualitybytestingmodelpricingofoff-the-runpositions.If the disagreement between an observed market price and a model value
representsacleardifferencebetweenwhereariskcanbesoldatthecurrenttimeanda theoryas to thevalueof theassetovera longerperiodof time, thennomatterhowsoundthereasoningbehindthetheory,Iwouldrecommendholdingtothemark-to-marketprinciple.Ifafirmdeviatesfromthisprincipleandvaluesbasedonlonger-termvaluesthatitbelievescanberealized,ratherthanonpricesatwhich risks can currentlybe exited, it is turning short-term risks intomuchharder-to-evaluate long-term risks. Morini (2011, Section 1.2.1) supports thisview colorfully: “on intuitive grounds, anyone who claims that arbitrageopportunities are abundant in the market should always be asked if he isfabulouslyrich.Ifheisnot,itisnotclearwhyheknowsofsomanyfreelunchesand yet, rather than exploiting them, goes around passing preposterousjudgmentsaboutmarketfunctioning.”However, sometimes thedifferencebetween anobservedmarket price and a
model value represents two different ways inwhich a risk can be sold at thecurrent time.Although thiswouldseemtoviolateseveral importantaxiomsof
financetheory—theno-arbitrageprincipleand the lawofoneprice—thesearejustmodels and cannot expect any absolute deference in the faceof empiricalexceptions.However,thereneedstobecarefulevaluationofwhatliesbehindanobserved difference between a market price and a model price before anintelligentdecisioncanbemadeastowhichisthebestoftwodifferentwaystorepresenttherisk.Let'sfocusonaconcreteillustration.Youhaveobservablemarketpricesfora
Europeancalloption,aEuropeanputoption,andaforwardtothesameexpirydate,withthesameunderlyingand,inthecaseoftheputandthecall,thesamestrike price. The combined prices, however, do not agreewith put-call parity.Thiswouldimply,forexample,thatapositionintheputthatyouhavesoldcanbeoffsetintwodifferentways—youcouldbuyaput,oryoucouldsyntheticallycreateaputbybuyingacallandenteringintoaforward.Italsoimpliesthatthecall-forward combination will offset the position at a cheaper price than thedirectpurchaseoftheput.What should a risk manager recommend in such circumstances? Since the
mainargumentbehindano-arbitrageprinciplesuchasaput-callparityisthatthelackofparitywillbequicklyeliminatedbyprofit-seekerstakingadvantageofariskless opportunity to make money, any persistence of parity violation issuggestiveof some liquiditydifficultiespreventing theopportunity frombeingexploited.We'llconsidersomepossibilities:
Thisisanarbitrageofwhichveryfewmarketparticipantscantakeadvantage,butyourfirmisonethatcan.Thiscouldbebecausethemarketfortheputisinsomewayrestrictedtoonlyafewfirms.Itcouldbeanarbitragethatisdifficulttoidentifycomputationallyandyourfirmhasacomputationaladvantage.Itcouldbeadiversifiedbasketofassetsthatisdifficulttoaccumulateandyourfirmhasanadvantageinitsmarketaccess(seethediscussioninSection12.4.1.1).Insuchcases,itisrighttobasevaluationonthemodel-derivedprice(inthisinstance,thecall-forwardcombination),sincethisrepresentsaliquidexternalpriceatwhichriskcanactuallybeextinguishedintheshortterm.Oneofthepricesislessliquidthantheothers.Forexample,theamountoftradingforthatstrikeanddatecouldbemuchmoreactiveincallsthaninputs.Thiswouldbeastrongindicationofthedesirabilityofusingamodel(put-callparity)tosupplyapricebasedonmoreliquidquotationsratherthanutilizingalessliquidprice.Thesamereasoningwouldapplyifthecallandputmarketsaresignificantlymoreactivethantheforwardmarket,in

whichcaseIwouldrecommendreplacinganilliquidforwardpricewithaput-callparity–derivedpricebasedonliquidputandcallprices.Atimingdifferenceexistsinpricequotations.Perhapstheoptionsmarketpostsclosingpricesatanearliertimeofdaythantheforwardsmarket.Itiscertainlylegitimatetouseamodeltoupdatebothcallandputquotestoadjustforchangesintheforwardsincethetimetheoptionsmarketclosed.Somecontractfeaturesmakethemodelnotcompletelyapplicable.Sometimes,oncloserexamination,contractprovisionscallintoquestiontheapplicabilityofamodel.Inthiscase,itmightbeanallowanceforearlyoptionexerciseincertaincircumstances,whereasput-callparityappliesonlytooptionswithoutearlyexerciseprovisions.
This last type of case has led to a considerable number of disputes betweenriskmanagersandtradingdesks.Oneexamplethathasarisenatseveralfirmsistraders' desire to unlock stock option values contained in convertible bonds.Option models applied to convertible bond prices frequently indicate impliedvolatilitiesthatarequitelowcomparedwiththeimpliedvolatilitiesthatcanbederivedfromplainequityoptionsonthesamestock,leadingtraderstoconcludethatbuyingtheconvertibleisagoodvaluetrade.Tradingdeskshungrytobookimmediateprofitshavepressedforoverridingreasonablyliquidconvertiblepricequoteswithamodel-drivenquotebasedontheimpliedvolatilityfromtheequityoptionsmarket.Butaconvertiblebondcontainstheoptiontoexchangeabondobligation for a stock obligation rather than to exchange cash for a stockobligation,so itcannotbecompletelyreducedto thevalueofanequityoption(seethediscussioninSection12.4.4).Whenturneddownontheirfirstattempt,sometradingdeskshaveshowngoodenterpriseinmarketingtotalreturnswapsonthebondportionoftheconvertibleinanattempttoisolatetheequityoptionportion. So long as the swap has been properly engineered to cover allcontingencies,suchascancelingtheswapwithoutpenalty in theevent that thebondisconvertedforequity,acompletedecompositioncanbeachievedanditislegitimate to value the resulting position as an equity option. Risk managershave,however,beenverycareful tocheckthatnouncoveredcontingenciesarepresentbeforeallowingthisvaluationchange.
8.4ILLIQUIDINSTRUMENTS
8.4.1ChoiceofModelValidationApproach

Model use for illiquid instruments is much more critical than it is for liquidinstrumentsand,unfortunately,modelvalidationisalsomuchmorechallenging.Theremaybeacompleteabsenceofactualmarketpricesatwhichpositionscanbe unwound, so modeling assumptions and inputs for unverifiable modelparametersnowbecomeakeydriverofmodelvaluation.BothDerman (2001) and Rebonato (2003) have strong statements as to the
difficultytheseriskscanentail.Derman:“Becauseoftheirilliquidity,manyofthesepositions[inlong-termorexoticover-the-counterderivativesecuritiesthathavebeendesignedtosatisfytheriskpreferencesoftheircustomers]willbeheldforyears.Despitetheirlong-termnature,theirdailyvaluesaffecttheshort-termprofitandlossofthebanksthattradethem.”Rebonato:“Whatdifferentiatestradinginopaqueinstrumentsfromothertradingactivitiesisthepossibilitythatthebankmightaccumulatealargevolumeofaggressively-markedopaqueinstruments.When,eventually,thetruemarketpricesarediscovered,thebook-valuere-adjustmentissudden,andcanbeverylarge.Stop-losslimitsareineffectivetodealwiththissituation,sincethegatescanonlybeshutoncethehorsehaswellandtrulybolted.”
Let'sconsiderwhichofthemodelvalidationmethodologiesofSection8.2.6—cost of hedging or prevailing market model—is more appropriate for illiquidinstruments. My own view is that the cost of hedging approach is the morerelevantforindependentmodelreviewersfortworeasons:
1.Evenifagivenmodelprevailsinthemarketplace,solongasthetradingdeskcan'tactuallyextinguishpositionsat theprices impliedby themodel,owing to illiquidity, it isactually thehedgingcosts thatwilldetermine thefirm's P&L on the product. The model might continue to prevail in themarketplace formanyyears,andall thewhile the firm losesmoneyon itshedging strategy. An advocate of the prevailing market model approachmightrespondthatif,infact,themodelleadstohedginglosses,thenfirmswill eventually replace themodel, so this is just a caseof anticipating thedirection in which the prevailing market model may evolve, in line withRebonato'sproposedcriteria.ButthenIwouldstillwanttoutilizethecostofhedging approach as a key tool in anticipating prevailing market modelevolution.2.Iamwaryoftheabilityofriskmanagerstoanticipateprevailingmarket

model evolution using any other tool besides cost of hedging simulation.SomeofthetoolsRebonatorecommends—marketintelligenceandcontactswith the trader community at other institutions—seem much easier fortraderstoutilizethanindependentreviewers.Ifindependentreviewersdorelyonthecostofhedgingapproach,itwouldstill
bevaluableforthefront-officereviewerstoutilizetheprevailingmarketmodelapproachasasupplement.Thisisparticularlytruewhenmark-to-marketpoliciesrequiremarkingtotheprevailingmarketmodel,sothatevenifaninstrumentisbeingpricedandhedgedinawaythatwillvirtuallyguaranteelong-termprofit,accountinglossesmayneedtobebookedin theshorter term.Rebonato(2003)makesthisclearinSection2.1,sayingthat“modelriskarises. . .becauseofadiscrepancy between themodel value and the value thatmust be recorded foraccountingpurposes.”Thiswouldnotbethecaseforthemark-to-marketpolicyIadvocateinSection8.4.4.In a thorough review of cost of hedging, Monte Carlo simulation allows
systematicconsiderationofmanypossiblefuturepathsofrelevantliquidmarketpricesandothereconomicvariables.Thesoundnessofthemodelcanbejudgedonlyoverlongertimeperiods,whenlonger-termunobservablepricestransforminto shorter-term observable prices,when there is enough time to observe theimpact of required rehedges, or when trades reach maturity and requirecontractualpayments.Overa short timeperiod, almost anymodelchosenwillappear to perform well by a type of circular reasoning: The instrument withunobservable prices will be valued using the model and the observable priceinputs. Therefore, the movement of the unobservable prices relative to theobservable prices will seem stable since the same model is being used forvaluation throughout the time period (see the example of this discussed inSection10.2.1).Proper design of a model review of an illiquid instrument utilizing Monte
Carlo simulation has two parts: (1) choice of the liquid proxy, which will beanalyzedinSection8.4.2,and(2)designofthesimulation,discussedinSection8.4.3.Iwillthenlookatissuesthisapproachraisesformark-to-marketpoliciesin8.4.4andforriskmeasurementin8.4.5.Another application of this approach to creation of liquid proxies and
simulations of hedge slippage involves investments in hedge funds for whichyoulackdataoncurrentholdingsofthehedgefunds.Tryingtodrawconclusionsfrom the historical pattern of the returns for the hedge fund and historicalcorrelationofthesereturnswithotherpositionsisdubious,giventhepossibility
that current holdings of the hedge fundmay not resemble historical holdings.The case for treating these investments as illiquid rests both on limitations onhedge fundwithdrawalsandon lackof informationon trueexposure.A liquidproxycanbebuiltbymakingreasonableinferencesaboutthecurrentstyleofthehedge fund, based on whatever public and private information you haveavailable from the fund. Ineichen (2003) is an excellent starting point forexplanations of the differing hedge fund styles (Chapter 5) and detailedexaminationofeachstyleinrelationtoindexesofliquidinvestments(Chapters6through8).AstatisticalapproachtocreatingliquidproxiesforeachhedgefundstylecanbegleanedfromHasanhodzicandLo(2007).TheliquidproxycanbeusedforrepresentinghedgefundinvestmentsinVaRandstresstestcalculations.Statisticalanalysiscanthenbeperformedondeviationsbetweentheliquidproxyandhistoricalreturnsonhedgefunds.
8.4.2ChoiceofLiquidProxyAchoiceof liquidproxyisequivalent toachoiceofwhat liquidmarketpricesare utilized inmodeling the illiquid instrument.Everymodel choice implies aliquidproxy,andeveryliquidproxychoiceimpliesamodel.In evaluatingwhether a liquidproxy choice is correct, it is necessary to ask
whethertheimpliedmodelmakesadequateuseofavailableliquidmarketprices.This iscloselyrelated tooneof thekeyquestions inDerman(2001):“Has themodel been appropriately calibrated to the observed behavior, parameters andprices of the simpler, liquid constituents that comprise the derivative?” Thispoint can bemost clearlymade using a concrete example,which is discussedmorefullyinSection12.4.2.Consider an optionwritten on a basket consisting of two stocks.You could
choosetwodifferentwaystomodelthis:(1)haveacompletemodelofthepriceevolution of each of the two stocks individually and assume a correlationbetweenthem,or(2)directlymodelthepriceevolutionofthebasket.We'llcallthesethecorrelationmodelandthedirectmodel,respectively.Assumethatthereareliquidmarketpricesforoptionsontheindividualstocksbutnoliquidmarketpricesforoptionsonthebasketoronthecorrelation,whichisafairlystandardsituation.It canbe argued that eithermodel is a reasonable choice. In either caseyou
will need input for a variable that cannot be observed in themarket. In bothcases,youhaveincludedallthesourcesofriskinyourmodel.

But,aswillbeshowninourmoredetaileddiscussioninSection12.4.2,wherecorrelation is not expected to be too negative, the first model offers definiteadvantagesintermsofmakingbetteruseofliquidmarketprices.Optionsontheindividualstockswillserveaseffectivepartialhedgesforthebasketoption,soutilizing the firstmodel,which can be calibrated to currentmarket quotes fortheseoptions,offersthefollowingadvantagesoverthesecondmodel:
Thecorrelationmodelimpliesaliquidproxythatrepresentsthebaskettradeintheexposurereportsforoptionspositionsonthetwoindividualstocks.Thisencouragestheuseofliquidhedges.Thecorrelationmodelwillrequirevaluationchangesinthebasketwhentherearechangesintheimpliedvolatilityofthetwoindividualstockoptions.Thedirectmodeldoesnotrequiresuchvaluationchangesandsocanresultinstalevaluationsnotfullyreflectingthecostofunwindingsomeoftheriskinthetrade.Thecorrelationmodelexhibitssignificantlylowerstatisticaluncertaintyofresultscomparedwiththedirectmodel.Thisshouldpermitlowerrequiredreservelevelsandlargerlimitsthancouldbeallowedifthedirectmodelwasused.
Notethattheseadvantagesofthecorrelationmodeloverthedirectmodelarebased on empirical, not theoretical, findings. As can be seen in the fullerdiscussion,ifcorrelationlevelsareexpectedtobeverynegativeoriftheproductwerestructureddifferently(forexample,anoptiononthedifferencebetweenthestockpricesratherthanonthebasket),theadvantagesofthefirstmodeloverthesecondwoulddiminishtothepointofindifferencebetweenthemodels.Insomecases,theliquidproxyusedcouldconsistofaninstrumentthatisnot
itselfliquid,butforwhichmodelingintermsofaliquidproxyandsimulationofthe remaining risk have already been incorporated into the firm's riskmanagement system.This is reminiscentof thequote fromDerman inSection8.2.6.2: “Derivative models work best when they use as their constituentsunderlying securities that areone level simplerandone levelmore liquid thanthe derivative itself.” For example, in Section 12.3.3, in examining a liquidproxyforbarrieroptionsbasedonPeterCarr'sapproach, Iadvocate theuseofilliquid binary options as part of the liquid proxy, noting that “techniqueswehave already developed for managing pin risk on binaries” in Section 12.1.4“cannoweasilybebroughtintoplay.”

8.4.3DesignofMonteCarloSimulationModelingthedifferencesbetweentheactualtradeanditsliquidproxymustgoallthewaytofinalpayoutortowhenthetradebecomesliquid.Modelingmustreflect the possibility that themodel used for pricing and trading the productmaybewrong.ModelingshouldbebyMonteCarlosimulationtoreflectafullrangeofpossibleoutcomesandtogenerateastatisticaldistributionthatcanbeused in assessing issues such as capital adequacy. Let us take these points inmoredetail:
Don'tassumethatanilliquidinstrumentwillbecomeliquid—itmayhappenbutitshouldn'tbeassumed.Anotherwayofsayingthis:Itisimportantthatstatisticalanalysisofthedistributionofparametersbebasedonactualmarketobservationsandnotonderivedvalues,sincethederivedvaluesoftenthemselvescontainmodelingassumptionssubjecttoerror.Forexample,ifagivenmarketiscurrentlyliquidonlyouttosevenyears,useonlyquotationsouttosevenyearsinyourhedgingsimulations;10-yearquotationsderivedbyextrapolationshouldnotbeused.ThisisanalogoustothepointmadeearlierinSection8.4.1aboutavoidingcircularreasoninginmodelvalidation.Statisticalassumptionsusedindeterminingdistributionsshouldnotbeconstrainedbyanyassumptionsmadewithinthevaluationmodel.Forexample,thevaluationmodelmayassumeanormaldistributionofafactorbecauseitiscomputationallysimpleandtheincreaseinaccuracyfromusingadifferentdistributioncanbeshownnottobeworththeaddedinvestment.Thiswouldnotinanywayjustifyassumingthatthecorrespondinginputvariableisnormallydistributedinamodel-testingsimulation,sincethecomputationaltrade-offsmotivatingthemodel-buildingdecisiondonotapplytothemodel-testingcalculation.Independentreviewersmustbecarefulnottorelyonstatisticalanalysispreparedbytraders.Itisnotoriouslyeasytoemploydata-miningtechniquestofindstatisticalproofsofnearlyanyrelationshipbyselectingtherighthistoricaldataset.Statisticalcontrols,suchascarefuldisciplineaboutsegregatinghistoricaldataintosampleperiodstofitparametersandout-of-sampleperiodstotestresults,areuseful,butcanstillbedefeatedbysufficientlyindustriousdatamining.Itisbettertohavetrulyindependentanalysis,evenattheriskofinaccuracy(onthesideofconservatism)fromlackofinsiderinformation.
UseofMonteCarlosimulationallowsforgenerationofafullstatisticaldistributionofresults,whichcanbeveryusefulforissuessuchasdeterminingcapitaladequacyonilliquidpositions.ThisisanecessityifthecapitaladequacyproposalofSection8.4.4istobefollowed.Itmustbeemphasizedthatanystatisticaldistributioninvolvingtailrisksrequiressubjectiveprobabilityjudgments(asdiscussedinSection1.3).Still,thebasicapproachofinsistingthatsimulationbeofhedgetradesinvolvingliquidinstruments,andthatsimulationgoallthewaytothepointatwhichtheoriginalpositionbecomesliquid,meansthattherewillbealotofhistoricalliquidpricingdatathatcanbeutilizedinformingtheseprobabilityjudgments.Inessence,whileilliquidinstrumentscannotbefullyevaluatedbasedoncurrentliquidprices,theycanbeevaluatedbasedonthefutureevolutionofliquidprices.Forillustrativeexamples,seeSections10.2.2,12.1.4,12.3.3,12.4.2,12.5.2,and13.4.3.UseofMonteCarlosimulationavoidstheoverstatementofriskthatcanresultfrommoreformulaicriskcalculations.Forexample,ifthedesireistoreservetoa90thpercentiledegreeofcertainty,using90thpercentilevaluesofthedistributionoftwoormoreinputparameterswilllikelyresultinafargreaterthan90thpercentiledegreeofcertaintyinthereserve.InaMonteCarlosimulation,manyrerunsofthevaluationmodelaremadebasedonsamplepointschosenrandomlyfromtheassumeddistributionofeachnonliquidvariable,andwithexplicitlyassumedcorrelationsbetweenvariables.The90thpercentileofmodeloutputscanthenbeestimated.
Dermanrecommendsafullsimulationthatincludesbothunderlyingbehaviorandtraderhedgingstrategy.Section11.3containsanexamplethatcomescloseto Derman's proposed full simulation: a Monte Carlo simulation of dynamichedging of a less liquid option (less liquid because of a nonstandard strike).Sampling over the simulation paths yields a statistical distribution of thedifferencesbetweenthepayoutontheoptionandthecostsofthehedge.Derman's recommendation of a full simulation including trader hedging
strategy represents an ideal that may sometimes be difficult to achieve inpractice.InthesimulationinSection11.3,afullsimulationispossiblebecausethe assumed trader strategy is very simple, just varying thedelta hedgeof theunderlying forward.Trader strategies that involvechanges inoptionspositionsaremuchmoredifficulttosimulate,becauseafullspecificationofthevolatilitysurface is requiredat eachnodeof the simulation.An illustrationof thispointcanbefoundinthediscussionofbarrieroptionsinSections12.3.2and12.3.3.

When a full simulation is not practical, then I still believe that a simulationshould be done, but computation can be simplified by restricting hedgingstrategies.Easierimplementationcomesatacostofgreaterconservatism,sincethe full range of possible trader hedging strategies will not be captured. ThesimulationsthatIrefertointhenext-to-lastbulletpointoftheprecedinglistcanserveashelpfulparadigms.
8.4.4ImplicationsforMarkingtoMarketChoosingagoodliquidproxy,followingtheguidelinesofSection8.4.2,shouldassure that illiquid positions aremarked tomarket to reflect changes in liquidmarketprices.Toillustratewiththeexampleusedinthatsection,whenthereisachangeintheimpliedvolatilityofoneofthetwostocksinthebasket,itwillbeimmediatelyreflectedinthemarkingtomarket(MTM)oftheliquidproxyandhenceintheMTMofthebasketoption,whichconsistsofthesumoftheMTMoftheliquidproxyandthereserveforthedifferencebetweenthebasketoptionandtheliquidproxy.But should there also be an adjustment to theMTMof the illiquid position
basedonnewinformationaboutparametersthatcannotbesourcedfromaliquidmarket?Continuingwith the sameexample, thequestionwouldbewhether tochange the MTM of the basket option based on new information aboutcorrelation between the two stocks. My answer would be that this should bedoneonlyveryrarely.Wehaveclassified thecorrelationparameterasone thathasnoliquidmarketpricingsource,sowherewouldfrequentupdatesbecomingfrom?Therearetwopossiblesources:
1.Analysisofhistoricalpricedatahas led to a change in estimatesof thecorrelation to be used. But this will only occur infrequently—if thecorrelationhasbeenestimatedfromalongdatahistory,thenitwillusuallytakemonthsofnewdatabeforeconclusionswillchangesignificantly.2.There isevidence that thepricebeingchargedcustomers forcorrelationhaschanged.Butsincethisisnotaliquidmarketatwhichriskcanbeexited,the argument formaking immediateuseof suchnewdata isnotnearly asstrongasitisforliquidinstruments.In both cases, new information on correlation might ultimately impact the
reserve for the difference between the basket option and the liquid proxy, andtherebyimpactthetotalMTMofthebasketoption.Butinbothcases,youwouldexpect to see this impact take place infrequently. In fact, I would argue for
designingreservecalculationsinawaythatwouldmakesuchchangesextremelyinfrequent.Forexample,inthiscase,calculatethereservebasedonanextremelyunlikely level of correlation as opposed to an extremely unlikely change incorrelation from the long-term average. That makes it less likely that newinformation about a shift in the long-term average will require a change inreservelevel.The reason Iwant tomake reserve changes infrequently is that I don't think
reservelevelchangesprovidegoodincentivestotradersandmarketers.ChangesinMTMof liquid instruments provide good incentives for exiting positions—either because stop-loss limits are being breached or because accumulatinglossescausetraderstorethinkthedesirabilityofpositions(thisincludeschangesinMTMofliquidproxies,whichcantriggerhedgingactionsinliquidmarkets).But changes in reserve levels won't provide much incentive to exit existingpositions,sincetheilliquidityoftheinstrumentmakessuchexitsverydifficult.It is true that raising reserve levelsmaysendasignal tomarketers tobemorereluctant to book new trades,whichmight argue for raising reserve levels onnewtradesbutnotonexistingones.Evenifyouareconvincedthispolicymakesgoodriskmanagementsense,you
stillmightbereluctanttohaveitguidetheMTMreportingofthefirm.Financialcontrollers, independent accounting firms, and regulators all tend to besuspicious of policies that involve high reserve levels that shield reportedearningsfromfluctuation;it lookslikeanattempttosmoothreportedearnings.Letmemakethefollowingpointsconcerningthis:
IbelievethatthepoliciesIamadvocatinghererepresentanaccuratepictureofwhatisknownaboutearnings.Thetrueearningsonilliquidpositionsareoftennotknownuntilthetradematures.Ahighlyconservativereservelevelisthereforejustified,anditisunreasonabletoexpectmuchnewinformationtoarrivefromoutsidesources;therealinformationwillcomeovertimeasthetradematures.Thereareexceptions—newinformationthatwouldchangeyouroutlookforthewholedistributionofanilliquidinput.Anexamplewouldbelong-termdefaultratesonhomemortgagesin2007whennewinformationondeterioratingunderwritingstandardswouldhaveimpactedreservelevelsthatwerepreviouslyviewedasprudentlyconservative.Reservingpoliciescanbedesignedtoassureindependenceandshieldingfrommanipulationthatattemptstousereservelevelstosmoothearnings.SeeSection6.1.4.
ThesepoliciescouldhelptodealwithsomeoftheconcernsbeingexpressedabouttheharmfulimpactMTMpoliciesarehavingonbankmanagement(seethereducingprocyclicalitydiscussioninSection5.5.8.1).MTMlossesforliquidinstrumentsencouragebankstoshedvolatileassets,butMTMlossesforilliquidinstruments,sincethebankscan'tshedtheassets,resultinaneedtoraisenewcapital,oftenineconomicenvironmentsthatarethemostchallengingforraisingcapital,leadingtoparalysisofthebankingsystem.(Thisisdiscussedingreaterdetail,inthecontextofthe2007–2008crisis,inSection5.3.2.)Myproposalcauseslargereservestobetakenupfront,whentheenvironmentisstillfavorableforraisingcapital,andthenreleasesthereserves,andhencefreescapitalfornewinvestments,astheexistinginvestmentsunwind.Iwoulddefinitelyadvocatestrongcontrolsontheuseofthisaccountingpolicy,onlypermittingitforpositionsthefirmdesignatesatthetimeofcreationasilliquid.Ihaveexperiencewithapolicyclosetotheonedescribedworkinginpracticeoveraseveral-yearperiod,from1996to2003,atChaseandJPMorganChase,withthefullknowledgeofriskmanagers,financialcontrollers,independentaccountants,andregulators.Reservelevelsestablishedweresufficientlyconservativethattheyalmostalwaysprovedadequateatanindividualproductlevel,andalwaysprovedmorethanadequateatanaggregatedfirmlevel.Inthecurrentenvironment,followingthedebacleof2007–2008,itmaynolongerbepossibletogetindependentaccountantsandregulatorstogoalongwithapolicylikethis;itrequiresmoretrustofthemotivationsoffirmriskmanagementthanmaynowbeachievable.Inthatcase,Ithinkriskmanagersshouldargueforkeepinganinternalsetofaccountsthatmostaccuratelyreflectstheeconomicsofabusiness,evenwherethisdivergesfromexternalreporting.
8.4.5ImplicationsforRiskReportingInSection8.3wenotedthatforliquidinstrumentsriskreportsonlyneedtolookatexposuresmeasuredagainstcurrentmarketprices,sincefutureexposuresdueto changes in price levels can always be reduced utilizing the liquidity of theinstrument. This approach will not work for illiquid instruments. To take anexample, discussed at greater length in Section 12.1.4, a binary optionmight

currentlyshowverylittlegammaexposurebutmighthaveanunacceptablylargegammainthefutureifpricesareclosetothestrikelevelwhenlittletimeisleftuntiloptionexpiry.Youcan'tjustwaittoseeifthiswillhappen,sinceifitdoesyoucan'tcountonbeingabletoextinguishtheriskbysellingthedigitaloption.Youneedtodealwiththiscontingencyatthetimeyouareconsideringcreatingtheoption.Onewayofhandlingthisistorunriskreportsatthetimeyouareconsidering
creatingthepositionthatlookatarangeoffuturepossiblepricelevelsforfuturedates.Acceptabilityofpossiblefutureriskexposuresareevaluatedaspartofthedecision-makingprocessfortakingontheposition.Another way of handling this is to make sure that the liquid proxy and
simulationmethodologyofSections8.4.2and8.4.3adequatelycontrolpossiblefutureexposures.Continuingwith thebinaryoptionexample,youwouldmakesure that the call spread liquid proxy chosen can only give rise to reasonablefuturegammas,bymakingsurethatthereisasufficientlywidegapbetweenthestrikesof the call spread.Asyouwill see inSection12.1.4,widening thegapbetween the strikeswill lead tomore uncertainty in the simulation and hencehigherreservelevelsandtighterlimits,butthisshouldbeviewedasanecessityforcontrollingfuturegammaexposure.
8.5TRADINGMODELSWhenamodelisbeingusedaspartofatradingdesk'sdecision-makingprocess,itclearlyrequiresinternalmodelreviewbythemodelcreatorsandusers.Forthemodelvalidationpartofthisprocess,itisparticularlyimportanttoreviewhowthemodelrelatestotheprevailingmodelbeingusedinthemarketandtotrytoanticipateevolutionoftheprevailingmarketmodel,asarguedinSection8.2.6.3.The question I want to examine here is whether suchmodels also require anexternal review by an independent group if the model is to be used only fortradingdecisionsandnot for the firm'sofficialvaluationsandmeasurementofrisk.Major trading losses are frequently ascribed to the firm having the wrong
model. What is often unclear in these claims is whether “having the wrongmodel” just means making incorrect forecasts about the future direction ofmarketpricesorifitmeansmisleadingthefirm'stradersandmanagersaboutthenatureofpositionsbeingtaken.Agoodillustrationis thediscussioninSection4.2.1 ofwhether the reliance by Long-TermCapitalManagement (LTCM) on

modelsshouldbeviewedasaprimarycauseofthecollapseofthefund.Any firmengaged inmakingmarketsor investing fundsmust takepositions
whose profit or loss will depend on the correctness of forecasts of moves inmarket prices. Different strategies will be tied to different price relationships.Somedependonoverallmarketdirection,whereasothersdependontherelativepriceofrelatedassets;somedependongettingalong-termtrendright,whereasothersdependoncorrectlyanticipatingshort-termmoves.However,traderswillalwaysneedtomakejudgmentsaboutanuncertainfuture,andfirmmanagersinturnwillalwaysneedtomakejudgmentsabouthowmuchofariskoflosstheywill allowa trader to take in exchange for a possible gain.Whenmaking thisassessment,management will be guided by evidence of prior accuracy of thetrader'sforecasts.Nothinginthelastparagraphwillbealteredbywhetheratraderusesamodel
asacomputationalaidinforecasting,unlessperhapsmanagementislulledintoafalsesenseofsecuritybybelievingthattheuseofamodellessensthechanceoferrors in trading judgment. However, if a model results, either purposely orinadvertently,inmisleadingtradersandmanagersabouttherelationshipbetweenpositions being taken and the size of possible losses, then the accusation thatmodelerrorresultedinthelossisfarmoreplausible.For example, a spot foreign exchange (FX) trader could be using a very
complexmodelwhendecidingwhichpositionstotake.Thiscouldevenextendasfarasprogramtrading,inwhichacomputeractuallyissuesthebuyandsellinstructions basedonmodel output.However, spotFXpositions can easily bevalued based on external quotes, and position size is extremely easy tounderstand without the aid of models (see the discussion in Sections 9.1 and9.2).Soitiseasyformanagementtoseewhattheprofitandloss(P&L)iseverydayandtocut therisk ifP&Lperformancehasbeenpoor.Thus, themodelingdoes not have any of the dangers of hidden risk, such as Ponzi schemes (seeSection 2.2).No FX traderwould dream of asking to reportmore profits thisyearbecausehe can “prove” that hismodel (or trading style)willworkbetternextyearthanthisyear.WhenIwasinthepositionofmanagingtheindependentmodelreviewsfora
firm, Iarguedstronglyagainstmygroupreviewing thevalidityofmodels thatwere being used only for trading decisions. Partly, this was an attempt toconserve resources forwhat Iviewedas themore important taskofvalidatingmodels used for valuation and risk measurement. But even more, I wasconcernedthattraderswouldusemodelvalidationbymyindependentreviewers
asastampofapprovalthatwoulddiscouragecriticalreviewoftradingstrategiesby senior management. I argued that since we weren't being asked to reviewtradingstrategiesthatdidn'tinvolvemodels,theuseofamodeldidnottransformusintoexpertsontradingstrategy.Inparticular,howcouldweobtaintheinsiderknowledge thatcouldallowus toanticipateevolutionof theprevailingmarketmodel?This is thepositionIadvocatedinthefirsteditionof thisbook,butonreflection,Iwouldreconsidermypreviousstance.Whenpositionlimitsarebeingsetandwhenactionsfollowingastop-losslimit
overagearebeingreviewed,thereisnoquestionthat traderswillutilizeresultsfrom their tradingmodels tomake their case to seniormanagers.Since seniormanagers will not have the time or, usually, the skill set to form their ownjudgmentofthesemodels,itisonlybyhavingindependentreviewerslookatthemodelsthataneffectivechallengetotraderclaimscanbeprepared.Independentreviewersmustmake clear the limited scopeof their review, but can certainlyraiseissuesconcerningpossiblecherry-pickingofhistoricaldataorreasonswhyshiftsintheeconomicenvironmentmightbringconclusionsbasedonhistoricaldata into question. These challengesmay prove of value to traders aswell asseniormanagers.And certainly, independent review ofmodelmechanics—themodelverificationofSections8.2.3,8.2.4,and8.2.5—canaddvalue.FRB (2011) seems quite clearly to endorse independent review of trading
models.ItsSectionIII,whichexaminesthecriteriaforwhichmodelsneedtobesubject to the review standards of the document, states, “Modelsmeeting thisdefinition might be used for analyzing business strategies, [and] informingbusiness decisions” and “The definition of model also covers quantitativeapproacheswhose inputsarepartiallyorwhollyqualitativeorbasedonexpertjudgment,providedtheoutputisquantitativeinnature.”

CHAPTER9
ManagingSpotRiskSpottradesaretradesthatinvolveanimmediateexchange.Thisincludestradessuchaspurchasesofstock,purchasesofgold,andexchangesofonecurrencyforanother.Itexcludestradesthatinvolveapromisetodeliveratsomefuturetime.Most of our study of risk involves future promises to deliver—unconditionalpromises constitute forward transactions, and promises whose payments arepredicatedonsomefutureconditionconstituteoptionstransactions.Themathematicalmodelingandriskmanagementofforwardsandoptionsare
farmorecomplexthanthecorrespondingelementsofspottransactions,andfarmore space in this book is devoted to forwards and options than to spotpositions.However,positionsinspottradesoftenconstitutethelargestportionofa firm's risk. Spot transactions are also the fundamental building blocks forvaluingandriskmanagingforwardandoptionpositions.Wecanfindthepresentvalue equivalent of a set of forward cash flows or the delta equivalent of anoptions position, butwe then need to be able to value and riskmanage theseresultingspotpositions.Soabriefsurveyof themanagementofspotrisk is inorder.
9.1OVERVIEWAll instruments traded by financial firms are commodities in the sense of notbeing individually identifiable. (If I borrow—that is, rent—a house from you,youexpectmetoreturnthatexactsamehouse,sohousesarenotacommodity;thisisnottruefordollarbills,barsofgold,barrelsofoil,sharesofIBMstock,specifiedamountsofagivenbond,andsoon.)Thiscommodityfeaturemeansthat traders are free to sell before theybuy, since they can always borrow theinstrument in order tomake delivery. In thisway, financialmarkets aremoresymmetricalthannoncommoditymarketssuchashouses,whereyoumustbuildupaninventorybybuyingbeforeyoucansell.Commoditiescanbedividedintophysicalcommodities,suchasgoldandoil,
and financial commodities, such as stocks, bonds, and currencies. We do notstudy any trading in bonds in this chapter. Since bonds represent a fixedobligation todeliveranamountofcurrency, theyare studied inChapter10on
managing forward risk.Ageneral convention in themarket is to use the termcommodities to mean physical commodities only. Financial commodities arenow almost universally transferable fromone location to another in electronicform,sotheyhavenegligibletransportationandstoragecostsperunit.Physicalcommodities have nonnegligible transportation and storage costs, which willhaveconsequenceswewillstudyshortly.Let us begin by looking at the hedging activities of a market maker in the
dollar versus yen spot foreign exchange (or to adopt the terminology of thatmarket,USD–JPYFX).Intermsofinstrumentsused,thisrepresentsthesimplesttypeoftradingpossible—itiscompletelyone-dimensional.Thetrader'spositionatanypointintimecanberepresentedaseitherlongorshortacertainquantityofJPY(or,completelyequivalently,shortorlongacertainquantityofUSD).Ina more complex spot market, such as the commodities market for wheat, atrader's position would need to reflect being long or short different grades ofwheat. However, currencies do not have grades—$1 million is $1 million,whetheritismadeupof10,000$100bills,100,000$10bills,1,000,000$1bills,or100,000,000pennies.Ourmarketmakerwillreceiveordersthroughoutthedayfromcustomerswho
areeitherlookingtosellJPYandbuyUSDorlookingtosellUSDandbuyJPY.EachcustomerwillstatethequantityofUSDshewishestosellandaskforabidof thequantityof JPY that themarketmakerwill exchange for it, or state thequantityofJPYshewishestosellandaskforabidofthequantityofUSDthemarketmakerwillexchangeforit.TradingscreensareavailableatalltimesthatshowthebestbidscurrentlyavailablefromothermarketmakersforsellingJPYinexchangeforUSDandforsellingUSDinexchangeforJPY.Marketmakersare constantly submitting their own bids for these two trades for theconsiderationofothermarketmakers.Whenacustomer'sinquiryisforasmallenoughquantity, themarketmakercanguaranteeaprofitbyquotingabidjustslightlyhigherthanthebestbidcurrentlyquotedonthetradingscreen,andifthecustomeracceptsthebid,themarketmakerwillimmediatelybeabletocloseoutthepositioncreatedbyhittingthebidquotedonthetradingscreenandmakingthesmalldifferencesbetweenthetwoasprofit.Themarketmaker isonlyrequiredtodecidehowmuchofamargintobuild
intothequotetothecustomer.Thehigherthemargin,thehighertheprofit,butthe greater the chance that the customerwill turn down the quote and seek aquotefromanothermarketmaker.Thesizeofmarginquotedmustdependonthemarketmaker'sknowledgeof the customer—how likely is this customer tobe

pollingalargenumberofmarketmakerssimultaneouslyratherthanjustcomingtoasinglefirmseekingaquote?Inpractice,thedecisionmakingatafirmwillprobablybedividedupbetweenatraderandasalesperson.Thesalesperson,whohas a close knowledge of and continuing relationship with the customer, willbear theprimary responsibility fordetermining the sizeofmarginquoted.Thetraderwill be credited, in the internal record keeping of the firm,with only asmallportionofthismargin.Atraderwhofollowedthisrisk-averseastrategywouldbeunlikelytoretaina
job for long. The firm would probably judge that the profit the trader wasmaking for the firm was not worth the opportunity cost of the trading seat.Higher profits would likely come from giving the seat to a more aggressivetrader who would choose to take some risk by not closing positions outimmediately. It is true that more aggressive traders are running the risk thatpriceswillmoveagainstthem,but,assumingthatthefirmseesadecentflowofcustomerorders,itislikelythatacustomerorderwillsooncomeinontheotherside,and,onaverage,overtime,thespreadbetweenthebidoneachsideofthemarketwillbegreaterthanlossesfrompricemovementthroughtime.Whenalargecustomerordercomesin, thenthemarketmakerhasnochoice
but to take some risk—the only choice is how to divide the risk between theliquidity risk of trying to offset the position immediately and the basis risk ofoffsetting the position over time.With a large order, the trader can no longercountonbeingable toclose thepositionoutat thepricepostedon the tradingscreensincethisquotewillonlybeforareasonablysmalltransaction.Ofcourse,thecustomerwillbechargedapremiumfortheliquidityriskposedbythesizeoftheorder,whichwillprovidesomecushiontothetraderagainsttheriskthatmustbetaken.Thetraderneedstomakeajudgmentastotherelationshipofthislarge customer order to overall market conditions. Is it an order that simplyreflectstheidiosyncraticcircumstancesofthiscustomer,perhapsapaymentthatneeds tobemade in the customer's business? In this case, it is unlikely that arelationshipexistsbetweentheorderandanyprice trendin themarket.Unlessthetraderhassomeotherreasontobelievethatthemarketwillbetrendinginadirection that will cause losses to this position, it will be better to close thepositionslowly,relyingoncustomerordersandsmall tradeswithothermarketmakers,minimizingliquidityrisk.However,ifthelargecustomerorderislikelytobepartofa largemovement, suchasacustomerwantingprotectionagainsttheannouncementofeconomicdatathatmayimpactthemarket,itmaybebettertoclosethepositionmorequickly,bearingsomeliquiditycostinordertoreduce

theexposuretomarkettrend.Almgren and Chriss (2001) show how to calculate the efficient frontier of
strategiesthathavetheoptimaltrade-offbetweentheliquiditycostsofoffsettingthepositioninlargeblocksandthevolatilityrisk(whichwecallbasisrisk)thatthepriceatwhichtheoffsetoccursdiffersfromthepriceatwhichthepositionwas put on. In the absence of price drift, the strategy thatminimizes liquiditycostisoneinwhichpositioncoveringisspreadoutoveraslongaperiodoftimeas possible, minimizing transaction size, and the strategy that minimizesvolatilityriskisoneinwhichtheentirepositionisoffsetatonce,withas littlechanceforpricestochangeaspossible.Thusfar,wehavepointedouttwoadvantagesofseeinggoodcustomerorder
flowtoamarket-makingfirm:theincreasedlikelihoodofclosingoutpositionsatthefavorablesideofthebidspreadandknowledgeaboutthemotivesbehindlargeorders.Thereareotheradvantagesaswell.Workingwithcustomerscloselyenables a firm to anticipate a large order and allows positions to accumulatethrough customer flow to meet part of the order in advance, thereby furtherlowering liquidity risk.Whena firm's tradershaveamarketviewandwant toputonaposition,customerorderflowenablesthemtoputpositionsonandcloseout the positions more cheaply than if all positioning had to be done byaggressivelyseekingbidsfromothermarketmakers.Alloftheseadvantagesofcustomerorderflowandthetrade-offsofliquidityversusbasisriskarepresentinallmarket-makingactivities,butcanbeobservedintheirpurestforminspotriskmarketmaking,whereothercomplicatingfactorsdonotintrude.Evenforthesimplestspotproduct,FXspot,positionscanbeclosedovertime
inotherpossibleways.Forexample,anothersourceofliquidityistospreadouttheclosingofthepositionbetweenthespotFXmarketandforwardFXmarkets.This introducesanewbasis risk in theformof theriskofunfavorable interestratemovementsbetweenthetimetheforwardpositionisputonandthetimeitisclosed out, but lowers the time basis risk.The tradermust judgewhich is themost favorable riskmix.A trader in thecurrencyofa smallereconomy, letussayonetradingtheDanishkroneagainstthedollar,mightchoosetotemporarilyhedgesomeofapositionbyaeuro-USDtradethatwilleventuallybeclosedoutbyakrone-eurotrade.Addingalegtothetradeaddstransactioncosts,buteuro-USDhasmoreliquiditythankrone-dollarandthetrader'sjudgmentmaybethatthe basis risk of a krone-euro position is considerably smaller than that of akrone-USDposition,giventheclosertieoftheDanisheconomytotheeconomyof the euro bloc countries than to theU.S. economy.Whenwemove tomore
complexspotproductssuchascommoditiesorequities,thepotentialavenuesforredirecting basis riskmultiply enormously. A position in IBM stock could betemporarily hedged by a Standard & Poor's (S&P) index future, judging thisbasis risk tobesmaller thananoutright IBMstockposition.Aposition inonegradeofwheatcouldbetemporarilyhedgedwithapositioninanothergradeofwheatthattradeswithgreaterliquidity.Firm-level risk management for spot risk is relatively straightforward. The
moreliquidspotpositionscanbevaluedbydirectlyobtainingmarketprices.Asa result, it is not necessary to utilize models for valuation and to establishreservesagainstpossiblemodelerrors.Mostspotmarketsareliquidenoughthatprices can be obtained from trading screens or closing prices on publicexchanges, so it is not even necessary to arrange for a price collection frombrokers.Formarket-makingtradingdeskswithreasonablecustomerorderflow,positions should be marked to midmarket, since the presumption is that, onaverage,most positions canbeunwoundwithout needing to aggressively seekbids fromothermarketmakers.Theonlyadjustment thatmightarisewithanyfrequencyisareserveagainstliquidityriskifaspotpositiongrowssufficientlylarge relative to the sizeof customerorder flow that significant liquidity costsmayariseinclosingtheposition.Forproprietarytradingdesks,positionsshouldgenerallybemarkedtothesideofthebid-askspreadthatisleastfavorablefortheposition,since,intheabsenceofcustomerorderflow,itshouldbepresumedthatclosingoutthepositionwillrequireaggressivelyseekingbidsfrommarketmakers.Less liquid spot markets may require some form of modeling for valuation
purposes.Forexample,anover-the-counterstockthatdoesnottradeveryoftenoracommoditygradethatisthinlytradedmaynothavereadilyavailablepricequotes.Amodelmayneedtobeestablishedthatrelatesthispricetothepriceofamoreliquidinstrument.Forexample,theover-the-counterstockpricecouldbepricedinrelationshiptoastockindex,oralessliquidcommoditygradecouldbepricedasaspreadtoamoreliquidcommoditygrade.Inthisway,thevaluationcan be updated daily based on quotes for the more liquid instruments. Therelationshipcanbereestimated lessfrequentlyasreliable tradingpricesfor thelessliquidinstrumentareobtained.Whenmodelsofthistypeareused,areserveisneededagainstthestatisticaluncertaintyoftherelationshipbetweenliquidandlessliquidpricesbeingutilized.Theissuesofnonstatisticallimitsandriskreportingtoseniormanagementfor
spotpositionscentercompletelyonissuesofwhichpositionsshouldbegrouped

together,sincethepositioninanyparticularspotinstrumentisasinglenumber.We'lldiscuss this issue foreachof thespotmarkets: firstFX, thenequity,andfinallyphysicalcommodities.
9.2FOREIGNEXCHANGESPOTRISKToconsideraconcreteexample,aUSD-basedfirmwillwanttolimitandreporttoseniormanagementitsnetFXspotexposuretoUSD.Thisfirmwillalsowantto have individual currency limits for FX spot exposure for every currency ittrades.Itwillsetlimitsizesrelativetotheoverallliquidityofthemarketforthatcurrencyandthefirm'sdegreeofcustomerorderflowinthatcurrencytoensurethat traders have explicitmanagement approval to build up positions thatwillrequire large time periods to reverse. However, senior management wouldprobablyneedtobeinformedonlyof thelargest individualcurrencypositions.TheremainingdecisionisdeterminingwhichcurrencygroupingsarethebesttouseinsettingnetFXspotexposurelimitsandreportingtoseniormanagement.Forexample,doesagroupingofall-Asiancurrenciesmakesense?Agroupingofall-Asian currencies excluding the yen, Australian dollar, and New Zealanddollar? Should Asian currencies be divided into groupings based on nationalgross domestic product (GDP) per person? Should all currencies of countrieswithlowerGDPperpersonbegroupedtogetherasemergingmarketcurrencies?Each firm will reach its own conclusions based on economic theory, tradingexperience,and,perhaps,statisticalanalysisofwhichcurrencymovementstendtooccurtogether.
9.3EQUITYSPOTRISKEquity reporting and limits can begin from a similar starting point as for FX.There should be reporting and limits for positions in individual stocks, for anoveralllong(orshort)netpositioninallstocks,andforgroupingsbygeographicregion.DecisionsonwhethertogrouptogetherstocksinallcompaniesbasedinEuropeorbasedinemergingmarketsissubjecttothesametypeofanalysisasthedecisionsforFX.But geography is just a starting point for stocks. There are several other
considerations:industryandindustrysectors,andstyle.Muchresearchhasbeendevoted towhichfactorsplay the largest role inexplaining theperformanceof
equitymanagers,anissuethatisknownasperformanceattribution; theclassicarticle in this area is Sharpe (1992), which was highly influential in therecognition of the importance of stocks of smaller-capitalization firms versuslarger-capitalization firms and growth stocks versus value stocks as importantstyleattributesinexplainingperformance.Muchofthisanalysistranslatesverydirectlytohowtogroupstockstogetherforpurposesofriskreportingandlimits.Hereareexamplesofsomepopularclassificationsforperformanceattribution:Morningstar,initsevaluationsofmutualfundsthatinvestinequities,hascreatedaveryinfluentialstyleboxbasedonsmaller-capitalizationfirms(lessthan$2billion)versuslarger-capitalizationfirms(morethan$10billion)andgrowthstocksversusvaluestocks.MorningstarfollowsSharpe(1992)indefininggrowthstocksasthosewithlittleornodividendpayout,highprice-to-bookandprice-to-earningsratios,andpromisingcapitalappreciation,andvaluestocksasthoselikelytopayhighdividendsbutwithlowprice-to-bookandprice-to-earningsratios.TheGlobalIndustryClassificationStandard(GICS)developedbyMorganStanleyCapitalInternational(MSCI)andStandard&Poor's(S&P)consistsof10sectors,24industrygroups,68industries,and154subindustries.The10sectorsareenergy,materials,industrials,consumerdiscretionary,consumerstaples,healthcare,financials,informationtechnology,telecommunicationservices,andutilities.
9.4PHYSICALCOMMODITIESSPOTRISKPhysicalcommoditiesarefurthercomplicatedbythepresenceoftransportationcosts, which leads to different markets for the same commodity in differentlocations(forexample,oilfordeliveryinSeattleisadifferentproductfromoilfor delivery in El Paso). This plays a role in valuation, since delivery at alocation where liquid prices are not available could be priced using a modelbased on a more liquid price for delivery at another location and estimatedtransportationcostbetweenthetwolocations.Italsoplaysaroleinthedesignoflimits and reporting. Locations that are reasonably closely related in price, byhaving low transportation costs between them, should have their positionssummedintoanetpositionforreportingandperhapslimits.An interestinganalogycanbemadebetween location relationshipsbasedon
transportationcostsandrelationshipsbetweenforwardprices fordifferent time

periods. In Section 10.3.2, we will see that some commodities have forwardprices for different times tightly linked by the possibility of cash-and-carryarbitrage.Itisinstructivetothinkofthisasaformoflocationrelationship,withthestorageandfinancingcostsasthecostof“transporting”thecommodityfromonetimeperiodtoalaterone.Justastransportationcanbesoexpensivebetweensomelocations that theyvirtuallyformindependentmarkets,storagecanbesoexpensiveforsomecommodities,suchaselectricity,astovirtuallyeliminatethepossibility of cash-and-carry arbitrage.However, although transportation costsarealmostalwayssymmetrical(itcostsjustasmuchtoshipfromAtoBasfromB to A), a commodity cannot be transported from a later period to a formerperiod,socash-and-carryarbitrageworksonlyintheforwarddirection.Other types of potential transformations besides location play a role in
physicalcommodities.TotaketwoexamplesfromMcDonald(2006,Chapter6):Soybeanscanbecrushedtoproducesoybeanmealandsoybeanoil.Atraderwithapositioninsoybeanfuturesandanoppositepositioninequivalentquantitiesofsoybeanmealandsoybeanoilfuturesistradingthecrushspread.Thetraderistakingapositionnotonwhatwillhappentothecostofsoybeansbutonwhatwillhappentothecostofprocessingsoybeansintosoybeanmealandsoybeanoil.Totheextentthatpositionsinsoybeansandsoybeanmealandsoybeanoiloffset,theresultingpositionshouldbereportedandlimitssetonthecrushspreadandnotontheindividuallegs.Crudeoilcanbeseparatedintodifferentpetroleumproductssuchasheatingoilandgasolinebyarefiningprocessknownascracking.Atraderwithapositionincrudeoilfuturesandanoppositepositioninequivalentquantitiesinheatingoilandgasolinefuturesistradingthecrackspread.Thetraderistakingapositionnotonwhatwillhappentothecostofcrudeoilbutonwhatwillhappentothecostofprocessingcrudeoilintoheatingoilandgasoline.Totheextentthatpositionsincrudeoilandheatingoilandgasolineoffset,theresultingpositionshouldbereportedandlimitssetonthecrackspreadandnotontheindividuallegs.
Reportsshouldalsobedesignedandlimitssetonaggregatedpositionsacrossphysicalcommoditieswhosepricestendtobehighlycorrelated.Sotheremightbeanoverall limiton totalnet long(orshort)exposure toallenergyproducts,summedovercrudeoil,heatingoil,gasoline,naturalgas,andelectricity.Whichproducts get grouped togethermay differ by firm, based on economic theory,tradingexperience,andstatisticalanalysis.

EXERCISE9.1SimulationoftheImpactofTradingRulesonExpected
ReturnandRiskAmarketmakerinaspotmarketisoperatingundertheconstraintthatshemustcloseoutherpositionbytheendofeachtradingday.Wewanttoseetheimpactofdifferentpossibletradinglimitsonthesizeofthepositionthatcanbebuiltup.Dividethetradingdayinto100timesegments.Ineachtimesegmentexceptthelast,thereisa50percentchanceofreceivingacustomerorderforoneunit.Acustomerorderhasa50percentchanceofbeingabuyanda50percentchanceofbeingasell.Customerspay$0.10pertradeintransactioncosts.Soifthemidmarketpriceis$100.00,acustomerwillpurchaseat$100.10andsellat$99.90.Themarketmakercannotcloseoutatradewithoutwaitingatleastoneperiod.Midmarketpricechangesfromoneperiodtothenextarenormallydistributedwithastandarddeviationof$0.10(assumeastartingmidmarketpriceof$100.00).Themarketmakermustcloseoutheropenpositionbythelasttradingperiod.Shepays$0.05pertradeintransactioncoststoclosepositionswithanothermarketmaker.Soifthemidmarketpriceis$100.00,shesellspositionsat$99.95andpurchasesat$100.05.Itistothemarketmaker'sadvantageifshecanwaituntilacustomerordercomesintocloseoutherposition,sinceshewillmakea$0.10transactionspreadoneachsideofthetrade,foratotalof$0.20,ratherthanmakingonly$0.10minus$0.05,foratotalof$0.05intransactionspreadbyclosingoutwithanothermarketmaker.However,thelongershewaitsforacustomerorder,thegreaterherriskofpricesmovingagainsther.Simulateasetoftradingrulestoseethetrade-offbetweenexpectedreturnandrisk.Use1,000pathsforeachsimulation.Themeasureofexpectedreturnshouldbesimplytheaverageoverthesepaths.Youcanchooseanyreasonablemeasureofrisk,suchasthe95thpercentilelossorthestandarddeviation.Onetradingruleshouldbetonevercloseoutuntilthelastperiod.Anothershouldbetoalwayscloseoutintheperiodimmediatelyafterthecustomertrade.Intermediaterulescanbebasedonalimitofhowlargetheabsolutesizeofapositionisallowedtogrow—whenthepositiongetslargerthanthislimit,theexcessmustbeclosedout.1. Determine the impact on the risk/return trade-off of a lower standard deviation of themidmarketpriceof$0.05perperiod.2.Foramoreextendedexercise,youcouldexperimentwithmorecomplextradingrules,suchashavingthetransactioncostforclosingapositionbeanincreasingfunctionoftheabsolutesizeofposition to be closed, or allowing the market maker to influence the probability of customertradesbeingbuysorsellsbyshiftingherquotedpriceawayfromthemidmarketprice.
CHAPTER10
ManagingForwardRiskManaging forward risk is considerablymorecomplex thanmanaging spot riskdue to the large number of dates onwhich forward payments can take place.Withsomeforwardmarketsgoingoutto30yearsandevenbeyond,evenifwerestrictdeliveriestotakeplaceonthe250businessdaysofayear,itstillleaves30×250=7,500daysonwhichfutureflowscanoccur,eachofwhichrequiresamark-to-marketvaluationandriskmeasurement.Itisclearlyimpracticaltohaveliquid market quotations for each possible forward, so modeling needs to beheavilyreliedupon.Havingaspotversusforwardpositionisaninterestratedifferentialposition,
notapriceview. If Ibelieve themarketwillgeta surpriseannouncement thatwillraisethestockprice,evenifIthinkitwillnotcomeforthreemonths,Idon'twanttobelongtheforwardandshortthespot.Whentheannouncementcomes,both will be roughly equally impacted. I want this position only if theannouncementIexpectissomethinglikeaone-shotdividendthatwillimpacttherelativevalueofthespotandforward.IfIputonalongforwardandshortspotposition,I'mtakingaviewontheinterestrate.Letme cite a real example.On June 24, 1998, a traderwas holding a long
forwardpositioninTelecomstockagainstwhichhewasshortthestock.AT&Tannounced plans to purchase Telecom at a sizable premium, but the traderwoundupwithasizableloss.Why?HisoutrightpositioninTelecomstockwaseven,sohedidn'tgainfromtheriseinthestockprice.Telecomhadneverpaidadividend,sotheforwardtradedata largepremiumtothecash.Assoonasthemarketanticipated that thestockcouldbe tradedforadividend-bearingAT&Tstock, this forward-to-cashpremiumshrunksignificantly since itwasnow lessexpensivetoholdacashpositioninthestockfordeliveryintoaforwardsale.The difference between an outright position and a borrowing or lending
positionisthedifferencebetweenwantingtoholdanassetasagoodinvestment(youexpectittogainvalue)versuswantingtomakeuseofanasset.Considerahouse.Whenyoubuyit,yougetacombinationofaninvestmentandaplacetolive.Youmightwant to split the two. Ifyou like it asan investmentbutdon'twanttolivethere,youcanbuyitandlendittosomeone(rentitout).Ifyouwanttoliveinitbutdon'tlikeitasaninvestment,youshouldborrowit(rentit)rather
thanbuyit.Similarly,afirmthatisinthebusinessofmillingwheatandisrunningshortof
wheatsupplytokeepitsproductionprocessgoingbutdoesnotlikewheatasaninvestment (doesnotbelieve itwill goup inprice)will seek toborrowwheatratherthanbuyit(althoughborrowingmaytaketheformofbuyingspotwheatwhilesellingforwardwheat).Likewise,afirmthatlikeswheatasaninvestmentbutdoesnotneeditforanyproductionprocesswillbuywheatandthenlenditout(possiblycombiningthetwostepsintoonebybuyingforwardwheat).Althoughacleardistinctioncanbemadebetweenanoutrightspotpositionand
aborrowingorlendingposition,theyalsosharecloserelationships.AswesawinthediscussionofspotriskmanagementinChapter9,maintainingaspotriskposition over a longer period than a single trading day requires some formofborrowing or lending. In some markets, the use of borrowing or lending tomaintainoutrightspotriskpositionsbecomessuchadominantforcethatitistheprincipaldriverofinterestratemovementsinthemarket.Inmanytrades,suchasforwardpurchasesandsales,spotandforwardriskareboundtogether,soitwillbenecessarytostudytheinteractionsbetweenthesetworiskstofullyunderstandthe dynamics of forward risk management. It is important for the riskmanagement function to clearly separate spot risk from forward risk intransactionsinwhichtheyarebundledtoensurethatallthefirm'sspotriskinagivenassetisreportedandmanagedinaunifiedfashion.Theborrowingandlendingmarketsincurrenciesandgoldstartedasameans
for businesses and individuals to adjust the timing between when income isearned and when purchases are made. Borrowing and lending in othercommoditiesstartedwithusersandsuppliersofthecommoditysatisfyingshort-termneeds,asinthepreviousmillingexample.Borrowinginstocksandbondsstartedwiththeneedforshortsellers,whowanttoactontheviewthatanassetwill decline in value, needing to first borrowwhat they wanted to sell short.Borrowing to support short selling is also a feature of all the other borrowingmarkets.Once borrowing and lending markets are established, they begin to attract
investors,speculators,andhedgerswhohaveviewsontheborrowingrateratherthanon theassetprice.Soone traderwhobelieves thataparticularborrowingratewillsoondeclinewilllendatthatratesolelyinhopesthathecanmatchthatlendingwithaborrowingatalowerratewhentheratedeclines.Anothertradermightbelieve that theborrowing rate forMay2015 is toohigh relative to theborrowing rate forApril 2015 so shewill borrow forApril and lend forMay,

hoping to reverse the transactions when rates return to a more normalrelationship.Another tradermightbelieve that borrowing rates for aparticularcorporation will decline relative to those of another corporation or thegovernment, so he will lend to the former by buying its bond and borrow tosupport a short sale of the latter's bond. A business firm worried about thepossible impact of high borrowing costs on its financial health in 2017 willborrowfundsnowthatdonotbecomeavailableuntil2017.TheemphasisIamplacingonborrowingandlendingratesasthefoundation
offorwardriskissomewhatnonstandard;butseeWilliams(1986)foranincisiveeconomic analysis of forward, futures, and lending markets for commoditiesusing this approach; also see Brown (2012, Chapter 10) for an excellentdiscussion along similar lines. A more conventional exposition, such as Hull(2012, Chapter 5), would focus on borrowing rates only for currencies andwould analyze forward risk on commodities and securities through forwardcontracts that involveexchanging thecommodityor security forcurrency.Theborrowingrateonthecommodityorsecuritystillcomesintoplayasoneoftheinputs determining the price of the forward or implied by the price of theforward.Thetwomethodsaremathematicallyequivalent,sochoosingbetweenthemis
a matter of deciding which is the most convenient and supplies the greatestfinancial insight. My choice of emphasis is based on the followingconsiderations:
Directborrowingandlendingmarketsexistformanyassets—suchasgold,stocks,andgovernmentbonds—thatdonotrequireanyinvolvementwithborrowing/lendingriskoncurrencies.Let'slookatanexample.Supposethattherateforborrowinggoldforthreemonthsis2percentannualized.IfIwanttoborrow1,000ouncesofgoldtoday,Imustbepreparedtoreturn1,000×(1+2%×3/12)=1,005ouncesofgoldinthreemonths.Nomentionhasbeenmadeofanycurrency—thereissimplyanequivalenceofacertainamountofgoldononedateandsomeotheramountofgoldonanotherdate.Auniformapproachtoallunderlyinginstrumentsmakesforeasierexpositionofsomeconcepts.Forexample,Section10.2onmathematicalmodelsforforwardriskisbuiltaroundasinglediscountcurvethatcouldrepresentborrowingcostsforacurrency,butcouldrepresentborrowingcostsforasecurityorcommodityequallywell.Itisconsistentwithariskmanagementviewpointinwhich,forexample,it

isnaturalforagoldtradertobetakingriskwithregardtogoldborrowingrates,butnotwithregardtodollarborrowingrates.Goldborrowingcostsareprimarilyimpactedbyeconomicfactorsuniquetothegoldmarket,includingthesupplyanddemandforgold,soitwouldbeasoundriskmanagementpracticeforthesametradingdesktorunrisksinthegoldspotandborrowingrates.However,thereislittlelinkagebetweengoldanddollarborrowingrates.Agoldtraderrunningdollarborrowingrisksthroughthevehicleofpositionsingold/dollarforwardsrequiresseriousmanagementscrutiny.Ataminimum,dollarinterestrateexposurestakeninthiswayneedtobereportedandaggregatedtogetherwithotherdollarraterisksthroughoutthefirm.Similarcommentsapplytoborrowingriskonothercommoditiesandsecurities.
Theprimaryargumentagainstaborrowingratefocusis thatforsomeassets,suchasoil, noborrowingmarket exists, requiring forward risk tobemanagedthroughforwardcontracts.Evenforsomeassetsforwhichaborrowingmarketdoes exist, the borrowing market has considerably less liquidity than thecomparable forward contract. However, it is always possible to take spot andforward prices and currency interest rates and derive implied asset borrowingrates thatcan thenbeused justas if theyhadbeenobtainedbyadirectquote.Indeed,eveninsomecurrencymarkets,themostliquidsourceforratequotesisto combine forward foreign exchange (FX) prices with dollar rates to deriveinterest ratesfor thecurrency.This isnobar todevelopingdiscountcurvesforthecurrencyorcombiningdirectlyobtainedratesthatarethemostliquidpricesource for some maturity segments with implied rates for other maturitysegmentsandusingthemtoformasinglediscountcurve.Within the fixed-incomedepartmentsof investmentbanks, it iscustomary to
findseparatetradingdesksforinterestrateandcreditproducts,withinterestratetradingfocusedexclusivelyonchangesincreditrisk-freeratesandcredittradingfocused exclusively on changes in the credit spread to risk-free rates.Clearly,some products cut across this boundary—a fixed-rate bond issued by acorporationwillchangeinvaluebecauseofbothchangesinrisk-freeratesandchanges in credit spreads. But interest rate swaps that convert fixed-rate intofloating-ratepaymentscanbeusedtotransformafixed-ratecorporatebondintoaninstrumentthatisalmosttotallydependentoncreditspread,sotradingdeskscan utilize internal transfers to almost completely separate the two types ofexposure.Wewillwanttofollowthisdivisioninstudyingrisk.Whilethereisacertain

amount of overlap between interest rate risk and credit riskmeasurement andmodeling, particularly in extracting term structure from market prices, thedifferencesaregreaterthanthesimilarities:
Optionproductsareveryimportantinstrumentsininterestratetrading,requiringthemodificationoftraditionaloptionmodelstomorecomplexmultiple-tenorenvironment.Optionproductsarecurrentlyofnegligibleimportanceincredittrading.Creditmodelingfocusesoncorrelationbetweendebtandequitywithinafirmandbetweendebtofdifferentfirms.Therearenocomparableissuesforinterestratemodels.
Consequently,wewillfocusonlyonproductsfreeofcreditriskinthischapter,reservingthestudyofcreditriskmanagementforChapter13.Strictly speaking, it is only bonds issued by the central government (for
example,U.S. Treasury bills and bonds in theUnited States) that are (nearly)completely free of credit risks. It is only the central government that hasunlimitedpowertoissueitsowncurrencyandsocan(nearly)certainlymeetanyobligations topay thatcurrency.But fixed-income tradingdesksof investmentbanksgenerallyalsotradeavarietyofinstrumentswhosecreditriskisextremelylow:bondsissuedbyagenciesofthecentralgovernment,mortgagesguaranteedby such agencies, and derivatives tied to bank indexes such as the LondonInterbank Offered Rate (LIBOR). This latter case is a particularly importantclassforinterestrateproducts;indeed,thelargestinterestrateriskexposuresoffinancialinstitutionsisusuallytoLIBORproducts:LIBORfutures,forwardrateagreements,swaps,caps,floors,andswaptions.Soweoughttoexaminecloselywhy credit risk on these products is considered negligible and why itpredominatesoverTreasuryratesasthebasisforderivativeproducts.First,weneed todistinguishbetween thecredit risk to thecounterpartyona
derivative and the credit risk on the derivative instrument itself. Consider theexampleof a typicalderivative tied toLIBOR,a10-year interest rate swapoffixed coupon payments against three-month US Dollar LIBOR reset eachquarter. Certainly there is credit risk that the counterparty will default on itsobligations under this contract, with the severity of risk tied to thecreditworthinessofthecounterparty.Butthishasnothingtodowithcreditriskof the swap itself.An equity option or foreign exchange swap or option on aTreasurybondwouldalsoentailcounterpartycreditriskbutnounderlyingcreditrisk.Bycontrast,adefaultswapinwhichyoumustpayCompanyAanagreedamountbasedonthedefaultofCompanyBagainstfixedpaymentstoyoufrom

companyAentailsbothcounterpartycreditriskoflosingyourfixedpaymentsifcompanyAdefaultsandunderlyingcreditriskofCompanyBdefaulting.Soweneedtoseewhetherthereisanyunderlyingcreditriskonabankindex
product.Letuscontinuewithourexampleofthe10-yearswapbasedonthree-month US Dollar LIBOR resets. There is clearly some credit risk—a severeeconomic downturn will raise concern about potential bank defaults andthereforeraisetheratethatbanksneedtopayonthree-monthdepositsrelativetothree-monthTreasurybillrates.Buttoseejusthowsmallthiselementofcreditriskis,letuscontrastitwiththecreditriskona10-yearbondissuedbyoneofthebankswhosedepositratesformtheLIBORindex,notingthatthecreditriskonthisbondisverysmalltobeginwith,sinceallbanksintheindexareofveryhighcreditquality,generallyAa.Thecreditspreadonthe10-yearbondneedstoreflecttheprobabilityofdefaultovera10-yearperiod,whichincludesscenariosinwhichthecreditworthinessofthebankdeclinesseverelypriortothedefault.ButthesescenarioswillhavelittleimpactontheaverageLIBORindexoverthe10years, sinceabank thatdeclines increditworthinesswillbe replaced in thepanel that determines theLIBOR index. For example,Moody's data for a 20-yearperiodshowsthat0.81%ofAa-ratedfirmsdefaultedwithin10yearsoftherating, but only0.02%ofAa firmsdefaultedwithinoneyearof anAa rating.Furthermore, even in the event of default, the chances of depositors losingmoney are very small since bank regulators are primarily concerned withprotecting depositors and take steps to ensure that losseswill be absorbed bystockholdersandbondholdersbutnotdepositors.SpreadsbetweenLIBOR-basedrates and Treasury rates therefore primarily reflect the superior liquidity ofTreasuriesandtheirvalueascollateral.Undertheveryextremeconditionsoftheglobal banking crisis of 2007–2008, there was a period in which a spreadbetween LIBOR and Treasury rates based on credit concerns came to play amajor role (see Tuckman and Serrat 2012, 431–432), but this is a very rareoccurrence.Individual government issues have idiosyncratic characteristics (liquidity,
borrowingrates,countryof issueforeuros)getting in thewayofcreationofasingle discount curve against time. This is closely tied to government bondsbeing in fixed supply as opposed to swaps, which can be freely created.Government rates represent only investment rates for most firms and notborrowing rates (you can only borrow at government rates if you havegovernmentbonds available as collateral)whiledeposit rates are two-sided, atleastforthelargefinancialinstitutionsthatserveasmarketmakers.Thishasled

to LIBOR being the risk-free rate generally used to price derivatives, such asfutures,forwards,interestrateswaps,interestrateoptions,andcreditswaps,andasatargetagainstwhichtomeasureborrowingrates.ThisexplainswhyLIBORis far more popular than government rates as a basis for derivatives used tohedge interest rate risk. As this book is going to press, news stories aboutmanipulationoftheLIBORratesettingprocessareraisingquestionsthatcouldthreaten the popularity of LIBOR as a basis for derivatives. As this storydevelops,itsconsequenceswillbeaddressedonthisbook'swebsite.A good summary of the issues raised by this manipulation of LIBOR rate
settingisthearticle“TheRottenHeartofFinance”intheJuly7,2012,issueofthe Economist magazine. The website of the British Bankers Association(www.bbalibor.com), the organization in charge of determining LIBOR, hasmany articles giving details of the LIBOR-setting process. When derivativecontractsbasedonbankdepositratesweredesigned,asignificantworrywasthatif a derivative referenced the rate set by a particular bank, that bank mightmanipulatetheratesatwhichitbidfordepositsinordertogenerateprofitsinitsderivatives holdings. The decisionwasmade to tie derivatives products to anindex of bank deposit rates, which would be harder for any one bank tomanipulate. A large panel of banks is selected (currently 16 for US DollarLIBOR), based on criteria of expertise and prominence in themarket and thehighest degree of credit worthiness (any bank no longer meeting theserequirementswouldbereplacedinthepanel).Thehighestandlowestquartilesofsubmittedratesaredropped,tominimizeanypotentialformanipulation,andonly the middle two quartiles averaged (in addition, any bank not operatingwithin the spirit of the ruleswouldbedropped from thepanel).Butwhen theglobalbankingcrisisof2007–2008causedalargedeclineintheuseofinterbankdeposits, the lack of market liquidity may have opened the door to potentialmanipulation.Giventhecomplexitiesofforwardriskmanagement,wewillneedtocarefully
organizeourstudyintothefollowingsections:Section10.1.Thisisastudyofthevarietyofinstrumentsthatentailforwardriskandthatcanbeusedtomanageforwardrisk.Thelargevarietyofstructuresinwhichspotandforwardrisk(andoccasionallyimplicitoptionsrisk)arewoventogethermeansthatanimportantpartofriskanalysisisoftenjustmakingsurethatalltherisksofaparticulartradehavebeenproperlyidentified.Inadditiontothemarketrisks,slightvariationsinstructure,whichmayresultinvirtuallyidenticalspotandforwardrisk,can
havelargedifferencesincreditrisk,legalrisk,andfundingliquidityrisk.Section10.2.Thissectionprovidesastudyofthemathematicalmodelsusedtovalueandmeasureforwardrisks.Althoughthesemodelshavebeenusedheavilyformanyyearsandagreatdealofconsensushasbeenbuiltuparoundthem,enoughsubtleissuesremaintomeritacarefulunderstandingoftheresidualrisksofmodeluncertainty.Section10.3.Thissectiontakesabrieflookatthefactorsthatimpactborrowingandlendingcosts.Althoughthisisnotprimarilyabookabouteconomics,atleastsomefamiliaritywiththedeterminantsofforwardpricesisnecessarytoproperlyunderstandtherequirementsfordesigningariskmanagementstructureforforwardrisks.Section10.4.Thissectionprovidesastudyofhowtodesignariskmanagementreportingsystemforforwardrisk.
10.1INSTRUMENTSThemanagementofforwardriskcaninvolveanumberofdifferentinstrumentsthatcanbeusedtotakeonthesamemarketriskposition.Theseinstrumentsmaydiffer in legal form, with different regulatory consequences and standing inbankruptcy proceedings, and have different implications for credit risk andfunding liquidity risk. They also differ in the extent to which they bundletogetherspotandforwardrisk.Weconsidereachofthefollowingcategories:DirectborrowingandlendingRepurchaseagreements.Forwards.Futures.Forwardrateagreements(FRAs)InterestrateswapsTotalreturnswapsAsset-backedsecurities
10.1.1DirectBorrowingAndLendingSupposeatraderwantstosellagivenassetshort.Inanumberofassetmarkets—such as stocks, bonds, currencies, and gold—the asset can be borroweddirectlyinordertosellshort.Othermarkets,suchasmostphysicalcommodities,havenotdevelopeddirectborrowingproducts.
Onedrawbacktousingborrowingasthemeansofobtaininganassettoshortis that it creates a sizable credit risk and funding liquidity risk for the assetlender,whocouldlosetheentirevalueoftheassetiftheborrowerdefaultsandwhohastofinancetheassetthathasbeenlent.Theborrowermaybepayingforcreditusage that isnot reallyneeded,since thecashraisedbyselling theassetshort is incidental to theoriginalobjectiveofsellingtheassetshort topositionforapricedrop.Onesolutionis touse thecashraisedascollateralagainst theborrowing.Thisreducesthecreditriskfortheassetlender,whocanholdontothecashcollateralincaseofborrowerdefault,andreducesthefundingliquidityrisk,sincethecashcollateralreceivedbytheassetlendercanbeusedtofundtheassetpurchase.Providing cash collateral to the asset lender creates credit risk for the asset
borrower,eventhoughthisismitigatedbythevalueoftheasset,whichdoesnotneedtobereturnediftherecipientofthecashcollateraldefaults.
10.1.2RepurchaseAgreementsInthepreviousexample,onepartyborrowstheassetandprovidescashcollateraltotheotherparty.Anequivalentwayofdescribingthesametradeistosaythatonepartyborrowstheassetandlendscash,whereastheotherpartyborrowscashandlendstheasset.Yetanotherequivalentwayofdescribingthesametradeisatransactioninwhichthefirstpartypurchasestheassetforcashand,atthesametime, contracts to sell the asset back to the secondparty at an agreed forwarddate for an agreed cash price. Table 10.1 demonstrates that all three ways ofdescribingthistransactionareequivalentintermsoftheflowsofcashandasset.TABLE10.1AlternativeDescriptionsofanAssetBorrowingCollateralizedbyCashDescription1Today Aborrows$1millionparamountofaTreasurybondfromB.
Asellsthebondinthemarketandreceives$980,000.Aplacesthe$980,000ascollateralwithB.
Onemonthfromtoday
Abuysthe$1millionparbondinthemarketandreturnsittoB.Breturnsthe$980,000collateraltoA.Apays$1,000ininterestforborrowingthebondtoB.Bpays$5,000ininterestfortheuseofthecashtoA.
Neteffect Adelivers$1millioninparamountoftheTreasurybondtoA.Bpays$980,000+$5,000–$1,000=$984,000incashtoA.
Description2Today Aborrows$1millionparamountofaTreasurybondfromB.
Bborrows$980,000incashfromA.

Onemonthfromtoday
Arepaysthe$1millionparTreasurybondloantoBplus$1,000cashininterestontheloan.Brepaysthe$980,000incashtoAplus$5,000ininterestontheloan.
Neteffect Adelivers$1millionparamountoftheTreasurybondtoA.Bpays$980,000+$5,000–$1,000=$984,000incashtoA.
Description3Today Apurchases$1millionparamountofaTreasurybondfromBfor$980,000incash.Onemonthfromtoday
Bbuysthe$1millionparamountoftheTreasurybondfromAattheprearrangedpriceof$984,000.
The thirddescription,which is knownas a repurchaseagreement, possessessome legal advantages in the event of default. If the party lending the assetdefaults, theotherparty technicallyowns theasset, since itpurchased it ratherthanjustborrowingit,soithasfewerlegalrestrictionsonitsabilitytousetheasset.Ifthepartyborrowingtheassetdefaults,thepartylendingtheasset,sinceit technically sold the asset and received cash as payment rather than just ascollateralfortheborrowing,hasfewerlegalrestrictionsinitsabilitytousethecash.
10.1.3ForwardsAforwardcontractisanagreementtopayafixedpriceonasetforwarddatefora specified amount of an asset.As such, it combines into a single transactionborrowing theassetand thenselling theasset in thespotmarket.Theselleroftheforwardneedstodelivertheassetatafixedforwarddateandprice,exactlyas a borrower of the asset must do. The seller of the forward is at risk forincreasesintheasset'spriceandwillgainfromdecreasesintheasset'sprice,justlike a borrower of the assetwho sells it in the spotmarket. The buyer of theforwardisinthesamepositionasabuyerofaspotwholendsouttheunderlyingassetbutdoesnotneedtofundthecurrencytopurchasetheasset.Sincenocashwillchangehandsuntiltheforwarddate,itdoesnothavethecreditandfundingliquidityrisksthatanuncollateralizedborrowingoftheassetwouldhave.Fromacreditriskstandpoint,aforwardtransactionisverysimilar toaborrowingofthesecuritythathasbeencollateralizedbycash.Credit risk on either a forward or a borrowing collateralized by cash starts
closetozero,butcanbuildupasthemarketpriceoftheunderlyingassetgoesupordown.Managingthiscounterpartycreditriskcanbequitecomplex,astheamountofcreditexposurevariesthroughtimeandiscorrelatedwithmovementsin a market price. We will not be fully prepared to address this issue until

Chapter 14 on counterparty credit risk. For now, we will just note that afrequentlyusedapproachtomitigatethiscreditexposureisthecollateralcall,inwhichtheborrowerandlenderagreeinadvancethatupwardmovesintheassetpricewillrequiretheassetborrowertoincreasetheamountofcollateralplacedwith the lender, and downwardmoves in the asset pricewill require the assetlendertoincreasetheamountofcollateralplacedwiththeborrower.Thiscross-collateralization agreement is an automatic feature of futures contracts, whichareverycloselyrelatedtoforwardtransactions.
10.1.4FuturesContractsFutures contracts are identical to forward contracts in their market priceexposures.Theyalsospecifythepaymentofafixedpriceonasetforwarddateforaspecifiedamountofanasset.Theydifferfromforwardtransactionsintwoprimarydimensions:themanagementofcounterpartycreditriskandthedegreetowhichtheyaretailoredtotradeoffbasisriskversusliquidityrisk.Webrieflydiscussbothaspects.Unlikeforwardtransactions,whicharedirect transactionsbetweentwofirms
orindividuals,futurescontactsarealwaysarrangedtohaveafuturesexchangeasoneofthecounterpartiestoeachcontract.SoifFirmAagreestosell100,000barrels of oil for delivery on June 15, 2015, to Firm B in exchange for $3million, it is technicallybrokenup intoanagreement forA todeliver100,000barrels of oil on June 15, 2015, to the futures exchange in exchange for $3millionandanagreementforBtopay$3milliontothefuturesexchangeforthedeliveryof100,000barrelsofoilonJune15,2015.Thisgreatlysimplifiescreditrisk management for the firms, which do not need to worry about thecreditworthinessofoneanotherbutonlyneedtoevaluatethecreditworthinessofthe futures exchange. This would involve enormous credit managementproblems for the futures exchange since it has credit exposure to every firmtrading on the exchange, but it is managed by strict insistence on continuouscash payments to and from the futures exchange as the prices of the futurestransactions rise and fall (details can be found in Section 14.2). This alsorequiressufficientinitialcollateraltoreducecreditrisktoaminimum.Thishasseveralsignificantimplications.Becauseof thecontinuouscollateralcalls,a firmusingfuturescontractswill
haveconstantinflowsandoutflowsofcashasassetpricesriseandfall.Thishasimportant consequences for both funding liquidity risk and market risk. The

fundingliquidityriskconsequenceis that ifafirmisusingfuturescontracts tooffset transactions thatdonothave thiscash settlement feature, itmay lead tosubstantialfundingneeds.Fordetails,referbacktotheMetallgesellschaft(MG)case in Section 4.2.2. The market risk implication is that the constant cashpaymentscreaterisktotheextentthatpaymentamountsarecorrelatedwiththetime value of the payments—see the discussion on convexity risk in Section10.2.4.Thissystemofcreditriskcontrolrequiresthatthetermsoffuturescontractsbe
standardized with only a few possible delivery dates and assets that can becontracted for. This contrastswith forward transactions,which, as agreementsbetweentwofirms,canbetailoredtoveryspecificforwarddatesandassetstobedelivered. This freedom is permitted by the firms performing their ownmanagementofthecreditconsiderationsofthetransaction.However,thefuturesexchangemust have the ability to quickly close out any contract on which acounterparty cannot meet a collateral call. The ability to quickly close outcontractswithoutasubstantialriskoflossrequirestheliquidityderivedfromafewstandardizedcontractterms.The liquidity that results from this standardization can also be attractive to
potential counterparties whomaywelcome the reduction in liquidity risk thisoffers.With only a few standardized contracts, it is easier to find good pricevaluationsandcloseoutpositionsthatarenolongerdesired.Thepriceoflowerliquidityriskis,asalways,heightenedbasisrisk.Afirmmightdesiretohedgeflowsonparticular dates but need to accept a hedgewithnearby standardizeddates. Itmay also desire to sell short a particular asset—a particular grade ofwheat,say—butneed toacceptahedgewitharelatedstandardizedgrade.Themaintenance of necessary liquidity may require the provision that severalpossible grades be deliverable, which requires formulas for determining howmuch of each grade must be delivered. However, changes in actual marketconditionswilldifferfromanysetformula,resultinginprofitopportunitiesandbasis risks that may need quite complex modeling. For an example, see thediscussionofthemodelingofdeliveryoptionsonTreasurybondfuturesinHull(2012,Section6.2).
10.1.5ForwardRateAgreementsA forward rate agreement (FRA, pronounced “fra”) is a particular type offorward contract in which the asset to be delivered on the forward date is a

borrowing with a specified maturity date, interest rate, and borrower. Forexample, it might be an agreement to deliver two years from today a $200millionone-yeardepositwithBankofAmericapayingan interest rateof6.50percent. This means that in two years the buyer of the FRA will be able todeposit $200 million with Bank of America in exchange for receiving $213million back at the endof the third year: $200million× (1+ 6.50%)=$213million.The standard practice for FRAs is to cash settle, meaning that no actual
depositofcashwithBankofAmericaisexpected;instead,acashamountequalto the value of the deposit will change hands. In our example, if Bank ofAmericaisoffering5.00%onone-yeardepositsattheendoftwoyears,therightto place a deposit at 6.50% is worth 1.50% × $200 million = $3 million.Therefore,theFRAsellerowes$3milliontotheFRAbuyer,whichwillbepaidat the end of the one-year deposit period. (In most, but not all, cases, thepayment will be made when the FRA settles, which is the beginning of thedepositperiod,nottheend.However,thesettlementpricewillbedeterminedbythepresentvalueofthepaymentdue,usingtheprevailingdiscountratesatthetimeofsettlement.Economically,thisisnodifferentinvaluefromreceivingthepayment at the end of the deposit period, but it has the beneficial effect ofreducing credit exposure.) If Bank of America is offering 7.50% on one-yeardepositsattheendoftwoyears,therequirementtoplaceadepositat6.50%hasacostof1.00%×$200million=$2million.Therefore,theFRAbuyerowes$2milliontotheFRAseller,whichwillbepaidattheendoftheone-yeardepositperiod.FRAsarevaluabletoolsformanagingforwardrisksincetheycanbeusedto
lockinborrowingandlendingcostsforfuturetimeperiodsortakepositionsonrates rising or falling. They are almost wholly confined to rates offered oncurrencyborrowingsbyveryhigh-credit-gradebanks,sincetheyhavedevelopedprimarily as tools formanaging the cost of borrowing and lending currenciesratherthantoolsforspeculatingonchangesincreditquality.Themostpopularinstruments are those tied to the deposit rates averaged over a panel of high-grade banks, such as the London Interbank Offered Rate (LIBOR), therebyreducingthelinktocreditqualityevenfurther.Someinterestratefutures,suchas LIBOR futures, are essentially FRAs contracted using futures rather thanforwardstructuring.

10.1.6InterestRateSwapsStandardinterestrateswapsareequivalenttoapackageofFRAs.Averytypicalexamplewouldbeafive-yearswapfor$200millionsettledquarterlywithoneparty paying U.S. dollar LIBOR and the other party paying a fixed rate of6.50%. This is equivalent to a package of 20 FRAs that are settled on eachquarterlydateforthenextfiveyears.Interest rate swaps are extremely flexible instruments that canbe tailored to
specificcustomerneeds.Althoughit is typical that the termsofeachFRAthatconstitutesthepackagewillbethesameonalltermsexcepttheforwarddate,itisquitepossibleforcustomerstoarrangeswapswithrates,depositlengths,andnotionalamountsthatdifferbyperiod.ItisalsoquitecommontocombineFRAsindifferentcurrenciesintoasingleswapandcombineFXforwardsalongwithFRAsintoasingleswap.Tobetterunderstandthecustomermotivationforthesefeatures,itisimportanttounderstandtherelationshipbetweenbondsandinterestrateswaps.Theprimaryinitialdemandforinterestrateswaps,andmuchofthedemandto
thisday,comesfromissuersofandinvestorsincorporatebonds.Mostcorporatebonds pay fixed coupons, as this represents the form popular with mostinvestors.However,bondissuersmayprefertoborrowatafloatinginterestrateratherthanafixedrate,eitherbecausetheybelieveratesarelikelytofallinthefutureorbecausetheybelievefloating-rateborrowingsareabettermatchtotheiroverall asset-liabilityposition.Some investorsmayprefer lendingata floatingrateratherthanatthefixedcoupononabond,eitherbecausetheybelieveratesarelikelytoriseorbecausetheyareprimarilylookingtotakeapositioninthecreditworthinessof the firmanddon'twant tocombine thiswithapositiononwhether risk-free rates will rise or fall. For such clients, a fixed-for-floatingsingle-currencyinterestrateswap,whichisjustapackageofFRAsforasinglecurrency,cantransformafixed-ratebondpositionintoafloating-rateone.Another instance of interest rate swap demand arising out of the corporate
bondmarket occurswhen the currency a firmwould prefer to owe debt in isdifferent than the currency that is preferred by a segment of investors in thefirm's bonds.A typical examplewould be aEuropean firm thatwanted to tapinto investordemand in theU.S.market.The firmmightprefer tohaveall itsdebt in euros, but most U.S. investors prefer to invest in dollar-denominatedbonds. One solution is to have the firm issue a dollar-denominated bond, butthen enter into a cross-currency interest rate swap in which the firm receives

fixed dollar payments equal to the coupon payments it owes on the dollar-denominatedbondandpaysfixedeurocashflows.ThefirmwouldprobablyalsowanttocombinethiswithanFXforwardcontracttoexchangetheeuroprincipalitwants topayon thematuritydateof thebond for thedollarprincipal that itowesonthedollar-denominatedbond.Thiscombinationisastandardproduct,across-currencyinterestrateswapwiththeexchangeoffixedprincipal.Thefirmmightalsowanttomakefloating-rateeurocouponpaymentsratherthanfixed-rateeurocouponpayments for thereasonsgiven in thepreviousdiscussiononsingle-currencyswaps.Rather thanexecute twoseparateswaps, thiscanallbeaccomplished ina single fixeddollar for floatingeurocross-currency swap.Across-currencyswapcanthereforebeacombinationofabundleofFRAsandabundleofFXforwards.Assuch,itcombinesthespotFXriskofFXforwards,theforwardriskofFXforwards,andtheforwardriskofFRAs.
10.1.7TotalReturnSwapsWehavealreadyseenhowacross-currencyswapcancombineFRAandforwardpositions in a foreign currency asset. Total return swaps are instruments thatgeneralize this approach to enable forward positions to be taken in any asset.Insteadofhavinganagreementtoexchangeafixedamountofeurosforafixeddollarpriceonanagreedforwarddate,asmightbethecaseinacross-currencyswap,anagreementmightbemadetoexchangeafixedamountofanassetsuchasabondorstockforafixeddollarpriceonanagreedforwarddate.Themostcommonformof total returnswapcalls for thefollowing.PartyA
makesaseriesofintermediatepaymentstoPartyB,usuallytiedtointermediatecouponpaymentsorstockdividends.PartyAdeliversanasset toBonafixeddateforafixedprice.Finally,PartyBmakesaseriesofintermediatepaymentstoA,usually tiedtoafundingindexsuchasLIBOR.Thisformof totalreturnswap is economically equivalent to a forward transaction. Like a forward, itcombinesintoasinglebundlethespotsaleofanassetandtheborrowingofthatasset for a fixed term.However, although a forward bundles together the saleprice andborrowing costs into a single final fixedprice, the total return swapmakestheintermediateborrowingcostsmoreexplicit.Onemajorcontractualdifferencebetween total return swapsand forwards is
that a total return swap can be used by a party that might otherwise find itdifficult, for legal or institutional reasons, to invest in a particular asset class.Althoughtheforwardcontractgenerallycallsfortheactualdeliveryoftheasset

on the specified forward date, the total return swapwill often call for a cashsettlementbasedon thevalueof theasseton the specifieddate.Thiscanbeanecessity for a party that cannot legally own the asset (for example, the partymaynothaveasubsidiaryinthecountryinwhichtheassettrades).Thiscanstillbeagreatconvenienceforapartythatcanlegallyowntheassetbutmaynotbewellpositioned to trade it. Ineffect, it iscontractingout to theotherparty theactualsale,whichmakessenseiftheotherpartyisamajormarketplayerinthisassetoriftheassetisactuallyaparticipationinaportfolioofassets.Thedownsideofthisarrangementisthatitcanleadtodisputesastowhatthe
actualsettlementpriceshouldbeincaseswherethereisnotapubliclyavailableand reliable pricing source. So although it may be easy to agree that thesettlement of a basket of stocks traded on the New York Stock Exchange(NYSE)willendupatthepublishedclosingexchangepricesfortheday,itmaybenecessary tobuildelaborate legalprocesses for the settlementof abondoflimitedliquidity.(Forexample,theprocessescouldinvolveanappealtoapanelofothermarketmakersortherightofthepartyreceivingthevalueofthebondtotakephysicaldeliveryintheeventoffailingtoagreeonacashprice.)Theprimaryinitialimpetusforthetotalreturnswapmarketcamefromparties
wantingtopurchaseassetstheywouldhavedifficultyholding.Theywereassetstheyeithercouldnotlegallyholdorwouldhavedifficultytrading,leadingtothedemand for a cash settlement discussed previously, or assets theywould havedifficultyfunding.Afirmwantingtopurchaseabondwithahighercreditgradethan thatof thefirmcouldface thenegativecarrycostsofhaving to fundatahigher credit spread than it can earn on the bond.To avoid this situation, onemust find a way to borrow against the collateral of the security, as discussedpreviously in Sections 10.1.1 and 10.1.2. The total return swap offers theconvenienceofbundlingpurchasestogetherwithalocked-inborrowingcostfora fixed period. Collateralization is not required since the asset will not bedelivereduntiltheendoftheborrowingperiod.Anotherexampleoffundingdifficultywouldbeafirmwithasufficientlyhigh
credit grade that is under regulatory pressure to reduce the size of its balancesheet. If it can find another high-credit-grade firm that is not under similarregulatorypressure,itcan“rentthebalancesheet”oftheotherfirmbyenteringintoatotalreturnswap,althoughitmustexpecttopayfortheservice.Many of the suppliers of total return swaps to parties wanting to purchase
assetstheywouldhavedifficultyholdingsimplypurchasetheassetandholdituntilthescheduleddeliveryorcashsettlement.Theyarebeingpaidtoprovidea

service,asamarketmakerabletoskillfullyexecutepurchasesandsalesatgoodprices, an efficient provider of a desired portfolio of assets, a firmhaving thelegalstandingtoholdassetsofadesiredcountry,orafirmwithahighercreditstandingandlowerfundingcostsormorebalancesheetroom.However,asthemarket has evolved,many suppliers are also using thismarket as an efficientmeansofborrowingassets inwhichtheywantashortspotposition.Aswithaforward, the total return swap provides convenient bundling of the assetborrowingandshortsaleintoasingletransaction.Forexample,afirmwantingtogainonapricedeclineofaspecificbond,eitherbecauseofamarketvieworbecausethisoffersahedgeagainstthecreditexposurethefirmhastothebondissuer, canenter into a total return swap inwhich it needs todeliver thebondforward(orequivalentlycashsettle)andthensimplydoesnotholdacashbondagainstthisforwardobligation.
10.1.8Asset-BackedSecuritiesIngeneral,anasset-backedsecuritycanbeviewedasanalternative instrumentto total return swaps in taking on exposures to asset classeswhere the actualmanagementof theexposure isdesired tobe left toanotherparty.Thereasonswhy this might be desirable could be copied almost verbatim from Section10.1.7. The use of asset-backed securities rather than total return swaps in aparticular situation is largely a matter of how documentation andcollateralizationoftheswapagreementarehandled.When a particular total return exposure is expected to have a fairly broad
appeal toaclassof investors, itmaybedesirable tostandardize the termsandoffer the exposure through a security rather than a swap. This eliminates theneed to individually negotiate swap terms since a single document covers thetermsofthesecurity,butthetrade-offisalossofflexibilityinfittingtermstoanindividualinvestor.Theuseofasecuritystructureforcesinvestorstoinvestcashup front, a convenient solution to collateralization concerns, particularlywhenthe number of investors is potentially too large to make the negotiation ofindividual credit coverage attractive. Of course, the disadvantage is thatinvestorsmusttieupcashinthetransaction,butinreturntheygetastandardizedsecurity that can be sold or pledged as collateral. By contrast, it is hard totransfer ownership of a swap position since your counterparty on the swap,whichdidnotplacecashupfront,mayobjecttothecreditworthinessofthenewpartytowhichyouwanttotransferownership.
Thecashnatureoftheinvestmentprotectsthepartymanagingtheassetsfromcreditconcerns.Investorsgetcreditprotectionbyhavingtheassetsonwhichtheexposurewillbe takenplaced insomeformof trust, thereby immunizing theirpayofffromdefaultonthepartofthepartymanagingtheassets.Thisleadstoapotentialproblemintheflexibilityofasset-backedsecuritiesinrelationtototalreturnswaps. Ifassetsneed tobewalledoff ina trust, thenhowcanamarketmakeruse this as avehicle for taking a short saleposition in the asset, asweshowed can be donewith a total return swap? The solution is to have a totalreturn swap as an asset placed with the trust and sufficiently collateralize orprotectitbythird-partyinsurance.Asset-backedsecuritieslendthemselvestopoolingpositionsinalargenumber
of similar assets, such as mortgages, credit card outstandings, loans tobusinesses, or bonds. The standardized nature of the documentation is wellsuitedtothesharingofexposurebyalargenumberofinvestorsinalargepoolofassets,therebydecreasingtheeventriskofeachinvestorowningaparticularblockof assets.However, this ismoreamatterof convenience thannecessity,andvirtuallyanyfinancialpositionthatcanbeachievedthroughanasset-backedsecuritycanalsobeachievedthroughatotalreturnswap.Whenmortgagesandloansarepooledtocreateanasset-backedsecurity,itcan
be structured so as to virtually eliminate credit exposure to the underlyingmortgages and loans by investors in the asset-backed security, or it can bestructuredtohavethiscreditexposurebepartoftheriskbornebytheinvestors.Riskmanagement aspects of asset-backed securities forwhich credit exposurehas been eliminated will be discussed in Section 12.4.6. Risk managementaspectsofasset-backedsecuritiesthatinvolvecreditexposurewillbediscussedinSection13.4.3.Table 10.2 summarizes the difference in risk between the different types of
instruments through which forward risk can be taken. Spot risk refers to theunderlying asset. Forward risk is always present for the underlying asset, butmayormaynotalso involveforwardrisk inacurrency(in thecasewhere theunderlyingassetisacurrency,thequestioniswhetherforwardriskinasecondcurrencyisinvolved).Creditriskrefersonlytocreditrisktothecounterpartyonthe instrument, not to any credit risk embedded in the underlying asset. Thedistinctionbetweenthelenderandborrowerreferstotheirpositionrelativetotheunderlyingasset.TABLE10.2ComparisonofRisksinForwardTransactions


10.2MATHEMATICALMODELSOFFORWARDRISKS
Themostimportantfactaboutthemathematicalmodelsusedtomanageforward

riskisthattheyrelyononeverysimpleprinciple:aflowonagivendateowedbyaparticular entity shouldbe regardedas absolutely equivalent to anyotherflowof thesamequantityon thesamedateowedby thesameentity(the termflowisusedratherthancashflow,sincewewanttoconsidermoregeneralcasesthancashpayments,suchasanentityowinganamountofgoldoroil).Atfirstglance, thismaylooklikeatautology,astatementtruebydefinition.
Anditisclosetoone,whichhelpstoexplainwhypractitionersagreesowidelyonthemodelsusedtomanageforwardrisk.However,itisnotquiteatautology—a reminder that mathematical finance deals with market realities, nottheoreticalabstractions.Whentheproducta trader isdealingwith isactuallyacomplicated bundle of flows on a large number of different dates, it is notimmediatelyclear thatbreaking thevaluationapart intomanydifferentpieces,few of which can independently be priced in the market, is the best way toproceed.Indeed,afewdecadesago,objections to thispracticewerestillbeingraised along the lines that it would be very expensive in terms of transactioncostsforatradertoactuallyhedgetheinstrumentinthisway.Bynow,everyoneinvolvedhascometoappreciatethattheprinciple,farfromcausingtraderstotryto aggressively rehedge each piece of a deal, is actually a powerful analyticaltoolthatenablesverycomplextransactionstobemanagedinawaythatpermitsamaximumamountofnettingofrisksbeforeresortingtoaggressivehedging.Weneedtoexaminewherethecomplexitiesinthisapproachlieinordertosee
what residual risks still need to bemanaged. Before turning to the hard part,however, let's first take a few moments to appreciate some of the benefitsentailedbythesimplicityofthisapproach.Onebenefitisthecomputationalsimplicityofthemethod.Theactualbundles
of forward transactions that trade in the market can have very complexstructures.Ourfundamentalprinciplesaystoignoreallthesecomplexities;justcalculate the individual flows that have been bundled together, calculate thepresentvalueofeachflowinisolationfromtheothers,andthensumthepresentvalues. It is not necessary to devise special methods that apply to particularcases, a feature that hobbledmany of the methods that were used before thefundamentalprinciplewasgenerallyadopted.A second benefit is the generality of the principle. The same computational
methodcanbeusedforcashflows,commodityflows,bonds,swaps,forwards,futures,risk-freedebt,riskydebt,andobligationstodeliverstock.(Pleasenotecarefullythatthisisnotsayingthatthismethodcanbeusedforvaluingstocks,sincestocksinvolveunknownfutureobligationsratherthanknownflows;what

isbeingsaidisthatanobligationtodeliverafixednumberofsharesofastockinthefuturecanbetranslatedintoanequivalentamountofsharesofthestocktobe delivered today.) The same computational method can be used to valueindividualtransactionsorportfoliosoftransactions,sinceeachcanbereducedtothe summationof a setof individual flows, and thereforecanalsobeused forvaluing total return swaps or asset-backed securities tied to portfolios oftransactions.A third benefit is thatwhen all transactions are completely reduced to their
respective constituent obligations, you are free to describe transactions inwhatever manner is most convenient in a given context. When discussing aphysicalcommoditysuchasgold,itisoftenconvenientjusttothinkintermsofequivalentquantities; forexample,youarewilling to trade100ouncesofgoldfor delivery today for 102 ounces of gold for delivery in one year. Whendiscussingacurrency,youmightprefertotalkabouttheinterestratetobepaid—say,6percentforoneyear.Althoughthisisjustadifferentwayofsayingthatyouarewillingtotrade$100fordeliverytodayfor$106fordeliveryinoneyear,theinterestrateviewisofteneasiertounderstandusingeconomictheory.Whendoing computations, it is usually best just to think of discount factors to bemultipliedbyeach flowand then summed toget anetpresentvalueequation.When checking the reasonableness of a given set of input parameters to themodel,itisoftenmostconvenienttothinkintermsofinterestratesthatapplytodistinctforwardtimeperiods—theratethatappliestoaparticularmonth,week,or day. Improbable inputs can bemore easily spotted if you can see that theyimplythatarateof20percentononedaywilloccurinbetweena7percentrateontheimmediatelyprecedingandfollowingdays.Formulas for translating from discount factors to zero-coupon interest rates,
par-coupon interest rates, or forward interest rates and back again are readilyavailable, as should be expected fromour general principle.You are probablyalreadyfamiliarwiththeseformulas.Ifnot,consultHull(2012,Chapter4).TheRates spreadsheeton thewebsite for thisbook illustrates the techniques
for valuing a portfolio of flows based on a given set of forward rates. Theforward rates are translated into equivalent zero coupon rates, par rates, anddiscount factors. Each set of flows, which might correspond to a forward, aswap, a bond, or any of the other instruments discussed, is broken up into itsindividualflows.Foreachindividualflow,adiscountfactorisdeterminedbasedoninterpolationfromthediscountfactorsderivedfromthegivenforwardrate.Eachindividualflowis thenmultipliedby itsdiscountfactor,and thesevalues
aresummedovertheportfolio.The interpolation methodology used in this spreadsheet for illustrative
purposesisasimplelinearinterpolation.Inpractice,morecomplexinterpolationmethodologiesareoftenused.TuckmanandSerrat(2012,Chapter21)presentsagoodintroduction.Thesamespreadsheetwillbeusedelsewhereinthischaptertoillustratehow
toderivea setof forward rates that canmatchagiven setofobservedmarketprices and to demonstrate the calculation of risk statistics for a portfolio offlows.Having postponed looking at complexities, it's time to face up to the task.
Basically,thisdiscussioncanbedividedintofourtopics:1.Section10.2.1.Models are needed to perform interpolation from flowsforwhichmarketpricesareavailabletootherflows.2.Section10.2.2.Modelsareneededtoextrapolatepricesforlonger-datedflows.3.Section10.2.3.Insomecases,goingfromflowpricestobundlepricesisnot as simple as the general approach. This is because some productsinvolveflowsrepresentingapromiseddeliverythatisactuallyapromisetodeliver a future flow (for example, a forward purchase of a bond).Untanglingtheseflowsinvolvessomecomplexities.4. Section 10.2.4. Although the method is designed to handle fixedobligations, it can be applied to a very important class of nonfixedobligationswithjustabitofwork—flowsthatwillbedeterminedbycertaintypes of indexes. However, this extension must be performed with care;otherwise,asignificantsourceofriskcanslipinunidentified.
10.2.1PricingIlliquidFlowsbyInterpolationAswaspointedoutatthebeginningofthischapter,thelargenumberofdaysonwhichfutureflowscanoccurmakesitalmostcertainthatliquidquotationswillbeavailablefromthemarketforonlyasmallportionofpossibleflows.Creatingprice quotes for all possible flows will require some theory that enables theinferenceofpricesofilliquidflowsfrompricesofliquidflows.Wewillpresenttwotheories:
1. The interpolation of the price of an illiquid flow from prices of liquidflowsthatarebothearlierandlaterthanit.

2. A stack-and-roll methodology for pricing flows that have longermaturitiesthananyflowswithliquidprices.Themathematicsofinterpolationissosimplethatitcanbeeasytolosesight
of the fact that interpolation is a financialmodel to the same degree asmorecomplex options models. It shares the same characteristics of being amethodology for predicting future financial events, requiring well-thought-outassumptions about the financialmarkets as grounds for choosing one possiblemethodologyoveranother,andbeingasourceofpotentialearnings loss to theextentfutureeventsdivergefrompredictions.When the modeling nature of interpolation is not kept clearly in mind, the
choiceofinterpolationmethodcanbemadebasedonaestheticcriteria,asifitisjustamatterofindividualtastewithnofinancialconsequences.Soletusbeveryspecificaboutfinancialassumptionsandthefinancialconsequencesofchoices.Consider the following example, which is typical of the circumstances in
whichinterpolationneedstobeemployedinpricingforwardflows.Youneedtopriceaforwardflowoccurringin6½yearsinamarketinwhichliquidpricescanbeobtainedfor6-and7-yearflows,butnothinginbetween.Letussupposeyouchoosetopricethe6½-yearflowastheaverageofthepricesofthe6-and7-yearflows.Ifyouputonahedgethatconsistsof50percentofthe6-yearflowand50percentofthe7-yearflow,youwillbeperfectlyhedgedintheshortrun,sinceatfirstchangesinthedailymarkofthe6½-yearflowwilljustreflecttheaverageofchangesinthedailymarkofthe6-and7-yearflows.Thesamewouldbetrueofanyotherinterpolationmethodchosen(forexample,25percentofthe6-yearflowand75percentof the7-yearflow)as longasyoumatchthehedgeto thechoseninterpolationmethod.Thetestofthehedge'seffectivenesswillcomethroughtime.Howwellwillit
hold up as flows come closer to maturity, encountering the denser pricequotations that exist (in all forward markets) for nearby flows? If, in thisexample,liquidpricesareavailablefor2-,1½-,and1-yearflows,thenthehedgewillproveeffectivetotheextentthatthe1½-yearflowispricedattheaverageofthe1-and2-yearflowsatthetimefiveyearsfromtoday,whenitwillbepossibleto unwind the trade and its hedge at these liquid prices. To the extent theinterpolatedvaluediffersfromtheactualvalueatunwind,anunexpectedloss,orgain,willresult.Notethattheunwindvaluesaredeterminedbytherelationshipbetween 1-, 1½-, and 2-year flow prices five years from now. The currentrelationshipbetween1-,1½-,and2-yearflowpricescannotbelockedintoandplaysnoroleotherthanservingasahistoricalobservationtouseinforecasting

futurerelationships.An interpolation methodology needs to be judged by the stability of the
valuationsitwillleadto.Tradingdesksdevelopafeelovertimeforhowstablethevaluationsproducedbyparticularinterpolationtechniquesareinaparticularmarket. Historical simulation can be used as a quantitative check on thesejudgments. (Exercise 10.1 takes you through a test of some possibleinterpolation methods judged by their degree of instability around historicalprice quotes.) The potential valuation errors determined by simulation can becontrolledthroughlimitsandreserves.Themostimportantlessonstobedrawnare:
Interpolation,likeanyothermodel,representsajudgmentaboutwhatismostlikelytooccurinthefuture.Totheextentthejudgmentiswrong,unanticipatedfuturelossesandgainswillresult.Thekeyeventthatneedstobeprojectedbyaninterpolationmodelisdeterminingtheactualrelationsbetweenpricesforflowsatafuturedatewhenmoreliquidunwindsarepossible.Historicalrelationshipsbetweentheseliquidflowscanbeusedasinputstoandtestsofjudgmentsaboutfuturerelationships.Limitsandreservescanbebasedonmeasuredhistoricalinstability.
Thepreferenceusually shown for interpolations thatproducesmoothpricingcurves can be explained by two complementary facts: historical relationshipsbetweenmost liquid flows tend to showsmoothpricingcurves, andeconomicintuitionaboutfutureeventstendstowardlong-termtrendswithoutabeliefthatat somespecific futuredateasharpchange inconditionswilloccur.However,theseareonlygeneraltrends,notrules.Ifsomespecificdatesmaybebelievedtohave forecastable effects, you should expect to see patterns, such as seasonalpatterns, reflected in the interpolations. For a discussion of the impact ofseasonalpatternsondifferentforwardsmarkets,seeSection10.3.4.Thechoiceofwhichvariablestointerpolate,whethertheyarediscountprices,
zero rates, or forward rates, is inone sense arbitrary sinceweknow that eachwayof representingpricesof forwardflows ismutually translatable.However,interpolation using one representation may turn out to be more natural thaninterpolationusingadifferentrepresentationbasedontheeconomicmotivationsupportingtheinterpolationmethodchosen.One approach that would follow naturally from our discussionwould be to
chooseaninterpolatedvaluethatminimizesaselectedsmoothnessmeasurefor

forward rates or zero coupon rates.Methods that are utilizedonmany tradingdesks,suchascubicsplines,havebeenjustifiedonformalorinformalargumentsalongtheselines.Anotherapproachthatisfairlywidelyusedistointerpolatethelogarithm of the discount factor. Table 10.3 shows how this works, with theresultingzerocouponratesandforwardrates.TABLE10.3InterpolationBasedontheLogarithmoftheDiscountFactor
As shown inTable10.3, the impact of this interpolationmethod is to use aconstant forward rate in all subperiods of the period between two alreadydetermined discounts. This method is generally favored by traders withbackgroundsintheforwardsandfuturesmarketswhobelievethat“allyoureallyknowisthequotedforward.”Soifyouhaveaforwardrateagreementthatrunsfromtheendofmonth9totheendofmonth12of7percentandnoothermarketobservationsinthisvicinity,thismethodwouldassignforwardratesof7percentto thesubperiods from theendofmonth9 to theendofmonth10, theendofmonth10totheendofmonth11,andtheendofmonth11totheendofmonth12.Butwhat do you do if you have a 7 percent depositmaturing at the end of
month3and8percentFRAfromtheendofmonth3totheendofmonth6,andyouarelookingtopriceaFRAfromtheendofmonth3totheendofmonth4?Themethodologysaysuse8percent,butmostpractitioners'economicintuitionsays therateshouldbe lower than8percent,since it seemsas if themarket isanticipating rising rates over the period. Most traders make some kind ofexceptionwhenratesarechangingthissharply,butaninterpolationmethodologytiedtoasmoothnessmeasurehastheadvantageofbuildingonthisapproachinamoregeneralsetting.Computationally, it would be convenient if a definitive set of flows was
availableforwhichliquidpricescouldbeobtainedonthebasisofwhichprices

forallotherflowscouldbeinterpolated.Thisisrarelytruefortworeasons:1.Priceliquidityisamatterofdegree.Someinstrumentshavepricesthatarelessliquidthanothersbutstillshowsomeliquidity.Therefore,theseshouldbe given lessweight in determining the discount curve, but should not becompletelyignoredinsettingthecurve.2. Prices are often not available for single flows, but are available forbundlesofflows—forexample,coupon-payingbondsandfixed-for-floatingswaps.Ifenoughliquidflowpricesareavailabletointerpolatepricesforallbut the last of the flows in a bundle, then the common technique ofbootstrapping(seeHull2012,Section4.5)canbeusedtofirstpricealltheflowsexcept the last and thenderive thepriceof the last flow from theseprices and the price of the bundle. However, often not enough prices areavailable to value all but the last flow. For example,many bondmarketshave a liquidprice for a 7-and10-year bond, but haveno liquidprices inbetween.Toderiveavaluefortheflowsoccurringintheeighth,ninth,andtenthyears, it isnecessarytocombineinterpolationandpricefittingintoasinglestep.The Rates spreadsheet on the book's website provides a sample discount
curve-fittingmethodologythatisverygeneralinallowingtheoptimizationofaweightedmixtureoftheaccuracyoffittingknownliquidpricesanddeterminingaforwardratecurvethatfitscloselytoanexpectedsmoothnesscriterion.The optimization method simultaneously determines all the discount rates
needed tomatchallof themarketpricesof instruments thatcanpotentiallybepriced off a single discount curve. All these discount rates are taken as inputvariables in the optimization. The objective function of the optimization is acombinationoftwomeasures.Thefirstisameasureofhowcloselythederivedpricecomestothemarket-quotedpriceforeachinstrument,andthesecondisameasureofhowsmooththediscountcurveis.Themeasureofclosenessof fitof thederivedprice to themarketquotecan
takeseveralforms.Thespreadsheetusesaverysimplemeasure,asummationofthe square of the differences between the derived price and themarket quotesummedover all instruments.Each ismultiplied by a selectedweight.Higherweights are assigned tomore liquid prices, and lowerweights are assigned toless liquidprices.Thisplaces agreaterpremiumoncomingclose to themorereliablepriceswhilestillgivingsomeinfluencetopricesthathavesomedegreeof reliability. Greater complexity can be introduced, such as placing a higherweightondifferencesthatareoutsidethebid-askspread.Themostextremeform

of this approachwould be to introduce constraints that require that the fit bewithinthebid-askspread(thisisequivalenttoplacinganextremelyhighweightondifferencesoutsidethebid-askspread).Thedesirabilityofputtingsuchahighweightonthebid-askspreaddependsonyouropinionofthequotationsyouareobtaining, how prone they are to error, and whether you really can count onbeingabletogettradesdonewithinthebid-askrange.Themeasureofthesmoothnessofforwardratesusedinthespreadsheetisalso
averysimpleone:tominimizethesquaresofseconddifferencesoftheforwardrates.Thismeasuressmoothnessbasedonhowclosetheforwardratescometoastraight line, since a straight line has second differences equal to zero. (Forexample, the sequence 7, 7.5, and 8, which forms a straight line, has firstdifferencesof7.5–7=0.5and8–7.5=0.5,andthereforeaseconddifferenceof0.5–0.5=0.Thesequenceof7,7.25,and8,which isnot linear,has firstdifferencesof0.25and0.75andthereforeanonzeroseconddifferenceof0.5.)Practitioners may use more complex measures of smoothness, such asminimizingsecondderivatives.Differentweightscanbespecifiedforhowimportanttheclosenessofpricefit
is relative to the smoothness of the discount curve. This is just one moreappearanceofthetrade-offbetweenbasisriskandliquidityrisk.Thelowertheweightputonsmoothnessand themoreeven theweightputonfittingeachofthe instruments, the greater the assurance that the discount curve producedmatchesexactly theobservedmarketpricesof all instruments.Thisminimizesbasisrisk,butincreasesliquidityrisk.Ifitturnsoutthatyoureallycannotcloseoutoneofthesepositionsatthepriceobtainedfromthemarket,youcouldhavesignificantlosses,sincethepriceyouusedforvaluationwasbasedonlyontheassumedmarketprice,evenifthisdifferedagreatdealfromthepricethatcouldbeobtainedbyhedgingwithmoreliquidinstruments.Conversely,thehighertheweightputonsmoothnessandthemoreweightputonmoreliquidinstruments,thegreatertheassurancethatyouarepricingoffhedgesthatarebasedonliquid,achievable prices. Thisminimizes liquidity risk but increases basis risk, sinceyou are now pricing off hedges that can be achieved with combinations ofnearbyinstrumentsinthemarket.The same guidance we have given for testing the financial impact of
interpolationrulescarriesovertotestingthefinancial impactofproceduresforextracting a discount curve from a set of liquid prices. Historical simulationshould be used to estimate the stability of valuations that will result from acandidate procedure. Figure 10.1 illustrates the degree to which greater

smoothnessofforwardcurvescanbeachievedwiththeoptimizationprocedurejust discussed thanwith a simple version of the bootstrapping technique.Thissimpleversion isused inHull (2012,Section4.5)and isusedonanumberoftrading desks; theBootstrap spreadsheet gives details of this comparison. Torepeat, the degree of importance of the greater smoothness resulting from theoptimization is not to be found in aesthetic pleasure, but should bemeasuredquantitativelyinfinancialimpact.
FIGURE10.1ComparisonofForwardRatesfromBootstrappingandOptimalFitting
We have been assuming that all the instrument prices can be completely bedetermined by discount prices. However, some instruments could have optionfeatures,suchascallablebondsor futures, thathaveanonlinearcomponent totheir price. This can be handled by subtracting the option component of theprice, leavingapurenonoptionportion thatcanbepricedoff thediscounts.Acomplexity is that the option component price may depend in part on thediscountcurve.Aniterativeprocessmightbeneeded.Optioncomponentsbasedon a first approximation to discounts can be used to get the inputs to theoptimization, which yields a discount curve. This is then used to reprice theoption components. These can be used as inputs to a second round ofoptimization. This cycle can be repeated until the discount curves producedstabilize.

When developing discount factors, it is important to remember that everyobligorwillhaveitsownsetoffactors;apromisetodeliveraflowonagivendatewillbeworthsomethingdifferent,dependingonhowreliable thepromiseis.There evenneed tobemultiple setsofdiscount factors forpromisesof thesameobligorsincesomedebtsareseniortoothersandwillmorelikelybepaidincaseofadefaultcondition.Before thismultiplicity of sets of discount factors seems too overwhelming,
let'sintroduceanoteofsimplification.Itisrarethatthetypeofflowowedplaysanyroleindeterminingtheprobabilityofpayment.Ifyoucanobserveasetofdiscountfactorsforafirmrelativetothediscountfactorsfortheassureddeliveryofoneasset,youcaninferthediscountfactorsforthatfirmfordeliveryofanyother asset. However, this rule has exceptions. If the government of Mexicoowesyouadebtdenominatedinitsowncurrency,thepeso,youwouldcertainlyapplyadifferentdiscountfactorthantoitspromisetopayadebtdenominatedinanother currency.Mexicohas control over the supplyof its owncurrency andcancreatenewcurrencytomeetitspayments.Ithasnosuchabilityinanothercurrency, and although it could create new pesos and exchange them for thecurrency owed, thismight have a severe enough impact on the exchange ratebetweenthecurrenciestocall intoquestionthecountry'swillingness,andevenitsability,todoso.As the procedures forminimizing credit exposure to a counterparty become
more complex, involving collateralization, netting, and margin calls, amongother techniques, it becomesmore difficult to represent the credit exposure indiscounting procedures. Any oversimplification should definitely be avoided,such as discounting the flows owed by A to B on a swap at a discount rateappropriateforA'sobligationsandtheflowsowedbyBtoAonthesameswapat a discount rate appropriate toB's obligations.This treats thegross amountsowed on the swap as if they were independent of one another, completelyignoring a primary motivation for structuring the transaction as a swap—thenettingofobligations.Ascreditexposuremitigationtechniquesgrowinsophistication,theydemand
a parallel sophistication in valuation technology. This consists of initiallytreatingallflowsonatransactiontowhichcreditexposuremitigationhasbeenappliedasiftheywereflowscertaintobereceived.Theactualcreditexposuremust thenbecalculatedseparately, taking intoaccount thecorrelationbetweenthenetamountowedandthecreditworthinessoftheobligor.Thismethodologyismorecomplexthanwecantackleatthispointinthebook.Wewillreturnto
thistopicinSection14.3.
10.2.2PricingLong-DatedIlliquidFlowsbyStackandRoll
An issue that arises frequently formarket-making firms is theneed toprovidevaluetocustomersbyextendingliquiditybeyondtheexistingmarket.Thisneedarisesnotonlyforbondsandsingle-currencyswapsandforwards,butalsoforFX forwards and commodity forwards. A concrete example would be a firmtryingtomeetcustomerdemandfor40-yearswapsinamarketthathasliquidityonlyforswapsoutto30years.To see the actual profit and loss (P&L) consequences of amethodology for
pricing these longer-term flows, we need to consider a well-known tradingstrategy:thestack-and-rollhedge.Inourexample,astack-and-rollhedgewouldcallforputtingona30-yearswapintheliquidmarketasahedgeagainsta40-yearswapcontractedwithacustomer.Then,attheendof10years,the20-yearswap towhich the30-year swaphasevolvedwillbeoffsetandanew30-yearswap in the liquid market will be put on, which will completely offset theoriginal40-yearswap,whichis,atthispoint,a30-yearswap.Thisstack-and-rollstrategycanbecharacterizedasaquasistatichedgeinthat
itrequiresonefuturerehedgeattheendof10years.Theresultsofthisrehedgecannotcurrentlybeknownwithcertainty,eitherastothetransactioncosts(thatis, bid-ask spread) or as to the impactwithout transaction costs.However, thefact that only a single rehedge is required allows for great simplification inestimating the expected cost of the hedging strategy and its statisticaluncertainty. These features recommend using themethodology to quantify thecostandriskofthelonger-termposition.To carry out a numerical example, assume that today's 30-year yield is 6.25
percent.Sinceyouareplanningtorollattheendof10yearsfroma20-toa30-year yield, to the extent you expect yield curve shifts to be predominantlyparallel,youshouldenterintoaduration-weightedhedgeof1.19230-yearswapsforevery40-yearswapyouaretryingtocreate.Thenumber1.192istheratioofa30-yearswapduration(13.40)toa20-yearswapduration(11.24),assuminga6.25percentannualparswaprate.Toestimatetheimpactoftheroll,youshouldlookatthehistoryoftherelationshipbetween20-and30-yearswaprates.If30-yearswaprates tend tobe5basispointshigheronaverage than20-yearswaprates plus orminus a standard deviation of 7 basis points, and if youwant to

keepareserveagainsta two-standard-deviationadversemove,youcouldmarkthe40-yearswaptoarateof6.25%+0.05%=6.30%andsetupa14-basis-pointreserve.Ifhistoricalanalysisshowsthat30-yearswapratesminus105%of20-year swap rates have a lower standard deviation (say, 5 basis points) than anunweighted spread,because20-year rates aremorevolatile than30-year rates,youcouldsetupahedgeratioof1.192/1.05=1.135andsetupa10-basis-pointreserve.Theactualhedgingpracticeonatradingdeskmightbetoinitiateastackand
roll, but it would probably be flexible as to the time at which the roll wasactually carried out. The roll could take place at the end of 10 years, but thetradingdeskmight,at that time,decideitwasmorefavorabletodefer theroll,sincetherollcouldjustaswellbecarriedoutatothertimesusingequallyliquidinstruments—forexample,rollattheendof20yearsfroma10-yearswapintoa20-yearswap.Thetradingdeskmightalsodecide,opportunistically,torollintoalessliquidinstrument.Forexample,aftertwoyears,theopportunitymightariseinwhichabidisavailablefora38-yearswapthatwouldcloseouttheremainingtermofthe40-yearswap.Inthiscase,thedeskwouldalsoneedtolookfora28-yearswaptocloseouttheremainingtermofthe30-yearswapitwasusingasahedge.Although a trading deskwillwant to retain flexibility inmanaging a stack-
and-roll strategy once it is entered into,modelers and riskmanagers can bestachieve their aims by assuming a fixed-roll strategy that involves liquidinstruments.Byconsideringastrategythatinvolvesliquidinstruments,itshouldbepossibletogetveryreasonabledatahistorythatbearsontheprobablecostofthestrategy.If20-and30-yearswapshaveliquidmarketquotesavailable,itmaybepossibletoobtainseveralyears'worthofdailydataonthecostofrollingoutofa20-yearswapintoa30-yearswap.Thisdatacanbeusednotjusttodecideonanexpectedrollcost,butalsotodetermineaprobabilitydistributionofrollcosts. The probability distribution can give reasonable estimates of theuncertainty of results, which can serve as an objective basis for establishinglimitsandreserves.Theadvantagesofthismethodforriskmanagementare:Appropriatehedgeratioscanbebasedonhistoricaldatasincedifferentpossiblehedgeratioscanbejudgedbasedontherelativedegreeofhistoricaluncertaintyofrollcost.Themethodmakesacleardistinctionbetweentheportionoftheexpectedcostofcreatingalong-terminstrumentthatcanbelockedintoatcurrent
marketpricesversustheportionthatrequiresprojections.Inthisexample,theportionthatcanbelockedintoisthecurrent30-yearrate,andtheportionthatrequiresprojectionisthespreadbetweenthe30-and20-yearratesatthetimeoftheroll(in10years).Thisapproachgivesasolidfinancialfoundationforwhatisoftenalooseintuitiveargumentalongthefollowinglines:“Thecurrent20-to30-yearportionoftheyieldcurveisflattoslightlyupwardsloping,sotopricethe40-yearswapatthesameyieldasthecurrent30-yearswapisconservativerelativetoextrapolatingthe20-to30-yearupwardslopeoutto40years.”Thisapproachmakesclearthatwhatmattersisnotthecurrent20-to30-yearrelationship,buttheprojectedone,whichcanprobablybestbeestimatedbasedonalongerhistoryofthisrelationship.Estimatesofuncertaintyforestablishinglimitsandreservescanbebasedonreadilyobservablehistoricalmarketdata.Futureliquiditycosts,suchasthepotentialpaymentofthebid-askspread,areconfinedtoasinglepointintime.
Exercise10.2takesyouthroughsomesamplecalculationsusingthestack-and-rollmethodology.
10.2.3FlowsRepresentingPromisedDeliveriesLetusconsideratypicalexampleofaproductinvolvingaflowthatrepresentsapromiseddeliveryoffutureflows.Amarketmakerisaskedtoquoteapriceforathree-yearU.S.Treasurybondtobedeliveredinsevenyears(let'sassumeweareworkingwithzerocouponinstrumentsforthesakeofsimplicity—theprinciplesforcoupon-payinginstrumentsarethesame).IftheU.S.Treasuryweretryingtocreatesuchaforward,itwouldbeeasy.TheTreasurywouldvaluetheforwardasa reduction in its need for 10-year borrowing and an increase in its need forseven-year borrowings, both of which can be valued off the standard U.S.Treasurydiscountcurve.However,amarketmakerhasalowercreditratingandhencehigherborrowingcosts than theU.S.Treasuryhas. If themarketmakertries to create the forward by buying a 10-year instrument, the price itwouldneedtochargefortheforwardwouldbeburdenedbysevenyears'worthofthecreditspreadbetweentheTreasuryandthemarketmaker.Toavoidthis,themarketmakerneedstofindawaytoborrowforsevenyears
atessentiallyaU.S.Treasuryrate.Sinceithasthe10-yearTreasurypurchasedtoput up as collateral against its seven-year borrowing, this should be feasible.

However, it is an institutional fact that a liquid market does not exist forborrowing against Treasury collateral at a fixed rate for seven years. It iscertainly possible to borrow against Treasury collateral for short periods withgreat liquidity, and the market maker should feel no fear about the ability tocontinuouslyrolloverthisborrowing.However,thisintroducesalargevariancein the possible funding costs due to uncertainty about the direction short-termrepurchaserateswilltakeoveraseven-yearperiod.The way around this impasse is for the market maker to buy a 10-year
Treasury, borrowa seven-yearTreasury, and sell the seven-yearTreasury.The10-yearTreasuryisfinancedforsevenyearsbyaseriesofovernightrepurchaseagreements (RPs). The borrowing of the seven-yearTreasury is financed by aseriesofovernightRPs.ThemarketmakerhassucceededinachievingthesamecostofcreatingtheforwardthattheTreasurywouldhave,exceptforanynetcostbetweentheovernightRPratesatwhichthelongerTreasuryisfinancedandtheovernightRPrateatwhichtheborrowingoftheshorterTreasuryisfinanced.In general, these two RP rates should not differ; on any given day, each
represents a borrowing rate for the same tenor (overnight) andwith the samequality collateral (a U.S. government obligation). However, the RP market isinfluencedbysupply-and-demandfactorsinvolvingthecollateralpreferencesofthe investors. Some of these investors are just looking for an overnightinvestmentwithoutcredit risk, so theydon'tcarewhichU.S.TreasurysecuritytheypurchaseaspartoftheRP.Otherinvestors,however,arelookingtoreceivea particular U.S. Treasury that they will then sell short—either as part of astrategy to create a particular forward Treasury or because they think thisparticular Treasury issue is overpriced and theywant to take advantage of ananticipateddownwardpricecorrection.Thehigherthedemandbycashinvestorstoborrowaparticularsecurity,thelowertheinterestratetheywillbeforcedtoacceptontheircash.WhenRPratesonaparticularTreasuryissuedeclineduetothe demand to borrow the issue, theRP for the issue is said to havegone onspecial.So the market maker in our example will not know in advance what the
relativeRPrateswillbeontheshortersecurityonwhichitisreceivingtheRPrateandthelongersecurityonwhichitispayingtheRPrate.Toproperlyvaluethe Treasury forward created by a market maker, it is necessary to make aprojection based on past experience with RP rates for similar securities. Thissource of uncertainty calls for risk controls,which could be a combination oflimitstotheamountofexposuretothespreadbetweentheRPratesandreserves

onforwardTreasuries,withreservelevelstiedtotheuncertaintyofRPspreads.Constant-maturity Treasury (CMT) swaps (seeHull 2012, Section 32.4) are
popular products with rate resets based on U.S. Treasury yields. They arethereforevaluedinthesamewayasU.S.Treasuryforwards.ControloftheriskforthisproductfocusesoncreatinglongandshortcashTreasurypositionsandmanagingtheriskoftheresultingRPspreads.
10.2.4IndexedFlowsWewill nowexaminehow to extendourmethods for handling fixed flows tohandlingnonfixedflowstiedtocertaintypesofindexes.Let'sstartwithasimpleexample.Tokeepthisclear,let'slabelallthetimesinourexamplewithspecificdates.Let'ssaythecurrentdateisJuly1,2013.BankXYZisduetopayasingleflow
onJuly1,2015,withtheamountoftheflowtobedeterminedonJuly1,2014,bythefollowingformula:$100millionmultipliedbytheinterestratethatBankXYZisofferingonJuly1,2014,for$100milliondepositsmaturingonJuly1,2015.Sincethisinterestratewillnotbeknownforoneyear,wedonotcurrentlyknowthesizeofthisflow.However,wecandetermineacompletelyequivalentsetoffixedflowsbythefollowingargumentandthenvaluethefixedflowsbythemethodologyalreadydiscussed.Wewriteoursingleflowasthesumoftwosetsofflowsasfollows:
July1,2014 July1,2015Set1 –$100million +$100million×(1+Indexrate)Set2 +$100million –$100millionContractedflow 0 +$100million×Indexrate
Wewillarguethat theflowsinset1shouldbevaluedatzero.If this is true,thenthepresentvalueofourcontractedflowmustbeequaltothepresentvalueofthesecondsetofflows,whichisasetofcompletelyfixedflows.It can be argued that the present value of the flows in set 1 should be zero
becausetheverymeaningoftheinterestratethatBankXYZwillbeofferingonJuly1,2014,for$100milliondepositsmaturingonJuly1,2015, is therateatwhichcustomersofXYZarewillingonJuly1,2014,topayXYZ$100millioninordertoreceiveacashflowof$100million×(1+Rate)onJuly1,2015.Sowhywouldwecurrentlyvaluetheright toenter intoa transactionthatwill,bydefinition,beavailableonthatdateatanythingotherthanzero?Asecondargumentcanbegivenforwhythepresentvalueoftheflowsinset1

shouldbezero.Mathematically, it isequivalent to theargumentalreadygiven,butitdiffersininstitutionaldetailandcandeepenintuition,soIwillprovideit.Let'ssayweareconsideringofferingaFRAwiththefollowingflows:
July1,2015Set3 +$100million×Indexrate
–$100million×Fixedrate
AtwhatfixedratewouldyoubewillingtoenterintothisFRAatanup-frontcostofzero(whichisequivalent tosayingithasadiscountedpresentvalueofzero)?Youshouldbewillingtodothisonlyifthefixedrateisonethatyoucanlock into today at zero cost. The only such rate is the one that makes thefollowingsetofflowshaveadiscountedpresentvalueofzero;seeHull(2012,Section4.7)foradetailedexample.
July1,2014 July1,2015Set4 –$100million +$100million×(1+Fixedrate)
Sincebothsets3and4havediscountedpresentvaluesofzero,theirsummustalsohaveadiscountedpresentvalueofzero.Thefixedrateisthesameinsets3and4byconstruction,sothesumisjust:July1,2014 July1,2015–$100million +$100million×(1+Indexrate)
Thisisthesetofflowswewantedtoprovehasadiscountedpresentvalueofzero.Onemajorcaveatexists for thisapproach: itworksonlywhen the timingof
theindexpaymentcorrespondsexactlytotheindextenor.If,inourexample,thepaymentbasedon theone-year index, setonJuly1,2014,had takenplaceonJuly1,2014,ratherthanJuly1,2015,theargumentwouldnothaveworkedineliminatingtheindexratefromthecashflowsandwewouldhaveendedupwithanadditionaltermconsistingofthereceiptof$100million×theindexrateonJuly1,2014,andthepaymentof$100million×theindexrateonJuly1,2015.Thevalueofthisearlyreceiptofpaymentdependsonwhattheleveloftheone-year interest ratewillbeonJuly1,2014,and thesizeof theearlyreceiptalsodependsonwhattheleveloftheone-yearinterestratewillbeonJuly1,2014.This nonlinearity gives rise to convexity, which is very similar to an optionspositioninthatnostatichedgeispossible(adynamichedgeisrequired),andthevalueofthepositionriseswithhigherratevolatility.Othersituationsalsoleadtoconvexity:
Positionsthathaveup-frontcashsettlementwithoutdiscounting,suchasfutures.Thevalueofreceivinggainsupfrontisdependentonfutureratelevels.Ifchangesinthevalueofthefuturecorrelatewithchangesinratelevels,astheycertainlywillforaninterestratefuture,thevaluewillbeanonlinearfunctionofratelevels.Positionswhereapaymentislinearlybasedonthefuturerate,ratherthanthefutureprice,ofabondorswap.Thevalueofpaymentsbasedonthefuturepricecanbedeterminedbydiscountedcashflows.However,thefuturerateisanonlinearfunctionofthefutureprice.
Hull (2012, Section 6.3 and Chapter 29) discusses the issue of convexityadjustments in the valuation of forward risk. Although complete models ofconvexityadjustments require termstructure interest rateoptionsmodels,Hulloffers some reasonable approximation formulas for convexity adjustment inthese sections. We will examine a more precise technique for convexityadjustmentsinSection12.1.3.Nowthatwehavefoundthesetoffixedcashflowsthatareequivalenttoan
indexed flow, it is important to remember that these fixed flows need to beidentifiedwiththesameobligorastheindexedflows.Indexedflowsarealmostexclusivelydetermined forapanelofhighlycreditworthybanks.Forexample,LIBORisdeterminedbyaset formula fromoffering ratesofapanelofbanksdeterminedbytheBritishBankers'Association.Panelsoffirmsareusedbecausetheyminimize thedangeroffirmsmanipulating the index.Ifmanycontractualratesweretiedtotherateatwhichacertainindividualbankwasofferingtopayfordeposits,thebankcouldsetitsrateabithigherifitknewthiswouldimpacttheamount itowedona largenumberofcontracts.Byusingapanelofbanksand having rules that throw out high and low offers and average those inbetween,theimpactofanyonebankontheindexrateislessened.So the index flows need to be translated into fixed flows representing the
averagecreditdiscountofapanelofbanks.Thiscanleadtoriskinfourdifferentdirections,allofwhichneedtobeproperlyaccountedfor:
1.Differentpanelsareusedfordifferentcurrencieswithinthesamelocation.TherearemoreJapanesebanksinthepanelthatdeterminesyenLIBORthaninthepanelthatdeterminesdollarLIBOR;therefore,ifJapanesebanksareperceivedtodeclineincreditworthiness,itwillleadtoahighercreditspreadappliedtothefixedflowsthatyenLIBORisequivalenttothanforthefixedflowsthatdollarLIBORisequivalentto.

2.Differentpanelsareusedforthesamecurrencywithindifferentlocations.TherearemoreJapanesebanksinthepanelthatdeterminestheyenTokyoInterbankOfferedRate (TIBOR) than in thepanel thatdetermines theyenLIBOR. Fluctuations in the perceived creditworthiness of Japanese bankslead to fluctuations in yenLIBOR-TIBOR spreads. Firms that have takentheshortcutofvaluingallyenindexflowsthesamehavesufferedsignificantlossesfromoverlookingthisexposure.3.Thepanelofbanksdetermininganindexhasadifferentcreditratingthanthatofan individualobligor. It is important todiscount indexedflowsatadifferent set of discount factors than fixed flows of a specific obligor andmake sure that exposure to changes in the relationship between thesediscount factors is kept under control.During the global banking crisis of2007–2008, this became particularly important, as credit concerns causedwide gaps to appear between the funding costs of individual banks; seeTuckmanandSerrat(2012,Chapter13)forananalysisofhowmodelingofinterestrateproductsneededtoadjusttotheseevents.4. There can be differences in the pricing of index flows for differentfrequencies.Forexample, if there isanexpectation thatsix-monthLIBORwillaverage5basispointsmorethanthree-monthLIBORoverafive-yearperiod, you would expect a five-year swap against six-month LIBOR tohave a 5-basis-point higher fixed rate than a five-year swap against three-month LIBOR quoted at the same time. There is a swap product, basisswaps, that trades LIBOR at one frequency against LIBOR at anotherfrequency.Usually,basis swappricing showsa slightlyhigher expectationforLIBORthatisresetlessoften(e.g.,six-monthLIBORwouldbegreaterthanthree-monthLIBOR).Thisisbothbecausebanksinraisingfundsprefertolockinratesforalongertimeperiod,guardingagainsttemporaryperiodsof illiquidity, and because swap investors receiving LIBOR have a slightpreferenceformorefrequentresets;itgivesthemanadvantageifabankintheLIBORpanelhastodropoutduetoadeterioratedcreditoutlookandisreplaced on the panel by a bank with lower funding costs. This basisdifference is normally quite small, but rose during the banking liquiditycrisisof2007–2008.Fordetails,seeTuckmanandSerrat(2012,449–450).
10.3FACTORSIMPACTINGBORROWINGCOSTSWhen designing stress tests and setting limits for forward risk for a given
product, riskmanagersmust understand the economics of the borrowing costsforthatproductinordertogaugetheseverityofstressestheborrowingcostcanbe subject to. Four key characteristics, which differ from product to product,shouldbedistinguished:
1.Section10.3.1.How large and diversified is the borrowing demand fortheproduct?2. Section 10.3.2. To what extent does cash-and-carry arbitrage place alowerlimitonborrowingcosts?3.Section10.3.3.Howvariableare thestoragecosts that impact thecash-and-carryarbitrage?4.Section10.3.4.Towhatextentareborrowingcostsseasonal?Wealsodiscuss therelationshipbetweenborrowingcostsandforwardprices
inSection10.3.5.
10.3.1TheNatureofBorrowingDemandAsourceofborrowingdemand that exists for all products comes from traderswantingtoborrowinconjunctionwithshortselling.Forsomeproducts—suchasstocks, bonds, and gold—this is the only significant source of borrowingdemand. At the other extreme are currencies, where there is strong creditdemand by businesses and households to finance purchases and investments.Intermediate cases include most physical commodities, such as oil or wheat,whereborrowingdemandexiststomeetimmediateconsumptionneeds.Products forwhich borrowing demand comes almost exclusively from short
sellers tend to have very low borrowing ratesmost of the time, since there islittle competition for the borrowing. Thismay not be immediately obvious inmarket quotes if the quotes aremade as forward prices rather than borrowingrates.Forexample,aone-yeargoldforwardmightbequotedat314.85,a4.85percentpremiumtoa$300spotprice.However,whenthisisbrokenapartintoaborrowingcostforcashandaborrowingcostforgold,italmostalwaysconsistsofarelativelyhighborrowingcostforcash,say6percent,andarelativelylowborrowingcostforgold,say1percent.Asaresult,$300todayisworth$300×1.06=$318receivedinoneyear,and1ounceofgoldreceivedtodayisworth1×1.01=1.01ouncesofgoldreceivedinoneyear,givingaforwardpriceofgoldof$318/1.01ounces=$314.85perounce.Borrowingratesriseasshort-sellingactivityincreases.Themajorriskforshortsellersintheseproductsistheshortsqueeze in which borrowing costs are driven sharply upward by a deliberate

policyofagovernmentorofholdersoftheassetsseekingtosupportpricesbyrestricting the supply of available borrowing. The resulting increase inborrowing rates pressures short sellers to abandon their strategy and close outtheirpositions.Short squeezes are possible for any asset class, but are more difficult to
achieveforassetswhereborrowingdemandhasabroaderbase.Agovernmentwantingtosupportthepriceofitscurrencymaybetemptedtotightenthemoneysupply in order to place borrowing cost pressures on the short sellers of thecurrency,but itwillbelimitedbythefact that theseincreasedborrowingcostswillalsohurtbusinessfirmsandconsumerswhoborrow.Evenso,agovernmentfacedwitha runon itscurrencywill stilldecideonoccasion that thedesire topressureshortsellersoutweighsotherconsiderations,andwilleither takestepsto sharply raise rates or put in place legal measures that discriminate againstcertainclassesofborrowerswhoarebelieved tobe selling thecurrency short.An example of the former is the Irish central bank driving short-term rates to4,000percent in1992 inanattempt to teachspeculatorsa lesson (Taleb1997,212). An example of the latter is Malaysia in 1997 closing its currencyborrowingmarketstoforeigninvestors.Thepossibilityofashortsqueezeonborrowingratesactsasabrakeonthose
whowanttotakeapositiononanassetdeclininginvalue,sincetheyarefacedwitharisktowhichthosetakingapositionontheassetpriceincreasingarenotsubject.Thosewantingtopositionforpriceincreasesinaparticularassethavethe freedom to borrow any other asset (most probably, but not necessarily, acurrency) relative towhich theybelieve itwill increase inprice and exchangeone for theother in the spotmarket.However, thosewanting toposition for aprice decrease in a particular asset must borrow that particular asset. Theconsequence of this asymmetry for rate scenarios is that the possible shortsqueezemeanstheriskofveryhighborrowingratesneedstobeguardedagainst.
10.3.2ThePossibilityofCash-and-CarryArbitrageWhenavailable, thepossibilityofacash-and-carryarbitragepositionactsasalower limit onborrowingcosts.Acash-and-carry arbitrage is one inwhich anasset is either purchasedor borrowed at one date and repaid or sold at a laterdate, being held or stored in between the two dates. The examplemost oftencitedisa limitoncurrency-borrowingratesnot togobelowzero,sinceif theydid, a trader could borrow the currency at a negative interest rate, hold the
currency,and thenuse thecurrencyheld topayback theborrowing,collectingthe negative interest payment as guaranteed profit.Amore general result saysthat a lower limit onnegativeborrowing costs is the storage cost of the asset.Thisgeneralizationmakesitclearthatthespecificresultforacurrencyrestsonthe assumption that currency storage costs are zero (by contrast, a physicalcommodity such as gold has handling and insurance costs of storage that canlead to negative borrowing costs).Although currency storage costs are almostalways zero for large amounts (retail depositors may be charged transactionsfees), there have been a few historical exceptions. For example, governmentswanting toslowthepaceatwhichforeigndepositsaredrivingup thevalueoftheir currency have imposed transaction fees or taxes on large deposits,permittingnegativeborrowingcosts.Cash-and-carry arbitrage is not feasible for all asset classes. Perishable
physicalcommodities,suchaslivesteersorelectricity,cannotbestored,socash-and-carry arbitrage does not place a lower limit on borrowing costs in suchmarkets. Although arbitrage is not available as a limit, some pressure onborrowing costs getting too lowwill still result from economic incentives forconsumers to change thepatternsofdemand.So if currentpricesget toohighrelativetothosesixmonthsforward,beefconsumptionwillbepostponedtothepointthatthespotpricewillstarttodeclinerelativetotheforwardprice,therebyraisingtheborrowingrate.
10.3.3TheVariabilityofStorageCostsStoragecostsonphysicalcommodities tend tobereasonablystable,since theyare thecostofphysicalprocessessuchashandlingand transportation.Couponpayments on bonds, a storage benefit, are also stable. However, the storagebenefit on stocks, the receipt of dividends, can be quite unstable. A financialsetback could lead to a sudden drop in dividends. A merger could lead to asuddenincreaseindividends,asintheexampleatthebeginningofthischapter.Changesintaxlawsappliedtodividendshavealsoresultedinsubstantialsuddenchanges in stock-borrowing costs. Note that it does not matter whether thecontractualborrowingtermscallforthestockborrowertoreceivethedividendsorpassthemthroughtothestocklender.Iftheborrowerreceivesthedividend,thenanincreaseindividendwillcausethelendertodemandahigherborrowingrate.When the borrowermust pass the dividend through to the lender, then aborrowerwhohassoldthestockshort(whichistheonlyeconomicrationalefor

borrowing stock) must pay the increased dividend out of the borrower's ownpocket.
10.3.4TheSeasonalityofBorrowingCostsInterpolationmethodologyfordiscountfactorsandtheevaluationoftheriskofincorrectinterpolationmusttakeintoaccounttheseasonalityofborrowingcosts,which can lead to patterns thatwould bemissed by simple interpolation fromadjoining prices. To illustrate this with an extreme example, suppose a stockpays a dividend on exactly every July 15. The value of the dividend to bereceived on July 15, 2014,will be reflected in the borrowing cost to July 15,2014,butnotintheborrowingcosttoJuly14,2014.Withoutknowingthis,noconventionalmethodologyforinterpolatingbetweenborrowingcoststoJanuary1, 2014, and January 1, 2015, will pick up the sharp difference between theborrowingcoststothesetwodates.Mostborrowingmarketsdonothingeonsuchspecificscheduling.However,
markets for physical commodities such as oil and other energy products andagriculturalproductsoftenreflectseasonalsupplyanddemandfactorssuchasastronger demand for heating oil as winter approaches and stronger supply ofwheat immediately followingharvestingmonths.Theseasonalityofborrowingcostsforphysicalcommoditiesiscloselytiedtothepossibilityofcash-and-carryarbitrage.Commoditiescapableof storage thatpermit cash-and-carryarbitragewillhaveasmallerseasonalcomponentsincethestorageofsupplycanbeusedas a response to seasonal demand. Perishable commodities that do not permitcash-and-carry arbitrage show a stronger seasonal component, since pricingdifferentials need to become large enough to start shifting demand. In theextremecaseofelectricity,whichcannotbestoredforevenveryshortperiodsoftime,seasonalityeffectscanbeseenwithinasingleday,withdifferentforwardprices fordifferent timesof thedaybasedondifferingdemandby the timeofday.Borrowingratesforgold,stocks,bonds,andcurrenciesgenerallyshowfarless
ofaseasonaleffectthanborrowingratesforphysicalcommodities,bothbecauseofthepossibilityofstorageandbecausetheseasonalityofsupplyanddemandisweakerthanthatforphysicalcommodities.However,someseasonaleffectscanbe observed—most prominently turn-of-the-quarter effects in currencyborrowing.Thiseffectisasharpspikeindemandforborrowingcurrencyonthelastbusinessdayofeachquarterandparticularly the lastbusinessdayofeach

year.AmoredetaileddiscussioncanbefoundinBurghardtandKirshner(1994).A particularly pronounced seasonal borrowing effect for currencies was
experiencedthroughout1999asfearsofcomputeroperationalproblemsstartingon January 1, 2000—the Y2K problem—caused a large demand for liquidityover the first few weeks of January 2000. Since firms wanted to lock in thecurrency availability for this period, they were willing to pay much higherborrowingratesforthisperiodthanforanyperiodprecedingitorsucceedingit.
10.3.5BorrowingCostsandForwardPricesAsemphasizedinSection10.2,everystatementmadeaboutborrowingcostscanbetranslatedintoanequivalentstatementaboutforwardprices,andviceversa.Inmarketconvention,statementsaboutcurrenciesareusuallymadeintermsofborrowingcosts,andstatementsaboutphysicalcommoditiesareusuallymadeinterms of forward prices. Since currencies generally have more widespreadborrowingdemands thanphysicalcommodities,asdiscussedinSection10.3.1,the borrowing costs for physical commodities will usually be lower than theborrowingcostsforacurrency.Thisisusuallyexpressedinforwardpricetermsby saying that the forward price of a physical commodity is generally higherthan its spot price—a condition known as contango. However,when a strongdemand exists for the availability of a particular physical commodity, itsborrowingcostmaybedrivenabovetheborrowingcostofacurrency,resultingin forward prices being lower than spot prices—a condition known asbackwardation.An example of this relationship is shown inTable 10.4. (Thisterminologyhasconsiderablehistorybehindit.Inthe1893GilbertandSullivanoperettaUtopia,Limited,acharacterisintroducedasafinancialwizardwiththephrase“ACompanyPromoterthis,withspecialeducation,WhichteacheswhatContangomeansandalsoBackwardation.”)TABLE10.4ExamplesofContangoandBackwardation
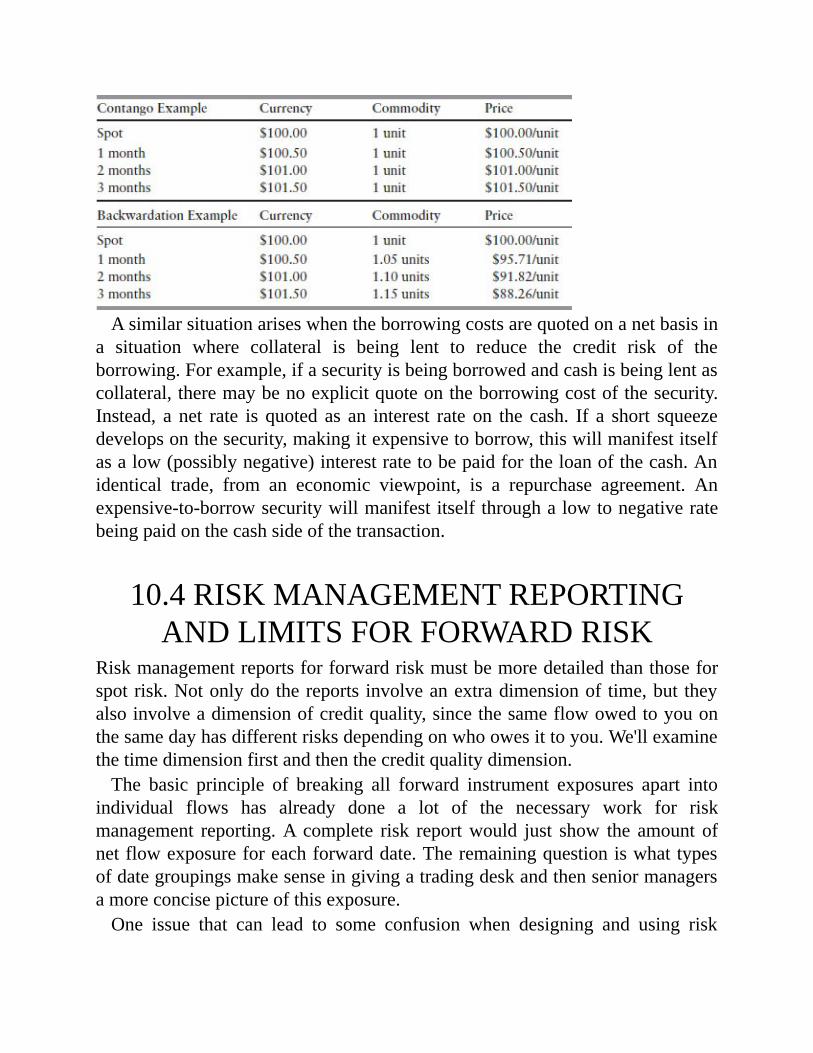
Asimilarsituationariseswhentheborrowingcostsarequotedonanetbasisina situation where collateral is being lent to reduce the credit risk of theborrowing.Forexample,ifasecurityisbeingborrowedandcashisbeinglentascollateral,theremaybenoexplicitquoteontheborrowingcostofthesecurity.Instead, a net rate is quoted as an interest rate on the cash. If a short squeezedevelopsonthesecurity,makingitexpensivetoborrow,thiswillmanifestitselfasalow(possiblynegative)interestratetobepaidfortheloanofthecash.Anidentical trade, from an economic viewpoint, is a repurchase agreement. Anexpensive-to-borrowsecuritywillmanifestitselfthroughalowtonegativeratebeingpaidonthecashsideofthetransaction.
10.4RISKMANAGEMENTREPORTINGANDLIMITSFORFORWARDRISK
Riskmanagementreportsforforwardriskmustbemoredetailedthanthoseforspotrisk.Notonlydothereports involveanextradimensionof time,but theyalsoinvolveadimensionofcreditquality,sincethesameflowowedtoyouonthesamedayhasdifferentrisksdependingonwhoowesittoyou.We'llexaminethetimedimensionfirstandthenthecreditqualitydimension.The basic principle of breaking all forward instrument exposures apart into
individual flows has already done a lot of the necessary work for riskmanagement reporting.A complete risk reportwould just show the amount ofnetflowexposureforeachforwarddate.Theremainingquestioniswhattypesofdategroupingsmakesenseingivingatradingdeskandthenseniormanagersamoreconcisepictureofthisexposure.One issue that can lead to some confusion when designing and using risk
managementreportsforforwardriskistheoverlapintheusageofmanyclose-to-equivalent measures. This starts with disagreement over the simpleconvention of what is meant by a long position and a short position. In spotmarkets,longclearlymeanstoownanasset,benefitbyariseintheassetprice,andlosefromadeclineintheassetprice,whileshortmeansexactlytheoppositeineachrespect.Inforwardmarkets,somepractitionerswhothinkaboutowninga bond use long and short in the same way—the long position benefits frombondpricesrisingandthereforefrominterestratesfalling,andtheshortpositionbenefitsfrombondpricesfallingandthereforefrominterestratesrising.OtherpractitionerswithbackgroundsininstrumentssuchasswapsandFRAs,
wherenonaturalconceptofanassetbeingownedisavailable,uselongtomeana position benefiting by interest rates rising and short to mean a positionbenefiting by interest rates falling. Often, all you can do is remind yourselfwhich trading desk you're talking to in order to knowwhichway the term isbeingused,butinsistthateveryonemustagreetouseafirmwideconvention,nomatterhowmuchtheyhateit,whentalkingtothechairmanoftheboard.Asimilarsetofdifferencesinconventionisatworkwhendescribingthesize
ofaposition.Sometradershavegrownupusingthetermvalueofabasispoint(orequivalentlyvalueofan01),whereasothersrefertoa5-yearequivalent,10-yearequivalent, orduration. Tuckman and Serrat (2012,Chapters 4 and 5) ishighlyrecommendedforadetailedandintuitiveexplanationof theseconcepts.Table10.5 illustrates thiswith a numerical example inwhichwe'll consider apositionwithjusttwocomponents:a5-yearflowanda10-yearflow.TABLE10.5SampleComputationofForwardRiskPositions
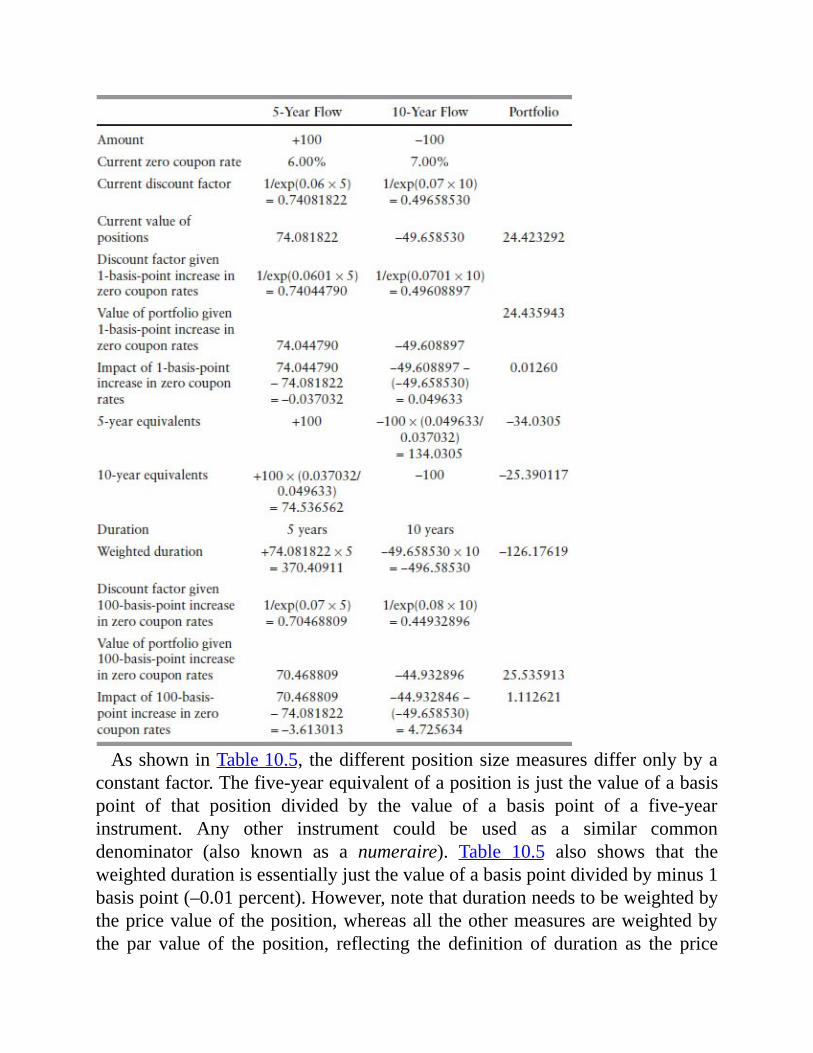
AsshowninTable10.5, thedifferentpositionsizemeasuresdifferonlybyaconstantfactor.Thefive-yearequivalentofapositionisjustthevalueofabasispoint of that position divided by the value of a basis point of a five-yearinstrument. Any other instrument could be used as a similar commondenominator (also known as a numeraire). Table 10.5 also shows that theweighteddurationisessentiallyjustthevalueofabasispointdividedbyminus1basispoint(–0.01percent).However,notethatdurationneedstobeweightedbythepricevalueoftheposition,whereasall theothermeasuresareweightedbythe par value of the position, reflecting the definition of duration as the price

changeperdollarofportfoliovalue.SeeTuckmanandSerrat (2012,130); seealsoTuckmanandSerrat(2012,145–147)foraproofthatthedurationofacashflowissimplyequaltoitstenor.Youcancheckthatifthepositionheldwas+100ofthefive-yearflowand–
74.536562ofthe10-yearflow,usingtheratiobetweenvaluesofabasispoint,the five-year equivalent, 10-year equivalent, and duration measures for theportfoliowould all come out equal to 0.However, the impact of a 100-basis-point increase would not be 0; it would be –3.613013 + (0.74536562 ×4.725634)=–0.090688.Soaposition that is completelyhedged fora1-basis-point rate move is not completely hedged for a 100-basis-point move. Thisnonlinearitystemsfromthefactthattheformulaforconvertinginterestratestoprices is not a linear formula. Risk exposure to the size of a move in inputvariables isknownasconvexityrisk.This is a risk thatdoesnot exist for spotexposures,whicharelinear,andisamajorissueforoptionsexposures;itwillbeaprincipaltopicofthenextchapter.Theconvexityofforwardsismuchlessseverethanforoptions,anditisrare
forriskmanagerstofocusmuchattentiononit.Inadditiontonotbeingaverylargeeffect,itisdirectlytiedtohedginglongerpositionswithshorterpositions(sincethenonlineareffectsgrowwithtimetomaturity),andriskreportingwillalreadybedirectedatthedegreeofmaturitymismatch.Convexityisanimportantissueforonetypeofforwardrisk—creditexposure.
Because a credit event, such as the downgrade of a credit rating or, at theextreme,adefaultevent,cancausecreditspreadstojumpbyhundredsoreventhousands of basis points, the degree of hedge exposure can be enormous.Reconsiderourpreviousexamplewiththehedgeratioof100:74.536562,makingthepositionneutraltoa1-basis-pointchangeinthecreditspread.Intheeventofdefault, therewillnolongerbeanydifferencebetweena5-and10-yearflow—both will just represent claims in a bankruptcy proceeding. If a 30 percentrecoveryoccursontheseclaims,thehedgedpositionwillshowalossof70%×(–100+74.536562)=–17.8244066.Thisisariskthatinvestorsneedtobeawareof.Itexplainswhyinvestorsin
bondsissuedbyfirmswithhighdefaultrisk(knownashigh-yielddebt,or, lesspolitely,asjunkbonds) tendtodealdirectlywithpricesandavoidreference tointerest rates. For a further discussion of the impact of convexity on creditexposure,seeSection13.1.2.2.Firm-level risk management for forward risk requires decisions about the
degree of detailwithwhich exposure to changes in yield curve shapewill be
represented.Seniormanagementalmostcertainlyneedstobeinformedofonlyafew parameters that represent the rate exposure. Many studies have beenperformedonthehistoricalchangesintheshapeofmanydifferentratecurves,and almost all have shown that about 80 to 90 percent of all changes can beexplainedbyjusttwoparameters,andcloseto95percentofallchangescanbeexplained by just three parameters. Although statistical methods can beemployedtodeterminethebesttwoorthreeprincipalcomponents,itmakesforbetterintuitiveunderstandingifparameterscanbechosenthatconveyaconcretemeaning. Fortunately, almost all studies of yield curve movement show thatintuitivelymeaningfulparametersperformalmostaswellasparametersselectedby statisticalmeans (see, for example, Litterman and Scheinkman 1988). Thethreeparametersthatexplainmostofthechange,inorderofimportance,are:
1.Aparallelshiftparameter.2.Aparametertomeasurethedegreeoflineartiltoftheyieldcurve.3.Aparametertomeasureyieldcurvetwist,thedegreetowhichthemiddleofthecurvechangesrelativetothetwoendsofthecurve.TheRates spreadsheet illustrates the calculation of the impact of parameter
shiftsonaportfolio.Theparallelshiftparametercertainlyrepresentsanondiversifiableriskinthe
senseofSection6.1.1,andacasecouldbemadeforconsidering the linear tiltparameter having an element of nondiversifiable risk as well. It is thereforeparticularlyimportantthattheseexposuresbehighlightedtomanagement.Nonstatistical limitsonyieldcurveshapeexposurealsooftenstartwithsuch
overallparameters,butitisusuallyfoundtobenecessarytohavemorerefinedlimitmeasuresaswell.Thedebate isoftenbetweenbucketmeasuresbasedongroupingsofforwardrisks(forexample,zero-toone-yearforwards,one-totwo-year forwards, two-to three-year forwards, and so on) versus bucketmeasuresthat break the yield curve exposure down to exposure to yield changes in themostliquidhedginginstruments(suchasfuturescontractsouttofiveyearsandthen 7-, 10-, and 30-year swaps). The primary argument in favor of the latterapproachisthatthesearetheactualhedginginstrumentsmostlikelytobeused;therefore, limitsexpressed in these termsare immediatelyoperational (a traderknowswhatactionneedstobetakentocloseaposition)andcanmoreeasilybejudgedastotheviabilityoflimitsizerelativetocustomerorderflowandmarketliquidityforthatinstrument.Theprimaryargumentagainstthisapproachisthatthetranslationofcashflowexposuresintoliquidhedginginstrumentequivalents

isnotcompletelydetermined,andverysmallchangesinthechoiceofalgorithmcan lead to large changes in how a position is distributed between differentinstruments. For further discussion of this choice, see Tuckman and Serrat(2012,158–159).The decision of which currencies, commodities, and equities should be
groupedtogetherrestsonverysimilarconsiderationsforyieldcurvesasforspotrisk(refertothediscussioninChapter9).Withinagrouping,limitsareneededbyobligor.Youwould,ataminimum,wanttohavelimitsonthegovernment'scurve and the interbank rate curve (also known as the swap curve or LIBORcurve),butwouldprobablywanttogrouptogetherratecurvesforotherobligors,probablybycreditratingandpossiblybyindustryandcountry.
EXERCISES
10.1InterpolationForthisexercise,makeuseoftheRateDataspreadsheet.Supposeyouaremakingamarketin16-,17-,18-,and19-yearswaps.Liquidswapsareavailableat15and20years.Tryoutsomedifferentinterpolationmethodsandtesttheireffectivenesswhenusingthemtoderiveunwindvalues.Herearesomesuggestions:
Thereisn'tenoughdataonthespreadsheettoseewhattheimpactofinitiatingahedgeatonepointandunwindingin10yearswouldbe,solet'smakethereasonableassumptionthatthelong-termdistributionofratecurveshapesisreasonablystable.So,forexample,we'lljudgetheeffectivenessofinterpolatingthe18-yearratefrom40%×the15-yearrate+60%×the20-yearratebylookingatthelong-termdistributionofunwindcostsofaneight-yearraterelativeto40%×thefive-yearrate+60%×the10-yearrate.Standarddeviationcanbeusedasareasonablesummarystatisticfortheuncertaintyofunwindcost,althoughyoushouldfeelfreetoexploreotherpossiblemeasuressuchasthe99thpercentile.Tokeepthematheasier,ignoreanycompoundingeffects;thatis,treattheparswapratesasiftheywerezerocouponrates.Sothegainfrombuyinganeight-yearswapat6%andsellingafive-yearswapat5.70%+60%ofa10-yearswapat6.10percentisjustthefollowing:(40%×5.70%+60%×6.10%)–6%=–0.06%.Youcanlookattheimpactofinterpolatingwithdifferentpercentagesthanthosesuggestedbymaturity;forexample,considera50%five-year,50%10-yearinterpolationforaneight-yearswapaswellasthestandard40%five-year,60%10-yearinterpolation.Youcanconsidertheimpactoffactoringthe30-yearrateintotheinterpolation;thiswillleadtotheuseofa20-yearrateintheunwind.Explorehowmuchimprovementinreducinghedgeuncertaintycomesaboutbyinterpolationratherthanjustassumingaflatcurvebylookingatthedegreetowhichuncertaintyisreducedbyusingboththefive-and10-yearratesintheunwindratherthanjustthefive-yearrate(orjustthe10-yearrate).

10.2StackandRollUsethesamplestack-and-rollcomputationinSection10.2.2andtheratedatahistoryfromtheRateDataspreadsheettocalculatetwostandarddeviationreservesforthefollowingproducts:
40-yearswap35-yearswap33-yearswap50-yearswap
AsinExercise10.1,assumethattheparswapratesareactuallyzerocouponratestokeepthemathsimpler.
10.3RatesUsetheRatesspreadsheettocalculateriskexposureforaportfolioofforwardinstruments:1.Beginbycreatingadiscountcurvethatcanbeusedinsubsequentcalculations.Enterasetofbenchmark instruments and market prices into the Instruments worksheet and solve for adiscount curve that fits these prices, following the spreadsheet instructions. You might, forexample,selectasetofU.S.Treasurybondswithone-,two-,three-,four-,five-,seven-,and10-yearmaturities.Areasonablesetofparametersistoputanequalweightingof1oneachofyourbenchmarkinstrumentsandtoplaceaweightof90percentonfittingpricesand10percentonthesmoothness of the resulting forward curve, but you are encouraged to try different parametersandseetheirimpactontheresultingdiscountcurve.2.Aftercreatingthediscountcurve,selectaportfolioofinstrumentsforwhichtocalculateriskexposurebyplacingweightsoneachinstrument(youcanalsoaddotherinstrumentsbeyondthebenchmark instruments). Look at the resulting risk exposure by forward bucket and summaryexposuretoforwardshifts,tiltshifts,andbutterflyshifts,andtrytomakeintuitivesenseofthem.3.Bytrialanderror(orbycreatinganoptimizationroutinewiththeSolver),findmodificationstoyourportfolioweightsthatmakeparallelshiftexposureclosetozero,butretainroughlythesametiltexposureandbutterflyshiftexposureasyouroriginalportfolio.4. Follow the same instructions as for part 3, butmake tilt exposure close to zero and leaveparallelshiftexposureandbutterflyshiftexposureroughlythesameasinyouroriginalportfolio.
CHAPTER11
ManagingVanillaOptionsRiskEvery book should have a hero. The hero of this book is not a person but anequation: the Black-Scholes formula for pricing European-style options. Likeeveryhero,ithasitsflawsandnoshortageofdetractorsreadytopointthemout.Butwithhelpfromsomefriends,itcanrecovertoplayavitalroleinintegratingalloptionsriskintoaunified,manageableframework.Thisisthethemeofthischapterandthenext.Options risk may be subdivided into two categories: the risk of relatively
liquidoptions,termedplain-vanillaorvanillaoptions,andtheriskoflessliquidoptions,termedexoticoptions.Managingoptionsriskforvanillaoptionsisquitedifferentfrommanagingoptionsriskforexoticoptions,sowewilldiscussthemintwoseparatechapters.Almost without exception, the only relatively liquid options are European-
stylecallsorputs,involvingasingleexercisedateandasimplepayofffunctionequal to the difference between the final price level of an asset and the strikeprice. As such, vanilla options can be priced using either the Black-Scholesformulaoroneofitssimplevariants(seeHull2012,Section14.8,Chapter16,and Sections 17.8 and 25.13). The only notable exception to the rule that allvanilla options are European style is that some American-style options onfuturesareexchangetradedandliquid.However,theearlyexercisevalueofsuchoptions—the difference between their value and that of the correspondingEuropeanoption—isquitesmall(asdiscussedinSection12.5.1).Sotreatingallvanilla options as European-style calls and puts is a reasonable firstapproximation.TosimplifyourdiscussionofEuropeanoptions,wewillutilizethefollowing
threeconventions:1.Alloptionsaretreatedasoptionstoexchangeoneassetforanother,whichenablesustoonlyconsidercalloptions.So,forexample,wetreatanoptionto put a share of stock at a fixed price of $50 as being a call option toexchange$50foroneshareofstock.Thisisamorenaturalwayoftreatingforeignexchange(FX)optionsthantheusualapproach,sincewhetheranFXoptionisacalloraputdependsonwhichcurrencyyouuseasyourbase.2.Optionspricesandstrikeswilloftenbeexpressedaspercentagesof the
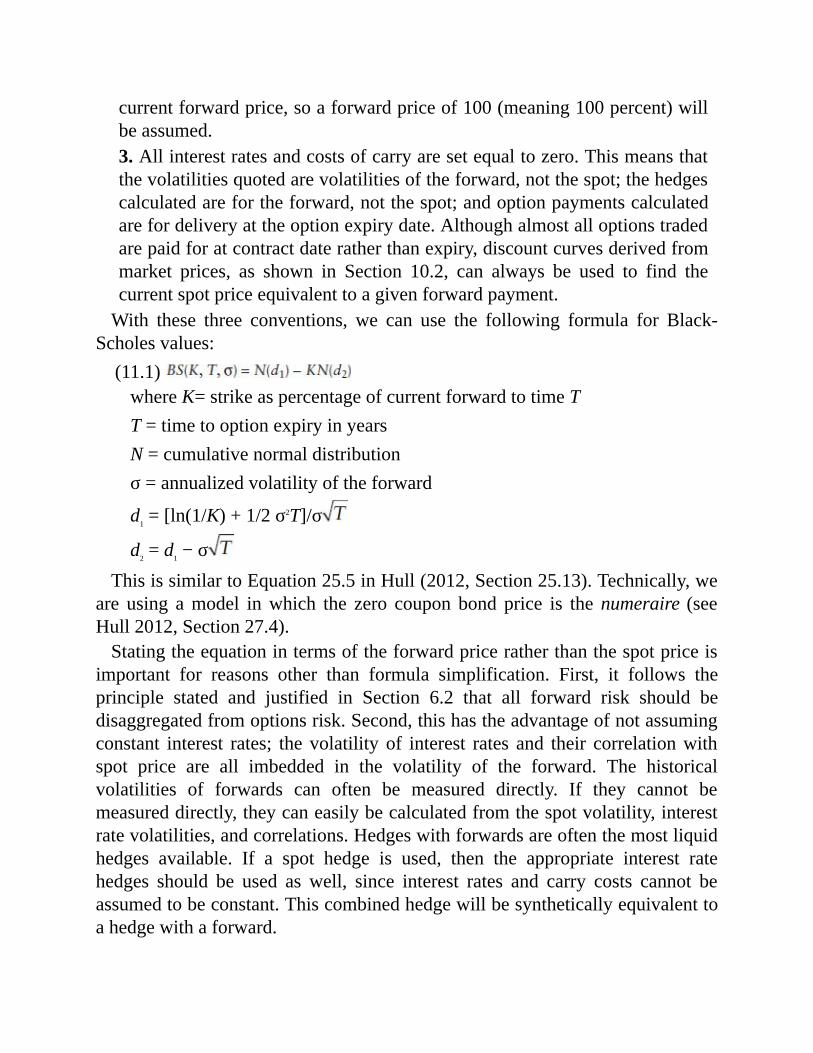
currentforwardprice,soaforwardpriceof100(meaning100percent)willbeassumed.3.Allinterestratesandcostsofcarryaresetequaltozero.Thismeansthatthevolatilitiesquotedarevolatilitiesoftheforward,notthespot;thehedgescalculatedarefortheforward,notthespot;andoptionpaymentscalculatedarefordeliveryattheoptionexpirydate.Althoughalmostalloptionstradedarepaidforatcontractdateratherthanexpiry,discountcurvesderivedfrommarket prices, as shown in Section 10.2, can always be used to find thecurrentspotpriceequivalenttoagivenforwardpayment.With these three conventions, we can use the following formula for Black-
Scholesvalues:(11.1)whereK=strikeaspercentageofcurrentforwardtotimeTT=timetooptionexpiryinyearsN=cumulativenormaldistributionσ=annualizedvolatilityoftheforward
d1=[ln(1/K)+1/2σ2T]/σ
d2=d1−σThisissimilartoEquation25.5inHull(2012,Section25.13).Technically,we
are using amodel inwhich the zero coupon bond price is thenumeraire (seeHull2012,Section27.4).Statingtheequationintermsoftheforwardpriceratherthanthespotpriceis
important for reasons other than formula simplification. First, it follows theprinciple stated and justified in Section 6.2 that all forward risk should bedisaggregatedfromoptionsrisk.Second,thishastheadvantageofnotassumingconstant interest rates; the volatility of interest rates and their correlationwithspot price are all imbedded in the volatility of the forward. The historicalvolatilities of forwards can often be measured directly. If they cannot bemeasureddirectly,theycaneasilybecalculatedfromthespotvolatility,interestratevolatilities,andcorrelations.Hedgeswithforwardsareoftenthemostliquidhedges available. If a spot hedge is used, then the appropriate interest ratehedges should be used as well, since interest rates and carry costs cannot beassumedtobeconstant.Thiscombinedhedgewillbesyntheticallyequivalenttoahedgewithaforward.

11.1OVERVIEWOFOPTIONSRISKMANAGEMENT
Even when we limit our discussion to vanilla options, the vast variety ofinstruments availablemakes it unlikely that liquidity of any single instrumentwill be large. For the options on just a single asset, not only do we face themultiplicity of dates we encountered for forward risk products, but each datealsohasamultiplicityofpossiblestrikes.Oncewetakeintoaccountthatoptionsinvolve an exchangebetweenpairs of assets, thenumberof possible contractsexpandsevenmorerapidly.Forexample,ifadesktrades10differentcurrencies,thenumberofcurrencypairsofFXoptionsis10×9=90.Infact,thedegreeofliquidityavailableforoptionproductsissignificantlysmallerthanthatforspotorforwardproducts.When options market trading first began and, to a more limited extent, as
options markets continue to develop for new assets, initial market-makerhedgingstrategieswereoftenachoicebetweenactingasabroker(attemptingtofind a structure forwhich a simultaneous buyer and seller could be found) orrelyingonaninitialstatichedgewiththeunderlyinginstrumentuntilaroughlymatchingoptionpositioncouldbefound.Thebrokerstrategyisverylimitingforbusinessgrowth.The statichedge strategycanonlyconvert callpositions intoputpositions,orviceversa; itcannotreducethenonlinearnatureof theoptionposition. As such, it can be used only by trading desks that are willing toseverelylimitthesizeofpositions(therebylimitingbusinessgrowth)ortotakeverylargerisksonbeingrightaboutthemaximumorminimumlevelstowhichassetpriceswillmove.Statichedgingwithlimitedpositionsizeremainsaviablestrategyforaproprietarydesk,butnotforamarket-makingdesk.The development of dynamic hedging strategies was therefore a major
breakthrough for the management of options market making. Consider Table11.1,whichextendsanexamplethatHull(2012,Tables18.1and18.4)presents,usingMonteCarlosimulationtoevaluatetheperformanceofdynamichedgingstrategies.TABLE11.1PerformanceofDynamicHedgingStrategies

Table11.1shows thatevenaverynaivedynamichedgingstrategy, thestop-lossstrategy,whichcallsfora100percenthedgeofacallwhenevertheforwardprice is above the strike and a 0 percent hedgewhenever the forward price isbelowthestrike,resultsinalargereductioninthestandarddeviationofresults—76 percent of option cost relative to 130 percent of option cost for a statichedge.However, an increased frequency of rehedging can only improve stop-loss results up to this point. By contrast, the dynamic hedging strategycorresponding to the Black-Scholes analysis enables the standard deviation toget as close to zero as one wants by a suitable increase in the frequency ofrehedging.YoucanseewhytheBlack-Scholesapproachhadsuchanimpactonoptionsriskmanagement.But almost immediately, this was followed by a backlash, focusing on the
unrealistic nature of the Black-Scholes assumptions. Principally, theseassumptionsandtheobjectionsare:
Tradingintheunderlyingassetcantakeplacecontinuously.(Infact,apracticallimitexistsonhowfrequentlytradingcanoccur,whichplacesalowerlimitonthestandarddeviationthatcanbeachieved.)Notransactioncostsareinvolvedwhentradingintheunderlyingasset.(Inpractice,transactioncostsplaceaneventighterlimitonthefrequencyof

rehedging.)Thevolatilityoftheunderlyingassetisaknownconstant.(Ifwemakethemorerealisticassumptionthatvolatilityisuncertain,withastandarddeviationaroundamean,wegetresultslikethoseinthelasttwocolumnsofTable11.1,placingalowerlimitonthestandarddeviationthatcanbeachieved.)TheunderlyingassetfollowsaBrownianmotionwithnojumps.(Inpractice,discontinuousjumpsinassetpricescanoccur,evenfurtherlimitingthedegreetowhichstandarddeviationcanbelowered.)
TradingdesksthathavetriedpureBlack-Scholeshedgingstrategiesfor largepositions have generally found that unacceptably large risks are incurred. Arelated example is the portfolio insurance strategy. Many equity portfoliomanagers were using this strategy in the mid-1980s to create desired optionspositions through dynamic hedging. InOctober 1987, the global stockmarketcrash caused liquidity to dry up in the underlying stocks, leading to tradingdiscontinuities that resulted in large deviations from planned option payoffprofiles.As a result, vanilla options market makers have generally moved in the
direction of a paradigm in which they attempt tomatch the options positionsbought and sold reasonably closely, enabling basis risk to be taken both overtimewhilewaitingforoffsettingtradestobeavailableandwithregardtostrikeandtenormismatches.TheBlack-Scholesmodelisreliedonasaninterpolationtool to relate observed market prices to prices needed for the residual riskpositions left after offsetting closely related buys and sells. Black-Scholesdynamichedgingisusedtohedgetheseresidualriskpositions.Three key tools are needed for managing a vanilla options book using this
paradigm:1.Areportingmechanismmustbeavailabletomeasuretheamountofbasisriskexposure resulting frommismatches in the strikeand tenorofoptionsboughtandsold.Althoughsummarymeasuressuchasvega(exposuretoamove in impliedvolatility levels) andgamma (the sensitivityofdelta to achangeinunderlyingpricelevel)canbeuseful,thetwo-dimensional(strikeandtenor)natureoftheexposurerequiresatwo-dimensionalriskmeasuretobereallyeffective.Thismeasureistheprice-volmatrixthatdepictsportfoliovaluation sensitivity to the joint distribution of two variables: underlyingasset price and implied volatility. It therefore measures exposure to bothjumps in underlying asset price and changes in implied volatility. It also

measures simultaneous changes in both. We will examine illustrativeexamplesanddiscusstheuseofprice-volmatricesinSection11.4.2.Dynamicdeltahedgingoftheportfolioofboughtandsoldoptionsneedstobeperformed.Guidance for thisprocess comes from theBlack-Scholesformula.Thetargetedhedgefortheportfolioisasimplesummationofthetargetedhedgesofeachindividualoptionposition,asdeterminedbyBlack-Scholes. However, given the reality of transaction costs for executing thedeltahedgesintheunderlying,asetofguidelinesabouthowoftentohedgeisnecessary. Ithasbeenshown,bothby theoryand traderexperience, thathedging guidelines based on the distance between the current delta hedgeand the target delta hedge are more effective than guidelines tied to thefrequencyofhedging.Thedegreeoftolerancefordeviationfromthetargetdelta determines a trade-off between higher transaction costs (for lowertolerances)andhigheruncertaintyofresults(forhighertolerances).Section11.5 discusses these delta-hedging guidelines in more detail along withrelatedissuessuchaswhatimpliedvolatilitytousetodeterminethetargethedge.3.Optionsforwhichliquidmarketpricesarenotavailablearevaluedbasedon interpolation from options that do have liquidmarket prices available.The interpolation methodology translates prices of liquid options intoimplied volatilities using the Black-Scholes formula, interpolates theseimplied volatilities to implied volatilities for less liquid options(interpolationisbasedonbothstrikeandtenor),andthentranslatesimpliedvolatilitiestopricesofthelessliquidoptions,againusingtheBlack-Scholesformula. Limits and reserves are needed to control uncertainty in theinterpolation process. Section 11.6 gives a detailed account of thisinterpolationmethod.Notehowcloselyboundtogetherthethreeoperativelegsofthisparadigmare.
TheBlack-Scholesformulaservesasthegluethatbindsthemtogether:Theprice-volmatrixshowshowtheportfoliovaluationwillchangebasedonajointdistributionofchangesinunderlyingassetpriceandimpliedvolatility.However,many(probablymost)oftheoptionsintheportfoliolackliquidmarketprices,sotheirvaluationdependsontheinterpolationstep.Furthermore,thecalculationofthechangeinoptionvalueforachangeofassetpriceandimpliedvolatilityiscalculatedusingtheBlack-Scholesformula.
Aswillbeseeninthedetaileddiscussionoftheprice-volmatrix,allcalculationsaredoneundertheassumptionthatexposuretosmallchangesinunderlyingassetpricehavebeendeltahedgedwithapositionintheunderlyingasset,sothevalidityoftheprice-volmatrixdependsontheexecutionofthisdynamicdeltahedging.TheneedforthisapproachtooptionsriskmanagementisbasedontheflatrejectionofthekeyassumptionsoftheBlack-Scholesmodel:continuousrehedging,notransactioncosts,nopricejumps,andknownandconstantvolatility.How,then,canwecontinuetorelyontheBlack-Scholesmodeltocalculatetheimpactofchangesinunderlyingassetprice,calculatethetargetdeltahedges,andplayacriticalroleinvalueinterpolation?Theansweristhatpositionlimitsbasedontheprice-volmatrixarebeingcountedontokeepriskexposureslowenoughthatdeviationsfromtheBlack-Scholesassumptionswillnothavethatlargeaneffect.Smallriskexposuresmeanthatthesizeofrequireddeltahedgeswillbesmallenoughthattransactioncostswillnotbethatsignificant.SmallriskexposuresmeanthatthedifferencesbetweentheBlack-Scholesmodelandthepresumablymuchmorecomplextruemodel(whateverthatmaybe)aresmallenoughtoholddowntheerrorsduetovaluingandhedgingbasedonamodelthatisonlyanapproximationtoreality.
Itisimportanttobeawareofthedegreetowhichthisparadigmdependsontheavailability of market liquidity for hedging instruments. The paradigm worksbestwhen reasonable liquidity in vanilla options is available for at least somecombinations of strike and tenor. This enables risks to be hedged by activelypursuingthepurchaseandsaleofoptionstolowerexposuresasmeasuredbytheprice-volmatrix.AswewillseeinExercise11.1,price-volmatrixexposurescanbeheldreasonablyflatevenifonlyasmallnumberofstrike-tenorcombinationsprovide significant liquidity. The valuation of options with other strike-tenorcombinationscanbeinterpolatedfromtheliquidset.If a particular optionsmarket does not have liquidity, the paradigmcan still
workreasonablywellaslongastheunderlyingassethasliquidity.Theprice-volmatrixnowservesprimarilyasameasureofpositionimbalance.Itcanserveasasignal to marketers to encourage customer business at some strike-tenorcombinationsanddiscourageitatothers.Itcanbeusedtoplacelimitsonnewcustomerbusinesswhenthiswouldcauserisktoexceedmanagementguidelines.It can be used as input to setting limits and determination of reserves againstilliquid concentrations of risk. It can also be used as input to calculations of
portfolioriskssuchasvalueatrisk(VaR)andstresstests.Priceinterpolation,inthe absence of liquid market quotations, becomes primarily a mechanism toenforcetheconsistencyofvaluations.Deltahedgecalculationscontinuetoservethefunctionofdirectingdynamichedgingandensuringtheproperrepresentationofoptionspositionsinfirmwidereportsofspotandforwardrisk.Itisfarmorequestionabletoemploythisparadigmintheabsenceofliquidity
intheunderlyingasset.Inthiscase,itisdoubtfulthatdynamicdeltahedgingcanbe carried out in any systematic way, and it probably becomes preferable toanalyze positions based primarily on how theywill behave under longer-termscenarios, with limits and reserves calculated from this scenario analysis. Anexamplewherethismayapplyisforoptionswrittenonhedgefundresultswherethereare restrictionson theability tobuyand sell theunderlying,which is aninvestmentinthehedgefund.AspecificcasetoillustratethispointistheoptionUnion Bank of Switzerland (UBS) wrote on Long-Term CapitalManagement(LTCM)performance(seeSection4.1.5).How well does this paradigm work? Trading desks that have years of
experience using it have generally been satisfied with the results. But this isinsiderknowledgeandmaybespecifictoconditionsinparticularmarkets.Howcan outsiders get comfortable with these assumptions, and how can theseassumptionsbetestedinnewoptionsmarkets towhichtheymightbeapplied?The best tool available isMonte Carlo simulation, inwhich all of the Black-Scholesassumptionscanbereplacedwithmorerealisticassumptions,includinglimitsonhedge frequency, transactioncosts,uncertainvolatility,nonlognormalchanges in theunderlyingprice,andprice jumps. InSection11.3,weexaminetheresultsofatypicalMonteCarlosimulationtoseewhatitindicatesaboutthefeasibilityofthisriskmanagementparadigm.
11.2THEPATHDEPENDENCEOFDYNAMICHEDGING
Tounderstandoptionspricing,an importantdistinctionmustbemadebetweenpath-independent and path-dependent options. A path-independent option'spayoutdependsonlyonwhatthepriceofsomeunderlyingassetwillbeatoneparticularpointintimeanddoesnotdependontheactualpathofpriceevolutionbetween the current date and that future date. All European-style options arepath independent. Exotic options are divided between path-independent and

path-dependentoptions.InChapter12onmanagingexoticoptionsrisk,wewillseethatpath-independentoptionsaregenerallymucheasiertoriskmanagethanarepath-dependentoptions.Although, when considered in isolation, European-style options are path
independent,oncewestarttoevaluatetheimpactofdynamichedging,wefindthat dynamic hedgingmakes “every option become path dependent.” (This isquoted from Taleb [1997, Chapter 16]. I strongly recommend reading Taleb'sChapter 16 along with this chapter.) This is a direct consequence of thelimitations of the Black-Scholes assumptions, since continuous hedging at aknown constant volatility would result in a definite value with no variation(hence,youwouldachievenotjustpathindependence,butindependenceofthefinalunderlyingassetvalueaswell).Sporadicdynamichedgingandstochasticvolatilitymake the realizedvalueofadynamichedgingstrategydependentonthe full price history of the underlying asset. Let's illustrate this with a fewexamples.ThefirstexampleisbasedononepresentedinTaleb(1997,270).Itisanout-
of-the-money call on $100 million par value of a stock with 30 days toexpiration that is purchased for $19,000. If no dynamic hedging is attempted,thentheoptionwillexpireeitherout-of-the-moneyforatotallossofthe$19,000premiumor in-the-moneywith upside potential. The amount of returnwill becompletelydependentonwhere theunderlyingassetprice finishes in30days.Suppose a trader wanting to reduce the uncertainty of this payoff attempts todynamicallyhedgeherposition.Talebdemonstratesaplausiblepricepathfortheunderlying asset that results in a loss of $439,000, not even counting anytransaction costs. TheNastyPath spreadsheet provided on the course websiteenables you to see the details of this path and experimentwith the impact ofotherpossiblepaths.Whatisitaboutthepaththatleadstoalossthatissolargerelativetotheoption'scost?Trytoreachyourownconclusion.IwillprovidemyanswerattheendofSection11.5.Thesecondexampleisdrawnfrommyownexperience.Inearly1987,Iwas
part of a team at Chase Manhattan that introduced a new product—a termdeposit for consumers thatwould guarantee a return of principal plus a smallinterestpayment,butcouldmakehigher interestpaymentsbasedona formulatied to the closing price of the Standard & Poor's (S&P) stock index on thematuritydateofthedeposit.Althoughthestockmarkethadbeenshowingverygood returns in the mid-1980s, stock market participation among smallerinvestors was still not well developed. Therefore, a product that would be
FederalDepositInsuranceCorporation(FDIC)insured,wouldguaranteeagainstloss, and would provide some upside stock participation quickly attracted asizableamountofinvestment.Our hedging strategy for this product was to invest part of the proceeds in
standarddepositproducts,ensuringtheabilitytoreturnprincipalplusguaranteedminimuminterest,andusetheremaindertofundanS&Pindexcallposition.Asmightbeanticipatedby thosewhoremember thefinancialeventsof1987, thisproductsufferedanuntimelydemiseintheautumnofthatyear.Afterthestockmarket crash of October 19, consumer interest in possible stock marketparticipation sharply diminished, so new funds stopped coming in. We alsoexperienced severe losses on our hedging of the existing product, and thepostmortem we conducted to determine the reason for these losses producedsomeinterestingresults.The equities options markets were at a very early stage of development in
1987, so therewasvirtuallyno liquidity foroptionswith tenorsbeyonda fewmonths. Since our market research had determined that there would be littleinterest in a deposit product with tenors shorter than a year or two, we haddecidedto initiallyrelyentirelyonadynamichedgingstrategy,usingaBlack-Scholes–determineddeltahedge.Wewerecertainlyawareofthevulnerabilityofthis approach to high volatility, but we had done extensive research on thehistoricalpatternsofstockmarketvolatilityandconcluded thatwecouldpricetheproduct at an impliedvolatility that allowed amargin for error thatwouldresultinhedginglossesonlyinextremelyrarecases.Notsurprisingly,ourpostmortemshowedsignificantlossesduetoourinability
tocarryout thedelta-hedgingstrategyduringtheperiodofOctober19andthefollowing few days. The cash and futures equitiesmarkets during that periodwere highly illiquid in the face of panicky selling, and therewere even someshortperiodsinwhichthemarketswereclosedinanattempttorestorestabilityto chaotic trading. Illiquidmarkets in theunderlyingduring largepricemovesresultingappinglossestooptionssellersemployingdynamichedgingstrategies.Wewerenotaloneinthisvulnerability.InOctober1987,asubstantialnumberofassetmanagersfollowingportfolioinsurancestrategiesinwhichtheyattemptedto achieve the payoff profiles of an option through delta hedging experiencedheavylossesasaresultofthisgapping.Whatwas less expected, though,wasour finding that a considerablepart of
ourlosswouldhavebeenexperiencedevenifthemarketshadnotgapped.Ourlosswasduetohigher-than-anticipatedvolatility.Thiswasdespitethefactthat

when we looked over the tenor of our deposit product the average realizedvolatilitywaswellwithin the rangewehad anticipated inpricing theproduct.Here's where path dependence comes in. The average realized volatilityconsisted of very high volatility during a short period when the market wasplungingsharply,whichwasprecededandfollowedbyperiodsofmuch lowervolatility.However, exposure tovolatilitydependson the relationshipbetweenthe price level and strike.The higher-than-average volatility during the periodwhen prices were falling sharply cost usmuchmore thanwe saved from thelower-than-averagevolatilityduringtheotherperiods.This phenomenon can be easily illustrated with some simple Black-Scholes
calculations.Supposeyouhavewrittenaone-yearcalloptionwithastrikeequalto thecurrent forwardprice.You intend todeltahedgeandexpectvolatility toaverage20%overtheyear.Ifyouarewrongandvolatilityaverages30%,yourexpected losseswill beBS(100%,1, 30%)−BS(100%, 1, 20%)= 11.923%−7.966%=3.957%.Supposeone-tenthofayeargoesbyandtheforwardpriceisat the same level as when youwrote the option. Your remaining exposure tovolatility averaging 30% is BS(100%, 0.9, 30%) − BS(100%, 0.9, 20%) =11.315% − 7.558% = 3.757%. So 3.757%/3.957% = 94.9% of your volatilityexposurecomesinthelast90%oftheoption'slifeandonly5.1%comesinthefirst 10% of the option's life (a consequence of the fact that = .949).However, if thepriceat theendofone-tenthof ayearhas fallenby30%, theremaining exposure to volatility averaging 30% is BS(70%, 0.9, 30%) −BS(70%,0.9,20%)=1.188−0.184=1.004.So(1.004%/3.957%)=25.4%ofyour volatility exposure comes in the last 90% of the option's life and 74.6%comesinthefirst10%oftheoption'slife.Averysimilareffectwillbeseenforalargeriseinunderlyingprice.With the benefit of experience, we concluded that we had badly
underestimatedtheriskoftheproduct.First,wehadnottakenintoaccountthepotential lossesfrompricinggaps.Second,thechancesofvolatilitybeingveryhighduringashorttimeperiodaremuchlargerthanthechancesofitbeingveryhigh during a long time period, so we had not properly calculated ourvulnerability to a short period of high volatility combined with a large pricemove. Third, we had not looked at the impact of other market participantspursuing strategies similar to ours, thereby decreasing liquidity by competingwithusforhedgesintheunderlyingwhenwemostneededthem.Whatwould have been amore prudentway ofmanaging this risk?We had
been considering, but had not implemented, a proposal from a broker in
exchange-traded, shorter-term S&P options for a hedge of our longer-termoptionswith these shorter-termoptions.SeeSection11.6.3 for a discussionoftheriskcharacteristicsofthishedge.
11.3ASIMULATIONOFDYNAMICHEDGING
In the immediately preceding section, we established that, under realisticeconomicassumptions,dynamicallyhedgedoptionsarepathdependent. In thesectionbeforethat,weobservedtheneedfortestinghowwelltheparadigmofmanaging options risk using Black-Scholes theory works. Both sections pointtowardusingMonteCarlosimulationtoseewhattheprobabilitydistributionofresultscanbefordynamicallyhedginganoptionsportfolio.UsingMonteCarlo simulation fordynamichedgingoptions is an invaluable
toolforunderstandinghowthemanagementofanoptionstradingbookworksinpractice.Whennewoptionsproductsorhedgingstrategiesareproposed,tradersandriskmanagersalikewillwanttolookatsimulationresultstoassesspotentialpitfalls. This is an example of the use of simulation in model testingrecommended in Section 8.4.3. Simulation gives the flexibility to take intoaccount the impact on hedging results of real-life constraints such as liquidityconstraints on the size of changes in hedges that can be performed in a giventimeperiod(ortheimpactoflargerchangesonthepriceatwhichthehedgecanbeexecuted).Simulation also provides a vital learning tool for peoplewho are unfamiliar
withtheworkingsofoptionsmarkets.Theoreticaldemonstrationsofthepowerof dynamic hedging rarely carry the conviction that can be provided byobservinghundredsofsimulationpathsthat,despitewildgyrationsinunderlyingprices, produce almost identical hedging results. Nothing short of actuallysuffering through a losing options strategy can convey the pain of anunsuccessfulhedgeaswillobservingthelossespileuponasimulationpath.InthecourseIteach,onwhichthisbookisbased,Ihavealwaysinsistedthat
eachstudentpersonallyprogramandrunsimulationsofadynamichedge.Ilackacomparablepowerofpersuasionoverreadersofthisbook,butIurgeeachofyou to do asmuch ofExercise 11.2 as you can. Even if you lack the time toprogram your own simulation, you should at least do parts 4 and 5 of thisexerciseusingtheprovidedspreadsheets.

What featuresdowewant aMonteCarlo simulationofdynamichedging tocontain?
Thesimulationmustbeoverasufficientlylargenumberofpossiblepricepathstoproducestablestatistics.Pricesfortheunderlyingvariablemustbesampledatenoughpointsoneachpathtoallowforrehedging.Sincevolatilityoftheunderlyingpriceisnotconstant,butisastochasticvariable,arandomprocessshoulddriveit.Datatodeterminereasonablevaluesofvolatilitycanbeobtainedbylookingathistoricaldistributionsofrealizedvolatilityforseparatetimeperiods.Aseparatevolatilityshouldbechosenforeachpathgenerated.Thedistributionoftheunderlyingpricedoesnotnecessarilyneedtobelognormal.Differentmixturesofnormalandlognormalprocessesshouldbetried.Rehedgesshouldbeallowedonlyatperiodicintervals,andtransactioncostsofthehedgeshouldbecalculatedexplicitly.Differentrulesfordetermininghedgeamounts,asdiscussedinSection11.5,shouldbeconsidered.WhencalculatingBlack-Scholesdeltasforrehedging,yougenerallydonotwanttotakeadvantageofknowingwhatvolatilityisbeingusedforthepath,sincethiswouldnotbeavailableinmakingactualhedgingdecisions.Eitheryouwanttousethesameimpliedvolatilitytocalculaterehedgesonallpathsoryouwanttousesomeadaptiveruletyingvolatilityusedtothehistoryofpricemovesonthepathuptothetimeoftherehedge.Arandomprocessofsignificantpricejumps,wherenorehedgingispermitteduntilafterthejumpiscompleted,canbeusedasasimulationofperiodsofilliquidity.Whensimulatingaportfolioofoptionsforoneparticularexpirydate,itisusuallyconvenienttoassumethatallhedgesareperformedwithaforwardwiththesameexpirytoavoidneedingtokeeptrackofdiscountingrates.Whensimulatingoptionswithdifferentexpirydates,someassumptionsaboutdiscountingratesmustbeusedtoarriveatrelativepricesbetweenforwards.
In effect, we are testing the performance of the Black-Scholes model as ahedging tool by running aMonteCarlo simulation based on amore complex,andpresumablymoreaccurate,modelofunderlyingpricebehaviorthanBlack-Scholes utilizes.Why not just value and hedge options by directly using thismorecomplexandcompletemodel?Fortworeasons:
1.Computationalcomplexity.ThespeedofthecomputationoftheBlack-

Scholesmodelforvaluationandthefastanddirectcomputationofthetargetunderlying hedge are enormous advantages in providing timely riskinformationonportfoliosofoptionsthatmayhavemanythousandsofdealsoutstanding at any given time. By contrast,more complexmodels can beorders of magnitude slower when computing valuations and often lack adirectcomputationoftargethedges,requiringmultiplerunsofthevaluationalgorithm to determine the appropriate hedge. This advantage canparticularlybeseeninMonteCarlotestingofhedgeeffectiveness.Ateachpotentialrehedgepoint,theBlack-Scholestargethedgeisasimpleequation;amorecomplexmodelmayrequirefullrecalibrationtocomputeeachhedge(seeSection12.3.2foradiscussionofthispointinconjunctionwithhedgingbarrieroptions).2.Validity.Wedon'tnecessarilyknowwhatthecorrectmodelis.Fortestinghedge performance with Monte Carlo, we can make different runs withalternativecandidatesforthecorrectmodel.Asafirstexampleofasimulation,let'slookatacomparisonbetweenhedging
anoptionusingapureBlack-ScholeshedgeandhedgingusingacombinationofBlack-Scholesdeltahedgingandhedgingwithotheroptions.Wemaysupposethatanoptionhasbeensoldatastrikeforwhichnoliquidityisreadilyavailable.Wecaneitherutilizeadynamichedgingstrategyorbuysomeoptionsatstrikesforwhichliquidity isavailableandthenutilizeadynamichedgingstrategyfortheresidualrisk.For this example,wewill assume that a one-year option has been sold at a
strike 5 percent in-the-money and that one-year options are available forpurchase at strikes at-the-money and 10 percent in-the-money. For the secondcase,wewill consider purchasing the samenotional amount of options as hasbeensold,but split50–50between theat-the-moneyoptionand10percent in-the-moneyoption.Thereasonforthinkingthatthismightbeagoodhedgewillbe shown inSection 11.4.Therewewill see that the price-volmatrix for thisportfolio(Table11.9)showsverylittlesensitivitytochangesineitherthepricelevelorimpliedvolatility.Thisdoesnot,byitself,provethatthehedgewillworkwellover the lifeof theoption, since itonly showsa snapshotatonepoint intime.Infact,youwillbeabletoseefromTables11.10and11.11inSection11.4that although this portfolio does continue to show low sensitivity to price onvolatility shifts for a substantial time period, this sensitivity increases at somepointinitsevolution.SoweneedtheMonteCarlosimulationtogetastatisticalmeasureofthesensitivity.Table11.2showstheresultsofthesimulation.

TABLE11.2MonteCarloSimulationComparingPureDynamicDeltaHedgingwithCombinedStaticOptionandDynamicDeltaHedging
In the context of the discussion of model risk in Section 8.4, the 50−50mixtureofat-the-moneyoptionand10percent in-the-moneyoptionconstitutesthe liquid proxy that would be used to represent the 5 percent in-the-moneyoption in standard risk reports, suchasVaRand stress tests.TheMonteCarlosimulation would be used to generate a probability distribution of howmuchextrariskthereisinholdingthe5percentin-the-moneyoptionthanthereisinholdingtheliquidproxy.Theassumptionthatthe50−50mixturewillconstitutea good hedge all the way to the expiration of the option is a simplifyingassumption thatmakes theMonteCarlo simulation easier. In reality, a tradingdesk would change this mixture through time, particularly as time to optionexpirywasclose.ButwhileaMonteCarlosimulationthatincludedchangesinthe mixture would be more realistic, it would also be far more difficult toperform. Changes in the volatility surface would need to be simulated, sincechanges in the mixture will require purchases and sales of options at future
dates; transaction costs for purchases and sales of options would need to beincluded;behavioralrulesfortradingdecisionswouldbeneededonthetrade-offbetweenthesetransactioncostsandthedesirabilityofchangingthemixture.Whatconclusionscanwereach?Ifthestandarddeviationofvolatilityiszero,thenboththepuredynamichedgingandthemixed-option/dynamichedgingstrategiescanachieveaslowastandarddeviationofresultsasyoulikebyincreasingthefrequencyofrebalancingthedynamichedge,althoughthemixedstrategyachievesagivenlevelofstandarddeviationwithfarfewerrebalancingsthanthepurestrategy.Foreitherstrategy,thereisatrade-offbetweenhigherexpectedtransactioncostswithmorefrequentrebalancingandlowerstandarddeviationsofresults.(Standarddeviationsoftotalresults,includingtransactioncosts,don'tdiffersignificantlyfromthestandarddeviationswithouttransactioncosts,whichareshowninTable11.2.)However,themixedstrategycanachieveadesiredlevelofstandarddeviationatafarlowertransactioncostlevelthanthepurestrategy.Forexample,achievinga3%standarddeviationwiththepurestrategyrequiresabout900rebalancingswithanassociatedtransactioncostof15.0%.Achievinga3%standarddeviationwiththemixedstrategyrequiresabout150rebalancingswithanassociatedtransactioncostofabout0.8%.Ifthestandarddeviationofvolatilityis33%,thenthereisalowerboundonhowmuchthestandarddeviationofresultscanbedecreased.Forboththepureandmixedstrategies,thislowerboundisreachedatabout250rebalancings.Thelowestlevelofstandarddeviationofresultsthatcanbeachievedbythemixedstrategyisaboutone-tenthofwhatcanbeachievedbythepurestrategy,roughly4%comparedtoroughly40%.Theinabilitytoreducethestandarddeviationofresultsbelowalowerboundisduetoboththeuncertaintyofvolatilityandtheuseofincorrectvolatilityinputsinforminghedgeratios.However,thefirsteffectismanytimeslargerthanthesecond.AMonteCarlorunwith33%standarddeviationofvolatility,butwithhedgeratiosoneachMonteCarlopathbasedontheactualvolatilityofthatpath,resultsinalowerboundonthestandarddeviationofresultsthatisonlyreducedfrom40to36%
Please note that although we are using standard deviation as a convenientsummarystatistictogivearoughfeelforrelativelevelsofuncertainty,bothinthis example and others in this book,more detailed analysiswould be neededbeforearrivingatanypreciseconclusions.Forexample,ifameasurewasbeing
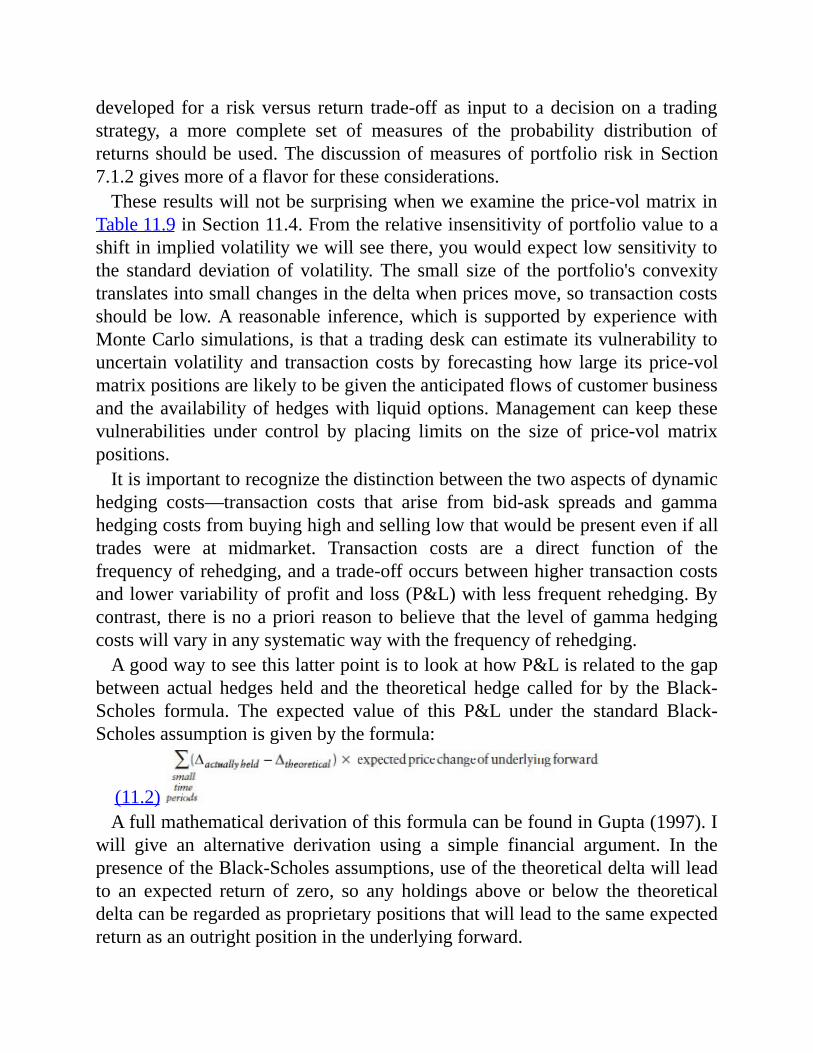
developed for a riskversus return trade-off as input toadecisionona tradingstrategy, a more complete set of measures of the probability distribution ofreturnsshouldbeused.Thediscussionofmeasuresofportfoliorisk inSection7.1.2givesmoreofaflavorfortheseconsiderations.Theseresultswillnotbesurprisingwhenweexaminetheprice-volmatrixin
Table11.9inSection11.4.Fromtherelativeinsensitivityofportfoliovaluetoashiftinimpliedvolatilitywewillseethere,youwouldexpectlowsensitivitytothe standard deviation of volatility.The small size of the portfolio's convexitytranslatesintosmallchangesinthedeltawhenpricesmove,sotransactioncostsshouldbe low.A reasonable inference,which is supportedby experiencewithMonteCarlosimulations,isthatatradingdeskcanestimateitsvulnerabilitytouncertainvolatility and transactioncostsby forecastinghow large itsprice-volmatrixpositionsarelikelytobegiventheanticipatedflowsofcustomerbusinessand theavailabilityofhedgeswith liquidoptions.Managementcankeep thesevulnerabilities under control by placing limits on the size of price-vol matrixpositions.Itisimportanttorecognizethedistinctionbetweenthetwoaspectsofdynamic
hedging costs—transaction costs that arise from bid-ask spreads and gammahedgingcostsfrombuyinghighandsellinglowthatwouldbepresentevenifalltrades were at midmarket. Transaction costs are a direct function of thefrequencyofrehedging,andatrade-offoccursbetweenhighertransactioncostsandlowervariabilityofprofitandloss(P&L)withlessfrequentrehedging.Bycontrast, there isnoapriorireasontobelievethat the levelofgammahedgingcostswillvaryinanysystematicwaywiththefrequencyofrehedging.AgoodwaytoseethislatterpointistolookathowP&Lisrelatedtothegap
between actual hedges held and the theoretical hedge called for by theBlack-Scholes formula. The expected value of this P&L under the standard Black-Scholesassumptionisgivenbytheformula:
(11.2)AfullmathematicalderivationofthisformulacanbefoundinGupta(1997).I
will give an alternative derivation using a simple financial argument. In thepresenceoftheBlack-Scholesassumptions,useofthetheoreticaldeltawillleadto an expected return of zero, so any holdings above or below the theoreticaldeltacanberegardedasproprietarypositionsthatwillleadtothesameexpectedreturnasanoutrightpositionintheunderlyingforward.

Theconsequenceofthisformulafortherelationshipbetweengammahedgingcostsandthefrequencyofrehedgingisthatasrehedgingbecomeslessfrequent,it widens the gap between actually held and theoretical. However, unless a correlationbetween the sign of this gap and the sign of the expected price change in theunderlying forward is expected for some reason, the expected value of theincrementalP&Lshouldbezero.(AlthoughthisformulaisstrictlycorrectonlyinthecasewheretheBlack-Scholesassumptionshold,MonteCarlosimulationwithstochasticvolatilityshowssimilarresults.)Aretherecaseswherewemightexpectarelationshipbetweenthesignofthe
deltagapandthesignofexpectedpricechangesintheunderlyingforward?Let'sconsider a case that will cast an interesting light on a long-standing debateamongpractitioners.Thedebateisoverwhatoptionspricingisappropriateforamarket in which the underlying process showsmean reversion, resulting in anarrower dispersion of future price levels than would be implied by a purerandomwalkwiththeshort-termvolatilityoftheunderlyingprocess.Onegrouparguesthatdelta-hedgingcostsarecompletelyafunctionofshort-termvolatility,someanreversionisirrelevanttopricing.Theopposinggrouparguesthatrisk-neutralvaluationprinciplesshouldresultinthesamepricingofoptionsaswouldbeimpliedbytheprobabilitydistributionoffinalprices;comparethediscussionheretoRebonato(2004,Sections4.7and4.8).Some of this dispute reflects a failure to distinguish between the short-term
volatility of spot prices and forward prices. If themarket is pricing themeanreversion process into the forward prices, we should expect to see a lowerhistorical short-term volatility of forward prices than a historical short-termvolatility of spot prices. Equivalently, this can be viewed as a correlationbetweenchangesinspotpricesandchangesinthediscountrateoftheforwards,a pattern that can be seen in the market for seasonal commodities. Whenseasonaldemandishighorseasonalsupplyislow,spotpricesrise,butsodoesthediscountrate,dampeningtheriseinforwardprices.Whenseasonaldemandisloworseasonalsupplyishigh,spotpricesfall,butsodoesthediscountrate,dampeningthefallinforwardprices.Sincetheoptioncanbedeltahedgedwiththeforward,replicationcostswillbetiedtothevolatilityoftheforward,soweshouldexpectimpliedoptionvolatilitiestoreflecttheimpactofmeanreversionrelativetothevolatilityofthespotprice.Suppose that a trader believes that the market has not adequately priced in
meanreversion,soheexpectsthatforwardpriceswillshowmeanreversion.Inthiscase,wecannotresolvethecontroversybetweenthetwodifferingviewson

options pricing by an appeal to the difference between short-termvolatility ofspotandforwardprices.LetuslookattheresultsofaMonteCarlosimulationinwhichweignoretransactioncostsandstudytheimpactofrehedgingatafixednumber of evenly spaced intervals. We will calculate statistics for the wholesampleofpaths,butalsoforthreesubsamples:
1.Thethirdofpathshavingthehighestfinishingforwardprices,whichwecantakeasrepresentingupwarddriftoftheforward.2.The thirdofpathshaving the lowest finishingforwardprices,whichwecantakeasrepresentingdownwarddrift.3.Theremainingthirdofthecases,whichwecantakeasrepresentingmeanreversion.Table11.3showstheresultingexpectedvaluesofadelta-hedgingstrategyfor
awritten(sold)option(forapurchasedoption,thesignswouldbereversed).TABLE11.3ImpactofDriftandMeanReversiononDynamicHedgingResults
Whatconclusionscanwedraw?Asyouincreasethefrequencyofrehedging,yougetthesameexpectedresultsregardlessofdriftormeanreversion.Thisisconsistentwiththetheoreticalresultthat,undertheBlack-Scholesassumptions,standarddeviationofresultsgoestozeroasthefrequencyofrehedgingincreases,sotheP&Lwillbethesameoneverypath.ItisalsoconsistentwithEquation11.2,sincefrequentrehedgingdrivesthedifferencebetweenthe actuallyheldand
theoreticaltermstozero.Asyoudecreasethefrequencyofrehedging,youincreasethelossesfromasoldoptionwithdriftorapurchasedoptionwithmeanreversion,andyouincreasethegainsfromasoldoptionwithmeanreversiononapurchasedoptionwithdrift.AlloftheseresultsareconsistentwithEquation11.2.Forexample,here'sthereasoningformeanreversiononasoldoption:Itislikelythatoneperiod'supmovewillbefollowedbythenextperiod'sdownmove,andviceversa.Afteranupmove,the theoreticalonthesoldoptionwillincrease,butifnorehedgeisperformed,duetotheinfrequencyofrehedging,thiswillmakethe actuallyheld− theoreticalforthenextperiodbe

negative.Sincetheexpectedpricechangeinthenextperiodisnegative,theexpectedP&Listheproductoftwonegatives,andhencepositive.Theconsequenceofthelastpointforhedgingstrategiesisthatifyouanticipatemeanreversion,youshouldtrytodecreasehedgingfrequencyforasoldoption(whichalsosavestransactioncosts,butincreasestheuncertaintyofreturn)andtrytoincreasehedgingfrequencyforaboughtoption(butthisneedstobebalancedagainsttheincreaseinhedgingcostsanduncertaintyofreturn).Thisisintuitivelycorrect.Astheoptionseller,youwanttoholdoffonrehedgingsinceyouexpectthemarkettorebound;astheoptionbuyer,youwanttotakeadvantageofthemarketmovewitharehedgepriortotheexpectedrebound.Conversely,ifyouanticipateadriftingmarket,whetherupordown,youshouldtrytodecreasehedgingfrequencyforaboughtoptionandincreasehedgingfrequencyforasoldoption.Ifyoucannotanticipateeitherdriftormeanreversion,thereisnodifferenceingammahedgingcostsbasedonthefrequencyofrehedging,sothedecisionrestspurelyonthetrade-offbetweentransactioncostsandtheuncertaintyofreturn.
11.4RISKREPORTINGANDLIMITSThebesttoolformanagingresidualoptionsriskonatradingdeskistheprice-vol matrix, which depicts valuation sensitivity to joint distributions of twovariables:theassetpriceandimpliedvolatility.ThePriceVolMatrixspreadsheetonthewebsiteforthisbookcalculatesaprice-volmatrixforasmallportfolioofoptions.Seetheaccompanyingdocumentationfordetails.Wewillnotejustthreeimportantpointsaboutthecomputation:
1.AllboxesinthematrixrepresentfullvaluationsusingtheBlack-Scholesmodel utilizing the shifted volatility level and underlying price level. Noapproximationsarebeingusedinthecomputation.2. Each box assumes that an underlying position has been put on toneutralizetheinitialdeltapositionoftheoptions.3.Onlytheinitialdeltapositionisneutralized;nodeltarehedgingisallowedduringapriceshift.Therefore,theprice-volmatrixrepresentsthepotentialimpactofpricejumpsthatcannotbedeltahedged.For those who respond better to visual presentations than to numerical

information,thespreadsheetproducestwographicalrepresentationsoftheprice-volmatrix:
1.Athree-dimensionalsurfaceof theP&Lconsequencesofchangesintheunderlyingpriceandimpliedvolatility.2.Achart showingchanges invaluation, delta, vega, andgammaaspricelevelschange.The price-volmatrix enables a trading deskmanager to see at a glance the
convexity (the nonlinear impact of large price changes), vega (sensitivity to asmall change in implied volatility), nonlinearities in vega, and interactionsbetween convexity and vega. The price-volmatrix can pick up discontinuitiescausedbystrikesinaportfolioclusteringaroundcertainlevels.Inorderfortheprice-volmatrixtohighlightnonlineareffects,itisbesttoassumethatanylineardelta position has already been hedged. To the extent that the trading bookchooses not to hedge delta risk, the resulting underlying position should bereported separately and be subject to limits separate from those on optionspositioning for the reasons given in Section 6.2 concerning the need for clearseparationoflinearandnonlinearrisks.Traders have recently shown greater focus on the sensitivity of vega to
changes in implied volatility and the sensitivity of vega to changes in spot.Asign of this increased focus is that these sensitivities have acquired their ownmockGreek names, vomma, also known aswisoo, and vanna, also known asDdelV, respectively. Note that the price-volmatrixmeasures changes in P&Limpactduetobothvommaandvanna.AlsonotethattheconvexitymeasuregoeswellbeyondasimpleP&Limpactofgamma,whichisjustthesecondderivativeof price changes, and hence determines the second-order term in the Taylorexpansionofoptionpriceintermsofunderlyingprice.SincethematrixisfilledinbyafullrevaluationoftheBlack-Scholesmodelforeachbox,theimpactofasmany terms in theTaylor seriesasdesiredcanbepickedupbya sufficientrefinementoftheunderlyingpricegrid.The price-volmatrix is a valuable tool both in the daily P&L reconciliation
needed to control model risk (compare with Section 8.2.7.1) and in P&Lapproximationsused inVaRandstress testcalculations (comparewithSection7.1.1.2).Whentheprice-volmatrixisusedformakingP&Lapproximations,itisoftenreferredtoasaheatmap.ForP&Lreconciliation,itallowsaquickfirst-cutcalculationofP&Lchangefromthecloseofonebusinessdaytothecloseofthenextbusinessdaydue to thecombinedchange inunderlyingpriceandoverallvolatilitylevelifnodeltahedginghadbeenperformedduringtheday.Itcanthen
besupplementedbymoredetailedcalculationsofP&Lchangesduetochangesintheshapeofthevolatilitysurfaceandduetodeltahedgingperformedduringtheday.P&Lduetochangesinvolatilityshapecanbecalculatedfromamatrixthat breaks down vega exposure by strike and by time to expiry (thePriceVolMatrixspreadsheetcontainsasamplecomputationofavegaexposurematrix).AnothervaluabletoolforP&Lapproximationisdollargamma.Dollargamma
iscalculatedasone-halfthegammamultipliedbythesquareofthecurrentpricelevel.ItsuseinP&Lapproximationisthatwhenyoumultiplyaportfolio'sdollargamma by the difference between the volatility at which positions have beenmarkedandtheactualpricemovefortheday,yougetagoodfirstestimateofadelta-hedgedportfolio'sP&Lfor theday.AgoodexplanationofdollargammaandsamplecalculationscanbefoundinAllen,Einchcomb,andGranger(2006,Section4.1).Wewillnowuse theprice-volmatrix toexaminesomerepresentativeoption
positionsasawaytolearnaboutbothriskcharacteristicsofthepositionsandtheanalyticpoweroftheprice-volmatrix:
Shortacalloption.Thisisthesimplestpossibleoptionsportfolio.Weareshortoneunitofaone-yearcallstruckat-the-money.Table11.4showstheprice-volmatrix.Naturally,vegaandgammaarebothnegative,andvegaremainsnegativeatallpricelevels.Negativevegaislargestat-the-moneyanddeclinesaspricesriseandfall,reflectingthedeclineinthetimevalueofanoptionasitgoesintooroutofthemoney.Thenegativegammaisreflectedinlargelossesfromeitherupordownpricejumpsatthecurrentvolatility.Callspread.Weareshortoneunitofaone-yearcalloptionstruckatthemoneyandlong1.06unitsofaone-yearcalloptionstruckat110percentoftheforwardprice.Table11.5showstheprice-volmatrix.The1.06unitshavebeendeliberatelyselectedtocreateaportfoliowithzerovega,gamma,andtheta.However,astheprice-volmatrixshows,thisisnotthesameassayingthereisnooptionsriskintheportfolio.
TABLE11.4PriceVolMatrixforBeingShortaCallOption
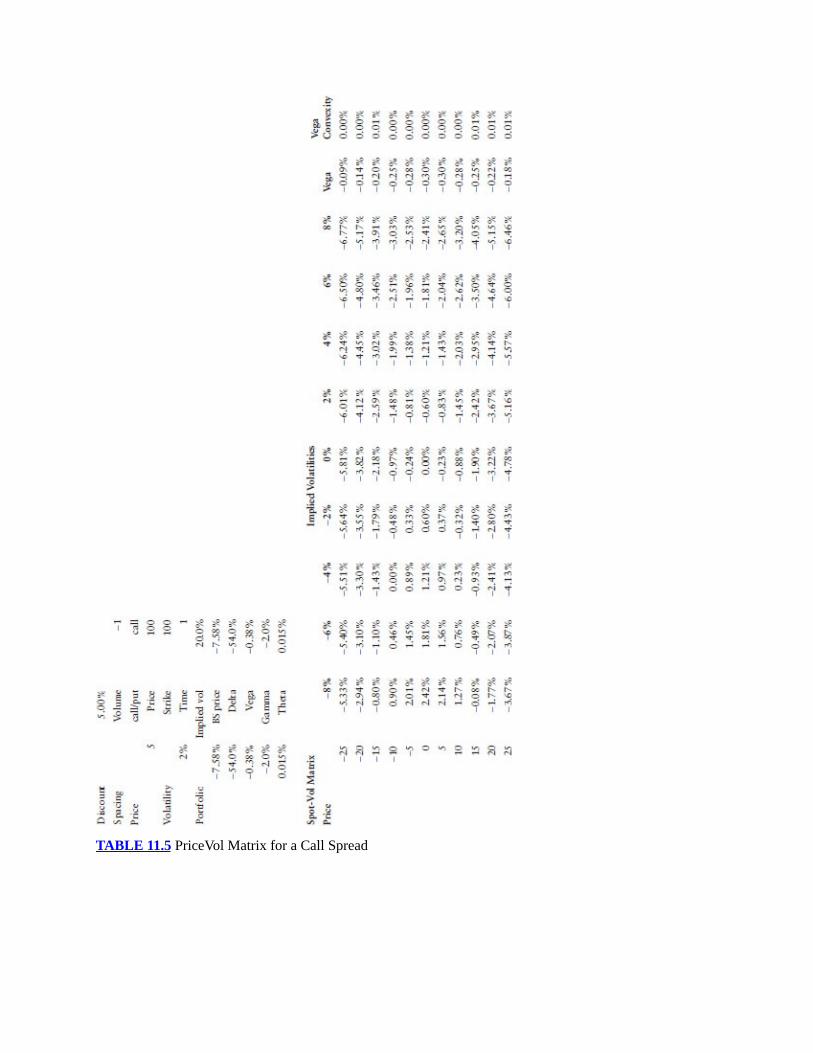
TABLE11.5PriceVolMatrixforaCallSpread

Focus on the center five boxes in the price-vol matrix of Table 11.5,representingthecurrentpriceandimpliedvolatility,aswellasoneshiftupanddowninpriceandimpliedvolatility,asshowninTable11.6.TABLE11.6CenterBoxesofPriceVolMatrix
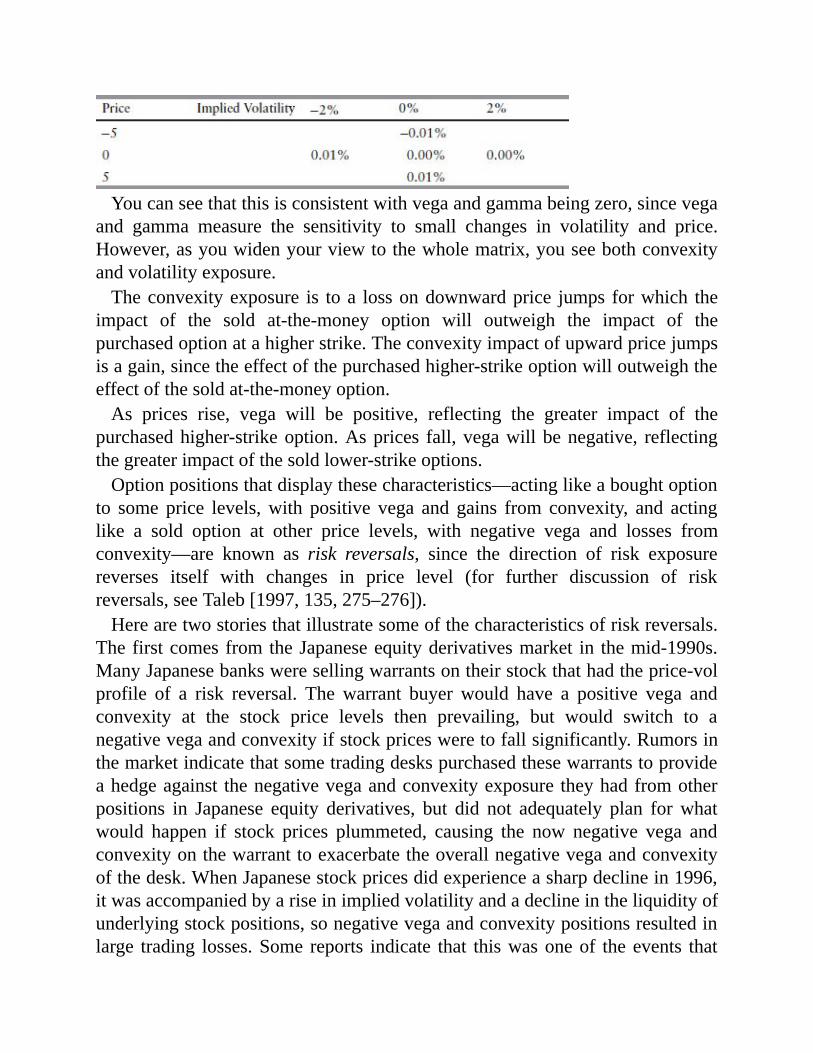
Youcanseethatthisisconsistentwithvegaandgammabeingzero,sincevegaand gamma measure the sensitivity to small changes in volatility and price.However,asyouwidenyourviewtothewholematrix,youseebothconvexityandvolatilityexposure.Theconvexityexposure is toa lossondownwardprice jumps forwhich the
impact of the sold at-the-money option will outweigh the impact of thepurchasedoptionatahigherstrike.Theconvexityimpactofupwardpricejumpsisagain,sincetheeffectofthepurchasedhigher-strikeoptionwilloutweightheeffectofthesoldat-the-moneyoption.As prices rise, vega will be positive, reflecting the greater impact of the
purchasedhigher-strikeoption.Asprices fall,vegawillbenegative, reflectingthegreaterimpactofthesoldlower-strikeoptions.Optionpositionsthatdisplaythesecharacteristics—actinglikeaboughtoption
to some price levels,with positive vega and gains from convexity, and actinglike a sold option at other price levels, with negative vega and losses fromconvexity—are known as risk reversals, since the direction of risk exposurereverses itself with changes in price level (for further discussion of riskreversals,seeTaleb[1997,135,275–276]).Herearetwostoriesthatillustratesomeofthecharacteristicsofriskreversals.
ThefirstcomesfromtheJapaneseequityderivativesmarket in themid-1990s.ManyJapanesebanksweresellingwarrantsontheirstockthathadtheprice-volprofile of a risk reversal. The warrant buyer would have a positive vega andconvexity at the stock price levels then prevailing, but would switch to anegativevegaandconvexityifstockpricesweretofallsignificantly.Rumorsinthemarketindicatethatsometradingdeskspurchasedthesewarrantstoprovideahedgeagainst thenegativevegaandconvexityexposure theyhadfromotherpositions in Japanese equity derivatives, but did not adequately plan forwhatwould happen if stock prices plummeted, causing the now negative vega andconvexityonthewarranttoexacerbatetheoverallnegativevegaandconvexityofthedesk.WhenJapanesestockpricesdidexperienceasharpdeclinein1996,itwasaccompaniedbyariseinimpliedvolatilityandadeclineintheliquidityofunderlyingstockpositions,sonegativevegaandconvexitypositionsresultedinlarge trading losses.Some reports indicate that thiswasoneof theevents that

contributedtothelargelossesatUBS(refertothediscussioninSection4.1.5).Thesecondstorygoesbackfurtherintimetotheearlydaysofoptionstrading.
Thebusinessexecutiveofanewlyformedoptionsbusiness,forwhichIwasincharge of analytics, came to me with a situation that was disturbing him. Arecent series of largemoves had occurred in this particularmarket,with largedecreases in underlying prices and increases in implied volatility followed bylargeincreasesinunderlyingpricesanddecreasesinimpliedvolatility.Theneteffectwasthatpricesandimpliedvolatilitieshadprettymuchfinishedupwherethey had started. Although the market had retained good trading liquiditythroughout, the implied volatility moves were substantial enough to triggermaterial P&L swings.What was disturbing to the business head was that thetrading book had been a loser in both the increase and decrease in impliedvolatility. The time period that was involved had been short enough that nosignificant change in the options position had taken place. So how could thispatternbeexplained?Thistradingdeskdidnotyethavearegularprice-volmatrix,butmyteamwas
able toputone together,whichquickly revealeda risk reversalpattern for theportfolio. At the price level that prevailed at the beginning of the period, theportfolio'svegawasnegative, leading to losses fromrising impliedvolatilities.Attheleveltowhichpricesthenfell,theportfolio'svegawaspositive,leadingtolosses from falling implied volatilities. So far, so good.But underlying pricesand implied volatilities ended where they began. In an unchanged portfolio,wouldn'ttheBlack-Scholesvaluationyieldthesameoptionpricesattheendofthe period as at the beginning of the period given that not enough time hadelapsed tomakea significantdifference? Itwouldbe agoodexercise to thinkthisthroughyourselfbeforeseeingmyanswer.Thekey tounderstandingwhathappened is that theportfoliowasnot really
unchanged since delta hedging had gone on throughout the period. Since themarkets had retained liquidity throughout, this delta hedginghadbeen smoothand no gains or losses due to price jumps had occurred. If price jumps hadoccurredratherthansmoothdeltahedging,thentheportfoliowouldhavecomebacktoitsoriginalvalue.If this is not clear, follow the example in Table 11.7,which corresponds to
beingshortoneunitofaone-yearat-the-moneycallandlongoneunitofaone-year call at 80 percent of the current price. Assume that the following fourmovestakeplaceinsequence:volatilitiesup8percent,pricesdown25percent,volatilitiesdown8percent,andpricesbackuptotheoriginal level.Table11.7
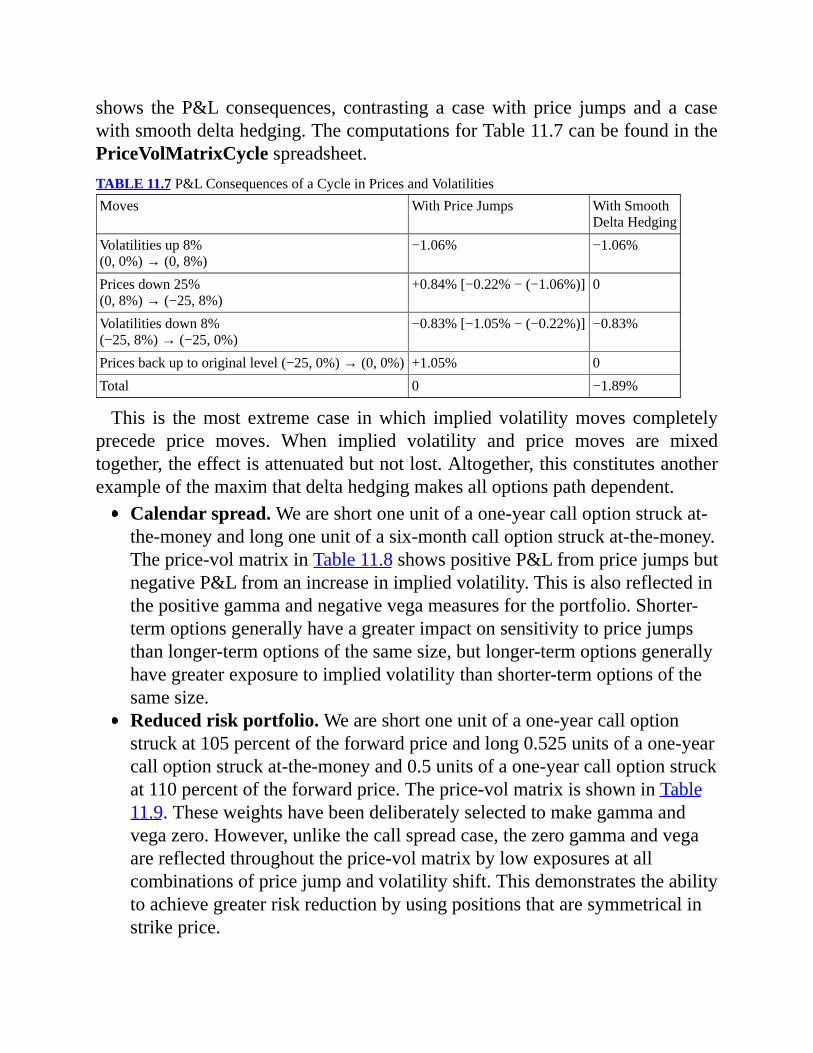
shows the P&L consequences, contrasting a casewith price jumps and a casewithsmoothdeltahedging.ThecomputationsforTable11.7canbefoundinthePriceVolMatrixCyclespreadsheet.TABLE11.7P&LConsequencesofaCycleinPricesandVolatilitiesMoves WithPriceJumps WithSmooth
DeltaHedgingVolatilitiesup8%(0,0%)→(0,8%)
−1.06% −1.06%
Pricesdown25%(0,8%)→(−25,8%)
+0.84%[−0.22%−(−1.06%)] 0
Volatilitiesdown8%(−25,8%)→(−25,0%)
−0.83%[−1.05%−(−0.22%)] −0.83%
Pricesbackuptooriginallevel(−25,0%)→(0,0%) +1.05% 0Total 0 −1.89%
This is themost extreme case inwhich implied volatilitymoves completelyprecede price moves. When implied volatility and price moves are mixedtogether,theeffectisattenuatedbutnotlost.Altogether,thisconstitutesanotherexampleofthemaximthatdeltahedgingmakesalloptionspathdependent.
Calendarspread.Weareshortoneunitofaone-yearcalloptionstruckat-the-moneyandlongoneunitofasix-monthcalloptionstruckat-the-money.Theprice-volmatrixinTable11.8showspositiveP&LfrompricejumpsbutnegativeP&Lfromanincreaseinimpliedvolatility.Thisisalsoreflectedinthepositivegammaandnegativevegameasuresfortheportfolio.Shorter-termoptionsgenerallyhaveagreaterimpactonsensitivitytopricejumpsthanlonger-termoptionsofthesamesize,butlonger-termoptionsgenerallyhavegreaterexposuretoimpliedvolatilitythanshorter-termoptionsofthesamesize.Reducedriskportfolio.Weareshortoneunitofaone-yearcalloptionstruckat105percentoftheforwardpriceandlong0.525unitsofaone-yearcalloptionstruckat-the-moneyand0.5unitsofaone-yearcalloptionstruckat110percentoftheforwardprice.Theprice-volmatrixisshowninTable11.9.Theseweightshavebeendeliberatelyselectedtomakegammaandvegazero.However,unlikethecallspreadcase,thezerogammaandvegaarereflectedthroughouttheprice-volmatrixbylowexposuresatallcombinationsofpricejumpandvolatilityshift.Thisdemonstratestheabilitytoachievegreaterriskreductionbyusingpositionsthataresymmetricalinstrikeprice.

TABLE11.8PriceVolMatrixforaCalendarSpread
TABLE11.9PriceVolMatrixforaReducedRiskPortfolio

Tables11.10and11.11showhowthispositionevolvesthroughtime.Wecansee that at the end of 0.5 years (Table 11.10), there is still not much riskexposure, but at the end of 0.9 years, with only 0.1 year left until optionexpiration (Table 11.11), there is some convexity, with gains if prices jumpupwardand losses if prices jumpdownward.This shows that evenahedgeofoptionsagainstoptions thatworksverywellat firstcannotbemaintainedasa
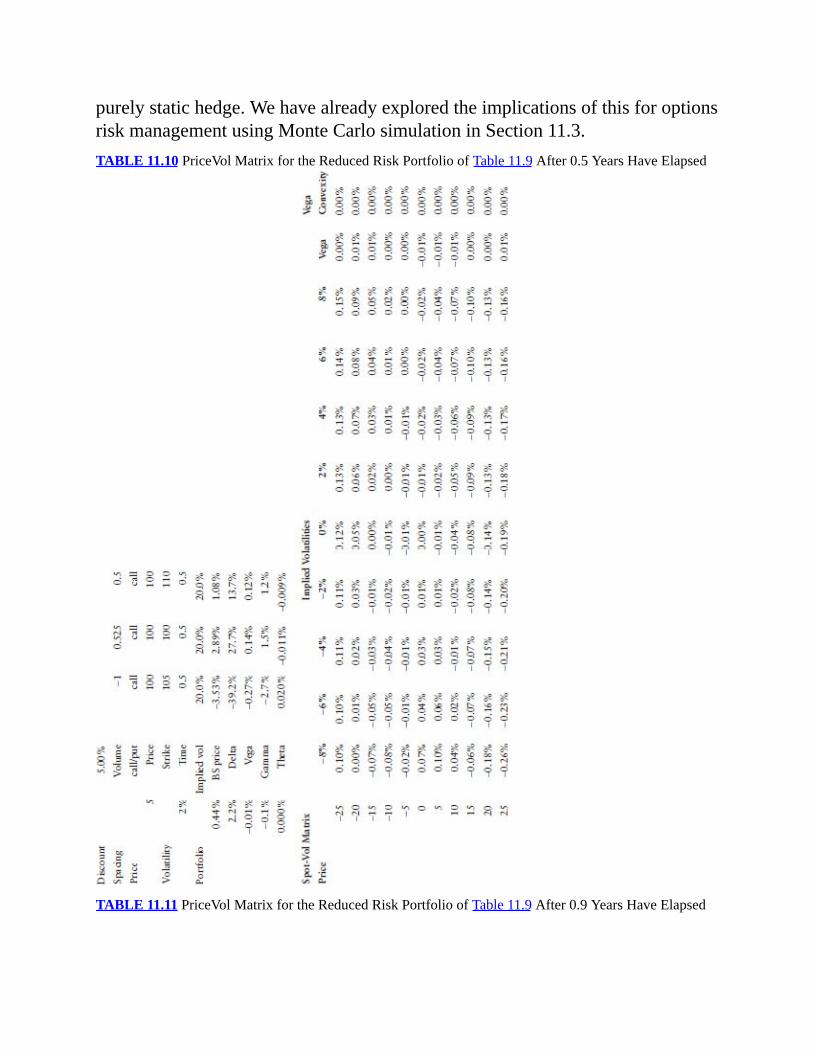
purelystatichedge.WehavealreadyexploredtheimplicationsofthisforoptionsriskmanagementusingMonteCarlosimulationinSection11.3.TABLE11.10PriceVolMatrixfortheReducedRiskPortfolioofTable11.9After0.5YearsHaveElapsed
TABLE11.11PriceVolMatrixfortheReducedRiskPortfolioofTable11.9After0.9YearsHaveElapsed
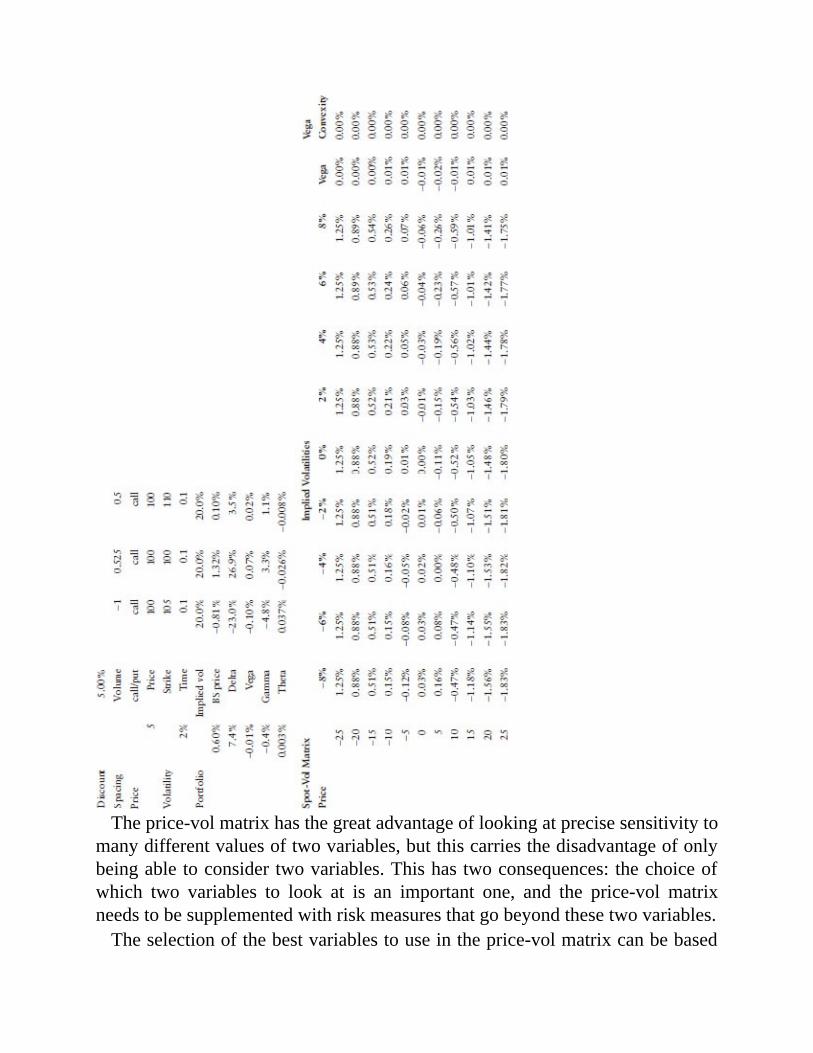
Theprice-volmatrixhasthegreatadvantageoflookingatprecisesensitivitytomanydifferentvaluesoftwovariables,butthiscarriesthedisadvantageofonlybeingabletoconsidertwovariables.Thishastwoconsequences:thechoiceofwhich two variables to look at is an important one, and the price-vol matrixneedstobesupplementedwithriskmeasuresthatgobeyondthesetwovariables.Theselectionofthebestvariablestouseintheprice-volmatrixcanbebased
on economic insight or on statistical techniques, such as principal componentanalysis.Onthesideofassetprices,onequestioniswhethertoassumeaparallelshiftinforwardprices.Thisisequivalenttoassumingzerocorrelationbetweenchanges in theunderlyingassetpriceandchanges indiscountcurves.Anotherquestioniswhethertoassumeconstantspreadsbetweendifferentvariantsoftheasset,suchasdifferentgradesforaphysicalcommodityanddifferentindividualstocksrelativetoastockmarketindex.Forvolatilities,thequestioniswhethertoassume parallel changes in the volatility surface or whether to assume astatisticalrelationshipbasedonhistoricalexperience.Lookingmorecloselyattheissueofwhethertoassumeaparallelshiftinthe
volatility surface, let's break this down into a time-to-expiry component and astrikecomponent.Withregardtotimetoexpiry,thefirstprincipalcomponentofchangesinvolatilitysurfaceshaslesstendencytobeflatthanthefirstprincipalcomponentofchangesininterestratecurves.Longer-termvolatilitiesoftentendtomovesubstantiallylessthanshorter-termones.Althoughatime-differentiatedshift conveys less immediate intuitive meaning in discussions with seniormanagementthanaflat1percentshift,theincreaseinlikelihoodmayoutweighthe communications disadvantage. A possible compromise that is reasonablyeasy to express and often reasonably close to historical experience is aproportionalratherthananabsoluteshift.Soifone-yearvolatilitiesarecurrently20percentandfive-yearvolatilitiesare15percent,a5percentproportionalshiftwouldmovetheone-yearvolatilityup1to21percentandthefive-yearvolatilityup 0.75 to 15.75 percent. The PriceVolMatrix spreadsheet allows the userspecificationofeitherflatorproportionalshifts.With respect to the strike component, a frequently used alternative to a flat
shiftby instrument isa flat shiftbydelta.Forexample,assume thatanat-the-moneyoptioncurrentlyhasa20percentimpliedvolatilityandanin-the-moneyoptionwith adeltaof75percent currentlyhas a19percent impliedvolatility,and assume thatwe are dealingwith a currently at-the-money option. Then avolatilityshiftofdown2percentcombinedwithapricejumpintheunderlyingasset thatmakes thisoption in-the-moneywitha75percentdelta results inanimplied volatility of 20% − 2% = 18% if we are assuming a flat shift byinstrument.Itresultsina19%−2%=17%impliedvolatilityifweareassuminga flat shift by delta. The PriceVolMatrix spreadsheet allows the userspecificationofeitherflatshiftbyinstrumentorflatshiftbydelta.The driving force behind the use of a flat delta shift is that the factors that
generate the shape of the volatility surface by the strike, such as stochastic

volatilityandthestructureofjumps,tendtoremainstaticacrosschangesintheunderlyingpricelevel.WediscussthesefactorsinSection11.6.2.Taleb(1997,138–142)providesadetailedexpositionofaflatdeltashiftmethodologyanditsconsequences forhedging.Derman (1999) contrasts flat instrument shiftswithflat delta shifts (“sticky-strike”versus “sticky-delta” inDerman's terminology)alongwitha thirdpossibility,“sticky-implied-tree.”Dermanpresentsempiricalevidencethatdifferingmarketenvironmentsovertimecanresultinachangeinwhichshiftpatternsprovidethegreatestexplanatorypower.Nomatterwhatselectionsaremadefortheprice-volmatrixvariables,thereis
clearlyenoughresidualrisktorequiretraderstoalsolookatmoredetailedriskreports as supplements to price-vol matrices. Certainly, this will includeexposure to changes in the shapeof the volatility surfacewith respect to bothtime and strikes. The PriceVolMatrix spreadsheet includes a calculation ofexposuretochangesinthevolatilitysurface.Thesemoredetailedreportsusuallyfocusonlyontheimpactofsmallone-at-a-timechanges,althoughaparticularlysignificantresidualriskmightjustifyaprice-volmatrixofitsown.Forexample,anequityoptionstradingdeskmightwanttolookatanoverallprice-volmatrixthat considers parallel shifts in all stock market indexes as well as price-volmatricesforeachindividualcountry'sstockindex,butwouldprobablywantonlyasimpledeltaandvegameasuretoreflecttheexposuretoeachindividualstocktraded.Seniormanagementwill want to seemuch less detail than the trading desk
regarding options.The primary concern of seniormanagement ismaking surethat they are comfortable with large macro positions that may be anaccumulationoftheholdingsofmanytradingdesks.Assuch,themostimportantmeasure for senior management is outright exposure to spot positions (forexample, JPY/USD FX, S&P index, and gold) or to forward positions (forexample, exposure to a parallel shift in the USD interest rate curve). Sinceoptionsdesksholddelta-equivalentpositionsinthesespotandforwardmarkets,including these positions in reports of the total spot exposure of the firm isnecessary inorder toensureanaccurate summary.So seniormanagementwillgenerallyjustbeinterestedinasingleoutrightpositionnumberforeachproduct,alongwithsomemeasureofvega.Formanyoptionspositions,thedeltawillfittheneedforanoutrightpositionmeasure.Controlofconvexityriskaroundthisdelta is then left to the trading desk level, probably prescribed by limits onconvexity.However,thepositionsofsomecomplextradingbooksmaynotbeatallaccuratelyrepresentedbythedelta.Ifabookwillgain$100millionforthe

next 1-point rise in theS&Pbut lose $2million for each point rise after that,representing the position by a +$100 million per point delta will be totallymisleading.Forseniormanagementpurposes,thedeltaneedstobedefinednotmathematically, as the instantaneous derivative, but economically, as a finitedifference over a selected economically meaningful price movement (a one-standard-deviationdailypricemovemightbeareasonablechoice).Limit-settingdetailforoptionsbooksliessomewherebetweenthelevelneeded
fortradingdeskcontrolandthatneededforseniormanagement.Someformoflimits on price-vol matrix positions is desirable, but separate limits for eachmatrix box would be overdetailed, whereas a single limit that no matrix boxcouldexceedwouldbetoobroad.Alimitsethighenoughtoaccommodatereallyunlikelycombinationswouldbetooliberalalimitforcombinationsclosetothematrix center. A reasonable compromise is differentiated limits by groups ofmatrix boxes, where a similar likelihood of outcomes determines grouping.Limitsonexposuretochangesintheshapeofthevolatilitysurfacecanoftenbebestexpressedintermsofafewparametersthatdeterminetheshape.Fordetailsonpossibleparameters,seethediscussioninSection11.6.2.Themanagementofoptionsriskisaninherentlydynamicprocess.Unlikespot
or forward risk,youcan rarely justputonahedgeonceand forall;youmustconstantlymake adjustments. So options traders needmeasures to show themhowtheirP&Landpositionsshouldchangeasaresultofthepassageoftimeorchangesinprices.ThisenablesthemtoprepareforthetradingactionstheywillneedtotakeandservesasacheckagainstactualchangesinP&Landpositionsto highlight anything that is happening that they don't understand. The best-knownmeasuresof this typeare theta (thechange inoptionvalueswith time)andgamma (thechangeindeltawithachangeinprice).However,manyotherexamples are available: for instance, bleed (see Taleb 1997, 191–199) andDdeltadvol(Taleb1997,200–201).By contrast, corporate riskmanagers are rarely interested in suchmeasures.
Thetacannotbeadirectmeasureofrisksinceclearlyyouarenotuncertainastowhethertimewillpass.Itdoesmeasurethepossibilityofgainorlossifimpliedvolatilityfailstoberealizedoveragiventimeperiod,butthesameriskcanbecaptured in a more comprehensive way by a time-bucketed vega measure.Gammaisofinterestonlytotheextentthatitcanbeusedtocomputeconvexity,whichisagenuineP&Lexposure,butgammaisareliableindicatorofconvexityonlyforverysimpleportfolios.Ingeneral,corporateriskmanagersexpectthattradingdeskheadswillbeable todealwith theoperational issuesofevolving

positions.Theonly exceptionsmight be changes so large as tomake liquidityquestionable,whichmightrequirelimitstobeset.
11.5DELTAHEDGINGIn the presence of transaction costs, it is necessary to use optimization todetermineadeltahedgingstrategy.Atrade-offexistsbetweenachievingalowerstandard deviation of results utilizingmore frequent hedging, and achieving ahigher expected return utilizing less frequent hedging leading to lowertransaction costs. Whaley and Wilmott (1994) have shown that the efficientfrontier for this problem consists of hedging policies with the followingcharacteristics:
Hedgeswillbetriggerednotbytimeintervals,butbythedistancethatthecurrentdeltahedgeratiodiffersfromthetheoreticaldeltahedgeratiorequiredbytheBlack-Scholesformula.Iftransactioncostsareonlyafunctionofthenumberofhedgetransactionsandnotthesizeofthehedgetransactions,thenwheneverahedgetransactionistriggered,theamountwillbeexactlyenoughtobringthehedgeratioinlinewiththedesiredtheoreticalratio.Sincethetransactioncostisthesamenomatterhowlargetheamount,youshouldgotothehedgeratioyouwoulduseintheabsenceoftransactioncosts.Iftransactioncostsareonlyafunctionofthesizeofthehedgetransaction,thenwheneverahedgetransactionistriggered,theamountofthetransactionisonlylargeenoughtobringthedifferencebetweentheactualandtheoreticalhedgeratiosdowntothetriggerpoint.Sinceyoudon'tcarehowmanytransactionsyouneedtouse,onlythesizeoftransactions,itmakessensethatyouwillstayascloseaspossibletothepointatwhichhedgeinaccuracyexactlybalancesbetweenthedesireforlowstandarddeviationofresultsandlowtransactioncosts.Iftransactioncostsareafunctionofboththenumberandsizeofhedgetransactions,thentheoptimalrulewillbeacombinationofthesetwocases,withanoutertriggerdistancebetweencurrentandtheoreticaldeltathatinstitutesatradetobringthedifferencedowntoaninnertriggerdistance.
Target delta hedges are determined by the Black-Scholes formula asN(d1),
where . What value of σ, the volatility of theunderlyingasset,shouldbeusedtodeterminethistargethedge?Optionsshouldbevaluedattheimpliedvolatilitythatcorrespondstothemarketpriceatwhichthepositioncouldbeexited,butthisdoesnotprovideanyreasonforusingthisimplied volatility to determine delta hedges of positions that are not exited.

Giventhatanymisestimationoftruevolatilitywhiledeterminingthehedgewillresult in unintended proprietary positions in the underlying asset, as per ourdiscussioninSection11.3,itisbesttogivetradersreasonablelatitudetomaketheirbestestimateoffuturevolatilityasinputtothetargethedge.ThisbringsustothesuggestedsolutionwepromisedtothequestioninSection
11.2. What causes the large losses from the nasty path? It is caused by thedramaticdifferencebetweenactualrealizedvolatilityandimpliedvolatility.YouwillseeintheNastyPathspreadsheetthattheoptionwaspricedata7percentimpliedvolatility,whichwasalsousedincreatingthedeltahedge.However,theactualpricemovesof0.13adaycorrespondtoarealizedvolatilityof2percent.Hadthetraderbeenabletoforeseethisandformthedeltahedgesbasedona2percentvolatility,P&Lonthetradewouldhavebeencloseto0(trythisoutinthespreadsheet).ContinuingthethemefromSection11.3,concerningwhatactionstotakeifa
trader believes the underlying price is mean reverting, simulations similar tothose reported in Table 11.3 indicate that gains will result from delta hedgesbased on overestimates of actual realized volatility. If underlying prices aretrending (eitherupordown) rather thanmean reverting, thengainswill resultfromdeltahedgesbasedonanunderestimateoftheactualrealizedvolatility.Sotradersshouldconsiderbiasingtheirvolatilityestimatesif theyhaveaviewonmean reversion.Toget an intuitiveunderstandingof this result, considerwhathappensifyouoverestimatevolatility.Thehighervolatility inthedenominatoroftheformulaford1willcausethetargetdeltatomovelessaspricemovementsresultintheoptionmovingintooroutofthemoney.Ifpricemovestendtobefollowedbymovesintheoppositedirection,astheywillbeifthepriceprocessismeanreverting,thenthedifferencebetweenactualdeltaandtheoreticaldeltawillbeintherightdirectiontocreatepositiveP&L.
11.6BUILDINGAVOLATILITYSURFACEBuildingavolatilitysurfaceforpricingEuropeanoptionsissimilartobuildingadiscount curve, but it operates in two dimensions rather than one, sincevolatilitieswillvarybystrikeaswellasbytime.However,thegeneralprincipleis the same: Build a surface that balances the fitting of known options priceswitha smoothnesscriterion.Thesmoothnesscriterion isdesigned tominimizetheriskoflossfromhedgingoptionsforwhichmarketpricesarenotknownwithoptionsforwhichpricesareknown.

Tobuild the surface inbothdimensions simultaneously requires a stochasticvolatilitymodeltowhichyoucanfitparameters(forexample,theHestonmodel—seeHeston1993).Themorecommonapproach is tobuildavolatilitycurveforat-the-moneystrikesbytimeperiodandseparatelybuildavolatilitycurveforafewselectedtimeperiodsbystrike.Arbitrarycombinationsoftimeandstrikecanthenbeinterpolatedfromalreadydeterminedpoints.Wewilllookinturnatthe issuesof interpolatingbetween timeperiods, interpolatingbetween strikes,andextrapolatingbeyondthelongestliquidtimeperiod.
11.6.1InterpolatingbetweenTimePeriodsWe have a problem that's extremely similar to the one we faced for discountcurves. We have a set of fitting conditions, wanting to choose underlyingdiscountprices (impliedvolatilities), so thatwhen they'replugged intopricingformulas, they come out with bond prices (option prices) that closely matchthose observed in themarket, and a set of smoothness conditions,wanting tochoosediscountprices(impliedvolatilities)thatleadtomaximumsmoothnessofforwardinterestrates(forwardvolatilities)acrossperiods.Theforwardvolatility,theamountofvolatilityexpectedtotakeplaceinsome
reasonably small timeperiod in the future, is anatural analogy to the forwardrate. With forward rates, we discussed whether to have an additional set ofconstraints stating that all forward rates must be nonnegative and examinedeconomicargumentsforandagainstthis(refertoSection10.3.2).Withforwardvolatilities, there isn't any doubt—a negative standard deviation is not amathematicalpossibility,sotheconstraintsarenecessary.Wecansetupanoptimizationtosolveforforwardvolatilitiesinacompletely
analogousmannertotheoptimizationwesetuptosolveforforwardrates,withdifferentsolutionscorrespondingtodifferenttrade-offsbetweenthetightnessofthe fittingconstraintsand tightnessof thesmoothnessconstraintsanddifferentweightsondifferentfittingconstraintsbasedontheliquidityofthepricequotes.(Notethatitisamoreviablepossibilitywithoptionsthanwithinterestratestojustfindforwardsthatexactlyfitallavailablemarketpricesandtheninterpolatebetween the forwards. Unlike bonds and swaps, options have no intermediatepaymentstorequireabootstrap.However,optimizationstillmightbedesirableasawayoftradingoffbetweenfittingandsmoothnessobjectives.)Whenfittingforwardinterestrates,wehadtopreprocesstoadjustforthelack
ofsmoothnessthatwewereanticipatingbasedonoureconomictheories,suchas
turn-of-the-quarter effects (see Section 10.3.4). In the same way, forwardvolatilities need preprocessing. Generally, the opinions of options tradersregardingthepatternsofforwardvolatilitytendtobemuchmorestronglyheldthan the opinions of interest rate traders regarding forward rates.Opinions onforwardvolatility center on issues of the flowof information into themarketsthatwill cause price fluctuations. Ifwe look at daily forward volatilities (andtradersofshorter-termoptionsoftendoworkat this levelofdetail),youmightfind a trader anticipating nearly zero volatility on weekends and holidays(markets are closed so no new prices can be observed), higher volatility onMondays and days after holidays than on other weekdays (governmentssometimes like to make surprise announcements when markets are closed),lowerthannormalvolatilityondayswhenmosttraderscanbeexpectedtobeonvacationorleavingworkearly(suchasthedaybeforeathree-dayweekend),andhigher than normal volatility on a day when a key economic statistic isscheduled to be announced. For more examples, see Taleb (1997, 98) andBurghardtandHanweck(1993).Thewebsite for thisbookhas twospreadsheets to illustrate fittinga forward
volatilitycurvetoobservedoptionsprices.Thefirst,VolCurve,canbeusedforallEuropeanoptionsotherthaninterestratecapsandfloors,andemphasizestheadjustment for anticipated volatility patterns. The second,CapFit, is designedforuseonlyfor interestratecapsand floors,whicharepackagesof individualoptions (known as caplets and floorlets, respectively). Since liquid prices aregenerally available only for the options packages and not for the underlyingoptions,anoptimizationisneededtofittheobservedpricesofpackageswithassmoothaforwardvolatilitycurveaspossible.
11.6.2InterpolatingbetweenStrikes—SmileandSkewNow let's turn to building a volatility curve by strike for a given time period.Marketpriceswillbeavailableforcertainstrikesthatwewillwanttofit.Whichvariableshouldplaythecorrespondingroletoforwardinterestratesandforwardvolatilitiesastheoneforwhichwetrytoachievesmoothness?Anaturalchoiceis the risk-neutral probability that the underlying variable finishes in a rangebetween two prices. If these ranges are chosen small enough, options at allstrikes can be priced to as close a precision as you want based on suchprobabilities.IfS is thestrikeandpi is therisk-neutralprobability that theunderlyingwill
finish between price Pi and price Pi+1, the option price must be bounded by
frombelow,andboundedby fromabove.Likeforwardvolatilities,probabilitiesmustbeconstrainedtobenonnegative.
Usingthisformulaallowstranslationamongcumulativeprobability,probabilityfrequency, and implied volatility by strike as alternative,mutually translatablewaysofdescribingaprobabilitydistribution,inmuchthesamewaythatparrate,zerocouponrate,forwardrate,anddiscountpricearealternativesfordescribingthediscountcurve.See theVolSurfaceStrike spreadsheet foran illustrationofthisprinciple.Jackwerth and Rubinstein (1996) illustrate an optimization setup to derive
probability distributions based on a trade-off between the tightness of fittingconstraintsandsmoothnessconstraints.Whenchoosingasmoothnesscriterion,analternativetojustlookingathowsmooththechangesinprobabilitylevelsareistolookathowcloselytheprobabilitiesfitadistributionselectedontheoreticalgrounds(forexample,normalorlognormal)asthemostlikelypriordistribution(prior, that is, toanyknowledgeof theactualoptionsprices).ThisuseofpriordistributiontiescloselytoBayesianstatisticalmethods.InSectionIII.Aoftheirpaper,JackwerthandRubinsteinexploreseveralsuchsmoothnesscriteria.A fundamental problem often encountered when trying to derive volatility
curvesbystrikeistherelativepaucityofmarketobservationsavailablebystrike.It isnotatalluncommontofindmarkets inwhichoptionspricesareavailablefor only three or four different strike levels at a given time period. In suchcircumstances,asmoothnesscriterionthatdoesnotutilizeapriordistributionisoflittleuse—youatleastneedtorestrictyourchoicetosomefamilyofpossiblecandidatedistributionson theoreticalgrounds.Of course, any suchchoice is amodelandshouldbeanalyzedforthedegreeofmispricingpossibleifthemodeliswrongbyconsideringhowdifferent thevolatilitycurvewouldbe if anotherplausiblemodelwerechosen.Reservesandlimitsagainstmodelerrorshouldbeconsidered.A good discussion of candidate distributions and the theoretical basis for
selectingbetweenthemcanbefoundinHull(2012,Sections26.1–26.3).Letusfirst state somegeneral factsabout theshapeofvolatility surfacesobserved inthe markets; these comments can be compared with those in Hull (2012,Sections19.2and19.3)andRebonato(2004,Chapter7).Inthisdiscussion,weusethetermsmiletorefertoapatternofvolatilitybystrikewherevolatilityrisesasstrikesmoveawayfromat-the-moneyinthedirectionofeitherintooroutof

themoney.We use skew to refer to a pattern of volatility by strike in whichvolatilityeitherdecreasesor increaseswith increasingstrike levels.Soskewisprimarily a linear relationship and smile is primarily a quadratic relationship.(Marketpractice from firm to firm, and evendesk todeskwithin a firm,maydifferinnomenclature.Sometimesskewisusedtocoverallaspectsofvolatilitysurface shape, and sometimes smile is used to cover all aspects of volatilityshape.)Usingthesedefinitions,theobservedpatternsare:Smilestendtoappearinalloptionsmarkets.Equityoptionsmarketsalmostalwaysshowapronouncedskew,withvolatilitydecreasingwithincreasingstrikes.Thecombinationofthisskewwiththesmileproducesapatternthatcanbedescribedasasharpskewatstrikesbelowat-the-moneyandrelativelyflatvolatilitiesatstrikesaboveat-the-money.NogeneralskewpatternexistsinmarketsforFXoptionsbetweenstrongcurrencies(forexample,betweenthedollar,euro,yen,sterling,andSwissfranc).However,theredoestendtobeastrongskewpattern(volatilitydecreaseswithincreasedstrikes)forFXoptionsbetweenastrongcurrencyandaweakercurrencysuchasanemergingmarketcurrency.Skewpatternsininterestrateoptionsmarketstendtovarybycurrency,withthestrongestpatternsofvolatilitiesdecreasingwithincreasingstrikesappearingforcurrencieswithlowinterestratelevels,particularlyinyen.
Whatexplanationshavebeenofferedfortheseobservedpatterns?Theprevalenceofvolatilitysmilescanbeexplainedintwodifferentways:stochasticvolatilityandjumpdiffusion.Stochasticvolatilityutilizesaprobabilitydistributionforthevolatilitythatdeterminestheprobabilitydistributionofunderlyingprices,whereasjumpdiffusionassumesthatsomepriceuncertaintyisexpressedthroughpricejumpsasopposedtoasmoothrandomwalk.BothassumptionsresultinadistributionoffinalpriceswithfattertailsthanthelognormaldistributionusedbyBlack-Scholes.Fatter-taileddistributionshavelittleeffectonoptionsatclosetoat-the-moneystrikes,whichareprimarilyaffectedbythecenterofthedistribution;however,theyhavegreatereffectsthemoreanoptionisin-the-moneyorout-of-the-money,sincetheseoptionsareprimarilyaffectedbythesizeofthetail.
The pricing formula for options using either stochastic volatility or jump
diffusion (see the equations inHull 2012, Sections 26.1 and 26.2) consists ofaverages of option prices using the Black-Scholes formula across a range ofvolatilities. The difference between the two models is the probability weightusedinaveragingacrossthesevolatilities.Stochasticvolatilityresultsinamorepronouncedsmileasthetimetooptionexpiryincreases,whereasjumpdiffusionresultsinamorepronouncedsmileasthetimetooptionexpirydecreases.Itmaybe necessary to combine the two to obtain actual smile patterns observed inmarketoptionsprices.SeeMatytsin(1999).
TheBlack-Scholesmodelassumesalognormaldistributionoftheunderlyingassetprice.Ifthemarketisassuminganormal,ratherthanlognormal,pricedistribution,thiswillevidenceitselfashigherimpliedvolatilitiesforlower-strikeoptionsandlowerimpliedvolatilitiesforhigher-strikeoptionswhenimpliedvolatilitiesarecomputedusingtheBlack-Scholesformula.Soifthemarketisassumingthatpricechangesareindependentofmarketlevelratherthanproportionaltomarketlevel,implyingnormalratherthanlognormalpricedistributions,thiswillleadtoaskewwithvolatilitiesdecreasingwithincreasingstrikes.Ifthemarketisassumingadistributionintermediatebetweennormalandlognormal,thisskewpatternwillstillexist,butitwillbelesspronounced.Historicalevidenceshowssupportforinterestratemovementsthataresometimesclosertobeingindependentoftheratelevelandothertimesclosertobeingproportionaltotheratelevel.Theskewforimpliedvolatilitiesofinterestrateoptionsisgenerallybelievedtobedrivenprimarilybytheexpectationthatratemovementsarenotcompletelyproportionaltotheratelevel,withtheexpectationinlow-rateenvironmentsthatratemovementsareclosetoindependentoftheratelevel.Theskewpatterninequitymarketshassometimesbeenexplainedastheoutcomeofasymmetryofthevalueofinvestmentinacorporation,whichcansuddenlycollapseasacompanyapproachesthebankruptcypoint.Hull(2000,Section17.7)discussesthreealternativemodelsbasedonthisexplanation—thecompoundoptionmodel,thedisplaceddiffusionmodel,andtheconstantelasticityofvariancemodel.
Amore general explanation of skew patterns can be found in analyzing thedegree of asymmetry in the structure of a particular market. For a thoroughexpositionofthisviewpoint,seeTaleb(1997,245–252),onwhichmuchofmydiscussion here is based. This asymmetry can be described in twocomplementaryways:one that focuseson investorbehavior and theother that
focusesonpricebehavior.From an investor behavior viewpoint, in some markets, investment has a
structural bias toward one side of the market. Equity markets are a goodexample. There are far more investors long equity investments than there areinvestors who have shorted the market; hence, more investors are seekingprotectionfromstockpricesfallingthanareseekingprotectionfromstockpricesrising.Thereasonisthatcorporateissuanceofstockisamajorsourceofsupply,and corporations are not seeking protection against their stock rising; in fact,theywelcome it.Soyouexpect to seegreaterdemand tobuyputsonstockatstrikesbelowthecurrentmarketlevel,soughtbyinvestorsprotectingtheirlongequitypositions,thanthedemandforcallsonstockatstrikesabovethecurrentmarketlevelsoughtbyshortsellerstoprotecttheirshortequitypositions.Thisimbalanceindemanddrivesupimpliedvolatilitiesonlow-strikeoptionsrelativetohigh-strikeoptions.Thecomplementaryviewfromapricebehaviorviewpointisthatstockmarket
crashes, in which large downward jumps occur in stock prices, are far morecommon than large upward jumps in stock prices. This can be seen as aconsequenceoftheimbalanceininvestorswhoarelongstocksrelativetothosewhoareshortstocks.Fallingpricescantriggerasellingpanicbyinvestorsfacedwith large losses forced to exit leveraged long positions supported byborrowings.Therearefewershortsellersandleveragedshortpositionstocausea panic reactionwhen prices are rising. A bias toward downward jumps overupward jumps leads to a skew in the distribution of probabilities of pricemovementsthatwilltranslateintohigherimpliedvolatilitiesatlowerstrikes.Inaddition, the anticipation of possible stockmarket crasheswill exacerbate thedemandforcrashprotectionthroughputsatlowerstrikes.A similar structural analysis can be constructed for FX markets for an
emergingmarket currency versus a strong currency. These exchange rates areoftenmaintainedatartificiallyhighlevelsbygovernmentsdefendingthevalueoftheemergingmarketcurrencythroughpurchasesofthecurrency,highinterestrates, or currency controls.Whenbreaks in theFX rate come, they tend tobelargedownwardjumpsinthevalueoftheemergingmarketcurrency.Thereisnosimilar possibility of upward jumps. This price behavior directly leads to aprobability distribution that translates to higher implied volatilities at lowerstrikes(lowerintermsofthevalueoftheemergingmarketcurrency).Indirectly,thispricebehaviorencouragesholdersof theemergingmarketcurrencytobuyputsatlowerstrikes,biddinguptheimpliedvolatilityatthesestrikes.
Othermarketsgenerallytendtowardamoresymmetricalstructure.Exchangeratesbetweentwostrongcurrenciesareusuallyfreerfloatingwithlessbottled-uppressure.Thus,nobiasexiststowardlargeupwardjumpsorlargedownwardjumps.Most interest ratemarkets and commoditymarkets tend to be roughlyevenly divided between longs and shorts—investors who would benefit fromupward movement and those who would benefit from downward movement.However,someparticularasymmetriescanbeobserved—forexample,thelargedemandbyU.S.mortgage investors forprotectionagainst falling interest ratesleadingtoacceleratedprepaymentsoratemporaryimbalanceofthesuppliersofa commodity seeking put protection against falling prices relative to theconsumersofthecommodityseekingcallprotectionagainstrisingprices.TheVolSurfaceStrikespreadsheetillustratesbothwaysinwhichaprobability
distributioncanbefittoasetofoptionpricesatdifferentstrikes.Withinputonprices at a number of different strikes, it trades off the smoothness of theprobabilitydistributionandclosenessofpricefit.Withinputonpricesatonlyafew strikes, it fits two parameters: one representing standard deviation ofvolatilityandonerepresenting thedegreeofproportionalversusabsolutepricechangetoassume.
11.6.3ExtrapolatingBasedonTimePeriodWhen we were looking at forward risk, we saw how to create valuation andreserves for a forward that had a longer tenor than any liquid instrument (seeSection 10.2.2). The technique was to assume you were going to hedge thelonger-termforwardwithaliquidshorter-termforwardandlaterrolltheshorter-termforwardintoalonger-termforward.Theexpectedcostoftherollneedstobeaddedintotheinitialcostofthehedgetoobtainavaluation,andareservecanbebasedonthehistoricalstandarddeviationoftherollcost.A similar approach suggests itself for valuing and reserving for long-term
optionsthathavealongertenorthananyliquidoption.Forexample,ifyouwanttocreatea10-yearoption inamarket thathas liquidquotesonlyout to sevenyears,youcouldbeginbyhedgingwithaseven-yearoptionand,at theendoffive years, roll out of what will then be a two-year option into the five-yearoptionyouneedtoexactlymatchyouractualposition.Expecteddifferences inimplied volatility between five-and two-year options determine expected rollcosts.Reservescanbebasedonthehistoricalstandarddeviationofdifferencesintwo-andfive-yearimpliedvolatilities.

However,optionsaremorecomplicatedbecausetheydependonstrikelevelaswellasthetimetoexpiry.Theprice-volmatrixinTable11.12showsthataratioof seven-year options to 10-year options selected so as to minimize roll-costuncertaintywhen the prices are at 100 leaves large roll-cost uncertaintywhenpricesareaboveorbelow100.TABLE11.12Hedgeofa10-YearOptionwithaSeven-YearOptionafterFiveYears
Tominimize roll-cost uncertainty over a wide range of prices, you need tohedgewithapackageofoptionsthatdifferbybothtenorandstrike.Theprice-volmatrix inTable11.13 shows the impactof selectingahedge froma setofsix-and seven-year options at various strike levels, using the OptionRollspreadsheettoselectweightingsoftheseoptionsthatwillachieveminimalroll-cost uncertainty in five years. This example only accounts for roll-costuncertainty due to shifts in volatility level; a more complete treatment wouldinclude shifts in the shape of the volatility surface. Expected roll costs andstandarddeviationsofrollcostsmustnowbecomputedrelativetotheweightedaverageofimpliedvolatilitiesofthehedgepackage.TABLE11.13HedgetoRollOverintoa10-YearOption

11.7SUMMARYBywayofsummary,letusseehowtheparadigmformanagingvanillaoptions

risk deals with the criticisms of the Black-Scholes analysis that have beenoffered.ComparetheanalysisheretoTaleb(1997,110–113).
Black-Scholesunrealisticallyassumesaconstantrisk-freeinterestrateanddriftrateoftheforward.ThewaywehavesetupourBlack-Scholesmodel,directlyincorporatingrateanddriftvolatilityintothevolatilityoftheforward,showsthatthiscriticismisnotaseriousone.Black-Scholesassumesthatassetpricesarelognormallydistributed.Thishaslongceasedtobetrueintradingpractice.Withtradersvaluingpositionsateachstrikeatdifferentmarket-observedvolatilities,anyprobabilitydistributionbelievedbythemarketplacecanbeaccommodated.Inpart2ofExercise11.2youareaskedtoexaminethesuccessofhedgingoptionsatonestrikewiththoseatanotherstrike,usingaMonteCarlosimulationthatdoesnotassumeassetpricestobelognormallydistributed.Youwillfindrelativelysmalluncertaintyofhedgingresults.Black-Scholesassumesthathedgingintheunderlyingassetcantakeplacecontinuouslyandwithouttransactioncosts.Theseassumptionsarecloselylinkedsincethepresenceoftransactioncostswillcertainlyforcehedgingtobelessfrequent,evenifmorefrequenthedgingistheoreticallypossible.OurMonteCarlosimulationshaveshownthat,withtheuseofoptionstohedgeotheroptions,theresultingpositionscanbedeltahedgedatdiscretetimes,resultinginrelativelysmalluncertaintyofhedgingresultsandrelativelylowtransactioncosts.Anyuncertaintyandtransactioncoststhatremainwillcontributetowiderbid-askspreadsforoptions.Black-ScholesassumesthatunderlyingassetpriceswillfollowaBrownianmotionwithnosuddenjumps.Inpractice,suddenjumpsdooccurandtheseareunhedgeableotherthanbyoffsettingoptionspositions.Theprice-volmatrixreportsexposuretopricejumps.Inpart1ofExercise11.2,youareaskedtoexaminethesuccessofhedgingoptionsatonestrikewiththoseatanotherstrike,usingaMonteCarlosimulationthatassumespricejumpswilltakeplace.Youwillfindrelativelysmalluncertaintyofhedgingresults.Black-Scholesassumesthatvolatilityisconstant.Thisisobviouslyfalse.Theimplicationsofstochasticvolatilityforthestandarddeviationofhedgingresultshavebeennoted.Theprice-volmatrixreportsexposuretochangesinvolatility,andpositionsthathavesmallexposureasmeasuredbytheprice-volmatrixhavebeenshown,usingMonteCarlosimulation,tohavearelativelysmalluncertaintyofhedgingresults.Black-Scholesassumesthatvolatilityisknown.Thisisalsoobviouslyfalse.
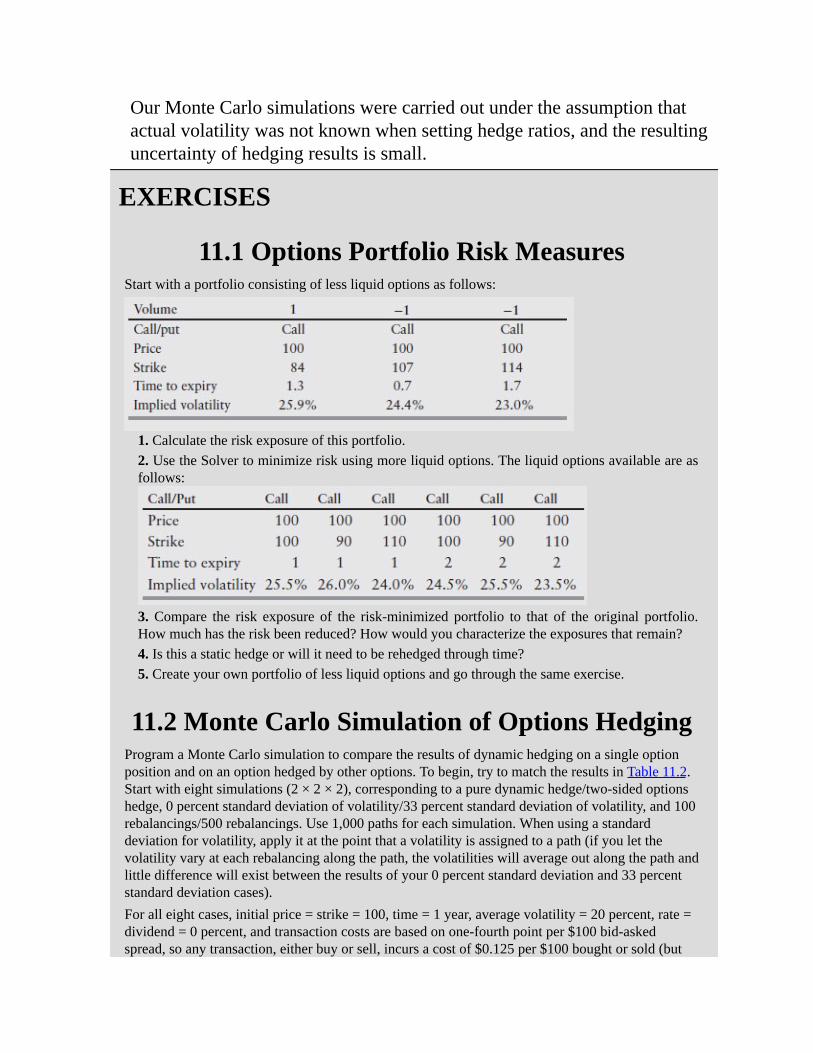
OurMonteCarlosimulationswerecarriedoutundertheassumptionthatactualvolatilitywasnotknownwhensettinghedgeratios,andtheresultinguncertaintyofhedgingresultsissmall.
EXERCISES
11.1OptionsPortfolioRiskMeasuresStartwithaportfolioconsistingoflessliquidoptionsasfollows:
1.Calculatetheriskexposureofthisportfolio.2.UsetheSolvertominimizeriskusingmoreliquidoptions.Theliquidoptionsavailableareasfollows:
3.Compare the risk exposure of the risk-minimized portfolio to that of the original portfolio.Howmuchhastheriskbeenreduced?Howwouldyoucharacterizetheexposuresthatremain?4.Isthisastatichedgeorwillitneedtoberehedgedthroughtime?5.Createyourownportfoliooflessliquidoptionsandgothroughthesameexercise.
11.2MonteCarloSimulationofOptionsHedgingProgramaMonteCarlosimulationtocomparetheresultsofdynamichedgingonasingleoptionpositionandonanoptionhedgedbyotheroptions.Tobegin,trytomatchtheresultsinTable11.2.Startwitheightsimulations(2×2×2),correspondingtoapuredynamichedge/two-sidedoptionshedge,0percentstandarddeviationofvolatility/33percentstandarddeviationofvolatility,and100rebalancings/500rebalancings.Use1,000pathsforeachsimulation.Whenusingastandarddeviationforvolatility,applyitatthepointthatavolatilityisassignedtoapath(ifyouletthevolatilityvaryateachrebalancingalongthepath,thevolatilitieswillaverageoutalongthepathandlittledifferencewillexistbetweentheresultsofyour0percentstandarddeviationand33percentstandarddeviationcases).Foralleightcases,initialprice=strike=100,time=1year,averagevolatility=20percent,rate=dividend=0percent,andtransactioncostsarebasedonone-fourthpointper$100bid-askedspread,soanytransaction,eitherbuyorsell,incursacostof$0.125per$100boughtorsold(but
don'tchargeanytransactioncostforestablishingtheinitialdeltahedge).UsetheOptionMCandOptionMCHedgedspreadsheetstocheckyoursimulationprograms.Todothis,runyoursimulationforjust20timesteps.Youcanthencheckaparticularpathbytakingtherandomnumbersdrawnforthatpathandsubstitutingthemfortherandomnumbersselectedinthespreadsheets.Youcanthencompareresults.OnceyoumatchtheresultsfromTable11.2,youshouldtrytoexpandtherunsinthefollowingways:1. Four runs with 100 rebalancings/500 rebalancings for the pure dynamic hedge/two-sidedoptionshedge,a33percentstandarddeviationofvolatility,anda jumpprocess.Jumpsshouldoccuronaverageonceoneachpath,thereshouldbea50–50chancethatajumpisupordown,andtheaverageabsolutejumpsizeshouldbe10percentofthecurrentpricewitha33percentstandarddeviationaroundthis10percent.Soaone-standard-deviationrangewouldbefrom10%×exp(−0.33)=7.2% to10%×exp(0.33)=13.9%.Thevolatilityof theunderlying shouldbeadjusteddownfrom20percent towhatever levelwill leavetheaveragepuredynamichedgingcostequaltowhatithadbeenwithoutthejump(youwillneedtotryoutafewdifferentvolatilitylevelstodeterminethis).2.A similar set of runs to test the impactof avolatility skewwith a standarddeviationof20percent.3.Forthecaseofapuredynamichedge,500rebalancings,and33percentstandarddeviationofvolatility,checktheimpactofimposingdifferentthresholdlevelsforrehedgingonthetrade-offbetweentheexpectedtransactioncostandstandarddeviationofP&L.4.Examineasampleof50individualpathsandobservetherelationshipbetweenthefinalpriceoftheunderlyingandthetotalhedgeP&L.DoestheobservedrelationshipsupporttheclaiminSection 11.3 that “despitewild gyrations in underlying prices, [the simulation paths] producealmostidenticalhedgingresults”?5.Whatpatterndoyouobserveofhedge ratios along the individualpaths?For example,howquicklydoesthehedgeratiogoto100percentforpathswhosefinalpriceisabovethestrikeandto0percentforpathswhosefinalpriceisbelowthestrike?
Forparts4and5ofthisexercise,youneedtoexamineindividualpathsoftheMonteCarlosimulation.Usepathstakenfromthesimulationwith0percentstandarddeviationofvolatilityand500rebalancings.IfyoudonothavethetimeorprogrammingbackgroundtocreateyourownMonteCarlosimulation,thencarryoutthesepartsoftheexerciseusingtheOptionMC1000andOptionMCHedged1000spreadsheets.Usethefollowinginputsettings:price=$100,strike=100,timetoexpiry=1,impliedvolatility=20percent,volatility=20percent,skew=0percent,andjumpprobability=0percent.
CHAPTER12
ManagingExoticOptionsRiskWeneedtofirstdeterminewhatwemeanbyanexoticoption.Somearticlesonoptions emphasize complex formulas anddifficultmathematical derivations asthehallmarksthatdistinguishexoticsfromvanillas.ThecriterionIamusinginthisbookemphasizesmarketliquidity.Ifyoucanreadilyobtainpricesatwhichtheoptioncanbeboughtandsold,thenitcountsasavanillaoption;ifnot,thenitisanexoticoption.TounderstandwhyIfavorthisdefinition,consideraforward-startoptionasan
illustrativeexample.This isanoptionpricednow,but itsstrike isnotsetuntilsome future date. Generally, it is set to be at-the-money on that future date.Thereiscertainlynocomplexityabouttheformulaormathematicalderivationofthe formula for thisproduct. It is the standardBlack-Scholes formulawith thestrike and underlying price set equal. However, this product has no liquidmarket, and relating itsvaluationandhedging to thevaluationandhedgingofordinaryEuropeanoptionsisnotstraightforward.Equivalently,wecansaythatnoclearrelationshipexistsbetweenthevolatility that isneededas input to theBlack-Scholes formula for the forward-start option and the volatilities impliedbythepricesofstandardEuropeanoptions.The two preceding chapters, on managing forward risk and vanilla options
risk, emphasized the use of methods that maximize the degree to which alltransactions can be viewed as being managed within a common risk-measurementframework—asinglediscountcurveforforwardsandtheprice-volmatrix for vanilla options. This common framework increases the chance thatexposuresondifferenttransactionscanbenettedagainstoneanotherandoffsetby transactions involving the forwards and vanilla options with the greatestliquidity. This paradigm does notwork for exotic options since none of themhaveenoughliquiditytoprovideconfidencethatriskscanbeoffsetatpubliclyavailableprices.Therefore, the emphasis throughout this chapter is on methodology that
enables,asmuchaspossible,therisksinanexoticoptiontoberepresentedasanequivalentvanillaoptionandforwardsposition.Thevanillaoptionandforwardsposition is the liquid proxy representation of the exotic discussed in Section6.1.2andinSection8.4.Myprimaryargumentsforanchoringexoticoptionrisk

management to a liquid proxy are presented there. Additional reasons werediscussed in the arguments favoring amore detailed limit approach inSection6.2,inthebroadersettingofgeneralriskdecomposition.Asappliedspecificallytoexoticoptions,thesereasonsare:
Itpermitstheseparationofexoticoptionsriskintoapartthatcanbemanagedwithvanillaoptionsandaresidualthatcannot.Itisimportanttoidentifyandquantifythisresidualrisksothatadequatereservescanbeheldagainstit,andtofacilitatethemanagementrecognitionofpricingthatisinadequatetosupportactualhedgingcosts.Withoutseparatingoutthepartoftheriskthatcanbehedgedwithliquidvanillaoptions,itisquitepossiblethatgainsfromordinaryvanillariskpositionswillobscurelossesfromthetrulyilliquidresidual.Itencouragesasmuchoftheriskaspossibletobemanagedaspartofthefarmoreliquidvanillaoptionsposition.Itreducestheriskofhavingexoticoptionspositionsvaluedwithamethodologythatisinconsistentwiththatusedforvaluingthevanillaoptionspositions.Itconsolidatesexoticoptionspositionsintoalreadywell-developedreportingmechanismsforvanillaoptions—price-volmatrices,volatilitysurfaceexposures,deltas,andother“greeks.”Thishastheadvantageofbuildingonwell-understoodreports,thusclarifyingtheexplanationtoseniormanagers.Italsoguardsagainstlargepositionsaccumulatingwithoutbeingrecognizedbyacommonreportingmechanism,sinceallexoticsforagivenunderlyingwillbeconsolidatedintothesamesetofvanillaoptionsriskreports.
Theuseof liquidproxies inriskmanagementcloselyparallels theuseof thecontrol variate technique in modeling. The control variate technique uses thebestavailablemodeltovalueaparticularexoticoption,butitalsousesthesamemodeltovaluearelatedvanillaoption(orbasketofvanillaoptions).Sincethevanillaoptionsareliquid, theycanthenbevalueddirectlyfromthemarket(orinterpolated from direct market prices). The model is only used to value thedifference between the exotic and related vanilla. Risk reporting and riskmanagementare similarlydividedbetween reportingandmanaging the riskofthe related vanilla option aswewould any other vanilla and creating separateriskreportingandmanagementforthedifferencebetweentheexoticandrelatedvanilla, thereby reducing themodel dependence of valuation. SeeHull (2012,Section20.3) for a discussion that emphasizes the computational efficiencyof

this technique,whichisstronglyanalogoustotheriskmanagementadvantagesstressedhere.If theunderlyingassumptionsoftheBlack-Scholesframeworkweretrue—in
particular, if volatility was known and constant—the choice of models forexotics would generally be easy. Most exotics can be valued using formulasderived from market assumptions similar to those used in the Black-Scholesanalysis of European options. However, when volatility is unknown andvariable,thereisseldomadirectwayoftranslatingavolatilitysurfaceusedforvaluingEuropeanoptionsintoasinglevolatilitytobeusedinvaluinganexotic.Usually, we will need to rely on more complex formulations tailored to aparticularexotictoestablishthisrelationship.Muchofthischapterisdevotedtodevelopingtheseformulationsforspecificexotics.Adistinctionthatwillproveveryimportantwhenanalyzingthesemodelscan
bemadebetweenthosewheretherelationshipbetweentheexoticandthevanillaisstatic and thosewhere the relationshipbetween theexoticand thevanilla isdynamic.Staticrelationshipsmeanthatthesamevanilla(orpackageofvanillas)canbeusedtorepresenttheexoticinvanillaoptionriskreportsthroughoutthelifeoftheexotic.Dynamicrelationshipsmeanthatthepackageofvanillasusedmay need to change in composition over the life of the exotic. Dynamicrelationships correspond to the full simulation approach recommended byDerman (2001) thatwas discussed inSection8.4. Static relationships, and thequasistaticrelationshipsIwilldiscussinamoment,correspondtothesimulationof a limited hedging strategy I propose as an alternative to Derman's fullsimulationapproachinSection8.4.3.Staticrepresentationshaveobviousoperationaladvantages.Onceitisbooked
attheinceptionofatrade,therepresentationdoesnotneedtobeupdated.Evenmore important is the simplicity introduced when the potential cost ofdifferencesbetween theactualexoticand itsvanillaoption representationoverthelifeofthetransactionisestimated.AsemphasizedinSection11.3,dynamicrepresentation requires simulation to evaluate potential costs. However, thesimulation of dynamic changes in vanilla option hedges can be far morecomputationallydifficultthanthesimulationofdynamicchangesinunderlyingforwards hedges studied inSection 11.3.The reasons for this are discussed inSection12.3.2.The ideal of a static representation cannot always be achieved. It will be
possibleinSections12.1and12.4whenwearediscussingoptionswhosepayoutdepends on prices at a single future time. However, when discussing options

whosepayoutisafunctionofpricesatdifferenttimes,asistrueinSections12.2,12.3,and12.5,staticrepresentationwillnotbepossible.Ouralternativeswillbeeitherdynamicrepresentationorquasistaticrepresentation,inwhichchangesinthe representation are minimized, often to only a single change, to simplifycalculations of potential cost. We will use the simpler term static for theremainderofthischapter,butthisisshorthandforquasistaticrepresentation,andwillpaydueattentiontotheestimationofthecostofthehedgechanges.Table12.1,whichwastakenfromSmithson(2000),showstheprincipalforms
ofexoticproductsandhowwidelytheyareusedindifferentmarkets.TABLE12.1IntensityofUseofOptionStructuresinVariousMarkets

The study of exotic options in this chapter is divided into five sections,followingthecategoriesusedinTable12.1.
Section12.1—single-payoutoptions.Theseareoptionswhosepayoffsarethefunctionsolelyofthepriceofanunderlyingassetatasinglefuturetime.Wewillshowhowtoreplicatetheseoptionsexactlyusingabasketof

forwardsandvanillaoptions.Theresultingreplicationcanbeusedbothtovaluetheexoticandrepresentitinriskreports.Theonlyresidualriskwillbetheliquidityoftheresultingbasket,particularlyinthereplicationofbinaryoptions.Aparticularexampleofanimportantsingle-payoutexoticisalogcontract,whichmakespaymentsbasedonthelogarithmoftheunderlyingprice.Itsimportanceismostlyduetoitscloselinkagetoavarianceswap,anexoticproductnotinTable12.1butthatshowsincreasinguse.Wealsodiscussthevolatilityswapinthissection,aclosecousinofthevarianceswap.Section12.2—time-dependentoptions.Theseareoptionswhosepayoffsarethefunctionofthepriceofavanillaoptionatasinglefuturetime.AsinSection12.1,wewillshowhowtoeliminateallriskofunderlyingpricemovementfortheseexoticsbyreplicationusingforwardsandvanillaoptions.Theresidualriskexposuretoimpliedvolatilityatafuturetimecanbequasistaticallyhedgedwithvanillaoptions.Theseexoticsincludeforward-startoptions,cliquetoptions,chooseroptions,andcompoundoptions.Section12.3—path-dependentoptions.Theseareoptionswhosepayoffsdependonthepriceofasingleunderlyingassetatseveralfuturetimes.Wewillfocusonbarrieroptions,butalsousethelessonslearnedtoapplytoladder,lookback,doublebarrier,andpartial-timebarrieroptions.Wewillexamineandcontrastreplicationapproachesthatutilizedynamichedgingwithvanillaoptionsandapproachesthatpermitquasistatichedgingwithvanillaoptions.Section12.4—correlation-dependentoptions.Theseareoptionswhosepayoffsdependonthepricesofseveralunderlyingassetsecuritiesandthatthereforemustbepricedbasedonassumptionsaboutcorrelations.Wewillexamineseveralimportantcases:basketforwardsandoptions,quantoforwardsandoptions,diffswaps,mortgage-backedsecurities,collateralizeddebtobligations(CDOs),andconvertiblebonds.Section12.5—correlation-dependentinterestrateoptions.Aparticularsubsetofcorrelation-dependentoptionsareoptionswhosepayoffsdependonmultiplefutureinterestrates.ThisincludestheimportantspecialcaseofAmericanandBermudanswaptions.
12.1SINGLE-PAYOUTOPTIONS
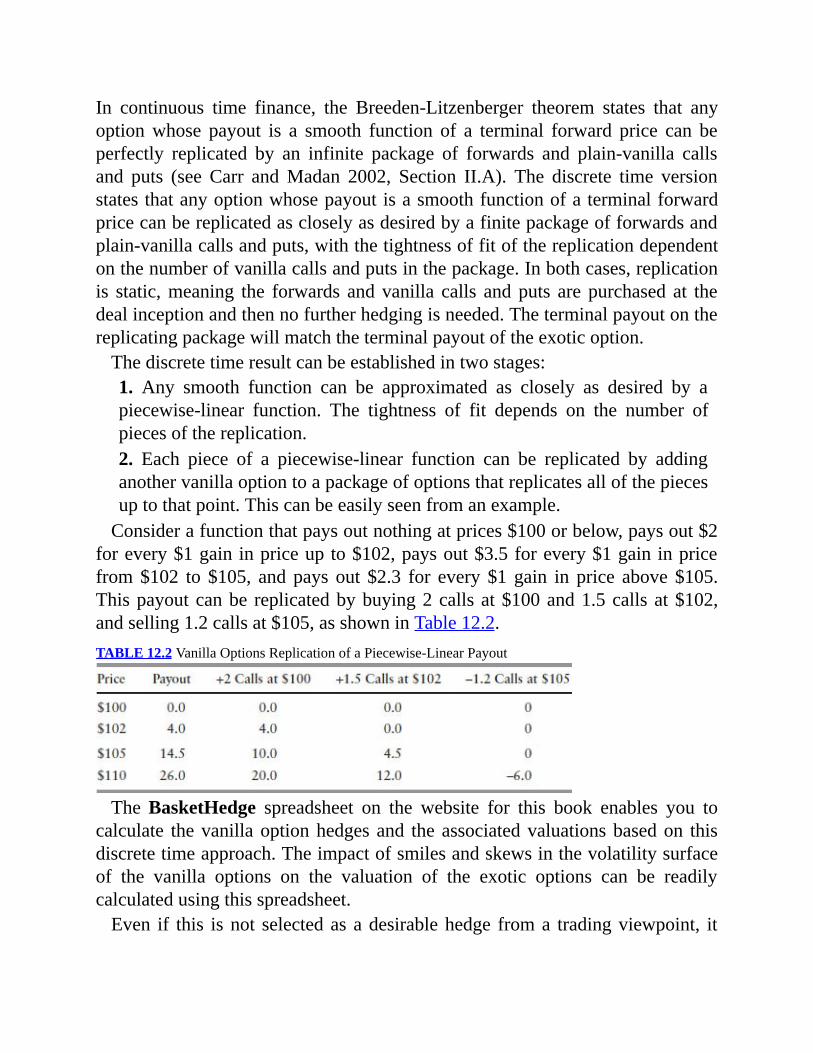
In continuous time finance, the Breeden-Litzenberger theorem states that anyoptionwhose payout is a smooth function of a terminal forward price can beperfectly replicated by an infinite package of forwards and plain-vanilla callsand puts (see Carr andMadan 2002, Section II.A). The discrete time versionstatesthatanyoptionwhosepayoutisasmoothfunctionofaterminalforwardpricecanbereplicatedascloselyasdesiredbyafinitepackageofforwardsandplain-vanillacallsandputs,withthetightnessoffitofthereplicationdependentonthenumberofvanillacallsandputsinthepackage.Inbothcases,replicationis static,meaning the forwards andvanilla calls andputs are purchased at thedealinceptionandthennofurtherhedgingisneeded.Theterminalpayoutonthereplicatingpackagewillmatchtheterminalpayoutoftheexoticoption.Thediscretetimeresultcanbeestablishedintwostages:1. Any smooth function can be approximated as closely as desired by apiecewise-linear function. The tightness of fit depends on the number ofpiecesofthereplication.2. Each piece of a piecewise-linear function can be replicated by addinganothervanillaoptiontoapackageofoptionsthatreplicatesallofthepiecesuptothatpoint.Thiscanbeeasilyseenfromanexample.Considerafunctionthatpaysoutnothingatprices$100orbelow,paysout$2
forevery$1gaininpriceupto$102,paysout$3.5forevery$1gaininpricefrom$102 to $105, and pays out $2.3 for every $1 gain in price above $105.Thispayoutcanbe replicatedbybuying2callsat$100and1.5callsat$102,andselling1.2callsat$105,asshowninTable12.2.TABLE12.2VanillaOptionsReplicationofaPiecewise-LinearPayout
TheBasketHedge spreadsheet on the website for this book enables you tocalculate thevanillaoptionhedges and the associatedvaluationsbasedon thisdiscretetimeapproach.Theimpactofsmilesandskewsinthevolatilitysurfaceof the vanilla options on the valuation of the exotic options can be readilycalculatedusingthisspreadsheet.Even if this isnot selectedas adesirablehedge froma tradingviewpoint, it

still makes sense as a way to represent the trade from a risk managementviewpointforthefollowingreasons:
Itpermitsrealisticvaluationbasedonliquid,publicprices.Alternativevaluationprocedureswouldutilizeananalyticpricingmodel,whichisusuallyeasilyderivable,butalevelofvolatilityneedstobeassumedandnostraightforwardprocedureisavailableforderivingthisvolatilityfromobservedmarketvolatilitiesofvanillaoptionsatdifferentstrikes.Thehedgepackagemethodwillconvergetothisanalyticsolutionasyouincreasethenumberofvanillaoptionhedgesused,providedallvanillaoptionsarepricedataflatvolatility(itisrecommendedthatthiscomparisonalwaysbemadeasacheckontheaccuracyoftheimplementationofthehedgingpackagemethod).However,thehedgingpackagemethodhastheflexibilitytopricetheexoticoptionbasedonanyobservedvolatilitysurface(infact,insteadofusingthevolatilitysurface,thedirectlyobservedvanillaoptionpricesareused,sothepricingisnotdependentonanyoptionmodel).Thehedgepackagemethodgivesaneasymeansofintegratingexoticoptionsintostandardriskreports,suchasprice-volmatricesandvegaexposurebystrikeandmaturity.Placingasmuchriskaspossiblewithinasinglecontextalsoincreasesthechancesthatrisksfromonepositionmayoffsetrisksinanotherposition.Onlythenetrisksneedtobemanaged.(SeetheargumentsforrequiringinternalhedginginSection6.2.)Althoughtherepresentationwillbeincompleteduetotheuseofafinitepackageofvanillaoptions,theresidualriskcanbeeasilycalculatedbyMonteCarlosimulationbasedonanassumedprobabilitydistributionoffinalforwardpricesmultipliedbytheamountofmishedge.Thisisaneasiercalculationofremainingriskthantheanalyticmethod,whichrequiresaMonteCarlosimulationofdynamichedging.
Oneobjectionthatissometimesraisedtothestatichedgingstrategyforexoticoptions is that the requiredbasket of vanilla options is unrealistic, in termsofusingoptionsatstrikesthathavelittlemarketliquidity,intermsofthenumberofdifferentoptionsinthebasket,orintermsoftherequiredoddlotsofindividualoptions.Althoughthisobjectionmayhavevalidityinthecontextofaproposedactual
hedgetobeplacedagainstaparticulardeal,itdoesnotcarrymuchforceinthecontextofriskmanagement,inwhichhedgingstrategiesareutilizedasdevicesfor representing risk in standard reports through liquid proxies. The tools formanaging vanilla European options within a portfolio framework are well

established. Aswas pointed out when discussing dynamic hedging in Section11.3, good empirical evidence exists that vanilla options at less liquid strikeswhen statically hedged with vanilla options at more liquid strikes result indynamichedgingstrategies thatachievefargreaterstability thanpuredynamichedging strategies.As a result,wewould argue that riskmanagers should nothesitatetorepresentexoticoptiontradesasbasketsofvanillaoptionsinavanillaoptions portfolio risk report. The advantages are parallel to those cited at thebeginning of Section 10.2 for representing an illiquid forward as a staticcombinationof liquidswaps:unifiedriskreporting increases risk transparency,maximizingliquidityandminimizingtransactioncosts.The one point of legitimate concernwould be if the resulting representation
wouldbeapositiontoolargetobemanagedwiththeexistingmarketliquidity.Thiswouldbeanargumentagainstrepresentingabinaryoptionasaverylargeposition in a very narrow call spread. Instead, liquidity considerations shouldlimitthesizeofthecallspreadpositionthatisusedasarepresentation,whichinturn limits thenarrowness of the call spreadused.The resulting residual risksmust be managed by the exotics desk through a combination of limits andreserves. We discuss this approach in more detail in Section 12.1.4. Anotherexamplewouldbeiftherepresentationrevealedheavyrelianceonveryhigh-orlow-strike vanilla options outside the range at which the firm's vanilla optiontraders would be comfortable managing the residual risk against more liquidstrikes.Notethatinbothcases,themethodofrepresentingexoticsexposureasabasket of vanilla options has the advantage of highlighting the regions ofilliquidityimpactingtheexotic,afocusthatmanyanalyticpricingmethodslack.These points hold generally for the replication of exotic derivatives with
vanillaoptions.Byrepresentingtheexoticderivativeascloselyaspossiblewithahedgepackageofvanillaoptions,youcanminimize theremainingbasis riskthatneedstobemanagedusingtechniquesspecifictotheexoticderivativeandmaximizetheamountofriskthatcanbecombinedwithandmanagedaspartofthevanillaoptionsbook,utilizingestablishedriskmanagementtoolssuchastheprice-volmatrix.Examples of options that can be risk managed in this way are calls on the
square, cube, square root, or other power of the excess above a strike, or thecorrespondingputs.Othermathematicalfunctions,suchasthelogarithmoftheexcessaboveorbelowastrike,arealsopossible.Thisstyleofoption,sometimescollectivelyknownaspoweroptions, has largely fallen out of favor followingtheBankersTrust (BT)/Procter&Gamble (P&G)/GibsonGreetingsblowupof

1994,whichisdiscussedinSection4.3.1.Thelawsuitsandallegationspromptedbylargelossesoncontractswithcomplexpayoffformulaswithnodiscernibletietoanyof theenduser'seconomicmotives ledtoadistrustofsuchderivatives.Currently, most market makers' client appropriateness rules permit suchcontractsonlyinverylimitedcircumstances.Nonetheless, some power options remain in active use.Themost prominent
arelogcontracts,whichareofparticularinterestbecauseoftheirlinktovaluingandhedgingvarianceswaps,anda typeofquantooption that isutilized in theforeign exchange (FX) and bullion markets. In addition, the convexityadjustmentsneededforvaluingandhedgingcertaintypesofforwardrisk,whichwediscussinSection10.2.4,canusefullybeviewedasatypeofpoweroptionandmanagedby this technique.Afterexaminingeachof these threecases,wewillfollowwithanexaminationoftheimportantcaseofbinaryoptions,whichillustratestheissueofhowtohandleliquidityriskarisingfromstaticreplication.Finally,wewillshowhowbinaryoptionscanbecombinedwithvanillaoptionstocreateotherexotics—acontingentpremiumoptionandanaccrualswap.
12.1.1LogContractsandVarianceSwapsAvarianceswap isaforwardcontractonannualizedvariancewhosepayoutatexpiryis:(12.1)
where is the realized stockvariance (quoted in annualized terms)over thelifeofthecontract,KVAR isthedeliverypriceforvariance,andN isthenotionalamountoftheswapindollarsperannualizedvolatilitypointsquared.Theholderof a variance swap at expiry receivesN dollars for every point bywhich thestock'srealizedvariance, hasexceededthevariancedeliveryprice,KVAR,andpaysNdollars foreverypointbywhich thestock's realizedvariance, fallsshort of the variance delivery price,KVAR. This contract can be generalized toassetsotherthanstocksandtoamountsotherthandollars.Varianceswapsgivetheirholdersavegaexposuresimilartowhattheywould
have by purchasing a vanilla option. However, variance swaps differ fromvanillaoptionsinthattheirvegaexposureremainsconstantovertime,whereasvanillaoptionsmaygointooroutof themoney,reducingtheirvegaexposure.Thiscanbeasignificantadvantagetoapositiontakerwhosemainconcernistofindaninvestmentthatexpresseshereconomicviewoffuturevolatility.Italso
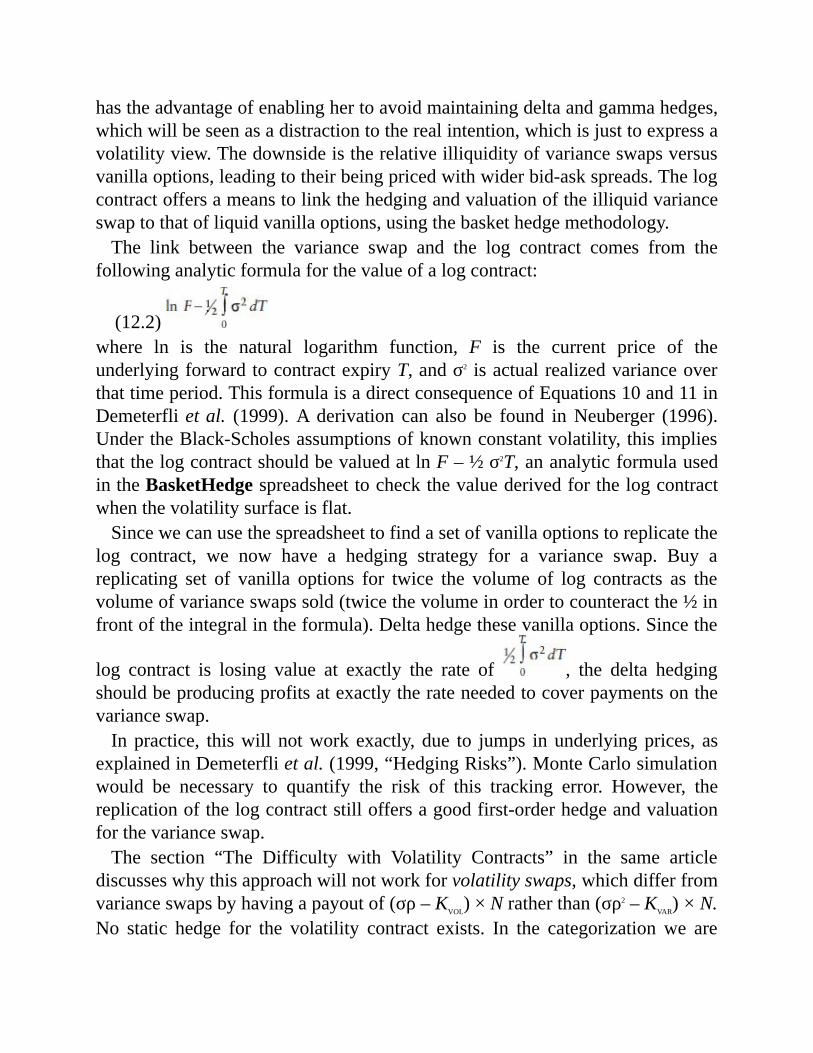
hastheadvantageofenablinghertoavoidmaintainingdeltaandgammahedges,whichwillbeseenasadistractiontotherealintention,whichisjusttoexpressavolatilityview.Thedownsideistherelativeilliquidityofvarianceswapsversusvanillaoptions,leadingtotheirbeingpricedwithwiderbid-askspreads.Thelogcontractoffersameanstolinkthehedgingandvaluationoftheilliquidvarianceswaptothatofliquidvanillaoptions,usingthebaskethedgemethodology.The link between the variance swap and the log contract comes from the
followinganalyticformulaforthevalueofalogcontract:
(12.2)where ln is the natural logarithm function, F is the current price of theunderlyingforwardtocontractexpiryT,andσ2 isactualrealizedvarianceoverthattimeperiod.ThisformulaisadirectconsequenceofEquations10and11inDemeterflietal. (1999).A derivation can also be found inNeuberger (1996).UndertheBlack-Scholesassumptionsofknownconstantvolatility,thisimpliesthatthelogcontractshouldbevaluedatlnF–½σ2T,ananalyticformulausedintheBasketHedgespreadsheettocheckthevaluederivedforthelogcontractwhenthevolatilitysurfaceisflat.Sincewecanusethespreadsheettofindasetofvanillaoptionstoreplicatethe
log contract, we now have a hedging strategy for a variance swap. Buy areplicating set of vanilla options for twice the volume of log contracts as thevolumeofvarianceswapssold(twicethevolumeinordertocounteractthe½infrontoftheintegralintheformula).Deltahedgethesevanillaoptions.Sincethe
log contract is losing value at exactly the rate of , the delta hedgingshouldbeproducingprofitsatexactlytherateneededtocoverpaymentsonthevarianceswap.Inpractice, thiswill notworkexactly, due to jumps inunderlyingprices, as
explainedinDemeterflietal.(1999,“HedgingRisks”).MonteCarlosimulationwould be necessary to quantify the risk of this tracking error. However, thereplicationofthelogcontractstilloffersagoodfirst-orderhedgeandvaluationforthevarianceswap.The section “The Difficulty with Volatility Contracts” in the same article
discusseswhythisapproachwillnotworkforvolatilityswaps,whichdifferfromvarianceswapsbyhavingapayoutof(σρ–KVOL)×Nratherthan(σρ2–KVAR)×N.No static hedge for the volatility contract exists. In the categorizationwe are

usinginthischapter,itispathdependentandneedstoberiskmanagedusingthetechniques of Section 12.3, utilizing local volatility or stochastic volatilitymodels to determine dynamic hedges. However, its close relationship to thevarianceswap,and thus to the logcontract, suggests theuseofa liquidproxyapproach: use dynamic hedging just for the difference between the volatilityswapandlogcontractwhilestatichedgingthelogcontract.For further reading on the modeling and risk management of variance and
volatility swaps, I highly recommend Demeterfli et al. (1999) and Gatheral(2006,Chapter11).Exercise12.1asksyoutoutilizetheBasketHedgespreadsheet tolookat the
impactofchangesinthevolatilitysurfaceonthevaluationoflogcontractsandhenceonvarianceswaps.Demeterflietal.(1999)alsohasaninstructivesectionon the “Effects of theVolatility Skew” on variance swaps. Log contracts andvariance swaps require hedges over a very wide range of strikes and shouldtherefore show valuation sensitivity across the whole volatility surface. Thisseemsreasonablefromanintuitivestandpointsincechangesinvolatilityimpactvariance swaps even when the underlying forward price has moved very faraway from the current price, leaving a currently at-the-money option veryinsensitive tovega.Sohigh-and low-strikevanillaoptionsareneeded to retainthevegasensitivityofthepackage.
12.1.2Single-AssetQuantoOptionsIn Section 12.4.5, we discuss dual-currency quanto derivatives in which thepercentagechangeofanassetdenominatedinonecurrencyispaidoutinanothercurrency.Forexample,a10percentincreaseintheyenpriceofaJapanesestockwill be reflected by a 10 percent increase in a dollar payment at a fixed-in-advancedollar/yenexchangerate.Wewillseethattheforwardpriceofaquantoisthestandardforwardmultipliedbyexp(ρσSσF),whereexpistheexponentialtothe base e, σS is the standard deviation of the asset price, σF is the standarddeviationoftheFXrate,andρisthecorrelationbetweenthem.A related product is a single-currency quanto derivative in which the asset
whose percentage change is to be calculated is also the assetwhose exchangerateisfixed.Herearetwoexamples:
1. A dollar/yen FX option,which, if the yen rises in value by 10 percentrelativetothedollar,willbereflectedbya10percentpayoutinyen.Sincetheyenhasgoneupinvalueby10percentversusthedollar,thepayoutin

dollartermsis110%×10%=11%.Ingeneral,forappercentincrease,thepayoutis(1+p%)×p%=p%+p2%.2.Adollar/goldoptionstruckat$300perounce.Ifgoldrisesinvalueby10percentto$330perounce,thepaymentis1ounce×10percent=0.1ouncesofgold.Thepayoutindollarsistherefore0.1×$330=$33,whichis$300×11%.Ingeneral,forappercentincreaseingoldprices,thepayoutisp%+p2%.Sincejustasingleassetisinvolved,theσSandσFinthequantoformulaarethe
sameandρisequalto1,sothestandardforwardismultipliedbyexp(σS2).The
BasketHedge spreadsheet has a worksheet calledQuanto that calculates thevalueofasingle-assetquantousingastatichedgebasketofvanillaoptions.Asyoucanseefromthespreadsheet,thehedgeconsistsof101percentofastandardcallatthequantostrikepluscallsof2percentofthenotionalatallstrikelevelsabovethequantostrike.Thisgivesapayoff,iftheassetrisesbyppercent,of:
Whenthestatichedgecostiscomputedfromaflatvolatilitysurface,theresultsagreeexactlywithananalytic formuladerived from the forwardmultipliedbyexp(σS
2). If higher volatilities are assumed for higher strikes, the cost of thebasket hedgewill exceed the cost derived from the analytic formula. If lowervolatilitiesareassumed forhigher strikes, thecostof thebaskethedgewillbelessthanthecostderivedfromtheanalyticformula.
12.1.3ConvexityInSection10.2.4,onapplyingmathematicalmodelsofforwardrisktoindexedflows,weraisedtheissueofconvexityornonlinearityofsomeindexflowsandthe complications this can entail for valuing and hedging these flows. Wepointedouttheavailabilityofanalyticformulasthatapproximatetheconvexityadjustmentsneededtoaccountfortheimpactonvaluationofthenonlinearityofthese flows. These approximation formulas (see formulas 6.3, 29.1, 29.2, and29.4inHull2012)allrequireaninterestratevolatilityasakeyinput.However,inaworldofnonflatvolatilitysurfaces,whichimpliedvolatilityshouldbeused?Equivalently,whatarethestrikesoftheoptionscontractsthatshouldbeusedtohedgethisexposure?Thebasket-hedgingmethodologywehavedevelopedinthissectionprovidesa
more precise valuation for convexity adjustments, one that is sensitive to the

shapeof thevolatility surface, and alsoprovides details of the requiredhedgethatcanbeusedtorepresenttheexposureinconventionalvanillaoptionpositionreports, as shown in the Convexity worksheet within the BasketHedgespreadsheet.
12.1.4BinaryOptionsEuropean binary options (also known as digital options or bet options) havehighlydiscontinuouspayoffs.Thebasicform,thecash-or-nothingoption,whichwewillfocusoninthissection,payseitherzeroifthepricefinishesbelowthestrikeorasetamountifthepricefinishesabovethestrike.Avariant,theasset-or-nothingoption,payszeroifthepricefinishesbelowthestrikeortheendingpriceifthepricefinishesabovethestrike.Anasset-or-nothingoptionissimplythe sumof a standard vanilla option and a cash-or-nothingoption at the samestrikethatpaysthestrikeprice.Table12.3illustratesthepayouts.TABLE12.3PayoutsofaBinaryOption
European binary options fulfill the condition of having a payout that is afunctionofthepriceofanassetatonedefinitetime.Therefore,itcanbetreatedbythemethodologyjuststated,usingabasketofvanillaoptionstohedgeitandusing this hedge package to calculate valuation, including skew impact, tocalculate remaining risk, and to be incorporated into standard risk reports.However, the discontinuous nature of the payment at the strike leads either tounrealisticallylargehedgepositionsinvanillacalls(liquidityrisk,sincemarketprices would be impacted by an attempt to transact so many calls) or tosignificanthedgeslippage(basisrisk)betweenthebinaryoptionanditshedge.Forexample,let'ssayacustomerapproachesatradingdeskwantingtobuya
one-year binary call thatwill pay $10million if theStandard&Poor's (S&P)index is above the current one-year forward level at the end of one year andnothing otherwise. The vanilla option decomposition of a barrier option isparticularly simple. It can be represented as a call spread between twovanillaoptions of equal notional size. Assume you buy a vanilla call at a strike justbelow thecurrent forward level and sell avanillaoptionat a strike just abovethislevelwithaspreadof0.01percentofthepricebetweenthetwooptions.You

willneedtoreceive$10millioniftheindexrisesby0.01percentabovethefirststrike,sinceforanyindexmoveabovethesecondstrike,youarepayingasmuchonthesecondoptionasyouarereceivingonthefirst.Sothenotionalamountofthecalltobeboughtandsoldis$10million/0.01%=$100billion.Let us start by assuming that all vanilla calls are priced at a 20 percent flat
implied volatility. The straight analytical formula for the value of the binaryoptionistheamounttobepaid×N(d2),thetermintheBlack-Scholesequationfor a vanilla option that gives the risk-neutral probability that the price willfinishabovethestrike.Inthiscase,wehave:
(12.3)Replicating thebinaryoptionusingavanillacall spread, theexact choiceof
vanillacallstobeusedmakesvirtuallynodifferencetotheprice(aslongasweassumeaflatimpliedvolatility),butitdoesmakeasignificantdifferencetothemixbetweenliquidityriskandbasisrisk.Forexample:
Buyavanillacallon$100billionatastrikeof99.995%oftheforwardlevelatapriceofBS(99.995%,1,20%)=7.9678802%for$100billion×7.9678802%=$7,967,880,200andsellavanillacallon$100billionatastrikeof100.005%oftheforwardlevelatapriceofBS(100.005%,1,20%)=7.9632785%for$7,963,278,500,foranetcostof$7,967,880,200–$7,963,278,500=$4,601,700.Buyavanillacallon$2billionatastrikeof99.75%oftheforwardlevelatapriceofBS(99.75%,1,20%)=8.0812430%for$161,624,900andsellavanillacallon$2billionatastrikeof100.25%oftheforwardlevelatapriceofBS(100.25%,1,20%)=7.8511554%for$157,023,100,foranetcostof$4,601,800.Buyavanillacallon$500millionatastrikeof99%oftheforwardlevelatapriceofBS(99%,1,20%)=8.4357198%for$42,178,600andsellavanillacallon$500millionatastrikeof101%oftheforwardlevelatapriceofBS(101%,1,20%)=7.5152765%for$37,576,400,foranetcostof$4,602,200.
Note the inverse relationship between the width of the call spread (0.01percent,0.50percent,and2percent,respectively)andthesizeofthelegsofthecallspread($100billion,$2billion,and$500million,respectively).
Thefirstcombinationoffersthesmallestbasisrisk.Itwillreplicatethebinaryoption exactly as long as the S&P index at the end of one year is outside therange99.995%to100.005%—thatis,aslongastheS&Pindexdoesnotfinishwithinaboutone-halfbasispointofitscurrentforwardlevel.However,liquidityriskisheavy;purchasesandsalesinthesizeof$100billionwouldbecertaintomovemarket prices if they could be accomplished at all. (Even if the tradingdeskdoesnotexpecttoactuallybuythiscallspread,itsuseinrepresentingtheriskprofileofthetradewillleadtoilliquiddynamichedgingrequirements.)Atthe other end of the spectrum, the third combination is of a size that couldpossibly be transactedwithoutmajormarketmovement, but basis risk is nowmuch larger.Exact replicationof thebinaryoption takesplaceonly ina rangeoutside99%to101%ofthecurrentforward,sothereareabout100basispointsof market movement on either side of the current forward level in whichreplicationwouldbeinexact.Andreplicationcouldbeveryinexact.Iftheindexendedat100.1%oftheforward,forexample,thecustomerwouldbeowed$10million,butthevanillacallat99%wouldpayonly$500million×1.1%=$5.5million,anetlossof$4.5million.Ofcourse,thebasisriskcanbedynamicallyhedgedwithpurchasesandsales
ofS&Pfutures.However, the largepaymentdiscontinuityof thebinaryoptioncan lead to unmanageable hedging situations. For example, suppose you areclose toexpirationandtheS&Pis1basispointbelowtheforwardlevel. Ifnofurthermovementoccurs,youwillmakeabout$4.95million[(99.99%–99%)×$500million]onthevanillacallandowenothingonthebinary,butanuptickofjust2basispointswill leadtoa lossofabout$5million.Shouldyouputonadeltahedgeofasize thatwillmake$5millionfora2-basis-pointuptick?Theproblem is that a positionof this sizewill cost you$10million for a 4-basis-pointdowntick,andyoudonotgainanythingfromoptionpayoutstooffsetthisloss. In theory, in aworld of complete liquidity and no transaction costs, youcouldputonthishedgeonlyattheexactmomentyouapproachthebinarystrikeandtakeitoffassoonasyoumoveawayfromthatstrike;butinpractice,suchstrategiesarewhollyimplausible.Theactualexperienceoftradingdeskscaughtneedingtodeltahedgeasizablebinarypositionthathappenstobenearthestrikeasexpirationapproaches isexcruciatinglypainful.Tradershave theirchoiceofgambles,buttheymustdecideonalargebetinonedirectionoranother.Inlightofthis,riskmanagerswillalwaysseektoplacesomesortofcontrols
onbinarypositions.Thesecontrols,whichmaybecomplementary,comeintheformofboth limitsand reserves.Limitsareplacedon thesizeof the loss that

canoccurforacertainsizepricemove,themaximumdeltapositionthatcanberequiredforahedge,orthemaximumgamma(thechangeindelta)thatcanberequired for a given price move. Delta and gamma limits are based on theanticipated liquidity and transaction costs of the underlying market in whichhedgingisbeingdone.Limitsonlosssizearedesignedtoenabletraderstotakeapurely insuranceapproach tobinaries,hoping tocomeoutahead in the longrun.Thisrequiresthatnoonebinarybetoolarge.Suchanapproachneedstobecombinedwith eliminatingbinaries close to a strike and expiration fromdeltaand gamma reports, so that delta hedging is not attempted. It also requiresdecisionsabouthowbinariesshouldbecombinedforlimitpurposes.Tooperatelikeinsurance,binariesneedtobewidelyscatteredastomaturity
dateandstrikelevel,andlimitsneedtobucketstrikesandmaturitiesinamannerthatforcesthisscattering.However,bucketingshouldcombinebinariesinonlyonedirection(boughtorsold);itisdangeroustopermitthenettingofonebinarywithanotherexceptwhendateandstrike(andanyothercontractterms,suchasaprecisedefinitionoftheindex)exactlymatch.A valuation and reserve policy should also be consistentwith the insurance
approach to binaries—profit and loss (P&L) should be recognized only to theextent it can come close to being locked in.Gains that have great uncertaintyattached to them should only be recognized when realized. This can beaccomplished with several methods. I will provide a detailed example of amethod that Iconsiderparticularlyelegant in itscapability tobalance liquidityandbasisrisks,itsmaximaluseofstatichedgeinformation,anditsgoodfitwithdynamichedging risk reporting. In this approach, everybinaryhas an internalliquid proxy representation assigned to it that is designed to be as close aspossible to thebinaryin itspayoutswhilestillbeingcapableof liquidhedgingand conservative relative to the binary in that the internal representation willalwaysproducealowerP&Lforthefirmthanthebinary.Allriskreportsforthefirmarebasedon the internal representation,not the true representationof thebinary.Nospecialrulesarerequiredforeliminatingbinariesclosetoastrikeandexpiration from the firm's delta and gamma reports, since the internalrepresentationhasbeendesignedtobesmallenoughnottorequireunreasonablehedges. The valuation difference between the true and internal representation,which by designmust always be a positive value to the firm, is booked to areserve account. Since the reserve is always positive, this policy sometimesresultsinthefirmrecognizingwindfallprofits,butneverwindfalllosses.Let'sseehowthispolicywouldworkinthecasewehavebeenconsidering.A

callspreadisselectedastheinternalrepresentationofthebinarybychoosingthesmallest spread that results in a position size that is considered to be smallenoughtobeliquid,eitherbyrepresentingarealpossibilityforpurchaseinthemarketorbybeingrepresentableinthefirm'sriskreportsbydeltapositionsthatcanbeachievedwithreasonableliquidity.However,ratherthanchoosingacallspreadthatstraddlesthebinary,andthereforehaspayoutsgreaterthanthebinaryinsomescenarios,wechooseacallspreadthatisononesideofthebinaryandthereforealwayshaspayoutsgreaterthanthebinary.If2percentisthewidthofthecallspreadweselectasthesmallestconsistentwithaliquidposition,thenweuseasaninternalrepresentationacallspreadconsistingofasaleof$500millionatastrikeof98percentandapurchaseof$500millionatastrikeof100percent(noticethattheinternalrepresentationhastheoppositesignfromthehedgethatwouldextinguishit).Theresultingvaluationwouldbe$500million×BS(98%,1,20%)–$500million×BS(100%,1,20%)=$500million×8.9259724%–$500million×7.9655791%=$44,629,900–$39,827,900=$4,802,000.Thisisthe valuation of the internal representation. The actual binary continues to bevaluedat$4,601,700;thedifferenceof$200,300isplacedintoareserve.Iftheactualsalepriceofthebinarytoacustomeris$5million,thenonly$200,000ofthe profit from the difference between the price and valuation goes intoimmediate P&L recognition; the other $200,000 goes into a reserve againstanticipatedliquiditycostsofmanagingthebinaryrisk.Whathappenstothisreserve?Thereareseveralpossibilities:Thefirmmightdecidetoactuallybuythestaticoverhedge,whichcosts$4,802,000.Theinternalhedgereportsofthefirmwillnotshowthenetpositionbetweentheinternalrepresentationofthebinaryandtheactualcallspreadhedge.IftheS&Pindexendsupbelow98percentorabove100percent,nodifferencewillappearbetweentheeventualpayoutunderthebinaryandthepay-induetothecallspread,andthereservewillendupatzero.IftheS&Pindexendsupbetween98and100percent,thecallspreadwillhaveapay-inwhilethebinaryhasnopayout.Forexample,iftheS&Pindexendsat99percent,thecallspreadwillpay$5million,whichwillbethefinalvalueofthereserve.Atexpiryoftheoptions,this$5millionwillberecognizedinP&Lasawindfallgain.Thefirmmightnotdoanystatichedgingandmightjustdeltahedgebasedontheinternalrepresentationofthestaticoverhedge.Sincethestaticoverhedgewasselectedtobeofasizethatenablesliquiddeltahedging,theresultsinthiscaseshouldbeclosetotheresultsinthecasethatthestatic

overhedgeisactuallypurchased,butwithsomerelativelysmallvariance.Asanexample,supposethatweareveryclosetoexpiryandtheS&Pindexforwardisat99percent.Basedontheinternalrepresentationofthecallspreadoverhedge,theappropriatedeltawillbeafull$500millionlongintheS&Pindexforward,androughly$5millionindynamichedgingprofitsshouldalreadyhavebeenrealizedbutheldinreserve.Iftheindexendsat99percent,the$5millionindynamichedgingprofitswillbetakenfromthereserveandrecognizedinP&Lasawindfallgain.Iftheindexendsjustabove100percent,the$5millionindynamichedgingprofitsrealizedtodateplusthe$5milliongainfromthe1percentincreaseonthe$500millionlongintheS&Pindexwillbeexactlyenoughtopaythe$10millionowedonthebinary.Notethatkeepingthe$5millionindynamichedgingprofitsrealizedtodateinreserveisnecessarytoavoidhavingtoreverseapreviouslyrecognizedgaininordertopayoffonthebinary.Othercombinationsarepossible,suchasstatichedgesthatarenotoverhedges,butallproducesimilarresults.
In Exercise 12.2 you will run a Monte Carlo simulation of the potentialdifferences between final payout on a portfolio of binary options and theoverhedgeliquidproxy,utilizingthespreadsheetBinaryMC.Itwillallowyoutoseeapracticalexampleofhowawell-diversifiedportfolioofbinaries requireslowerreservesthanamoreconcentratedportfolioofbinaries.This technique of representing a binary internally as a static overhedge is
sometimesobjected toby front-officepersonnel as tradingoff averyprobablegaininordertoachievesecurity.Inthisview,the$400,000thatwasoriginallyrealizedonthetransactionwasrealP&L,and$200,000wassacrificedinorderto achieve security in the very small minority of cases in which the indexfinishesveryclosetothestrike.Theideathat$200,000hasbeenthrownawayis,infact,anopticalillusioncausedbyfocusingonlyonthosecasesinwhichtheindexfinishesoutsidethe99to101percentrange.Thetradestillhasa$400,000expectedvalue—itjustconsistsofasure$200,000inthevastmajorityofcasesinwhichtheindexfinishesoutside99%to101%andasetofwindfallprofitsupto$10millionwhentheindexfinisheswithinthisrange.Thefront-officeviewwould be correct if somemeanswere available, such as dynamic hedging, ofbeing almost sure of achieving this $400,000 result in all cases. But it wasexactlythelackofsuchmeans—thefactthattheuseofdynamichedgingtotrycoming close to achieving $400,000 in all cases results in some cases withdisastrous losses—that causedus to seek an alternative approach.This reserve
methodologycanbeseenasbeingconsistentwithmovingthefrontofficeawayfromviewingthesetradesasnormalderivativestradesthatcanbeapproachedinan isolated manner and toward viewing them as necessarily being part of awidelydiversifiedportfolioofbinaries.Inthiscontext,overalongenoughtimeperiod, the sum of occasional windfall gains can become a steady source ofincome.Iflimitscanensureawideenoughdiversification,thenreservesmaynotbenecessary.So far in the example we have assumed a lack of volatility skew. In the
presenceofskew,thebinarywillpricequitedifferently.Let'sseetheimpactofusing a 20.25 percent implied volatility for a strike of 99 percent and a 20percentvolatilityforastrikeof101percent.Thecostofthe99percentvanillacall is now BS(99%, 1, 20.25%) = 8.534331%, resulting in a net cost of$5,095,274. Just as with the cases previously discussed, the reduction to apackageofvanillaoptionsletsuspickuptheimpactofvolatilityskew.Wecanseethatbinaryoptionsarehighlysensitivetoskew.Taleb (1997,Chapter17)gives a luciddiscussionof thepractical aspectsof
hedgingbinaryoptions.Onpage286,Talebsaysthat“thebestreplicationforabinaryisawideriskreversal(thatwouldincludeanyprotectionagainstskew).There will be a trade-off between transaction costs and optimal hedges. Thetraderneedstoshrinkthedifferencebetweenthestrikesastimeprogressesuntilexpiration,atagradualpace.Assuchanoptimalapproachconsumestransactioncosts,thereisaneedforinfrequenthedging.”Usingacallspread(alsoknownasa risk reversal) that is wide reduces the size of the vanilla options that areneeded,reducingtransactioncostsandliquidityconcerns,andalsocapturingthevolatility skewmore accurately, since awide spread could utilizemore liquidstrikes.Aswehaveseen, thewidthof thespreadshouldnotmaterially impactthetotalhedgecost.Inmanycases,theunderlyingpricewillfinishnowherenearthestrikeandno
furthertransactionsareneeded.However,inthosecaseswheretheunderlyingisthreateningtofinishclosetothestrike,thebasisriskwillgettoolargeandthetraderwill need to roll from the original call spread into a tighter call spread,incurring transaction costs due to the need to purchase and sell options andbecausethesizesof theoptiontransactionsaregrowingas thespreadnarrows.Factoringthispotentialtransactioncostintothevaluationofbinaryoptionsisanalternative method for establishing a valuation reserve on a binary. As Taleb(1997,286)states,“whenthebetoptionisawayfromexpiration,therealrisksaretheskew.Asitnearsexpiration,theriskstransfertothepin.Inpractice,the

skewishedgeable,thepinisnot.”(WehavebeenusingbasisriskforwhatTalebtermsthepinrisk.)Gatheral(2006,Chapter8)alsohasagooddiscussionofdigitaloptions,witha
very clear demonstration of the dependence of digital option valuation on theskewofthevolatilitysurface.
12.1.5ContingentPremiumOptionsAcontingentpremiumoptionentailsnoinitialpaymentbytheoptionbuyer,whopaysonlyatoptionterminationunderthecircumstancesthattheoptionfinishesin-the-money.This type of option is popularwith some clients because of thedeferral of cash payment and because the client will not need to pay for anoptionthatturnsouttobeuseless,althoughitshouldbenotedthatanoptionthatfinishesjustslightlyin-the-moneywillstillrequireanetpaymentbytheoptionbuyer,sincethepaymentduefromtheoptionsellerwillbelessthantheoption'scost.Itiseasytoseethatacontingentpremiumoptionisjustastandardvanillaoption plus a forward to defer payment of the option premium plus a binaryoptiontooffsettheoptionpremiumdueintheeventthepricefinishesbelowthestrikeofthevanillaoption.
12.1.6AccrualSwapsAccrual swaps are swaps where interest on one side accrues only when thereferencerateiswithinagivenrange(seeHull2012,Section32.6).Anaccrualswap can be represented as a package of binary caps and floors since interestaccruing is an all-or-nothing event. Being above the floor rate requires thepayment and being above the cap rate cancels the payment, which can berepresentedbyapaymentwiththeoppositesign.
12.2TIME-DEPENDENTOPTIONSNowthatwehaveprovidedamethodologyforhedgingandvaluingthepriceofa linear underlying instrument at a single future point, we will extend thatapproachtoexoticoptionswhosepayoffsdependonthepriceofavanillaoptionatasinglefuturepoint.Thisdependenceonavanillaoption'sfuturepricecanbedecomposedintodependenceonthepriceoftheunderlyingofthevanillaoptionanddependenceonitsimpliedvolatility.Wecanhedgethefirstelementofthisdecomposition by a direct application of the methodology of the preceding

section,leavingonlydependenceonimpliedvolatility.Toseehowtohedgethispiece, letus first lookatanexotic that isdependentonlyon impliedvolatilityandhasnodependenceontheunderlyingprice.
12.2.1ForwardStartingandCliquetOptionsA forward-start option is specifically constructed to have its price dependentirelyontheat-the-moneyimpliedvolatilityofavanillaoptionataspecifiedtime.Forexample,aforward-startoptioncouldbesoldonApril1,2013,foraone-year at-the-money option to buy 1,000 shares of IBM that starts onNovember1,2013.ThestrikeoftheoptionwillbesetonNovember1,2013,atthe then underlying price.Hence, no underlying price exposure exists prior toNovember1,2013,andtheonlyexposureprior tothat timeis towhat impliedvolatilitytheat-the-moneyoptionwillsellatonNovember1,2013.Acliquetoptionisapackageofforward-startoptions,usuallywithonestarting
justas thepreviousoneexpires.Forexample,acliquetmightconsistof three-month forward-start options beginningMarch 10, June 10, September 10, andDecember 10, 2013. Since the payoff on each option in the package isdetermined independentlyof anyotheroption in thepackage, a cliquet canbevaluedbyvaluingeachforward-startoptionseparatelyandthensumming.Anaturalapproachwouldbetoconsidervaluingaforward-startoptionwithan
extensionof themethodweused to roll intoa longer-termoption(seeSection11.6.3).Theonlydifferenceisthatweneedtosetupthetargetprice-volprofilethat we want to achieve as that of an at-the-money option, regardless of theunderlying price level. TheForwardStart spreadsheet on thewebsite for thisbookshowsthedetails.Theessentialpointisthatthedifferenceinthepriceoftheat-the-moneyoptionattwodifferentimpliedvolatilitylevels,σ1andσ2,canjustberepresentedasBS(100%,T,σ1)–BS(100%,T,σ2),whereTisthetenorofthe at-the-money option to be created. Optimal fitting can then find thecombinationofcurrentoptionsthathasclosetothedesiredprofileofvolatilityexposure at the time the forward-start option expires and the at-the-moneyoptionbegins.IfyoulookattheexamplegiveninTable12.4,youwillfindthatthepackage
ofcurrentoptions thatcreates thedesiredprofilehasasignificantweightingatmanydifferentstrikelevels,soitwillvaryinvaluationbasedonboththecurrentsmileandthecurrentskew.Thisisnotsurprising,giventhatwearecreatinganoptionthathasflatexposuretofutureimpliedvolatilitylevelsatallstrikes.The

situationparallelsthatofthelogcontract,whichhasflatexposuretovariance.TABLE12.4HedgeatRolloverofaOne-YearOptionwithaForwardStartinTwoYears
12.2.2CompoundOptionsItisnowquitestraightforwardtoextendthisapproachtoexoticsthatdependonbothunderlyingandimpliedvolatility.Acall-on-a-calloptionisoneexampleofacompoundoption,whichgivesthepurchaserofthecompoundoptiontherighttobuy(orsell)aparticularvanillaoptionatagivenstrikeprice.Itisalsoknownasasplit-feeoption becauseamajor sellingpoint is that a customerwhomaywantanoptionbutisnotwillingtoinvestthatmuchinonecanputupasmallerdownpaymenttodeferthedecision.Analyticalformulasforcompoundoptions,assumingflatvolatilitysurfacesandconstantvolatility,arewellknown(seeHull2012, Section 25.6).Wewillmake use of these formulas towork through anillustrativeexample.Let's say that a customerwants to buy a one-year at-the-money call on 100
millioneurosonApril1,2013,expiringonApril1,2014.Assuming20percentimpliedvolatility,thecostwouldbe7.97percentoftheprincipalamount.We'llassumetheat-the-moneyeuroexchangerateis$0.90.Thecustomermightprefertopay4.45percenttogetanoptionthatcanbeexercisedonNovember1,2013.Onthatdate,thecustomercaneitherpay5percenttogetacallon100millioneurosatastrikeof$0.90expiringonApril1,2014,orchoosetolettheoptionexpire. The attraction to the customer is that if the euro declines in value byNovember 1, 2013, the option will seem unattractive and he will have savedmoneybyhavingpaidonly4.45percentratherthan7.97percentfortheoriginaloption.Thecustomerwillpaymorethan4.45percentonlyiftheoptionturnsouttobevaluable.Ofcourse,thedownsideisthatifhedoeswanttheoption,hewillhavepaidatotalof4.45%+5.00%=9.45%foritratherthan7.97percent.Whenthecall-on-a-calloptionexpiresonNovember1,2013,thevalueofthe
call option that the customer must now decide to purchase or let expire isdeterminedbyboth thepriceof theunderlyingeuroexchange rate (forward toApril 4, 2014) and the implied volatility for a six-month option on the eurostruckat$0.90.ThebaskethedgingprocedureusedinSection12.1canfindasetof vanilla option hedges that eliminate the risk of the uncertainty of theunderlyingeuroexchangerate.However,exposuretotheuncertaintyofthesix-month implied volatility on November 1, 2013, will remain. This impliedvolatilityexposurecanbehedgedby the sameoption roll approachasused inSection 12.2.1. The Compound worksheet of the BasketHedge spreadsheetcalculates the vanilla option hedge against the underlying price and alsocalculates the price-volmatrix exposure of the resulting hedgedposition.This

price-vol matrix can then be used as input to the ForwardStartOptionspreadsheettocomputeahedgeontheresidualforward-startingvolatilityrisk.Exercise 12.1 takes you through pricing this call-on-a-call option in the
BasketHedge spreadsheet. For a flat volatility surface, the basket hedgereproduces the analytical value, but different valuations are produced in thepresenceofsmileand/orskew.Furtherstepsintheexercisehaveyouutilizethespreadsheettocalculatehedgesandvaluationsforothercompoundoptionsandchooseoptionsinwhichthedecisiononwhetheranoptionshouldbeacalloraputcanbedeferred.
12.3PATH-DEPENDENTOPTIONSSo farwe've dealt strictlywith exotic optionswhose payment is based on thepriceofanassetatasingle timeperiod—that is,European-styleoptions.Nowwewanttolookathowanoptionthatisbasedonthepricesofasingleassetatmanytimeperiodscanbehandled.Barrieroptionsareagoodexampletofocusonforthefollowingreasons:
Theyillustratedependenceontheentirevolatilitysurface,intermsofbothtimeandstrikelevel.Theyhavealargerangeofvariants.TheyareoverwhelminglythemosttradedexoticoptionsamongFXoptionsandarealsousedwithequities,commodities,andinterestrates.Theycanbeusedasbuildingblockstoformstatichedgesforotherexoticoptions,suchaslookbackandladderoptions.
Abarrieroptionisonewhosepayoffisequaltothatofastandardcallorput,but that pays off only under the condition that some price level (called thebarrier)hasbeenbreached(ornot)atsometimeperiodpriortothetimethecallorputpayoffisdetermined.Optionsthatpayonlyifabarrierhasbeenbreachedarecalledknock-in (downand in if thebarrier isbelow theasset'spriceat thetime theoption inwritten, andupand in otherwise). For example, a one-yeardown-and-outcallontheS&Pindexwithabarrierof1,050willhavenopayoutiftheS&Pindexgoesbelow1,050atanytimeduringtheyear.Optionsthatpayonlyifabarrierhasnotbeenbreachedarecalledknock-out(eitherdownandoutorupandout).Variationsincludedoublebarrieroptionsthateitherknockoutifeitheradown-and-outoranup-and-outconditionhasbeenreachedorknockinif either a down-and-in or up-and-in condition has been reached. Anothervariation isapartial-timebarrier,where thebarrierconditioncanbeactivated
onlyduringaspecifiedtimeperiodthatbeginsaftertheoptionstartdateand/orendsbeforetheoptionterminationdate.Avariationthatcanbecombinedwithalloftheseoptionsisafixedrebatetobepaidifanoptionisknockedout.We will first show that standard analytic models for barrier options are
inadequate, both for valuation and for risk representation, in the presence ofnonflatvolatilitysurfacesforvanillaoptions.Wewillthereforeneedtoturnourattentiontotwoalternativeapproachestovaluingandhedgingbarriers:dynamichedgingutilizingbothvanillaoptionsandtheunderlyingandquasistatichedgingwithvanillaoptions.Oneparticularquasistatichedgingapproach,developedbyPeterCarr,isparticularlyusefulfordevelopinganintuitiveunderstandingoftheriskprofileofbarrieroptions.Wewillthendemonstratehowtostaticallyhedgelookback and ladder options with barrier options and how to handle rebates.Finally,wewillbrieflydiscusshowthemethodsdevelopedforstandardbarrieroptions can be applied to the broader class of single-asset exotic options,includingdoublebarriersandpartial-timebarriers.One noticeable difference between this section and all of our previous
discussions of options is that we are concerned with the drift, which can bethought of either as the difference between the risk-free rate and the dividendrate,ormoregenerallyas thediscountratebetweenforwardpricesatdifferentexpiries. Up until now, we didn't need to worry about drift because we wereconsideringonlyoptionswhosevaluewouldbedeterminedbytheassetpriceata single point in time; hence, all hedges could be based on a forwardwith asingleexpirydate.Sincewearenowconsideringoptions thatdependonpricebehavior at several points in time, hedges may need to involve forwards fordifferentexpirydatesandtherelationshipbetweenforwardpricescannolongerbeignored.
12.3.1StandardAnalyticModelsforBarriersGoodanalyticmodelsbasedonpartialdifferentialequations(PDEs)havebeendeveloped for barrier options; seeHull (2012,Section25.8) for the equations.AnalyticmodelshavegreatadvantagesintermsofcomputationalspeedrelativetoMonteCarlo and tree-basedmodels.The easeof calculating a valuationbyjustplugginginputvariablesintoaformulaexplainsmuchofthesuccessoftheBlack-Scholes equation. The formulas for barrier options require a bit morecomputationthanBlack-Scholes,but theyarestillquitemanageable.However,theanalyticmodels forbarriershave thedrawback that theyneed toassumea

single levelofvolatility,and therearenogoodrulesfor translatingavolatilitysurface observed forEuropeanoptions into a single volatility to be used for aparticularbarrieroption.Infact,casescanbeshownwherenosinglevolatilityassumption can be utilized with the standard analytic approach to give areasonable price for the barrier option. We will illustrate this point with thefollowingexample.Consideranat-the-money three-monthup-and-outcall thatknocks out at a barrier 20 percent above the strike. Its valuation at differentvolatility levels, using the standard analytic formula shown in Hull (2012,Section25.8)isshowninTable12.5.TABLE12.5ValueofaBarrierBasedonAnalyticFormulaVolatility ValueofUp-and-OutCall1.00%2.00%3.00%4.00%5.00%6.00%7.00%8.00%9.00%10.00%11.00%12.00%13.00%14.00%15.00%16.00%17.00%18.00%19.00%20.00%21.00%22.00%23.00%24.00%25.00%26.00%27.00%28.00%29.00%30.00%
0.19950.39890.59840.79790.99731.19681.39621.59561.79421.98972.17722.34992.50082.62422.71662.77712.80702.80872.78582.74212.68162.60802.52452.43402.33902.24152.14322.04551.94921.8552
Note that the analytic result has option values that first increase as thevolatility level rises,sincerisingvolatilitycauses thecallvalue to increase.Athigher volatility levels, the option values decrease as the volatility level rises,sincerisingvolatilityincreasestheprobabilityofaknock-out.Sincethebarrier

levelstartsfarawayfromthecurrentprice,itisonlyathighvolatilitiesthattheimpactofrisingvolatilityontheprobabilityofaknock-outdominatestheimpactofrisingvolatilityonthevalueofthecall.The methods for utilizing the full volatility surface, which we will discuss
shortly, would agree with these analytical results for flat volatility surfaces.However,ifweassumeanonflatvolatilitysurface,withanimpliedvolatilityof20percentforaEuropeancallstruckat100and18percentforaEuropeancallstruck at 120, approaches that utilize the full volatility surface (either theDerman-Kani dynamic hedging approach or theCarr static hedging approach)wouldpricethebarrieroptionat3.10,whichis10percenthigherthanthe2.81maximum value the barrier option reaches at any volatility level using theanalyticapproach.Thereasonforthisisthatthelowervolatilityasyouapproachthe barrier decreases the chance of penetrating the barrier withoutsimultaneouslyloweringthevalueofthecall.This example also shows why the analytic method is inadequate for
representing the risk in standard option reports. The analyticmethod does notgiveanybreakdownofhowmuchoftheriskshouldberepresentedassensitiveto changes in the at-the-money vanilla options versus how much should berepresentedassensitivetochangesintheout-of-the-moneyvanillaoptions.
12.3.2DynamicHedgingModelsforBarriersDynamichedgingmodelspricebarrieroptions(oranyotherexoticoptionwhosepayoff is a function of a single underlying asset) based on the cost ofdynamically hedging the exotic with a portfolio of the underlying asset andvanillaEuropeanoptions.ThisisanalogoustotheBlack-ScholesmodelpricingofvanillaEuropeanoptionsbasedonthecostofdynamicallyhedgingwiththeunderlyingasset.ThesemodelsutilizethefullsetofthecurrentpricesofvanillaEuropean options, so theymake use of the full volatility surface alongwith atheoryofhowthesevanillaoptionpricescanevolvewithtime.Ifyouutilizeanactual dynamic hedging strategy consistent with the model, you will besuccessful in replicating themodel's price for the exotic to the extent that themodel's theory about the evolution of the vanilla options prices is correct andthattransactioncostsaremanageable.Twoprincipaltypesofdynamichedgingmodelsareusedforexotics:1. Local volatility models that assume that volatility is a known andunvaryingfunctionoftimeandtheunderlyingpricelevel.Thesemodelsare
naturalextensionsoftheBlack-Scholesmodel,whichassumesthatvolatilityisknownandunvarying,butwhichalsoassumesitisthesameatalltimesandunderlyingpricelevels.Basedontheassumptionofthelocalvolatilitymodel,youcanderiveadefinitepriceatanyfuturetimeandtheunderlyingprice levelofanyvanillaorexoticoption.Thecostof thedynamichedgetherefore differs from the originally derived price only to the extent thatfuturevolatilitiesprovetofollowavaryingfunctionoftimeandunderlyingpricelevel(orthattransactioncostsaresignificant).2. Stochastic volatility models that assume that volatilities will vary overtime and thatmight include price jumps, based on some assumedmodel.Thecostof thedynamichedgediffers fromthederivedprice to theextentthattheprocessofactualvolatilityvariationdiffersfromthatassumedbythemodel(ortotheextentthattransactioncostsaresignificant).Arelativelystraightforwardimplementationforalocalvolatilitymodelisthe
trinomial tree approach ofDerman andKani (1994), which builds the uniquetrinomialtreeformodelingthepricediffusionoftheunderlyingassetthatmeetsthefollowingtwocriteria:
1.Volatilityisaknownandunvaryingfunctionoftimeandtheunderlyingpricelevel.2. The tree correctly pricesall European calls and puts on the underlyingassetatdifferentstrikelevelsandtimestoexpiry.A thorough discussion of the Derman-Kani approach and its application to
barrierpricingcanbefoundinChriss(1997,Chapters9and11).Ifanyreaderwants to implement this model, I strongly recommend reading Chapter 5 ofClewlow and Strickland (1998), which provides wonderfully detailedinstructionsandexamples.AgeneralintroductiontostochasticmodelscanbefoundinDermanandKani
(1998).Afrequentlyusedcomputationallytractablestochasticvolatilitymodelisthat found in Heston (1993). Amodel that is attracting current interest is thevariancegammamodel,whichisexplainedinMadan,Carr,andChang(1998).Gatherall (2006) andLee (2001) contain insightful analysis on the differencesbetweenlocalvolatilityandstochasticvolatilitymodelsinthepricingofexoticoptions.Matytsin(1999)suggeststhatacombinationofstochasticvolatilityandjumpprocessesisneededtoexplainobservedvolatilitysurfacesimpliedbythevanillaoptionprices.Thejumpprocessesareneededtoexplainthesteepnessofsmileandskewobservedatshorter-termmaturities,whereasstochasticvolatility

isneededtoexplainthesteepnessofsmileandskewatlonger-termmaturities.Dynamichedgingutilizesthefullvolatilitysurfaceinpricingbarrieroptions.It
can be readily employed for representing the barrier option in risk reportsthroughitsvanillaoptionhedges.Dynamichedgingcanalsobeapplied toanyderivative based on a single underlying. Its drawback is its vulnerability toincorrect assumptions about volatility evolution and possible instability of thehedgerepresentation.Themostthoroughdiscussionofthevulnerabilityofdynamichedgingmodels
toincorrectassumptionsaboutvolatilityevolutionthatIknowofisinGatheral(2006),arelativelyshortbookthatislongoneleganceandinsight.AtthecloseofChapter4,Gatheralstatesthat“Fromtheresultsofourcomputation,wecansee that the local volatility model and the stochastic volatility model priceEuropean options almost identically” and that “to value an option, it's notenoughjust tofitall theEuropeanoptionprices,wealsoneedtoassumesomespecificdynamicsfortheunderlying.”InChapter8,Gatheralthenanalyzesthedifferenceinevolutionofthevolatilitysurfaceimpliedbylocalvolatilitymodelsversus stochastic volatility models. He states, “If the payoff we are hedgingdepends (directly or indirectly) on the volatility skew, and our assumption[whichisimpliedbyalocalvolatilitymodel]isthatthe...skewisindependentofthevolatilitylevel,wecouldenduplosingalotofmoneyifthat'snothowthemarketactuallybehaves.”Onceanexotichasbeenpricedbyagivenmodel,theexoticcanbehedgedby
a set of vanilla options that have the same sensitivity to the model's inputparameters as the exotic. As long as the model's input parameters remainunchanged,thehedgedoesnotrequirechanging.However,changesinobservedvanilla option prices may require changes to input parameters to fit currentprices,andonceparameterschange,thehedgemayneedadjustment.How stable is the resulting representation? To what degree does it require
frequentandsizableadjustments in theoptionshedges thatcanresult inhedgeslippageasaresultofbothtransactioncosts(generallyconsiderablyhigherforoptions than for the underlying) and the instability of the hedge againstparameter changes? The more the price of a product is dependent onassumptions about volatility evolution, the greater the instability of hedges.Although trading desks may gain experience with the stability of particularmodelsinparticularmarketsthroughtime,itisdifficulttoobtainariskmeasureinadvance.TheprojectionofhedgechangesthroughMonteCarlosimulation(asrecommended by Derman [2001] as discussed in Section 8.2.6.2), which has

provedveryusefulinestablishingresultsforthehedgingofvanillaoptionswithother vanilla options, is orders of magnitude more difficult to achieve forexotics.This isbecauseeachsteponeachpathof theMonteCarlo simulationrequires recomputation of the hedge. When the only hedge change is in theunderlying, this is a very simple calculation of theN(d1) in theBlack-Scholesformula.Whenthehedgechangeisinanoption,acompleterecalculationofthemodel being used to link the vanilla options and the exotic option together isrequired.
12.3.3StaticHedgingModelsforBarriersThe uncertainty surrounding the hedging costs of using dynamic hedging forbarriers provides the motivation to search for static or near-static hedgingalternatives.Statichedgingmodelspricebarrieroptionsbasedon thecostofareplicationstrategythatcallsforanalmostunvaryinghedgeportfolio(atleastofthe vanilla options; it would be possible to use a dynamic hedge of theunderlying,althoughtheparticularstatichedgingmodelswediscussonlyutilizevanillaoptionsinthehedgeportfolio).Thesemodelsutilizenearlystatichedgeportfolios both as a way to reduce transaction costs and as a way to reducedependence on assumptions about the evolution of volatility. Chapter 9 ofGatheral (2006) analyzes these nearly static hedges of barrier options from adifferentvantagepointthanmine,butwithbroadlysimilarconclusions.Threeapproachestothestatichedgingofbarrierscanbedistinguished:1.TheapproachofDerman,Ergener,andKani,whichisbroadlyapplicabletoallexoticoptionswhosepayoffisafunctionofasingleunderlyingasset,buthasconsiderableexposuretobeingwrongaboutfuturevolatilitylevels.2. The approach of Carr, which is more specifically tailored to barrieroptions,utilizingananalysisoftheBlack-Scholesformulatoformahedgeportfoliothatis immunetochangesinoverallvolatilitylevelandvolatilitysmile. However, the Carr approach is still vulnerable to changes in thevolatility skew. It is easier to implement than the DermanErgener-Kaniapproachforbarriersintheabsenceofdrift(thatis,forwardequaltospot)and produces a very simple hedging portfolio that helps develop intuitiveunderstandingoftheriskprofileofthebarrier.3. Approaches that utilize optimal fitting give solutions close to thoseprovidedbytheCarrapproachforsinglebarriersintheabsenceofdrift,butare more flexible in handling drift and are less vulnerable to changes in

volatility skew. Optimal fitting can be generalized to broader classes ofexotics,butwithlesseasethantheDermanErgener-Kaniapproach.All three approaches are based on the idea of finding a basket of vanilla
optionsthatstaticallyreplicatethedifferencesbetweenthebarrieroptionandaclosely related vanilla option. To facilitate the discussion, we will confineourselvestothecaseofaknock-outcall,sinceaknock-incallcanbehandledasavanillacalllessaknock-outcall,andalloptionscanbetreatedascalloptionsto exchange one asset for another (refer back to the introductory section ofChapter 11). The idea is to purchase a vanilla call with the same strike andexpirationdateastheknock-outbeingsoldandthenreducethecostofcreatingthe knock-out by selling a basket of vanilla options (this basket may havepurchasesaswellassales,butthenetinitialcashflowonthebasketispositivetothebarrieroptionseller).Thebasketofvanillaoptionsmustbeconstructedsothat:
Ithasnopayoffifthebarrierisneverhit.Inthiscase,thepayoutonthebarrieroption,whichhasnotbeenknockedout,isexactlyoffsetbythepay-infromthevanillacallthatwaspurchased,sonothingisleftovertomakepaymentsonthebasket.Itsvaluewhenthebarrierishitisanexactoffsettothevalueofthevanillacall.Whenthebarrierishit,youknowyouwillnotneedtomakeanypaymentsonthebarrieroption,soyoucanaffordnowtosellthevanillacallyoupurchased.Youdonotwanttolaterbevulnerabletopayoutsonthebasketofvanillaoptionsyousold,soyoumustpurchasethisbasket.Inorderforcashflowstobezero,thebasketpurchasepricemustequalthevanillacallsaleprice.
Youcanguaranteethefirstconditionbyonlyusingcallsstruckatorabovethebarrier in thecaseofabarrierhigher than thecurrentpriceandbyonlyusingputsstruckatorbelowthebarrierinthecaseofabarrierlowerthanthecurrentprice.Ifthebarrierisneverhit,thenyoucertainlywon'tbeabovetheupbarrieratexpiration, soyouwon'toweanythingonacall, andyoucertainlywon'tbebelowthedownbarrieratexpiration,soyouwon'toweanythingonaput.Allthreestatichedgingtechniquestakeadvantageofknowingthatatthetime
youarereversingyourpositioninthesevanillaoptions,theunderlyingmustbeatthebarrier.Ausefulanalogycanbemadebetweentheseapproachestostatichedgingandtheoneweexaminedforforward-startoptionsinSection12.2.Forforward-startoptions,wepurchasedaninitialsetofvanillaoptionsandthenhad

a fixed date on which we would make a single switch of selling our initialpackageofvanillaoptionsandbuyinganewvanillaoption.Forbarrieroptions,we cannot know in advance what the time of the switch will be, but we canknowwhattheforwardpriceoftheunderlyingwillbeatthetimeoftheswitch.As with forward starts, we confine ourselves to one single switch out of theinitial vanilla option hedge package. All of these approaches therefore sharemanyoftheadvantageswesawforthestatichedgetechniqueforforwardstarts:
Acleardistinctionbetweentheportionofexpectedcostthatcanbelockedinatcurrentmarketpricesofvanillaoptions(includingcurrentvolatilitysurfaceshape)versustheportionthatrequiresprojectionsofwhatthevolatilitysurfaceshapewillbeatthetimeoftheswitch.Anestimateofuncertaintyforestablishinglimitsandreservescanbebasedonreadilyobservablehistoricalmarketdataforpossiblevolatilitysurfaceshapes.Theimpactofuncertaintyiseasytocalculatesinceitonlyneedstobecomputedatoneparticularpoint.Futureliquiditycosts,suchasthepotentialpaymentofbid-askspread,areconfinedtoasingleswitch.Althoughitistobeexpectedthattradingdeskswill,inpractice,adjustthestatichedgeasmarketcircumstancesevolve,itremainsusefulasariskmanagementtechniquetoevaluatetheconsequencesofanunadjustedhedge.
The three approaches differ in how they attempt to ensure that the optionpackagewillbeequalinvaluetothevanillacallatthetimethebarrierishit.TheDermanErgener-Kani approach (see Derman, Ergener, and Kani 1995) uses apackage of vanilla options that expire at different times.The algorithmworksbackward,startingata timeclose to theexpirationof thebarrieroption. If thebarrier is hit at this time, the only vanilla options still outstandingwill be thevanilla call and the very last option to expire in the package. Since both theunderlyingpriceisknown(namely,thebarrier)andthetimetoexpiryisknown,theonlyremainingfactorindeterminingthevaluesofthevanillaoptionsistheimplied volatility, which can be derived from a local or stochastic volatilitymodel (if it is derived from a stochastic volatilitymodel, it will be based onexpected values over the probability distribution). Thus, the DermanErgener-Kani approach can be viewed as the static hedging analog of the dynamichedgingapproacheswehavebeenconsidering.Once the prices of the vanilla options at the time the barrier is hit are
calculated,youcaneasilydeterminetheamountoftheoptionthatispartofthe

basketthatneedstobesoldinordertoexactlyoffsetthesaleofthevanillacallwith the purchase of the option in the basket. You then work backward timeperiodbytimeperiod,calculatingthevaluesofallvanillaoptionsifthebarrierishitatthistimeperiodandcalculatingthevolumeofthenewoptioninthebasketthatisneededtosetthepriceoftheentirebasketequaltothepriceofthevanillacall.At each stage, you only need to consider unexpired options, so you onlyneedtoconsideroptionsforwhichyouhavealreadycomputedthevolumesheld.The following points about the DermanErgener-Kani approach should be
noted:Ifthebarrierishitinbetweentwotimeperiodsforwhichvanillaoptionshavebeenincludedinthepackage,theresultsareapproximatedbythenearestpriortimeperiod.Theinaccuracyofthisapproximationcanbereducedasmuchasyouwantbyincreasingthenumberoftimeperiodsused.Theapproachcaneasilyaccommodatetheexistenceofdrift(dividendrateunequaltorisk-freerate),sinceaseparatecomputationismadeforeachtimethebarriercouldpotentiallybehit.Sincetheapproachreliesontheresultsofalocalorstochasticvolatilitymodeltoforecastfuturevolatilitysurfacelevelsandshapes,itisvulnerabletothesameissueaswhenthesemodelsareusedfordynamichedging—thehedgeworksonlytotheextentthattheassumptionsunderlyingthemodelprovetobetrue.AsDerman,Ergener,andKanistate,“Thehedgeisonlytrulystaticiftheyieldcurve,thedividend,andthevolatilitystructuresremainunchangedovertime.Otherwise,thehedgemustbereadjusted.”ThisisillustratedinTable12.6,whichshowsthepotentialmismatchinunwindcostataperiodclosetoexpirybasedondifferencesbetweenmodel-assumedvolatilitiesandactualvolatilitiesatthetimethebarrierishit.
TABLE12.6UnwindCostsofDermanErgener-KaniHedgeofBarrierOptionBarrierOptionStrikeat-the-money,barrierat95percentofforward,andthreemonthstoexpiry.Down-and-outcallvalueatinitial20percentvolatilityis3.1955.Unwindwithonemonthtoexpiry.VolatilityatUnwind UnwindGainorLoss10.00%15.00%20.00%25.00%30.00%
0.44790.29280.0000–0.3595–0.7549

Note that the DermanErgener-Kani approach is vulnerable to model errorsrelatingtoboththelevelofvolatilitysurfaceandtheshapeofvolatilitysurface.TheCarrapproach(seeCarr,Ellis,andGupta1998)avoidsthisdependenceon
projectingfuturevolatilitysurfacesandismuchsimpler to implement,butataprice—itcannothandlevolatilityskews(thoughitcanhandlevolatilitysmiles)anditssimplicitydependsontheabsenceofdrift(dividendrateequalsrisk-freerate).The Carr approach achieves a degree of model independence by using a
framework that corresponds directly with the Black-Scholes equation anddeterminingahedgepackagethatwillwork,providingnodriftorvolatilityskewispresent.Inthesecircumstances,onecancalculateexactlyasinglevanillaputthatwillbesellingatthesamepriceasthevanillacall inthecasethatadownbarrierishit.Itisbasedontheprincipleofput-callsymmetry.Intheboxes,wefirst explain how the principle of put-call symmetry can be derived from theBlack-ScholesequationandthenshowhowtheexactCarrhedgescanbederivedfromput-callsymmetry.
PUT-CALLSYMMETRYTheprincipleofput-callsymmetrysaysthatifyouhavetwostrikes,K1andK2,whosegeometric
averageistheforwardprice,thatis, thenthecurrentpriceofacallstrikeatK1forexpiryT,C(K1,T),andthecurrentpriceofaputstruckatK2forthesameexpiryT,P(K2,T),arerelatedbytheequation:
ThisformulaisadirectandeasyconsequenceoftheBlack-Scholesformula.FromHull(2012,Section17.8),theBlack-Scholesformulaforthepriceofacallandputbasedontheforwardpriceis:
Butsince
So,

AndsubstitutingF/K1forK2/F,
SincewehaveutilizedtheBlack-Scholesformulainourderivation,thisresultholdsonlyundertheBlack-ScholesassumptionofaflatvolatilitysurfacefortheexpirytimeTorifthedeviationfromflatvolatilitysurfaceisexactlythesameatstrikeK1andK2.However,sincetheforwardisthegeometricaverageofthesetwostrikes,thisisequivalenttosayingthatonestrikeisthesamepercentageabovetheforwardasthepercentagetheotherstrikeisbelowtheforward.Fortheirvolatilitiestobeequal,thevolatilitysurfacemusthaveasmileshape,notaskewshape,usingtheterminologyofSection11.6.2.
DERIVINGTHECARRHEDGESincenodriftispresent,theforwardpriceisequaltothespotprice,whichisthebarrierlevel,H.
SincethecallisstruckatK,wecanfindareflectionstrike,R,suchthat =Hand,byput-call
symmetry, Since youneedto
purchase putsstruckatH2/K.Foranupbarrier,onemustseparatelyhedgetheintrinsicvalueandthetimevalueofthevanillacallatthetimethebarrierishit.Theintrinsicvaluecanalmostbeperfectlyoffsetbysellingbinaryoptionsthatpay2×I,whereIistheintrinsicvalue.Anytimethebarrierishit,therewillbenearlya50–50chancethatthebinarywillfinishin-the-money,soitsvalueiscloseto50%×2×I=I.Infact,thestandardlognormalpricingofabinaryresultsinassumingslightlylessthana50percentchanceoffinishingabovethebarrier,soweneedtosupplementthebinarywithI/Hofaplain-
vanillacallstruckatthebarrier.Theexactvalueofthebinaryis andthevalueofthevanillacallstruckatthebarrier,andhenceexactlyat-the-moneywhenthebarrierishit,is
ThesumofthesetwotermsisthenI.
TheCarrapproachhasseveraladvantages:

Itshowsthatitisatleastplausibletopricethebarrierbasedonoptionswithtenorequaltothefinaltenorofthebarrier,indicatingthatthisisprobablywheremostofthebarrier'sriskexposureiscomingfrom.Havingalargebinarycomponentofthehedgeisanexcellentmeansofhighlightingandisolatingthepinriskcontainedinthisbarrierthatdiesin-the-money.Techniqueswehavealreadydevelopedformanagingpinriskonbinariescannoweasilybebroughtintoplay.Forexample,wecouldestablishareserveagainstthepinriskofthebinary(seeSection12.1.4).Thisapproachisquiteindependentofwhetherthetradingdeskactuallysellsabinaryasapartofthehedge—theriskofthebinaryispresentinanycase.BecausetheCarrapproachusesasmallnumberofoptionsinthehedgepackage,itisverywellsuitedfordevelopingintuitionabouthowchangesintheshapeofthevolatilitysurfaceimpactbarrierprices.Evenifyouchoosetohedgeandpriceusingadynamichedgingapproach,theCarrmethodologycanstillbeusefulasaliquidproxy.DynamichedgingcanbeemployedforthedifferencebetweenthebarrierandthestatichedgedeterminedbytheCarrapproach.Bychoosinganinitialhedgethat,ontheoreticalgrounds,weexpecttobeclosetoagoodstatichedge,weexpecttominimizethedegreetowhichchangesinoptionhedgesarerequired.However,byusingdynamichedging,weallowforasmuchprotectionastheaccuracyofthemodelprovidesagainstuncertaintyinskewanddrift.NeitherthepresenceofvolatilitysmilesnortheuncertaintyoffuturevolatilitysmilesimpactstheCarrapproach.Sinceitdealswithoptionsthataresymmetricallyplacedrelativetotheat-the-moneystrike,allsmileeffectscancelout.
ThesimplicityoftheCarrapproachislostinthepresenceofdriftorvolatilityskew.SeetheappendixtoCarrandChou(1996)foramethodofusingalargenumber of vanilla options to create a volatility-independent static hedge ofbarrieroptionsinthepresenceofdrift.SeeCarr(2001)foramethodofhandlingvolatilityskew.To appreciate how the Carr model performs and to gain the benefit of its
insight into the risk structure of barriers, you should study theCarrBarrierspreadsheet provided on thewebsite for this book.The spreadsheet shows thehedgestructure foralleightpossiblesimplebarrierstructuresand theresultofthe barrier unwind for a specified scenario. Exercise 12.3 guides you throughsomesampleruns.Herearesomeofthepointsyoushouldbelookingfor:
Theonecommonelementinalleightvariantsistheuseofthereflection

option—theonethatutilizestheprincipleofput-callsymmetry.Itcapturesthetimevalueofthebarrieroptionatthepointthebarrierishit.ThesamplerundisplayedinTable12.7showsthatonunwind,forthedowncallandupputcases,thereflectionoptionexactlyoffsetsthevalueoftheoptionthatneedstobepurchasedfortheincasesandneedstobesoldfortheoutcases.Fortheupcallanddownputcases,abinarypiecealsoneedstobeoffset,butthereflectionoptionoffsetstheentiretimevalue.InTable12.8,inwhichtheonlychangefromTable12.7isthatthevolatilityatunwindhasbeenraised,thebinarypiece(thesumofthebinaryandbinarycorrection)isunchangedfromTable12.7,butthetimevaluehasincreasedexactlyequallyforthevanillaoptionandthereflectionoption.Thetimevaluewhenthebarrierishitdependsonhowfarthebarrierisfromthestrike.IntheTable12.7example,theupbarrierof110isfurtherfromthe100strikethanthe95downbarrieris,sotheupreflectionoptionshavefarlessvaluethanthedownreflectionoptions.Youcanthinkofthereflectionoptionastakingvalueawayfromtheoutoptionandtransferringittotheinoption.Theupcallanddownputcasesareoneswithbinarycomponents,sincetheseinoptionswillbeginlifealreadyin-the-moneyandtheseoutoptionscauseanin-the-moneycomponenttobeextinguished.Thesizeofthebinarycomponentatthetimethebarrierishitistheexactdifferencebetweenthestrikeandbarrier.Itisdividedintotwopieces:theprincipalpieceisthebinaryoptionandthesecondarypieceisthevanillaoptionusedtosupplementthebinary.Thetotalvalueofthesetwocomponentsatinitiationwillbelessthanthepotentialvalueonhittingthebarrier,preciselyreflectingthe(risk-neutral)probabilitythatthebarrierwillbehit.Bytryingdifferentvaluesforbarrier-hittingscenarios,youwillseethataslongasvolatilityskewanddriftarebothequaltozero,thetotalimpactofbuysandsellsinalleightcasesisalwayszero.Thatis,thehedgeworksperfectlyregardlessoftheassumptionsmadeastothetimeremainingwhenthebarrierishit,theat-the-moneyvolatility,thevolatilitysmile,ortherisk-freerate.However,ifeitherdriftorvolatilityskewdiffersfromzero,gainsandlosseswilloccurwhenthebarrierishit,varyingbycase.ExamplesareshowninTables12.9and12.10.Itwouldclearlybearelativelyeasytasktocalculatethesizeofpotentiallossesbasedonassumptionsabouthowadversedriftandskewcouldbeatdifferentpossibletimesthebarrierishit.Thiscouldserveasinputforthedeterminationofreservesandlimits.

Whentheinitialvolatilityskew,volatilitysmile,anddriftaresetequaltozero,pricinggivenbythestandardanalyticformulaforbarriers(shownonthetoplineineachcolumn)exactlyequalsthetotalcreationcostoftheCarrhedges,ascanbeseenfromthezeroonthelinelabeled“difference.”Whenanyofthesevaluesisdifferentfromzero,theCarrhedgegivesadifferentvaluethantheanalyticformula.Forexample,Tabel12.11showsacasethatcorrespondstotheoneanalyzedinTable12.5,showinga3.104valuefortheup-and-outcallinthepresenceofavolatilityskewcomparedwitha2.7421valueusingtheanalyticformula.Notethatthepresenceofvolatilityskew(ordrift)intheinitialconditionsdoesnotimplythattheCarrhedgewillnotwork.Onlyconditionsatthetimethebarrierishitdeterminetheefficiencyofthehedge.
TABLE12.7CarrStaticHedge
TABLE12.8CarrStaticHedgewithHigherVolatilityatUnwind

TABLE12.9CarrStaticHedgewithNonzeroSkewatUnwind

TABLE12.10CarrStaticHedgewithNonzeroDriftatUnwind
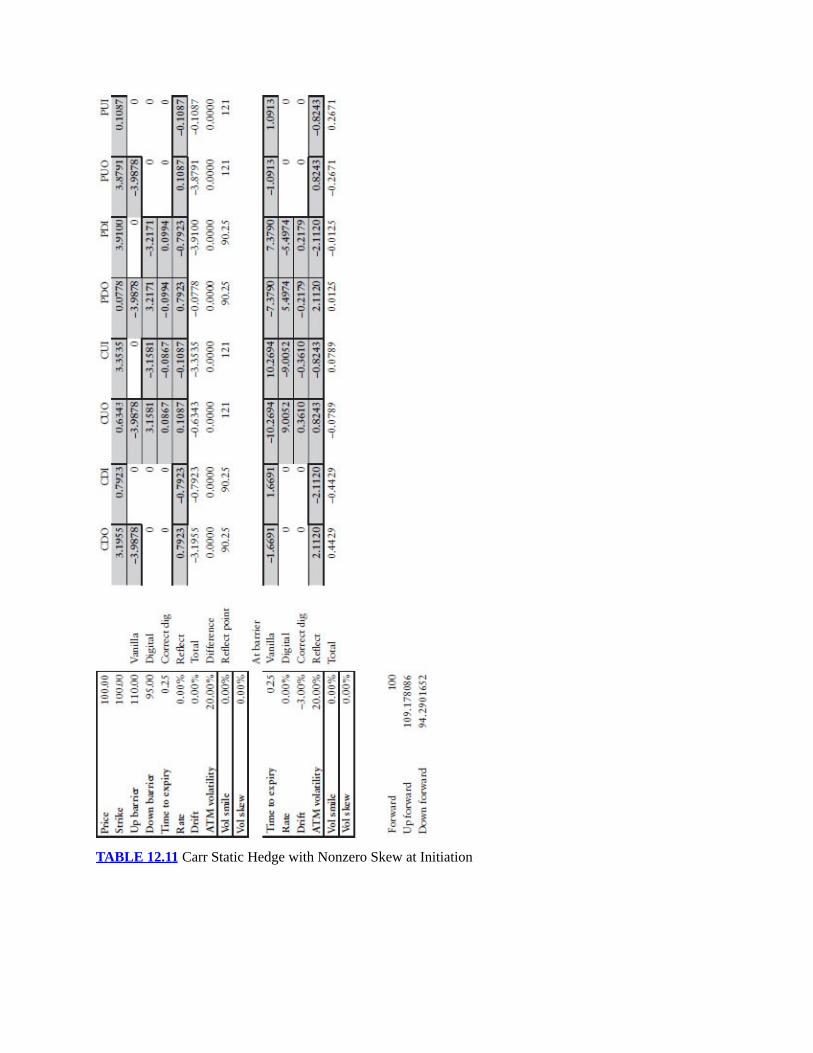
TABLE12.11CarrStaticHedgewithNonzeroSkewatInitiation

In Exercise 12.4 you will run a Monte Carlo simulation of the cost of ahedgingstrategy thathedgesabarrieroptionwith theCarrhedge,utilizing thespreadsheetCarrBarrierMC.A more general approach to static hedging that can handle all drift and
volatility shape conditions is optimization, inwhich a set of vanilla options is

chosenthatfitsascloselyaspossibletheunwindofthebarrieroptionatdifferentpossible times, drifts, volatility levels, and volatility surface shapes that mayprevailwhenthebarrierishit.TheoptimizationapproachisdiscussedinDembo(1994). Often no perfect static hedge can be found, but in these cases theoptimization produces information on the distribution of possible hedge errorsthatcanbeusefulinputfordeterminingareasonablereserve.Asimilarapproachcanbetakentomanydifferenttypesofexoticstructures.TheOptBarrierspreadsheetillustrateshowoptimizationcanbeusedtofinda
statichedgeforabarrieroption.Ifthepossibleconditionswhenthebarrierishitarerestrictedtozerodriftandvolatilitysmilebutnoskew,thentheExcelSolverwillfindasetofvanillaoptionsthatalmostexactlymatchesthebarrierunwindforallvolatilitylevelsandtimestoexpiry(althoughtheparticularsetofhedgeschosenmaylacktheclarityofinsightthattheCarrhedgesoffer).Ofcourse,thisis not a surprise since we know from the Carr approach that a perfect statichedge is possibleunder these circumstances.Whendifferentnonzerodrift andvolatility skew conditions are allowed, thematch of the barrier unwind is nolongerasexact.The spreadsheet determines how much this slippage can be across all the
specifiedcasesofhittingtime,skew,anddrift.AswiththeCarrapproach, thisinformationcanthenbeusedtosetreservesandlimits.ThedifferencefromtheCarrapproachistheobjectivetofindahedgethatminimizestheamountofthisslippage.Exercise12.3guidesyouthroughsomesampleruns.Asaconcludingnote,observethatthereisalowerlimitontheuncertaintyof
unwindcostsforanystatichedgingapproach.Anydynamichedgingmodelcanbeusedtocomputetheunwindcostofaselectedstatichedgingstrategy.Soanydifference in thepricingof barrier optionsbetweendifferent dynamichedgingmodels translates into uncertainty of unwind costs. Practical experience withdynamic hedgingmodels shows that differences in assumptions (for example,stochasticvolatilityversuslocalvolatilityandthefrequencyofjumps)giveriseto substantial differences in barrier options prices utilizing the same input forcurrentvanillaoptionsprices.Soyoucansearchforstatichedgesthatminimizethe uncertainty of unwind costs, but an irreducible uncertainty will alwaysremain that can be controlled only through limits and reserves. Static hedginggreatlysimplifiesthecalculationsneededforlimitsandreserves.
12.3.4BarrierOptionswithRebates,Lookback,and
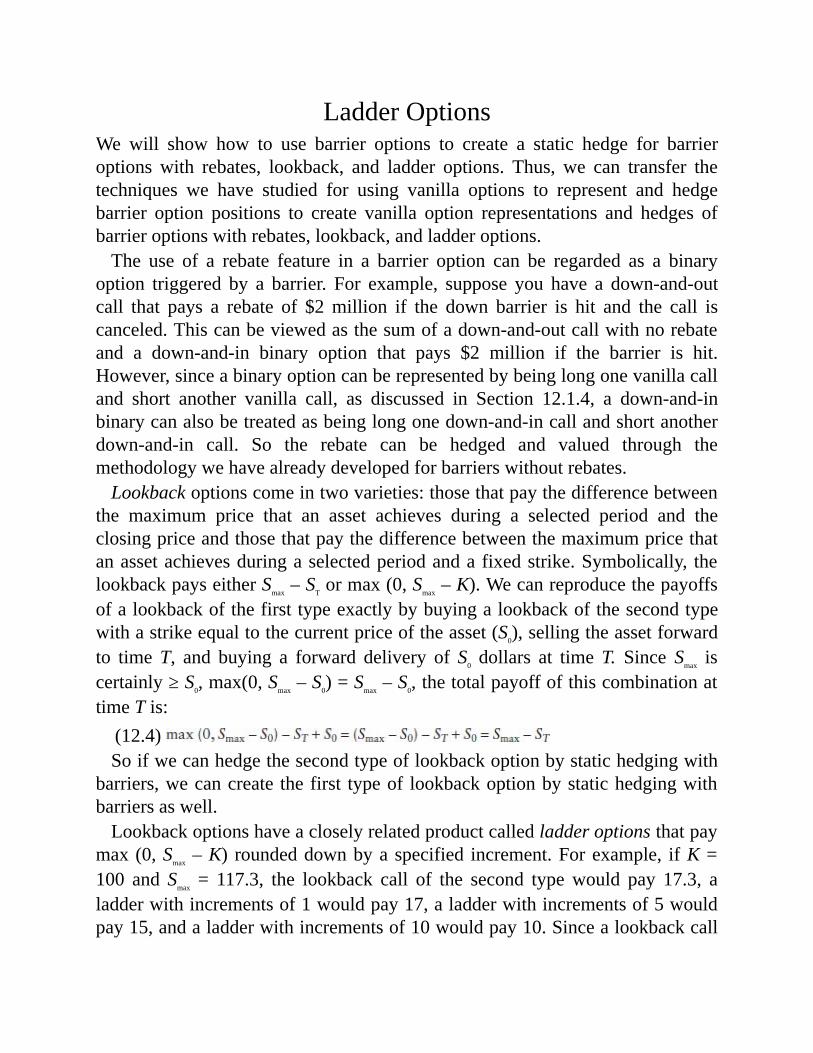
LadderOptionsWe will show how to use barrier options to create a static hedge for barrieroptions with rebates, lookback, and ladder options. Thus, we can transfer thetechniques we have studied for using vanilla options to represent and hedgebarrier option positions to create vanilla option representations and hedges ofbarrieroptionswithrebates,lookback,andladderoptions.The use of a rebate feature in a barrier option can be regarded as a binary
option triggered by a barrier. For example, suppose you have a down-and-outcall that pays a rebate of $2million if the down barrier is hit and the call iscanceled.Thiscanbeviewedasthesumofadown-and-outcallwithnorebateand a down-and-in binary option that pays $2 million if the barrier is hit.However,sinceabinaryoptioncanberepresentedbybeinglongonevanillacalland short another vanilla call, as discussed in Section 12.1.4, a down-and-inbinarycanalsobetreatedasbeinglongonedown-and-incallandshortanotherdown-and-in call. So the rebate can be hedged and valued through themethodologywehavealreadydevelopedforbarrierswithoutrebates.Lookbackoptionscomeintwovarieties:thosethatpaythedifferencebetween
the maximum price that an asset achieves during a selected period and theclosingpriceandthosethatpaythedifferencebetweenthemaximumpricethatanassetachievesduringaselectedperiodandafixedstrike.Symbolically, thelookbackpayseitherSmax–STormax(0,Smax–K).Wecanreproducethepayoffsofalookbackofthefirsttypeexactlybybuyingalookbackofthesecondtypewithastrikeequaltothecurrentpriceoftheasset(S0),sellingtheassetforwardto timeT, and buying a forward delivery of S0 dollars at timeT. Since Smax iscertainly≥S0,max(0,Smax–S0)=Smax–S0,thetotalpayoffofthiscombinationattimeTis:(12.4)Soifwecanhedgethesecondtypeoflookbackoptionbystatichedgingwith
barriers,wecancreate thefirst typeof lookbackoptionbystatichedgingwithbarriersaswell.Lookbackoptionshaveacloselyrelatedproductcalledladderoptionsthatpay
max(0,Smax–K) roundeddownbyaspecified increment.Forexample, ifK=100 and Smax = 117.3, the lookback call of the second typewould pay 17.3, aladderwithincrementsof1wouldpay17,aladderwithincrementsof5wouldpay15,andaladderwithincrementsof10wouldpay10.Sincealookbackcall

can be approximated as closely as wewant by a ladder with a small enoughincrement,itissufficienttoshowhowtostaticallyhedgealadderwithbarriers.It is easy to create a static hedge for a ladder optionusingup-and-inbinary
options.Foreachladderrung,youbuyanup-and-inbinaryoptionof thesametenor that pays the increment conditional on the rung being breached at somepointduringthelifeoftheoption.Forexample,ifK=100andwehavealadderwith incrementsof5,webuyanup-and-inbinaryoptionhavingapayoffof5andabarrierof105,anotherwithapayoffof5andabarrierof110,andsoon.Ifthehighestleveltheunderlyingreachesduringthelifeoftheladderoptionis12,then 10 will be owed on the ladder option, but the binary up-and-ins withbarriersof105and110willbothhavebeentriggeredforapaymentof5+5=10.
12.3.5BroaderClassesofPath-DependentExoticsNow that we have looked at several dynamic hedging and static hedgingalternativesformanagingriskonstandardbarrieroptions,wewant toexaminehow these approaches can be generalized to the full universe of single-assetexotics.Wewillfocusmostofourattentionondoublebarriersandpartial-timebarriers, since these are reasonably popular products and since any techniquesthat are flexible enough to handle these variants would be flexible enough tohandleanyproduct.Doublebarriersknockout(orknockin)ifeitherahigheroralowerbarrieris
crossed.Anexamplewouldbeaone-yearcalloptionstruckat100thatknocksoutifthepriceduringtheyearisevereitherabove120orbelow80.Partial-timebarriershavearestrictedtimeperiodduringwhichthebarrierprovisionapplies.Anexamplewouldbeaone-yearcalloptionstruckat100thatknocksoutifthepriceisbelow90anytimebetweentheendofmonth3andtheendofmonth9.Ifthepricegoesbelow90priortomonth3butthengoesbackabove90bytheendofmonth3,noknock-outoccurs.Similarly, if thefirst timethepricegoesbelow90isaftermonth9,noknock-outoccurs.The greatest flexibility is offered by dynamic hedging, using either local
volatility or stochastic volatility models, and by the DermanErgener-Kaniapproachtostatichedging.Bothcanbeeasilygeneralizedtodoublebarriersandpartial-time barriers. Local volatility models that solve for the exotic optionvaluesonatreeconstructedtofitvanillaoptionpricescanbeeasilyadaptedtosolve for virtually any set of payoffs. Stochastic volatilitymodels,whichmay
requireMonte Carlo simulation solutions, can easily handle any deterministicpayout.TheDermanErgener-Kanistatichedgingalgorithmcansolveforhedgepackagesthatgivezerounwindcostsfordoublebarriersandpartial-timebarriersjustaseasilyasforstandardbarriers.TheDermanErgenerKaniDoubleBarrierand DermanErgenerKaniPartialBarrier spreadsheets illustrate thiscomputation. An interested reader could use these spreadsheets as a guide toprogram a general calculator for applying theDermanErgener-Kanimethod tomorecomplexbarriers.ThedrawbacksofdynamichedgingandDermanErgener-Kani statichedging
thatweanalyzedforstandardbarriersapplyinamoregeneralsettingaswell.Itwill still be difficult to project the potential effects of hedge slippage fordynamic hedging. This is a heightened concern for double barriers since theyhave a reputation among exotics traders as particularly treacherous todynamicallyhedgesincetheyarealmostalwaysthreateningtocrossonebarrieror the other. The dependence of DermanErgener-Kani on the model used tocalculate the hedge ratios, and hence its vulnerability to being wrong aboutfuturevolatilitylevels,remainstruefortheexpandedproductset.PeterCarrandhiscollaboratorshavedonealottoexpandtheapplicabilityof
his static hedging approachbeyond standardbarriers. In particular,Carr,Ellis,andGupta(1998,Section3.1)havedevelopedastatichedgefordoublebarriers,and Carr and Chou (1997) have developed a static hedge for partial-timebarriers.SimilarresultsarepresentedinAndersenandAndreasen(2000).ThesehedgesofferoneofthemajoradvantagesoftheCarrhedgeforstandardbarriers—protection against shifts in volatility levels. However, they do not offeranothermajor advantageof theCarrhedge for standardbarriers:Theyarenotsimple to compute and do not provide much intuitive insight into the riskstructureoftheexoticbeinghedged.Thespecializednatureofeachconstructiondoesnotoffersignificantguidanceastohowtobuildhedgesforotherexotics.Optimal fittingwould seem to offer the best hope for an easy-to-generalize
static hedge that will minimize sensitivity to model assumptions. However,unlike theDermanErgener-Kanimethod,which automates the selection of thevanilla options to be used in hedging a particular exotic, the optimal fittingapproach relies on practitioner insight to generate a good set of hedgecandidates. A poor choice of possible hedges results in a poorly performingstatichedge.ApossiblesolutionistotrytogeneralizetheDermanErgener-Kaniapproachtofittoarangeofvolatilitysurfacesratherthantoasingleone.Somepromising results along these lineshavebeenobtainedbyAllenandPadovani

(2002,Section6).Acopyofthispaperisonthebookwebsite.
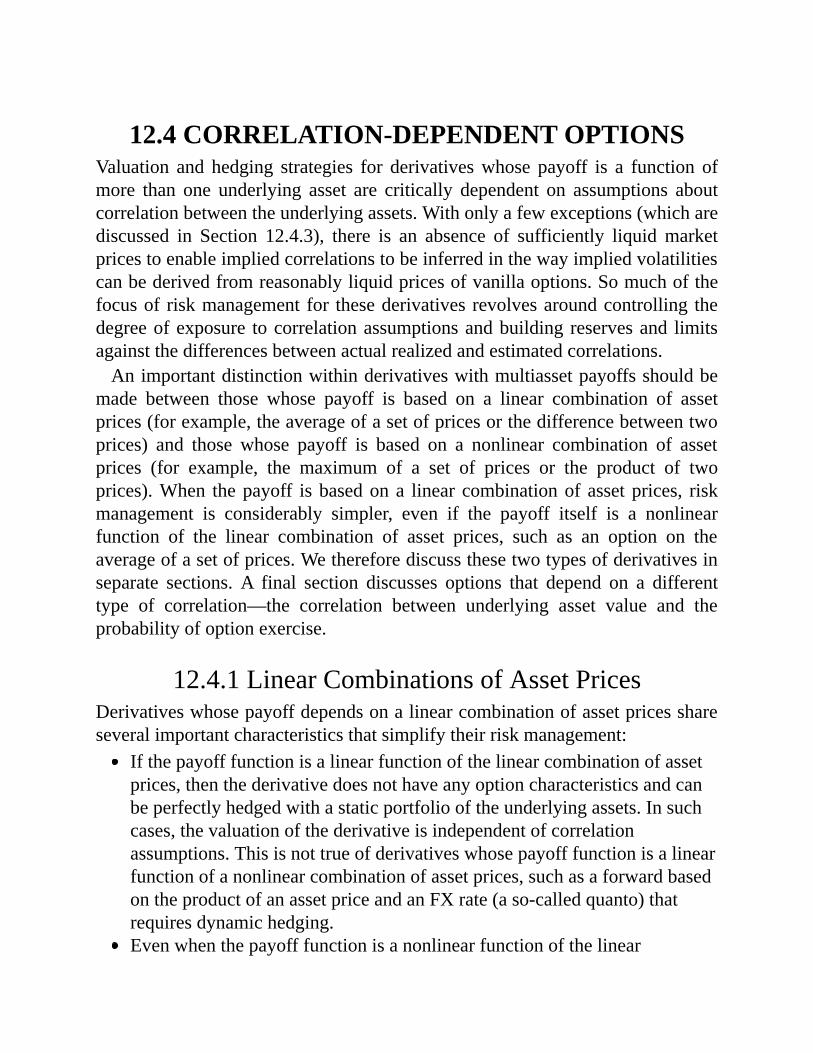
12.4CORRELATION-DEPENDENTOPTIONSValuation and hedging strategies for derivativeswhose payoff is a function ofmore than one underlying asset are critically dependent on assumptions aboutcorrelationbetweentheunderlyingassets.Withonlyafewexceptions(whicharediscussed in Section 12.4.3), there is an absence of sufficiently liquidmarketpricestoenableimpliedcorrelationstobeinferredinthewayimpliedvolatilitiescanbederivedfromreasonablyliquidpricesofvanillaoptions.Somuchofthefocusof riskmanagement for thesederivatives revolvesaroundcontrolling thedegreeofexposure tocorrelationassumptionsandbuilding reservesand limitsagainstthedifferencesbetweenactualrealizedandestimatedcorrelations.Animportantdistinctionwithinderivativeswithmultiassetpayoffsshouldbe
made between those whose payoff is based on a linear combination of assetprices(forexample,theaverageofasetofpricesorthedifferencebetweentwoprices) and those whose payoff is based on a nonlinear combination of assetprices (for example, the maximum of a set of prices or the product of twoprices).When thepayoff isbasedona linear combinationof assetprices, riskmanagement is considerably simpler, even if the payoff itself is a nonlinearfunction of the linear combination of asset prices, such as an option on theaverageofasetofprices.Wethereforediscussthesetwotypesofderivativesinseparate sections. A final section discusses options that depend on a differenttype of correlation—the correlation between underlying asset value and theprobabilityofoptionexercise.
12.4.1LinearCombinationsofAssetPricesDerivativeswhosepayoffdependsonalinearcombinationofassetpricesshareseveralimportantcharacteristicsthatsimplifytheirriskmanagement:
Ifthepayofffunctionisalinearfunctionofthelinearcombinationofassetprices,thenthederivativedoesnothaveanyoptioncharacteristicsandcanbeperfectlyhedgedwithastaticportfoliooftheunderlyingassets.Insuchcases,thevaluationofthederivativeisindependentofcorrelationassumptions.Thisisnottrueofderivativeswhosepayofffunctionisalinearfunctionofanonlinearcombinationofassetprices,suchasaforwardbasedontheproductofanassetpriceandanFXrate(aso-calledquanto)thatrequiresdynamichedging.Evenwhenthepayofffunctionisanonlinearfunctionofthelinear

combinationofassetprices,suchasanoptionontheaverageofasetofprices,andthereforerequiresdynamichedging,therulesfordynamichedgingareparticularlysimpletocalculate.Evenwhendynamichedgingisrequired,itisoftenpossibletomakeverygoodapproximationsofvaluationandtheriskofincorrectcorrelationassumptionsusingastandardBlack-Scholesmodel.
Wewillexamineeachofthesecharacteristicsmoreclosely.Wewillthenmakeuse of the approximation technique discussed previously to answer questionsabouthowtheriskofthesederivativesshouldbemanaged.
12.4.1.1DerivativesWhosePayoffsAreLinearFunctionsofLinearCombinationsofAssetPricesIn principle, any derivative whose payoff is a linear function of a linearcombinationofassetprices,suchasaforwardontheaveragepriceofabasketofassets, can be statically hedged by buying the properly weighted basket offorwards.Inpractice,thiscouldbeoperationallydifficultforabasketcomposedofaverylargenumberofassets,andamarketmakermaychoosetohedgewithadifferentlyweightedbasketselectedtostatisticallytrackthederivativepayoffclosely,witharesultingpossibilityoftrackingerror.However,ineithercase,theperformance of this hedging strategy will not be influenced by the level ofcorrelationsofassetswithin thebasket. Inparticular, thevaluationofabasketshouldnotbeinfluencedbywhethertheassetsinthebasketarewelldiversifiedor highly concentrated. Both well-diversified and highly concentrated basketsshould be valued as the weighted average of the valuations of the individualcomponents.At first, this may seem to violate intuition, since firms devote considerable
resourcestocalculationssuchasvalueatrisk(VaR)thatratehighlyconcentratedbaskets as riskier than well-diversified baskets. Shouldn't some penalty invaluationbeappliedforanassetbasketthatcarriesmorerisk?Theanswerfromcapitalmarket theory is thatonly systemic risk,which isnot capableofbeingdiversifiedaway,shouldbepenalizedandthattheroleoftoolssuchasVaRistomakecertainthatafirmhasconsideredtheproperhedgesagainstriskthatcanbediversifiedaway.Soa traderentering intoa forwardon theaveragepriceofabasket will be charged a higher risk premium by his firm's risk systems forrunning an open position (that is, not putting in place the basket hedge) in ahighlyconcentratedbasketthaninawell-diversifiedbasket.Butineithercase,

hehastheabilitytoputonthehedgeclosingouttheposition,soconcentrationshouldonlyplayaroleintheevaluationoftheriskofrunninganopenposition,notinthevaluationofthederivative.AparticularlycleardiscussionofthispointcanbefoundinVarian(1987,“ValueAdditivityTheorem”).AsVarianemphasizes,thisprincipleonlyappliesaslongaspayoffsarelinear
andceasestoapplywhenpayoffsarenonlinear.Thisistruebothfornonlinearityof the payoff function, such as an option on the average price of a basket ofstocks,andthenonlinearityofacombinationofassetprices,suchasaforwardonthemaximumpriceofasetofstocks.Assoonasnonlinearityisintroduced,considerations that only play a minor role in the risk assessment of linearproducts begin to play a role in valuation. For example, the probability ofextremetaileventsbasedonthecorrelationofdefaultprobabilitiesplaysnoroleinthevaluationofaCDObasedonabasketofloansand/orbondssolongastheCDOdividesownershipofthebasketproportionally.(ACDOisanexampleofanasset-backedsecurity;seeSection10.1.8.)However,CDOsoftendivide theownership of the basket into tranches, with some tranches paying all creditlosses up to a certain level and other tranches paying only losses above thatlevel. This enables the investor market to be segregated more efficiently bycreatingsomebondsthataretailoredtoinvestorsseekinglowercreditriskandotherbonds thatare tailored to investorswilling to takeonmorecredit risk inreturn for adequate compensation. TranchingCDOs introduces nonlinearity ofpayoffs.As a result, valuation is dependent on the probability of extreme taileventsbasedonthecorrelationofdefaultprobabilities.Forfurtherdiscussionofthispoint,seeSection13.4.1.Asecondpointtonoteisthatthearbitrageprincipleonlyappliesiftheassets
comprisingthebasketaresufficientlyliquid.Ifnot,investorswhowouldhaveahard time acquiring a diversified basket of assets may be willing to pay apremiumtoreceiveapaymentonanindexbasedontheaveragepriceofsuchabasket. This offers a profit opportunity to market makers who can efficientlyacquire diverse baskets that other market participants would find difficult toreplicate.Themarketmakercanthenoffertopayanindexbasedonitsearningsonthebasketandbuildapremiumintotheindex.Thisdiversificationpremiumhasdefinitelybeenobservedinthedefaultswapsmarket.
12.4.1.2RulesforDynamicHedgingThe required dynamic hedges for an option on a linear combination of asset
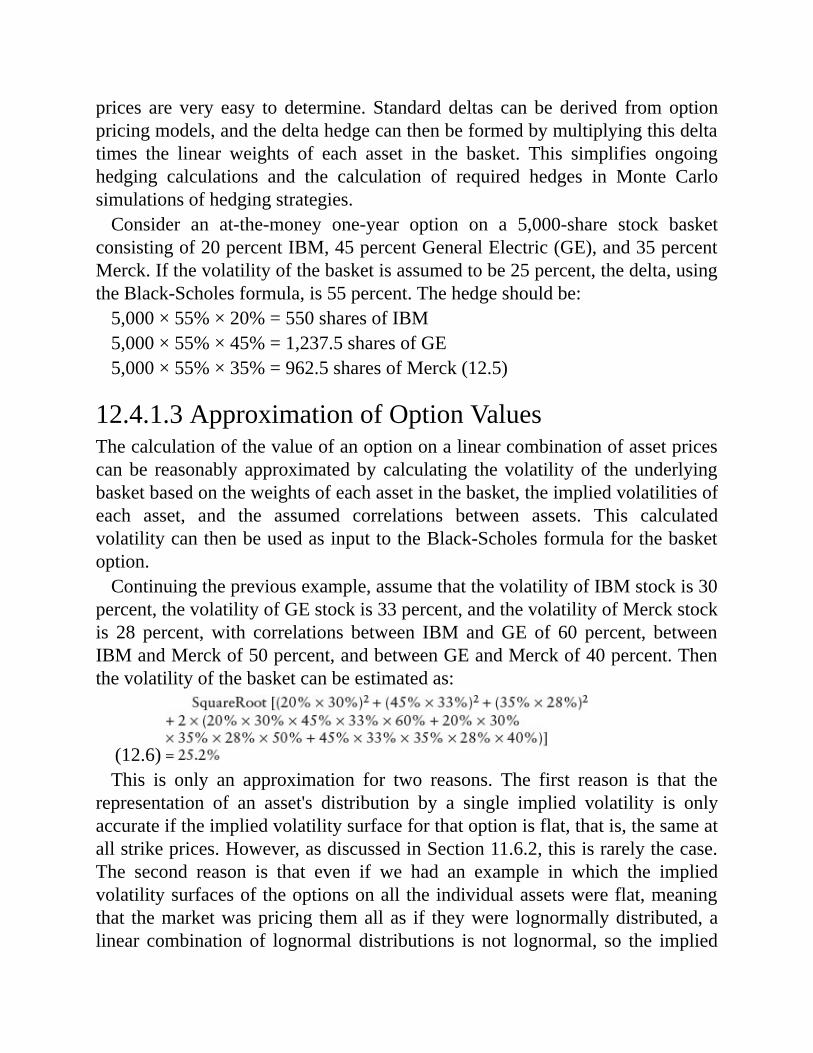
prices are very easy to determine. Standard deltas can be derived fromoptionpricingmodels,andthedeltahedgecanthenbeformedbymultiplyingthisdeltatimes the linear weights of each asset in the basket. This simplifies ongoinghedging calculations and the calculation of required hedges in Monte Carlosimulationsofhedgingstrategies.Consider an at-the-money one-year option on a 5,000-share stock basket
consistingof20percentIBM,45percentGeneralElectric(GE),and35percentMerck.Ifthevolatilityofthebasketisassumedtobe25percent,thedelta,usingtheBlack-Scholesformula,is55percent.Thehedgeshouldbe:5,000×55%×20%=550sharesofIBM5,000×55%×45%=1,237.5sharesofGE5,000×55%×35%=962.5sharesofMerck(12.5)
12.4.1.3ApproximationofOptionValuesThecalculationofthevalueofanoptiononalinearcombinationofassetpricescanbe reasonably approximatedby calculating thevolatilityof theunderlyingbasketbasedontheweightsofeachassetinthebasket,theimpliedvolatilitiesofeach asset, and the assumed correlations between assets. This calculatedvolatilitycanthenbeusedasinputtotheBlack-Scholesformulaforthebasketoption.Continuingthepreviousexample,assumethatthevolatilityofIBMstockis30
percent,thevolatilityofGEstockis33percent,andthevolatilityofMerckstockis 28 percent,with correlations between IBM andGE of 60 percent, betweenIBMandMerckof50percent,andbetweenGEandMerckof40percent.Thenthevolatilityofthebasketcanbeestimatedas:
(12.6)This is only an approximation for two reasons. The first reason is that the
representation of an asset's distribution by a single implied volatility is onlyaccurateiftheimpliedvolatilitysurfaceforthatoptionisflat,thatis,thesameatallstrikeprices.However,asdiscussedinSection11.6.2,thisisrarelythecase.The second reason is that even if we had an example in which the impliedvolatilitysurfacesoftheoptionsonalltheindividualassetswereflat,meaningthat themarketwaspricing themallas if theywere lognormallydistributed,alinear combination of lognormal distributions is not lognormal, so the implied
volatilitysurfacefor thebasketoptionwouldnotbeflatand thuscouldnotberepresentedbyasinglevolatility.Forassetswithreasonablyflat impliedvolatilitysurfaces, thisapproximation
techniquewill give accurate enough results to be useful as away of buildingintuitionabout thedegreetowhichbasketoptionpricesdependontheimpliedvolatilities of the individual assets and on the assumed correlations betweenthem.This ishowwewillmakeuseof thisapproximation in theremainderofthissection.Actualvaluationsrequiremoreaccuratenumericaltechniques.Inpractice,two
are generally used.One technique is aMonteCarlo simulation inwhich eachasset process is specifiedby a full distribution that corresponds to the impliedvolatility surface for that asset, following the approach discussed in Section12.3.2.Assumedcorrelationsbetweenassets canbe enforcedby the techniquediscussed in Hull (2012, Section 26.7). This technique is flexible enough tosupportmorecomplexassumptions,suchascorrelationsthatvarybasedonthepricelevelorpricemovementofthecomponentassets.Finally,thevalueofthebasketcanbecomputedalongeachsamplepathand the resultingvalueof theoptioncanbecalculated.Theflexibilitytohavecorrelationvarywithpricelevelorpricemovementcan
be important since large downward price moves tend to be accompanied byhigher correlation than ordinary pricemoves. This can result in baskets beingpricedathighervolatilityskewsthanindividualcomponentsofthebasketsinceit increasescorrelationandhence increasesvolatilityat lowerprice levels.Forfurtherdiscussionofthispoint,seeDermanandZou(2001).TheMonteCarloapproachaffordsgreatflexibility,includingtheincorporation
ofstochasticvolatilityandpricejumpassumptions.ItsdrawbackisdifficultyinvaluingAmerican-style options that require the determinationof optimal earlyexercise strategies. Further developments in Monte Carlo modeling do allowapproximations of American option valuation; see, for example, Broadie,Glasserman,andJain(1997).The alternative approach forAmerican-style options on baskets is the three-
dimensional tree approach described inHull andWhite (1994).This approachenables thecombinationof two trinomial trees thathavebeenfitted to the fullimpliedvolatilitysurface,usingthetechniquesdiscussedinSection12.3.2,tobecombined intoa single treebasedonassumedcorrelations,whichcanvarybynode. Basket values can then be computed on the combined tree and optionvalues determined by working backwards on the tree. This approach has the
advantage of greater precision in determining early exercise strategies. Thedisadvantagesare that it isonlycomputationally feasible forbaskets involvingtwo assets and it is restricted to using local volatility models to replicate theimplied volatility surface, which lacks the flexibility to incorporate stochasticvolatilityorprice jumps.Apossiblecombinationof the twomethods formorethan two assets would be to determine the option price for the final exerciseusingthemorepreciseMonteCarlomethodandestimatingtheextravalueduetopossible early exercise using the three-dimensional tree techniqueusing thefirsttwoprincipalcomponentsoftheassetsasthetwovariablestobemodeledonthetree.
12.4.2RiskManagementofOptionsonLinearCombinations
Wewillnowtakeadvantageofthesimpleformulaavailabletoapproximatethevalueofanoptiononalinearcombinationofassetstoexaminehowrisksarisingfrompositionsintheseoptionsshouldbemanaged.Onepossibleriskmanagementtechniqueispuredynamichedgingofoptions
positions in a particular linear combination. This is operationallystraightforward, as discussed in Section 12.4.1.2. However, it encounters thesamedeficienciesofrelianceonthedelta-hedgingstrategythatwediscussedinSection11.1.Thesameargumentsfavoringtheuseofotheroptionsinhedgingthatweregiven inSection11.1apply,but it isunusual to findany liquidity inoptions on asset combinations. This suggests the use of options on individualassetscomprisingthebasketaspartofthehedge.Consider the following simple example. An option has been written on the
average of two assets, A and B. Compare the simulation results of a puredynamichedgewiththeunderlyingstockswiththesimulationresultsofahedgethat involves first purchasingoptionson assetsAandBand thendynamicallyhedgingtheresultingpositionwiththeunderlyingstocks.Supposeaone-yearat-the-moneyoptionhasbeenwrittenontheaverageofthe
prices of two stocks, A and B. Assume that both A and B have 20 percentvolatilityonaveragewitha33percentstandarddeviationofvolatilityandthatcorrelationbetweenthetwoassetsaverages0percentwitha33percentstandarddeviation.Wewill simulate twohedgingstrategies:Useapuredynamichedgewiththeunderlyingstocks,orfirstpurchaseanat-the-moneyoptiononAandanat-the-money option on B and then dynamically hedge the resulting position

with the underlying stocks. The ratio of the notional of purchased options onindividual stocks to the notional of the sold basket option we will use is 70percent, split equally between the option on A and the option on B. This 70percent ratio is suggestedby the averagevolatility of thebasket optionbeing
whichisjustalittlebitmorethan70percentofthe20percentaveragevolatilityoftheindividualstocks.Simulationstartingwithdifferent ratiosof individual stockoptions to thebasketoptions confirmsthat 70 percent is the ratio that results in the lowest standard deviation of thedynamic hedging results. Table 12.12 compares the results between the twohedgingstrategies.TABLE12.12TheImpactofHedgingBasketOptionswithSingle-StockOptions
StandardDeviation
TransactionCosts
Dynamicallyhedgewithunderlyingstocksonly 28.7% 2.3%Purchaseat-the-moneyoptionsonstocksAandBandthendynamicallyhedge
14.0% 1.9%
Although a substantial reduction in uncertainty and transaction costs resultsfromutilizinganoptionintheconstituentstocksasahedge,itisnotaslargeareductionaswasshownforhedgingvanillaoptionswithvanillaoptionsatotherstrikesinTable11.2.Evenifwewerecertainofthecorrelation,thestatichedgeutilizing the purchase of at-the-money options on stocks A and B can onlyreducethestandarddeviationto12.2percent.Theintuitivereasonforthisisthattherelationshipofonestrikebeinglocatedmidwaybetweentwootherstrikesisobviouslystable,whereastheunderlyingstockoptionscanmoveintooroutofthemoneywithoutasimilarmoveonthepartofthebasketoption.Forexample,ifstockA'spricerisesby20percentandstockB'spricefallsby20percent,thepreviouslyat-the-moneycalloptionsonstockAandBwillnowbesubstantiallyin-the-moneyandout-of-the-money,respectively.Inbothcases,theirsensitivitytovolatilitywillbeconsiderablyreducedfromthetimeofinitiation.Thisisnottrue for the basket option, which will still have its same initial sensitivity tovolatilitysinceitisstillat-the-moneyrelativetotheaveragepriceofAandB.Apossibleremedywouldbetodynamicallychangetheamountofsinglestock
options being used to hedge in response to changes in relative volatilitysensitivityofthebasketoptionandsinglestockoptions.Thishasmanysimilarvirtues and drawbackswith the proposal to dynamically hedge barrier optionswithvanillaoptionsthatwasconsideredinSection12.3.2.Oneadvantageinthiscaseisthatitisconsiderablyeasiertocalculatetherequiredoptionhedgesinthe
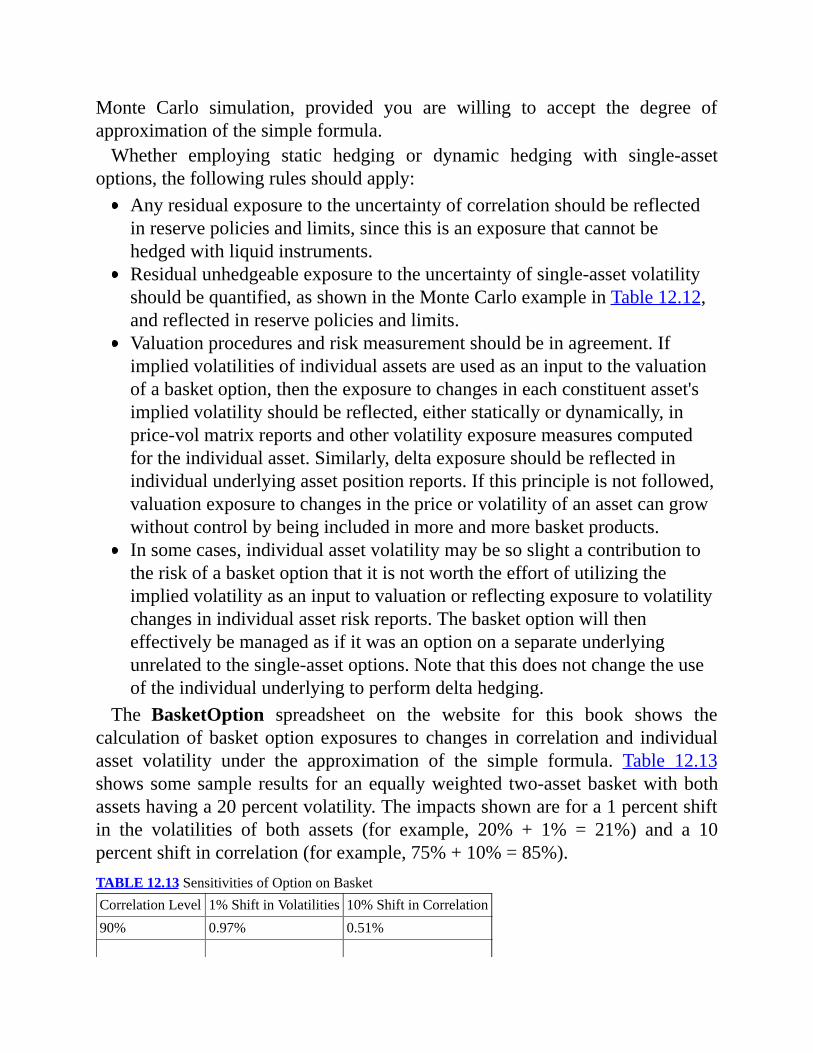
Monte Carlo simulation, provided you are willing to accept the degree ofapproximationofthesimpleformula.Whether employing static hedging or dynamic hedging with single-asset
options,thefollowingrulesshouldapply:Anyresidualexposuretotheuncertaintyofcorrelationshouldbereflectedinreservepoliciesandlimits,sincethisisanexposurethatcannotbehedgedwithliquidinstruments.Residualunhedgeableexposuretotheuncertaintyofsingle-assetvolatilityshouldbequantified,asshownintheMonteCarloexampleinTable12.12,andreflectedinreservepoliciesandlimits.Valuationproceduresandriskmeasurementshouldbeinagreement.Ifimpliedvolatilitiesofindividualassetsareusedasaninputtothevaluationofabasketoption,thentheexposuretochangesineachconstituentasset'simpliedvolatilityshouldbereflected,eitherstaticallyordynamically,inprice-volmatrixreportsandothervolatilityexposuremeasurescomputedfortheindividualasset.Similarly,deltaexposureshouldbereflectedinindividualunderlyingassetpositionreports.Ifthisprincipleisnotfollowed,valuationexposuretochangesinthepriceorvolatilityofanassetcangrowwithoutcontrolbybeingincludedinmoreandmorebasketproducts.Insomecases,individualassetvolatilitymaybesoslightacontributiontotheriskofabasketoptionthatitisnotworththeeffortofutilizingtheimpliedvolatilityasaninputtovaluationorreflectingexposuretovolatilitychangesinindividualassetriskreports.Thebasketoptionwilltheneffectivelybemanagedasifitwasanoptiononaseparateunderlyingunrelatedtothesingle-assetoptions.Notethatthisdoesnotchangetheuseoftheindividualunderlyingtoperformdeltahedging.
The BasketOption spreadsheet on the website for this book shows thecalculationofbasketoptionexposures tochanges incorrelationand individualasset volatility under the approximation of the simple formula. Table 12.13showssomesampleresults foranequallyweighted two-assetbasketwithbothassetshavinga20percentvolatility.Theimpactsshownarefora1percentshiftin the volatilities of both assets (for example, 20% + 1% = 21%) and a 10percentshiftincorrelation(forexample,75%+10%=85%).TABLE12.13SensitivitiesofOptiononBasketCorrelationLevel 1%ShiftinVolatilities 10%ShiftinCorrelation90% 0.97% 0.51%

75% 0.94% 0.53%50% 0.87% 0.57%25% 0.79% 0.62%0% 0.71% 0.69%–25% 0.61% 0.79%–50% 0.50% 0.95%–75% 0.35% 1.30%–90% 0.22% 1.85%–95% 0.16% 2.31%–98% 0.10% 2.90%
Note how the relative contribution of individual stock volatility relative tocorrelationdeclinessharplyascorrelation levelsbecomenegative.This isveryrelevant for options on the spread between two asset prices, since the hedgebasketthenconsistsofapositivepositioninoneassetandanegativepositionintheother. If theassetsarestronglycorrelated, theirpositions in thebasketwillshow high negative correlation. In these cases, hedging the individual optionvolatilitiesisquestionable.Onereportingissueforallmultiassetderivativesiswhethertotakecorrelation
into account when reporting delta and vega exposure of the derivative. As aconcrete example, consider a forward on the average of two stocks,A andB,whose prices are 90 percent correlated. If the overall basket position has anexposure of $1million for a 10 percent rise in the average price, should youshow the exposure to A as $500,000 or as something closer to $1million toreflecttheprobabilitythatariseinthepriceofAwillbeaccompaniedbyarisein the price of B? Clearly, for purposes of the firm's consolidated risk-managementreports,$500,000istherightfiguresincetheconsolidatedreportswill also be showing a $500,000 exposure to B and these two positions willcontributetotheconsolidatedreportingoftotalexposuretoa10percentincreaseinstockprices.Ifyouusedapositioncloserto$1millionfortheAexposure,itwouldhavetheabsurdresult,whencombinedwithexposuretoB,ofshowinganexposure greater than $1 million to a 10 percent increase in stock prices.However, including a correlation may be appropriate for specially tailoredreportsfortraderswhowantaquickruleofthumbabouthowmuchthebasketpricewillmovewhenstockA'spricemoves(perhapsbecauseA'spriceismoreliquidthanB's).Aparticularexamplethathasattractedindustryattentionisthesensitivityofconvertiblebondprices tochanges in theunderlyingstockprice,whichwediscussfurtherinSection12.4.4.

Aparticularexampleofabasketoption isanAsianoptiononasingleasset.AnAsianoptionisanoptionontheaveragepriceoftheassetoveraspecifiedsetofobservations.Thisisequivalenttoanoptiononabasketofforwardswherealltheforwardsareforthesameunderlyingasset.Obviously,onewouldexpectcorrelationson such forwards tobequitehigh. In fact, theconventionalAsianoption pricing formula assumes a correlation of 100 percent (see Hull 2012,Section25.12),whichisequivalenttoassumingconstantinterestrates,whichisslightly inaccurate. Note that the time period over which each forward willcontributevolatilitytothebasketisdifferent,whichisakeyelementtobetakenintoaccountinthepricingoftheoption.
12.4.3IndexOptionsAsageneralization,wehavestatedthatmostmultiassetderivativesareilliquid.But this rule has clear exceptions—most prominently, options on interest rateswapsandoptionsonequityindexes.Optionsoninterestrateswaps,alsoknownas swaptions, are mathematically and financially equivalent to options on abasket of forwards so they reflect an implied correlation. This special case istreatedatlengthinSection12.5.Optionsonstockindexes,suchastheS&P500,NASDAQ,FTSE,andNikkei,areamongthemostwidelytradedofalloptions.Comparingimpliedvolatilitiesofstockindexoptionswithimpliedvolatilitiesofoptions on single stocks that are constituents of the indexwill therefore yieldimpliedcorrelationlevels.Welookattheriskmanagementconsequences,whichcanalsobeappliedtootherliquidindexoptionssuchasoptionsoncommoditybasketsandFXbaskets.The first principle is that the valuation of a reasonably liquid index option
shouldalwaysbedirectlybasedonmarketprices for the indexoptionandnotderived from prices for options on individual stocks in the index and acorrelation assumption.Correlation assumptions, nomatter howwell based inhistoricalanalysisandeconomicreasoning,shouldneverbeallowedtoreplaceamarket-derived implied correlation to assess the price at which risk can beexited.Thisisjustanapplicationofthesamereasoningthatsaysthatreasonablyliquid options need to be valued using implied volatilities, not volatilityassumptionsbasedonhistory.This does not mean that room is not available for models that analyze the
index option price in terms of its constituent parts. Traders frequently employtradingstrategiesbasedonhowrichorcheaptheimpliedcorrelationisrelative
tocorrelationsbasedonhistoricalandeconomicanalysis.Whentheyconcludethatimpliedcorrelationsaretoolow,theybuytheindexoptionandselloptionsonindividualstocksintheindex,hopingtogainifrealizedcorrelationishigherthan implied. This is called a convergence position.When they conclude thatimpliedcorrelationsaretoohigh,theybuyoptionsonindividualstocksandsellthe indexoption.This iscalledadivergenceposition.Corporate riskmanagersneedtomakeajudgmentabouthowhighorlowrealizedcorrelationcangoinmeasuringtheriskinessofthesepositions.Indexoptionsarealsopotentiallyusefulinhedgingilliquidbasketoptions.For
example,ifamarketmakerhaswrittenanoptiononanaverageof50stocks,allofwhich are components of the S&P index, hedging the volatility risk of thebasketoptionbybuyinganoptionontheS&P500indexislikelytoleavelessresidualriskthanbuyingoptionsonthe50individualstocksanditwillcertainlybefarmoreefficientfromanoperationalriskviewpoint(anerrorismorelikelytracking 50 options positions in single stocks than 1 options position in theindex).Alsoinfavoroftheindexoptionhedgeisthatindexoptionsarealmostalwaysmoreliquidthansinglestockoptions.However, if the option written was on the average of two stocks that are
components of the S&P 500 index, hedging the volatility risk of the basketoptionbybuyingoptionsonthetwosinglestocksislikelytoleavelessresidualrisk thanbuyinganoptionon theS&P500 index.Atsomepointbetween twoand50stocks,theindexhedgeislessuncertainthantheindividualstockhedge,but it needs to be found empirically through simulation. Simulation is alsonecessary to measure the residual uncertainty of the index stock hedge forpurposes of calculating reserves and limits. The most accurate means ofsimulation is a Monte Carlo with dynamic hedging in an underlying assetpackageforwhichthedeltasonindividualstocksarecomputedasthenetofthedeltaonthebasketoptionandthedeltaontheindexoption.Anapproximationthat ismuch easier to compute and reasonably accurate for large baskets is toassumenodelta hedging and just compute the tracking error between the twooptionsthatoccursatthefinalpayoff.
12.4.4OptionstoExchangeOneAssetforAnotherAt the beginning of Chapter 11, we stated that all vanilla options could beviewed as the option to exchange one asset for another. It is equally true,following a result of Margrabe, that every option to exchange one asset for
anothercanbeevaluatedby theBlack-Scholesoption formulaused forvanillaoptions(seeHull2012,Section25.13).Sowhyshouldwetrytoviewtheseasmultiassetoptions?Becausebybringinginathirdassetthatplaysnoroleintheoriginal contract, we can in some cases increase the liquidity of the option'svaluation.Thiscanmosteasilybeseenbyaconcreteexample.Consider an option to exchange 10,000 ounces of gold for £4.5 million.
Clearly, this option will be exercised if and only if an ounce of gold at theexpirationof theoption isworthmore than£450.Equallyclearly, thiscontrasthasabsolutelynoreferenceorrelationshiptodollars.However,itcanbeviewed,asamathematicalequivalence,asaspreadoptiononthedifferencebetweenthedollarpriceof10,000ouncesofgoldandthedollarpriceof£4.5million.Toseethisequivalence,considerthefollowing:
Theoptionwillbeexercisedifandonlyifanounceofgoldisworthmorethan£450.Thisisequivalenttosayingitwillbeexercisedifandonlyifthedollarpriceofanounceofgoldisworthmorethanthedollarpriceof£450,whichisequivalenttosayingitwillbeexercisedifandonlyifthedollarpriceofanounceofgoldminusthedollarpriceof£450isgreaterthan0.Multiplyingby10,000,thisisequivalenttosayingitwillbeexercisedifandonlyifthedollarpriceof10,000ouncesofgoldminusthedollarpriceof£4.5millionisgreaterthan0.Iftheoptionisexercised,itcanbeexercisedbybuying10,000ouncesofgoldforitsthencurrentmarketpriceindollars,exchangingthegoldundertheoptionscontractfor£4.5million,andsellingthe£4.5millionforitsthencurrentmarketpriceindollars.The(necessarilypositive)differencebetweenthedollarsalepriceandthedollarpurchasepricerepresentsthepayoffoftheoption.
What has been gained by introducing dollars into the picture? If sterlingoptions on gold have no liquidmarket, but dollar options on gold and dollar-sterlingoptionshavealiquidmarket,thenthegold-sterlingspreadoptioncanbevalued and risk managed based on the implied volatilities of dollar-gold anddollar-sterling vanilla option hedges. Some residual uncertaintywill still existdue to the assumed correlation level, but this residual uncertaintymaybe lessthantheuncertaintyofanilliquidgold-sterlingexchangeoption.AswesawinTable12.13,thiswilldependonthegoldandsterling-dollarpricesnotbeingtoohighlycorrelatedwithoneanother.Iftheyarehighlycorrelated,implyingaverynegativecorrelation for the longand shortpositions in the spreadbasket, thenlittlecanbegainedfrombeingabletohedgethesensitivitytoimpliedvolatilities

ofdollar-goldanddollar-sterling.A particular case of an option to exchange one asset for another that draws
considerableattentionisthelargemarketinconvertiblebonds;seeHull(2012,Section26.4)andTsiveriotisandFernandes(1998).Convertiblebondsofferthebondholderanoptiontoexchangethebondforafixednumberofsharesofthefirmissuingtheconvertiblebond.Convertiblebondsgenerallyhavereasonablyliquid markets, so there is rarely a valuation advantage to viewing them asspread options. However, when determining trading strategies and evaluatingrisk exposures, it is often convenient to assess the dependence of convertiblebondvaluationsontheimpliedvolatilityoftheequityoption(moreprecisely,theequity-cash option), the assumed volatility of the option on a straight(nonconvertible)bondissuedbythefirm,andtheassumedcorrelationbetweenthebondandthestock.AsdiscussedattheendofSection8.3,onetradingstrategyoftenpursuedisto
trytotakeadvantageoftheimpliedvolatilityforanequityoptiononthestockofaparticularfirmbeinghigherthantheequityvolatilityimpliedbythepriceofaconvertible bond issued by that firm. A trader may decide that buying aconvertibleisaninexpensivewayofbuyingvolatilityonthefirm'sequityprice.Ora tradermightchoose torunabasisposition longtheconvertiblebondandshorttheequityoption.Riskanalysisofsuchpositionsshouldbesensitivetothereasonableness of assumptions about the volatility of the bond option and thecorrelationbetweenthebondandstockthathavebeenusedtoconcludethattheconvertible bond's equity volatility is cheap. The valuation of a convertibleshould always be based on observedmarket prices, not on assumptions aboutcorrelation.Another issue that frequently arises in the management of convertible
positionsisdeterminingthecorrectdeltatouseinhedgingaconvertiblepositionwithstock.Ithasoftenbeenobservedthatwhenstockpricesaresolowthattheconvertible is far fromitsexerciseprice, theactualresponseof theconvertibleprice tochanges in thestockprice is far larger thanwouldbeexpectedfromadeltaderived fromamodel thatonlyaccounts forvolatilityof the stockprice.Theexplanationofthisobservationcanbefoundinthecorrelationbetweenthebond and stock. When stock prices are far below its exercise prices, aconvertiblebondought tobehaveverymuch likea straightbond,butboth thebondandstockpricewillbeimpactedinsimilarwaysbychangesintheoutlookforthefirm'searnings(thisisdiscussedinmoredetailinSection13.2.4).If a convertiblebondbehavesmore like a straightbond thana stock, thena
straightbondwouldseemlikeabetterhedge.However,theremightbereasonsforusingthestockasahedge,suchasgreaterliquidityoreaseinborrowingthestock relative to the straight bond. In such instances, hedging ratios shouldcertainlyreflecttheassumedcorrelationbetweenstockandbondprices.Butyoumust be careful to remember that the correlation assumption drives this delta.Forexample,ifthefirm'sriskreportsshowasensitivitytocreditspreadfortheconvertible,alsoshowingahighsensitivitytostockpricefortheconvertibleinthefirm'sriskreportswouldinvolveadoublecountofthesensitivitytothebondprice—oncedirectlyandoncethoughthebond-stockcorrelation.
12.4.5NonlinearCombinationsofAssetPricesWhenaderivative'spayoffisthefunctionofanonlinearcombinationofasetofassetprices,noneof the three simplifyingcharacteristics thathold for a linearcombinationcanbeassumed tobe in force.Thiscanbe illustratedbyasingleconcreteexample:aquantoforwardwhosepayoffiscalculatedbytheproductofanassetpriceandFXrate.OnJanuary25,2002,stockintheSonyCorporationwastradingat6,080yen
pershareandtheyenwastradingat134.79yenperdollar.SothethencurrentdollarpriceofashareofSonystockwas6,080/134.79=$45.11.Thesix-monthforwardpriceforSonystockonthatdatewasalsoroughly6,080yenpershareandthesix-monthforwardexchangeratewas133.51yenperdollar.Supposeacustomercomestoamarketmakerlookingtopurchase1,000,000sharesofSonystock for six-month forward delivery at a dollar price. Possible contracts (seeReiner1992forafulldiscussion)couldbe:
Makethepurchasesatadollarpricefixedinadvance.Themarketmakerhasastatichedgeavailable(itisanexchangeofassets,asdiscussedinSection12.4.4).Shecanpurchase1,000,000sharesforsix-monthforwarddeliveryat1,000,000×6,080=6,080,000yenandpurchase6,080,000yenforsix-monthforwarddeliveryat6,080,000/133.51=$45,539,660,whichistheprice,withoutprofitmargin,sheshouldchargethecustomer.Makethepurchaseatadollarpricebasedontheexchangerate,whichwillbeineffectinsixmonths.Themarketmakerhasastatichedgeavailable.Shecanpurchase1,000,000sharesforsix-monthforwarddeliveryat1,000,000×6,080=6,080,000yen.Thedollarpricewillbedeterminedinsixmonthsbasedonthethenprevailingexchange.Agreethatthedollarpricepersharewilldifferfromthecurrentsix-month

forwardpriceof6,080/133.51=$45.54persharebythepercentagechangeintheyenpricepershare.Soiftheyenpriceinsixmonthsis6,080×110%=6,688,thepricepersharetobepaidwillbe$45.54×110%=$50.094.Thisisaquanto.
Nostatichedgeisavailableforaquanto.Themarketmakercanbeginwithapurchaseof1,000,000sharesforsix-monthforwarddeliveryfor6,080,000yenanda6-monthforwardexchangeof6,080,000yenfor$45,539,660.However,iftheforwardsharepricerisesby10percent,shenowhasFXriskonanadditional1,000,000×6,080×10%=608,000yenandmustenterintoaforwardexchangeoftheseyenfordollars.IftheforwardFXraterisesby10%to133.51×110%=146.86yenperdollar,shenowhasstockpriceriskofanadditional10percent,sinceherstockpricehedgeisforafixedamountofyenandwhatsheneedsisahedgeforafixedamountofdollars.Astheyenweakensagainstthedollar,sheneedstoincreasetheamountofhedgedenominatedinyentomaintainthedollaramount of the hedge. This pattern, a change in one asset price requiring adynamicchangeofthehedgeamountoftheotherasset,istypicalofderivativeswithpayoffsbasedontheproductoftwoassetprices.The formula forvaluationof aquantoed forward,under theassumptionof a
bivariatelognormaldistribution,isthepriceofastandardforwardmultipliedbyexp(ρσSσF),whereσSisthevolatilityofthestockpricedenominatedinyen,σFisthevolatilityoftheFXrate(thatis,theyenpricedenominatedindollars),andρisthecorrelationbetweenthestockpricedenominatedinyenandtheFXrate.AbriefexplanationofthisformulacanbefoundinHull(2012,Section29.3),andamore detailed derivation can be found in Baxter andRennie (1996, Section4.5).Twoimportantconsequencesfollowfromthisformula.First, thevalueofthederivative,eventhoughitisnotanoption,isdependentonthevolatilitiesofthe assets and the correlation. Second, if the correlation is zero, then thevaluation formula for a quanto is the same as the valuation formula for astandard forward, so the total impact of the dynamic hedging required mustbalance out to zero (however, this dynamic hedging could still result intransactioncosts).Aderivativewithverysimilarcharacteristicstoaquantoisadifferenceswap,
inwhich the payoff is basedon the future differencebetween interest rates indifferentcurrenciesmultipliedbyanotionalprincipaldenominatedinoneofthecurrencies.Forexample,thedifferencebetweenadollarinterestrateandayeninterest ratemay bemultiplied by a dollar notional amount. The future dollarinterest ratemultipliedby thedollarnotionalamount representsaquantity that
canbestaticallyhedged,butayen interest ratemultipliedbyadollarnotionalamountisaquantoedcombinationthatrequiresdynamichedgingofboththeyeninterestrateandthedollar/yenFXrate.Formoredetails,seeHull(2012,Section32.2)andBaxterandRennie(1996,Section6.5).Oncethebivariatelognormalassumptionisdropped,morecomplexvaluation
algorithms are required. Both theMonte Carlo and trinomial tree approachesdiscussedinSection12.3havetheflexibilitytobedirectlyappliedtoquantosorany other derivative based on a nonlinear combination of asset prices. Bothapproaches build probability distributions for each asset separately and canincorporate a full volatility surface (and, in the case of Monte Carlo, canincorporatestochasticvolatilityandpricejumps).Bothapproachescanfactorinanydesired correlation assumptions between assets.Both approaches can thencomputeanydesiredfunctionoftheassetprices,nomatterhowcomplex,basedontheindividualassetpricesateachnode(andMonteCarlocanincorporatefullpricehistoriesoftheassetsiftheyplayaroleinthefunction).Nonlinear functionsofmultipleassetpricescanrangefromthesimplicityof
themaximumorminimumpriceof abasket of assets to the complexityof aninvolved set of rules for successively dropping high and low prices out of abasketonwhichanaverageisbeingcalculated.Someassetsinthebasketmayrepresentquantoedtranslationsfromothercurrencies.Asafurtherstep,optionscanbewrittenonanyof thesenonlinearfunctions,andexoticfeaturessuchasbarriers can be introduced. So long as theMonte Carlo or tree is valuing thenonlinearfunctioncorrectly,itshouldalsovaluetheoptioncorrectly.Ageneraldesignationforderivativesbasedonnonlinearfunctionsofmultipleassetpricesandtheirderivedoptionsisarainbowcontract.Hedgingconsiderationsforderivativesonnonlinearcombinationsareexactly
parallel to those for derivatives on linear combinations, so the approach inSection 12.4.2 can be applied. The only difference is that the simpleapproximation formulas used in that section do not apply. Computations ofsensitivities to shifts in asset prices, implied volatilities, and assumedcorrelations generally need to be evaluated by rerunning the Monte Carlo ortrinomialtreevaluationmodelwithshiftedinputs.Another interesting example that is similar in structure to the quanto is
counterpartycredit exposureonaderivative suchasan interest rate swapofaFX forward.As discussed in Section 14.3.5, counterparty credit exposure cangrow or diminish through time as a function of the interest rate or FX ratedriving thevalueof thederivative.This credit exposure canbehedgedby the

purchase of credit derivatives or the short sale of bonds issued by thecounterparty. The total value of the credit exposure is then the product of thevalue of the derivative and the credit spread on the counterparty. Similar to aquanto, a dynamic hedge is required. A change in the value of the derivativerequiresachangeinthesizeofthecredithedgeandachangeinthesizeofthecreditspreadrequiresachangeinthesizeofthederivativehedge.In Section 11.3,we examined a case ofmean reversion inwhich there is a
narrowerdispersionoffinalunderlyingpricelevelsthanwouldbeimpliedbyapurerandomwalkandwequestionedwhetherdynamichedgingcostswouldbeafunction of the higher short-term volatility or the lower long-term dispersion.Our answer, based on both Monte Carlo simulation and theory, was thatsufficientlyfrequentrehedgingmakesdynamichedgingcostsdependentirelyonshort-termvolatility, but a traderwhowanted to take advantageof anticipatedlowerlong-termdispersioncoulddosobyrehedginglessfrequently(butwithanattendanttrade-offofahigheruncertaintyofhedgingcosts).Let's ask aparallel question for correlation.Supposeyou anticipate that two
assetswillhaveastrongcorrelationin termsof long-termtrend,butverylittlecorrelation in terms of short-term moves. If you are dynamically hedging aposition whose valuation depends on correlation, will your dynamic hedgingcosts be a function of the low short-term correlation or the high long-termcorrelation?Youshouldn'tbesurprisedtofindthattheansweristhesameforcorrelationas
itisforsingle-assetvolatility.Ifyourehedgeoftenenough,onlytheshort-termcorrelation impacts hedging costs. If you want to take advantage of theanticipatedlong-termtrend,youmusthedgelessfrequentlyandacceptahigheruncertainty of hedging costs in exchange for expected hedging costs beinginfluencedbythelonger-termcorrelation.Many people find this conclusion highly nonintuitive.Consider an example.
SupposeyouarehedgingthecounterpartycreditriskonanFXforwardandthatover the life of the forward the exposure continues to grow while the creditratingofthecounterpartycontinuouslydeteriorates,buttheindividualmovesareuncorrelated.Astheexposuregrows,youaregoingtohavetobuymorecreditprotection,anditmaybehard tobelieve thatyouwillnothavetopayfor thisincreased credit protection at the higher price levels brought on by thedeterioratingcreditrating.To help see how thisworksmechanically, I have provided theCrossHedge
spreadsheet, which enables you to enter a price history of six prices for each

assetandwhichlooksatthehedgingofanexoticpayingtheproductofthetwoasset prices. The spreadsheet shows the hedging and its costs under twoassumptions: if the price moves between the two assets are completelyuncorrelated and if the price moves between the two assets are perfectlycorrelated.Thecompletelackofcorrelationisimplementedbyhavingeachpricemoveonthefirstassetprecedeintimeeachpricemoveonthesecondasset,sothere is time to change the hedge quantity before the second asset's pricechanges.(Rememberthatforapayofftiedtotheproductoftwoassetprices,achange in thepriceofoneasset requiresachange in thehedgequantityof theother asset.) Perfect correlation is implemented by simultaneous changes inprices.Table12.14showsthecaseofdeterioratingcreditoncounterpartycreditrisk.
Thefirstassetistheexposureamountandthesecondassetisthediscountonthecounterparty'sbonds.Ascreditdeteriorates,thediscountgoesallthewayto100percent, corresponding to theworst possible case of defaultwith no recovery.Despite the fact that the exposure is steadily growing while the discount issteadilyincreasing,thechangeinthevalueoftheproductiscompletelyhedgedintheuncorrelatedcase.Examiningtheimpactoftheindividualhedgesshouldimpartabettersenseofhowthehedgeworks—eachchangeincreditqualityandexposurehasbeenhedgedbyhavingtherightsizehedgeinplaceatthetimeofthechange.TABLE12.14CrossHedgeofDeterioratingCreditonaGrowingCounterpartyExposure
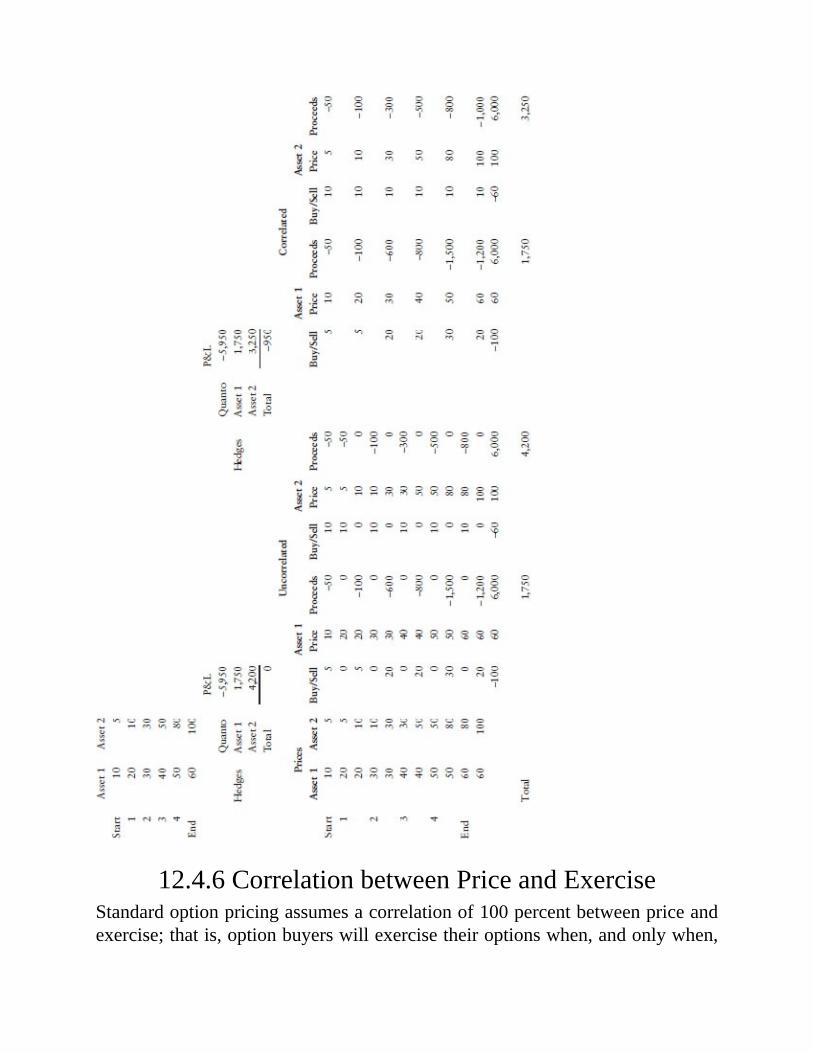
12.4.6CorrelationbetweenPriceandExerciseStandardoptionpricingassumesacorrelationof100percentbetweenpriceandexercise;thatis,optionbuyerswillexercisetheiroptionswhen,andonlywhen,

the price of the underlying asset makes it profitable to exercise. However, insome instances, it can be argued that a correlation of less than 100 percentshould be assumed. These arguments rely on a combination of historicalexperience, showing thatapreviouscorrelationhasbeen less thanperfect,andon a behavioral analysis of the option buyers, demonstrating that they havemotivationsthatconflictwithoptimaloptionexercise.Intermsofgametheory,standard option analysis, which assumes a correlation of 100 percent, isequivalent to a zero-sum game inwhich a loss by the option seller is exactlyoffset by a gain for the option buyer. A correlation of less than 100 percentcorrespondstoanon-zero-sumgame.Table12.15showstheimpactofdifferentcorrelationassumptions,multiplying
thepayoffbasedonpriceandexercisebytheprobabilityandsummingtogetanexpectedreturn.TABLE12.15CorrelationbetweenPriceandExercise
Forexample,itmaybearguedthatamunicipalitythathastheoptiontorequireearlyrepaymentofafixed-ratetermdepositwithoutpayinganypenalty,whichisequivalenttoaswaption,willonlyexercisethisoptioninresponsetoachangein its cash needs,which are uncorrelatedwith interest rate levels. Support forthis analysis should certainly include historical studies of how similarmunicipalities have exercised these options. However, even reasonableexplanationsofbehaviorandhistoricalprecedentmaybequestionableevidence.Intheabsenceofanyactuallegalconstraintorinternalcoststhatexercisewould

entail, it is possible that institutions will become more efficient exercisers ofoptions over time, as they gain financial sophistication or as large economicmovements (forexample,unusuallyhigh interest ratesonnewdeposits)createincreasedincentivestofocusattention.Such arguments may become more plausible when the option must be
exercisedbyalargegroupofindividuals.Correlationnowbecomesaquestionofwhat proportion of a populationwill exercise options in a timely fashion, andtheirdiversityofcircumstanceswill argue for less thanperfectcorrelation.Anexamplewould be a pension plan that guarantees someminimum return on aparticular investment strategy. If option exercise were a zero-sum game, theindividualinvestorswouldwithdrawfromtheplanwhenevertheinvestmentwasbelowtheminimumreturninordertocollecttheguarantee.However,financialinstitutions that provide these guarantees value them based on behavioralassumptionsabouttheindividualparticipants,whosevariedcircumstanceswithregard to age, career, and tax status make the cost of exercising the optiondifferentforeachsubgroup.Animportantexampleofanoptionexercisedbyalargegroupofindividualsis
theverysizablemarketinasset-backedbonds,whereeachbondisbackedbyapoolofmortgages, automobile loans,orother consumer loans.Although theseassetsoftenprovideconsumersthelegalrighttoprepaytheloanwithoutpenalty,individual circumstances often get in the way of an economically efficientexerciseofthisright.First,refinancingaloanofteninvolvessubstantialpersonalcosts (for example, legal fees, title searches, and the time devoted to thetransaction). For an institution on a large loan, these would probably beinsignificant relative to gains from exercise, but this may not be true for anindividual. Second, some consumers may not be able to refinance due to adeteriorating credit rating or decrease in asset value. Others may have strongpersonalmotivesthatoutweighthecostsoffinancing,suchasarequiredmoveor a divorce forcing a home sale that causes a desirable rate mortgage to beprepaidorthedesiretotradeacarforanewermodel.Given the enormous size of this asset class and the plausibility of less than
perfect correlations, financial firms have invested and continue to invest largeamountsofmoneyinresearchtodevelopaccuratemodelsofthiscorrelation.AgoodintroductiontothisassetclassisDavidsonetal.(2003),withitsChapter9introducing themodeling issues involved.Forsomeassets,suchasautomobileloans, the general conclusion is that correlation tends to be close to zero. Formortgages, correlation is definitely strongly positive; falling mortgage rates

triggermassiverefinancings,andrisingmortgageratestriggerconsiderablyslowrefinancings.However,correlationiscertainlyfarfromperfect,andthestakesinproperly identifying which mortgage bonds represent good investments aresufficiently high to support detailed research trying to predict the relationshipbetween refinancing behavior and prevailing mortgage rates by populationsubcomponent, such as the geographic region or size of mortgage. Therelationshipsdevelopedareoftenquitecomplex.Thebehaviordependsnotjustoncurrentmortgage rates,but alsopastmortgage rates andyieldcurve shape.Consumers are found to be sensitive not only to the current refinancingadvantage,butalsotobeliefsastowhetherthatadvantagewillbegrowing,sincethe costs of refinancing are high enough to cause consumers to attempt tominimizethenumberoftimestheyrefinance.Anotherfactor,knownasburnout,indicates that a consumer population that has already experienced a period oflow rateswill show lower refinancing response (as a proportion ofmortgagesstilloutstanding)inasubsequentlowrateperiod.Thisispresumablyduetotheproportion of thosewho did not refinance the first timewho cannot afford torefinance.MonteCarlomodelsof thecorrelationareused toprojectconsumerbehaviorunderavarietyofpossible future interest ratemovements,andbondsarerankedonthebasisofoption-adjustedspread(OAS)—thespreadthebondisearningoveracomparable-maturityTreasuryafter taking intoaccount thecostoftherefinancingoptionbasedontheassumedcorrelation.Why does this spread remain?One reason is certainly that these correlation
relationshipsareonlyestimatesbasedonpastdatathatcouldprovetobewrong.Whenunanticipated shifts in consumerbehavioron refinancings areobserved,such as a prolonged period of very low rates resulting in greater consumereducation about refinancings, leading to refinancing levels that substantiallyexceedthosepredictedbymodelsbasedonpastdata,OAScanshowlargerapidincreases. To some extent, this will later reduce as Monte Carlo models areupdated to accommodate the new experience, but some OAS increase maypersist,reflectinganincreaseinuncertaintyovertheaccuracyofsuchmodels.
12.5CORRELATION-DEPENDENTINTERESTRATEOPTIONS
Throughout Chapter 11 on vanilla options and in Sections 12.1 and 12.2, wehavedealtwithoptionswhoseunderlyingcanberegardedasaforwardtoasetfuture date. As we discussed at the beginning of Chapter 11, all uncertainty

aboutdiscounting rates for thesemodelscanbecollapsed into thevolatilityofthe forward.However, someoptionshavepayoffs thatdependon forwards forseveraldifferentfuturedates(butwithallforwardsonthesamespotunderlying).TheprimaryexamplewouldbeanAmericanoptionthatgivestheoptionholderfreedom to determine the timing of payoff. More complex dependence ondifferentforwardscanbeseenintheproductsweexaminedinSection12.3,suchasbarrieroptions.Optionsthatdependonforwardsforseveraldifferentfuturedatescanusefully
be viewed as options on multiple underlyings with all relationships betweentheseforwardsbuiltintothecorrelationstructureassumedbetweentheforwards.Indeed, this is the approach to multifactor interest rate models that haspredominatedoverthepasttwodecadesintheformoftheHeath-Jarrow-Morton(HJM)models(seeHull2012,Section31.1)andtheLIBORmarketmodels,alsoknownasBrace-Gatarek-Musiela(BGM)models(seeHull2012,Section31.2).Shouldwethenjustviewtheseproductsasaparticularclassofoptionswith
multiple underlyings and consider their risk management issues as alreadyhavingbeendealtwithinSection12.4?Onereasonfornotavailingourselvesofthis convenient shortcut is that the large volumeof these options that activelytrade encourages extra effort to try to find a simpler structure and fastercomputation time for subsets of this product. Another reason is that thisrepresents theonlyclassofmultiassetoptionswheresomereasonable liquidityexistsinproductsthatrequirecorrelationinputstovalue,soitisworthstudyinghowmuch information on correlation can be extracted from observedmarketprices.Three levels ofmodels are essentially available, of increasingmathematical
and computational complexity. The simplest level includes the binomial andtrinomial tree models in which the relationship between different forwards istreatedasconstant.InSection12.5.1,weexamineriskmanagementusingthesemodelsandtheconditionsunderwhichmorecomplexmodelsarerequired.Thesecond level includes the single-factor interest rate models in which therelationship between different forwards is treated as stochastic. In Section12.5.2, we examine risk management using these models and the conditionsunderwhichthethirdleveloffull-blownmultifactorHJMorBGMmodelsarerequired. Finally, in Section 12.5.3, we look at how much correlationinformationcanbeextractedfromobservedmarketprices.
12.5.1ModelsinWhichtheRelationshipbetweenForwardsIsTreatedasConstant
Wehavealreadyencounteredbinomialand trinomial treemodels inwhich therelationshipbetweenforwardsistreatedasconstant—thelocalvolatilitymodelsdiscussed in Section 12.3.2. Recall that this section was devoted to optionswhose payoff depends on the underlying price of a single asset at severaldifferent times. Because values of the asset at several different times areinvolved,weneededtobeconcernedwithhedgingandvaluationdependingonseveral different forwards. However, the only way to avoid treating thesedifferentforwardsasmultipleassetsistoassumethataconstantrelationexistsbetween them. This is in effectwhat is done in the local volatilitymodels ofSection12.3.2,sincetheonlyvariablechangingonthetreeisthespotpriceofthe asset and all forward prices are derived based on fixed interest raterelationshipsbetweenforwardandspotprices.In this section, we study the simplest, most widely traded, and best-known
version of a product that depends on the underlying price of a single asset atseveral times—the American option. American options differ from Europeanoptionsbya singleadded feature: the rightof theoptionbuyer toexercise theoption at any time. A simple variant restricts the right to exercise to severalspecified timesandisvariouslyknownasasemi-European,semi-American,or(as a geographic middle ground between European and American)Bermudanoption.AmericanandBermudanoptionshavelongbeenvaluedusingbinomialtrees
(the Cox-Ross-Rubinstein model) and more recently using trinomial trees toallow for nonflat volatility surfaces. See Hull (2012, Chapter 12) for themathematicsofthebinomialtree.SeeClewlowandStrickland(1998,Chapter5)for the use of trinomial trees to incorporate the volatility surface. The keyassumption is that the relationship between the forwards remains fixed.Mosttypically, this is represented by a constant interest rate and forward drift (orconstant dividend rate,withdrift defined as the interest rate less the dividendrate). However, any constant set of relationships between forwards can beaccommodated with no increase in complexity or cost of computation, asdiscussedinHull(2012,Section20.5).Fourfactorsdrivethevalueofearlyexercise(allofthisdiscussionisforcalls
—wearecontinuingourconvention fromChapter11of treatingalloptionsascalls):

1.Price.Whenprices rise, it increases theprobabilityofprice levelshighenoughtowarrantearlyexercise,soearlyexercisevalueincreases.2.Volatility. Themore volatile the price, the greater the incentive not toexercise early in order to take advantage of the time value of the option.However,highvolatilitymeansagreaterpercentageofpricemoveswillbelarge enough to warrant early exercise. So the two impacts of highervolatilityruninoppositedirections.Inpractice,thesecondeffectisusuallylarger,andhighervolatilityincreasesearlyexercisevalue.3.Financingcost.Thehigherthenetcostoffundingthedeltahedgeoftheoption,thegreatertheincentivetoexerciseearly.However,ifnetfinancingcost is earning the option buyermoney on his delta hedge, it discouragesearlyexercise.Anequivalentwayofviewingthisisthroughthedriftoftheforward.Ifdrift ispositive,thisdecreasestheincentivetoexercisethecallearlysinceit islikelythecallwillbeworthmoreaftertheupwarddrift.Ifdriftisnegative,thisincreasestheincentivetoexercisethecallearlysinceitislikelythecallwillbeworthlessafterthedownwarddrift.4.Discount rate. Early exercise allows earlier receipt of option payoffs.This ismore valuable the higher the discount rate, so high discount ratesencourageearlyexercise.TheAmericanOption spreadsheet illustrates thecomputationofAmericanoptionvaluesusingaCox-Ross-Rubinsteinbinomialtree.Itfocusesonthecomputation of the early exercise value, defined as the excess value theAmericanoptionpossessesover thecorrespondingEuropeanoption.Table12.16showssomesampleresults.
TABLE12.16EarlyExerciseValuesandHedgesforAmericanOption

NotefromTable12.16 the relatively small impactofdiscount ratesonearlyexerciserelativetodrift.Sinceexchange-tradedAmericanoptionsarealloptionsonafixedforward,theyallhavezerodrift,soearlyexercisevalueisquitesmall.This explains the claimmade at the start of Chapter 11 that exchange-tradedAmericanoptionshavelittlevaluationdifferencefromEuropeanoptions.

Hedgescanbeestablishedfortheimpactontheearlyexercisevalueofallfourof these factors,as illustrated inTable12.16.Fordelta andvega,wecalculatethe ratio of American option delta and vega to the corresponding Europeanoptiondeltaandvega,enablingtheAmericantoberepresentedindeltareportsandprice-volmatricesforthecorrespondingEuropeanoption.Fordiscountanddrift, the sensitivity of the early exercise value to a 100 basis point shift iscalculatedandcanbeusedtoestablishahedge.Thisisacomparablesituationtovega hedging an option you are valuing using the Black-Scholes model—thetheorybehind themodel saysvolatility isconstant,butyouaregoing“outsidethemodel”tohedgeagainstvolatilityuncertainty.Herewearedeterminingtheearly exercise value using a model that says that discount rate and drift areconstant,butweareestablishingahedgeagainstanuncertaindiscountrateanddrift.Theliquidproxyfor theAmericanoptionwouldbeacombinationof thecorrespondingEuropeanoptionandtheextrahedgesneededfortheexposuretodiscount rate and drift. This can easily be converted into a Monte Carlosimulation of the differences in final payout between anAmerican option andthis liquid proxy, given a simulation of changes in the underlying price, thediscountrates,anddrift.Thecriticalassumptionwhencalculatingthesehedgesisthatdiscountrateand
drift risk canbe valued andhedged as variables independent of the spot pricerisk. Equivalently, the assumption is that the level of forward rates isuncorrelated with the shape of the forward rate curve. This assumption isreasonableformostequities,questionableforFXandcommodities(referbacktoourdiscussionofmeanreversioninSection11.3),andcertainlyfalseforinterestrateoptions, sincehigh correlationwill exist between the ratedetermining thepayoffandtheratesdeterminingthediscountanddrift.Is itpossible that the impactof thiscorrelationissmallenoughto ignorefor
practicalpurposes?Asshown inTable12.16,whendrift is positiveor zeroorwhen it isnot toonegative, the total sizeof theearlyexercisevalue isnot toolargesoanyimpactofcorrelationcanprobablybeignored.Whendriftisquitenegative,earlyexercisevaluebecomessignificantanditislikelythattheimpactof correlation between interest rates needs to be taken into account. To do sorequires some type of term structure model; the factors influencing choicesbetweenthesemodelsarediscussedinthenextsection.This isparticularly true foroptionsonbondsoron swaps,where thepull to
parcausesdrifttobeverynegative.Becausethedurationofabondorswapgetsshorter as time passes, the impact of interest rates on prices is continuously

declining.Soanoptionholderfacedwithanearlyexercisedecisionknowsthatthe current price premium is likely to diminish through time—if interest ratesdon'tmove further inher favor,current rate levelswill translate intoa smallerprice advantage in the future. This is true both for options that pay on risinginterest rates and those that payon falling interest rates, sincebothhighbondprices based on low interest rates and low bond prices based on high interestrates move in the direction of par if rates stay the same as time to maturitydiminishes.If any substantial reduction in the duration of an underlying bond or swap
occurs during the tenor of an option, this negative drift will require a termstructuremodel. If no substantial reduction in duration occurs over the optiontenor,thenaCox-Ross-Rubinsteinmodelwiththedurationheldconstantcanbeusedasareasonableapproximation.Aruleofthumbthatisoftenusedisthatthisapproximationissuitableaslongasthedurationoftheunderlyingatthestartoftheoption life is at least 10 times as great as the option tenor. So this rule ofthumbwould allow the use of a Cox-Ross-Rubinstein model for a six-monthoptionona10-yearbond,butwouldinsistonatermstructuremodelforaone-yearoptiononafive-yearbond.
12.5.2TermStructureModelsThemost liquid options products based on interest rates are caps, floors, andEuropeanswaptions.AEuropeanswaption isanoption toenter intoaswapatsomefixedfuturedateataratefixedat thetimeofenteringintotheoption.Aone-period swap is a forward rate agreement (FRA) and, by convention, anoptiononanFRAiscalledacapletifitisanoptiontoreceivefloatingandpayfixed(i.e.,itpaysoffwhenratesarehigh)andiscalledafloorletifitisanoptiontopay floating and receive fixed (i.e., it paysoffwhen rates are low).Marketpracticeistosellcapletsandfloorletsinbundles,calledstrips,whicharecalledcapsandfloors,respectively(soaswaptionisanoptiononabundleofFRAs,aswap,andacaporfloorisabundleofoptionsonFRAs).Forexample,afive-yearcaponthree-monthLIBORwouldconsistofastripofnineteenoptionsonthree-month FRAs that have starting dates beginning at times starting threemonths from now and ending four years and nine months from now.Marketconventionwillquoteasinglevolatilityforacaporfloor,whichisthenappliedtoeachoftheconstituentFRAoptions—butthisisjustaconventiontomakeiteasytocommunicate.Actualpricingofacaporfloorevaluateseachindividual

FRAoptionattheappropriatevolatility,sumstheresultingpricestoarriveatthepriceofthecaporfloorandthensolvesforasinglevolatility,which,appliedtoeachindividualFRAoption,wouldresultinthissummedprice.AEuropeanswaptiononaoneperiodswapisidenticaltoacapletorfloorlet.
In our discussion of term structuremodels, themodels used to price complexinterest rate products, in both this section and in Section 12.5.3, we will forconvenience sometimes refer to all of the liquid instruments being used forcalibrationofthemodelsasswaptions,eventhoughthosewhichareoptionsonindividualFRAsaremoreaccuratelycalledcapletsorfloorlets.Broadly speaking, termstructuremodels come in twovarieties: single-factor
modelsthatassumethatthecorrelationbetweenallforwardsis100percentandmultifactormodelsthatcanaccommodatelessthanperfectcorrelationstructures.Both types of model can handle a correlation between the underlying of theoption and drift. Multifactor models are obviously more accurate, but add aconsiderable cost in computation time and complexity. Since American andBermudanoptionsonswapsandbondsarebyfarthemostutilizedexoticintheinterestrateoptionsmarket,thereisastrongincentivetotrytousesingle-factormodelsforthisproductaslongasaccuracyisreasonable.A critical fact about interest rate options, which any term structure model
needs to deal with, is that options of the same tenor for bonds (or swaps) ofdifferent maturities tend to have lower interest rate volatilities for the longmaturity.Thiscanbeconfirmedbothbyobservationsofimpliedvolatilitiesfrommarket quotes and from historical volatility observations of par bond or swapyields. (For example,Table12.17 showsannualizedvolatilitiesby tenorbasedon six years of dollar par swap yields between 1996 and 2001—see theDataMetricsRatesDataspreadsheetfortheunderlyingdata.)TABLE12.17AnnualizedVolatilityofDollarParSwapYields
Broadly speaking, this fact can be explained by some combination of thefollowingtwotheses:
1.Forwardratesarelessthanperfectlycorrelatedwithoneanotherandthelonger the bond maturity, the more its volatility is dependent on the

correlationbetweenforwards.2.Longer-termforwardshavelowervolatilitythanshorter-termforwards.Thelattertheoryimpliesthatinterestratesaremeanreverting,sinceitrequires
thestandarddeviationoflonger-termforwardstobelowerthanthatproducedbyapurerandomwalkdrivenbythevolatilityofshorter-termforwards.Toseetheinteractionbetweenthecorrelationandvolatilityoflonger-termforwardswhenexplainingswaptionvolatility,refertoSection12.5.3.Because it assumes that all correlation between forwards is 100 percent, a
single-factor model must utilize the lower volatility of long-term forwards todrivetheobservedvolatilitystructureofswaptions.Towhatextentdoesforcingoneofthesetwoleverstobearalloftheexplanatoryweightdistortvaluationandhedging? In principle, to answer this question, build the bestmultifactor termstructuremodel you can; calibrate both thismultifactormodel and the single-factormodelthatisproposedforproductionusetothecurrentsetofvanillacap,floor, andEuropean swaptionprices; and thencompare theiroutput invaluingexoticproducts.Althoughthisistoodauntingacomputationaltasktoattempthere,Iwillgive
aflavorofwhatthisanalysisislikeforoneverysimplecase:athree-yeartimehorizon;threeliquidvanillaproducts—aone-yearcapletonaone-yearLIBOR,atwo-yearcapletonaone-yearLIBOR,andaone-yearswaptiononatwo-yearswap;andaflatimpliedvolatilitysurfacewithrespecttostrike.Wewillassumethe two-year swap is on a one-year LIBOR. We will take advantage of theequivalencebetweenswapsandpackagesofforwardrateagreements(FRAs),asnoted inSection10.1.6.Thenotationwewillemploy is to labelaFRAby thetime atwhich its rate is determined and the time atwhich it settles. So a 2–3FRAhasaratedeterminedattheendoftwoyearsbasedonwhatwouldthenbetheone-yearrate.Themodelwillbecalibratedtothecurrentone-yearLIBOR,1–2FRAand2–3
FRA,theone-yearvolatilityofthe1–2FRA,thefirst-yearvolatilityofthe2–3FRA, the second-year volatility of the 2–3 FRA, and the one-year correlationbetweenthe1–2FRAandthe2–3FRA.Inadditiontovaluingtheliquidvanillaproducts,wewillvaluefourexotics:
1.Atwo-yearBermudanswaptionthatcanbeexercisedeitherattheendofyear1basedonthethenprevailingtwo-yearLIBORorattheendofyear2basedonthethenprevailingone-yearLIBOR.2.Atwo-yearcapletonaone-yearLIBORthatcanknockoutdependingon
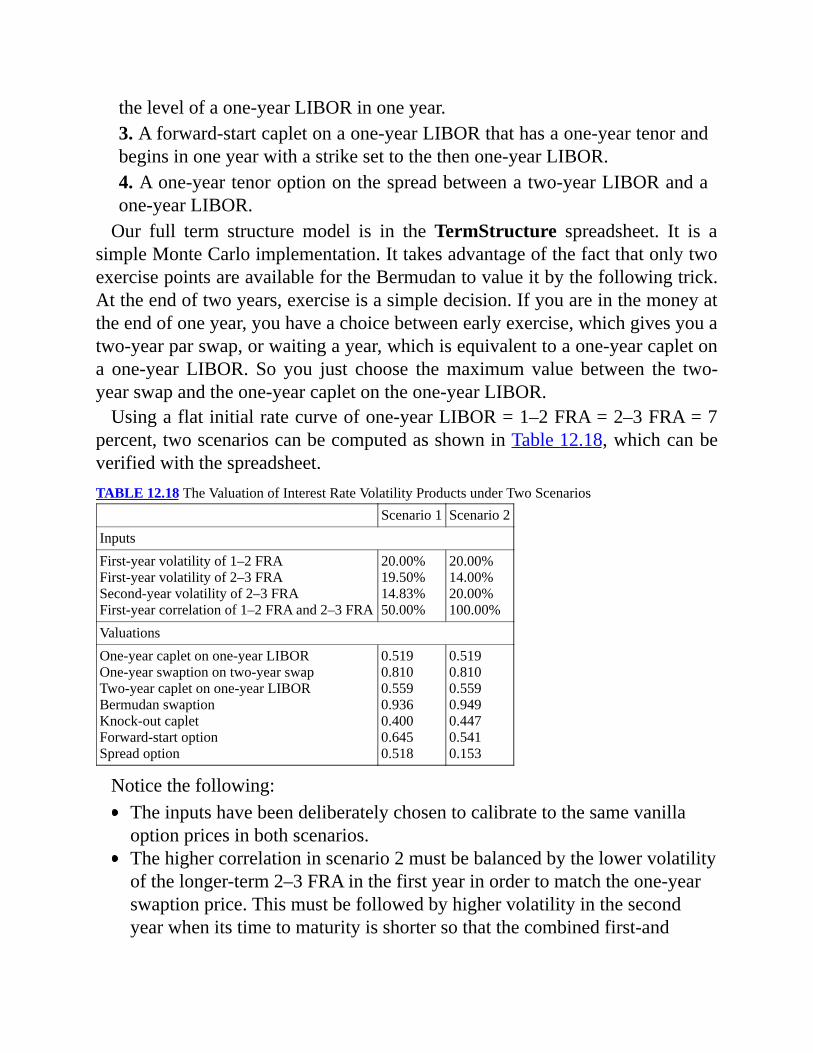
thelevelofaone-yearLIBORinoneyear.3.Aforward-startcapletonaone-yearLIBORthathasaone-yeartenorandbeginsinoneyearwithastrikesettothethenone-yearLIBOR.4.Aone-yeartenoroptiononthespreadbetweenatwo-yearLIBORandaone-yearLIBOR.Our full term structure model is in theTermStructure spreadsheet. It is a
simpleMonteCarloimplementation.IttakesadvantageofthefactthatonlytwoexercisepointsareavailablefortheBermudantovalueitbythefollowingtrick.Attheendoftwoyears,exerciseisasimpledecision.Ifyouareinthemoneyattheendofoneyear,youhaveachoicebetweenearlyexercise,whichgivesyouatwo-yearparswap,orwaitingayear,whichisequivalenttoaone-yearcapletona one-year LIBOR. So you just choose themaximumvalue between the two-yearswapandtheone-yearcapletontheone-yearLIBOR.Usingaflatinitialratecurveofone-yearLIBOR=1–2FRA=2–3FRA=7
percent,twoscenarioscanbecomputedasshowninTable12.18,whichcanbeverifiedwiththespreadsheet.TABLE12.18TheValuationofInterestRateVolatilityProductsunderTwoScenarios
Scenario1 Scenario2InputsFirst-yearvolatilityof1–2FRAFirst-yearvolatilityof2–3FRASecond-yearvolatilityof2–3FRAFirst-yearcorrelationof1–2FRAand2–3FRA
20.00%19.50%14.83%50.00%
20.00%14.00%20.00%100.00%
ValuationsOne-yearcapletonone-yearLIBOROne-yearswaptionontwo-yearswapTwo-yearcapletonone-yearLIBORBermudanswaptionKnock-outcapletForward-startoptionSpreadoption
0.5190.8100.5590.9360.4000.6450.518
0.5190.8100.5590.9490.4470.5410.153
Noticethefollowing:Theinputshavebeendeliberatelychosentocalibratetothesamevanillaoptionpricesinbothscenarios.Thehighercorrelationinscenario2mustbebalancedbythelowervolatilityofthelonger-term2–3FRAinthefirstyearinordertomatchtheone-yearswaptionprice.Thismustbefollowedbyhighervolatilityinthesecondyearwhenitstimetomaturityisshortersothatthecombinedfirst-and
second-yearvolatilitiesfitthepriceofthetwo-yearcaplet.Despiteaverylargedifferenceincorrelationsbetweenthetwoscenarios,theBermudanswaptionvaluesclosetoequalinbothscenarios.Thisreflectsatrade-offbetweenlowervolatilityofthe2–3FRAinthefirstyear,whichdecreasesthevalueofearlyexercise,andhighervolatilityofthe2–3FRAinthesecondyear,whichincreasesthevalueoftheoptioninthosecasesinwhichearlyexercisedoesnotoccur.Theknock-outcapletalsoshowsvaluesclosetoequalinbothscenarios.Lowercorrelationincreasesthechancesthatahigh2–3FRA,whichleadstoahighercapletvalue,willbeaccompaniedbya1–2FRAthatislowenoughthatthecapletwillnotknockout.Thisleadstoahighercapletvaluebutisoffsetbythelowersecond-yearvolatilitythataccompaniesthelowercorrelation.Lowercorrelationcausestheforward-startoptiontohaveahighervaluebyaddingvolatilityintherelationbetweenthestrikeandforwardtothevolatilityoftheforward.Thelargestdifferencebetweenthetwoscenariovaluationsisforthespreadoption,whichistheproductmostdirectlytiedtoyieldcurveshaperatherthanlevel.Itvaluesmuchhigherwhenlowercorrelationpermitsgreatervariabilityinshape.
This single case is consistent with the intuition ofmost practitioners in theinterestrateoptionsmarket.ForBermudanswaptions,aone-factormodelcanbecalibratedtocurrentvanillapricesandgivereasonableresults,butasyoumovetowardproductsthataremoredependentonthefutureshapeoftheyieldcurve,multifactormodelsbecomemoreofanecessity.Althoughthisdemonstrationfora two-period case is far from conclusive for longer-term swaptions, seeAndersen and Andreasen (2001) for similar conclusions in a more generalsetting.Thisspreadsheetcanbeuseful forgaining intuitionabout thedirectionand order of magnitude of correlation assumptions on different interest rateexotics.When multifactor models are utilized, traditionally the primary choice has
beenbetweenmodels that assumeanormaldistributionof the short-term rate,such as Hull-White, and models that assume a lognormal distribution of theshort-termrate,suchasBlack-Derman-ToyorBlack-Karasinski.SeeHull(2012,Section 30.3) and Rebonato (1998, Chapters 12 and 13) for an exposition ofthesemodels.The discussion on which of these approaches to use has often centered on
whetheronebelievesthatnormalorlognormaldistributionsofratesgiveclosercorrespondencetohistoricalexperience.Thislineofargumentisgettingtoseemratherdated in lightof thealmostuniversal adoptionof fullvolatility surfacesthataccommodatemixturesofnormalandlognormalassumptionsinequity,FX,and commodity options models (see Section 11.6.2). As we discussed withbarrieroptionsinSection12.3.1,notgettingtheshapeof theimpliedvolatilitysurfacecorrectcanresultinmajorerrorsinthevaluationofexotics.Bermudansshareakeycharacteristicofbarriers in that thestrike level thatdetermines theterminationoftheoptioncanbedifferentthanthestrikelevelthatdeterminesthevalueoftheoption,makingthecorrectfittingoftherelativevolatilitybetweenthese two strike levels an important determinant of valuation.Amoremodernapproach toutilizing the full impliedvolatility surfacewhencreatinga single-factorinterestrateoptionsmodelcanbefoundinKhuong-Huu(1999).Other factors that go into the choice and accuracy of a single-factor model
include:TheHull-Whitemodeloffersastrongcomputationaladvantageinthattheforwardvalueofabondorswapcanbecomputedbyanalyticformulaforanynodeofthetree(seeHull2012,Section30.3).Bycontrast,lognormalmodelsoftheshortratemustextendthetreeallthewayouttothematurityofthebondorswapandsolvebackwardsonthetreetodetermineaforwardvalue.Itispossibleforinterestratestobecomenegativeinsomeportionofthetreeinnormalmodelsoftheshortrate.Ifyoubelievethisiseconomicallyunrealistic(referbacktothediscussioninSection10.3.2),thenyouwouldwanttogetestimatesofthedegreeofimpactthiscouldhaveonvaluationsandhedges;seeRebonato(1998,Section13.9)forabalanceddiscussionofthisissueandotherstrongandweakpointsoftheHull-Whitemodel.Thelimitationofhavingjustasinglefactortocalibratewithleadstoconflictsbetweenthedesiretocorrectlyfitobservedpricesofpotentialhedginginstrumentsandthedesiretoavoidunrealisticevolutionsoftheratecurve;seeRebonato(1998,Sections12.5and13.9)foranextendeddiscussion.Black-Derman-Toyisabinomialtreemodel,incontrasttothetrinomialtreemodelsofHull-WhiteandBlack-Karasinski,andisfareasiertoimplementandmaintainthanthetrinomialtreemodels.Thepricepaidforthisconvenienceisthatthespeedofmeanreversionisdeterminedandcannotbesetasaninputparameter.Overcomingthisweaknesswastheprimary

motivationfortheintroductionofBlack-Karasinski(seeHull2012,Section30.3).Asaresult,Black-Derman-Toycanonlycalibratetoalimitedsubsetofvanillaoptionsonanygivenrun.Forinstance,inourtwo-periodexample,itcouldonlycalibratetotheone-yearswaptiononatwo-yearswapandthetwo-yearcaplet,butnottotheone-yearcaplet.Thiscouldpotentiallyreducethenumberofpossiblehedginginstrumentsthathavebeencorrectlypricedbythemodel;seeRebonato(1998,12.5)forfurtherdiscussion.Allofthesingle-factormodelssharetheissuethatshiftsinratelevelswillcauseshiftsinthepackageofvanillaoptionsthatformagoodhedgeforanAmericanorBermudanoption.Table12.19showsanillustrativeexample.Thistableisbasedona10-yearannuallyexercisableBermudancalloptionona10-yearswapwithacouponrateof7percentandflatvolatilitysurfaceat20percent.Asshouldbeexpected,fallingratesincreasethevalueofthecall,makingearlyexercisemorelikelyandthusincreasingtheimpactofearlyvolatilityrelativetolatervolatility.Risingratesdecreasethevalueofthecall,makingearlyexerciselesslikelyandthusincreasingtheimpactoflatevolatilityrelativetoearliervolatility.ItistheneasytosolveforasetofEuropeanoptionswithsimilarexposuretotheforwardvolatilitycurve.However,apackageofvanillaoptionsthatmatchesthedistributionofexposureatoneratelevelwillnolongermatchtheexposureatadifferentratelevel.
TABLE12.19ImpactofRateLevelsontheForwardVolatilityCurveDependenceofaSwaption
Rebonato(2002),particularlyChapters8,9,and10,isanexcellentsourceofdetailed examples and exposition regarding the subtleties of calibrating termstructure models to market prices of caps, floors, and European swaptions.Rebonato'sdiscussionoftermstructuremodelsisverymuchconsistentwiththe

conclusionsofGatheral(2006)regardingdynamichedgingmodelsdiscussedinSection12.3.2—modelsthatcorrectlypricealloftheliquidinstrumentscanstilldiffer substantially in how the volatility surface evolves. And differences involatilitysurfacedynamicscan translate intosubstantialdifferences in thecostofhedginganexoticinstrumentwithmoreliquidinstruments.LookingbackoncemoretoSection8.4,theriskmanagementapproachtothis
should be Monte Carlo simulation of the P&L resulting from following ahedging strategy implied by a particular model, as recommended by Derman(2001). Once again, the difficulty is the computational burden of needing tocompute required rehedging along all the differentMonteCarlo paths. In thiscase, Idon'thaveastaticorquasistatichedgingalternative tooffer that Ihaveactually had experience with. A suggested approach would be, to take aBermudanswaptionasanexample,tostartwithaliquidproxyofapackageofvanillaswaptionsasinTable12.19,basedoncurrentratelevels.TheideawouldbetoholdthispackagefixedasyougoforwardontheMonteCarlopath.Thisapproachrunsintotwoproblems.ThefirstisthatsomeoftheEuropean
options will reach expiry and deliver a payoff, leaving the Bermudan optiondecidedlyunderhedged.Perhapsasimplerulecouldbefollowed,suchaseverytime a European swaption reaches expiry, bring the package of Europeanswaptions back up to 100 percent of the Bermudan swaption by buying newEuropean swaptions in the same proportion as the remaining Europeanswaptionsintheoriginalpackage.Thesecondproblemishowtodecidewhenoneach path Bermudan options should be exercised without needing repeatedrerunsof thetermstructuremodel.Oneapproachcouldbetousesomeruleofthumb to govern exercise. Another approachwould be to assume exercise oneach pathwill take place at the time that, looking back at the path from finalexpiry,wouldbetheleastfavorabletothetradingdesk.
12.5.3RelationshipbetweenSwaptionandCapPricesSince a European option on a swap or bond can be a reasonably liquidinstrument,andsincewecanviewitasequivalentforvaluationpurposestoanoptionon thebasketsofFRAs,which theswap isequivalent to,wecan try toextract information onmarket-implied correlations between FRAs from liquidprices.Howmuchcorrelationinformationcanweextract?Notthatmuch,unlesswearewillingtomakesomeadditionalassumptions.To seewhy, let's startbyconsideringa simplifiedmarket inwhichonly two

FRAstradea1–2yearanda2–3year.Thenaturaloptionswouldbeaone-yearcaplet on the 1–2 year, a two-year caplet on the 2–3 year, and a one-yearswaption on the combination of 1–2 year and 2–3 year. To price these threeoptions,weneedinputsforthefollowingunderlyingvariables:thevolatilityofthe 1–2yearFRA in year 1, the volatility of the 2–3yearFRA in year 1, thecorrelationbetweenthesetwoFRAsinyear1,andthevolatilityofthe2–3yearFRA in year 2. Unfortunately, four underlying variables are present and onlythreeoptionsneedtobepriced.Soitwillnotbepossibletoextractacorrelationfromtheprices,aswehaveseenintheexampleoftheprevioussection,unlesswearewillingtoplacesometightrestrictionsonthepossiblestructureofFRAvolatilities.Whenwemove tomore realisticmarket assumptions, the situationdoes not
improve.TheSwaptionsspreadsheetcantakepriceinputsforone-yearLIBORcaplets from one to 10 years and all possible swaption prices involving anintegralnumberofyearslessthanorequalto10(forconvenience,thepricesarequoted as the equivalent Black-Scholes implied volatility). Based on anassumptionas tocorrelationstructure, thespreadsheetusestheExcelSolver tofind a structure of underlying FRA volatilities that explains the prices. Fromyourexperimentationwiththespreadsheet(seeExercise12.10),youcanconfirmthatawiderangeofdifferentcorrelationassumptionsisconsistentwithasingleset ofprices.Wehave assumedzerovolatility skewand smile throughout thisdiscussion,butchangingthisassumptionwillnotimprovethesituation.It is possible to come to conclusions about the probability of different
underlying FRA volatility structures based on historical observation, and thismay result in constraints that would at least give a tight range of possiblemarket-implied correlations. For example, one proposal that has both intuitiveappealandsomeempiricalsupportistoassumethatthevolatilityofFRAsisafunctionofhowfartheyarefrommaturity.Sothevolatilityofa2–3yearFRAinitssecondyear,whenitisinthefinalyearofitslife,shouldbethesameasthefirst-yearvolatilityofa1–2yearFRAandthethird-yearvolatilityofa3–4yearFRA. The intuition behind this assumption is that new information has itsgreatest impactonnearbyborrowing rates, sowe should expect to seegreatervolatility innearby ratesand lowervolatilityasyougo fartherout inmaturity(this is equivalent to assumingmean reversion of interest rates, aswe saw inSection12.5.2).Soifthecapletvolatilityinthemarketfora1–2yearFRAis23percent,butis22percentfora2–3yearFRA,itisreasonabletoassumethatthis22percentcanbedecomposedintoa21percentvolatilityinthefirstyear,when
theFRAstillhasoverayeartogo,anda23percentvolatilityinthesecondandlastyear.This assumption is powerful enough to enable all FRA correlations to be
derivedfromswaptionprices.Toseethis,considerthatifyouhaveNdifferentFRAsforwhichyouprovidevolatilityassumptions,thiscanprovidepricingfor
different swaptions (N in period 1,N – 1 in period 2,and so on —
. The total number of correlations that can be specified between
FRAsis sincetheNcorrelationsofaFRAwithitselfmustbe100percentand a correlation between FRAi and FRAjmust equal the correlation betweenFRAjandFRAi.IfyouspecifythatFRAvolatilityiscompletelydeterminedbytimetomaturity,itreducesthenumberofvolatilitiesthatcanbespecifiedtoN.The total of specified volatilities plus specified correlations is then
Soifall swaptionpricesarespecified,auniquesetofFRAvolatilitiesandcorrelationsthatcanexplainthemmustexist.However, it is possible that placing severe constraints on the relationship
betweendifferentFRAvolatilitieswillnotleaveenoughfreedomtofindimpliedcorrelations that fitmarket swaption prices. It can also be the case that capletvolatilitiesdeclinetoosteeplywithtimetobeconsistentwiththeassumptionofFRAvolatilitybeingafunctiononlyoftimetomaturity;comparethiswiththediscussioninRebonato(1998,Section4.5).Rebonato(2002,Section9.1.3)makesacasethatswaptionsvolatilitiestendto
be persistently higher than caplet volatilities due to supply and demandconsiderations. This is due to consistently high demand from corporateborrowersforcapprotectionofborrowingcosts,whileissuersofputtablebondsandbuyersofcallablebondsarewillingtoselltheoptionstheyownforafixedupfrontprice,creatingasupplyofswaptionprotection. InSection9.1.3,alongwith Sections 1.2 and 6.1.2, Rebonato warns against trying to fit models ofexotic interest rate products to both caplet and swaption volatilities, since thedifferenceinvolatilitylevelsduetotheimbalanceofsupplyanddemandfactorsmayresultinunrealisticimplicationsfortheevolutionofvolatilities,whichmayinturnleadtofuturetradinglosses.ThispointisroughlysimilartoonemadeinSection10.2.1ofthisbook,theneedtoaccountforthetrade-offbetweenbasisriskandliquidityriskinconsideringthedegreetowhichanexactfittomarketprices should be attempted in a model designed to infer prices of illiquid
instrumentsfrommoreliquidinstrumentprices.
Exercises
12.1UsingtheBasketHedgeSpreadsheet1.Foraflatvolatilityassumption(thatis,smile=0andskew=0),checkthecalculationofthesquarerootoptionintheMainworksheetagainstanotherpricingmethod.Themethodcouldbeanalytic (that is, based on solving a PDE), useMonteCarlo simulation, or use a binomial ortrinomial tree. Whatever method you choose, make sure you check its accuracy by pricingordinaryoptionsandcomparingtheanswerstotheBlack-Scholesformula.2.Pickanothertypeofnonlinearpayoff.ChangeColumnCintheMainworksheettocalculateahedge and pricing. Check the results for a flat volatility assumption against another pricingmethod,asinpart1ofthisexercise.3.Checktheimpactofsmileandskewonthepricingofeachofthefollowing:
a.Thesquarerootoption.b.Theoptionyoupricedinpart2ofthisexercise.c.Thesingle-assetquantopricedintheQuantoworksheet.d.ThelogcontractpricedintheLogworksheet.e.TheconvexityriskhedgepricedintheConvexityworksheet.f.Thecall-on-a-calloptionpricedintheCompoundworksheet.
4.ChangeColumnCintheCompoundworksheettoprice:a.Aput-on-a-callcompoundoption.b.Acall-on-a-putcompoundoption.c.Achooseroptionthatasofthefirstexpirytime(B1)turnsintowhicheverismorevaluablebetweenacallandaputpricedatthesamestrike(B5)toasecondexpirytime(B4)(seeHull2012,Section25.7).
5. For a call-on-a-call option and all three of the options in part 4 of this exercise, usetheCompoundworksheettodeterminehowmuchsensitivityremainstofutureimpliedvolatilityafterexposuretothepricelevelhasbeenhedged.
12.2UsingtheBinaryMCSpreadsheetAssumeyouarelongonebinaryoptionandshortasecondbinaryoptionofthesamesize.Createasetofexamplestoshowthatthereisalowerprobabilityofloss:a.Thecloserthetwobinaryoptionsareinmaturitydate.b.Thecloserthetwobinaryoptionsareinstrike.c.Thegreaterthecorrelationintheunderlyinginstrumentsofthetwobinaryoptions.
Alsoshowthatthevariabilityofresultscanbereducedbynarrowingthespreadbetweenthecalloptionsusedasliquidproxiesforthebinaryoptions.
12.3UsingtheCarrBarrierSpreadsheetUsingthesamepricestrike,upbarrier,downbarrier,andoriginaltimetoexpiryastheoneusedin

Table12.7,performthefollowing:1.TestthevalidityoftheclaimthatunwindP&Liszerowheneverdriftandskewatunwindarezero.Trydifferentcombinationsoftimetoexpiry,at-the-moneyvolatility,smile,andrateatthetimethebarrierishit.Alsotrydifferentcombinationsofdriftandskewatthetimetheoptionisoriginated.2.WhatconclusionscanyoudrawaboutthepatternofdependenceofunwindP&Londifferentvaluesofdrift?3.WhatconclusionscanyoudrawaboutthepatternofdependenceofunwindP&Londifferentvaluesofskew?
12.4UsingtheCarrBarrierMCSpreadsheetCreateasetofexamplestoshowthesensitivityoflossprobabilitytochangesinthestandarddeviationofskewandthestandarddeviationofdrift.
12.5UsingtheOptBarrierSpreadsheetTakeadown-and-outcallcasethatyouhaveanalyzedusingCarrBarrierandanalyzeitusingOptBarrier.Usetheoptimizationcriterionof100percentofthemaximumabsoluteerror:1.FirstuseOptBarrierwithfourpossibletimesandfourpossibleat-the-moneyvolatilities,butonlyonepossiblesmile,skew,anddrift—smile,skew,anddriftareallsettozero.ConfirmthatthevaluesyouderivefortheoptionpriceareclosetothosethatCarrBarrierderived.2.Changeskewtoasinglevalueof10percentandseewhatoptionvaluesresult.3.Changedrifttoasinglevalueof–3percentandseewhatoptionvaluesresult.4. Change skew to have two values—one 0 and one 10 percent—and seewhat option valuesresultandwhattheresultingdegreeofuncertaintyofcloseoutcostis.ComparethisuncertaintyofforwardcosttothatoftheCarrBarrierforthesamelevelofskewanddrift.5.Changedrifttohavetwovalues—one0andone–3percent—seewhatoptionvaluesresultandwhattheresultingdegreeofuncertaintyofcloseoutcostis.ComparethisuncertaintyofforwardcosttothatoftheCarrBarrierforthesamelevelofskewanddrift.
12.6UsingtheDermanErgenerKaniSpreadsheet1. Use the spreadsheet to check the results given in Table 12.6. Then examine the impact onunwindP&LofdeviationsbetweentheassumptionsaboutunwindconditionsinC8:C12andtheactualunwindconditionsinC17:C21.Createatabletoshowtheimpactofchangesinrate,drift,smile,andskew.2.VerifythatanychangesmadeininitialconditionsinB8:B12willonlychangetheinitialpriceofsettingupthehedgeandwillnothaveanyimpactonunwindP&L.
12.7UsingtheBasketOptionSpreadsheet1.CheckonthesensitivitiesshowninTable12.13.2.Create some examples to check that theGeneralCase and the 3AssetCase give the sameanswersforcaseswithjusttwoorthreeassets.3.Using theGeneralCase, tabulate therateofchange inbasecasevolatilityandsensitivity to

changes involatilityandcorrelationas thenumberofassets increases.Howdoes thisdifferatbasecorrelationratesof0,25,and50percent?
12.8UsingtheCrossHedgeSpreadsheetTrydifferentpricepathsforthetwoassetsandconfirmthattheyalwaysshowzeroP&Lfortheuncorrelatedcase.WhatpatternsdoyouobservefortheP&Linthecorrelatedcase?Forexample,whatdistinguishescasesthatleadtogainsfromcasesthatleadtolosses?Whatinfluencesthesizeofthegainsorlosses?
12.9UsingtheTermStructureSpreadsheet1. Reproduce the results in Table 12.18, whichwill verify that two different combinations ofvolatilityandcorrelationinputcanproducethesamevaluationsforvanillaproductsbutdifferentvaluationsforexoticproducts.2.Findothercombinationsofvolatilityandcorrelationinputsthatproducethesamevaluationsforthevanillaproductsanddeterminethesensitivityoftheexoticproductstotheseinputs.3.Create your own exotic product by specifying a different payout structure in column J anddetermine its sensitivity to different combinations of input volatility and correlation that leavevanillaproductpricingfixed.
12.10UsingtheSwaptionsSpreadsheetStartwithinputswaptionandFRAratesasfollows:
AllFRAratesat7.0percent.SwaptionvolatilitiesfromTable12.20.
Theseswaptionvolatilitiesdisplaytheusualpatternobservedinthemarketofdecliningasswaptenorincreases:1.Inputcorrelationsof90percentforallcombinationsandusetheSolvertofindasetofFRAvolatilitiesthatcorrespondtothiscase.2.Replaceallthe90percentcorrelationswith80percentcorrelationsandusetheSolvertofindasetofFRAvolatilitiesthatcorrespond.3.YounowhavetwodifferentsetsofFRAvolatilitiesthatcanexplainthesamesetofswaptionvolatilities—one based on higher correlation levels than the other. What are the patterns ofdifferenceyouseebetweenthesetwosetsofvolatilities,andhowwouldyouexplainthelinkagebetweenthesepatternsandthedifferenceincorrelationlevels?
TABLE12.20SwaptionVolatilitiesInputforExercise12.10

CHAPTER13
CreditRiskThefieldofcredit riskmanagementhasundergonemajor transformationsoverthepasttwodecades.Traditionalcommercialbanklenders,whosefocususedtobealmostexclusivelyontheanalysisofindividualborrowerswithasmalldoseof limits to avoid excessive concentration in a region or industry, haveincreasingly viewed overall portfolio management as a major part of theirfunction.Thishasopenedthedoortorapidgrowthintheuseofquantitativeriskmanagement techniques. At the same time, the introduction of an array ofvehiclesfortransferringcreditriskbetweencreditors—theincreaseduseofloansales,loansyndication,andshortsalesofbonds,alongwiththeintroductionofmany varieties of credit derivatives, asset-backed securities, and collateralizeddebtobligations(CDOs)—hasservedasatoolforportfoliomanagement.Overthesametimeperiod,manynewplayershavebecomeactiveparticipants
in credit risk markets. While there have always been nonbank investors incorporatebonds,suchasinsurancecompanies,pensionfunds,andmutualfunds,thevarietyofnewinstrumentsavailableforinvestorsincreditrisk—assetswaps,total return swaps, credit default swaps (CDSs), CDOs—has both introducednew investors, suchashedge funds,and increased theparticipationofexistinginvestors.Inlookingattheprinciplesguidingcreditriskmanagement,oneseesagenuine
dichotomy between the views of traditional commercial bank lenders and theviews of many nonbank investors. Investors who focus primarily on liquidcorporate bonds and CDSs view riskmanagement on these instruments as nodifferentfrommarketriskmanagementofequityorinterestratepositions—thegeneral principles of Section 6.1.1 would apply, with emphasis on stop-losslimits,liquidationofpositions,timelymarkingtomarket,anduseofvalueatrisk(VaR)andstress testingtoassessliquidationrisk.Traditionalcommercialbanklenders, withmany loans to creditors whose debt has little liquidity andwithlargepositionsof illiquid size to creditorswhosedebt doeshave liquidity, seelittlevalueinsuchshort-termviewsofriskandconcentrateinsteadonlong-term(multiyear)analysisofportfoliorisk.ThisdichotomyofviewsrelatesbacktothediscussioninSection1.2,withthe
credit riskofcommercialbank lenders looking likeactuarial risk, requiringan

approachmoreliketheonewe'veoutlinedinSections6.1.2and8.4.Caughtinthemiddleareinvestorswhohavehybridexposuretoliquidandilliquidnames—theyneedtouseamixtureofshort-termmarketriskmanagementtechniquesfor theirmore liquid risksand long-termportfolioanalysis for their less liquidnames.Amongtheplayerscaughtinthemiddlearemarketmakersinover-the-counterderivatives,whoalmost alwayshaveacustomermixof counterpartieswithbothliquidandilliquiddebt.Theapproachinthischapteristostartwiththeshort-termriskmanagementof
liquid positions in Section 13.1, then to turn to long-term portfolio riskmanagement in Section 13.3. In between, Section 13.2 looks at non-market-basedmethodsfor the internalanalysisofsingle-namecredit instruments.Thistopicis importantascritical input totheportfoliomodelsofSection13.3,asavital supplement to the techniques of Section 13.1 for names with good butlimited liquidity, andas a fundamental element in tradingmodels even for themost liquid names. Finally, Section 13.4 looks at the risk management ofmultinamecreditderivatives suchasCDS indexesandCDOs,which requireachallengingmixoftheportfoliomanagementtechniquesofSection13.3andthemore market-based approach of Section 13.1, a challenge that much of thefinancial industry badly failed in the 2008 crisis. The important topic of themanagementofcredit riskforderivativescounterparties isplacedinaseparatechapter,Chapter14,whichwilldrawheavilyontheconclusionsofthischapter.
13.1SHORT-TERMEXPOSURETOCHANGESINMARKETPRICES
Whendealingwith sufficiently liquid debt, credit instrument riskmanagementcanbedesignedtolookverysimilartointerestrateriskmanagement,butthereare some importantdifferences.Aswith interest rate riskmanagement,agoodpartof thechallenge iscomingupwithaunifyingprinciple forcombining therisks ofmany different types of instrumentswith awide variety of terms andconditions.Aswithinterestrateriskmanagement,thekeytoolwillbeafocusoncashflowsasaunifyingprinciple(referbacktothestartofSection10.2).Thisprincipledoesnotworkascleanly forcredit instrumentsas itdoes for interestrates,butwithsomemodificationitwillstillbeabletoserve.We will model our discussion in this section closely on our interest rate
discussion in Chapter 10. Section 13.1.1 looks at the variety of credit
instruments,Section13.1.2looksatthemathematicalmodelsforvaluingcreditinstruments,andSection13.1.3examinesthedesignofriskreports.
13.1.1CreditInstruments
13.1.1.1BondsandAssetSwapsThe market for corporate bonds has been around for a long time, and theseinstruments are generally well quoted for certain firms. It has always beenadvantageous for companies seeking capital to issue bonds, partly because ofresultingtaxadvantages,andalsonottodilutetheownershipinthecompanybyissuingtoomuchequity.Mostofthetime,corporatebondsarefixed-ratebonds,because this is what most investors in bonds prefer, even though manycompaniesprefer toborrowatafloatingrate,generally indexedto theLondonInterbankOfferedRate (LIBOR)(companieswishing toexchangefloating-ratepaymentstheywanttomakeforthefixed-ratepaymentsrequiredontheirbondsare a major source of demand for interest rate swaps). Most investors incorporatebondssharethefollowingthreecharacteristics:
1.Theyhavecashtoinvest.2.Theyarewillingtotakeoncreditrisk,becausetheyhaveafavorableviewofthecreditprospectsofaparticularfirmorsetoffirms.3. They arewilling to take on rate risk or have a longer-term investmenthorizonandsoviewlockingintolong-termratesdesirable.Someinvestorsareinterestedonlyinthefirsttwofeaturesbecausetheydon't
necessarilywant to takeapositionwithaviewon rate risk.This iswhyassetswapswerecreated.Anassetswapisacombinationofacorporatebondandaninterestrateswapcontractthatswapsthebond'scouponintoafloatingpayment.Sothepurchaserofanassetswapwillreceiveafixedspreadaspaymentsolongas thebonddoesnotdefault.But aneven largermarketdeveloped for apurerform of credit-linked instruments, the credit default swap (CDS), that isolatescreditriskwithouteitheroftheothertwoaspectsofcorporatebonds.
13.1.1.2CreditDefaultSwapsCreditdefaultswapswerecreatedinthe1990s.Theirdefinitionisverysimple.While there isnodefaulton theunderlying, theprotectionprovider receives afixed spreadpaymentona regularbasis (forexample, every sixmonths) from

theprotectionbuyer.Ifthereeverisadefaultduringthelifetimeofthecontract,theprotectionsellerwillpaytheprotectionbuyerthefullparvalueofthebond.Sincetheprotectionsellerwillthenonlybeabletorecoverthevalueofthebondlesslossgivendefault(LGD),thesellerwillhavealossequaltotheparvaluetimesthelossgivendefaultrate.Sotheprotectionsellerisinexactlythesamefinancialpositionasthebuyerofanassetswap,receivingfixedspreadpaymentsif there isnodefault, losing theparamount times the lossgivendefault rate ifthereisadefault.ACDSismeanttolooklikeanassetswap,butwithouttheneedtoinvestcash.
Whilethisfeaturemakesitveryattractivetosomeinvestorslookingtotakeoncredit risk, it is an evenmore important product for investorswith a negativeview of a firm's credit orwho are seeking protection against a firm's default.These investors previously could only achieve the position they desired bysellingshortacorporatebond.Butthemarketforborrowingcorporatebondsisextremely thin and expensive. The advent of the CDS, like any new forwardmarket, provides far greater liquidity to thosewishing to take short positions.(Youmightwonderwhyan investorseekingprotectionagainsta firm'sdefaultcouldnotjustselltheassetcausingthisexposure.Butnotallassetsexposinganinvestor to losseswhena firmdefaultsareaseasy tosellasacorporatebond.Somemaybedifficulttosell,suchasbankloansandextensionsoftradecredit;others may be impossible to sell, such as counterparty credit exposure onderivatives.) It also provides far greater liquidity for thosewishing to expressrelativevalueviewsthatonesetofcreditspreadswillwidenrelativetoanotherset.ThegrowthoftheCDSmarkethasbeenexplosive,growingatarateofabout
100percentperyearinmanyyears.ThemosttroublesomeissueinthecreationoftheCDSmarkethasbeendifficultiesindecidingonasettlementmechanismintheeventofdefault.First,sincepayoffbytheprotectionselleronlyoccursintheeventofadefault,exactdefinitionofadefaulteventmustbeagreedupon.Does defaultmean anydelay in a scheduledpayment of the borrower or onlyoneofaparticularmagnitude?Isaformaldeclarationofbankruptcyanecessity?What happens if the terms of the borrower's debt are voluntarily renegotiatedwithcreditors?(Andhowcanyoutellhowvoluntaryithasbeen?The2011and2012 experience with renegotiation of Greek government bonds has been aparticularly worrisome example; see the Economist article “Fingers on theTrigger” of June 2, 2011.) Second, how should the amount owed by theprotection seller to theprotectionbuyer in the eventofdefault bedetermined,

and should this determination involve physical settlement or cash settlement?Third,whatbecomesofaCDSwhenthereferencefirmceasestoexistthroughmerger or acquisition?Multiple solutions have been proposed to these issueswith many different variants incorporated into documentation of individualdeals.This is a particular headache formarketmakers inCDSs,whomust becertain that transactions that seem to offset one another in terms of tenor andreference entity actually do offset one another when contractual details ofsettlementprocedureareconsidered.Protectionsellerswouldpreferthatthedebtinstrumentsusedforsettlementbe
as narrow as possible, preferably the single most liquid bond issued by thecompany.ButCDSswithsuchanarrowclassofdeliverableshaveledtosevereproblemsinsettlement,withprotectionbuyershavingtoscrambletopurchaseadeliverablebond,resultingindrivingupthepriceofthatbondsohighthatitisclose to par—the resulting profit between the purchase price and sale to theprotection seller at par has not been nearly enough to compensate for actualdefaultlossesonwhichprotectionwassought.(Formoredetails,seethearticlesfromtheEconomist:“IsThereMoney inMisfortune?”July16,1998,and“OfDevils,DetailsandDefault,”December3,1998.)Ithasnowbecomemuchmorecommontodefineabroadclassofdeliverables,evenincludingmuchlessliquidcredit instrumentssuchasbank loansand tradecredit.Thismakes it fareasierfor the protection buyers, since they can often deliver the actual creditinstrumentonwhichtheywereseekingprotectionand,inanycase,haveawidechoiceofinstrumentstodeliver.Butthishasmadesettlementmoredifficultforthe protection seller, both because of lower liquidity of the instrument beingdelivered and because the protection buyer's choice of deliverable instrumentgives the buyer a cheapest to deliver option, comparable to the cheapest todeliveroptionintotheTreasurybondfuture,referencedinSection10.1.4.Boththeseeffectscauseprotectionsellers todemandhighercreditspreadsthantheywouldotherwise.WediscussissuesofrelativepricingbetweenbondsandCDSsinSection13.1.2.3.Someoftheimpactonmarketpricesofcreditprotectionbuyersscramblingto
acquire deliverable instruments can be eased by a cash settlement provisiondefined in terms of quoted prices for a specified bond. But the illiquidity ofcorporate bondmarkets, particularly in conditions following the default of thebond issuer, makes quoted prices suspect. This problem has been greatlyexacerbatedbythegrowthofmultinamecreditderivativesthathaveresultedinthe notional value of CDS contracts referenced to a firm exceeding the total
valueofthefirm'sdebt.Thishasledtotheestablishmentofauctionproceduresforestablishingpricesatwhichcashsettlementcantakeplace;seeHelwegeetal.(2009)fordetailsconcerningtheauctionmechanismanditsimplicationsforCDSmarketparticipants.Another possible solution to this problem is to have a default swap with a
fixedpaymentintheeventofdefault,knownasbinarycreditdefaultswaps.Thisresolvestheissueofhowtodeterminepayment,butmaynotbeagoodfittotheriskneedsofaholderofabondor loan.SupposeIamholdinga$100millionbond issued by ABC. I can buy a standard default swap on $100 millionnotional.Ifthelossintheeventofdefaultturnsouttobe$20million,itshouldpayroughly$20million.Ifitturnsouttobe$80million,itshouldpayroughly$80million.However,ifIbuyadefaultswapwithafixeddollarpayout,Imustmakeaguessas to the loss in theeventofdefaultandrun therisk that Ihaveeither purchased too little protection or paid for toomuch protection. Defaultswapswithfixedpayoffsarealsohardertovaluesincethisrequiresanestimateof the probability of default, whereas a standard bond price is based on theproductoftheprobabilityofdefaultandlossgivendefault.SeeSection13.1.2.1forfurtherdiscussionofthispoint.Default swaps, more than any other derivative instrument, have led to the
conceptoflegalbasisrisk(seeSection3.2.1).Amarketmakermaybelieveitsriskonadefault swap ismatchedexactlyby theprotectionpurchased throughanotherdefaultswap,onlytofindithastomakeapaymentunderthecontractuallanguage of the first swap but receives nothing under the slightly differentlanguageofthesecondswap.The International Swaps and Derivatives Association (ISDA), the industry
group that sets standards for derivatives contracts, has made several valiantattempts to remedy the situation by standardizing contract wording. Theresultingchecklistofpossiblecontract terms isadauntingdocument.Evenso,new disputes continue to arise. ISDA has also established determinationcommittees that rule on disputed issues such as the impact of mergers andwhetherarenegotiation isvoluntaryorforced.AndISDAhasstandardized theauction mechanism for determining prices at which cash settlement can takeplace.Anyfirmparticipatinginthismarketneedstobethoroughlyawareofallthe relevant history of the disputes, of past actions of ISDA determinationcommittees, and of ISDA auction procedures, and needs to be certain it fullyunderstandsthetermsoftheriskithastakenon.AgoodsynopsisoftheISDAstandards and the motivation behind them can be found in Gregory (2010,
Section 6.3). For further background on the issues, see Henderson (1998),Falloon (1998), Cass (2000), Bennett (2001), Helwege et al. (2009), and thefollowingarticles from theEconomist: “IsThereMoney inMisfortune?” (July16, 1998); “OfDevils, Details andDefault” (December 3, 1998); “Fixing theHoles” (August 12, 1999); “TheSwapsEmperor'sNewClothes” (February 8,2001);“TheTenderAge”(April20,2006);and“FingersontheTrigger”(June2,2010). The “Legal and Documentation” section of the ISDA website, foundunder the “Functional Areas” heading, provides many documents relating tocontractual disputes and the findings of determination committees(www2.isda.org/functional-areas/legal-and-documentation)..The total return swap, which we encountered in Section 10.1.7, is another
derivative instrument that canbe structured for investorswhowant to takeoncreditriskwithoutputtingupcash.Unlike theCDS,whichisdesignedto looklike an asset swap, the total return swap is designed to look like a straightinvestmentinacorporatebond.Themechanicsarethattheinvestorentersintoaswap inwhichhe receivesallof thecouponpayments from thebondandanychange in thebondprice (positiveor negative, sohemayowepayments) andpaysanamountequaltoLIBORtimestheparamountofthebond.SocashflowsareverysimilartoborrowingatLIBORandinvestinginthebond,butwiththeadvantage that the counterparty to the total return swapcanuse it to create asshortpositioninthebondandtherebyexpressanegativeviewonthecreditorprotectacreditexposure.TotalreturnswapshaveprovedtobefarlesspopularinstrumentsthantheCDS,perhapsbecauseassetswappositionsaremoresoughtafterthanfixed-ratecorporatebondpositions(forthoseinvestorsnotwillingtoputupcash)andperhapsbecausetherelianceonasinglebondraisessettlementissuesunfavorabletotheinvestorsimilartoaCDSwithasingledeliverable.
13.1.2ModelsofShort-TermCreditExposureIn Section 10.2, we were able to base all modeling of interest rate risk on asingle principle, that the value of each individual cash flow that is bundledtogetherinaninterestratecontractcanbedeterminedindependentlyofthevalueofanyothercashflowbundledinthatcontract.Wewouldliketouseasimilarprincipleforcreditinstruments,butrunintothreeroadblocks,onehavingtodowith the treatmentofcredit instruments inbankruptcyproceedings, the secondduetothelargeconvexityrisksofcreditinstruments,andthethirdduetobasisriskbetweenbondsandCDSs.

Beforewe can address these issues,we first need a fundamental frameworkwithinwhichwecandiscusscreditrisk.Ultimately,thecostofcreditriskmustbebasedonexpectationsanduncertaintyconcerninglossfromdefault.Withoutthepossibilityofdefault, credit instrumentswould justbepricedbasedon therisk-freediscountcurve.Defaultlosscanbeanalyzedintothreecomponentsasfollows:(13.1)
We use PD(B) instead of PD(I) because cross-default legal provisions comeclosetoguaranteeingthataborrowerwilldefaultoneitherallornoneofitsdebt.For liquid instruments like bonds and CDSs, AD(I) is a fixed amount—the
amount of currency borrowed—so we need only concern ourselves in thissectionwith thePD(B)×LD(I) term. In Section 13.2,whenwe look at illiquidinstruments,wewillencountercases(linesofcreditandcounterpartycreditrisk)forwhichAD(I)canvary.Market prices of credit instruments cannot distinguish the effects of default
probabilityandlossgivendefault—inotherwords,youcanextractinformationfrommarketpricesonPD(B)×LD(I),butcannotdistinguishbetweenPD(B)andLD(I). To get a clear view of the entanglement of default probability and lossgivendefault inmarketpricesforcredit instruments, let'sconsiderthesimplestpossiblecase.SupposecompanyXYZhasatwo-yearzerocouponbondthatistrading at $85.50 per $100.00 par amount, while a two-year zero coupongovernmentbondistradingat$90.00per$100.00paramount.The$4.50haircuton the corporate bond implies that the market is pricing the bond as if theexpected loss fromdefault over a two-year periodwould be 5 percent ($90×95%=$85.50).However,thislosscouldconsistofPD(B)=5%,LD(I)=100%;PD(B)=10%,LD(I)=50%;oranyothercombinationthatresultsinPD(B)×LD(I)=5%.Thisinabilityofsplittingprobabilityofdefaultfromexpectedlossgivendefaultwill need tobekept inmindwhenwediscussutilizingmarketdata ininternalmodelsofcreditrisk inSection13.2,andinmodelsofportfoliocreditriskinSection13.3.
13.1.2.1ImpactofBankruptcyLawThe ability to value all cash flows received on the same date using the samediscount factor is a vital assumption in the methodology used to maximizeliquidity in theforwardsmarkets,asdiscussedinSection10.2.Thereasonthisassumption breaks down for credit instruments relates to provisions ofbankruptcylaw.Inalmostalljurisdictions,theclaimforatwo-yearcoupondueon a five-year bond is not the same in bankruptcy as the claim for the sameamountofprincipalonatwo-yearbond.Thecommonruleforbankruptcyisthattheholderofabondorloancanmakeaclaimontheprincipal,butnotonanycouponinterest.Offsettingthislossofinterestthatcanbeclaimedistheabilitytocallforimmediatepaymentofprincipal,regardlessofmaturity.For bonds or loans trading close to par—that is, the coupon on the bond is
closetothecurrentparcoupon—theadvantageanddisadvantagealmostcancelout. A five-year bond loses five years' worth of coupons, but can accelerateprincipalduebyfiveyears,whileatwo-yearbondlosesonlytwoyears'worthofcoupons,butcanaccelerateprincipalduebyonlytwoyears.Theparcouponcanbe thought of as the rate of interest that exactly compensates an investor, atcurrent market discount factors, for deferral of receiving principal; therefore,foregoingcouponsontheparcouponbondwillpreciselyoffsettheaccelerationof principal. For similar reasons, a floating-rate bond or loan, whose couponresets to current market levels, should have the advantage of principalaccelerationcloselybalanceoutthelossofcouponpayment.However, for bondsor loans selling at a premium, either becauseof a fixed
couponhigherthanthecurrentparcouponorafloatingrateatapositivespreadto current market levels, the bankruptcy rules will cause more of a loss ondefaultthanthatfeltbyaparbondorloan.Conversely,abondorloansellingatadiscountwillexperiencelessofalossondefaultthanthatexperiencedbyaparbond or loan. As a result, the rule that all cash flows on the same date areequivalent,regardlessofwhatpackagetheyarepartof,breaksdown.Acouponpaymentisworthmoreindefaultifitispackagedaspartofadiscountbondthanacouponpaymentforthesamedatethatispackagedaspartofapremiumbond.Exercise13.1familiarizesyouwiththemathematicsneededtodealwiththis
situation.TheCreditPricer spreadsheetused in theexercise takesas input thecurrentrisk-freezerocouponcurve,anassumedsetofannualdefaultrates,andanassumed lossgivendefault rate, andcomputes the resultingparcurve foracorporatebondandresultingspreadstotherisk-freeparcurve.Thecalculation
looksatthevalueofpaymentsreceivedifnodefaultoccursplustheacceleratedprincipalpaymentsreceivedifdefaultoccurs.YouwillalsofindthiscalculationexplainedandillustratedinHull(2012,Section23.4).Theexercisedemonstratesthatspreadstotherisk-freeparcurvewilldifferfordifferingassumptionsoflossgivendefault.ThisshowsthatitisnotjusttheproductPD(B)×LD(I)thatmattersinthiscase,butalsotheindividualcomponents,sincethevalueoftheprincipalacceleration depends on the loss given default assumption. The exercise alsoshowsyouhowtousethesamespreadsheettosolveformarket-implieddefaultratesbasedonanobservedparcurveandanassumedlossgivendefaultrate.Itfurther shows that if prices are available for several coupons with the samematurity, then information about the split between PD(B) and LD(I) can beextracted.Oneissueinwhichthedifficultyinsplittingmarketquotesintoprobabilityof
defaultandlossgivendefaultcomponentsinvolvesbinarycreditdefaultswaps.ThepriceofabinaryCDSshouldjustbethecostofastandardCDSdividedby1–LD(I), since the standardCDSwill pay1 –LD(I) dollars for each dollar ofprincipalof theCDS in theeventofdefault,but thebinaryCDSpays the fullprincipalintheeventofdefault.
13.1.2.2ConvexityofCreditInstrumentsToillustratethedifficultythatconvexityposesforcreditriskmanagementbasedonshort-termexposuretomarketprices,considerthefollowingsimpleexample.(Bycontrast,convexityhaslittleimpactoninterestrateinstruments;seeSection10.4.)ConsidertwoobligationsofcompanyXYZ:atwo-yearzerocouponbondanda10-yearzerocouponbond.Assumethatarisk-freetwo-yearzeroistradingat$90per$100parvalueandarisk-free10-yearzeroistradingat$60per$100parvalue.IftheexpectedlossfromdefaultforXYZisroughly1percentayear,wewouldexpecttoseeahaircutforthetwo-yearzeroof$90.00×2%=$1.80andahaircutforthe10-yearzeroof$60.00×10%=$6.00.IfmarketconfidenceinXYZworsenedslightly, expected loss fromdefaultmight rise fromabout1percentayeartoabout1.1percentayear,resultinginahaircutforthetwo-yearzeroof$90.00×2.2%=$1.98andahaircut for the10-yearzeroof$60.00×11%=$6.60.Therefore,thetwo-yearzerohasmovedby$1.98–$1.80=$0.18andthe10-yearzerohasmovedby$6.60–$6.00=$0.60,aratioof$0.60/$0.18=3.33,whichcouldalsobederivedasaratioofthedurationsmultipliedbythepresentvalues:(10×$60)/(2×$90).

Ifyouwant tohedgeagainst smallmoves inacredit spread,youwould sellshort$30million10-yearbondsagainstalongpositionof$100milliontwo-yearbonds. But what happens if XYZ defaults? You have losses on $100 millionbalanced by gains on only $30million.The right ratio for hedging short-termmarketmovements is an extremely poor ratio for hedging default, due to thesevere convexity. The higher the PD(B) component of the in PD(B) × LD(I)product, the greater the probability of default, and the more significant theconvexityrisk.Forlargemovesthatdonotgoallthewaytodefault,asmightbeassociatedwith a credit downgrade, amismatch in correct hedging ratioswillstill occur, but it will be less severe. This example demonstrates that riskmanagement utilizing short-term exposures to changes in market price is notsufficientbyitself;itneedstobesupplementedbyananalysisofultimatedefaultrisk.
13.1.2.3CDS-BondBasisRiskTounderstandthebasisriskbetweenCDSandbonds,wemustfirststartwiththetheoreticalarbitragerelationshipbetweenthemandthenseewhatfactorsmightalterit.Wewillusasimpleillustrativeexampleofthearbitragerelationship,afullerdiscussionofwhichcanbefoundinDuffieandSingleton(2003,Section8.3). Under ideal circumstances, the spread above LIBOR on a floating-ratebondissuedbyacorporation(call thisspreadS)ought tobeequal totheCDSspread for the samematurity (call this spreadC). If thepurchaserof thebondalsopurchasesaCDSofthesametenor,hisreturniftheissuerdoesnotdefaultisLIBOR+S–Ceachyearplus thereturnofhisprincipal. If the issuerdoesdefault,hecanexchangethebondforparunderthetermsoftheCDS.Sincetheinvestoralwaysgetsbackhisprincipal,hehasaninvestmentwithnocreditriskonwhich the return ought to beLIBOR; henceLIBOR+S –C should equalLIBOR,soSshouldequalC.Inpractice, very fewcompanies issue floating-ratebonds, but an asset swap
canbeusedtoturnafixed-ratebondintoacloseapproximationofafloating-ratebond.SotheCDSspreadoughttoequalthespreadoverLIBORthatthefixed-ratecouponcanbeexchangedforintheinterestrateswapmarket,whichisthespreadbetweenthecouponrateandtheswaprateforthebond'stenor.Sowhy should the actual basis between aCDS spread and a bond's coupon
spreadtotheswapratebedifferentthanzero?Partlyitisbecausetheassetswapis not a perfect substitute for a floating-rate bond, and partly it is because of

featuresoftheCDSthathavenotbeenaccountedforintheaboveidealization,suchasthecheapest-to-deliveroptiondiscussedinSection13.1.1.2.TheseminalarticleontheCDS-bondbasisisLehmanBrothers'“ExplainingtheBasis:CashversusDefaultSwaps”byO'KaneandMcAdie(2001).Itanalyzesmanyfactorsthat potentially could make the CDS spread greater than the bond spread(“increasethedefaultswapspread”intheterminologyofthepaper)ormakethebondspreadgreaterthantheCDSspread(“decreasethedefaultswapspread”).AsummarycanbefoundinO'Kane(2008,Chapter5).Othersourcesworthconsultingare:DeWit(2006).DeWit'sdiscussionoffactorsdrivingthebasisinSection2ofhispaperleansheavilyonO'KaneandMcAdie,butheaddssomeanalysisandaverycomprehensivesetoffootnoteswithreferencestobothempiricalandtheoreticalarticles.Table6givesaconcisecomparisonofempiricalresearchonthesizeofthebasis,whichcentersaround5to10basispointswithCDSspreadshigherthanbondspreads.DeWitstates:“Whilewedefine14differenteconomicbasisdrivers,itisourunderstandingthatfourofthem(i.e.theCDScheapesttodeliveroption,difficultiesinshortingcashbondsinacontextofstructuraldemandforprotection,relativeliquidityinsegmentedmarkets,andsyntheticCDSissuance)arethemaindeterminantsoftheCDS-bondbasis.”Hull,Predescu,andWhite(2004)alsopresentempiricalevidencethatsupportsthesameconclusionasDeWit'sTable6.DuffieandSingleton(2003,Section8.3)analyzestheCDS-bondbasis.TheyarelessinclusivethanO'KaneandMcAdieinconsideringallpossibleinfluences,butareworthlookingatforthedepthoftheiranalysisoftheimpactofthedifficultyinshortingbonds.ThehistoricalrelationshipofCDStradingabout5or10basispointshigherthanbondspreadswasseverelydisruptedbythe2007–2008crisis,withspreadsgoingnegativeby250basispointsforinvestment-gradefirmsandby650basispointsforhigh-yieldnames;seeBaiandCollin-Dufresne(2011)foradetaileddiscussionofbothmarketbehaviorandpossiblecauses.Thetwomajordriversofthisdisruptionappeartobe:
1. Funding cost. Many holders of cash bonds were now funding atsubstantiallyhigherratesthanLIBOR.WhilethehighbondspreadrelativetoCDSspreadswouldthenseemtoofferanarbitrageopportunitytothosewho could still fund atLIBOR, theremay be have been little appetite forsuch arbitrage in the current environment (a Reuters article “Popular US
Credit Trade Turns Sour” of December 13, 2007, stated that “lack offinancial balance sheet capacity and a general unwillingness to lend hasprolongedthenegativebasis”).2. Heightened concern for counterparty risk. If a CDS is not fullycollateralized,thebuyerofCDSprotectionmaybeunwillingtopaythefullcostofdefaultrisk.
13.1.3RiskReportingforMarketCreditExposuresAgoodstartingpointforriskreportingofmarketcreditriskistocloselyparallelthereportingguidelinesforforwardriskgiveninSection10.4.Aswithforwardrisk,keyquestions formarketcredit risk involveselectionofmaturitybucketsand selection of summary statistics, such as exposure to a parallel shift in thecredit spread curve and exposure to linear tilt of the credit spread curve. Ameasureofcreditspreadduration iscalculated incloseparallel to thedurationmeasureforratesandservesasanalternativetothevalueofabasispointshiftinthecreditspreadcurve.Becauseeconomiceventsthathaveanimpactondefaultprobabilitiesoftenimpactthecreditspreadsofmorevulnerablefirmsmorethanthoseofhighercreditquality,manyfirmsutilizeameasureofpercentagechangeincreditspreadasanalternative toorsupplement toameasureof impactofaparallelshiftincreditspread.Forexample,ameasureofa5percentincreaseincredit spreads would add together the impact of a 5-basis-point increase in acreditthatcurrentlyhasa100-basis-pointcreditspreadwiththeimpactofa25-basis-pointincreaseonacreditthatcurrentlyhasa500-basis-pointcreditspread.There are two key added factors for the measurement of credit spread
exposures relative to rate exposures.One is that credit spreads have farmorecharacteristics tobe takenintoaccountwhengroupingexposures—geographic,industry, and credit quality. The second is the importance of price jumps andconvexityforcreditspreads,whichisoflittleimportanceforforwards.Let'slookatgroupingcharacteristicsfirst.AswithequityspotriskinSection
9.3, grouping of exposures and limits by geography and industrymake sense.Forcorporatecredit,equityexposureandcreditspreadexposurearetwoaspectsof riskexposure tocorporations,so thegroupingsusedshouldbeverysimilar.All levels of management should see total net credit exposure along withexposure to major geographic regions (e.g., United States, Western Europe,developed Asia, emerging markets) and major industry groups, while lowerlevelsofmanagementshouldseemoredetailednetcreditexposuresbycountry
and specific industries. Reporting and limits for exposure to individualborrowers isalsoneeded.Finally,groupingofexposuresand limitsareneededforcreditquality,withratingagencygrades,suchasAa,A,Baa,andBa,oftenbeingused.Giventhelargeimpactofconvexityoncreditspreadexposures,asdiscussed
inSection13.1.2.2, it very important tohavemeasures and limits that capturethis risk. Measures and limits that capture default risk will be discussed inSection 13.2. For large credit spread shifts, themost intuitively appealing aremeasuresofandlimitsontheamountthatcanbelostintheeventofverylargeshiftsincreditspreadthatmightbeassociatedwithamajorshiftintheeconomicenvironment.Soyoumighthaveameasureofexposure toa1percentshift increditspreadstocontrolforordinarymarketmoves,andameasureofexposureto a10percent shift in credit spreads to control for a largemove.There is anobviousparalleltothedeltaandconvexitylimitsonoptionspositions,discussedinSection11.4.
13.2MODELINGSINGLE-NAMECREDITRISKModelsofsingle-namecreditriskareimportantforseveralreasons:
Ifyouhaveexposuretoasingle-namecreditinstrumentforwhichyoucan'tobtainaliquidmarketprice,youwillneedamodeltovalueit.Evenwhenyoucanobtainaliquidmarketprice,comparisontoamodeledpricecanbeusefulininformingtradingdecisions.Single-namecreditinstrumentmodelsserveasimportantinputstocreditportfolioandmultinamecreditinstrumentmodels.Sincecreditportfoliosandmultinamecreditinstrumentsneedtobeevaluatedoverlong-termhorizons,justhavingaliquidpriceforconstituentpiecesisnotadequate—amodelofpossiblepriceevolutionisalsorequired.
Thekeyelement inmodelingany single-namecredit instrument ismodelingexpecteddefaultloss,since,absentdefaultloss,theinstrumentisjustaninterestrate instrument, whose modeling we have already studied in Chapter 10.Referringback toEquation13.1 inSection13.1.2, the default loss on a creditinstrumentcanbewrittenas
thatis,theproductofprobabilityofdefault,lossgivendefault,andtheamountthat will be owed conditional on default. The best way of organizing themodelingofdefault loss is tomodel these threecomponentsseparately.Partly,

this is just an aid to clear thinking. Partly, it is motivated by probability ofdefault being a functionof theborrower, independent of the instrument,whiletheothertwocomponentsareinstrumentdependent.Andpartly,thisisamatterofexpertise:Thosewhoaremostexpertinmodelinglossgivendefaultmaybelendingofficerswith experience in loanwork-outs of borrowers threatenedbybankruptcy, while probability of default may best be modeled by those withdirectknowledgeofaparticularfirmorindustry.Our discussion in this section is accordingly separated into sections on
estimatingprobabilityofdefault(13.2.1),estimatinglossgivendefault(13.2.2),and estimating amount owed conditional on default (13.2.3). Section 13.2.4looks at information relative to defaults that can be derived from prices forequityandequityoptionsutilizinganoption-theoreticapproach,atopicthatcutsacrossbothprobabilityofdefaultandlossgivendefault.
13.2.1EstimatingProbabilityofDefaultDefault probability is the most critical and most intensely studied of thecomponentsofsingle-namecredit risk.Almostall firms thatdeal incredit riskinstrumentswillwanttoformtheirownassessmentsofdefaultprobability(onlyifcreditinstrumentsareonlyasmallportionoftheinvestmentportfolioandarealmost all liquidmight a firmbe satisfiedwith just basing this assessment oninput from an outside service). Firms with heavy investment in creditinstruments,suchastraditionalbanks,willdevoteconsiderableresourcestotheirowndeterminationofdefaultprobability.Butall firmsshouldbeawareofandmakeuseofindependentassessmentsofdefaultprobability,bothasinputtotheirownjudgmentsandasrealitychecks.Thisisparticularlytruewhenthecreditvaluationisforabusinesswithwhich
thelendingfirmhasalongrelationshipanddetailed,intimateknowledgeofthebusiness'smanagement and operations. Caution needs to be exercised in suchcases, since close, longtime relationships can breed complacency and areluctance to acknowledge unwelcome changes. It is important to have aninternal review mechanism in which internal credit ratings that show lowerdefaultprobabilitiesthanagencydefaultprobabilitiesorthosederivedfromthemodels ormarkets are challenged.The reviewmechanism needs to be run bypeople with good experience in the credit area but who don't have the directclientinvolvementthatmayleadtocomplacency.Wehavedividedup thepossiblesourcesof independentdefaultprobabilities
intotwobroadcategories.Thefirst,andmostwidelyused,isdirectcomparisonto ratingagencyevaluations.Thesecond is theuseof statisticalmodeling thatmaytakeasinputborrower-specificinformation,gaugesofthebroadeconomy,andmarketprices.Thislastcategorywillleadusintotheareaofoption-theoreticmodels,discussedinSection13.2.4.Wediscussthesetwocategoriesinturn.
13.2.1.1RatingAgencyEvaluationsThe primary output of rating agency evaluation of individual borrowers is aletter grade. Translating letter grades into default probabilities requires someanalysis,buttheratingsagenciesprovideanabundantamountofhistoricaldatathat can be utilized tomake this conversion.While all of the rating agenciesprovidesuchhistoricaldata,Iwill, forconvenience,makeallmyreferences inthis section to theMoody'sdata,which isupdated regularlyandappears tobeeasily available to the public on theweb, through theNationalAssociation ofInsurance Commissioners at www.naic.org. All the data quoted and used intablescomesfromMoody's(2011a).It should be noted that any use of historical rating agency data to translate
fromcurrentagencyratingstodefaultprobabilitiesdoesrestontheassumptionthat the ratings assignment process has been reasonably stable and consistentovertime.Argumentsforthisbeingareasonableassumptioncanbefoundinthesection“TheRatingProcess”indeServignyandRenault(2004,Chapter2),forexample,“Thecriteriaaccordingtowhichanyassessment isprovidedareverystrictly defined and constitute the intangible assets of ratings agencies,accumulated over years of experience. Any change in criteria is typicallydiscussedataworldwidelevel.”Thetranslationofratingagencygradestodefaultprobabilitiesgenerallystarts
withtransitionmatricesthatshowtheprobabilityoverafixedtimeperiodthatacreditratedinonecategoryatthebeginningoftheperiodwilldefaultduringtheperiodorwilltransitiontoanothercreditratingcategoryattheendoftheperiod.Tables13.1and13.2showasampleone-yeartransitionmatrixandacumulativetransitionmatrixthatonlylooksatdefault.Ratingagenciesalsopublishmatricescovering many different transition periods (for example, two-year transitions,three-year transitions,andsoon);matriceswithfinercredit ratinggraduations;andmatricesbasedonsubsetsofthishistoricaldata.TABLE13.1One-YearTransitionMatrix,1970–2010

TABLE13.2CumulativeDefaultRates,1970–2010

Thereareavarietyofapproachesinusingthisdatatoconvertagencyratingsintodefault probabilities.Here are someof themajordifferences.As theone-yeartransitionmatrixinTable13.1shows,someborrowerswhoreceivearatingat the beginning of a period are no longer tracked by the end of the periodbecause they have asked the agency to withdraw its rating. In projectingtransitionprobabilities,achoicemustbemadebetweenassumingthatarequestforratingwithdrawalindicatesanticipationofadowngradeandassumingthatarequest for rating withdrawal carries no information content or someintermediateassumption(seedeServignyandRenault2004,Appendix2A).
Trade-offsexistbetweenusingmultiyeardefaultdatabasedonthedirectobservationofcumulativedefaultratesversusgeneratingmultiyearcumulativedefaultratesbythematrixmultiplicationofone-yeartransitionmatrices.Thedirectuseofcumulativedefaultratessuffersfromadiminishingdatapoolforlongertenorsandgreaterpotentialinaccuracyfromwithdrawnratings(firmswhoseratingsarenolongertracked)(seeGupton,Finger,andBhatia1997,Section6.3.2).MatrixmultiplicationassumesaMarkovianprocess,wherenoserialcorrelationexistsbetweentransitions.Alternatively,itcouldbedesirabletoderiveone-yeartransitionmatricesthatareconsistentwithobservedlonger-termcumulativedefaultandtransitionbehavior(seeGupton,Finger,andBhatia1997,Section6.4).However,thereisdatasuggestingthatserialcorrelationbetweentransitionsdoesexist(seeBaharandNagpal2000).Defaultprobabilitiesfortenorsthatfallinbetweenthoseforwhichtransitionmatricesarepublishedcanbeinterpolated(seedeServignyandRenault2004,Appendix2A).Ratingagenciesareveryfrankaboutthefactthattheirratingsrepresentthrough-the-cycleasopposedtopoint-in-the-cycleratings(seedeServigny

andRenault2004,“TimeHorizonforExternalRatings”inChapter2).Ratingsarenotadjustedjustbecauseamovementfromanexpansionaryphaseoftheeconomiccycletoarecessionincreasesthelikelihoodofdefaults.ConversiontodefaultprobabilitiesthataccuratelyreflectthecurrenteconomicenvironmentcanbemadeusingdatasuchasthatpresentedinTable13.3,whichshowshowfive-yeardefaultprobabilitiesdifferedbystartingyear.Thisdatacouldthenbecorrelatedwithinformationonthestageoftheeconomiccycleeachfive-yearperiodrepresents.Defaultratesandtransitionmatricescouldbeadjustedforthecurrentstageintheeconomiccycle,basedonhistoricalobservationofdifferencesduringrecessionandgrowthperiods.Largelendingfirmsmayhavetheirowninternaldataondefaultsandtransitionsthattheymaywanttousetosupplementthepubliclyavailabledatathatcomesfromtheratingsagencies.However,evenifthisdatahasbeenwellmaintained,atrade-offexistsbetweenusingdatathatismorerelevanttotheparticularclassofborrowerswhoarecustomersofaparticularfirmandthelossofaccuracythatcomesfromtheutilizationofasmallersample.Ifdefaultandtransitiondataisavailablebrokenoutbycountryandindustry,thiscouldbeusedtorefinethedataavailablefromtheratingsagencies.OnecriticismofratingsagencydataisthattheyarelargelybasedonexperiencewithU.S.firms;seethesections“QualityofTransitionMatricesoverTimeandRegion”and“IndustryandGeographyHomogeneity”indeServignyandRenault(2004,Chapter2).However,thesamepointsaboutsmalldatasamplesraisedinthelastbulletmayberelevanthere.Thetablesanddiscussioninthissectionhavereferredonlytocorporateborrowers.Theratingagenciespublishcomparabletransitionmatricesforsovereigngovernmentborrowers(seeMoody's2011b)andothergovernmentborrowers,suchasmunicipalities(seeMoody's2010).Defaultandtransitiondatafromdifferentsourcescanbeblended,suchasaveragingS&PandMoody'sdata,orratingagencyandprivatedata.
TABLE13.3Five-YearDefaultRatesbasedondatafromMoody’s(2011)Exhibit42
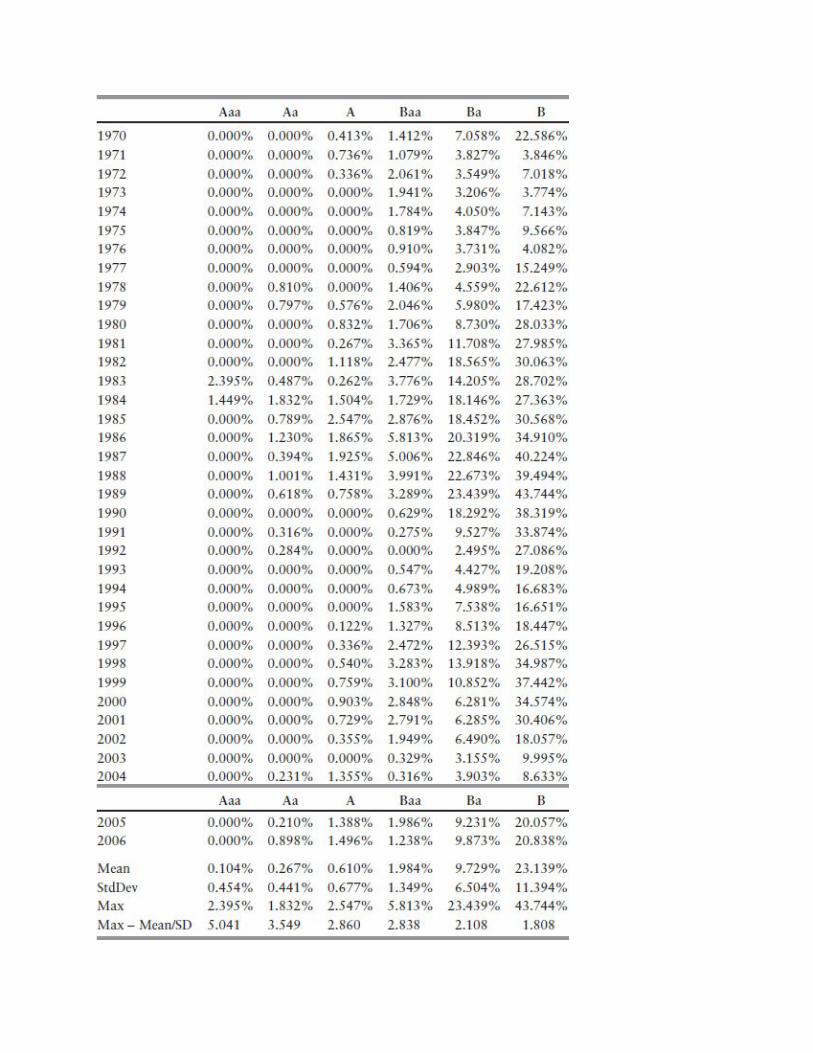

A frequently expressed concern is that agency credit ratings are not updatedoftenenough to fully reflect theprobabilityofdefault. It reflects thenatureofthe rating process, which, because of the serious consequences to a firm'sfinancialhealtharatingschangecanentail,requiresthatchangesbethoroughlydeliberatedandwelldocumented.Thismaysupplythemotivationtosupplementthissourceofindependentdefaultprobabilitieswithoneofthetwoothersourceswewillnowdiscuss.
13.2.1.2StatisticalModelingTheseminalconceptinstatisticalmodelingofdefaultprobabilitieswasEdwardAltman's 1968 Z-score model that related probability of corporate default tofirm-specific accounting ratios—the ratio to total assets of working capital,retainedearnings,earningsbeforeinterestandtaxes,andsales—andonemarketprice, the market value of equity. Bohn and Stein (2009, Chapter 4) andSaundersandAllen(2010,Chapter6)giveagoodexpositionofthecurrentstateofthesemodels.Marketpricescanbeusedinstatisticalmodelsofdefaultprobabilityinoneof
threeways.ThefirstisthewayAltmanusedthemarketvalueofafirm'sequityinhisZ-scoremodel, as just an independentvariable ina regressionmodelordiscriminantanalysis.Thesecondistotrytobringmoretheoreticalstructuretotherelationshipbetweenequitymarketpricesanddefaultprobability,theoption-theoreticmodelswewillexamineinSection13.2.4.Thethirdistotrytofindastructural relationship between bond and CDS market prices and defaultprobability.LinkingbondandCDSmarketpricestodefaultprobabilitycouldbeusefulin
severalways.AbankthatisholdingtoomuchdebtofaparticularborrowertobeabletoconsiderusingtheCDSmarkettoliquidatetheriskandwhichthereforemustmanagetheriskusingalonger-termportfoliomanagementapproachwouldstill be interested in finding out the default probability that is built into themarketprice—CDSspreadsmayreflectnewinformationfaster than thebank'sinternal reviewprocessandwouldbevaluableas input to the internalprocess.Even when no liquid market exists for the bonds or CDSs of a particularborrower, itmightbepossible toconstructan indexof liquidbondsandCDSsfor other borrowers related by similar characteristics (e.g., credit rating,nationality, industry),andderivingadefaultprobabilityfor this indexcouldbesimilarlyvaluableinputtothebank'sinternalreviewprocess.

Therearetwobarriersthatmustbeovercomeinderivingdefaultprobabilitiesfrommarketcreditspreads.ThefirstistheonediscussedinSection13.1.2,theinability to separate default probability from loss given default (LGD). ThiswouldneedtobeaddressedbymakingareasonableassumptionfortheLGDandthen deriving the default probability implied by the credit spread. The secondbarrier is the large difference between actual default probabilities and thoseimpliedbymarket rates, due largely to the systematic risk embedded in creditexposure (thiswill bediscussed further inSection13.4.4).Thisdifferencehasbeen studied extensively over the past fewyears; good summaries are inHull(2012, Section 23.5) and Amato and Remolona (2003). Actual defaultprobabilitiescanbeinferredfrommarket-implieddefaultprobabilitiesbasedonobservedhistoricalrelationships.Thedownsidetothislatterapproachisthatchangesindebtpricesmayreflect
manyfactorsother thanchanges inmarketsentimentaboutdefaultprobability;technicalliquidityfactorsorchangesinthewillingnesstotakeonsystematicriskcan dominate.And evenwhen a borrower does have liquid bonds andCDSs,theymaynot be very liquid andmaynot provide an up-to-date assessment ofmarket sentiment on the firm's credit risk.Stockprices are generally farmoreliquid and less subject to, thoughnot immune to, being impactedby technicalliquidityfactors(andequityiscertainlysubjecttothesamebufferingasdebtbychangesinwillingnesstotakeonsystematicrisk).Thegreaterliquidityofstockpricesisamajordrivingfactorbehindtheuseoftheoption-theoreticmodelsforcredit.
13.2.2EstimatingLossGivenDefaultDeServignyandRenault(2004,Chapter4)andBohnandStein(2009,Chapter5) are good introductions to the general topic of estimating loss given default(LGD).StatisticalestimatesofLGDhavebeenpublishedbythecreditratingagencies.
A few other published studies are available aswell.De Servigny andRenault(2004, Chapter 4); Altman, Resti, and Sironi (2001, Appendix III.1); andGupton, Finger, and Bhatia (1997, Chapter 7) offer good discussions of thepublic data available. Table 13.4 provides results from theMoody's study forbond defaults occurring from 1982 to 2010, as reported in Moody's (2011a).Distinctionsaredrawnbasedon the relativeseniorityofdebt,withbank loansregarded as a separate seniority class from bonds. Published studies usually

show recovery rates, which are 100 percent minus the LGD rate, but I havetranslatedintoLGD.TABLE13.4ComparisonofRatesofLossGivenDefaultSeniorityClass MeasuredbyUltimateRecoveries
(1987–2010)MeasuredbyPostdefaultTradingPrices(1982–2010)
Firstlienbankloans 19.7% 34.2%Secondlienbankloans
70.9%
Seniorunsecuredloans
52.2%
Seniorsecuredbonds 36.5% 49.2%Seniorunsecuredbonds
50.8% 63.3%
Seniorsubordinatedbonds
70.6% 69.3%
Subordinatedbonds 70.7% 68.7%Juniorsubordinatedbonds
81.6% 75.3%
Source:BasedonMoody's(2011a,Exhibits7and9).
ThemeasurementofhistoricalLGDcanbeperformedintwodifferentways.Oneistoobservethedropinmarketpricesforaninstrumentaboutonemonthafter the announcement of default, and is shown in the column labeled“MeasuredbyPostdefaultTradingPrices”inthetable.Thesecondistotrackallcasheventually received in thesettlementofclaimsand topresentvalue thesefuturereceiptsbacktothedateofdefault,utilizingadiscountratethatsuitablyreflectstheuncertaintyofrecovery.ThismeasureisshowninTable13.4 in thecolumnlabeled“MeasuredbyUltimateRecoveries.”Gupton,Finger,andBhatia(1997, Section 7.1) cite academic studies that conclude that the “bondmarketefficiently prices future realized liquidation values,” supporting a roughequivalenceofthesetwomethods.ThisconclusionisconsistentwiththedatainTable13.4.Bohn andStein (2009,Chapter 6) cite aMoody's studybyVarmaandCantorthat“determinedthatthesingleBbondspreadprovidedareasonableproxyforthediscountratethat,onaverage,equated”thesetwomeasures.Whichmeasureismorerelevantdependsonusage.Inthecontextofthemanagementofliquid credit instruments in Section 13.1, postdefault trading prices would bemoreinlinewiththeexitpriceapproachforliquidinstruments.Managersoflessliquidcreditportfolioswouldhavemoreflexibilityindecidingwhichmethodofrecoverywasmorepromisingforeachdefaultevent.
All losses shouldbeexpressedasapercentageofpar,given thatbankruptcylawusesparamountoftheinstrumentasthebasisforaclaim(asdiscussedinSection 13.1.2.1). Volatility of LGD rates is an important issue for the creditportfolio simulations discussed in Section 13.3.2. Tables 4.4 and 4.5 of deServigny and Renault (2004) display statistics on volatility of LGD rates byseniorityclass,showingstandarddeviationsinthe25to35percentrange.Parallel toourdiscussionon theestimationof the riskofdefault, firmsmay
wanttosupplementpublisheddataonLGDwiththeirowninternaldata.Thisisparticularlyanissuewithnon-U.S.debtandbankloans.Publisheddataonlossgivendefault isheavilyweighted toward theU.S.market,butbankruptcy lawsand procedures differ substantially by country and may thus be expected toimpactrecoveryrates.Recoveryratehasalsobeenshowntodiffersignificantlybyindustry;seedeServignyandRenault(2004,Chapter4)fordatainTable4.5anddiscussion; inparticular, deServignyandRenault suggest that “whatmayappearasanindustryeffectmayactuallyreflectdifferencesincollateralqualityofferedbyfirmsinvariousindustries.”Thelowerlossgivendefaultrateonbankloanscanbepresumedtobeduetotheattentionbankspaytothenegotiationofsecurity against default.However, this attentionmayvary betweenbanks and,evenwithinabank,byloantype.Firms putting together their own internal data on LGD must be careful in
compiling the data on ultimate recoveries. Gupton and Stein (2005, Section4.3.1) point to a 1999 Moody's study “Debt Recoveries for CorporateBankruptcies”byDavidHamiltonandLeaCartyshowingthat“15%ofthevalueof recoveries for Senior Secured Loans came in the form of equity of thedefaultedform.”GuptonandSteinthencomment:Sincethesepaymentswithequityinterests(e.g.,commonstock,preferred,andwarrants)commonlydonottrade,theirvaluewillbeunclearandunrealizedforyears.Whentheseequityvaluesareeventuallyrealized/known(oftenwellpastthewrite-offdate),itwouldbeatypicalforabank'saccountingsystemtotrack flows back to the original charge-off. When we assist clients indatabasing their own institution's LGD histories, we have always found itnecessary to examine archived paper records. The full tracking of defaultresolution realized values (cash flows) has been far more informative thansourcingsimplytheaccountingwrite-offs.EconomicmodelingofLGDhasnotreceivedasmuchattentionaseconomic
modelingofprobabilityofdefault.JacobsandKaragozoglu(2011),AltmanandKalotay (2010), andBohnandStein (2009,Chapter 5) eachpresent economic

modelsforLGDalongwithdiscussionoftherelevantliterature.Moody'sKMVhasdevelopedacommercialeconomicforecastingmodelforLGD;seeGuptonand Stein (2005). Even when forecasts are based on the judgments ofexperienced creditmanagers, it is still advisable to be aware of the economicmodels, at least for sensitivity to the factors that have provedmost important.Along with loan structure and ranking of collateral, Bohn and Stein findmacroeconomicenvironment(stateoftheeconomy,industry)andfirmleverageamongthesignificantfactors.JacobsandKaragozoglualsofindfirmsizetobesignificant. Gupton and Stein also utilize KMV's distance-to-default measures(discussed in Section 13.1.4) for the firm, the industry average, and thegeographicregionaverage.Anissuethathasdrawnsignificantrecentattentionisthecorrelationbetween
theoccurrenceofdefaultandtherateoflossgivendefault.ThisisthefocusofareportsubmittedbyAltman,Resti,andSironi(2001)totheInternationalSwapsand Derivatives Association. This study finds significant negative correlationbetweentheoccurrenceofdefaultandrecoveryrate,whichtranslatestoastrongpositive correlation between the occurrence of default and loss given default.This is not surprising on economic grounds, since an economic recession islikely to triggermoredefaultswhile alsonegatively impacting the ability of abankruptfirmtorealizevalueonitsremainingassets.Thiscorrelationhasmuchthesameeffectasanincreaseinthelevelofcorrelationbetweendefaults,sincebothresultinmoreclusteringofdefaultlosses.Forexample,ifwe'reprojectingthepossibledefaultlossesforthenextyear,wemightexperienceagoodperiodfor the overall economy that leads to few defaults and small losses on thedefaults that do occur, orwemight experience a recession that leads tomanydefaultsandahighleveloflossesonthesedefaults.Totheextentdefaultlossescluster, it implies the need for added capital to guard against large losses, asdiscussed in Section 13.3.2, and a lower valuation of the senior tranches inCDOs,asdiscussedinSection13.4.1.
13.2.3EstimatingtheAmountOwedatDefaultForloansandbonds,amountowedatdefaultissimplytheparamount.Butforlinesofcreditandcounterpartycreditonderivatives,theamountowedatdefaultneeds to be modeled.We will consider the modeling of the amount owed atdefault for counterparty credit on derivatives in Chapter 14. Here we willconfineourdiscussiontolinesofcredit.

Lines of credit enable a borrower to draw funds as needed up to somemaximumamount,subject tovarious termsandconditions.Fromacompletelypessimistic view, AD(I) would be set for a credit line equal to the maximumamountthatcanbedrawn,sincejustpriortodefaultaborrowerwilllikelytrytomaximize theuseofall available sourcesofcredit.However, this fails to takeintoaccount someof thecontractual terms that the lendercanemploy to limitcredit lineusagewhen the credit ratingof theborrower isdeclining. It is thuspossiblethatAD(I)willbelessthanthemaximumamountthatcanbedrawn.Two principal forms of credit lines are available—those used for working
capitalandthoseusedasbackstopsforcommercialpaperissuance.Workingcapitalcreditlinesgiveaborrowertheflexibilityofonlypayingfull
interest on the amount of funds it needs at a particular point of timewithoutlosingthesecurityofknowingthatitcandrawdownaprecommittedamountasneeded.Commercial paper backup lines act as a safety net for commercial paper
issuers.Commercialpaperissuancetypicallyoccursforveryshorttimeperiods,oftenonlyafewdays,toaccommodatetheliquidityneedsofcommercialpaperinvestors. The tenor of the commercial paper is usually shorter than theborrowingneedofthecommercialpaperissuer,leavingtheissuervulnerabletoan inability to roll the paper over at maturity, but also leaving the investorvulnerable to not beingpaid back in the event of rollover failure.Thebackuplinegivesassurancetoboththeborrowerandinvestorintheeventofaliquiditysqueeze. A backup line is consequently insisted on by rating agencies as aprerequisiteforaninvestment-gradecreditratingonafirm'scommercialpaper.Usageoncommercialpaperbackuplinesisvirtuallyzero,exceptintherarecaseofrolloverdifficulty.Inmeasuringthelossgivendefaultofcreditlines,averageusageisobviously
oflittlevalue,sinceitfailstodealwiththehighcorrelationbetweenlineusageand credit deterioration. The key is how much usage will there be if defaultoccurs.Asnotedpreviously,backuplineusageaveragesclosetozero,butwhenthelinesareused,itisbecausecreditdifficultiesmakerollingcommercialpaperproblematic.Ifonly1percentofallcommercialpaperissuersdefault,butallofthesehavetheirlinesdrawnby100percentjustpriortodefault,andif0percentusageappearsontheremaining99percentofissuers,thentheoveralllineusagewillbeonly1percent,butdefault losseswillbe justasgreatas ifoverall lineusageis100percent.
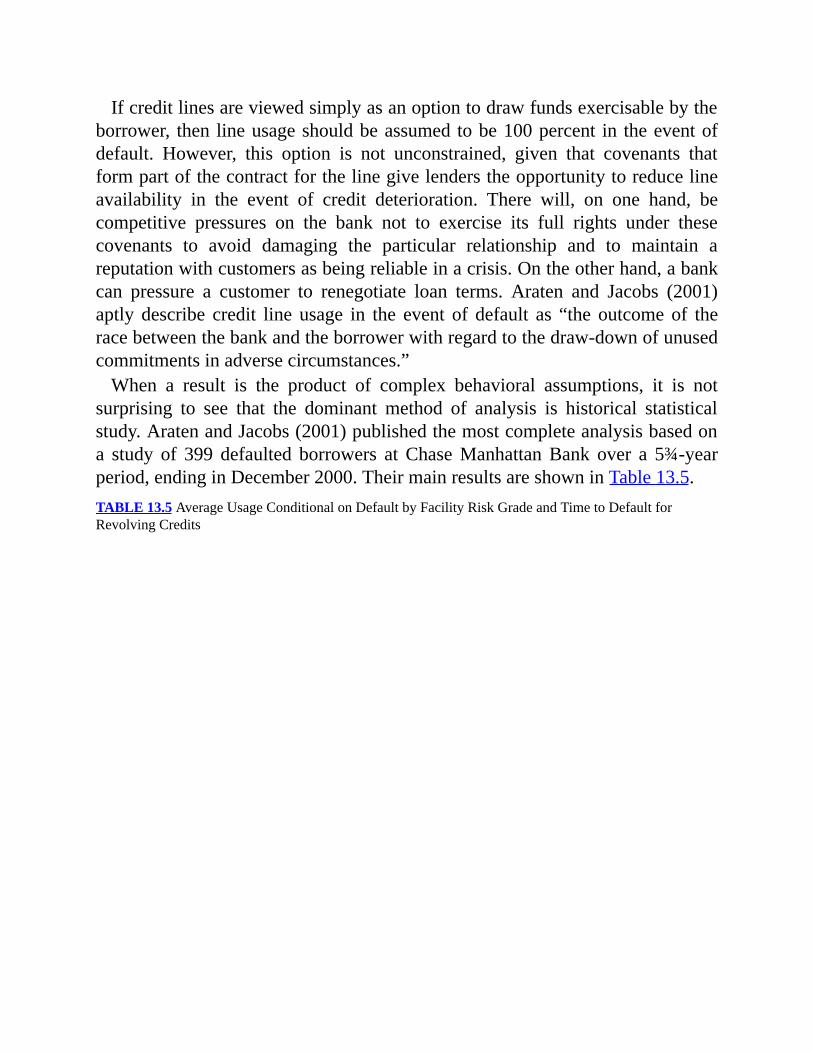
Ifcreditlinesareviewedsimplyasanoptiontodrawfundsexercisablebytheborrower, then lineusageshouldbeassumed tobe100percent in theeventofdefault. However, this option is not unconstrained, given that covenants thatformpartofthecontractforthelinegivelenderstheopportunitytoreducelineavailability in the event of credit deterioration. There will, on one hand, becompetitive pressures on the bank not to exercise its full rights under thesecovenants to avoid damaging the particular relationship and to maintain areputationwithcustomersasbeingreliableinacrisis.Ontheotherhand,abankcan pressure a customer to renegotiate loan terms. Araten and Jacobs (2001)aptly describe credit line usage in the event of default as “the outcomeof theracebetweenthebankandtheborrowerwithregardtothedraw-downofunusedcommitmentsinadversecircumstances.”When a result is the product of complex behavioral assumptions, it is not
surprising to see that the dominant method of analysis is historical statisticalstudy.AratenandJacobs(2001)publishedthemostcompleteanalysisbasedona study of 399 defaulted borrowers atChaseManhattanBank over a 5¾-yearperiod,endinginDecember2000.TheirmainresultsareshowninTable13.5.TABLE13.5AverageUsageConditionalonDefaultbyFacilityRiskGradeandTimetoDefaultforRevolvingCredits

Aswouldbeexpected,averageusageupondefaultriseswiththetimeelapsedbetweenwhenalineiscommittedandwhendefaultoccurs.Thisisbecausethelonger the timeperiodelapsed, themore likely that aborrowerwho startedashigher grade and subject to fewer covenants has slipped downward in credit

grade. Similar reasoning explains the finding that average usage upon defaulttendstorisewithahigherinitialcreditrating.Ofcourse,it islesslikelythatahigher-rated creditwill default compared to a lower-rated credit, but for thosewhododefault,thelowerlevelofcovenantsresultsinhigherusage.
13.2.4TheOption-TheoreticApproachBeforeexpoundingontheoption-theoreticapproach,letusreviewwhyitwouldbeveryusefultohaveamodelthatrelatesafirm'sequitypricetocreditspreads,default probability, and loss given default. First, as noted toward the end ofSection 13.2.1.2, the generally greater liquidity andmore frequently availablequotesofequitypricesrelativetodebtpricesmakesthisanattractivepotentialdriver of inputs to portfolio credit models. Second, the greater availability ofhistorical stock price datamakes it attractive as a driver of default correlationmodels, as we will see in Section 13.3.1. Third, credit spreads derived fromequity prices can be a useful input to trading decisions about which creditinstruments represent good investment values. Fourth, models of correlationsbetween equity prices and credit spreads can be valuable tools in buildingmodels of products, such as convertible bonds, that are hybrids of equity anddebt.Fifth,modelsofcorrelationsbetweenequitypricesandcreditspreadscanbe useful input to the creation of stress scenarios. And sixth, certain tradingstrategies, termed capital structure arbitrage, use option-theoretic analysis toidentify mispriced relationships between debt instruments and equity options;Morini(2011,Section11.2)offersanextensivediscussionofthesestrategiesandpossibledifficultiestheymayencounter.Intheoption-theoreticapproach,afirm'sequityisviewedasacalloptionon
thevalueof the firm's assetswith a strikeprice equal to the facevalueof thefirm'sdebt.Thisisequivalenttoviewingtheequityownersofafirmashavingaputoptiontopayoffthedebtholderswitheitherthefacevalueofthedebtorthetotalvalueofthefirm'sassets,whicheverissmaller.Sothetotaleconomicvalueofthefirm'sdebttothedebtholdersmustbethefacevalueofthedebtlessthevalueofthisputoption.Let us first look at a very simple version of the options model, basically
correspondingtotheoriginalMertonmodel,whichcanbefoundinHull(2012,Section23.6).It isextremelyusefulasafirstapproximation,sincewewillseethatitprovidesapreciserelationshipbetweenalloftheelementswearetryingtolinkwithverylittlecomputationalburden.Thismodelhasfourkeysimplifying

assumptions:1.Thefirmhasonlyasingleclassofdebtoutstanding,azerocoupondebt,andthefirmwillnotissueanynewdebtbeforethisdebtmatures.2.Ifthefirmdefaults,thiswillonlyoccuratthetimeofthematurityofthisdebt.3.Thefirm'sbehavior,suchas theriskinessof its investments,willnotbeimpactedbyhowcloseitistodefault.4. No intermediate payments, such as dividends, will be made to equityholders.At the price of these simplifying assumptions, themodel requires only four
inputs—thetimetomaturityofthedebt,themarketvalueofthefirm'sassets,thepresent value of the firm's debts, and the volatility of the firm's assets. Themodel can give explicit formulas, in terms of these four inputs, for theprobabilitythefirmwilldefault,thelossgivendefault,therequiredinterestratespread over the risk-free rate for the firm's debt, and themarket value of thefirm'sequityanddebt.UsingnotationclosetothatinHull,we'lldenote:V0: Thecurrentmarketvalueofthefirm'sassets
D0: Thepresentvalueofthefirm'sdebt,whichmaturesattimeT,discountedattherisk-freeinterestrate
σV: Thevolatilityofthefirm'sassets
PD: Theprobabilityofdefault
LD: Thelossintheeventofdefault
Viewingtheequityasacalloptiononthefirm'svaluewithastrikepriceofthefaceamountofthedebt,wecanwriteaformulaforthecurrentmarketvalueofthefirm'sequityas:(13.2)
where
Thecurrentmarketvalueofthefirm'sdebtisjustV0–E0.Following the standardBlack-Scholes analysis,N(d1) is the delta, the partial
derivative ofE0 with respect toV0, andN(d2) is the probability that the strikepricewillbeexceededattimeT.Butthisistheprobabilitythatthefirmwillnotdefaultso:
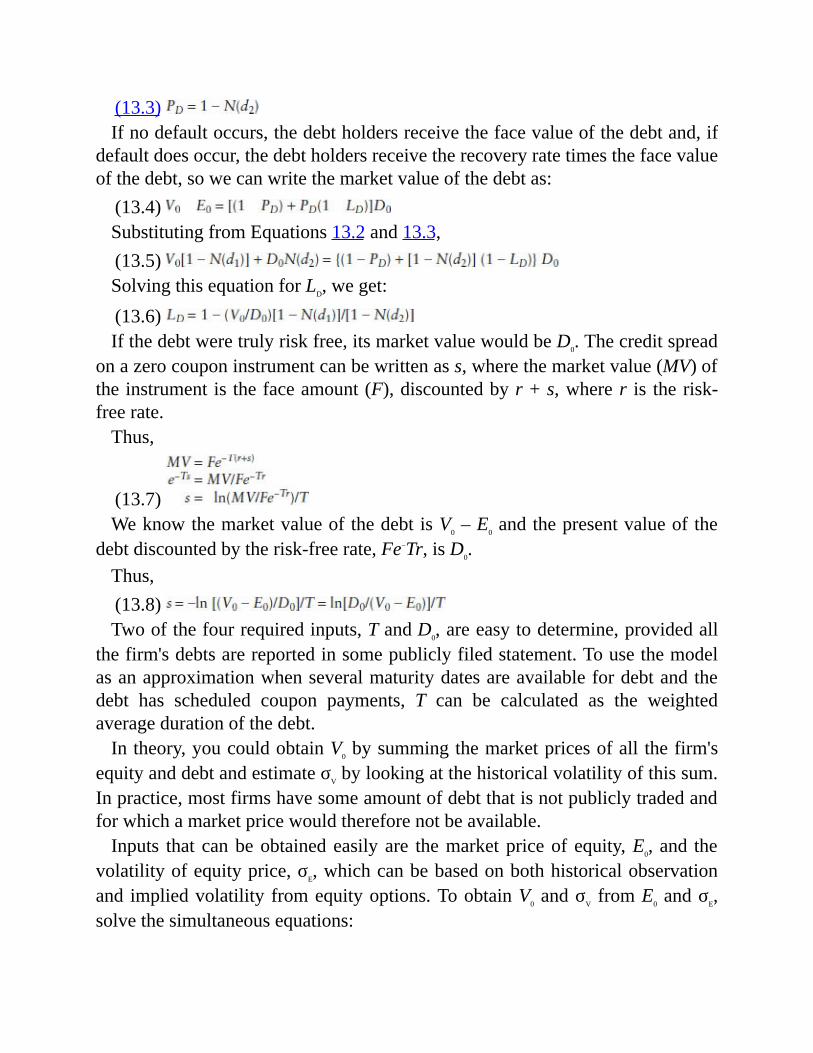
(13.3)Ifnodefaultoccurs,thedebtholdersreceivethefacevalueofthedebtand,if
defaultdoesoccur,thedebtholdersreceivetherecoveryratetimesthefacevalueofthedebt,sowecanwritethemarketvalueofthedebtas:(13.4)SubstitutingfromEquations13.2and13.3,(13.5)SolvingthisequationforLD,weget:(13.6)Ifthedebtweretrulyriskfree,itsmarketvaluewouldbeD0.Thecreditspread
onazerocouponinstrumentcanbewrittenass,wherethemarketvalue(MV)oftheinstrumentisthefaceamount(F),discountedbyr+s,wherer is therisk-freerate.Thus,
(13.7)WeknowthemarketvalueofthedebtisV0–E0andthepresentvalueofthe
debtdiscountedbytherisk-freerate,Fe−Tr,isD0.Thus,(13.8)Twoofthefourrequiredinputs,TandD0,areeasytodetermine,providedall
thefirm'sdebtsarereportedinsomepubliclyfiledstatement.Tousethemodelasanapproximationwhenseveralmaturitydatesareavailablefordebtandthedebt has scheduled coupon payments, T can be calculated as the weightedaveragedurationofthedebt.Intheory,youcouldobtainV0bysummingthemarketpricesofall thefirm's
equityanddebtandestimateσVbylookingatthehistoricalvolatilityofthissum.Inpractice,mostfirmshavesomeamountofdebtthatisnotpubliclytradedandforwhichamarketpricewouldthereforenotbeavailable.Inputs that canbeobtainedeasily are themarketpriceof equity,E0,and the
volatilityofequityprice,σE,whichcanbebasedonbothhistoricalobservationand impliedvolatility fromequityoptions.ToobtainV0andσV fromE0andσE,solvethesimultaneousequations:
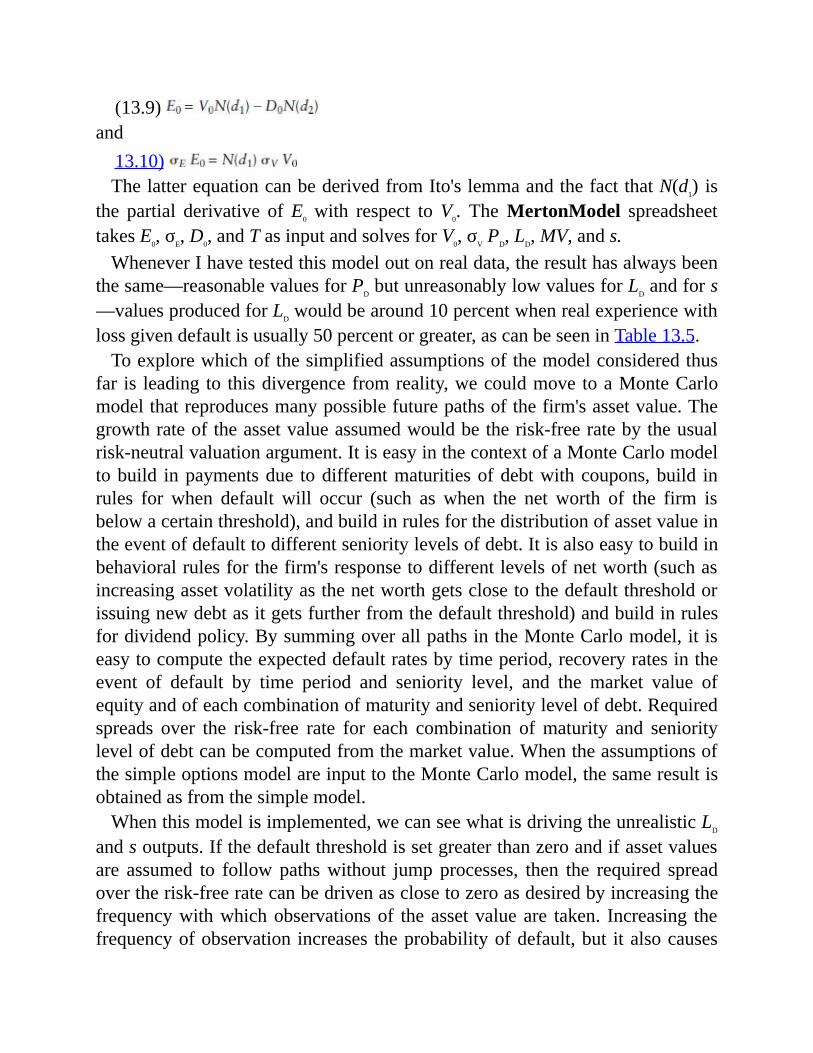
(13.9)and13.10)ThelatterequationcanbederivedfromIto'slemmaandthefactthatN(d1) is
the partial derivative ofE0 with respect toV0. TheMertonModel spreadsheettakesE0,σE,D0,andTasinputandsolvesforV0,σVPD,LD,MV,ands.WheneverIhavetestedthismodeloutonrealdata,theresulthasalwaysbeen
thesame—reasonablevaluesforPDbutunreasonablylowvaluesforLDandfors—valuesproducedforLDwouldbearound10percentwhenrealexperiencewithlossgivendefaultisusually50percentorgreater,ascanbeseeninTable13.5.Toexplorewhichofthesimplifiedassumptionsofthemodelconsideredthus
far is leading to thisdivergencefromreality,wecouldmovetoaMonteCarlomodelthatreproducesmanypossiblefuturepathsofthefirm'sassetvalue.Thegrowthrateoftheassetvalueassumedwouldbetherisk-freeratebytheusualrisk-neutralvaluationargument.ItiseasyinthecontextofaMonteCarlomodeltobuild inpaymentsdue todifferentmaturitiesofdebtwithcoupons,build inrules for when default will occur (such as when the net worth of the firm isbelowacertainthreshold),andbuildinrulesforthedistributionofassetvalueintheeventofdefaulttodifferentsenioritylevelsofdebt.Itisalsoeasytobuildinbehavioralrulesforthefirm'sresponsetodifferentlevelsofnetworth(suchasincreasingassetvolatilityasthenetworthgetsclosetothedefaultthresholdorissuingnewdebtasitgetsfurtherfromthedefaultthreshold)andbuildinrulesfordividendpolicy.BysummingoverallpathsintheMonteCarlomodel,itiseasytocomputetheexpecteddefaultratesbytimeperiod,recoveryratesintheevent of default by time period and seniority level, and the market value ofequityandofeachcombinationofmaturityandsenioritylevelofdebt.Requiredspreads over the risk-free rate for each combination ofmaturity and senioritylevelofdebtcanbecomputedfromthemarketvalue.WhentheassumptionsofthesimpleoptionsmodelareinputtotheMonteCarlomodel,thesameresultisobtainedasfromthesimplemodel.Whenthismodelisimplemented,wecanseewhatisdrivingtheunrealisticLD
andsoutputs.Ifthedefaultthresholdissetgreaterthanzeroandifassetvaluesare assumed to follow pathswithout jump processes, then the required spreadovertherisk-freeratecanbedrivenasclosetozeroasdesiredbyincreasingthefrequencywithwhichobservationsof theassetvalueare taken. Increasing thefrequencyofobservation increases theprobabilityofdefault,but italsocauses

thelossintheeventofdefaulttoapproachzerobydividinguptheassetsofthefirmamongthecreditorswhiletheyarestillsufficienttopayoffthecreditorsinfull. This shows that the key issues in determining default loss are behavioralrather than financial; that is, they depend critically on how transparent theoperationsof the firmare tocreditorsandhowmuchcontrol thecreditorscanexerciseinforcingbankruptcyinatimelyfashion.Thismaydiffersignificantlyby government jurisdiction.The role governmentsmayplay in providing helpforfirmsclosetodefaultmayalsodiffer.Therearetwowaysforwardfromthisimpasse.Oneistofocusonmodelsthat
do incorporate jump processes. The other is to stickwith a simplemodel buttreat it just as a heuristic that can be input to a statistical analysis. We willexplorebothinturn.
13.2.4.1JumpProcessModelsManysuchmodelshavebeenproposed.Agoodsummarywith referencesanddiscussionforavarietyofsuchmodelsandisBohnandStein(2009,Chapter3).It is important to distinguish between two reasonswhy a jumpprocessmay
exist.One is that the asset value of the firmmay follow a jumpprocess.Theotheristhattherecanbediscontinuitiesintheassetvaluethresholdthatwillleadto default. CreditGrades (2002) in documenting a model of the second typestates, in the introduction to Chapter 2, “In our approach, we model theuncertaintyinthedefaultbarrier,motivatedbythefactthatwecannotexpecttoknowtheexactleverageofthefirmexceptatthetimethefirmactuallydefaults.The uncertainty in the barrier admits the possibility that the firm's asset valuemay be closer to the default point than we might otherwise believe.” Theadvantageofthisapproachisthatitisconsistentwiththetermstructureofcreditspreads observed in themarket; without uncertainty around how close a firmcurrentlyistothedefaultpoint,onewouldexpecttoseemuchlowershort-termcreditspreadsthanareactuallyobserved.The JumpProcessCredit spreadsheet implements a jump process model
closely related to the one documented in CreditGrades (2002) and alsodocumented in Schonbucher (2003, Section 9.5). This model has advantagessimilar to theMertonmodel, in requiringvery few inputs andbeing relativelyeasytounderstand.ThemodelassumesthesamesortofstochasticevolutionoftotalfirmassetvalueastheMertonmodel,butassumesthatdefaultcouldoccuratanytimetheassetvaluefallsbelowadefaultbarrier.InputsareE0andσE,asin

theMertonmodel,alongwiththerisk-freerateandboththemeanandstandarddeviationofthedefaultbarrierThisinputforthedefaultbarriertakestheplaceofthepresentvalueofdebtthatisinputtotheMertonmodel.UnliketheMertonmodel,thismodeldoesnotattempttocomputealossgivendefaultrate;thisisassumed to be estimated by statistical means for each class of debt, as perSection 13.2.2. Themodel outputs probability of default and credit spread foranydesiredtimeperiod;unliketheMertonmodel,itisnotrestrictedtoasingletimeperiodcorrespondingtothetenorofexistingdebt.AsourquotefromCreditGrades(2002)intheparagraphbeforelastindicates,
standard deviation of the default barrier is assumed to represent uncertaintyabout thecurrent levelof thedefaultbarrier,andhence is independentof timeperiod.Section2.2andFigure2.2ofCreditGrades(2002)showthatastandarddeviationof30percent for thedefaultbarrier,derivedfromhistoricalstatisticson actual recovery data, produces a term structure of credit spreads that isconsistentwithmarketobservations.TheCreditGradesmodel does not have an input for themeanof the default
barrier.Insteaditisassumedtobethefacevalueofoutstandingdebtmultipliedbythehistoricalaveragelossgivendefault,averagedoveralloftheoutstandingdebtof thefirm.WhileCreditGrades(2002,Section2.2)presentsanargumentfortheplausibilityofthisassumption,thereisarangeofvaluesforthedefaultbarrier that would also be plausible given the criteria of the CreditGradesargument. I have chosen in the JumpProcessCredit spreadsheet to leave themean default barrier as a user input. Users can choose the CreditGradesassumption or experiment with default barrier levels that seem to fit thehistorical credit spreads of a particular issuer or category of issuers (say agrouping by industry and country). Exercise 13.2 is designed to give you anunderstanding of the differences between the Merton model and the jumpprocessmodelinresultsandinsensitivitiestoinputs.
13.2.4.2StatisticalAnalysisEven simple optionsmodels can still play a useful heuristic role in helping tounderstand the default process. This is the role they play in the models ofMoody's KMV, whose analysis is widely utilized among investors in creditinstruments. Crosbie and Bohn (2003) summarize theKMVmethodology. DeServigny andRenault (2004,Chapter 3) in the section “KMVCreditMonitorModelandRelatedApproaches”provideabriefreviewofthemodel,alongwith

somereservations.TheKMV approach is to utilize amodel somewhat like the simpleMerton
model we first discussed, but the objective is to use it not to try to directlymeasuredefaultprobability,but rather toproduceameasurecalleddistance todefault, which is then used to project default probabilities based on anempirically fitted statistical model. Technically, the model utilized by KMVtreatsequityas“aperpetualoptionwiththedefaultpointactingasanabsorbingbarrierforthefirm'sassetvalue”(seeCrosbieandBohn2003,Section3).Theinsightbehindthisisthat,whereasthebehavioralnatureofdefaultrequirestheuseofstatisticalobservationofpastexperience,theoptionsmodeloutputcanbeavaluable input to thisprocesswhenusedcomparativelyto judgewhichfirmsare relatively more likely to default than others. In this approach, statisticalmodels,notoption-theoreticones,areemployedinestimatingloss in theeventofdefault.KMVpresentsthefollowingpointsinfavorofthisuseoftheoptionmodel:Becausethemodelisbasedonequitymarketprices,whicharecontinuouslyobservable,itismorelikelytorepresentthelatestavailableinformationthantheratingsofjustasinglefirm'screditofficersoraratingagencyoronstatisticalmodelsbasedonaccountinginformationthatisonlyavailableperiodically.Itcanalsobeappliedtoanypubliccompany,evenonethatdoesnothavepubliclyrateddebt,sinceitisbasedonequityprices.Themodeltakesintoaccountboththecapitalstructureofafirmanditsbusinessandindustryrisk.Capitalstructureisrepresentedbytheleverage,theratiooftotalfirmvaluetoequity.Businessandindustryriskisrepresentedbythevolatilityofassetvalues.(Forexample,youcanexpectmuchmorevolatilityfromafirminahigh-techindustrythanautility,ormuchmorevolatilityfromafirminanemergingmarketcountrythanoneinanestablishedindustrialcountry.)
The distance to default is measured by the number of standard deviationmovements itwould take to put a firm at the pointwhere default is a seriouspossibility.Intermsofthesimplemodelwepresented,itwouldbe(V0–D0)/(V0
σV),whichiscalculatedintheMertonModelspreadsheet.TheactualmodelusedbyKMV to calculate the distance to default ismore complex thanour simplemodelinseveralways.Tohighlightafew:
Oursimplemodelassumesthatdefaultcanoccuronlywhenfirmassetvalueisinsufficienttomakearequiredpayment.TheKMVmodel

recognizesthatfirmscanbeforcedtodefaultwhentheirassetvaluesdeclinesufficientlybelowthepresentvalueofrequiredfuturepayments.Basedonempiricalstudies,KMVhassetthedefaultpoint,whichinourmodelisD0,asthesumofshort-termdebt,representingrequiredcurrentpayments,andone-halfoflong-termdebt,representingpaymentsthatwillberequiredinthefuture.Inthisway,assetscandeclinebelowtherequiredfuturepaymentsbysomeamount,butnottoofar,beforedefaultisthreatened.DeServignyandRenault(2004,Chapter3)notethatthisisapurelyempiricalruleofthumbthat“doesnotrestonanysolidtheoreticalfoundation.Thereforethereisnoguaranteethatthesameruleshouldapplytoallcountriesandjurisdictionsandallindustries.Inaddition,littleempiricalevidencehasbeenshowntoprovideinformationabouttheconfidencelevelassociatedwiththisdefaultpoint.”Thiscritiqueshouldbecomparedtotheresponsetothequestion“Aredefaultprobabilitiesapplicableacrosscountriesandindustries?”inCrosbieandBohn(2003,Section6).TheKMVmodelcanhandlemoreliabilityclassesthanjuststraightdebtandequity;itcanalsoaccommodatehybridclasses—convertibledebtandpreferredstock.KMVregardsEquation13.10astoosimplistic,sinceitdoesnottakeintoaccounttheimpactofvaryingleveragelevelsthroughtimeontherelationshipbetweenequityvolatilityandassetvolatility.KMVusesamorecomplexmodeltoreflectthisfactor.Inparticular,theconcernisthatforafirmwhoseperformanceistrendingdownward,thedeclineinequityvaluewillresultincurrentleveragebeinghigherthanitsleveragehasbeeninthepast.Ifassetvolatilityisestimatedfromitshistoricalequityvolatilityanditscurrentleverage,thiswilltendtounderstatehistoricalassetvolatility,resultinginunderstatingthedefaultprobability.Theconverseofthiseffectwillresultinoverstatingthedefaultprobabilityforafirmwhoseperformanceistrendingupward.AsCrosbieandBohn(2003,Section4)state,this“biasestheprobabilitiesinpreciselythewrongdirection.”
KMV's solution is a more granular approach in which a time series ofhistorical daily asset returns is constructed fromhistorical daily equity returnsandEquation13.2,basedonaninitialguessatσV.ThesedailyassetreturnscanthenbeusedtocomputeanewguessatσV,leadingtoanewseriesofdailyassetreturns.Theprocessisrepeateduntilitconverges(seeCrosbieandBohn2003,Section4).ManyaspectsofKMV'smethodologyareproprietaryandundisclosed,butthe
resultstheyhavepublishedhavehadamajorimpactonfirmsthatmanagecreditrisk,bothasasourceofinformationandasaninspirationfortheirownresearch.De Servigny and Renault (2004, Chapter 3) note that “Many banks havedevelopedtheirownsystemstoextractearlywarninginformationfrommarketvariables.Manyvariantscanbefoundthatextractthevolatilityofthefirmfromeitherequitytimeseries,impliedvolatilitiesinoptionsmarkets,orevenspreads.. . . Equity-based models reflect the market's view about the probability ofdefault of specific issuers and therefore can provide valuable early warningsignals.Unfortunatelytheyarenopanacea,astheyalsoreflectallthenoiseandbubbles that affect equity markets. Overall, they can be seen as a usefulcomplement to an analysis of a firm's fundamentals.” Bohn and Stein (2009,Chapter 3) in the section “Modifying BSM” provide references to empiricalresearch that “cast[s] doubt on thepractical viabilityof structuralmodels”butobservethat“numerousfinancialinstitutionsaroundtheworldhavesuccessfullyimplementedandtestedcreditriskmanagementsystemsbasedonthestructuralframework.” (In this context, “structural” is equivalent towhatwe have beencalling“option-theoretic”—modelsthatarenotjustbasedonstatisticallinkagesbututilizeoptionstheorytolinkdefaultprobabilitytoequityprices.)Altman, Fargher, and Kalotay (2010) present results supporting the use of
statisticalmodelsofdefaultprobabilitiesthatcombineequitymarketinformationwithtraditionalaccountingvariables(ofthetypediscussedinSection13.2.1.2).Theyprovidereferencestootherpublishedmodelsutilizingequitymarketbasedinputswithadiscussionofcomparativeresults.BohnandStein(2009,Chapter3) in the section “Modifying BSM” also observe that a “promising point ofdepartureisthatofthehybridapproach,wherecharacteristicsofbothstructuraland reduced-form models . . . or structural and econometric approaches arecombined,”andprovidemanyreferencestopublishedhybridmodels.
13.3PORTFOLIOCREDITRISKInSection13.2,wehaveestablishedthemainbuildingblocksthatareneededforanalyzing portfolio credit risk. The remaining building block is estimation ofcorrelationsbetweendefaults,whichwewill investigate inSection13.3.1.Wewillthenturn,inSection13.3.2,toMonteCarlosimulationmodelsthatbringallof thesebuildingblockstogether,andlookatcomputationalalternativestofullsimulation in Section 13.3.3. Finally, in Section 13.3.4,wewill examine how

simulationmodels and the tools of Sections 13.1 and 13.2 can be used in themanagementandreportingofportfoliocreditrisk.
13.3.1EstimatingDefaultCorrelationsLet'sbeginwithsomepointsonwhichalmosteveryonewhohasworkedonthistopiccanagree:
Strongevidencesupportsapositivecorrelationbetweendefaults—thatis,thatdefaultstendtooccurinclusters.Forexample,Table13.6,fromMoody's(2011a),ofdefaultpercentagesbyyearforratingscategoriesBaa,Ba,andB,showsmuchhigherdefaultratesinrecessionperiods,suchas1989to1991andin2001to2003,thaninperiodsofeconomicgrowth,suchas1993to1997.Estimatingthiscorrelationbasedonthejointdefaulthistoryoffirmswiththesamecreditratingisunsatisfactory.Groupingtogetherallfirmswiththesamecreditratingignoresfactorssuchaswhetherfirmsareinthesameindustryorwhetherfirmsarelocatedinthesamegeographicalregion,butthesefactorsarewidelybelievedtoinfluencejointdefaultcorrelation.SeeGupton,Finger,andBhatia(1997,Section8.2).Thedirectestimationofjointdefaultcorrelationbyexamininghistoricaldefaultscategorizedbyrating,country,andindustryisnotafeasibleapproach.Defaultisarelativelyrareeventandwiththisfineasegmentation,therewouldnotbeenoughobservationtoallowrobuststatisticalinference.Awayaroundthisimpasseistoestimatecorrelationforavariablethatcanbemorefrequentlyobservedandcanthenbeutilizedtoproducedefaultcorrelations.
TABLE13.6DefaultPercentagesbyYear

ForKMV,assetreturnsareaverynaturalchoiceforsuchavariable,sincetheyare directly tied to defaults through the distance-to-default measure and itsstatisticalrelationshiptodefaultprobability.KMVutilizesthemethodologywediscussed in Section 13.2.3 to delever equity returns directly observed in themarketandcomputeassetreturns.Itisaneasystepfromcreatingatimeseriesofassetreturnsforalargeuniverseofborrowerstocomputingcorrelationsbetween

asset returns for those borrowers. Monte Carlo simulations of correlatedmovements in asset returns,whichwediscuss in thenext section, can thenbeused tocalculate thepercentageofcases that result in jointdefault,enablingadefaultcorrelationtobecomputed.TheactualmethodologyemployedbyKMVdoesnotdirectlycalculateassetreturncorrelationsbetweenpairsofborrowers.Instead,afactoranalysisisusedinwhichcompositeassetreturnsarecalculatedfor sectors—countries and industries as well as groupings of countries andindustries. Historical asset return correlations can then be computed betweensectors. Asset return correlations between borrowers can then be easilycomputed based on the statistical relationship between each borrower's assetreturn and those of the country and industry sectors. The KMV approach tocorrelations is described in more detail in the section on “Model of ValueCorrelation” in Kealhofer and Bohn (2001) and in the section “CalculatingCorrelationsUsingMoody'sKMVPortfolioManager”inChapter8ofSaundersandAllen(2010).TheCreditMetricsapproachtoestimatingdefaultcorrelationsisverysimilarto
KMV's, except that correlation between equity returns is used as a proxy forcorrelationbetweenassetreturns.Gupton,Finger,andBhatia(1997,Section8.5)providegreatdetailonthisprocess.Thedefaultprobabilityimpliedbycreditspreadsisanothernaturalcandidate
to be used. The drawbacks are that this involves a much smaller universe ofborrowers for whom liquid public debt prices are available relative to thenumber of borrowers for whom liquid equity prices are available and thatimplied default probabilities from public debt prices significantly overstateactual default probabilities, as we discussed in Section 13.2.1.2. As a result,firmsthatdodecidetousemarketimplieddefaultprobabilitiesasindicatorsofrelativecreditquality,butmaychoosetoadjusttheoveralldefaultprobabilitybya factor that lowers these probabilities to anticipated rates of actual default,followingourdiscussioninSection13.2.1.2.Whichever variable is used to provide the linkage, the key to transforming
shorter-termcorrelationsintolonger-termdefaultcorrelationsisasimulationofmovementsthroughtime,whichwewillcometointhenextsection.Becauseofthe relative infrequencyofdefault,evenhighshort-termcorrelations transformintomuchsmallerdefaultcorrelations.While much of the early work on building default correlation relationships
focusedonestimatingcorrelationcoefficients,therecenttrendhasbeentoalsoplacea lotofattentionon theshapeof thecorrelationrelationship, thecopula.
For example, it is frequently the case that large moves in changes in defaultprobability are more closely correlated than smaller moves. The section on“Copulas”inBohnandStein(2009,Chapter8)andDuffieandSingleton(2003,Section10.4)giveanintroductiontothistopicinthecontextofestimatesfromhistorical data. The assumption that correlation is the same for all sizes ofchangesinprobability isknownas theGaussiancopulaassumption.Estimatesbased onmarket prices of credit correlation products, such as CDOs, will bediscussedinSection13.4.2.One recent trend has been to utilize frailty analysis, a technique borrowed
from medical research, to correct for underestimation of correlation due toundetectedfactorsthatcanhaveacommonimpactonmanyborrowers.AgoodexplanationcanbefoundinDuffieetal.(2009),whichprovidesafrailtymodelapplied to corporate defaults, a statistical analysis of the degree of correlationunderestimation that may occur if this correction is not accounted for, andreferences to related literature. Another recent trend has been to introducemodelingofcontagion,theimpactthatdefaultsbyoneormorefirmsmayhavein increasing thedefault probabilities of remaining firms.Rullière,Dorobantu,and Cousin (2010) provide a recent model of this effect with references torelatedliterature.
13.3.2MonteCarloSimulationofPortfolioCreditRiskWherewestand,basedontheSections13.2.1,13.2.2,13.2.4,and13.3.1,isthatavarietyofmethodshavebeenpresentedforestimatingdefaultprobabilityandloss given default for individual borrowers and for estimating the short-termcorrelation between borrowers for some variable that can be linked to longer-termdefaults.WenowfocusonanalyzingmethodsthatcanprovidethislinkageandalsoproducecalculationsofportfolioriskverysimilartotheportfolioriskmeasuresthatwereprovidedformarketriskinChapter11.Let's begin by assuming that all of this analysiswill be provided byMonte
Carlosimulation.FormanyofthesamereasonsstatedinouranalysisofVaRinSection11.1,simulationisthemostaccuratemethodofgeneratingportfolioriskmeasures. It has the flexibility to incorporate almost any assumption aboutstatistical distributions we want to make. Later, in Section 13.3.3, we willdiscuss possible shortcuts to the calculation of portfolio risk under morerestrictive distributional assumptions. However, simulation is always thebenchmark againstwhich the accuracy of other approximations can be tested.
ThereasonwhyweonlyconsiderMonteCarlosimulationforcreditrisk,whilewe considered the alternatives of Monte Carlo simulation and historicalsimulationformarketriskVaR,isthatthelongertimeperiodsinvolvedincreditrisksimulationsmeanthatnotenoughnonoverlappinghistoricaldatapointswillbeavailabletoderiveahistoricalsimulation.AMonteCarlosimulationwillfollowakeyvariable,whetheritisassetvalue,
macroeconomicfactors,ordefaultprobability,foreachborrowertowhomcredithas been extended. The simulation will be based on assumptions about thevolatility of asset returns or transaction matrices for default probabilities andassumptions about short-term correlations between the borrowers (bothcorrelation coefficients and copulas, as discussed in Section 13.3.1). If assetvalue is being used as the key variable, it must be converted into defaultprobabilities,usingastatisticalrelationshipsuchastheonedevelopedbyKMVbetween an asset's distance to default and probability of default. Defaults canthenoccuratrandom,basedontheprobabilityofdefault.Intheeventofdefault,arandomsampleisdrawnbasedonthemeanandstandarddeviationofthelossgivendefaultforagivenseniorityclassofinstrument(ifinstrumentsofdifferentseniorityareoutstandingtothesameborrower,acorrelationshouldbeenforcedbetweenthedegreetowhichthelossgivendefaultoneachinstrumentexceedsorisbelowtheaverage).CorrelationsbetweendefaultprobabilityandLGD,asdiscussedinSection13.2.2,canbespecifiedaspartofthesimulation.Detaileddescriptions of such simulationmodels can be found in Duffie and Singleton(2003,Chapter10),Schonbucher(2003,Chapter10),andBohnandStein(2009,Chapter8).AMonteCarlomodelmeetingthisdescriptionhasmanypossibleapplications.
It can be usedwith just two borrowers to translate a short-term correlation ofassetsvaluesorcreditspreadsintolong-termdefaultcorrelations.Itcanalsobeusedwith an entire portfolio of assets to generate statistics on expected creditlosses and the full distribution of credit losses, such as losses at the 99thpercentile.ItcanbeusedforvaluingatranchedCDObytrackinglossestoeachtranchealongeachofthepathsandthencalculatingtheexpectedlossesoneachtranche,aswewilldiscussinSection13.4.2.Thus farwe have been discussing aMonteCarlo simulation that only deals
withasingle timeperiodinwhichtherelevantoutcomesareforeachcredit toeitherdefaultornotdefault.Thiscanbeextendedinoneoftwodirections.Onedirectionwouldbethesimulationofanend-of-periodchangeincreditgradeandcreditspreadinadditiontodefault.Thisextensionrequiresatiebetweenthekey

variablebeingsimulatedandcreditgradeandcreditspread.ThisrelationshipisstraightforwardforimplieddefaultprobabilitiesandisprovidedforassetvaluesbyKMV'sstatisticallinkagesofthedistancetodefaulttocreditrating.KMVhasalsodevelopedalinkagebetweenassetvaluesandcreditspreads(seeAgrawal,Arora, andBohn2004), partially basedon the capital asset pricingmodel andpartly on statistical relationships. The other direction would be multiperiodsimulation.Multiperiodsimulationcouldbeachievedbyjustcomputingdefaultloss distributions at different points along the simulation path. However, fullaccuracyrequiressomesimulationofpossiblechangesintheoveralleconomicclimate, factoring in features suchas the increasedprobabilityof an economicdownturnfollowingaperiodofsustainedeconomicgrowth(seeWilson1997).DeServignyandRenault(2004,Chapter6)giveathoroughdiscussionoffour
commerciallyavailableMonteCarlosimulationmodelsforcreditportfolios:theCreditMetrics model documented in Gupton, Finger, and Bhatia (1997); theMoody's KMV PortfolioManager model documented in Kealhofer and Bohn(2001); Standard & Poor's Portfolio Risk Tracker mode documented in deServigny et al. (2003); and Financial Analytics's CreditPortfolio Viewdocumented in Wilson (1997). De Servigny and Renault's summary in theirTables6.1and6.3 isparticularlyuseful inshowingataglance thesimilaritiesanddifferencesinthesefourmodels.DeServignyandRenault'sanalysisshowsgreatersimilaritiesthandifferences.
All fourmodels simulate stochastic evolution of default probabilities and usestochastic LGD rates, but only Portfolio Risk Tracker includes correlationbetweendefaultprobabilitiesandLGDrates.Allfourmodelshandlecorrelationsbetween defaults by simulation of common factors that drive defaultprobabilities.Theydifferonthecommonfactorsthatdrivedefaultprobabilities—country and industry factors for CreditMetrics, Portfolio Manager, andPortfolio Risk Tracker, and macroeconomic factors for CreditPortfolio View.Both CreditMetrics and Portfolio Manager derive the relationships that drivethese common factors from equity markets (as discussed in more detail inSection 13.3.1), while Portfolio Risk Tracker offers user flexibility to basecorrelationsonequity,creditspread,orempiricaldata.Theirbiggestdifferencesinvolveoutputs—PortfolioManagerfocusesonthedistributionofdefaultlosses,CreditMetrics and Portfolio Risk Tracker on the distribution of changes inmarket value that can be driven by both defaults and ratings changes, whileCreditPortfolioViewgivesachoicebetweenthesetwodistributions.Whileinformationonchangesinmarketvaluecanbeveryusefulinformation
forcreditportfoliomanagers,aswewilldiscussfurtherinSection13.3.4,Iamextremely suspicious of any approach to portfolio credit risk that does notincludeafocusondistributionofultimatedefault losses.Sinceportfoliocreditrisk is a long-term risk not amenable to management with liquid marketinstruments, as discussed in the introduction to this chapter, the approach ofSections6.1.2and8.4shouldgovern.Anymodelingthatreliesonfuturemarketvalue isassuminga future liquidity thatcannotbereliedon. Ifnostatisticsonultimatedefaultlossesareavailablefromthemodelbeingused,thenthereneedsto be a ready way of translating model output on market value changes intodistributionsofultimatedefaultlosses.A Monte Carlo simulation of individual loans becomes computationally
infeasibleforloanportfolioswithverylargenumbersofverysmallloans.Thisiscertainly true for retail loans such as homemortgages or credit cards. In suchcases, the portfolio needs to be analyzed into segments that can be treated asroughly homogeneous. For example, a portfolio of homemortgages could bedivided into segments grouped by geography and home value. Each segmentnowmustbetreatedasasingleloanintheMonteCarlosimulationoftheentirefirm'sloanportfolio.Butunlikeatrueindividualloan,whichisineitheroneoftwostates,defaultornondefault,agroupingofsmallloansmustberepresentedbyapercentageofloansthatdefaultinaparticulartimeperiod.Ananalysisofthe history of default patterns can establish statistics to drive the simulation,includingcorrelationswithdefaultlevelsbetweentwosegmentsandbetweenthesegmentandindividualloansbeingsimulated.Thebestwaytoderivehistoricalcorrelationsmay be through amutual dependence onmacroeconomic factors,suchasgrowthratesintheeconomy;seeWilson(1997)andBucayandRosen(2001).Forageneraloverviewofasimulationofdefaultsonretailcredits,seeRiskManagementAssociation(2000).Onewayinwhichtheuseofsimulationforcreditriskdiffersfromitsusefor
marketriskVaRisthattheexpectedvalueofthedistributionplaysasignificantrole.SincemarketriskVaRiscomputedoververyshorttimeperiods,expectedvaluecaneitherbeignoredorelsehasonlyaminorimpact.Thefarlongertimehorizonofcreditrisksimulationrequiresthatexpectedcreditlossbeaccountedfor.Expectedcreditlossshouldbetakenasachargeagainstearnings,eitherintheformofareductioninvaluationforaportfoliothatismarkedtomarketorintheformofaloanlossreserveforaportfoliothatusesaccrualaccounting.Riskshould be measured and capital should be allocated based on the unexpectedlosses—thedistributionofreturnsaroundtheexpectedlosses.

Parallel to thediscussion inSection7.2of stress testingasacomplement toVaRformarketrisk,itisoftendesirabletocomplementthestatisticalanalysisofcredit risk for a portfolio with a stress test based on economic insight, forexamplelookingattheimpactofanunusuallyprolongedglobalrecession.Thisis especially true in evaluating the risk of credit concentration to firms doingbusinesswithinaparticularcountry.Creditconcentrationwithinacountryleadstotheriskofcorrelatedoutcomessinceallfirmsmaybeimpactedbyhowwellthecountry'seconomyperforms.Thistypeofcorrelationriskisverymuchthesametypeofriskastheriskofcreditconcentrationwithinanindustryorwithina geographical region of a country. All of these correlation risks can bereasonably measured by statistical means. But country risk has an additionaldimension. The possibility exists that all firms, individuals, and governmentbodieswithinagivencountrywillbeprohibitedfrommeetingtheircontractualobligations. This can arise from the imposition of exchange controls by thegovernment as a defensive measure against adverse currency flows, or fromgovernment renunciation of foreign debts, or from disruption of normalcontractualrelationshipsduetowarorrevolution.Thisformofriskrepresentsamajorpoliticaldiscontinuitythatstatisticalanalysisofhistoricaleconomicdatawill shed little light on. It can best be quantified by looking at the extent ofdamageinpastincidentsofpoliticaldisruptioninothercountriescombinedwithsubjective assessment of the likelihood of occurrence based on economic andpolitical insights into the current conditions within a particular country. SeeBouchet,Clark,andGroslambert(2003).UsingMonteCarlomethods todesigncreditportfoliostress tests,parallel to
thediscussion inSection7.2.3, is specificallyaddressed inBreuerandCsiszar(2010,Sections3.3and3.4).
13.3.3ComputationalAlternativestoFullSimulationPortfoliocredit riskanalysisdoesnothave thesameneedforrapid turnaroundthat models used for trading liquid instruments do. Changes in the portfoliooccur more slowly, you don't need to respond to the needs of a trading deskrequiringanup-to-datepictureatthestartofeachtradingday,ortocontributetothedailyVaRmarketriskcalculations.Sothereismuchgreatertoleranceforfullsimulation runs that may require many hours or even a few days to producestatistics. Even so, there will be a desire to see the impact of alternativestrategiesinbuildingthecreditportfolioorinbuyingprotectionthatmayneeda
speedierapproximationtoaccommodatemultipleruns.Anddefinitelytheneedto produce marginal risk analysis for the impact of a proposed new loan,discussedinSection13.2.4,willrequireafastapproximationtechnique.Fortunately,approximationscaneasilybe testedforaccuracyagainst thefull
simulation,followingtheprescriptionsofSection8.2.5.Andfortunatelyagreatdealofclevermathematicshasbeendevelopedtoproducegoodapproximationsinreasonabletime.Muchofthisworkhasbeeninsupportofcreditderivatives,such as CDOs, which are traded in a market environment and have an evengreaterdemandforquickestimation,aswewillseeinSection13.4.2.But,sincefull simulation models for portfolio credit risk and for CDOs are virtuallyidentical,portfoliocreditriskcanbenefitfromthesequantitativeadvances.Thetwomostimportantideasthathavebeenintroducedforapproximatingfull
simulationsare the largehomogeneousportfolio (LHP) approximation and theVasicekmodelthatutilizesonlyasinglefactortodrivecorrelationrelationships.The LHP approximation looks very similar to the approach to simulation
modeling of large numbers of very small loans discussed in Section 13.3.2.Loans are grouped by common characteristics (this could include industry,geography, credit rating, estimated probability of default) and each group issimulatedasifitwereasingleloan,butinsteadofbeingrepresentedbyjusttwostates (default or nondefault), the representing state is the percentage of loanswithinthegroupthathavedefaultedasofagiventimestep.Withineachgroup,the loans are treated as homogeneous (i.e., all having the same defaultprobabilities, LGD probabilities, and default correlations with loans in otherclasses).Thenumberof loanswithineachclass is treatedas largeenough thatthe class can just be represented by an overall percentage of default withoutworryingabout theactual sizesof individual loanswithinacategory.The lessequaltheloansizesare,thelessaccuratethisassumptionwillbe;forexample,iftherewereoneverylargeloan,itsdefaultwouldcauseajumpinthepercentageof defaults for the category. The fewer categories you use, the faster thesimulationwillrun,butthelessaccuratetheapproximationtothefullsimulationmodelwillbe.TheVasicekmodelutilizesonlyasinglefactor,roughlycorrespondingtothe
stateof theworldeconomy, todrive the simulation.This isobviouslyamajorapproximation, since much of the detail of correlation relationships based onindustry-specific and geography-specific factors will now be lost. But theresulting simplification allows calculations to be performed by much quickernumerical integration methods, as opposed to simulation; see Schonbucher

(2003,Section10.4.3)fordetails.Evenincaseswherethedecisionistorelyona fuller simulation for risk reporting, thismuch fastercalculationallowsquickestimation of sensitivities to input variables that can be valuable for buildingintuition for portfolio managers. The Vasicek model is a particularly usefulapproximation for building intuition because of its strong emphasis on theseparation of systematic risk and idiosyncratic risk, as we will see in thefollowingpages.EvenquickernumericalintegrationcanbeachievedbycombiningtheVasicek
modelwiththeLHPapproximation.Themostfrequentlyencounteredversionofthis combination also assumes a Gaussian copula (see Section 13.3.1) for thecorrelations.Thisversion,thenowinfamousLimodel(seeSection5.2.5.3),hasbeenwell documented, for exampleHull (2012,Section23.9)orSchonbucher(2003,Section10.4.4),aswellastheoriginalLi(2000).TheVasicekmodeloperatesbykeepingtrackofalldefaultcorrelationsusinga
single common factor and calculating losses corresponding to each possiblevalueofthiscommonfactor.Tyingcomputationstothiscommonfactor,whichcouldbethoughtofasthestateoftheeconomyor,formortgageportfolios,thelevel of housing prices, is what makes the Vasicek model so appealing forgaininganintuitivegraspoftheimpactofsystematicrisk(wewilldiscussthisfurther in Section 13.4.4). What makes computation so easy is that allidiosyncraticriskisincorporatedthroughasimpleformulaappliedtoeachlevelofthecommonfactor.Wewillquicklylookathowthisisdone.Since the portfolio is assumed homogeneous, there are only three input
variables to describe the underlying credit portfolio of theCDO: the expecteddefaultpercentageofthisportfolio,D;therecoveryrateintheeventofdefault,R; and the correlationbetweenchanges in assetvalues, ρ.All theother inputsreflectthestructureoftheCDO—theattachmentanddetachmentpointofeachtranche.Themodelassumesthateachindividualcredithasassociatedwithitastandard
normallydistributedvariablexithatreflectsthedistancetodefaultofthecredit.Thereisathresholdvaluesuchthat,ifxigoesbelowthethreshold,defaultwilltakeplace.SinceweknowthattheprobabilityofdefaultofeachcreditisD,thisthresholdmustbeN−1(D),whereNisthecumulativestandardnormaldistributionandN−1isitsinverse.Thevariableximaybewrittenas:
whereM is a common factor affecting all defaults andZi is a factor affecting

only credit i. The variable M and all the Zi variables are assumed to haveindependent standard normal distributions, so that the relationship assures thatallpairsofcreditshaveacorrelationofρandthatallxivariableshaveastandardnormaldistribution.The probability of default of any individual credit is xi < N−1(D), which
becomes
or
sothattheprobabilityofdefaultis:
ThenextstepistonumericallyintegrateovermanydifferentpossiblevaluesofM. For each one we can calculate the percentage of total defaults, whichmultipliedby(1–R)givesthepercentageoftotallosses.Wecaneasilycalculatethe lossesdue toeach tranche,utilizing theattachmentanddetachmentpoints,correspondingtoeachvalueofM.WemakeuseoftheLHPassumptiontotreattheselossestimatesasexact(giventhevalueofM),ratherthanjustthecentralpoint for a probability distribution.We thenuse the probability distributionofthevaluesofMtoinferprobabilitydistributionofthetranchelosses.The assumption of a Gaussian copula is not at all necessary for the quick
numerical integration technique towork; seeO'Kane (2008,Sections21.5 and21.6) and Schonbucher 2003, Section 10.8.2) for examples. Similar, butmorecomputationallyintense,integrationscanbeusedformultifactorapproximations(seeSchonbucher(2003,Sections10.4.5and10.4.6).TheCDOspreadsheetonthewebsiteforthisbookwillallowyoutoexperimentwithaVasicekmodelthatuses the LHP approximation but with several choices for the copula. O'Kane(2008,Sections16.4and18.6)analyzestheaccuracyoftheseapproximations.TheLH+modelisaninterestingcompromise(seeO'Kane2008,Section17.3).
It's a Vasicekmodel that uses the LHP approximation for the entire portfolioexcept for a single loan that is individually modeled. It can still make itscomputationsusingafastnumericalintegration,butasO'Kanesays,it“allow[s]ustounderstandtheinterplaybetweenthecharacteristicsofthesinglecreditandthose of the overall portfolio.” This can obviously be very valuable whenmakingdecisionsabouthowtoplaceaninternalpriceonanewloanorwhethertobuycreditprotectionagainstanexistingone.
AlternativestotheLHPassumptioncanachievespeededapproximationwhileretainingmoredetailaboutthestructureofindividualloanswithintheportfolio.O'Kane (2008, Chapter 18) provides a good overview of these approximationtechniques.Agoodstartingpointforlearningaboutthesemodelswould beHull andWhite (2004),which is particularly clear in its exposition,presents two models that are relatively easy to implement, and providesreferences and comparisons to other similar approaches in the literature. Bothmodels work with individual loan data and utilize recurrence relationships inplaceofMonteCarlosimulationforcalculation.Thefirstcalculatesprobabilitiesof exact loss percentages from the recurrence relationships using Gaussianquadrature. The second approximates the chances of losses falling into user-specifiedprobabilitybuckets.Twootherwell-knownmodelsalongcomparablelines are Andersen, Sidenius, and Basu (2003), which also provides manyreferencestosimilarapproaches,andLaurentandGregory(2003),whichutilizesafastFourier transform.Bluhm,Overbeck,andWagner (2002,Chapter4) isagood exposition of the commercially availableCreditRisk+model that utilizesrecurrencerelationshipsandprobability-generatingfunctionsinplaceofMonteCarlo simulation. Since credit risk calculations are focused on occurrence ofdefault,which isa low-probabilityevent, improvements inaccuracyrelative tocomputationtimecanbegainedutilizingimportancesampling,atechniquethatfocusesmoreofthesimulationpathsonthoseprobabilityregionswheredefaultismore likely to occur.Glasserman andLi (2005) is a keypaper in this area.Glasserman (2004, Section 9.4.3) covers similar material. Giesecke andShkolnik(2011)isarecentcontributionandprovidesmanyreferencestosimilarapproaches.
13.3.4RiskManagementandReportingforPortfolioCreditExposures
Atraditionalbankmanagingalargeportfolioofcreditriskwillneedtofindtheproper balance between the illiquidity of much of its portfolio and the liquidinstruments thatcanallow it tomanagesomeof its risk.On theonehand, theilliquidityofsomeborrowersandthesizeofexposurestoevenliquidborrowerswill preclude any chance of using liquid instruments to eliminate all of theexposure.On the other hand, a combination of loan sales, purchases of creditinsurance throughCDSs, and packaging of some credit in CDOs does permitsomechoicesonthecompositionoftheportfolio.

Choicesaboutsalesofexistingloansorpurchasesofcreditinsuranceagainstcurrentpositionsarenottheonlytoolsavailabletoacreditportfoliomanager.Akey tool is the internalpricing for takingonnewcreditexposure.Whencreditmanagers have a more favorable view of the credit prospects of a particularborrower than themarketdoes, theywill convey this to the firm's relationshipmanagers by quoting internal prices that reflect narrower credit spreads thanthosequotedintheCDSmarket.(Thesamewillapplyforparticularclassesofloanswherethecreditmanagers'viewofthecombinationofdefaultprobabilityand LGD is more favorable than is reflected in the market.) As we noted inSection 13.2.1, it is important that the views of the firm's creditmanagers bechallengedwhentheyaremorefavorablethanratingsagenciesormarketpricesimply, but when the credit managers' judgment is sustained after such achallenge,itisanappropriatestrategyforthefirmtoencouragesuchlending—itmayverywellbethatlongexperiencewithparticularborrowersorindustriesorparticularexpertisegivesthefirmanedgethatitshouldbetakingadvantageof.Conversely,whenthefirm'screditmanagershavealessfavorableviewofthe
creditprospectsofaparticularborrowerthanthemarketdoes,theywillwanttodiscouragerelationshipmanagers fromextendingnewcredit.But thisdoesnotnecessarilyinvolvequotinginternalpricesthatreflectwidercreditspreadsthanthose quoted in the CDS market. To the extent that the CDS market for theborrowerisliquid,theinternalquotemayjustreflecttheCDSspread,withthecreditmanagers intending to purchase CDS protection against any new creditextensionstotheborrower.Butthisstrategymustbeaccompaniedbysometypeoflimitontheamountoflendingthatcanbeofferedatthismarketprice,gaugedtotheliquidityofthemarket.Internalpricequotesmorefavorablethanmarketquotesarenotconfinedtothe
situationinwhichcreditmanagershaveafavorableviewonaborrower.Itmayalso reflect the composition of the firm's credit portfolio. If lending to aparticular borrower offers diversification of the portfolio, perhaps in terms ofindustryorgeography,thismaygetreflectedinalowerinternalpriceforcreditthanthemarket.Andconversely,iflendingtoaparticularborrowerwilladdtoexisting portfolio concentrations, the credit managers may quote an internalpriceequaltothemarketpriceandplantooffsettheloanwithCDSprotection,evenwhen they have amore favorable view of the borrower than themarketdoes. This approach clearly requires reporting from the credit portfoliomodelthat can assess themarginal impact new lending to a particular borrowerwillhave on the firm's overall credit risk. We will address this information need
shortly,whenwediscusscreditportfolioreportingrequirements.Given our discussion of the large differences between actual and market-
implied default probabilities toward the end of Section 13.2.1.2, one mightsuspect that this wouldmotivate relationshipmanagers to prefer internal loanpricing tomarket loan pricing. Inmy experience, this does not turn out to bemuchofafactor.Thereasonisthattheinternalpricing'schargeforcapitalusageis roughly equal to the difference between default experience and market-implied probabilities. Looking at Table 13.5, you can see that the differencebetweenaverage andworst-casedefault experience is greater than the averagedefault experience for every credit rating above B. Since allocated capital isroughly comparable to this difference, and since charges against earnings forcapital allocations are on the order of 15 percent per year, you can see thatinternalpricingisunlikelytolookmorefavorablethanmarketpricingjustbasedonthisfactor.Rather,itisdifferencesbetweenmarketandinternalassessmentsofcreditqualityforagivennameandportfoliocompositionconsiderationsjustdiscussedthatusuallydrivepreferencesbetweeninternalandmarketpricing.Risk reporting forportfolio credit risk is similar to risk reporting formarket
riskVaR, andmanyof the recommendations of Sections 7.1.2 and 7.3 can befollowedwith littlemodification.ThereportingofVaRatdifferentpercentiles,theuseofshortfallVaRasanalternativetoVaRtobettercapturetailriskandtoavoid issues of instability and negative diversification effects, the reporting ofexposuresbyproductandbusinessline,andtheuseofbothmarginalandstand-alonemeasuresofriskallcarryoverquitewelltoportfoliocreditrisk.Reportingofexposuresbyproductandbusinesslinewillhelptoidentifylinesofbusinessthatshouldbeexpandedorwhosegrowthmayneedtobeslowedandtoidentifyprioritiesforpartsoftheportfoliothatrequirehedgingthroughloansales,CDSs,and CDOs. More thoughts along these lines will be found in the section on“ImprovingPortfolioPerformance”inBohnandStein(2009,Chapter8).Inmakingdecisionsamongcompetingpriorities forportfoliohedging,credit
managerswillneed toconsider the risksofdelaynot just in termsofpossibledefaults,butalsointermsofratingsdowngradesandwideningofmarketcreditspreads. So, while I would still insist on the illiquidity of credit portfoliosrequiringoutputbasedoneventualdefaults(seeSection13.3.2),outputbasedonthe impactof changes inmarketvalue is alsoneeded.Thisoutput should alsoinclude reports on market value sensitivity to shifts in the economicenvironment, along the lines of the sensitivity measures for liquid creditdiscussed in Section 13.1.3. O'Kane (2008, Section 17.2) has an extensive

analysisofsensitivitymeasures forcreditportfolio risk in thecontextofCDOtranches,whichwillbediscussedinSection13.4.3.Thecaveatsaddressedthereabout the limitations on the usefulness of these sensitivity measures due toilliquidityofcreditmarketsalsoapplyhere.One major difference between market risk VaR and credit portfolio risk
modelsistheneedtomeasurethemarginalriskcontributionofindividualloans,in line with our previous discussion. No marginal measure that is this fine-grainedisrequiredformarketrisk.Sinceitwouldbecomputationallyinfeasibletogeneratethisinformationbyrunningthefullsimulationforeachloan,findingcomputational shortcuts, addressed in Section 13.3.3, is critical for creditportfoliomodeling.
13.4RISKMANAGEMENTOFMULTINAMECREDITDERIVATIVES
13.4.1MultinameCreditDerivativesMultinamecreditderivativesarebasketsthatbundletogethercreditexposuretoseveraldebt issuers intoasingle instrument.Fromthesideofcreditprotectionsellers,theseinstrumentsofferanopportunitytoobtainexposuretoadiversifiedbasketofcorporatedebt—itcanbequitedifficultforaninvestortoputtogethersuch a basket on his own, owing to the relative illiquidity of corporate bondmarkets.Soamarketmakerwhohastheabilitytosourcesuchabasketofdebtcangetpaidagoodspreadforsellingitinaconvenientform.Fromthesideofcredit protection buyers, these instruments offer a chance to offset portfoliocreditriskandcanplayasignificantroleinthemanagementofportfoliocreditexposurediscussedinSection13.3.4.There are several forms such credit baskets can take. One that has become
particularlypopularistocreateaderivativetiedtoacreditmarketindexsuchastheCDXand iTraxx indexes (see the discussion inHull (2012,Section 24.3).Since these indexes are calculated and disseminated in a very publicmanner,theyprovidegoodtransparency.Aspreadisset that thecreditprotectionbuyerwillpaytothecreditprotectionseller.Everytimeoneofthecomponentsofthebasketdefaults, settlement ismadeon thatportionof thebasket, following thesame rules as settlement of individual CDSs (with a strong bias toward cashsettlement). The choice of index components has been designed to balance
liquidity of individual names and diversity of credit exposure.Many differentstrategies for expressing views on relative credit spreads and achievingprotectionagainstexistingcreditriskscanbeobtainedthroughcombinationsoflongandshortexposurestodifferentcreditindexesandindividualCDSs.Marketmakers will also construct more tailored indexes for clients with particularneeds.As longas all credit protection sellers in a credit basket share equally in all
cash flows (both receipt of credit spread and payment of default losses), thecreditbasketisjustasimplesummationofthepricingofindividualCDSsandsoshouldbe riskmanaged following the principles ofSection12.4.1.1; there aresometechnicalbasisriskissuesthatcreatedifferencesbetweentheindexbasketand a portfolio of the individual CDSs comprising the basket—these arewellcovered inO'Kane (2008,Chapter10).But a frequentvariant is to structure acreditbasketintotranchesthatreceivedifferentportionsofthecashflows.Themotivationforthisstructuringisthatdifferentclassesofinvestorshavedifferenttolerance for credit risk and different institutional restrictions on the type ofcredit risk they can invest in, and the object is to design a structure thatwillbetterfitdemand.SomeCDOsarestructuredthisway,butothersarejustsingletranches(called
synthetic tranches) that havebeenagreed tobetweena credit protectionbuyerand a credit protection seller with an agreed reference portfolio. Creditprotectionbuyersmayenterintothesesingletrancheseitherasawayofbuyingprotectionagainsttheircreditexposureinapiece-by-piecefashionorinordertoexpress a particular view on credit risk.Credit protection sellersmaywant toexpress a particular view on credit risk or offset previously purchased creditprotectiontheynolongerneed.Themodelingandriskmanagementoftranchesis very similar,whether they arose as part of a credit basket or as a synthetictranche, though there are somedifferences in payment details thatwill impactmodeling;seeO'Kane(2008,Section12.5).Tranches of CDOs are structured by designating an attachment point and a
detachmentpoint.Forexample,atranchewithanattachmentpointof7percentand a detachment point of 10 percent would not have to make any defaultpaymentsuntildefaultlossesinthebasketexceed7percentofnotionalprincipalandthenwouldpayalldefaultlossesuntildefaultlossesinthebasketreach10percentofnotionalprincipal,afterwhichtimethetranchenolongerexists(itisno longer receiving any credit spread payments and does not owe anyobligations on any possible future defaults). In between 7 percent and 10

percent,every timeadefault takesplace,settlement ismadeon thatportionofthe tranche, with credit spread payments on that portion ceasing. By marketconvention,creditspreadspaidtotheprotectionsellerofatranchearequotedaspercentagesof theportionofnotionalprincipal that thesellercouldpotentiallylose.Forexample,ifaninvestorsells7percentto10percentcreditprotectionona$100millionbasket,his largestpotential losswouldbe$100million(10%–7%)=$3million.Ifhiscreditspreadisquotedat3.47percent,hewillreceive3.47%$3million=$104,100peryearuntilsuchtimeasdefaultlossesexceed7percent.StandardizedtrancheshavebeencreatedforboththeCDXandiTraxxindexes(seeHull,Table24.6).Thetranchethatwillreceivethefirstlosses,thetranchewith 0 percent attachment point, is called theequity tranche (since itsabsorptionoflossespriortoanylossesimpactingothertranchesissimilartotherelation between the equity investors in a corporation relative to the debtholders).Thetranchewiththehighestattachmentpointiscalledthesuper-seniortranche(sinceitsexpectedlossesareusuallyevensmallerthanthehighest-ratedAAA corporate debt). Intermediate tranches are calledmezzanine tranches forthosewith lower attachment points and senior tranches for those with higherattachmentpoints.Tranchingcashflowsfromacreditbasket introducesanewtypeof risk that
didnotpreviouslyexistinthebasket—exposuretodefaultcorrelation.Thiscanbeillustratedbyasimpleexample.Supposeyouhaveacreditbasketonwhichyourexpecteddefaultlosses,netofrecovery,overitsfive-yearlifeare3percentofprincipal.Ifyouassumeaverylowlevelofcorrelationbetweendefaults,thenalmostallscenarioswill involvesomegroupofcompaniesdefaultingandveryfewwill involvea largenumberdefaulting.Soa0percent to3percentequitytranchewill almost always lose close to itsmaximum and a 15 percent to 30percentsuper-senior tranchewillexperiencezero losses.Bycontrast,ataveryhigh level of default correlation, some scenarioswill involve almost no losseswhile some will incur very heavy losses. So a 0 percent to 3 percent equitytranchewill sometimes lose less than themaximum and so have lower lossesthan under the low correlation assumptionwhile the 15 percent to 30 percentsuper-seniortranchewillsometimesexperiencelossesandsohavehigherlossesthanunder thehighcorrelationassumption.Thispatternalwaysholds—highercorrelationmeanslowerlossesforanytranchewitha0percentattachmentpointand higher losses for any tranchewith a very high attachment point, but youcan'ttellinadvanceofdetailedcalculationshowanintermediatetranchewillbeimpacted.

One variant of tranching CDOs is to allocate losses based on number ofdefaults rather than on the percentage of losses in the portfolio. It is called adefaultbasket. For example, a first-to-default tranche absorbs all the losses ofthefirstcreditinabaskettodefault(ifany)butlosesnothingonanysubsequentdefaults. Default baskets make sense only when based on a relatively smallnumber of individual credits, anywhere form 2 to 10. O'Kane (2008, Section12.2) explains the mechanics and basic economics of this product. While itsmodelingand riskmanagementareclosely related to thoseof standardCDOs,LHPapproximationsdonotmakesense,giventhesmallnumberofcreditsintheunderlying portfolio and the digital nature of loss allocation. Approximationmethodology such as the first of the two models in Hull and White (2004),referencedinSection13.3.3,aremoreappropriatefordefaultbaskets.More complex variants of CDOs, such as CDO-squareds, constant
proportional debt obligations, and options on tranches, will be covered onlybrieflyaspartofthenextsectiononmodelingofmultinamecreditderivatives.
13.4.2ModelingofMultinameCreditDerivativesThe modeling of multiname credit derivatives is extremely similar to themodelingofportfolio credit riskcovered inSection13.3. Indeed,manyof thetechniquesdiscussed therewereoriginally developed in support of analysis ofCDOs and CDO tranches. This is not surprising, since multiname creditderivativesrepresentanattempttoprovideamarketforthetransferofportfoliocreditrisk.A first-cut sketch of themodel for amultiname credit derivative instrument
would therefore be to start with the portfolio of credits that comprise theunderlyingbasketreferencedbytheinstrument,modelthelossesinthisportfoliousingthetoolsofSection13.3,andinthismodelingkeeptrackofwhichlossesaccrue towhich tranches.You can see a simple illustration for a single-factorVasicekmodel in theCDO spreadsheet on thewebsite for this book.At eachlevel of the single factor that drives the correlation between defaults ofunderlyingcredits,thespreadsheetkeepstrackofhowmuchlossaccruestoeachtrancheoftheCDO.Itistheneasytocomputeafullprobabilitydistributionofthelossesforeachtranche.AnexpositionofthissimplemodelcanbefoundinO'Kane(2008,Section16.2)alongwithananalysisof thesensitivityofmodelresultstoinputparametersinSection16.3.Inpractice,theallocationoflossestotranchesmayfollowcomplexrules.This
is particularly true for tranches of CDOs based on mortgage securities. Somodelingoftranchelossesrequiresmoresophisticationinthesimulationofeachindividual path. Smithson and Pearson (2008) addresses this issue. Morecomplexmultinamecreditderivativesmayrequiremoredetailedmodelingoftheevolutionoflossesovertime.O'Kane(2008)givesabriefintroductiontotheseproducts(constantproportionaldebtobligationsinSection22.3,forward-startingtranchesin22.6,andoptionsontranchesin22.7)alongwithanintroductiontothemoredetailedmodelsofevolutionoflossesinChapters23and24.Aproductthatbecamepopularintheexplosionofsubprimemortgage–based
CDOswasthemultilevelCDOinwhichtranchesofdifferentCDOsarebundledtogether to form a portfolio that can itself be tranched, called aCDO-squared(andthisprocesscanberepeatedtoformaCDO-cubed,andsoon).Thesamefundamentalmodelingapproachcanbeutilizedasforsingle-levelCDOs,modelinglossesandkeepingtrackofwhichlossesaccruetowhichtranches and tranches of tranches. However, the computational intensity ofkeepingproper trackof thiswaterfallmayrequirenew techniques forefficientapproximation. O'Kane (2008, Section 22.4) is a good introduction to theseproducts and their modeling. As O'Kane illustrates in Figure 22.4, CDO-squareds have tremendous sensitivity—very large changes in the losses totranchesdue toverysmallvariations in losses to theunderlyingcredits. In thewakeofthe2007–2008crisis,whenagreatmanyAAA-ratedtranchesofCDO-squareds of subprime mortgages suffered close to 100 percent losses, theseproducts came in for harsh criticism as vehicles for inappropriate levels ofleverage. It is doubtful that we will ever see a revival of interest in them (aparallelstorytothepoweroptionswhoseunsuitableuseintheearly1990sledtothevirtualdeathoftheproducteversince—seethediscussiontowardtheendoftheintroductorysectioninSection12.1).Credit portfolio managers are typically dealing with just a single firmwide
portfolio.Bycontrast, traders inCDOsandothermultinamecredit derivativesaretypicallydealingwithalargenumberofdifferentreferenceportfolios.Thismakes computational alternatives to full simulation, which we covered inSection 13.3.3, even more critical to CDO traders than they are to creditportfoliomanagers.AswealreadynotedinSection13.3.3,itwasinthecontextof CDO modeling that many of these computational alternatives were firstdeveloped.ItalsomeansthatCDOtraderswilltypicallyhaveafarlessintimateknowledge of the characteristics of any particular reference portfolio they aredealing with than a credit portfolio manager will have of her portfolio. This

should raise a note of caution concerning the accuracy of CDOmodeling, towhichwewillreturninthenextsectiononCDOriskmanagement.AcriticaldifferencebetweencreditportfoliomodelingandCDOmodelingis
that CDO modelers will frequently be trying to fit to market data on wheredifferentCDOinstrumentsaretrading.TheonlymarketdatathatwasconsideredinourdiscussionofcreditportfoliomodelinginSection13.3wasmarketdataonindividual credits; all input on relationship between defaults of differentborrowerscamefromstatisticsandsubjectiveprobabilities.WhileCDOtradersand risk managers must also be aware of the implications of statistical andsubjectiveestimates,inputfrommarketsisvital.Let's consider a typical situation. A trading desk is asked to price a
nonstandardtrancheonaparticularportfolio(bynonstandard,wemeanhavingdifferent attachment and detachment points from more commonly tradedtranches).Thedeskcanobtainmarketpricesforstandardtranchesonthesameportfolio. To price the nonstandard tranche, the traders would like to fit theparametersofapricingmodeltocorrectlypriceallofthestandardtranchesandthen apply the model to a nonstandard tranche. This very closely fits theinterpolationmodelapproachofSections8.2.6.1and8.3.Itwouldbeconvenientifasimplemodel,suchastheLimodel,couldfitthestandardtrancheprices,butthis is virtually never possible. The reasons why sound very much like thereasons we discussed in Section 11.6.2 for why a single implied volatility isunlikelytofitmarketoptionspricesforseveraldifferentstrikes.For vanilla options, as we saw in Section 11.6.2, it is partly because of
different market supply and demand pressures for different strikes, and it ispartly because some of the assumptions of the Black-Scholes model areincorrect. The story is similar for CDOs. Tranches with very low attachmentpoints (equity tranches) and trancheswith very high attachment points (super-seniortranches)arefarlesspopularwithbuyersofcreditriskthanaretrancheswithintermediateattachmentpoints(mezzaninetranches).Wediscussedsomeofthe reasons for this in Sections 5.2.2 and 5.2.5, in the context of CDOs ofmortgages; similar reasons apply to CDOs of corporate loans. As for modelassumptions, the assumption of a Gaussian copula is often contradicted byhistoricaldata(seeSection13.3.1).There are two basic approaches to fitting market prices for tranches. One
focusesonfindingamodelthatmoreaccuratelyreflectsstatisticalrelationshipsbetween defaults; the second focuses on pragmatically changing modelparameterstoachieveafit.Thefirsthastheadvantageoftryingtobuildinmore
economicrealityandsoislikelytobeamorerobustmodelthanonethatjustfitstoprices.But the first has thedisadvantage that even themost realisticmodelmaynotbeabletoaccountforsupplyanddemandforcesinthemarket.The more pragmatic approach of just fitting market prices is a very close
analogue to utilizing volatility smiles and skews in fitting option prices;whateversupplyanddemanddictatesdeterminestheimpliedvolatilityinputforeachstrikeandtenor,andoptionsthatcan'tbedirectlypricedinthemarkethavetheir volatilities interpolated from those that aredirectlypriced, as inSections11.6.1and11.6.2.TheanalogousmethodforCDOsiscalledimpliedcorrelationskewtoparalleltheimpliedvolatilityskew.O'Kane(2008,Chapter19)explainsthisapproachindetail.Tomakethefittingmoremanageableandarbitrage-free,it is extremely helpful to do all fitting to base tranches, tranches with anattachmentpointof0(i.e., tranchesthatabsorball lossesuptothedetachmentpoint). This approach, known as base correlation, is explained in detail inO'Kane (2008, Chapter 20). Standard base tranche prices can always beconstructeddirectlyfromstandardtrancheprices(e.g.,a0percentto10percentbasetrancheisjustthedirectsummationofa0percentto3percenttranche,a3percent to 7 percent tranche, and a 7 percent to 10 percent tranche). Thisapproach closely parallels one that has been in use for years in the vanillaoptionsmarket,whereall fittingofvolatilitiesby timeperiod isdone for timeperiods starting at the current date; this avoids interpolations that producenegativeimpliedvolatilitiesandmakesforsmootherfits.The more fundamental approach of finding a model that more accurately
reflects statistical relationships has a vast multitude of candidate models—atleastasmanyas thedifferent ideasonalternativecopulasdiscussed inSection13.3.1.O'Kane(2008,Chapter21)addressessomeofthemorepopularchoicesforcopulas,anddiscussesissuesofcalibrationandcomparisonbetweenmodels.
13.4.3RiskManagementandReportingforMultinameCreditDerivatives
Wewill beginwith twopolarviewsof riskmanagement and related reportingrequirements formultinamecreditderivativesand thenseehow the twoviewscanbeblended.Atoneextreme,wewillfocusonthefact thatholdingaCDOposition is very similar to holding a credit portfolio position, so the riskmanagement should look very similar to the approach to riskmanagement ofportfoliocreditgiveninSection13.3.4.Attheotherextreme,wewillfocuson

the greater liquidity of credit derivatives and look to a risk managementapproachcloser to that forother liquidderivatives inSections11.4and13.1.3.Whichapproachwillhavethegreaterweightinablendedviewwilldependalotonjusthowliquidthemarketisformultinamecreditderivatives.Even ifwebelieved thatmultinamederivativeswerecompletely illiquid,we
wouldstillneedtomodifytheportfoliocreditriskapproachofSection13.3.4toaccountforthefactthatinaderivativesbookyourpositionsencompasssalesofcreditportfoliosaswellaspurchases.Butthebasicprinciplewouldremainthesame:simulatedefaultlossesallthewaytothematurityofpositionsandlookatthe full distribution, both expected losses and tail losses. But there are a fewadditionalpointstobeconsidered:
Somecreditsmaybereferencedinmultipletranches.AndformultilevelCDOproducts,suchasCDO-squareds,thesametranchemaybereferencedinmultiplehigher-leveltranches.Thesimulationenginemusthavethecapabilityofidentifyingthesemultiplereferencesandtreatingthemproperly;theymustshow100percentcorrelationondefaults.TradersinCDOtrancheswilloftenlackthedetailedknowledgeaboutindividualunderlyingcreditsthatacreditportfoliomanagerwouldhaveforcreditsoriginatedinthefirm.ThecreditportfoliomanagermightstilluseafastersimulationmethodsuchasanLHPapproximation,asaddressedinSection13.3.3,buthasthecapabilityofcheckingtheaccuracyoftheapproximationbyoccasionalcomparisonofresultstoafullsimulation,andthenadjustingriskreportstoreflecttheaccuracyoftheapproximation.ACDOtradingdeskmanagerusingthesameLHPmethodologymaylackthedetaileddataonindividualunderlyingcreditsthatwouldallowtheaccuracyoftheapproximationtobechecked.Somealternativemeansofadjustingriskreportsfortheinaccuracyofapproximationmustbedesigned,suchassimulatingseveraldifferentpossiblespecificationsforthedataonunderlyingcredits,calculatingtheapproximationerrorthateachwouldleadto,andbasingaconservativeestimateofapproximationerrorontheseresults.Someadjustmentinprobabilitydistributionswouldalsobeappropriatetoreflectthelowercertaintyregardingestimatesofdefaultprobabilitiesandlossgivendefaultthatisassociatedwithlessdetailedknowledgeofindividualcredits;comparewithRajan(2010,128–129).
AtraderdealinginliquidCDOtrancheswouldwanttostartwithasetofriskmeasures and limits that looked a lot closer to thoseofSection13.1.3,with a

focus on exposure to changes in market credit spreads, but supplemented bymeasuresofconvexityexposuretolargejumpsincreditspreadanddefault.Butthiswouldneed tobemodified to takeexposure tocorrelation intoaccount. Ifthetranchesaretrulyliquid,thenitshouldbepossibletomanagecorrelationriskinamannerveryclose to themanagementofoptionrisk inSection11.4,withmeasuresofexposuretochangesincorrelationlevelsaswellaschangesintheshape of the correlation surface (by time bucket and attachment point) and tojointchangesincreditspreadandcorrelations.O'Kane(2008,Chapter17)hasadetaileddiscussionofriskreportingfollowingthisapproach.Thereportingandriskmanagementofamultinamecreditderivativeportfolio
needsablendofthesetwoapproaches,basedonactualdegreeofliquidity.Butnomatterhowliquidthederivativesintheportfolio,someweightshouldalwaysbe given to the approach of Section 13.3.4, since this is the approach bestdesignedtodealwith the impactofdefaults.This isaparallelpoint to theonemadeinSection13.1.3onriskmanagementandreportingforsingle-namecreditinstruments; the extreme difference between exposure to credit spreadmovementsandexposuretodefaults,illustratedinSection13.1.2.2,necessitatestwodifferentreportingframeworks.WhateverapproachisbeingtakentoriskmanagementofCDOs,thereneedsto
be a strong awareness by both traders and risk managers of the extremesensitivity of some CDO tranches to systematic risk and to changes inassumptions.Thiswillbehighlightedinthenextsection.
13.4.4CDOTranchesandSystematicRiskAmongthegeneralprinciplesforriskmanagementinSection6.1.1wastheneedfor riskmanagers to carefully distinguish between systematic (undiversifiable)andidiosyncratic(diversifiable)risks.Earlierinthischapter,wenotedthestrongimpact of systematic risk on the pricing of credit exposure (Section 13.2.1.2).This becomes a particularly important issue for the most senior tranches ofCDOs,becausetranchinghastheeffectofconcentratingtheidiosyncraticriskofthe reference portfolio in the more junior tranches and concentrating itssystematic risk in the more senior tranches. This effect becomes even morepronouncedfor thesenior tranchesofCDO-squaredproducts.These issuesareverycogentlyanalyzedinCoval,Jurek,andStafford(2008).Oneway tounderstandwhy thishappens is tosee that thereare likely tobe
somedefaults in thereferenceportfolioregardlessof thestateof theeconomy.

Sotheamountoflossinthetranchesthatabsorbthefirstlossesislikelytobeasdependentontheidiosyncraticriskarisingfromexactlywhichcreditsareintheportfolioasitisonthestateoftheeconomy.Butlosseswillreachtheveryseniortranchesonly insituationswhere thecommoneconomic factorsuffersamajornegativeevent.Ausefulanalogywouldbeaputoptionpurchasedasprotectionagainsta largedeclineinastockindex;itwillpayoffonlyif thereisasevereshock to the economy. But just as we saw in Section 11.6.2 that protectionbuyerstendtostronglybiduptheimpliedvolatilityonsuchputoptions,wecananticipate that senior tranchesofCDOsshouldbepricedat steeppremiums toexpectedlosses.Closelyrelatedpoints,highlightedbyCoval,Jurek,andStafford(2008), are that senior tranches have very high volatility of returns and verystrongsensitivitytomodelassumptions.AndallofthesepointsapplywithevenmoreforcetoseniortranchesofCDO-squareds.AswenotedinSection13.3.3,amajoradvantageoftheVasicekmodelisits
abilitytobuildintuitionconcerningtheallocationofsystematicrisktotranches.Exercise13.3,usingtheCDOspreadsheetonthewebsiteforthisbook,allowsyou to use the Vasicek model to generate measures of systematic risk andvolatilityfortranchesofaCDO.OnepointthatwillbemadeinthisexerciseisthatthereasonablenessofcorrelationinputstotheVasicekmodelcanbejudgedbycomparingmodelresults tohistoricaldefaultexperience,utilizingdatasuchasthatpresentedinTable13.5.
EXERCISES
13.1CalculatingdefaultratesfrombondratesUsingtheCreditPricerspreadsheet,beginwiththefollowinginput:
Risk-FreeZero-CouponRate RiskyParRate1 7.00% 8.00%2 7.50% 8.60%3 7.75% 8.90%4 8.00% 9.20%5 8.15% 9.40%
1.Solveforthedefaultratesandspreadstotherisk-freeparcurvethatcorrespondstothiscase.2.Changethelossgivendefaultto30percentanddoublethedefaultrates.Solvefortheriskyparbondrates.Howdoesthespreadtotherisk-freeparcurvedifferfromthatinthepreviousstep?Thisshowsthat it isnot just theproductofdefaultrateandlossgivendefault that impacts thevaluationofriskycashflows.

3.Assumethat thecompanywhoseriskyparratecurvewasshownpreviouslyalsohasafive-yearbondwitha9percentcouponthatispricedinthemarketat98.56.Assumingaconstantlossgiven default irrespective of the time at which default occurs, determine a unique loss givendefaultandasetofdefaultratesfromthis information.What if the9percentcouponfive-yearbondissellingat98.46?
13.2ComparingthejumpprocesscreditmodeltotheMertonmodel
1.RuntheMertonModelwithastockpriceof40,debtpershareof60,equityvolatilityof60percent,andtimetomaturityoffiveyears.Whataretheresultingprobabilityofdefaultandlossgivendefault?2.Run theJumpProcessCreditmodelwith the same stock price and equity volatility as youusedfortheMertonModelwitharisk-freerateof5percent,alossgivendefaultof60percent,anda standarddeviationof thedefaultbarrierof50percent.Trydifferent inputvalues for thedefaultbarrierlevelandseewhattheimpactisontheprobabilityofdefaultandthecreditspreadforafive-yearmaturity.3.Prepareananalysiscomparingthetwomodelsintermsoftheimpactonprobabilityofdefaultforchangesinthestockpriceandchangesintheequityvolatility.
13.3UsingtheVasicekmodelforriskmeasurementofCDOtranches
1. Set the CDO spreadsheet to run the Vasicek model with Gaussian copula (i.e., set all tailfactorsandcorrelationfactorsto100.00%).Inthisexercisewewill justbeexperimentingwithdefaultrates,sowewillnotreduceinputlossratesforassumedrecoveries.2.AssumethatyouhaveaportfolioofBbloans.UsingresultsfromTable13.5,settheinputlossrateto9.73%.Experimentwithdifferentinputcorrelationratestoseetheimpactonthestandarddeviation and 2.45th percentile losses for the portfolio.Notice that very low input correlationrates produce standard deviations and 2.45th percentile losses for the portfolio that lookunrealistically low relative to historical experience, and that very high input correlation ratesproduce the opposite effect (for example, a 1% input correlation rate produces a portfoliostandard deviation of 1.69% and a 2.45th percentile loss of 13.48%, while a 20% inputcorrelation produces a portfolio standard deviation of 8.31% and a 2.45th percentile loss of32.38%;Table13.5showsthehistoricalstandarddeviationofBbloandefaultstobe6.50%andmaximumlossoverany5yearperiodtobe23.44%).3. Through experimentation find an input correlation rate that produces reasonable resultsrelativetothehistoricalBbloandefaultstandarddeviationandmaximumloss.4.Continuingwiththisexample,experimentwithdifferenttrancheattachmentpointstofindonethatwillproduceexpectedlossesasapercentageof investment in themostsenior tranche(thetranchewith a 100%detachment point) roughly equal to thehistorical 0.27% loss rate forAaloansfromTable13.5.Thencomparethestandarddeviationoflossesand2.45thpercentilelossas a percentage of investment for this senior tranchewith the historical standard deviation of0.44% andmaximum loss of 1.83% forAa loans fromTable 13.5. You should see that eventhoughtheexpectedlossesoftheseniortranchematchhistoricallossesofAaloans,thestandarddeviationand“worstcase”lossesareconsiderablyhigherfortheseniortranchethantheyarefora portfolio ofAa loans. This illustrates the pointmade in Section 13.4.4 about the impact oftranchingonconcentrationofsystematicrisk.5.FurtherexerciseswiththeCDOspreadsheetcouldinvolveexperimentingwithattachmentand

detachmentpoints to try tocreate tranches thatmatchothercreditclasses in termsofexpectedlossasapercentageof investment.Youcanalsoexperimentwith the impactofcreating fattertailsthantheVasicekmodelbyusinginputtailfactorsandcorrelationfactorshigherthan100%.

CHAPTER14
CounterpartyCreditRiskCounterparty credit risk management arising from derivative contracts is anextremely important piece of the management of credit risk for reasonsdiscussedinSection14.1.Sincethefirsteditionofthisbookwaspublished,thefirstfull-lengthbooktreatmentofcounterpartycreditrisk,writtenbyoneoftheleading practitioners in this field, Gregory (2010), has appeared. I will bemakingfrequentreferencetothisbookinwhatfollowsandwillprovideseveralsuggestions for further reading inGregory thatwill provide greater detail andexamplesforpointsIwillraise.
14.1OVERVIEWForcreditrisk,derivativesrepresenta two-edgedsword.Ontheonehandtheyhavebeenvaluabletoolsinreducingcreditexposure,butontheotherhandtheuse of derivatives leads to the buildup of credit exposure. The hope is thatexposure reduction outweighs exposure buildup, but, without carefulmanagement, thefullpotential forcreditexposurereductionbyderivativesusewillnotbeachieved.When financial derivatives markets first began to grow in the 1970s, the
growthwasprimarilyincurrencyandinterestratederivatives,andthisremainsthe largest use to the current day (over 85 percent of the notional amount ofcontractsoutstanding,accordingtofiguresfromTables19and23AintheBankforInternationalSettlements'December2011DerivativesStatistics).Oneuseofthese derivatives was to take on market exposures that could previously beaccomplishedonlybycashinstruments,suchas loans,bonds,anddeposits.AscanbeseenfromSection10.1.3andTable10.2,derivativesminimizethecreditexposureandfundingrequirementsentailedbyloans,bonds,anddeposits.Themanagement of counterparty credit risk has been accomplished by two
verydistinct,but related,approaches: theuseofderivativesexchangesand thecreditmanagementofover-the-counter(OTC)derivativesthatarenottradedonexchanges.Wewill first discuss credit riskmanagement through exchanges inSection 14.2 and the credit risk management for OTC derivatives in Section14.3.TheclearfailureofmanyfirmsinmanagingtheircreditexposureonOTC

derivatives(discussedinSection5.3.1)hasledtoincreasingpressuretomoveasmuchcounterpartycreditrisktoexchangesandawayfromOTCaspossible.ThepotentialofandpossibleproblemswiththisapproachwerediscussedinSection5.5.7.To see the significance of credit risk generated by derivatives, consider that
U.S.commercialbankshad$281billionofcreditexposurerelatedtoderivativescontractsattheendof2011,aboutaquarterthesizeoftheir$1,339billioncreditexposure in traditionalcommercialand industrial loans(figures takenfromtheFederalReserve'sH8report).Toseetheimpactofmanagementofcreditriskonderivativescreditexposure,asofJune2011globalcreditexposureonallover-the-counterderivativescontractswas$19.5trillion,comparedwith$707trillionof notional outstandings, and there were another $83 trillion in notionaloutstandingsonexchange-tradedderivativescontracts,onwhichthereshouldbevirtually no credit exposure, as we will see in Section 14.2 (all figures fromTables 19 and 23A in the Bank for International Settlements' December 2011DerivativesStatistics).
14.2EXCHANGE-TRADEDDERIVATIVESCounterparty credit risk management of exchange-traded derivatives rests onfive key concepts: novation, margining, closeout, netting, and lossmutualization.Themostimportantoftheseconceptsisnovation.Assoonastwocounterparties(let'scallthemAandB)agreetoaderivativecontracttradedonan exchange, the contract between the two counterparties is immediatelycanceledandreplacedby twocontracts,onebetweenAand theexchange,andtheotherbetween theexchangeandB; seeGregory (2010,Section14.1.5) fordetails.Neither of the two counterparties needs to have any concernwith the credit
risk of the other—each has a contractual relationship for delivery on thederivativescontractwith theexchange, and theexchangealwayshasvery lowcreditriskbecauseithasthebackingofallitsmembers(we'lldiscussthisfurtherunder loss mutualization), because it takes no market risk, and because itcarefullycontrolsitscreditrisk.Tokeepthediscussionsimpleinwhatfollows,Iwillwriteasifexchangesdeal
directlywithallcounterparties.Actually,a typicalexchangehastwoclassesofcounterparties: exchange members who share in loss mutualization, and all
others. It is only an exchange member who is permitted to be the directcounterpartyoftheexchange.Allothercounterpartiesareactuallycounterpartiesofoneoftheexchangememberfirms,whichplacestradeswiththeexchangeonbehalf of these counterparties. But since exchange members manage theircounterparty risk by the exact same method that the exchange handles itscounterparty risk, throughmargining and closeout, a unified description is nottoofarremovedfromactualpractice.Attheendofthissection,wediscusstheextradetail that is needed to account for the two-tier realityof exchanges andmembers.Also,intheinterestofsimplicity,Iwillalwaysrefertothecontractsasbeingwiththeexchange,ignoringthepossibledistinctionbetweentheexchangeanditsaffiliatedclearinghouse;seeGregory(2010,Section14.1.3)fordetails.Theexchangetakesnomarketriskbecauseitsonlypositionsariseasaresult
ofnovationandhencearealwaysexactlyoffsettingpositions.Forexample,ifAcontracts to deliver 100million dollars to B in exchange for B delivering 70million euros to A on a certain future date, this contract is replaced by Acontracting todeliver100milliondollars to theexchange for70millioneurosandB contracting to deliver 70million euros to the exchange for 100milliondollars, both on the same date. So as long as both A and B perform theircontractualobligations, theexchangewillhavenogainorloss,nomatterwhathappenstothedollar/euroexchangerate.Hence,theexchangeneverbearsanymarketrisk.By contrast, the exchangemust be very concerned about counterparty credit
risk,sinceeachtradeleavesitwithcreditexposuretobothpartiesofthetrade.The exchangemanages this credit risk through a verywell-defined system ofmargining,closeout, andnetting.Theexchange iscontinuouslymonitoring themark-to-marketpositionofeverytrade,andanymark-to-marketlossesrequireacounterparty to immediately pay cash to the exchange to cover the loss (theexchangedoesn'tkeepthiscash;itpaysittothecounterpartywithanoffsettingmark-to-marketgain).Anytimeacounterpartyfailstoprovidethecashrequiredto cover amark-to-market loss, the exchangewill declare the counterparty indefaultandcloseoutallofthecounterparty'spositionswiththeexchange.Inthiscloseout,allof thecounterparty'spositions,whethergainsor losses,arenettedagainstoneanother.Theexchangeseeksnewcounterparties to takeover thesepositions. The exchange's losses on these positions are limited to the changefrom themark-to-marketprice the last time thedefaulting counterpartypostedmargin and the price at which a new counterparty is willing to trade. Theexchangehasthreewaysinwhichtocovertheselosses:
1.First,eachcounterpartymustpostwiththeexchangeinitialmarginatthetime it first enters into a trade (thisdoesnotneed tobe in cash; it canbesomehigh-qualitysecuritysuchasaTreasurybond).Lossesinclosingoutadefaulted position will be charged against this initial margin before anymoneyorsecuritiesarereturnedtothedefaultingcounterparty.2. Second, if losses exceed the initial margin, the exchange will sue thedefaulting counterparty for the remaining loss.However, recoverymaybelimitedifthedefaultingcounterpartyisactuallybankruptasopposedtojustsufferingtemporaryproblemsinmeetingamargincall.3. Third, any remaining losses are shared among all the members of theexchange.Thisistheprincipleoflossmutualization.Inevaluatinghowmuchinitialmarginanexchangeshoulddemandtoprotect
itself against the possibility of default, a key factor is to estimate probabilitydistributionofpricechangesbetweenthelastmark-to-marketandthetransactionwith a new counterparty. This depends crucially on the price volatility of thecontract, the liquidity of the contract, and the speed with which the closeoutmechanism operates. The more liquid a contract (i.e., the more frequently ittrades and the larger the size of trading that occurs), themore confidence theexchangecanhavethatthemark-to-marketisclosetotheactualpriceatwhichanew trade can be done, and the lower the chance that the forced trading theexchangewilldotocloseoutthedefaultedpositionwillimpacttheprice.AswealreadynotedinSection6.1.1, themanagementofcounterpartycredit
riskthroughmarginingcanfollowverycloselytheprescriptionwehavedetailedfor themarket riskof trading: the importanceof timely and accuratemark-to-market(Section6.1.3),valueatrisk(VaR)(Section7.1),andstresstest(Section7.2) calculations. In particular,VaR simulations and stress testing should lookalmost identical to thediscussion inChapter7.Aswith tradingpositions,VaRwill focus on losses that might occur under conditions of normal marketliquidity, while stress tests will look at losses that might occur over longerperiods between closeout and replacementwith a new counterparty that resultfromunusualconditionsofmarketilliquidity.There are two critical differences between the management of counterparty
credit risk on exchanges and the management of the market risk for tradingdesks that impact VaR calculation methodology. One is that there may be asignificantdelaybetweenthefailureofacounterpartytomeetamargincallandthedeclarationofdefault(thisiscalledthegraceperiod); itmay take timefor

the exchange to confirm that a counterparty truly cannot or is choosingnot tomeetamargincall, rather thanjustadelaycausedbyanoperationalerrororacommunication failure. The time that is necessary tomake this determinationmust be built into theVaR calculation, since it is a time period duringwhichpricesmay fluctuate. Exchanges try tominimize required initialmargin, sincethisisakeyfactorinthecompetitionforbusiness,andsowilltrytominimizethegraceperiod.Forexample,aspointedoutinGregory(2010,Section14.1.8),large price movements might trigger intraday margin calls, a practice that isbecoming increasinglycommonand is supportedby technologyadvances.Butclosing out too quickly may also result in loss of business to competitorexchanges,sinceitwillundulypenalizeoperationalerrors.The second critical difference is that trading desks are experienced in
managingmarketriskpositions,andsocanbeexpectedtoskillfullymanagetherequiredclosingoutofaposition.Bycontrast,exchangesbytheirnaturearenotexpectedtohavemodelriskpositions,soclosingoutapositionisnotatasktheyarewellpositionedfor.Exchangesprotectthemselvesbylimitingthenumberofcontractstheywilltradetoastandardizedset(e.g.,allowingtradingforonlyfoursettlementdateseachyear;seeHull2012,Section2.2,“DeliveryMonths”).Byutilizingalimitedsetofstandardizedcontracts,exchangescultivateliquidityforeachcontracttraded,makingmarkingtomarketmorerobustandcloseouteasiertoperform.OnceVaRandstresstestcomputationshavebeenmade,anexchangewillbe
inagoodpositiontoevaluatetheadequacyofinitialmarginrequirementsandtoestimate theprobability that the initialmarginswillprove insufficient tocoverthe losses incurred in a closeout. Some of the considerations thatwill go intoevaluatingtherequiredsizeofinitialmarginsare(comparewithGregory2010,Section14.1.8):
Thevolatilityofpricesfortheparticularcontractsinvolvedandthelengthofthegraceperiod,bothofwhichshouldbedirectinputstotheVaRandstresstestcomputations.Thedegreeofoffsetlikelybetweennettedpositionsindifferentcontracts.ThisalsoshouldbeanintegralpartofVaRandstresstestcomputations,butwiththesameconcernforthereliabilityofhistoricalcorrelationrelationshipsunderstressedmarketconditionsdiscussedinSections7.2.2and7.2.3.Thesizeofthecounterparty'spositionrelativetothesizeoftradinginthecontract.ThisisapointverysimilartothatraisedinSection6.1.4regarding
positionsthatareilliquidduetosize.TheremedyshouldbesimilartothatproposedinSection6.1.4:simulationofpricechangebetweenlastmark-to-marketandcompletedcloseoutshouldbeoveralongertimeperiodtoaccommodatethelargerposition.Thedegreetowhichacounterpartyhasfinancialresourcesbeyonditstradingpositions.Thiswillimpactthelikelihoodthatlossescouldberecoveredthroughalawsuit.Thedegreetowhichacounterparty'slosseswilltendtobecorrelatedwiththoseofasignificantnumberoftheexchange'sothercounterparties.ThismightrequireVaRandstresstestcalculationsthatlookatthewholeuniverseofcounterparties,ratherthanjustoneatatime.
The methodology that exchanges use to manage counterparty credit riskthrough margining and closeout offers both drawbacks and advantages tocounterparties.On the negative side is the narrow range of allowed contracts,which limits the degree to which derivatives can be tailored to meet specificneedsofacustomer.Alsoonthenegativesideistheoperationalcomplexityofmeetingcontinuousmargincalls.Onthepositiveside,theheavyrelianceofthisapproach on controlling credit risk through the actual mechanism of tradingreduces reliance on credit evaluation of each customer. This can be veryattractive to some customers who might not have the track record needed towithstand a credit review butwho have confidence in their ability tomanagemargincalls.Anotherpositiveisthatsincetheexchangehasnomarketposition,it has no incentive to hide information about prices at which trades haveoccurredandthedepthofthemarket.Exchangestypicallysupplyamuchgreaterrangeandqualityofpriceandmarketsizeinformationthandotradingdesksthatare also holding market positions. Not only do exchanges generally providecompletepublic informationon thesizesandpricesofall executed trades,but“in typical exchange-traded markets . . . the best available bid and offer areprovided to nearly all market participants nearly instantly” (Duffie, Li, andLubke 2010). One further negative thatmust be considered is that exchangesmay protect themselves in instances of extrememarket volatility by imposinglimitations on trading that disadvantage some customers (this point is madeforcefullyinthesectiononclearinghousesinBrown(2012,Chapter10).Averyimportantpositiveoftheexchangecounterpartycreditmethodologyis
theeasewithwhichacounterpartycanoffsetapositionpreviouslyenteredinto.As time and circumstances change, it is very common to wish to reverse aprevious transaction. If your contract iswith a private firm, as in anover-the-

counterderivative,youmustnegotiatewiththisfirmtooffsetthepriorposition.Ifyourcounterpartystillwantstokeeptheposition,youhaveachoiceofeitherofferingpriceconcessions to induceyourcounterparty tooffset thepositionorenteringintoanoffsettingpositionwithanewcounterparty,whichwouldoffsetthe market position but leave you with credit exposure to both your originalcounterparty and the new counterparty. By contrast, the novation feature ofexchange-tradedderivativesmakesoffseteasy.Sinceyourcounterpartyonanytransactionistheexchange,youcanfindanynewcounterpartywantingtoenterinto an offsetting position and this will result in the complete cancellation ofyour original position with the exchange, leaving both you and the exchangewithnofurthercreditexposureontheoriginalpositionoronyournewoffsettingposition.(Tomakethiscompletelyclear,iftheoriginalpositionwasbetweenAandB,andlaterAentersintoanoffsettingpositionwithC,AwillbeleftwithnoexposureandtheexchangewillhaveoffsettingpositionswithCandB,replacingitsoriginaloffsettingpositionswithAandB.)Asafinalpoint, letusaccountfortheactualtwo-tierednatureofexchanges.
Aswesaid toward thebeginningof this section,wehavebeensimplifyingbywritingasifexchangesdealdirectlywithallcounterparties.Infact,itisonlyanexchangemember,onewhosharesinlossmutualization,whoispermittedtobethe direct counterparty of the exchange. All other counterparties are actuallycounterpartiesofoneof theexchangemember firms,whichplaces tradeswiththe exchange on behalf of these counterparties. When a customer requests atrade through a member, the member is obligated to make that trade on theexchange,somembersdonotaccumulateanymarketpositionswithcustomers.The exchangeonlyneeds tomanage its credit exposure to itsmembers,whileeach member needs to manage its credit exposure to its customers. Thedescription we have given thus far, of margining, netting, closeout, VaR, andstress test calculations all apply equally to the exchange's management of itscredit exposure to members and to members' management of their creditexposure to customers. If a customer's position requires a margin call by theexchange,itisthememberthatisobligatedtomeettheexchange'smargincall,andthememberinturnwillmakeamargincalltothecustomer.From the viewpoint of a customer of a member, there shouldn't be any
differencebetweenplacingtradesthroughtheexchangeandtheactualplacementof trades through a member—the obligation to pay the customer is theexchange'sobligation.Theexchangewillmakepaymentsdueonmark-to-marketincreasestothememberfirm,whichisinturnobligatedtopassthesepayments
ontothecustomer.Theonlypotentialproblemwouldbeifthememberdoesnotadequately segregate customer funds from its own funds; in this case, if themember goes bankrupt, the customers could lose on initial margin accountsbeingkeptwiththememberalongwithanyfundsthecustomerkeptinexcessofrequiredmargin, perhaps as an operational convenience tomeet futuremargincalls.Thiswasconsidereda remotepossibility,givenexchangerulesand legalrequirementsformemberfirms.Butthe2011bankruptcyofMFGlobalanditsfailuretosegregatecustomerfundsleftcustomerswill longdelaysinaccesstofundsandthedefinitepotentialforultimatelossofpartoftheirmarginaccounts(seeKoutoulasandRoe2012).Itremainstobeseenwhatimpactthiswillhaveoncustomerviewsofthesafetyofexchange-tradedderivatives.
14.3OVER-THE-COUNTERDERIVATIVES
14.3.1OverviewGivenalltheadvantagesofexchange-tradedderivatives,whydocustomersenterinto OTC derivatives, which require far more credit scrutiny, are much moredifficulttooffset,andaresurroundedbyfarmoresecrecyconcerningpricesandmarket conditions? The answer has to be largely centered on the two mainweaknesses of exchange-traded derivatives: lack of customization and theoperational intensity of managing margin calls. Firms that want to enter intoderivative contracts custom-tailored to a specific need must use OTCderivatives.AnadditionalmotivationforusingOTCderivativesisthatacounterpartymay
be seeking an extension of credit in connection with its derivatives trading.Initialmarginanddailymargincallsrequirecashorsecuritiesthatthefirmmayneedforotherpurposes.Unlikeanexchange,theproviderofanOTCderivativemaybewillingtoextendcreditforanamount that isdueinthefutureunderaderivativecontract.While some OTC derivatives contracts are negotiated directly between two
firmslookingforoppositesidesofatrade,theoverwhelmingmajorityofOTCderivative contracts involve a derivatives market maker as one of thecounterparties to the trade. This reflects both the willingness of derivativesmarketmakers to structurecontracts that fit theparticularneedsofacustomerand the nature of market making in providing continuous liquidity by being

willing to take either side of a trade at a reasonable price, aswe discussed inSection2.5.Findinganon-market-makingfirmlookingfortheoppositesideofatradeyouwanttoenterintorequiresanextensivesearch.Amarketmakerinderivativesmustthereforehavebothasophisticatedtrading
operationwithregardtomarketriskandaveryhighcreditrating.Incaseswherethere have been credit concerns regarding a market-making firm, specialarrangements have been made to create a subsidiary that has a higher creditratingthantheparentfirmthatwillbethecounterpartytoallderivativestrades(fordetails,seeGregory2010,Section2.3.1andChapter13).Wecanthereforeseethatinmanywaysthederivativesmarketmakerplaysa
very similar role to that of the exchange in managing the credit risk ofderivatives. Parties taking oppositemarket positions have credit exposure to amarket maker rather than to one another. But the market maker has morefreedom than an exchange in deciding how it wants to manage this creditexposure;thelossmutualizationrulesoftheexchangemakeitanswerabletoallofitsmemberfirmsandconstrainitsoptions.Three primary approaches have been proposed and used for managing
counterpartycreditriskforOTCderivatives.Theearliestapproachwastotreatthe counterparty credit risk on OTC derivatives as much as possible like thetraditional credit process for loans. We will discuss this approach in Section14.3.2.The second approach is to incorporate someof the creditmanagementtoolsofexchange-tradedderivativestoOTCderivatives—closeout,netting,andmargining. This approach will be discussed in Sections 14.3.3 and 14.3.4. In14.3.5,wewill discuss themost recent of the approaches, the use of dynamichedgingtomanagecounterpartycreditrisk.
14.3.2TheLoan-EquivalentApproachThe earliest approach to the management of counterparty credit risk on OTCderivatives was to incorporate it into the traditional credit process for loans.Sincecreditriskmanagersareusedtomakingdecisionsonthetotalamountofcredit that it is prudent to extend to a given borrower, it is only necessary tocalculate the total loan-equivalent size of credit extension needed for a givenOTC derivative position. The difficulty with this approach is that where astandard loan(other thana lineofcredit)hasa fixedamount that issubject tolossintheeventofdefault,thesizeofderivativeexposureatthetimeofdefaultdependsontheuncertainevolutionofmarketconditions.
The standard solution to this problem has been to set some probabilitythreshold (such as the 99th percentile) and then estimate the near-maximumamount that can be lost in the event of default at this threshold. This near-maximumlossamountistreatedasaloanequivalent,andcreditriskmanagersareaskedtogiveapprovalforthisaddedcreditextensiontotheborrower.Beforediscussingthecomputationalaspectsofthisapproach,letusnotetwo
majorissues:1.Creditriskmanagementlooksnotjustattotalcreditexposurebutalsoatthe expected recovery in the event of default.While historical experiencehasbeendevelopedforrecoveryondifferentclassesofcreditexposure(seeTable13.4), the relative rarityofdefaultbyOTCderivativecounterpartieshasmade comparable data difficult to obtain.Someassumption about thisrecovery rate needs to be made based on some combination of relevantexperienceandtheoreticalconsiderations.2. Derivatives marketers and traders feel discriminated against by thistraditionalapproach.Theypointout,withreason,thattheactualamountatriskintheeventofdefaultwould,onstatisticalgrounds,oftenbelessthanthenear-maximumamountusedasa loanequivalent,whereasa traditionalloanwill alwayshave the same fixedexposure.Derivativesmarketers andtraderswant to see notions of expected exposure at default supplement orreplace themeasure of near-maximum exposure at default.However, caremust be taken to create a comparable measure to traditional loans. Iftraditionalloanexposureismeasuredbyloanamount,theexpectedexposureonderivativesmustbemeasuredbyexposureatdefaultandnotbebasedonexpected loss, which differs from expected exposure by the amount ofexpectedrecoveryintheeventofdefault.With respect to the second point, there is near-universal agreement that
expected exposure at default should be measured and that loan officers inmakingdecisionsoncredit extensions should lookat expected exposure alongwith near-maximum exposure. There is also near-universal agreement thatpricing credit exposure and allocating capital against credit use, as in Section13.3.4, should be based on expected exposure. More controversial is theproposalbysomederivativesmarketersandtradersthatnear-maximumexposureshouldnotbeconsideredatallandthatonlyexpectedexposureshouldbelookedat as a measure of credit risk on OTC derivatives. In my experience, thisargumenthasnotgainedmuchtraction.Certainlyforborrowerswithverylargeexposures, the potential impact of default on the lending firm makes it

mandatory for credit officers to consider the near-maximum impact. Even forsmaller borrowers, the discipline of looking at near-maximum exposure is ahealthy incentive to focus loan officers on the soundness of credit extensiondecisions.Turningtothecomputationalaspectsoftheloan-equivalentapproach,thereare
twobasicmethodologies toconsider:simulationandformulas.Consistentwiththe basic themes of this book, I advocate the use of simulation as therecommended approach (compare with Sections 1.3 and 6.1.1). Simulation ismore accurate than formulas in the calculation of credit exposure on a singlederivative,isanabsolutenecessityforlookingatcreditexposureofthefullsetofderivativesforacounterpartyorforpricingcreditexposureforaportfolioofcounterparties, is needed for taking into account correlation between marketmovements and default probability (so-called wrong-way risk), and is anabsolute necessity for taking into account creditmitigation techniques such asnetting and margining. We will postpone the discussion of the details ofsimulation methodology until after the introduction of credit mitigation inSection14.3.3,allowingforaunifiedsimulationapproach.For all these reasons, calculation of credit exposure through formulas has
limited applicability and is relied on only by smaller, less sophisticated firms.However, larger and more sophisticated firms may still utilize formulas as aquickfirstapproximationtoguideinitialdiscussionsbetweenderivativetradersand loan officers and as an aid to intuition. These approximations are usuallybasedonthereasonableassumptionthatuncertaintyaboutmarketvariableswillgrowwiththesquarerootofelapsedtime,balancedbythedecreaseindurationofproductssuchasinterestrateswaps.Foraswap,increasinguncertaintyatfirstdominates, and credit exposure increases, reaches a peak, and then declinesthroughtimeas theimpactofdecreasingdurationcomestodominate.Gregory(2010, Section 4.2 and Appendix 4A) contains examples of approximationformulasandgraphsillustratingtypicalcases.For less sophisticated firms attempting to approximate counterparty credit
exposure without the use of a full simulation model, portfolio credit risk ascalculatedinSection13.3.2willjusthaveexpectedloanequivalentsrepresentingcounterpartyexposureasinput.Portfoliocreditriskcomputedwiththisshortcutmust be adjusted upward to take into account interactions between creditexposureandmarketvaluethatwouldbepickedupinafullsimulation.Thisisthe so-calledalpha factor explained in detail inGregory (2010, Sections 10.4and 10.5). This exposure increase is present even in the absence of any
correlation between default probabilities andmarket values, simply due to theadded volatility of market values contributing to higher tail risk of the creditportfolio.
14.3.3TheCollateralizationApproachThesecondapproach tomanagingcounterpartycredit riskonOTCderivativeshasbeentocombinethefirstapproachjustdescribedwithtoolsborrowedfromthe exchanges' management of counterparty credit risk. In particular, acombinationofnettingandcloseoutisusedtocombinederivativepositionswithasinglecounterparty,andmarginingisusedtoobtaincollateral thatwilloffsetlossintheeventofdefault.Let'slookatthesetwotoolsinsomemoredetail.Netting and closeout are discussed at length inGregory (2010, Sections 3.4
and3.5).AccordingtoGregory,“Ofallriskmitigationmethods,nettinghashadthegreatestimpactonthestructureofthederivativesmarkets.Withoutnetting,the current size and liquidity in the derivatives markets would be unlikely toexist. . . .Theexpansionandgreaterconcentrationofderivativeshasincreasedtheextentofnettingfromaround50%inthemid-1990stocloseto100%today.”Netting and closeout require a legal agreement between counterparties, mosttypicallyunderanISDAMasterAgreement (seeGregory2010,Section3.4.6),that permits, in the event of a counterparty default, the nondefaultingcounterparty to immediately terminate all outstanding derivative contractsbetween the two counterparties, determine what is owed on each terminatedcontractatcurrentmarketvalues,andnetoffsettingamountsowed.Iteliminatesthepossibilityofthedefaultingcounterpartysettlingcontractsonwhichitowesmoney at only a recovery fraction of the amount owed,while demanding fullpaymentoncontractsonwhichitisowedmoney.AccordingtoGregory,“ISDAhas obtained legal agreements supporting their Master Agreements in mostrelevant jurisdictions” (wherever there are doubts about legal enforceability ofcloseout netting in a jurisdiction, ISDA lobbies for legislative clarity; onceclarity has been achieved, ISDA obtains a legal opinion to this effect for thebenefitofitsmembers).Another major advantage of the ISDA Master Agreement is that it has
standardizedproceduresfordeterminingwhatclaimscanbemadeinbankruptcyagainst a defaulting counterparty. The suggested ISDA language defines theamount that can be claimed as the amount that the nondefaulting party“reasonablydetermines ingood faith tobe its total lossesandcosts”asof the

closeout date and states that the nondefaulting party “may (but need not)determineitslossbyreferencetoquotationsofrelevantratesorpricesfromoneormoreleadingdealersintherelevantmarkets.”Thislanguagemakesclearthatthenondefaultingpartydoesnothavetoenterintoareplacementtransactioninhaste in order to establish a price on which to base its claim in bankruptcyproceedings.Instead,itcanutilizemarketquotations,supplementedbyindustry-standardmodels,toestablishwhatthemark-to-marketofthetransactionwasatthe time of default, base its bankruptcy claim on that, and exercise its bestjudgmentastowhenorwhethertoactuallyenterintoareplacementtransaction.Margining is discussed at length in Gregory (2010, Sections 3.6, 3.7, and
5.2.1).Itworkssimilarlytomarginingbyexchanges,withacallforpostingofmargintocoveramark-to-marketlossandthefailuretopostmarginconstitutingadefaulteventthatwillterminatethetrade(andallothertradeslinkedthroughnettingagreements).IfOTCderivativesmarginingworkedexactlylikeexchangemargining, it would completely eliminate the advantages of OTC derivativesoverexchange-tradedderivatives inoperational simplicityandcredit extension(though still leaving contract customization as an advantage). To retain theseadvantages, OTC derivatives market makers usually make their marginingrequirementslessburdensomethanexchangemarginingrequirementsbyoneormoreofthefollowingconditions:
Marginpaymentsmaynotberequiredasoftenasdaily,butmayhavealessfrequentperiod,suchasweeklyormonthly.Marginpaymentsmayberequiredonlyonceacertainmark-to-marketlossthresholdhasbeenreached.Marginmaybeallowedtobepostedassecuritiesofaspecifiedqualityratherthannecessarilybeingcash,thoughthisprovisionhasbeenlosingpopularitysinceeventsofthe2008crisis(Gregory2010,Section3.6.5).Initialmarginmaynotberequired.Moreleniencymaybepermittedinallowingagraceperiodduringwhichthecounterpartyhastimeinwhichtopostmargin.
These more lenient margining requirements allow OTC derivatives marketmakers to accept a greater degree of credit exposure to customers than isnormallyextendedbyexchanges.Withthisbackgroundonnetting,closeout,andmargining,let'sbegintolookat
thecomputationofcounterpartycreditriskexposurebysimulation.Thereareverystrongparallelstotheuseofsimulationandstresstestingthat

can be found in Chapter 7, and much of that material is fully applicable tocounterpartycreditexposure.AsinChapter7,weareconcernedwiththevalueatwhichatransactionwillactuallytakeplace—thereplacementvalueatwhichaderivative contract canbe entered into in the eventofdefault for counterpartycredit exposureversus the exit valueof an existing transaction in the event offorcedliquidationformarketrisk.TheprimarydifferencesbetweenthemarketrisksimulationofChapter7and
the simulation of counterparty credit exposure are length of simulation periodandtherequiredstatistics.Counterpartycreditexposuremustbecalculatedovermuchlonger timeperiodsthanVaR,sinceafirmcanexit itsmarketexposuresover a period of a few days but has a longer contractual commitment to thecreditriskonderivatives.Whilemarketrisksimulationsareconcernedonlywithtail risk, counterparty credit exposure simulations need to calculate expectedvalueaswellasthetails,asalreadyexplainedinSection14.3.2.For the time being we will assume that the timing of default of the
counterpartyisindependentofthemarketvaluesofthederivativecontracts.Wewilllaterdropthisassumptioninthenextsection,onwrong-wayrisk.Herearesomepointsthatmustbeconsideredindesigningcounterpartycredit
exposuresimulationsinadditiontothepointsalreadycoveredinChapter11;fora more detailed description, see Gregory (2010, Chapters 4 and 5), and alsocomparewithBrindle(2000)andCanabarroandDuffie(2003).
ThelongertimeperiodthatcounterpartycreditexposuresimulationrequiresnecessitatestheuseofMonteCarlosimulation.WithVaRsimulation,wecanchoosebetweenhistoricalsimulationandMonteCarlosimulationonlybecausetheshorttimeperiodbeingsimulatedmeanstherearemanyprevioushistoricalperiodsofthesametimelengthastheperiodtobesimulated.EachpathoftheMonteCarlosimulationdeterminescreditexposureateachpossibledefaulttimebeingconsidered.Calculationsalongeachpathtakeintoaccountnotjustthevaluesofthederivativecontractsbutalsoaccountforallnettingthatwouldoccurintheeventofdefaultandanymargincallsandcollateralpostingsthatwouldhaveoccurredbasedonthedetailsofthemarginingagreementwiththecounterparty.Sinceasinglecounterpartymayhaveenteredintomanydifferenttypesofderivativecontracts(equity,interestrate,foreignexchange[FX],credit,commodities,etc.),afullrangeofmarketvariablesmustbeconsidered,justasinaVaRcalculation,withduecareexercisedoncorrelationassumptions

betweenvariables.AswithVaRsimulations,fullvaluationofderivativesalongeachsimulationpathmaybeveryresourceintensive,andtrade-offswillexistbetweentheaccuracyoffullvaluationandthefasterturnaroundtimeandlowercostofapproximations(comparewiththediscussionofvaluationapproximationsinSection7.1.1.2).ThisisanevengreaterissueforcounterpartycreditsimulationsthanforVaRsimulations,sinceeachpathalsorequiresvaluationsatmanydifferenttimeperiods;seethesectionon“ComputationalConsiderations”inBrindle(2000)andGregory(2010,Section4.1.3).Tospeedcomputation,inadditiontotheapproximationmeasuresdiscussedinSection7.1.1.2,thenumberofdefaulttimesforwhichvaluationisdonemaybereducedwithinterpolationutilizedfordefaulttimesinbetweentheonesevaluated.Gregory(2010,Section4.1.4)discussespossibleissueswithinterpolationbetweenthediscretetimepointsforwhichcalculationsaremadeandmeasuresforreducinginterpolationerror.Incounterpartycreditexposuresimulations,thedrift(theexpectedchangeinavariablethroughtime)playsamoreimportantrolethaninVaRcalculations.DuetotheshorttimeframeofVaRcalculations,driftcanbeassumedtobezero,sincevolatilitywilltotallydominatedrift,particularlyintailcalculations.Butforcounterpartycreditexposure,overmuchlongertimeperiodsandwhereexpectedvalueisimportantalongwithtailvalues,driftisveryimportant.AsGregory(2010,Section4.3.2)notes,“inthelongrunastrongdriftwilldominate”sincevolatilityvarieswiththesquarerootoftimewhereasthedriftscaleslinearlywithtime.SoattentionmustbepaidtoforecastingthedriftsofmarketvariablesintheMonteCarlosimulation.Insimulatingmargining,inadditiontoallcontractualdetails,assumptionsneedtobemadeaboutdelaysinthetimebetweenamargincallbeingmadeandadefaultforfailuretomeetthemargincallbeingdeclared.AsGregory(2010,Section5.2.1)explainsindetail,theindustrystandardincorporatedintoBaselIIistoassumea10-business-dayminimumremarginperiodbetweenmargincallanddefaultdeclarationandclosingoutofpositions.Thisallowstimeforbothoperationalissuesofprocessingmarginrequestsanddelaysindetectionofnondelivery,andgraceperiodsallowedtopermitacounterpartytocureafailuretopostmargin.AsGregorynotes,longerremarginperiodsmaybeappropriateforcounterpartiesthatmaybegrantedmoreleniencytomaintaingoodrelationsorwherethenatureofthederivativesmayrequirelongerperiodstoresolvedisputesoverthemark-to-

marketdrivingamargincall.Brindle(2000)alsonotesthatinsomejurisdictions,statutorystayperiodsmaydelaytheliquidationofcollateral,andcontractualagreementsmaystipulateaminimumdelayperiod.Thecloseoutdelaysassumedinthesimulationshouldbeindividuallytailoredtoeachcounterparty.Whenacounterpartyagreementallowsfornoncashcollateral,themarketvalueofthecollateralshouldalsobesimulatedalongeachofthesimulationpaths,withfullconsiderationofcorrelationbetweenvalueofthecollateralandvalueofthederivatives.Whenthevalueofthederivativesandofthecollateralinstrumentarepositivelycorrelated(e.g.,aTreasurybondascollateralandasetofswapsonwhichthecounterpartynetpaysafixedrateinthesamecurrency),creditexposurewillbegreaterthanifcollateralwaspostedincash.Whenthevalueofthederivativesandofthecollateralinstrumentarenegativelycorrelated(e.g.,aTreasurybondascollateralandasetofswapsonwhichthecounterpartynetreceivesafixedrateinthesamecurrency),creditexposurewillbelessthanifcollateralwaspostedincash.AworkedexampleoftheimpactofcollateraloncreditexposurecanbefoundinGregory(2010,Section5.2.5).AswithVaR,asdiscussedinSection7.1.1.2,counterpartycreditexposuresimulationsmustaccountforilliquidity,whetherduetoinfrequenttradingortoalargeposition.Illiquiditymustbeconsideredforboththederivativepositionsandfornoncashcollateral.Whetherduetoinfrequenttradingortolargepositions,thebasictoolfordealingwithilliquidityofderivativesistolengthenthetimeassumedbetweenadefaulteventandpositioncloseout.ThiscloselyparallelsthetreatmentforilliquiditydetailedinSection6.1.4andtheprovisionforremarginperiodsdiscussedtwobulletpointspreviously.Illiquiditywillprobablyhavelimitedimpactoncounterpartyexposurewheremarginingisnotused—thereislittledifferencebetweenthepricemovementinderivativevalueover,say,twoyearsfromnowtodefaultandovertwoyearsandtwoweeks,allowinganextratwoweeksafterdefaultforilliquidity.Butilliquiditycanhaveamajorimpactoncounterpartyexposurewhenmarginingisused.Itcouldnow,forexample,doublethetimefromdefaulteventtocloseoutfromtwoweekstofourweeks,increasingexposureby .Similarly,illiquidityofcollateralcanbetreatedbyincreasingthetimeperiodoverwhichthecollateralisassumedtobeliquidatedandhencetheuncertaintyofthepricerealized.Whenilliquidityofaderivativeisduetoapositionwithactuarialrisk,aseparate

treatmentisneeded.Thiswillbediscussednext.Forderivativeswithactuarialrisk,IstronglyfavoranapproachparalleltothatrecommendedinSection6.1.2:utilizealiquidproxyinthecounterpartyexposuresimulationbutmakeaseparatecomputationfortheresidualrisk.Myargumentisthatadefaultbythecounterpartywillresultinthenondefaultingpartyacquiringandnowneedingtomanagetheactuarialriskinthesamewayitwouldhaveneededtomanageitifithadcreateditinatradingposition.Thereservesthatwouldbeneededtomanageoutoftheposition,ascomputedinSection8.4,willnowbeapotentialcostandhenceareanadditiontonear-maximumcreditexposureandneedtobeaccountedforinexpectedcreditcost,multipliedbytheproperdefaultprobabilityandlossgivendefaultpercentage.Anotherconsequenceofthisargumentisthatfirmsshouldnotenterintoderivativespositionsontransactionsforwhichtheylackadequatemodelsandpersonneltomanageapositionthatwillresultfromadefault.Therehavebeenunfortunateexamplesinwhichfirmshavedecidedto“standinthemiddle”betweentwocounterpartiesonatransactionthattheyhadnoexperiencetradingandlittleunderstandingof,persuadedthattheywere“only”takingacounterpartycreditriskandnottakinganymarketrisk(typicallybecauseoneofthecounterpartieswasnotwillingtoacceptthecreditriskoftheotherandwaslookingforacounterpartywithstrongercreditrisk).Ondefaultofoneofthecounterparties,thesefirmsfoundthemselvessuddenlyneedingtomanagepositionstheylackedcompetencetotrade.StresstestingasasupplementtosimulationofcounterpartycreditexposureplaysasmallerrolethanitdoesasasupplementtoVaR,forreasonssimilartothosediscussedtwobulletpointspreviouslyconcerningtheminimalimpactofilliquidityofpositionsoncounterpartycreditexposure.Byparallelreasoning,astressscenarioofatemporaryperiodofmarketilliquidityinnormallyliquidpositionswillhavelittleimpactonexposurewhennomarginingisemployedbutmaybequitenecessaryandofsignificantimpactwhenmarginingisemployed.Thedegreetowhichnettingreducesnear-maximumcreditexposureisveryheavilyimpactedbycorrelationassumptionsregardingmarketvariables.Itisimportanttomakesurethatsubjectiveprobabilitiesoffutureperiodsinwhichcorrelationsthatareeitherveryloworveryhighbyhistoricalstandardshavebeengivendueconsideration.
Theneedforcommunicationofmarginalcostofnewcreditexposurestoloan
officers discussed in Section 13.3.4 has a parallel requirement forcommunicating themarginalcostofnewcounterpartycreditexposures to loanofficers,traders,andstructurers.Thisisdonethroughthecreditvalueadjustment(CVA),athoroughdiscussionofwhichcanbefoundinGregory(2010,Chapter7). Gregory's discussion of measuring marginal exposure contributions in hisSection4.5isalsorelevant.Iwill limitmyself tojustafewremarksrelatedtocaseswheretheCVAmethodologydiffersinsomerespectfromthemethodologyofSection13.3.4:
AsinthemoregeneralcaseofmarginalcreditexposuresdiscussedinSection13.3.4,thereisaneedforapproximationsthatcanbeusedattheindividualcreditlevel.GregoryprovidesapproximationformulasintheappendixestoChapter7,butwiththeimportantcaveatthattheseworkonlyintheabsenceofwrong-wayrisk(i.e.,whenthereisnodependencebetweendefaultprobabilityandlossgivendefault).Whenwrong-wayriskispresent,thetechniquesofthenextsection,14.3.4,needtobeused;theseareverycloselyrelatedtothecomputationsinSection13.3.4andsowouldneedtoutilizeapproximationtechniquescoveredthere,thoughGregory'sSection8.3doesprovidesomeapproximationformulasspecifictoCVAforwrong-wayrisk.Manyfirmshaveemployedanaccountingprocedurethattakesintoaccounttheimpactonderivativecontractsofthedefaultprobabilityofthefirmitself(thisistermedbilateralcounterpartyriskandiscoveredbyGregoryinSection7.3).Whateveritsvirtuesasanaccountingprocedure,itshouldneverbeutilizedinriskmanagementmeasuressuchasCVA.Fromariskmanagementstandpoint,therearenobenefitstoafirmfromitsowndefault,soutilizingitinriskmeasureswouldbecompletelymisleading.Evenasanaccountingprocedure,thebenefitsofthisapproacharedubious:anattempttobookprofitsthatwillfuelshort-termbonusesatthepotentialexpenseofinvestorconfidenceinthefirm'sreportedearnings,ascanbeseenintheexamplesinGregory(2010,188).
14.3.4TheCollateralizationApproach—Wrong-WayRisk
Intheprevioussectiononsimulationofcounterpartycreditexposure,wenotedthat a key assumption in our calculations was independence of counterpartydefaultandmarketvalueof thederivativescontracts.Formanycounterparties,
thisisareasonableassumption.Whenthereisacorrelationbetweendefaultandmarket value, then computations must be different. A positive correlationbetweenprobabilityofdefaultandmarketvalueof thederivatives isknownaswrong-way risk and increases exposure and CVA measures from what theywould have been in the absence of this correlation. A negative correlationbetweenprobabilityofdefaultandthemarketvalueofderivatives isknownasright-way risk and decreases exposures and CVA measures from what theywouldhavebeen in theabsenceof thiscorrelation.Gregory (2010,Chapter8)containsathoroughexpositionofwrong-wayandright-wayrisk.This section addresses how to modify the simulation methodology of the
previous section to accommodate this correlation.The short answer is that thedefaultprobabilityof thecounterpartymustalsobesimulatedalongeachpath,incorporating correlation with the market variables being simulated. We willprovide details and examples shortly, but first let us consider some cases inwhichwrong-wayriskissoextremethatsimulationshouldbecircumventedandadirectanalysisshouldbemade.Let's startwith a trade that has, unfortunately, been propos over the past 15
years.Withmacabrehumor,itissometimescalledan“endoftheworld”trade.Itisaproposaltoputonaderivativetradethatwillprovideapayoffonlyifsomereally extreme event occurs—let's say 40 percent defaults on a basket ofinvestment-grade corporate loans. No initial margin is being asked of thecounterpartyprovidingtheprotection,andthereisnoprovisionformargincalls.It is easy to see the attractiveness of this trade from the viewpoint of the
counterparty providing the protection; it will receive a small annual paymentevery year, and if the dire circumstances in which it is required to make apaymentdidoccur,itdoubtsitwouldstillbeinbusiness.Itishardertoseewhythefirmpurchasingtheprotectionwouldwanttodothe
trade.IneverycaseIhaveencountered,whenIaskedthetradingdeskproposingthetradewhethertheythoughttherewasanychancethecounterpartywouldstillbe inbusiness if itwasrequired tomakeapayment, theanswerwas,“No,buteven though this has no financial benefit to the firm, it will provide us reliefunder such-and-such regulatory capital calculation.” My response, as a riskmanager,wasalways:(1)wewouldn'tpermittradestobemadethatcostthefirmmoneywithnofinancialbenefit,and(2)evenifitappearedtoprovideregulatoryrelief,itwouldbemyobligationassomeoneinacontrolfunctiontopointouttotheregulatoryauthorityconcernedthatitwasbeinggamed.Innowaywasanymodelingrequiredtocometothisconclusion.
Alessobviouscaseisoneinwhichnomarginingisrequiredbyacounterpartyunless the counterparty receives a ratings downgrade below a certain level orunless an extremely negative event occurs in the counterparty's stock price orcredit spread, in which case a large margin payment is required. In suchcircumstances,Ihavealwaysbeenopposedtogivinganycreditincounterpartycredit exposure calculations for thismargining requirement; Iwouldmake thecalculations assuming no margin requirement at all.My reasoning is that thetype of event that triggers the margin call is just the sort of circumstance inwhich the counterparty will be strapped for cash and will either be forced todefaultorwillappealtoourfirm'sseniormanagementforrelieffromthemargincalltoavoidbankruptcy.Indeed,itwasjustthistypeofmarginingprovisionthatpushedEnronintobankruptcy(seeMcLeanandElkind2003,394–395).Sothisis a case of wrong-way risk in which there is a high correlation between arequiredmarginpaymentandadefaultthatpreventsitbeingmade.Anothervariantonextremewrong-wayriskisanattempttoavoidrelianceon
margin calls that have a low probability of being fulfilled by converting thecounterpartycreditriskintoagapmarketrisk.Adetailedandinstructiveworkedexample of this mechanism is given in Gregory (2010, Section 8.6.4). I willbuildonGregory'sexampleinthediscussionthatfollows,butwithonlyabriefsketchofGregory'sdetails.Intheexample,themarket-makingfirmbuysorissuesa$100millioncredit-
linkednote(CLN)andentersintoatotalreturnswapontheCLNwithahedgefund. The hedge fund posts $10 million in initial margin and benefits fromhavingahighlyleveragedposition,receivingareturnonthe$100millionnotewhile only needing to invest $10 million in collateral. The downside for themarket maker is that it knows that if the market value of the CLN starts todeclinetoward$90million,itishighlyunlikelythatthehedgefundwillbeableto post additional margin, since the hedge fund, under the circumstances thatcreditspreadshaverisenhighenoughtocreatethissizemarketlossontheCLN,willlikelybeintroubleduetoitshighleverageandprobablelossesonsimilartrades.The market maker's trading desk knows it is unlikely to get any credit for
margincallprovisionsduetotheextremewrong-wayrisk.ApossiblealternativeistoexcludethemargincallprovisionbutinsteadputinaprovisionthatifthevalueoftheCLNgetstooclosetoexhaustingthe$10millioninitialmargin,themarket maker has the right to close out the position and sell the CLN. InGregory'sexample,aprovisionissetthatifthevalueoftheCLNisatorbelow
$92.2 million, the position can be closed out. This is supposed to leave theevaluationofthetradeentirelytomarketriskmanagerssincethereisnocreditriskcomponentremaining.Theonlylossestothemarketmakercanoccurifthegapbetweenthe$92.2milliontriggerpointandthepriceatwhichtheCLNcanbesoldexceedsthe$2.2millionofremaininginitialmargin.ItistheprobabilityofthislargemarketmoveoccurringthatissupposedtobeevaluatedbystandardmarketriskVaRandstresstestmethodologies.Ihavealwaysbeendubiousof this typeofattemptedend run. I think it just
replacesoneformofwrong-wayriskwithanotherformofwrong-wayrisk:thehighcorrelationbetweenlargedrops inpriceof theCLNandlargesubsequentgap moves. The fundamental flaw in the appeal to VaR and stress testmethodologies in evaluating the gap risk is that VaR and stress testing aredesigned to evaluate the risk of current positions based on current marketconditions.Forgaprisk,wearebeingaskedtoevaluateafuturepositionunderfuturemarketconditionsandonethatwillbetriggeredbyconditionslikelytobeunfavorable to us. As such, they fall under one of the criteria proposed foractuarial risk in Section 6.1.1, positions that can be liquidated only underrestrictiveconditions.Hence,theyshouldbeevaluatedusingthetoolsofSection8.4,withveryconservative reserves toallowfor the illiquidityof theposition.Subjectivejudgmentbyriskmanagementwouldberequiredastothesizeofgapmoves that could occur following the very negativemarket events thatwouldcausethetriggertobereached.Onemorevariantofextremewrong-wayriskistheliquidityputsdescribedin
Section5.2.5.2.Hereaninvestmentbankwassellinganextremelyilliquidasset,asuper-seniortrancheofaCDO,butwiththeprovisionthatifthefirmbuyingthis asset encountered funding difficulties it could sell the asset back to theinvestment bank at par. This type of transaction should be treated for stresstestingpurposesasiftheassethadnotbeensoldatall—thefirmbuyingtheassetwould probably run into funding difficulties only in a period of widespreadfinancial distress, exactly the circumstances in which the asset is likely to beworthsignificantlylessandbeevenhardertofindanotherbuyerfor.Sincetheassessmentofthepotentiallossesontheassetwerethatitwouldlosesignificantvalueonlyinaperiodofunlikelywidespreadfinancialdistress,allowingittobeplaced back to the investment bank in these circumstances reduces the riskreductionforstresstestingpurposesofsellingtheassettoanegligibleamount.We now turn to the details of simulation incorporating correlation between
defaultprobabilitiesandmarketvariablesforthoseinstancesofwrong-wayand
right-wayriskthatdorequirefullcalculation.Insteadofassumingthatdefaultoccursindependentofmarketvariables,wenowdirectlysimulatedefaultprobabilitiesandallowtheMonteCarlosimulationtoworkfromthesedefaultprobabilitiestoassigndefaultstoparticularpathsandtimeperiods.Expectedandnear-maximumexposurevaluesarecomputedfromonlythosepointsatwhichdefaulthasoccurred.Ifthosedefaultpointsarecorrelatedwithmarketvalueofthederivativespositions,thiswillbereflectedinthesimulationresults.Correlationsbetweendefaultprobabilitiesandmarketvalueswillneedtobeestablishedbyacombinationofsubjectivejudgmentsbasedoneconomicinsightandstatisticalstudiesofcorrelationsbetweenmarketvariablesandcreditspreadsasaproxyfordefaultprobabilities.Muchdependsonthedegreeofbusinessdiversificationofacounterparty.Acounterpartywithmanybusinesslinesindifferentcountriesanddifferentindustriesisfarlesslikelytobesubjecttowrong-wayriskthanacounterpartywithahighlyconcentratedbusiness.Oneofthemostobviousexamplesofwrong-wayriskstemsfromcountryrisk.Acounterpartywhosefinancialhealthisverydependentonbusinessinasinglecountryislikelytohaveahighcorrelationbetweenitsdefaultprobabilityandtheexchangerateandinterestratesofthatcountry.Thismostfrequentlyimpactslong-termFXforwardsorcross-currencyswaps.AspointedoutbyGregory(2010,Section8.2.3),“anotherwaytolookatacross-currencyswapisthatitrepresentsaloancollateralizedbytheoppositecurrencyintheswap.Ifthiscurrencyweakensdramatically,thevalueofthecollateralisstronglydiminished.ρAbusinesswhoseviabilityislikelytobestronglyimpactedbythepriceofaparticularcommoditysuchasoilshouldshowastrongcorrelationbetweendefaultprobabilityandthecommodityprice.CorrelationsbetweendefaultprobabilitiesoffirmsbasedonindustryandcountryhavealreadybeendiscussedinSection13.3.1.Thiscanhaveastrongimpactifacounterpartyishighlycorrelatedwithafirmonwhichitiswritingcreditprotectionthroughacreditdefaultswap(CDS).Oneoftheprincipalsourcesofwrong-wayriskhistoricallyhasbeentheuseofCDScounterpartiescloselyrelatedtothefirmonwhichprotectionisbeingpurchased.ThecreditportfoliosimulationsofSection13.3.2shouldbeabletocapturethis.Consider,forexample,aloantoCompanyABCforwhichcreditprotectionhasbeenpurchasedfromCompanyXYZthroughaCDS.
NolosswilloccurifABCdefaultsandXYZhasnotdefaulted,since,inthiscircumstance,XYZmustpayallthecostsoftheABCdefault.IfXYZdefaultsandABChasnotdefaulted,thefirmwillhavealoss(orgain)equaltothereplacementcostoftheCDS,whichisdrivenbychangesinthecreditspreadforABC.Thesimulationcalculatesthisbykeepingtrackofchangesindefaultprobabilitiesandcreditspreadsforbothfirmsalongeachsimulationpath,takingthepropercorrelationbetweenthedefaultprobabilitiesofthetwofirmsintoaccount,andlinkingthedefaultprobabilityofABCtothecreditspreadofABC.Gregory(2010,Section8.4)providesmoredetailandexamplesillustratingwrong-wayriskonCDSs,andinSection8.5extendsthisanalysistowrong-wayriskonCDOs.Asignificantsourceofwrong-wayriskiscounterpartieswhoderiveamajorportionoftheirrevenuesfromfinancialtransactions.Insuchcases,anestimatemustbemadeofhowmuchofthecounterparty'stradingpositionsaresimilartothoseonwhichyourfirmholdspositionswiththecounterparty.Themoresimilaroveralltradingpositionsaretothosewithyourfirm,themorelikelythatdefaultprobabilityhasahighcorrelationwithmarketvariablesimpactingthosepositions.
Whilesimulationisarequirementforaccuracyinmeasuringwrong-wayrisk,formulas can be utilized for quick approximations that are useful in gainingintuition and to guide initial discussions between derivative traders and loanofficers. Examples of useful formulas and illustrated cases can be found inGregory(2010,Section8.3)andWinters(1999).
14.3.5TheActiveManagementApproachThe third,andnewest, approach tomanagingcounterpartycredit risk forOTCderivativesinvolvestheactiveuseofpurchasedcreditprotectionthroughCDSs(or, equivalently, by short selling of bonds). As such, it shares many of thecharacteristics of active management of credit portfolios discussed in Section13.3.4, involving trade-off decisions aboutwhen topurchaseprotectionversuswhen to self-insure by extending credit lines, the communication of internalpricingofnewcreditextensionsbasedonacombinationofthecosttopurchaseCDSprotectionand thecostof requiredcapitalagainst self-insurance risk, theactiveinvolvementofmarketersandtradersinmakingjudgmentsaboutwhetherthe extension of new credit is worth paying the internal charge, and themanagement by a central unit of the cost of loan defaults against the revenue
accumulatedbyinternalchargesforcreditextension.Thedifferencebetweentheactivemanagementofcounterpartycreditriskandofportfoliocreditriskisthatcounterpartycredit riskactivemanagement involvessimultaneousmanagementofthecostofcreditexposureandthedynamicchangesinsizeofcreditexposuredue to changes in themarket value of counterparty positions. This requires avery specialized skill set that has ledmost large derivatives dealers to set upspecialized business units (counterparty risk groups [CRGs]) for the dynamicmanagement of counterparty credit risk.Gregory (2010, Chapter 12) gives anextendeddiscussionofhowthisisdone.Thecentralizedunitformanagingcounterpartyexposurewillneedtocreatea
mechanism for charging tradingdesks forprotection against counterparty risk.Thismechanismmust followmanyof the same criteria as outlined inSection13.3.4inthecontextofthemoregeneralissueofhowtochargemarketingareasfortheextensionofcreditrisk,butwiththeaddedcomplexitiesofestimatingthecreditexposurearisingfrommarketmovements.Thesechargesshouldcreatetheincentives for tradingdesksandderivatives structurers todesigncontracts thatminimize credit use. There will be trade-offs between customer desire tominimize the use of devices such as margin calls and the reduction in creditchargesthatresultfromsuchdevices.Itisthetaskoftradersandstructurerstofindcleverdesignsthatbringthegreatestreductionincreditchargefortheleastamountofcustomerdissatisfaction.To the extent this counterparty risk group (CRG) decides to manage
counterpartycreditriskwiththepurchaseofCDSprotection,itrequirestheuseof dynamic hedging techniques originally developed for multiasset exoticderivatives such as quantos.The size ofmarket exposure at any instant is theproduct of the credit spread of the counterparty and the size of the creditexposure. As we illustrated in Section 12.4.5, this requires dynamic hedging,with a change in derivative value requiring a change in the size of the credithedge, and a change in the credit spread requiring a change in the size of thederivative hedge. Essentially, this method amounts to replacing the derivativewithanothercounterparty,notallatonceondefault,butgraduallyastheoriginalcounterparty's credit worsens. Correlation assumptions, driven by wrong-wayexposure concerns, will have the intuitively correct effect of increasing theexpected cost of the dynamic hedge. The CrossHedge spreadsheet gives adetailedexampleofthedynamichedgingofacounterpartycreditpositionwithresultsshowninTable12.13.What the example in Section 12.4.5 illustrates is that, to a good degree of
accuracy, the dynamic hedge allows locking in credit protection on thecounterparty at the current market credit spread, even though the amount ofcredit protection will vary over time in a stochastic fashion. This is quitecounterintuitive—itwould seem that if credit spreadswidenedat the time thatexposure grows you would need to purchase some of the credit protection athigher spreads.But the dynamic hedging approachmeans that you are alwayssimultaneously hedged against both changes in credit spread and changes inexposure (always with the exception that correlation in price movementsbetween the credit spread and the market exposure caused by wrong-wayexposure leads to extra costs).This allows theCRG to be able to price creditexposure at the time of agreeing to the derivatives contract with reasonableconfidence.While the example in Section 12.4.5 is written from the point ofviewofcreditprotectiononasinglederivativescontract,themechanismactuallyworks for covering an entire portfolio of derivatives—essentially, you justsubstitute the volatility of the whole portfolio for the volatility of the singlecontract.Inpractice,aCRGwillchoosetouseCDShedgingonsomeexposuresandnot
on others—some counterparties will not have sufficient liquidity in the CDSmarket to allow the dynamic hedging technique to be used; for othercounterpartiesthecreditmanagerswilljudgethattheirviewofthecreditriskofthename ismore favorable thanwhat ispriced into theCDSmarket and theywillchoosetoself-insureforthatname,atleastforatime.Inothercases,mixedapproaches will be taken—names that lack a liquid CDS market but whoseexposure is at an uncomfortable level for the credit managers will be proxyhedgedwithabasketofmoreliquidCDSsonsimilarnamesbeingusedtohedgea basket of less liquid names, with the risk having been transformed fromoutrightdefaultrisk to thebasisriskondefaultexperienceof thebaskethedgeanddefaultexperienceoftheactualbasket.Thesimultaneousdynamichedgingofcreditspread(fortheproxybasket)andmarketexposureworksinthiscaseaswell.Whenutilizingdynamichedgingofcounterpartycreditexposure,aCRGwill
need to utilize riskmeasures similar to those we have discussed for dynamichedging of options in Section 11.4, but with the added complications thatexposures to credit and tomarketvariables arebeingmanaged simultaneouslyand that credit risk requires riskmeasures that include exposure to immediatedefault. A thorough discussion of the riskmeasures required can be found inGregory(2010,Chapter9).

OneissueforCRGsthathasbeenmuchdebatedandishighlightedbyGregory(2010)inSection12.4.4iswhethertheCRGshouldengageindynamichedgingof themarket exposure of a derivatives book in a casewhere it is completelyself-insuring the credit risk for that counterparty. Unlike the dynamic cross-hedging examples just given, there is no cost of aCDS position that is beingoffsetbythemarketexposurehedge.All that isbeinghedgedisanaccountingentryof themark-to-marketof theself-insurancestrategy.Theeconomicvalueofpayingmoneytohedgeaccountingentriesisregardedwithextremesuspicionby many risk management practioners, myself included. But if there is someformofactivehedgingintheCDSmarket,evenifitisonlyagainstabasketofnamesthatprovidealiquidproxy,thenIwouldfinddynamichedgingofmarketexposuretobequitereasonable.In takingovermanagementof thecounterpartycredit riskofderivatives, the
CRG must be prepared to manage all aspects of a counterparty default (seeGregory2010,Section12.2.6).ThisincludesthesettlementprocessonanyCDSprotection that has been purchased (which may involve delivery squeezes, asdiscussedinSection13.1.1.2),thelegalprocessforrecoveryofamountsowed,and responsibility for the liquidity costs of replacing defaulted contracts. TheCRGmustfactorallofthesepossiblecostsintoitspricingofdefaultinsurancetothefirm'stradingdesks.There are other strategies that aCRG can pursue in providing protection. It
might, for example, contact a counterparty with which the firm has a largeoutstandingexposureandseektonegotiateareductioninexposure.Thiscouldbe especially attractive if deterioration in this counterparty's credit outlookcauses particular concern to the firm's credit risk managers. Reduction inexposurecouldcomeinseveraldifferentforms:aone-timepostingofmarginorrenegotiating the terms of existing contracts to provide for tighter terms onpostingofmargin.Ofcourse,postingmarginortighteningmarginrequirementsiscostlytothecounterparty,sosomeconcessionmustbeofferedasinducement—probablyasarenegotiationofthefinancialtermsofthederivativecontractstomake strikes or spreads more favorable to the counterparty. The CRG wouldneed tocompensate the relevant tradingdesk foranysuchpricingconcessionsandmustjudgewhetherthisup-frontcostisworththereductionincreditrisk.Another strategy that a CRG could pursue in reducing exposure to a
counterparty is to offer the counterparty a mutual reduction in exposure—reducingthecounterparty'screditexposuretothefirmbychangingthefinancialterms on some derivative contracts on which the firm owes money to the
counterparty in exchange for reducing the firm's credit exposure to thecounterparty by changing the financial terms on some derivative contracts onwhich the counterparty owes money to the firm. These changes in financialtermscanbedoneinsuchawayastoleavethenetamountowedbyonepartytothe other unchanged, but with lower gross amounts owed.While netting andcloseoutmasteragreementsaccomplishmuchthesamething,actualreductioningrossamountsowedreducestheamountsthatwillbeincontentioninlitigationthatfollowsadefault,andthusofferspositivebenefits.Agreaterimpactonexposurescouldbeachievedbymovingbeyondbilateral
negotiationsforchangedfinancial termstomultilateralnegotiations inwhichacounterparty's exposure to one firm is reduced in exchange for a reduction inanother firm's exposure to the counterparty. This results in actual reduction incredit exposure, not just the reduction of litigation risk of the bilateralnegotiation of changed financial terms discussed previously. Here's a simpleillustration.SupposeBankAcurrently is owed$50millionon an interest rateswapbyCounterpartyB,andBankCcurrentlyowesCounterpartyB$50milliononanFXforward.IfCounterpartyBiswillingtorenegotiatethefinancialtermsonthesetwocontracts,itwouldnothavetomakeanypayments,sincethe$50millionitwouldowetoBankAfortherenegotiationwouldbeoffsetbythe$50millionitisowedbyBankC.BankCwouldowea$50millionpaymenttoBankA,butBankAwouldofferBankCsomediscountonthisasaninducementtoloweringBankA'screditexposuretoCounterpartyBandtocompensateBankCfor losing the cushion it had against having a credit exposure to B. Insummation,BankAbenefitsfromreducedcreditexposurebutmayhavetopaysomethingforit,CounterpartyBisnotimpactedandinfactmightgainslightlybyreducedcreditexposuretoBankC(thoughitmayaskforsomepaymentfromBankAforitscooperation),andBankCwillbenefit totheextentitreceivesapayment from Bank A. Other creditors of Counterparty B are potentiallydisadvantaged, since in a default they would no longer have a claim on theamountowed toBbyBankA,but theyhavenostanding in the transactionaslongasBisagoingconcern.Variantsofthislasttransactionhavebeenintroducedasawayforderivatives
marketmakerstolowercreditusageonderivativestransactionsbetweenmarketmakers,andtherebyfreeupcreditlines.Forexample,severalmarketmakersgettogetherandengageintradecompression,inwhichthemarketmakersidentifyasetofderivativetransactionsthatcanbecanceledandreplacedbyanothersetofderivativetransactions,leavingmarketexposuresclosetounchangedbutwitha

significant decrease in credit exposures. In addition to canceling trades thatoffsetoneanother inmarket exposure, slightdifferences incontractdetail thathavelittleimpactonmarketexposurecanbeeliminatedtoincreasepossibilitiesfor contract cancellation. Some vendors now offer analytical services fordevelopingproposedreplacementsthatoptimizethereductionincreditexposurethat can be achieved by trade compression. Vause (2010) has a thoroughdiscussion of trade compression and similar counterparty credit reductiontechniques with examples. ISDA (2012) provides a detailed exposition ofcompressionintheimportantcaseofinterestrateswapsandillustratesthetrade-offbetweenafirm'stoleranceforsmallchangesininterestrateexposureandthedegreeofcompressionthatcanbeaccomplished.Generally speaking,havingaderivativespositionwith a counterparty that is
marked tomarket in your favor gives rise to credit exposure, but there is nooffsetting credit benefit from having derivatives positions with a counterpartythatismarkedtomarketagainstyou.ManyCRGshavebeensearchingforwaysto achieve a more symmetrical position. We have just seen (in the next-to-previous paragraph) an example in which a firm can benefit from the creditconsequences of amark-to-market against it, sinceBankCwould be paid byBank A to use its negative exposure to offset A's positive exposure toCounterparty B. But this captures only part of the value of the exposure. Astrategythathasbeenproposedforcapturingthefullvalueoftheexposureistopurchase a bond of the counterparty that you net owemoney to on derivativecontractswithamaturityclosetothatofyourderivativepositions.Let'sconsideranexampletoseehowthismightwork.Let's say you net owe $100 million in derivatives marked to market to a
counterpartyinaweakcreditcondition.Sayyoucanpurchase$100millionfacevalue of its bonds for $90 million owing to its poor credit outlook. If thecounterpartydoesnotdefault,thenyougain$10millionfromthebondthatyoupurchasedat$90millionmaturingat$100million.Ifitdoesdefault,youcanusethebondyouownasanoffset inbankruptcyproceedingstothe$900youowethecounterpartyonthederivatives.Soyouhavebeenabletousetheamountyouowe on your derivatives contracts to purchase free default protection on thebonds.TheCRGwould,ofcourse,needtodynamicallymanagetheamountofbond it holds tomatch changes in the derivativesmarket exposure in just thesamewayitdynamicallymanagestheamountofCDSprotectionitbuyswhenitis owedmoney on the derivatives position. The risk of this strategy is that abankruptcycourtcouldpossiblyobjecttooffsettingthederivativespositionand

thebondholding.Finally,oneoptionforaCRGwouldbetojustpurchasecompleteprotection
against the counterparty credit risk on a particular derivatives trade through acontingentcreditdefaultswap(CCDS).ThisisaCDSthatintheeventofdefaultpays the amount that has been lost on the referenced derivatives trade. So, ineffect, theCRG is turning themanagementof credit riskon this tradeover toanotherfirm.ThefirmsellingtheCCDSwillhavealloftheissuesofmanagingriskonthistradethatwehavediscussedthroughoutthischapterandwillneedtobe paid accordingly. There are many negatives arguing against the use of aCCDS,suchas themismatchbetween theamountofprotectionpurchasedandthe amount of protection actually needed, since buying protection on a singletransactioncannottakereductioninexposurethroughnettingandmarginingintoaccount.TheCCDS is thereforeprobablya solution foronlyvery large singletransactions that are unlikely to have much offset against them. A thoroughdiscussionofCCDSscanbefoundinGregory(2010,Section9.8.2).

References
Acopyof this references listwill bemaintainedon thewebsite for this book,withongoingupdatestotheInternetsitesreferenced.Acharya, Viral, Matthew Richardson, Stijn van Nieuwerburgh, and LawrenceWhite.2011.GuaranteedtoFail.Princeton,NJ:PrincetonUniversityPress.Agrawal, Deepak, Navneet Arora, and Jeffrey Bohn. 2004. “Parsimony inPractice, and EDF-Based Model of Credit Spreads.” Moody's KMV.www.moodysanalytics.com/~/media/Insight/Quantitative-Research/Credit-Valuation/04-29-04-Parsimony-in-Practice.ashx.Allen, Peter, Stephen Einchcomb, and Nicholas Granger. 2006. “VarianceSwaps.” J.P. Morgan Securities European Equity Derivatives ResearchInvestmentStrategiesno.28.Allen, Steven, and Otello Padovani. 2002. “Risk Management Using Quasi-StaticHedging.”EconomicNotes31(2):277–336.Almgren, Robert, and Neil Chriss. 2001. “Optimal Execution of PortfolioTransactions.”JournalofRisk3(2):5–39.Altman,Edward,Neil Fargher, andEgonKalotay. 2010. “ASimpleEmpiricalModel of Equity-Implied Probabilities of Default.”http://pages.stern.nyu.edu/~ealtman/DefaultModel2010JFI.pdf.Altman,Edward, andEgonKalotay.2010. “AFlexibleApproach toModelingUltimate Recoveries on Defaulted Loans and Bonds.”http://pages.stern.nyu.edu/~ealtman/FlexibleRecovery_v1.1.pdf.Altman, Edward, Andrea Resti, and Andrea Sironi. 2001. “Analyzing andExplainingDefaultRecoveryRates.”www.defaultrisk.com/pp_recov_28.htm.Amato, Jeffery, and Eli Remolona. 2003. “The Credit Spread Puzzle.” BISQuarterlyReview(December).www.bis.org/publ/qtrpdf/r_qt0312e.pdf.Andersen,Leif,andJesperAndreasen.2000.“StaticBarriers.”Risk9:120–122.Andersen,Leif,andJesperAndreasen.2001.“FactorDependenceofBermudanSwaptions:FactorFiction?”JournalofFinancialEconomics62(1):3–37.Anderson,Leif, JakobSidenius,andSusantaBasu.2003.“AllYourHedges inOne Basket.” Risk 11:67–72.www.risk.net/data/Pay_per_view/risk/technical/2003/1103_credit_der.pdf.

Araten, Michel, and Michael Jacobs. 2001. “Loan Equivalents for RevolvingCredits and Advised Lines.” RMA Journal 5:34–39.http://michaeljacobsjr.com/Jacobs_Araten_RMA_LEQ_Pub_April_2001.pdf.Artzner, Philippe, Freddy Delbaen, Jean-Marc Eber, and David Heath. 1997.“Thinking Coherently.” Risk 11:68–71. A longer version is available atwww.math.ethz.ch/~delbaen/ftp/preprints/CoherentMF.pdf.Ashcroft,Adam,andTilSchuermann.2008.“Understanding theSecuritizationof Subprime Mortgage Credit.” Federal Reserve Bank of New York StaffReportsno.318.www.newyorkfed.org/research/staff_reports/sr318.pdf.Asiaweek. 1996. “Perils of Profit.” July 5. www-cgi.cnn.com/ASIANOW/asiaweek/96/0705/ed2.html.Bahar, Reza, and Krishan Nagpal. 2000. “Modeling the Dynamics of RatingTransition.”Credit3:57–63.Bai,Jennie,andPierreCollin-Dufresne.2011.“TheCDS-BondBasisduringtheFinancial Crisis of 2007–2008.” http://papers.ssrn.com/sol3/papers.cfm?abstract_id =1785756ttp://papers.ssrn.com/sol3/papers.cfm?abstract_id=1785756.BaselCommitteeonBankingSupervision.2009a.“Principles forSoundStressTestingPracticesandSupervision.”www.bis.org/publ/bcbs155.pdf.Basel Committee on Banking Supervision. 2009b. “Supervisory Guidance forAssessing Banks' Financial Instrument Fair Value Practices.”www.bis.org/publ/bcbs153.pdf.Baxter, Martin, and Andrew Rennie. 1996. Financial Calculus. Cambridge:CambridgeUniversityPress.Bennett,Oliver.2001.“SplittingHeadaches.”Risk7:36–37.Bluhm, Christian, Ludger Overbeck, and Christoph Wagner. 2002. AnIntroductiontoCreditRiskModeling.BocaRaton,FL:CRCPress.Bodie,Zvi,AlexKane,andAlanMarcus.2009.Investments.8thed.NewYork:McGraw-Hill.Bohn, Jeffrey, andRoger Stein. 2009.Active Credit PortfolioManagement inPractice.Hoboken,NJ:JohnWiley&Sons.Bookstaber,Richard.2007.ADemonofOurOwnDesign.Hoboken,NJ: JohnWiley&Sons.Bouchet,Michel,EphraimClark,andBertrandGroslambert.2003.CountryRisk

Assessment.Chichester,England:JohnWiley&Sons.Brealey, Richard, Stewart Myers, and Franklin Allen. 2011. Principles ofCorporateFinance.10thed.NewYork:McGraw-Hill.Breuer,Thomas,andImreCsiszar.2010.“StressTests:FromArts toScience.”https://homepages.fhv.at/tb/cms/?Working_Papers.Breuer,Thomas,andGreraldKrenn.2000.“IdentifyingStressTestScenarios.”http://citeseerx.ist.psu.edu/viewdoc/summary?doi=10.1.1.27.118.Brindle, Andy. 2000. “Calculating with Counterparties.” Risk 1:100–103.www.risk.net/data/Pay_per_view/risk/technical/2000/risk_0100_jpmorgan.pdf.Broadie, Mark, Paul Glasserman, and Gautam Jain. 1997. “Enhanced MonteCarloEstimatesofAmericanOptionPrices.”JournalofDerivatives5 (1):25–44. A closely related article can be found atwww.axelkind.com/teaching/financial_derivatives/papers/broadie_glasserman_1997_jedc.pdfBroom, Giles. 2011. “UBS in ‘Disarray.'” Bloomberg News. September 26.www.bloomberg.com/news/2011-09-25/ubs-in-disarray-as-gruebel-quits-ermotti-named-interim-chief.html.Brown,Aaron.2012.Red-BloodedRisk.Hoboken,NJ:JohnWiley&Sons.Bruck,Connie.1988.ThePredators'Ball.NewYork:Penguin.Brunnermeier, Markus. 2009. “Deciphering the Liquidity and Credit Crunch2007–2009.” Journal of Economic Perspectives 1:77–100.www.princeton.edu/~markus/research/papers/liquidity_credit_crunch.pdf.Bucay,Nisso,andDanRosen.2001.“ApplyingPortfolioCreditRiskModelstoRetail Portfolios.” Journal of Risk Finance 3:35–61.www.financerisks.com/filedati/WP/ALGO_PAPER/ch5_retail.pdf.Burghardt,Galen,andGeraldHanweck.1993.“Calendar-AdjustedVolatilities.”In Volatility: New Estimation Techniques for Pricing Derivatives, edited byRobertJarrow.London:RiskBooks.Burghardt,Galen,andSusanKirshner.1994.“OneGoodTurn.”Risk11:44–54.Canabarro, Eduardo, and Darrell Duffie. 2003. “Measuring and MarkingCounterparty Risk.” In Asset/Liability Management of Financial Institutions,edited by Leo Tilman, Chapter 9. London: Euromoney Books.www.darrellduffie.com/uploads/surveys/DuffieCanabarro2004.pdf.Carr, Peter. 2001. “Closed Form Barrier Option Valuation with Smiles.”www.math.nyu.edu/research/carrp/papers/pdf/closed4.pdf.

Carr, Peter, and Andrew Chou. 1996. “Breaking Barriers.” Risk 9:139–145.www.math.nyu.edu/research/carrp/papers/pdf/breakingbarriers.pdf.Carr, Peter, and Andrew Chou . 1997. “Hedging Complex Barrier Options.”www.math.nyu.edu/research/carrp/papers/pdf/multipl3.pdf.Carr, Peter, Katrina Ellis, and Vishal Gupta. 1998. “Static Hedging of ExoticOptions.”JournalofFinance53(3):1165–1190.Carr,Peter,andDilipMadan.2002.“TowardsaTheoryofVolatilityTrading.”www.math.nyu.edu/research/carrp/papers/pdf/twrdsfig.pdf.Cass,Dwight.2000.“TheDevil'sintheDetails.”Risk8:26–28.Chew, Lillian. 1996.Managing Derivatives Risks. New York: John Wiley &Sons.Chriss,Neil.1997.Black-ScholesandBeyond.Chicago:Irwin.Clementi, Gian Luca, ThomasCooley,MatthewRichardson, and IngoWalter.2009. “Rethinking Compensation in Financial Firms.” InRestoring FinancialStability,editedbyViralAcharyaandMatthewRichardson.Hoboken,NJ:JohnWiley&Sons.Clewlow, Les, and Chris Strickland. 1998. Implementing Derivatives Models.NewYork:JohnWiley&Sons.Cochrane,John.2001.AssetPricing.Princeton,NJ:PrincetonUniversityPress.Cordell,Larry,YilinHuang,andMeredithWilliams.2012.“CollateralDamage:SizingandAssessing theSubprimeCDOCrisis.”WorkingPaperNo.11-30/R,Research Department, Federal Reserve Bank of Philadelphia.www.philadelphiafed.org/research-and-data/publications/working-papers/2011/wp11-30.pdf.CounterpartyRiskManagementPolicyGroup. 1999. “ImprovingCounterpartyRiskManagementPractices.”www.defaultrisk.com/pp_other_08.htm.Coval, Joshua, Jakub Jurek, and Erik Stafford. 2008. “The Economics ofStructured Finance.” Harvard Business School Working Paper no. 09-060.www.hbs.edu/research/pdf/09-060.pdf.CreditGrades. 2002. “CreditGrades Technical Document.” RiskMetrics Group.www.msci.com/resources/research/technical_documentation/CGtechdoc.pdf.Crosbie,Peter,andJeffBohn.2003.“ModelingDefaultRisk.”Moody'sKMV.www.moodysanalytics.com/~/media/Insight/Quantitative-Research/Default-and-Recovery/03-18-12-Modeling-DefaultRisk.ashx.
Crouhy,Michel, Dan Galai, and RobertMark. 2001.RiskManagement. NewYork:McGraw-Hill.Culp,Christopher.2001.TheRiskManagementProcess.NewYork:JohnWiley&Sons.Culp, Christopher, and Merton Miller. 1995a. “Hedging in the Theory ofCorporate Finance: A Reply to Our Critics.” Journal of Applied CorporateFinance(Spring):121–127.Culp, Christopher, and Merton Miller. 1995b. “Metallgesellschaft and theEconomics of Synthetic Storage.” Journal of Applied Corporate Finance(Winter):62–75.www.rmcsinc.com/articles/JACF74.pdf.Dash,Eric,andJulieCreswell.2008.“CitigroupSawNoRedFlagsEvenasItMadeBolderBets.”NewYorkTimes,November22.Davidson, Andrew. 2007. “Six Degrees of Separation.”www.securitization.net/pdf/content/ADC_SixDegrees_1Aug07.pdf.Davidson,Andrew,AnthonySanders,Lan-LingWolfe,andAnneChing.2003.Securitization.Hoboken,NJ:JohnWiley&Sons.Davies, Rob. 2008. “Genius or Blunder?” Risk. 3:22–27. www.risk.net/risk-magazine/feature/1498128/genius-blunder.Dembo, Ron. 1994. “Hedging in Markets That Gap.” In Handbook ofDerivatives and Synthetics, edited by Robert A. Klein and Jess Lederman.Chicago:Probus.Demeterfli,Kresimir,EmanuelDerman,MichaelKamal,andJosephZou.1999.“Guide to Variance Swaps.” Risk 6:54–59. A longer version is available atwww.ederman.com/new/docs/gs-volatility_swaps.pdf.Derivative Strategies. 1998. “What Really Happened at UBS?” October.www.derivativesstrategy.com/magazine/archive/1998/1098fea1.asp.Derman, Emanuel. 1999. “Regimes of Volatility.” Risk 4:55–59. A longerversion is available at www.ederman.com/new/docs/risk-regimes_of_volatility.pdf.Derman,Emanuel. 2001. “Markets andModels.”Risk 7:48–50.My referencesare primarily to the longer version available atwww.ederman.com/new/docs/risk-price_verification.pdf.Derman, Emanuel, Deniz Ergener, and Iraj Kani. 1995. “Static OptionsReplication.”JournalofDerivatives2(4):78–95.

Derman,Emanuel,andIrajKani.1994.“RidingonaSmile.”Risk2:32–39.Derman, Emanuel, and Iraj Kani . 1998. “Stochastic Implied Trees.”International Journal of Theoretical and Applied Finance 1 (1): 61–110. Alonger version is available at www.ederman.com/new/docs/gs-options_replication.pdf.Derman, Emanuel, and Joseph Zou. 2001. “A Fair Value for the Skew.”Risk1:111–114.deServigny,Arnaud,V.Peretyatkin,W.Perraudin, andOlivierRenault. 2003.“Portfolio Risk Tracker: Description of theMethodology.” Standard & Poor'sRiskSolutions.de Servigny, Arnaud, and Olivier Renault. 2004. Measuring and ManagingCreditRisk.NewYork:McGraw-Hill.DeWit,Jan.2006.“ExploringtheCDS-BondBasis.”NationalBankofBelgiumworkingpaper.www.nbb.be/doc/ts/publications/wp/wp104En.pdf.Diebold, Francis, Til Schuermann, and John Stroughair. 2000. “Pitfalls andOpportunities in the Use of Extreme Value Theory in RiskManagement.” InExtremesandIntegratedRiskManagement,editedbyPaulEmbrechts.London:RiskBooks.www.ssc.upenn.edu/~fdiebold/papers/paper21/dss-f.pdf.Dixit, Avinash, and Robert Pindyck. 1994. Investment under Uncertainty.Princeton,NJ:PrincetonUniversityPress.Dowd,Kevin.2005.MeasuringMarketRisk.2nded.Hoboken,NJ:JohnWiley&Sons.Duc,Francois,andYannSchorderet.2008.MarketRiskManagementforHedgeFunds.Hoboken,NJ:JohnWiley&Sons.Duffie,Darrell.2011.HowBigBanksFail.Princeton,NJ:PrincetonUniversityPress.Duffie, Darrell, Andreas Eckner, Guillaume Horel, and Leandro Saita. 2009.“Frailty Correlated Defaults.” Journal of Finance. 5:2089–2123.www.darrellduffie.com/uploads/pubs/DuffieEcknerHorelSaita2009.pdf.Duffie,Darrell,AdaLi, andTheoLubke. 2010. “PolicyPerspectives onOTCDerivativesMarketStructure.”FederalReserveBankofNewYorkStaffReportsno.424.www.newyorkfed.org/research/staff_reports/sr424.pdf.Duffie, Darrell, and Kenneth Singleton. 2003. Credit Risk. Princeton, NJ:PrincetonUniversityPress.

Dunbar, Nicholas, and Elisa Martinuzzi. 2012. “Goldman Secret Greek LoanShows Two Sinners as Client Unravels.” Bloomberg News, March 5.www.bloomberg.com/news/2012-03-06/goldman-secret-greece-loan-shows-two-sinners-as-client-unravels.html.Dwyer,Paula.1996.“Sumitomo'sDescentintotheAbyss.”BusinessWeek,July1.www.businessweek.com/1996/27/b348241.htm.Eichenwald,Kurt.1995.SerpentontheRock.NewYork:HarperBusiness.Embrechts,Paul.2000.“ExtremeValueTheory:PotentialandLimitationsasanIntegratedRiskManagementTool.”DerivativesUse, Trading, and Regulation6:449–456.www.math.ethz.ch/~baltes/ftp/evtpot.pdf.Fabozzi,Frank,SergioFocardi,andPetterKolm.2006.FinancialModelingoftheEquityMarket.Hoboken,NJ:JohnWiley&Sons.Fabozzi, Frank, Sergio Focardi, and Petter Kolm. 2010. Quantitative EquityInvesting:TechniquesandStrategies.Hoboken,NJ:JohnWiley&Sons.Falloon,William.1998.“TheDevilintheDocumentation.”Risk11:32–35.Fay,Stephen.1996.TheCollapseofBarings.London:RichardCohenBooks.FederalReserveBoard. 2009. “The SupervisoryCapitalAssessment Program:Design and Implementation.”www.federalreserve.gov/bankinforeg/bcreg20090424a1.pdf.Federal Reserve Board. 2011. “Supervisory Guidance on Model RiskManagement.”www.federalreserve.gov/bankinforeg/srletters/sr1107a1.pdf.FinancialCrisisInquiryReport.2011.NewYork:PublicAffairs.Downloadableatwww.gpo.gov/fdsys/pkg/GPO-FCIC/pdf/GPO-FCIC.pdf.Financial Stability Board. 2010. “Implementing OTC Derivatives MarketsReforms.”www.financialstabilityboard.org/publications/r_101025.pdf.Financial Stability Forum. 2008. “Enhancing Market and InstitutionalResilience.”www.financialstabilityboard.org/publications/r_0804.pdf.Financial Stability Forum. 2009a. “Addressing Procyclicality in the FinancialSystem.”www.financialstabilityboard.org/publications/r_0904a.pdf.Financial Stability Forum. 2009b. “Principles for Sound CompensationPractices.”www.financialstabilityboard.org/publications/r_0904b.pdf.Garfield,Andrew. 1998. “PeterYoungChargedwithMorganGrenfell Fraud.”The Independent. October 20. www.independent.co.uk/news/business/peter-young-charged-with-morgan-grenfell-fraud-1179481.html.

Gatheral,Jim.2006.TheVolatilitySurface.Hoboken,NJ:JohnWiley&Sons.Giesecke,Kay,andAlexanderShkolnik.2011.“ImportanceSamplingforEventTiming Models.” www.stanford.edu/dept/MSandE/cgi-bin/people/faculty/giesecke/pdfs/is.pdf.Gillen, David, Yoolim Lee, and Bill Austin. 1999. “J.P. Morgan's KoreanDebacle.”BloombergMagazine3:24–30.Glasserman,Paul.2004.MonteCarloMethods inFinancialEngineering.NewYork:Springer-Verlag.Glasserman, Paul, and Jingyi Li. 2005. “Importance Sampling for PortfolioCredit Risk.” Management Science 11:1643–1656.www2.gsb.columbia.edu/faculty/pglasserman/Other/is_credit.pdf.Global Legal Group. 2011. “The International Comparative Legal Guide toSecuritization 2011.” www.iclg.co.uk/index.php?area=4&kh_publications_id=194.Greenlaw, David, Jan Hatzius, Anil Kashyap, and Hyun Song Shin. 2008.“Leveraged Losses: Lessons from the Mortgage Market Meltdown.” U.S.Monetary Policy Forum Report no. 2.http://research.chicagobooth.edu/igm/events/docs/MPFReport-final.pdf.Gregory, Jon. 2010.CounterpartyCreditRisk. Chichester,UK: JohnWiley&Sons.Group of Thirty. 1993. “Global Derivatives Study Group: Practices andPrinciples.”GroupofThirty.2009.“FinancialReform:AFrameworkforFinancialStability.”www.group30.org/images/PDF/Financial_Reform-A_Framework_for_Financial_Stability.pdf.Gumerlock,Robert.1999.“TheFutureofRisk.”Euromoney6:112–114.Gupta,Ajay.1997.“OnNeutralGround.”Risk7:37–41.Gupton, Greg, Christopher Finger, and Mickey Bhatia. 1997. “Creditmetrics-TechnicalDocument.”www.defaultrisk.com/pp_model_20.htm.Gupton, Greg, and Roger Stein. 2005. “Losscalc V2: Dynamic Prediction ofLGD.” Moody's KMV. January.www.defaultrisk.com/_pdf6j4/LCv2_DynamicPredictionOfLGD_fixed.pdf.Hammond, John, Ralph Keeney, and Howard Raiffa. 1999. Smart Choices.Boston,MA:HarvardBusinessSchoolPress.

Hansell, Saul. 1997. “Joseph Jett: A Scoundrel or a Scapegoat?” New YorkTimes,April6.Harris, Larry. 2003. Trading and Exchanges: Market Microstructure forPractitioners.NewYork:OxfordUniversityPress.Hasanhodzic, Jasmina, and Andrew Lo. 2007. “Can Hedge Fund Returns BeReplicated? The Linear Case.” Journal of Investment Management 2:5–45.http://jasminah.com/Papers/hasanhodzic_lo07b.pdf.Helwege, Jean, SamuelMaurer, Asani Sarkar, andYuanWang. 2009. “CreditDefaultSwapAuctions.”FederalReserveBankofNewYorkStaffReportno.372.www.newyorkfed.org/research/staff_reports/sr372.pdf.Henderson, Schuyler. 1998. “Credit Derivatives: Selected DocumentationIssues.”JournalofInternationalBankingandFinancialLaw9.Heston, Steven. 1993. “A Closed-Form Solution for Options with StochasticVolatility.” Review of Financial Studies 6 (2): 327–343.www.javaquant.net/papers/Heston-original.pdf.Holland, Kelley, and Linda Himelstein. 1995. “The Bankers Trust Tapes.”BusinessWeek,October16.www.businessweek.com/1995/42/b34461.htm.Holton,Glyn.2003.Value-at-Risk.SanDiego,CA:AcademicPress.Huertas, Thomas. 2011. Crisis: Cause, Containment and Cure. 2nd ed.Basingstoke,UK:PalgraveMacmillan.Hull,John.2000.Options,Futures,andOtherDerivatives.4thed.UpperSaddleRiver,NJ:PrenticeHall.Hull,John.2002.Options,Futures,andOtherDerivatives.5thed.UpperSaddleRiver,NJ:PrenticeHall.Hull, John. 2009. “The Credit Crunch of 2007.”www.rotman.utoronto.ca/~hull/downloadablepublications/CreditCrunch.pdfqaHull,John.2012.Options,Futures,andOtherDerivatives.8thed.UpperSaddleRiver,NJ:PrenticeHall.Hull,John,MirelaPredescu,andAlanWhite.2004.“TheRelationshipbetweenCreditDefaultSwapSpreads,BondYields,andCreditRatingAnnouncements.”Journal of Banking and Finance (November): 2789–2811.www.rotman.utoronto.ca/~hull/DownloadablePublications/HPWPaperonCDSSpreads.pdfHull, John, andWulin Suo. 2001. “AMethodology forAssessingModelRiskand Its Application to the Implied Volatility Function Model.”

www.rotman.utoronto.ca/~hull/DownloadablePublications/HullSuoPaper.pdf.Hull, John, and Alan White. 1994. “Numerical Procedures for ImplementingTerm StructureModels II: Two-FactorModels.” Journal ofDerivatives 2 (2):37–48.Hull, John,andAlanWhite.2004.“ValuationofaCDOandannth toDefaultCDS without Monte Carlo Simulation.” Journal of Derivatives 2:8–23.www.rotman.utoronto.ca/~hull/DownloadablePublications/HullWhiteCDOPaper.pdfIneichen,Alexander.2003.AbsoluteReturns.Hoboken,NJ:JohnWiley&Sons.InternationalComparativeLegalGuidetoSecuritization.2011.London:GlobalLegalGroup.International Monetary Fund. 2009.Global Financial Stability Report. April.www.imf.org/External/Pubs/FT/GFSR/2009/01/pdf/text.pdf.ISDA.2012.“InterestRateSwapsCompression:AProgressReport.”February23.www2.isda.org/functional-areas/research/studies/.Jackel, Peter. 2002.Monte Carlo Methods in Finance. Chichester, UK: JohnWiley&Sons.Jackwerth, Jens, and Mark Rubinstein. 1996. “Recovering ProbabilityDistributions from Option Prices.” Journal of Finance 51 (5): 1611–1631.www.er.ethz.ch/teaching/Risk_neutral_Proba_Nonparametric_1996.pdf.Jacobs, Michael, and Ahmet Karagozoglu. 2011. “Modeling Ultimate LossGivenDefaultonCorporateDebt.”JournalofFixedIncome1:6–20.Jameson, Rob. 1998a. “Operational Risk: Getting theMeasure of the Beast.”Risk11:38–41.Jameson,Rob.1998b.“OperationalRisk:PlayingtheNameGame.”Risk10:38–42.Jett,Joseph,withSabraChartrand.1999.BlackandWhiteonWallStreet.NewYork:WilliamMorrow.Jewson, Stephen, Anders Brix, and Christine Ziehmann. 2005. WeatherDerivativesValuation.Cambridge:CambridgeUniversityPress.Jorion,Philippe.2007.ValueatRisk.3rded.NewYork:McGraw-Hill.Kagel, J. H., and Alvin Roth. 1995. Handbook of Experimental Economics.Princeton,NJ:PrincetonUniversityPress.Kealhofer,Stephen,andJeffreyBohn.2001.“PortfolioManagementofDefaultRisk.”Moody'sKMV.www.moodysanalytics.com/~/media/Insight/Quantitative-

Research/Portfolio-Modeling/93-15-11-Portfolio-Management-of-DefaultRisk.ashx.Khuong-Huu, Philippe. 1999. “Swaptions on a Smile.” Risk 8:107–111.www.risk.net/data/Pay_per_view/risk/technical/1999/risk_0899_jpmorgan.pdf.Kim, Jongwoo, and Christopher Finger. 2000. “A Stress Test to IncorporateCorrelation Breakdown.” Journal of Risk.www.risk.net/digital_assets/4867/v2n3a1.pdf.Kooi,Mari.1996.“AnalyzingSumitomo.”http://riskinstitute.ch/134800.htm.Kotowitz, Y. 1989. “Moral Hazard.” In The New Palgrave: Allocation,Information, andMarkets, edited by John Eatwell,MurrayMilgate, and PeterNewman.NewYork:W.W.Norton.Koutoulas,James,andJohnRoe.2012.“WhitePaper:Background,Impacts&SolutionstoMFGlobal'sDemise.”www.financialsense.com/node/725.Laurent, JeanPaul,andJonGregory.2003.“BasketDefaultSwaps,CDO'sandFactor Copulas.”http://laurent.jeanpaul.free.fr/basket_cdo_factor_copula_2003.pdf.Lee,Roger.2001.“LocalVolatilitiesunderStochasticVolatility.” InternationalJournalofTheoreticalandAppliedFinance4:45–89.Leeson,Nick,withEdwardWhitley.1996.RogueTrader.Boston:Little,Brown.Leibowitz, Martin, and Alfred Weinberger. 1981. “The Uses of ContingentImmunization.”JournalofPortfolioManagement1:51–55.Leibowitz, Martin, and AlfredWeinberger. 1982. “Contingent Immunization–PartI:RiskControlProcedures.”FinancialAnalystsJournal38(6):17–31.Leibowitz, Martin, and AlfredWeinberger. 1983. “Contingent Immunization–PartII:ProblemAreas.”FinancialAnalystsJournal39(1):35–50.Lewis,Michael.2011.TheBigShort.NewYork:W.W.Norton.Li, David. 2000. “On Default Correlation: A Copula Function Approach.”RiskMetricsWorking Paper no. 99-07. http://papers.ssrn.com/sol3/papers.cfm?abstract_id=187289.Litterman,Robert.1997a.“HotSpotsandHedges,Part1.”Risk3:42–45.Litterman, Robert. 1997b. “Hot Spots and Hedges, Part 2.” Risk 5:38–42.http://home.ku.edu.tr/~cdemiroglu/Teaching/Risk/hotspots.pdf.Litterman, Robert, and Jose Scheinkman. 1988. “Common Factors AffectingBondReturns.”JournalofFixedIncome1(1):54–61.
Lo,Andrew. 2008. “Hedge Funds, SystemicRisk, and the Financial Crisis of2007–2008.” Testimony for the U.S. House of Representatives Committee onOversight and Government Reform November 13 hearing on hedge funds.http://papers.ssrn.com/sol3/papers.cfm?abstract_id=1301217.Lo,Andrew. 2012. “Reading about the Financial Crisis: A 21-BookReview.”Journal of Economic Literature 1:151–178.www.argentumlux.org/documents/JEL_6.pdf.Lowenstein,Roger.2000.WhenGeniusFailed.NewYork:RandomHouse.Lowenstein,Roger.2004.OriginsoftheCrash.NewYork:Penguin.Lowenstein,Roger.2010.TheEndofWallStreet.NewYork:Penguin.Ludwig, Eugene. 2002. “Report on Allied Irish Bank.”www.aibgroup.com/servlet/ContentServer?pagename=AIB_Investor_Relations/AIB_Download/aib_d_download&c=AIB_Download&cid=1015597173380&channel=IRHPMadan,Dilip,PeterCarr,andEricChang.1998.“TheVarianceGammaProcessand Option Pricing.”www.math.nyu.edu/research/carrp/papers/pdf/VGEFRpub.pdf.Malcolm, Fraser, Pawan Sharma, and Joseph Tanega. 1999. Derivatives:OptimalRiskControl.London:PrenticeHall.Matytsin, Andrew. 1999. “Modeling Volatility and Volatility Derivatives.”www.math.columbia.edu/~smirnov/Matytsin.pdf.Mayer, Martin. 1995. “Joe Jett: Did the Computer Make Him Do It?”InstitutionalInvestor3:7–11.Mayer,Martin .1997.TheBankers:TheNextGeneration.NewYork:TrumanTalleyBooks.McDonald,Robert.2006.DerivativesMarkets.Boston:PearsonEducation.McKay,Peter.1999.“MerrillLynch toPayFinesof$25MillionforScandal.”DowJonesNewswires,July1.McLean,Bethany,andPeterElkind.2003.TheSmartestGuysintheRoom.NewYork:Penguin.McLean,Bethany, and JoeNocera. 2010.All theDevilsAreHere. NewYork:Penguin.McNeil, Alexander. 2000. “Extreme Value Theory for Risk Managers.” InExtremesandIntegratedRiskManagement,editedbyPaulEmbrechts.London:RiskBooks.
Mello, Antonio, and John Parsons. 1995. “Maturity Structure of a HedgeMatters.”JournalofAppliedCorporateFinance(Spring):106–120.Meucci,Attilio,2005.RiskandAssetAllocation.Berlin:Springer-Verlag.Moody's. 2010. “Municipal Bond Defaults and Recoveries, 1970–2009.”www.naic.org/documents/committees_e_capad_vos_c1_factor_review_sg_related_docs_moodys_us_municipal_bonds.pdfMoody's. 2011a. “Corporate Default and Recovery Rates, 1920–2010.”www.naic.org/documents/committees_e_capad_vos_c1_factor_review_sg_related_docs_moodys_corporate_default.pdfMoody's. 2011b. “Sovereign Default and Recovery Rates, 1983–2010.”www.naic.org/documents/committees_e_capad_vos_c1_factor_review_sg_related_docs_moodys_sovereign_default.pdfMoosa, Imad. 2007. Operational Risk Management. New York: PalgraveMacmillan.Moosa, Imad. 2008.Quantification of Operational Risk under Basel II. NewYork:PalgraveMacmillan.Morini,Massimo.2011.UnderstandingandManagingModelRisk.Chichester,UK:JohnWiley&Sons.Neuberger, Anthony. 1996. “The Log Contract andOther Power Options.” InTheHandbookofExoticOptions,editedbyIsraelNelken.Chicago:Irwin.Norris, Floyd. 2009. “A Lack of Rigor Costs MBIA.” New York Times,November12.O'Brien,TimothyL.1999. “Taking theDangeroutofRisk.”NewYorkTimes,January28.O'Kane, Dominic. 2008. Modelling Single-Name and Multi-Name CreditDerivatives.Chichester,UK:JohnWiley&Sons.O'Kane,Dominic,andRobertMcAdie.2001.“TradingtheDefaultSwapBasis.”Risk 9, Lehman Brothers–sponsored article.www.scribd.com/dtayebconsulting/d/26559374-Explaining-the-Basis-Cash-Versus-Default-Swaps.Oyama,Tsuyoshi.2010.Post-CrisisRiskManagement. Singapore: JohnWiley&Sons.Perold,Andre.1998.“CapitalAllocationinFinancialFirms.”HarvardBusinessSchoolworkingpaper.Perold, Andre. 1999a. Harvard Business School Case Study (9-200-007) ofLong-TermCapitalManagement(A).Perold, Andre. 1999b. Harvard Business School Case Study (9-200-009) of

Long-TermCapitalManagement(C).Pirrong, Craig. 2011. “The Economics of Central Clearing: Theory andPractice.” ISDA Discussion Paper Series no. 1. Available atwww2.isda.org/functional-areas/research/discussion-papers/.PricewaterhouseCoopers.2011.APractitioner'sGuidetoBaselIIIandBeyond.London:ThomsonReuters.Rajan,Raghuram.2010.FaultLines.Princeton,NJ:PrincetonUniversityPress.Ramberg, John,EdwardDudewicz,PanduTadikamalla, andEdwardMyktyka.1979. “A ProbabilityDistribution and Its Use in FittingData.”Technometrics2:201–214.Rawnsley,Judith.1995.TotalRisk.NewYork:HarperCollins.Rebonato, Riccardo. 1998. Interest-Rate OptionsModels. 2nd ed. New York:JohnWiley&Sons.Rebonato, Riccardo. 2002. Modern Pricing of Interest Rate Derivatives.Princeton,NJ:PrincetonUniversityPress.Rebonato,Riccardo.2003.“TheoryandPracticeofModelRiskManagement.”In Modern Risk Management: A History, 223–248. London: Risk Books.AvailableonthewebthroughCiteSeerX.Rebonato, Riccardo. 2004. Volatility and Correlation. 2nd ed. Hoboken, NJ:JohnWiley&Sons.Rebonato, Riccardo. 2007. Plight of the Fortune Tellers. Princeton, NJ:PrincetonUniversityPress.Reiner,Eric.1992.“QuantoMechanics.”Risk3:59–63.Richardson,Matthew, andLawrenceWhite.2009. “TheRatingsAgencies.” InRestoringFinancialStability,editedbyViralAcharyaandMatthewRichardson.Hoboken,NJ:JohnWiley&Sons.RiskManagementAssociation. 2000.Credit Risk Capital for Retail Products.www.johnmingo.com/pdfdocs/RMARetailCreditCapit614.pdfRiskMetrics Group. 1996. RiskMetrics Technical Document. 4th ed.www.msci.com/resources/research/technical_documentation/td4e.pdf.Roubini, Nouriel, and Stephen Mihm. 2010. Crisis Economics. New York:Penguin.Rullière,Didier,DianaDorobantu,andAreskiCousin.2010.“AnExtensionofDavisandLo'sContagionModel.”http://arxiv.org/pdf/0904.1653v2.pdf.

Salmon, Felix. 2009. “Recipe for Disaster: The Formula That Killed WallStreet.” Wired, February 23. www.wired.com/techbiz/it/magazine/17-03/wp_quant?currentPage=all.Saunders,Anthony, andLindaAllen. 2010.Credit RiskMeasurement. 3rd ed.Hoboken,NJ:JohnWiley&Sons.Saunders,Anthony,RoySmith,andIngoWalter.2009.“EnhancedRegulationofLarge,ComplexFinancialInstitutions.”InRestoringFinancialStability,editedbyViralAcharyaandMatthewRichardson.Hoboken,NJ:JohnWiley&Sons.Schachter, Barry. 2001. “How Well Can Stress Tests Complement VaR?”www.gloriamundi.org/UploadFile/2010-2/stressandevt1.pdf.Schonbucher,Philipp.2003.CreditDerivativesPricingModels.Chichester,UK:JohnWiley&Sons.Schutz,Dirk.2000.TheFallofUBS.NewYork:PyramidMediaGroup.Senior Supervisors Group. 2008. “Observations on the Risk ManagementPractices during the Recent Market Turbulence.” March 6.www.newyorkfed.org/newsevents/news/banking/2008/SSG_Risk_Mgt_doc_final.pdfSharpe,William.1992.“AssetAllocation:ManagementStyleandPerformanceMeasurement.” Journal of Portfolio Management 2:7–19.www.stanford.edu/~wfsharpe/art/sa/sa.htm.Shaw,Julian.1997.“BeyondVaRandStressTesting.” InVaR–UnderstandingandApplyingValue-at-Risk,211–224.London:RiskPublications.Shiller, Robert. 2003. The New Financial Order. Princeton, NJ: PrincetonUniversityPress.Shiller, Robert. 2008. The Subprime Solution. Princeton, NJ: PrincetonUniversityPress.Shirreff,David.1998.“AnotherFineMessatUBS.”Euromoney11:41–43.Shirreff,David.2000.“Lessons from theCollapseofHedgeFund,Long-TermCapital Management.”http://elsa.berkeley.edu/users/webfac/craine/e137_f03/137lessons.pdf.Sifakis,Carl.1982.EncyclopediaofAmericanCrime.NewYork:FactsonFile.Smithson,Charles.2000.“What'sNewintheOptionsMarkets?”Risk5:54–55.Smithson, Charles, and Neal Pearson. 2008. “Valuing CDOs of ABSs.” Risk3:84–87.www.rutterassociates.com/pdf/Smithson&Pearson_ValuingTranchesOfCDOsOnABS_RISK_Mar2008.pdf
Société Générale Mission Green Report. 2008.www.sp.socgen.com/sdp/sdp.nsf/V3ID/8D7F118212725EC6C1257452005AA90E/$file/report%20part%203.pdfSociété Générale Special Committee of the Board of Directors Report toShareholders. 2008.www.sp.socgen.com/sdp/sdp.nsf/V3ID/C54C92B634428055C1257452005A7F61/$file/report%20part%201.pdfSorkin,AndrewRoss.2010.TooBigtoFail.NewYork:Penguin.Squam Lake Group. 2010. Squam Lake Report: Fixing the Financial System.Princeton,NJ:PrincetonUniversityPress.Standard&Poor's.1996.“April1CreditWeek.”Stiglitz,Joseph.2010.Freefall.NewYork:W.W.Norton.Stigum,Marcia. 1989. The Repo and ReverseMarkets. Homewood, IL: DowJones–Irwin.Swensen, David. 2000. Pioneering Portfolio Management. New York: FreePress.Taleb,Nassim.1997.DynamicHedging.NewYork:JohnWiley&Sons.Taleb,Nassim.2010.TheBlackSwan.NewYork:RandomHouse.Tett,Gillian.2009.Fool'sGold.NewYork:FreePress.Thaler,Richard.1992.TheWinner'sCurse.NewYork:FreePress.Tsiveriotis,Kostas,andChrisFernandes.1998.“ValuingConvertibleBondswithCreditRisk.”JournalofFixedIncome8:95–102.Tuckman, Bruce, and Angel Serrat. 2012. Fixed Income Securities. 3rd ed.Hoboken,NJ:JohnWiley&Sons.TurnerReview. 2009. “ARegulatoryResponse to theGlobalBankingCrisis.”FinancialServicesAuthority.www.fsa.gov.uk/pubs/other/turner_review.pdf.UBS. 2008. “Shareholder Report on UBS's Write-Downs.” Available athttps://www.ubs.com/global/en/about_ubs/investor_relations/share_information/shareholderreport.htmlVarian,Hal.1987.“TheArbitragePrincipleinFinancialEconomics.”JournalofEconomic Perspectives 1 (2): 55–72.http://ideas.repec.org/a/aea/jecper/v1y1987i2p55-72.html.Vause,Nicholas.2010.“CounterpartyRiskandContractVolumesintheCreditDefault Swap Market.” BIS Quarterly Review (December): 59–69.http://finance.eller.arizona.edu/lam/fixi/creditmod/Vause.pdf.Wang, Jin. 2001. “Generating Daily Changes in Market Variables Using a

MultivariateMixtureofNormalDistributions.”Proceedingsof the33rdWinterSimulationConference.Washington,DC:IEEEComputerSociety.Weiss, Gary. 1994. “What Lynch Left Out.” BusinessWeek, August 22.www.businessweek.com/stories/1994-08-21/what-lynch-left-out.Whaley,Elizabeth,andPaulWilmott.1994.“HedgewithanEdge.”Risk10:82–85.Williams, Jeffrey. 1986. The Economic Function of Futures Markets.Cambridge:CambridgeUniversityPress.Wilson,Charles.1989.“AdverseSelection.”InTheNewPalgrave:Allocation,Information, andMarkets, edited by John Eatwell,MurrayMilgate, and PeterNewman.NewYork:W.W.Norton.Wilson, Harry. 2011. “UBS Rogue Trader: Investigations Focus on FictitiousHedges.”TheTelegraph,September16.www.telegraph.co.uk/finance/financial-crime/8772540/Fictitious-hedges-see-UBS-rogue-trader-losses-climb-to-2.3bn.html.Wilson,Thomas.1997. “PortfolioCreditRisk.”Risk 9:111–117and10:56–61.Shorter version available at http://papers.ssrn.com/sol3/papers.cfm?abstract_id=1028756.Wilson,Thomas.1998.“ValueatRisk.”InRiskManagementandAnalysis,Vol.1,editedbyCarolAlexander,61–124.NewYork:JohnWiley&Sons.Winters, Bill. 1999. “Wrong-Way Exposure.” Risk 7:52–55.www.risk.net/data/Pay_per_view/risk/technical/1999/risk_0799_jpmorgan.pdf.Wolfe, Eric. 2001. “NatWest Markets: E-Risk.”www.riskmania.com/pdsdata/NatWestCaseStudy-erisk.pdf.Zandi,Mark.2009.FinancialShock.Updateded.UpperSaddleRiver,NJ:FTPress.

AbouttheCompanionWebsiteThisbookhasanassociatedwebsite
(www.wiley.com/go/frm2e)containingMicrosoftExcelspreadsheetsthatcanbeusedtoexperimentwithmanyofthe
conceptscoveredinthetext.Mostofthebook'sexercisesarebuiltaroundthesecalculators.Fulldocumentationofthe
spreadsheetsiscontainedinanaccompanyingWorddocumentonthewebsite.Thisappendixbrieflydescribesthespreadsheetsthatareavailable.Theyarelistedintheorderyouwillencounter
theminthetext.
I have chosen to build all of these calculators inExcelwithminimal use ofuser-definedfunctionsfortworeasons:1.ByusingExcelratherthanaprogramminglanguage,Iamhopingtomaximizethenumberofreaderswhowillbeabletofollowthecalculations.2.Byminimizinguser-definedfunctions,Iammakingthemachineryofthecomputationsasvisibleaspossible.These calculators have all beenbuilt specifically to illustrate thematerial of
this book (and the course I teach on which the book is based). They are notdesigned to be used to actuallymanage risk positions. Specifically, they don't
include thesortofdetail,suchasdaycountconventions, that is important inatradingenvironment.Thissortofdetailcanbedistractingwhentrying to learnbroadconcepts.Forsimilarreasons,Ihaveoftenchosensimplealternativesovermorecomplexonestoillustrateapoint.Forexample,Ihavechosentorepresentvolatilitysmileandskewthroughasimpleformulathatfavorstheeaseofseeingthe approximate impact of changes in input variables over the accuracy of amorecomplexrepresentation.Using such calculators for actual trading would require programs that are
easilyscalable;thatis,theycanreadilyaccommodateaddingalargernumberofpositions. I have deliberately sacrificed scalability for the ease of handling asmall number of positions. Scalability nearly always requires the use of aprogramming language as opposed to a primarily spreadsheet-based approach.For readers who want to pursue building more robust calculators, and forteacherswhowanttoassignexercisesinvolvingthebuildingofscalableversionsofsomeofthesecalculators,thesespreadsheetsshouldbeabletoserveasgoodsources for parallel tests of computations, particularly since Excel gives animmediatedisplayofall thenumerical resultsof the intermediatestagesof thecalculations.Thespreadsheets,intheorderofthecorrespondingmaterialinthetext,areas
follows.TheMixtureOfNormalsspreadsheetproducesseriesofrandomvariablesdisplayingfattailsandclusteringoflargemovesbymixingtogethertwonormallydistributedseries.ItisutilizedforexercisesinSections1.3and7.1.1.TheWinnersCursespreadsheetillustratesthemechanismofthewinner'scurseinauctionsituations,asexplainedinSection2.4.TheVaRspreadsheetcomputesVaRusingthreedifferentmethods–historicalsimulation,MonteCarlosimulation,andvariancecovariance.Itenablestheusertocompareresultsobtainedthroughthethreemethodsandexplorepossiblemodifications.ThisisdiscussedinSection7.1andisusedinExercises7.1and7.3.TheEVTspreadsheetusestheextremevaluetheoryformulasfromthebox“KeyResultsfromEVT”inChapter7tocalculateVaRandshortfallVaRforselectedpercentiles.TheRatesspreadsheetcanbeusedeithertovalueandcomputeriskstatisticsforaportfoliooflinearinstruments(suchasforwards,swaps,andbonds)basedonaninputsetofforwardratesortodetermineasetof
forwardratesthatachieveanoptimumfitwithagivensetofpricesforaportfoliooflinearinstrumentswhilemaximizingthesmoothnessoftheforwardratesselected.ThisisdiscussedinSections10.2.1and10.4.TheBootstrapspreadsheetproducesacomparisonbetweenthebootstrapandoptimalfittingmethodologiesforextractingforwardratesfromanobservedsetofswaprates.ThisspreadsheetwasusedtoproduceFigure10.1inSection10.2.1.TheRateDataspreadsheetcontainsahistoricaltimeseriesofU.S.interestratedata.ItisusedinExercises10.1and10.2.TheNastyPathspreadsheetisanillustrationofthesizeoflossesthatcanbeincurredwhendynamicallydeltahedginganoption.Theexamplefollowsthedynamicdeltahedgingofapurchasedcalloptionoverthe30daysofitslife.ThisisdiscussedintheexampleinSection11.2.ThePriceVolMatrixspreadsheetcomputestheprice-volatilitymatrixandvolatilitysurfaceexposureforasmallportfolioofvanillaEuropean-styleoptions.ItillustratesthematerialdiscussedinSection11.4.ThePriceVolMatrixCyclespreadsheetisaparticularrunofthePriceVolMatrixspreadsheetthathasbeenusedtoproduceTable11.5.TheVolCurvespreadsheetfitsaforwardvolatilitycurvetoobservedoptionsprices.ThisspreadsheetisdesignedforEuropeanoptionsotherthaninterestratecapsandfloors.ThisisdiscussedinSection11.6.1.TheCapFitspreadsheetfitsaforwardvolatilitycurvetoobservedoptionspricesforinterestratecaps.Sincecapsarebasketsofoptions,witheachoptionwithinthebaskettermedacaplet,thespreadsheetneedstobreakeachcapapartintoitsconstituentcapletsandpriceeachoneindividually.ThisisdiscussedinSection11.6.1.TheVolSurfaceStrikespreadsheetinterpolatesimpliedoptionvolatilitiesbystrikeforagiventenor,utilizingthemethodsdiscussedinSection11.6.2.Theinterpolationcanbeperformedintwomodes:1.Impliedvolatilitiesareinputforenoughstrikestoallowforreasonableinterpolation.2.Impliedvolatilitiesareinputforonlythreestrikes.
TheOptionRollspreadsheetisavariantofthePriceVolMatrixspreadsheet.Itdiffersintheformoftheoptimization,whichissetuptocalculateahedgethatwillminimizeafuturerollcost.ItillustratesthematerialdiscussedinSection11.6.3.TheOptionMCspreadsheetcalculatesasinglepathofaMonteCarlo

simulationofthedeltahedgingofavanillaEuropean-stylecalloptionposition.ItisdesignedtohelpyoucheckyourworkfortheMonteCarlosimulationexerciseinChapter11(Exercise11.2).TheOptionMC1000spreadsheetusedinExercise11.2isidenticaltotheOptionMCspreadsheetexceptthatitissetupfor1,000timestepsinsteadof20timesteps.TheOptionMCHedgedspreadsheetusedinExercise11.2isavariantontheOptionMCspreadsheet.ItcalculatesasinglepathofaMonteCarlosimulationofthedeltahedgingoftheEuropean-stylecalloptionhedgedbytwoothercalloptionswiththesametermsbutdifferentstrikeprices.TheOptionMCHedged1000spreadsheetusedinExercise11.2isidenticaltotheOptionMCHedgedspreadsheetexceptthatitissetupfor1,000timestepsinsteadof20timesteps.TheBasketHedgespreadsheetcalculatesandpricesapiecewise-linearhedgeusingforwardsandplain-vanillaEuropeanoptionsforanyexoticderivativewhosepayoffsarenonlinearfunctionsofthepriceofasingleunderlyingassetatoneparticularpointintime.ThespreadsheetconsistsofaMainworksheetthatcanbeusedforanypayofffunctionandotherworksheetsthatcontainillustrationsofhowtheMainworksheetcanbeusedtohedgeparticularpayofffunctions.Theparticularfunctionsillustratedareasingle-assetquanto,alogcontract,interestrateconvexity,andacompoundoption.ThisisdiscussedinSection12.1.TheBinaryMCspreadsheetprovidesaMonteCarlosimulationofbinaryoptionsusingthemethoddiscussedinSection12.1.4.TheForwardStartOptionspreadsheetisaslightvariantonthePriceVolMatrixspreadsheetthatcanbeusedfortheriskmanagementofforward-startingoptionsusingthemethoddiscussedinSection12.2.TheCarrBarrierspreadsheetcomparesthepricingofbarrieroptionsusingCarr'sstatichedgingreplicationwiththosecomputedusingstandardanalyticformulas.Thecostofunwindingthestatichedgeisalsocalculated.ThisisdiscussedinSection12.3.3.TheCarrBarrierMCspreadsheetprovidesaMonteCarlosimulationofbarrieroptionsusingCarr'sstatichedgingreplication,asdiscussedinSection12.3.3.TheOptBarrierspreadsheetillustratestheuseofoptimizationtofindahedgeforadown-and-outcallbarrieroption,asdiscussedinSection12.3.3.TheDermanErgenerKanispreadsheetusedinExercise12.6calculatesthe
pricingofknock-outbarrieroptionsusingtheDermanErgener-Kanistatichedgingreplication.Thecostofunwindingthestatichedgeisalsocalculated.ItillustratesthematerialdiscussedinSection12.3.3.TheDermanErgenerKani20spreadsheetalsocalculatesthepricingofknock-outbarrieroptionsusingtheDermanErgener-Kanistatichedgingreplication.ItdisplaysintermediateresultsmoreexplicitlythantheDermanErgenerKanispreadsheet,butislessflexibleforexpansiontoalargernumberoftimesteps.TheDermanErgenerKaniDoubleBarrierspreadsheetcalculatesthepricingofdoublebarrierknock-outbarrieroptionsusingtheDermanErgener-Kanistatichedgingreplication.Thecostofunwindingthestatichedgeisalsocalculated.ThisisdiscussedinSection12.3.5.TheDermanErgenerKaniPartialBarrierspreadsheetcalculatesthepricingofpartialbarrierknock-outbarrieroptionsusingtheDermanErgener-Kanistatichedgingreplication.Thecostofunwindingthestatichedgeisalsocalculated.ThisisdiscussedinSection12.3.5.TheBasketOptionspreadsheetcomputesanapproximatevalueforthevolatilitytobeusedtopriceanoptiononabasketofassetsandalsocomputesthesensitivityofthisvolatilitytochangesinthevolatilityoftheunderlyingassetandinthecorrelationbetweenassets.ThisisdiscussedinSection12.4.1.TheCrossHedgespreadsheetsimulatesthehedgingofaquantothatpaystheproductoftwoassetprices.Thehedgeissimulatedusingtwodifferentassumptions:iftheassetpricemovesarecompletelyuncorrelatedandiftheassetpricemovesarecompletelycorrelated.ThisisdiscussedinSection12.4.5.TheAmericanOptionspreadsheetcalculatesriskstatisticsfortheearlyexercisevalueofAmericancalloptions,asdiscussedinSection12.5.1.TheTermStructurespreadsheetillustratesthedifficultiesinvolvedinpricingproductsthataredependentonyield-curveshape.ItshowsthatdifferentcombinationsofinputparametersthatresultintheidenticalpricingofEuropeancaps/floorsandswaptionscanleadtoverydifferentpricingsoftheseproducts.ThisisdiscussedinSection12.5.2.TheSwaptionsspreadsheetcalculatescurrentswaptionvolatilitiesfromcurrentforwardrateagreement(FRA)levels,forwardFRAvolatilities,andcorrelationsbetweenFRAs.UsingtheSolver,itcanfindforwardFRAvolatilitiesthatwillreproduceobservedcurrentswaptionvolatilities,as
discussedinSection12.5.3.TheCreditPricerspreadsheettranslatesbetweenparyieldsanddefaultratesforriskybondsandalsopricesriskybondsbasedonthederiveddefaultrates,asdiscussedinSection13.1.TheMertonModelspreadsheetcalculatesdefaultprobabilitiesandthedistancetodefaultusingthesimplifiedmodeldocumentedinSection13.2.4.TheJumpProcessCreditspreadsheetcalculatesdefaultprobabilitiesandcreditspreadsusingthejumpprocessmodeldiscussedinSection13.2.4.1.TheCDOspreadsheetcalculatesdefaultprobabilitiesfortranchesofCDOsutilizingaVasicekmodelwiththelargehomogeneousportfolio(LHP)assumption,asdiscussedinSection13.3.3.

Index
ACAInsuranceAccountingarbitrageAccountingrisk:definedasformofreputationalrisk
AccrualswapsAcharya,ViralAckerlof,GeorgeActivemanagementapproachActuarialriskmanagement:actuarialrisk,definedcomparisonwithfinancialriskmanagementfinancialriskinestimatingliquidproxiesinmoralhazardinfor positions that are born illiquid Adjustable-rate mortgages (ARMs). SeealsoFinancialcrisisof2007–2008
Adoboli,KwekuAdverseselectioncontrollingdefinedinformationasymmetryandlegalriskand
Agrawal,DeepakAIG(AmericanInternationalGroup)Allen,FranklinAllen,LindaAllen,PeterAllfirstFirstMarylandBancorp.SeeAllied IrishBank (AIB)caseAllied IrishBank(AIB)casedetection of unauthorized financial positions development of unauthorizedpositionfailuretodetectunauthorizedpositionsfurtherreading

incidentlessonstobelearnedresult
Almgren,RobertAlphafactorAltman,EdwardAmato,JefferyAmericanInternationalGroup(AIG)Americanoptions:defineddifficultyinvaluingEuropeanoptionsversushedgingintensityofuse
AmericanOptionspreadsheetAnalysisofoverridesAnalysisofrevenueAndersen,LeifAndreasen,JesperAndrews,EdmundAraten,MichelArbitrage:accountingAlliedIrishBank(AIB)casearbitragetheoryindecomposingriskArbitrageBaringsBankcasecash-and-carryinternalno-arbitrageprinciple
Arbitragepricingtheory(APT)ArbitrageursArmitstead,LouiseArora,NavneetArthurAndersen
Artzner,PhilippeAshcroft,AdamAsiancreditcrisisof1997AsianoptionsAskin,DavidAskinCapitalManagementAsset-backed securities. See also Credit default swaps (CDS) Asset liquidityrisk.SeealsoFundingliquidityriskbasisrisksversusdefinedfundingliquidityriskversuspositionsthatachieveilliquiditypositionsthatarebornilliquidinriskmeasurement
Asset-or-nothingoptionsAssetswaps:creditdefaultswaps(CDS)versusincreditriskmanagement
AT&TAuctions,winner'scurseandAustin,BillBackgroundchecksBackoffice:definedfraudriskand
Back-testing,invalueatrisk(VaR)analysisBackwardationBahar,RezaBai,JennieBankersTrust(BT)caseBankforInternationalSettlements(BIS)BankofAmericaBankofEnglandBankofNewYorkBankruptcy:impactofbankruptcylawlegalriskand

needformoreorderlybankruptcyproceedingsskewpatterninequitymarketsand“toobigtofail”mentalityand
Banziger,HugoBaringsBankcasedetection of unauthorized positions development of unauthorized positionsfailuretodetectunauthorizedpositionsfurtherreadingincidentlessonstobelearnedresult
Barrieroptionsbarriers,definedCarrhedgedefinedDermanErgener-Kanihedgedoubledriftdynamichedgingmodelsknock-in(downandin)knock-out(downandout/upandout)ladderoptionslookbackoptionspartial-timeput-callsymmetrywithrebatesstandardanalyticmodelsstatichedgingmodelsvalueofbarrierbasedonanalyticformulaBasecorrelation
BaselCommitteeonBankingSupervisionBasisrisk:CDS-bonddefinedliquidityriskversus
BasisswapsBasketHedgespreadsheetBasketOptionspreadsheet

Basu,SusantaBaxter,MartinBearStearnsBennett,OliverBermudanoptionshedgingintensityofuse
BermudanswaptionsBetoptions.SeeBinaryoptionsBhatia,MickeyBilateralcounterpartyriskBinarycreditdefaultswapsBinaryMCspreadsheetBinaryoptionsasset-or-nothingoptioncash-or-nothingoption
BinomialtreemodelBlack-Derman-ToymodelBlack-KarasinskimodelBlack-Scholesoptionpricingmodelforexoticoptionsmodelriskandforvanillaoptions
BlackSwan,The(Taleb)Bleed(Taleb)Bluhm,ChristianBodie,ZviBohn,JeffreyBonds:CDS-bondbasisriskincreditriskmanagementmarketfor
Bookrunning.SeeMarketmakers/marketmakingBookstaber,RichardBootstrappingBootstrapspreadsheetBorrowingcosts

forwardpricesandnatureofborrowingdemandpossibilityofcash-and-carryarbitrageseasonalityvariabilityofstoragecosts
Bouchet,MichelBrace-Gatarek-Museila(BGM)modelBrealey,RichardBreeden-LitzenbergertheoremBreuer,ThomasBrindle,AndyBritishBankersAssociationBrix,AndersBroadie,MarkBroom,GilesBrown,AaronBruck,ConnieBrunnermeier,MarkusBucay,NissoBurghardt,GalenBurnoutBusinessWeekCabiallavetta,MathisCalendarspreadCallspreadsCanabarro,EduardoCancel-and-correctactivityCapFitspreadsheetCapitalassetpricingmodel(CAPM)Capitalstructure,leverageinCaps/capletsCarr,PeterCarrBarrierMCspreadsheetCarrBarrierspreadsheetCarrhedge:

advantagesbroaderapplicationscomparisonwithotherstatichedgingmodelsderivingdevelopmentofkeypointsput-callsymmetryandstatichedge
Carty,LeaCash-and-carryarbitrageCash-or-nothingoptionsCashsettleCass,DwightCDOspreadsheetCDXindexCentralcounterpartyclearinghouse(CCP)ChainletterfraudsChang,EricChaseManhattanBankChase Manhattan Bank/Drysdale Securities case detection of unauthorizedpositions development of unauthorized positions failure to detect unauthorizedpositionsfurtherreadingincidentlessonslearnedresult
Chew,LillianChieffinancialofficer,fundingliquidityriskcontrolandChing,AnneCholeskydecompositionmethodChou,AndrewChriss,NeilCitigroupClementi,GianLucaClewlow,LesCliquetoptionsCloseouts:exchange-tradedderivatives
over-the-counterderivativesCochrane,JohnCollateral:ChaseManhattanBank/DrysdaleSecuritiescasecontinuouscollateralcallsonfutures contracts nondeliberate incorrect information and Société Généralecase
CollateralizationapproachISDAMasterAgreementwrong-wayrisk
Collateralized debt obligations (CDOs).See also Credit default swaps (CDS);Financialcrisisof2007–2008CDOcreatorsinfinancialcrisisof2007–2008computationalapproximationscreditriskmanagementanddefaultbasketequitytranchesfaultymodelsinfinancialcrisisof2007–2008illiquidityofmezzaninetranchesmultinamecreditderivativesriskmanagementandreportingforportfoliocreditexposuresseniortranchessuper-seniortranches
Collin-Dufresne,PierreCommercialpaper:increditcontagionof2007–2008estimatingamountowedatdefault
Commodities:broaddefinitionfinancialphysical
ComponentVaRCompoundoptionsCompoundworksheetComptrolleroftheCurrency
ComputererrorsConductofcustomerbusiness:BankersTrust(BT)caseEnroncaseothercases
Constant-maturityTreasury(CMT)Contagioncreditcontagionmarketcontagion
ContangoContingencyplans:fordisasterriskforfundingliquidityriskformodelriskandevaluationcontrolContingentcreditdefaultswap(CCDS)Contingentimmunizationstrategy
ContingentpremiumoptionsContinuousreviewanalysisofoverridesback-testingdailyP&Lreconciliation
Contracts,riskofunenforceableControlvariatetechniqueinmodelingConvergencepositionConvexity:convexityadjustmentsofcreditinstrumentsdefinedprice-vol-matrixandofsingle-payoutoptions
ConvexityriskCooley,ThomasCopulamethodologyCordell,LarryCorrelation between price and exercise Correlation-dependent interest rateoptions.SeealsoCorrelation-dependentoptionsBrace-Gatarek-Musiela(BGM)
modelsdescribedHeath-Jarrow-Morton(HJM)modelsintensityofuserelationship between forwards treated as constant relationship betweenswaptionandcappricestermstructuremodels
Correlation-dependentoptionscorrelationbetweenpriceandexercisedescribedindexoptionsinterest-rate options (see Correlation-dependent interest rate options) linearcombinations of asset prices nonlinear combinations of asset pricesCorrelation-dependentoptions to exchange one asset for another risk management of options onlinearcombinationsCounterpartycreditriskofCDS-bondbasisriskexchange-tradedderivativesover-the-counterderivativesoverview
Counterpartyriskgroups(CRGs)CounterpartyRiskManagementPolicyGroupCountrywideCousin,AreskiCoval,JoshuaCox-Ross-RubinsteinbinomialtreeCoy,PeterCrackspreadCreditconcentrationCreditcontagion,infinancialcrisisof2007–2008Creditdefaultswaps(CDS)assetswapsversusbinaryCDS-bondbasisriskcounterpartycreditexposurethroughincreditcontagionof2007–2008creditriskmanagementandlegalbasisrisklossgivendefault(LGD)

inmarketcontagionof2007–2008MonteCarlosimulationandoriginstotalreturnswaps
CreditexposuremitigationtechniquesCreditGradesCreditinstrumentsassetswapsbondscollateralized debt obligations (CDOs) (see Collateralized debt obligations[CDOs])convexityofcredit default swaps (see Credit default swaps [CDS]) Credit-linked note(CLN)
CreditMetricsCreditors:moralhazardandoutsidemonitorsfor
CreditPricerspreadsheetCreditratingagencies:criticismofestimatingprobabilityofdefaultinfinancialcrisisof2007–2008informationasymmetryandinvestmentbankrelianceonrelationshipwithinvestmentbanksuseofforecasts
Creditriskmanagementcounterparty(seeCounterpartycreditrisk)creditinstrumentslargemoneymovesandlegalriskversusloan-equivalentapproachmodels of short-term credit exposure multiname (see Multiname creditderivatives)portfolio(seePortfoliocreditrisk)riskreportingformarketcreditexposuressingle-name(seeSingle-namecreditrisk)Creditspreadcurve
Creditvalueadjustment(CVA)

Creswell,JulieCrosbie,PeterCross-currencyswapsCrossHedgespreadsheetCrouhy,MichelCrushspreadCsiszar,ImreCulp,ChristopherDailyTelegraphDaiwaBankDanishmortgagestructureDash,EricDataMetricsRatesDataspreadsheetDavidson,AndrewDavies,RobDdeltavol(Taleb)DeAngelis,Anthony(“SaladOilKing”)DefaultbasketDefaultrisk:comparisonofratesoflossgivendefaultcorrelationwithmarketvaluesdefaultpercentagesbyyearestimatingamountowedatdefaultestimatingdefaultcorrelationsestimatinglossgivendefaultestimatingprobabilityofdefaultfive-yeardefaultratesleverageinmeasuringratingagencyevaluationsstatisticalmodeling
Delbaen,FreddyDembo,RonDemeterfli,KresimirDerivativeStrategiesDerman,EmanuelDermanErgenerKani20spreadsheetDermanErgenerKaniDoubleBarrierspreadsheetDermanErgener-Kanihedge:
broaderapplicationscomparisonwithotherstatichedgingmodelskeypointsunwinding
DermanErgenerKaniPartialBarrierspreadsheetDermanErgenerKanispreadsheetDerman-KanidynamichedgedeServigny,ArnaudDeutscheBankDeWit,JanDiebold,FrancisDigitaloptions.SeeBinaryoptionsDirectborrowingandlendingDirectnegotiation,winner'scurseandDisasterriskDistancetodefaultDivergencepositionDiversifiable/idiosyncraticriskDixit,AvinashDocumentation:ofcontributionofriskpositionslegalriskandofmodelriskandevaluationcontrolofmodelverification
DollargammaDorobantu,DianaDoublebarrieroptionsDowd,KevinDownandin(knock-in)Downandout(knock-out)DrexelBurnhamLambertDriftDrysdale Government Securities. See Chase Manhattan Bank/DrysdaleSecuritiescaseDuc,FrancoisDudewicz,EdwardDuffie,DarrellDunbar,NicholasDwyer,PaulaDynamichedgingstrategies:

dynamicdeltahedginghedgeslippageandimpactofdriftandmeanreversionmodelsforbarrieroptionsMonteCarlosimulationversusdynamicdeltahedgingnatureofpathdependenceofperformanceofsimulationofdynamichedgingforvanillaoptions
Eber,Jean-MarcEconomicscenariostresstestsEconomistmagazineEichenwald,KurtEinchcomb,StephenEisman,SteveElkind,PeterEllis,KatrinaEmbrechts,PaulEnronEnterpriseriskEquityspotriskEquitytranchesErgener,DenizERiskEuropeanoptions.Seealso Vanilla option riskmanagementAmerican optionsversusconventionsforintensityofuse
EuropeanswaptionsEVTspreadsheetExchange-tradedderivativescloseoutslossmutualizationmarginingnetting

novationExoticoptionriskmanagementcorrelation-dependentinterestrateoptionscorrelation-dependentoptionsexoticoptions,definedintensityofuseofoptionstructuresinvariousmarketspath-dependentoptionssingle-payoutoptionstime-dependentoptionsvaluationreservesand
Extrapolationapproach:basedontimeperiodextremevaluetheory(EVT)in
Extremevaluetheory(EVT)Fabozzi,FrankFactor-pushstresstestsFairvalue:definedriskmeasurementforpositiontakingFalloon,William
FannieMaeFargher,NeilFay,StephenFederal Deposit Insurance Corporation (FDIC) Federal Reserve Bank ofNewYorkFederalReserveBankofPhiladelphiaFederalReserveBoard(FRB)FederalReserveSystemFernandes,ChrisFICOscoresFinancefunctionFinancialcommoditiesFinancial Crisis Inquiry Commission Financial Crisis Inquiry Report (FCIR)Financialcrisisof2007–2008actuarialversusfinancialriskmanagementandbroaderlessonsCDOcreatorsincreditcontagionincreditratingagenciesin

crisisinCDOsofsubprimemortgagesequitytranchesinFCIRreportoninsurersininvestmentbanksininvestorsinlessonsforregulatorslessonsforriskmanagersLi'sGaussiancopulaformulaandmarketcontagioninoverviewspreadofthecrisissubprimemortgageoriginatorsin“toobigtofail”mentality
Financialdisastersconductofcustomerbusinesslargemoneymovesmisleadingreporting
Financialriskmanagement:actuarialriskmanagementversusbroaderapplicationsofcredit risk (see Credit risk management) default risk (see Default risk)essentialcomponentsfinancialversusactuarialriskforwardrisk(seeForwardriskmanagement)instrumentsthatlackliquidityoptions risk (see Vanilla option risk management; Exotic option riskmanagement)quantificationinthroughriskaggregationriskcontrolthroughriskdecompositionriskmeasurementinspotrisk(seeSpotriskmanagement)FinancialStabilityBoard
FinancialStabilityForumFinger,ChristopherFitch

Floors/floorletsFlows:indexedinpricingilliquidflowsbyinterpolationrepresentingpromiseddeliveriesstack-and-rollhedgeand
Focardi,SergioFons,JeromeForeignexchangespotriskForward contracts. See also Forward risk management models in whichrelationshipbetweenforwards is treatedasconstantForwardprices,borrowingcostsandForwardrateagreements(FRA)ForwardriskForwardriskmanagementasset-backedsecuritiesdirectborrowingandlendingfactorsimpactingborrowingcostsfirm-levelriskmanagementforwardcontractsforwardpricesfordifferenttimeperiodsforwardrateagreements(FRAs)forwardtransactions,definedfuturescontractsinstrumentsinterestrateswapsKidderPeabodycasemodels(seeForwardriskmodels)overlapbetweeninterestrateriskandcreditriskoverviewrepurchaseagreementsriskcomparisonsriskmanagementreportingsystemspotversusforwardpositionstotalreturnswaps
Forwardriskmodelsflowsrepresentingpromiseddeliveriesindexedflowspricing illiquid flows by interpolation pricing long-dated illiquid flows bystackandrollForward-startcaplets

Forward-startoptionshedgeatrollover
ForwardStartOptionspreadsheetForwardStartspreadsheetFRA(forwardrateagreements)FrailtyanalysisFraudriskdeceptionaboutearningsdeceptionaboutpositionsreducing
FreddieMacFriedman,Billings,RamseyFrontoffice:componentsofdefinedfraudriskandhealthyskepticismabouthedgeslippageandinformationasymmetryandlegalriskandmodelingchoicesofnondeliberateincorrectinformationandrisksthataredifficulttoidentify“toobigtofail”mentalityand
Fundingcost,ofCDS-bondbasisriskFundingliquidityriskassetliquidityriskversuscomponentsofdefined
FuturescontractsFuturesexchanges:creditinover-the-countermarketsversus
Galai,DanGamma:defined

dollarhedgingcostsprice-vol-matrixand
GapmarketriskGarfield,AndrewGates,BillGatheral,JimGaussiancopulaformulaGeneralElectric(GE)Generalized autoregressive conditional heteroscedasticity (GARCH) GibsonGreetingsGiescke,HenningGiesecke,KayGilbert,W.S.Gillen,DavidGlasserman,PaulGlobalIndustryClassificationStandard(GICS)GlobalLegalGroupGoldenparachutesGoldmanSachsGoneonspecialGovernment:conflictofinterestinformationasymmetryandlessonsfromfinancialcrisisof2007–2008outsidemonitorsfor
GraceperiodGranger,NicholasGraniteCapitalGranville-Barker,HarleyGreeceGreenlaw,DavidGreenspan,AlanGregory,JonGroslambert,Bertrand

GrosspositionregulationGroupofThirty(G-30)recommendationsontradingrisk
GroupofTwenty(G-20)Grunkemeyer,BarbaraGumerlock,RobertGupta,AjayGupta,VishalGupton,GregGuysandDolls(Runyon)Hamanaka,YasuoHamilton,DavidHammond,JohnHansell,SaulHanweck,GeraldHarris,LarryHarvardBusinessSchoolcasestudiesHasanhodzic,JasminaHatzius,JanHeath,DavidHeath-Jarrow-Morton(HJM)modelHeatmapsHedgefunds,needforbroaderregulatoryoversightHedgeslippageHedging. See Dynamic hedging strategies; Static hedging strategies Helwege,JeanHenderson,SchuylerHeston,StevenHestonmodelHigh-yielddebtHimelstein,LindaHistoricaldata:simulationofP&Ldistributionstresstestsrelyingon
Holland,KelleyHolton,GlynHuang,Yilin

Huertas,ThomasHull,JohnHull-WhitemodelIBMIdiosyncraticrisk.SeeDiversifiable/idiosyncraticriskIguchi,ToshihidaIllegalactions,riskofIlliquid instruments. See also Collateralized debt obligations (CDOs) assetliquidityriskandchoiceofliquidproxychoiceofmodelvalidationapproachdesignofMonteCarlosimulationimplicationsformarkingtomarketimplicationsforriskreportingmodelvalidationandriskmanagement
Illiquidpositions,pitfallsinderivingvaluationsImportancesamplingIncentive asymmetry, information asymmetry and Independent auditors,criticismofIndexedflowsdescribedtranslationintofixedflows
IndexoptionsIndyMacIneichen,AlexanderInformationallydisadvantagedInformationasymmetry:adverseselectionandforcreditorsgovernmentregulationandincentiveasymmetryandmoralhazardinnatureofoutsidemonitorsandpotentialsolutionstradersand

Initialmargin,forexchange-tradedderivativesInsurers:AIGinfinancialcrisisof2007–2008
InterestrateswapsInternalarbitrageInternationalMonetaryFund(IMF)InternationalSwapsandDerivativesAssociation(ISDA)Interpolationapproach:inbuildingavolatilitysurfaceinmodelvalidationpricingilliquidflowsbyinterpolationseasonalityofborrowingcostsbetweenstrikes
IntradaymargincallsInvestmentanalysts:conflictofinterestinformationasymmetryand
Investmentbanks:capitalrequirementsreformrecommendationCDOcreatorsinfinancialcrisisof2007–2008compensationreformrecommendationsconflictofinterestfailuretoaccountforilliquidityofsuper-seniortranchesfaultyCDOmodelsinfinancialcrisisof2007–2008inadequateanalysisofstatisticalhedginginadequatederivativeprotectioninadequatestresstestslossesinfinancialcrisisof2007–2008off-balance-sheetvehiclesoverrelianceonVaRmeasurespersonnelriskandrecommendationsforrelianceonexternalratingsrisk management procedures reform recommendation size and allowableactivitiesreformrecommendations“toobigtofail”mentalityand
Investors,infinancialcrisisof2007–2008IrishcentralbankiTraxxindex

Jackel,PeterJackwerth,JensJacobs,MichaelJain,GautamJameson,RobJett,JosephJewson,StephenJorion,PhilippeJPMorganJPMorganChaseJumpProcessCreditspreadsheetJumpprocessmodelsJunkbondsJurek,JakubKalotay,EgonKane,AlexKani,IrajKaragozoglu,AhmetKashyap,AnilKealhofer,StephenKeeney,RalphKerviel,JérômeKhuong-Huu,PhilippeKidderPeabodycasedetection of unauthorized positions development of unauthorized positionsfailuretodetectunauthorizedpositionsfurtherreadingincidentlessonstobelearnedresult
Kim,JongwooKing,MervynKirshner,SusanKMVapproachKnock-in(downandin/upandin)
Knock-out(downandout/upandout)Kolm,PetterKooi,MariKotowitz,Y.Koutoulas,JamesKrenn,GeraldKurer,PeterLadderoptionsLargecomplexfinancialinstitutions(LCFIs)Largehomogenousportfolio(LHP)Largemoneymoves. See also Long-Term Capital Management (LTCM) caseMetallgesellschaft(MG)casestresstestsand
Laurent,Jean-PaulLawofonepriceLee,RogerLee,YoolimLeeson,NickLegal-basisriskLegalriskbankruptcyanddefinederrorinlegalinterpretationmitigatingriskofillegalactionsofunenforceablecontracts
LehmanBrothersLeibowitz,MartinLenderoflastresortfacilitiesLeonhardt,DavidLeverage:incapitalstructureanalysisasmeasureofdefaultrisk
Lewis,MichaelLi,AdaLi,David
Li,JingyiLIBOR(LondonInterbankOfferedRate)LimitedpartnershipsLinearcombinationsofassetpricesapproximationofoptionvaluesderivativecharacteristicsderivativepayoffsaslinearfunctionsofriskmanagementofoptionswithrulesfordynamichedging
Lippmann,GregLiquidinstruments,modelriskandLiquidity risk. See also Asset liquidity risk; Funding liquidity risk costs ofliquidationdefinedtimerequiredforliquidation
LiquiditysqueezeLiquidproxy:controlvariatetechniquecomparedwithforderivativeswithactuarialriskforilliquidinstrumentsreasonstouse
Li'sGaussiancopulaformulaLitterman,RobertLo,AndrewLoan-equivalentapproachLoan-to-valueratiosLocalvolatilitymodelsLogcontractsLondonInterbankOfferedRate(LIBOR)Long,meaningsofLong-TermCapitalManagement(LTCM)case:bailoutlargemoneymoveslessonslearnedmanagementstylesuggestionsforimprovedpracticestypesofpositionsUnionBankofSwitzerland(UBS)andLookbackoptions
Lossgivendefault(LGD)estimating

Lowenstein,RogerLubke,TheoLudwig,EugeneLynch,GaryMadan,DilipMadoff,BernieMalcolm,FraserMarcus,AlanMarginCall(film)MargincallsMargining:exchange-tradedderivativesover-the-counterderivatives
Mark,RobertMarketcontagion:infinancialcrisisof2007–2008need for broader regulatory oversight need for more orderly bankruptcyproceedingsneedtoreduceprocyclicality
Marketers,infrontofficeMarketmakers/marketmaking:gamblinganalogyhedginginspotmarketsimpactofcustomerorderflowinspotmarketsliquidityrisk/basisrisktrade-offmarketmaking,definedmodelstoperformriskdecompositionpositiontakingversuswinner'scurseand
Marketrisk,legalriskversusMarketusing.SeePositiontakingMarkingtomarketanalysisofrevenueandcaveatsconcerningdollarversusJapaneseyeninestablishingexitpricesforexchange-tradedderivativesbyexpertpanelsexposuretomarketpriceshifts

frequencyofwithilliquidpositionsliquidproxyforilliquidinstrumentspurposeof
Markowitz,HarryMartinuzzi,ElisaMatytsin,AndrewMaurer,SamuelMayer,MartinMBIA,Inc.McAdie,RobertMcDonald,RobertMcKay,PeterMcLean,BethanyMcNeil,AlexanderMeanreversionMello,AntonioMerckMergerarbitrageMerrillLynchMertonmodelMertonModelspreadsheetMetallgesellschaft(MG)caseMetropolitanLifeMeucci,AttiolioMezzaninetranchesMFGlobalMiddleofficedefinedfraudriskandmodelverificationand
Mihm,StephenMilken,MichaelMiller,MertonMiller,William“520Percent,”
MisleadingreportingAlliedIrishBank(AIB)caseBaringsBankcaseChaseManhattanBank/DrysdaleSecuritiescasedeceptionaboutearningsdeceptionaboutpositionsKidderPeabodycaseothercasesriskofnondeliberateSociétéGénéralecaseUnionBankofSwitzerland(UBS)caseMixtureofNormalsspreadsheet
Modelrisk.SeealsoModelriskevaluationandcontroldefinedilliquidinstrumentsimportanceofliquidinvestmentsasoperationsrisktradingmodelsvaluationofilliquidpositions
Modelriskevaluationandcontrol.SeealsoModelriskboardofdirectorsroleinbusinessunitaccountabilityforcapturingdifficult-to-identifyriskscomponentsofreviewcontinuousreviewdocumentationofmodelastermmodelvalidationmodelverificationperiodicreviewproprietaryinformationandrolesandresponsibilitiesscopeseniormanagementroleinvenderversusin-housemodels
Modelvalidationcapturingdifficult-to-identifyriskschoiceofapproachforilliquidinstrumentscostofhedgingapproach

definedilliquidinstrumentsandinterpolationapproachliquidinstrumentsandmatchingtomodelpurposeno-arbitrageprincipleandbyoutsidereviewersprevailingmarketmodelapproachofspecifictradingstrategies
ModelverificationofapproximationscomponentsofofdealrepresentationdefineddegreeofcomplexityofmodelsindependentimplementationmodelerrorandnatureofrulessuggestedcontrolsforcomputationalapproximationsystemsimplementationtestingoncaseswithknownsolutionsMoneymarketmutualfunds, increditcontagionof2007–2008
MonopolyrentsMonteCarlosimulation:advantagesofcomputationalalternativestofullsimulationofcounterpartycreditexposuredisadvantageofdynamichedgingofvanillaoptionsequalprobabilityweightsforallsimulationrunsforilliquidinstrumentsmissing/nonsynchronousdatainmodelverificationusingofoptionshedgingofP&Ldistributionofportfoliocreditrisk

withstresstestsstresstestsversus
MonteCarlostresstestsMoody'sInvestorsServiceratingsMoody'sKMVMoosa,ImadMoralhazardinanalysisofinsurancerisksconflictbetweeninsidersandoutsidersdefininginformationasymmetryinriskmeasurementtakinglargeriskpositions“toobigtofail”mentalityandinvalueplacedonearningsvolatilityMorganGrenfellAssetManagement
MorganStanleyMorganStanleyCapitalInternational(MSCI)Morini,MassimoMorningstarMortgagebrokers,infinancialcrisisof2007–2008MultinamecreditderivativesCDOtranchesandsystematicriskmodelingnatureofriskmodelingandreportingfor
Myers,StewartMyktyka,EdwardNagpal,KrishanNarrowbanksNastyPathspreadsheetNationalAssociationofInsuranceCommissionersNationalWestminsterBankNetting:exchange-tradedderivativesover-the-counterderivatives
Neuberger,AnthonyNewYorkStockExchange(NYSE)
NewYorkTimesNo-arbitrageprincipleNobelPrizeineconomicsNocera,JoeNondiversifiableriskNonlinearcombinationsofassetpricesNorris,FloydNorthernRockNovation,exchange-tradedderivativesNumeraireO'Brien,TimothyL.Off-balance-sheetvehiclesOfficeoftheComptrolleroftheCurrency“Off-the-run”instrumentsO'Kane,DominicOne-waymarketsOne-yeartenoroptions“On-the-run”instrumentsOperationalriskaccountingriskdefinedenterpriseriskfundingliquidityriskidentificationofriskslegalriskoperationalriskcapitaloperationsriskreputationalrisk
Operationalriskcapitalbottom-upapproachtop-downapproach
OperationsriskdefineddisasterriskpersonnelriskriskoffraudriskofnondeliberateincorrectinformationOptBarrierspreadsheet
Option-adjustedspread(OAS)

OptionMC1000spreadsheetOptionMCHedged1000spreadsheetOptionMCHedgedspreadsheetOptionMCspreadsheetOptionRollspreadsheetOptions risk management. See also Exotic option risk management; Vanillaoptionriskmanagementoptionsconventionsoptionstransactions,definedoverview of options risk management Options to exchange one asset foranotherOption-theoreticapproachjumpprocessmodelsKMVstatisticalanalysis
Out-of-the-moneycallsOverbeck,LudgerOverrideanalysisOver-the-counterderivativesactivemanagementreportcloseoutcollateralizationapproachcounterpartyriskgroups(CRGs)loan-equivalentapproachmarginingnettingoverviewwrong-wayrisk
Oyama,TsuyoshiPadovani,OtelloPaineWebberPandit,VikrimParkingParsons,JohnPartialdifferentialequations(PDEs)Partial-timebarrieroptionsPath-dependentoptionsbarrieroptionswithrebates
broaderclassesderivingtheCarrhedgedescribeddynamichedgingmodelsforbarriersinexoticoptionriskmanagementintensityofuseladderoptionslookbackoptionsput-callsymmetrystandardanalyticmodelsforbarriersstatichedgingmodelsforbarriersinvanillaoptionriskmanagement
Paulson,JohnPearson,NealPensionfunds,asinvestorsinfinancialcrisisof2007–2008PerformanceattributionPerformancemeasurementPeriodicreviewchangesinacademicliteraturechangesinmarketenvironmentchangesinmarketpracticeschangesinpopulationoftransactionschangesintechnology
Perold,AndrePersonnelriskPhantomprofitsPhysicalcommodities:borrowingcostsfordefinedfinancialcommoditiesversusspotriskstoragecoststransportationcosts
Pindyck,RobertPinrisk(Taleb)Pirrong,CraigPlain-vanillaoptions.SeeVanillaoptionriskmanagementPonzi,Charles

PonzischemesbroadenedmeaninghedgeslippageandKidderPeabodycaselossesfromunauthorizedpositionsandoriginalmeaning
PortfoliocreditriskcomputationalalternativestofullsimulationestimatingdefaultcorrelationsMonteCarlosimulationofrisk management and reporting for portfolio credit exposures Portfolioinsurance
PortfolioRiskTrackerPortfoliotheoryPositionmanagers,infrontofficePositiontaking:definedgamblinganalogyinstrumentsoutsideareaofexpertisemarketmakingversusmodelsasforecastingtoolsriskmeasurementfor
PoweroptionsPredescu,MirelaPricetaking.SeePositiontakingPrice-volmatrix:advantageofforbeingashortacalloptionforacalendarspreadforacallspreadinterpolationresultsbasedonforareducedriskportfolioinvanillaoptionriskmanagement
PriceVolMatrixCyclespreadsheetPriceVolMatrixspreadsheetPricewaterhouseCoopersPrince,ChuckPrivate equity funds, need for broader regulatory oversight Procter&Gamble
(P&G)ProgramtradingProprietarytradingPrudential-BacheSecuritiesPulltoparPyramidschemes.SeealsoPonzischemesQuanto:nonlinearcombinationsofassetpricessingle-assetquantooptions
QuantoworksheetRafael,AndreaRaiffa,HowardRainbowcontractsRajan,RaghuramRamberg,JohnRandommatrixtheory/shrinkageestimationRateDataspreadsheetRatesspreadsheetRatiosworksheetRawnsley,JudithRealoptionsRebates,barrieroptionswithRebonato,RiccardoRebookingtradesReducedriskportfolioRehedgingReiner,EricRemarginperiodRemolona,EliRenault,OlivierRennie,AndrewRepurchaseagreements(RPs)ReputationalriskaccountingriskasformofBankersTrust(BT)casedefinedlargemoneymovesand
natureofResearchers,infrontofficeReserves.SeeValuationreservesResti,AndreaRevealingpositions,problemsofRichardson,MatthewRight-wayriskRisk-adjustedreturnoncapital(RAROC)RiskaggregationRiskarbitrage.SeeMergerarbitrageRiskcontroldetailedlimitsonsizeofexposureincentive-basedapproachtointernalhedginginriskdecompositionand
Riskdecomposition:definedmodelstoperformreportinginriskcontroland
Risk Identification for Large Exposures (RIFLE) Risk magazine Riskmanagement.SeeFinancialriskmanagementRiskManagementAssociationRiskmanagers,infrontofficeRiskmeasurementanalysisofrevenueexposuretochangesinmarketpricesgeneralprinciplesinstrumentsthatlackliquidityliquidationtimeandmarketvaluationforpositiontakingprinciplesofriskmanagementinrulesforstop-losslimitvaluationreservesand
RiskMetricsGroupRiskoffraudpressures
RiskofnondeliberateincorrectinformationRiskreversals
Roe,JohnRoseman,AlanRosen,DanRoss,StephenRoubini,NourielRoyalBankofScotlandRubinstein,MarkRullière,DidierRunyon,DamonRusnak,JohnRussiandebtdefaultof1998Salespeople,infrontofficeSalmon,FelixSalomonBrothersSanders,AnthonySarkar,AsaniSaunders,AnthonyScenarioanalysisSchachter,BarryScheinkman,JoseScheuermann,TilSchonbucher,PhilippSchorderet,YannSchuermann,TilSchutz,DirkSeasonality,ofborrowingcostsSecuritiesandExchangeCommission(SEC)SecuritiesIndustryAssociationSeinfeld (TV program) Sell side. See Market makers/market making Semi-AmericanoptionsSemi-EuropeanoptionsSeniorSupervisorsGroupreportSeniortranchesSeptember11,2001attacks,disasterriskandSerrat,AngelShakespeare,William

Shareholders:informationasymmetryandoutsidemonitorsfor
Shareholdervalueadded(SVA)Sharma,PawanSharpe,WilliamSharperatioShaw,JulianShiller,RobertShin,HyunSongShirreff,DavidShkolnik,AlexanderShort,meaningsofShortfall/expectedshortfallVaRShortingacalloptionShortsqueezeShort-termcreditexposureCDS-bondbasisriskconvexityofcreditinstrumentsimpactofbankruptcylawriskreportingformarketcreditexposuresSidenius,Jakob
Sifakis,CarlSimulation.SeealsoMonteCarlosimulationadvantagesofcomputationalalternativestofullsimulationhistoricaldatainilliquidpositionsinMonteCarlo(seeMonteCarlosimulation)natureofofP&Ldistribution
Simulationforriskmeasurementsubjectivejudgmentand
Single-assetquantooptionsSingle-namecreditriskestimatingamountowedatdefaultestimatinglossgivendefault

estimatingprobabilityofdefaultoption-theoreticapproach
Single-payoutoptionsaccrualswapsbinaryoptionscontingentpremiumoptionsconvexitydescribedintensityofuselogcontractswapssingle-assetquantooptionsvarianceswaps
Singleton,KennethSironi,AndreaSkewSmilesSmith,AdamSmith,RoySmithson,CharlesSociétéGénéralecasedetection of unauthorized positions development of unauthorized positionsfailuretodetectunauthorizedpositionsfurtherreadingincidentlessonstobelearnedresult
SonyCorporationSorkin,AndrewRossSoros,GeorgeSouthKoreaSpecCommSpeculation.SeePositiontakingSpence,MichaelSplit-feeoptionsSpotriskmanagementequity

firm-levelriskmanagementforeignexchangeoverviewphysicalcommoditiesspottrades,defined
Spreadsheets:AmericanOptionspreadsheetBasketHedgespreadsheetBasketOptionspreadsheetBinaryMCspreadsheetBootstrapspreadsheetcalculatingdefaultratesfrombondratesCapFitspreadsheetCarrBarrierMCspreadsheetCarrBarrierspreadsheetCDOspreadsheetcomparing the jump process creditmodel to theMertonmodelCreditPricerspreadsheetCrossHedgespreadsheetDataMetricsRatesDataspreadsheetDermanErgenerKani20spreadsheetDermanErgenerKaniDoubleBarrier spreadsheetDermanErgenerKaniPartialBarrier spreadsheet DermanErgenerKanispreadsheetEVTspreadsheetForwardStartOptionspreadsheetForwardStartspreadsheetgeneratingfattailsinMonteCarlosimulationsinterpolationJumpProcessCreditspreadsheetmaximizingdiversificationmeasuringfattailsinhistoricaldataMertonModelspreadsheetMixtureofNormalsspreadsheetMonteCarlosimulationofoptionshedgingNastyPathspreadsheetOptBarrierspreadsheetOptionMC1000spreadsheet
OptionMCHedged1000spreadsheetOptionMCHedgedspreadsheetOptionMCspreadsheetOptionRollspreadsheetoptionsportfolioriskmeasuresPriceVolMatrixCyclespreadsheetPriceVolMatrixspreadsheetRateDataspreadsheetRatesspreadsheetsimulationoftheimpactoftradingrulesonexpectedreturnandriskstackandrollSwaptionsspreadsheetTermStructurespreadsheetusing Vasicek model for risk measurement of CDO tranches value-at-riskcomputationsVaRspreadsheet(example)VolCurvespreadsheetVolSurfaceStrikespreadsheetWinnersCursespreadsheet
SquamLakeGroupStack-and-rollhedgeadvantagesofdescribed
Stafford,ErikStandard & Poor's (S&P) 500 stock index Standard & Poor's (S&P) ratingsStatichedgingstrategies:forbarrieroptionsforexoticoptionsflowsrepresentingpromiseddeliveriesindexedflowsnatureofpricingilliquidflowsbyinterpolationquasistaticrepresentationsstack-and-rollhedge
StaticoverhedgeStatisticalhedging,inadequateanalysisinfinancialcrisisof2007–2008

StayperiodStein,RogerStickydeltaStickystrikeStiglitz,JosephStigum,MarciaStochasticvolatilitymodelsStop-losslimitsStoragecostsStresstestsinassessingcreditriskin capital requirements reform recommendations of counterparty creditexposureeconomicscenariostresstestsforexchange-tradedderivativesfactor-pushhistoricaldatastresstestsimpactoflargemoneymovesandinadequatelargemoneymovesandMonteCarlosimulationversusMonteCarlosimulationwithoverallmeasuresoffirmpositionriskoverviewperformancemeasurementandforpositionsthatachieveliquidityStrickland,Chris
Stroughair,JohnStructuredFinanceLitigationblogStructuredinvestmentvehicles(SIVs)Structurers,infrontofficeSubjectivejudgment.SeealsoStresstestshistoricalinformationversusinLi'sGaussiancopulaformulasimulationand
Subprimemortgageoriginators.SeealsoFinancialcrisisof2007–2008infinancialcrisisof2007–2008
Sullivan,Arthur
SumitomoCorporationofJapanSuo,WulinSuper-seniortranchesSwaps:accrualbasisbinarycreditdefaultcreditdefault(seeCreditdefaultswaps[CDS])cross-currencyinterestratelogcontracttotalreturnvariancevolatility
SwaptionsBermudanEuropeanrelationshipsbetweencappricesandSwaptionsspreadsheet
Swensen,DavidSwissBankCorporation(SBC)SynthetictranchesSystematic/nondiversifiableriskTadikamalla,PanduTaleb,NassimTanega,JosephTechnologists,infrontofficeTechnologystockbubble(2001)TelecomTermstructuremodelsTermStructurespreadsheetTett,GillianThaler,RichardTheta:definedprice-vol-matrixand

TicketsinthedrawerTime-dependentoptionscliquetoptionscompoundoptionsdescribedforward-startoptionsintensityofuse
“Toobigtofail”mentalityTotalreturnswapsTotemMarketValuationsserviceTradecancellationTradecompressionTraders:adverseselectionandcollusionandconservatismversusindependenceandcontrolpersonnelversusdeltarehedginganddetailedlimitsonsizeofexposurefraudriskandinfrontofficeG-30 recommendations on trading risk incentive-based approaches in riskcontrolinformationasymmetryandmonopolyrentsandmoralhazardandpositionsininstrumentsoutsideareaofexpertisepressuretobookimmediateprofitstradingmodelsandvaluationreservesand
Trading and Capital-Markets Activities Manual (Federal Reserve System)TradingmodelsTransportation costs, in physical commodities spot risk Treasury function,fundingliquidityriskcontrolandTrinomialtreemodelTsiveriotis,KostasTuckman,BruceTurnerReviewTwelfthNight(Shakespeare)UniCreditGroup

UnionBankofSwitzerland(UBS):AmplifiedMortgage Portfolio (AMPS) analysis of financial crisis of 2007–2008VaRmethodologies
Union Bank of Switzerland (UBS) case development of authorized positionsfurtherreadingincidentlessonslearnedresult
Upandin(knock-in)Upandout(knock-out)Utopia,Limited(Gilbert&Sullivan)VacationpolicyValuationreservesagingreservepolicyimpactofexitinglargepositionsmodelverificationandobjectivestandardsforreservestoshieldearningsfromfluctuationValueatrisk(VaR)analysisback-testingbasedoncreditratingagenciesbasedonhistoricalvariance/covarianceValueatrisk(VaR)analysisincapitalrequirementsreformrecommendationscounterpartycreditexposuredetail recorded on positions and market prices determining all marketvariablesdirectmeasurementofprofitandlossearningsvolatilityandforexchange-tradedderivativesexoticderivativepricesandextremevaluetheory(EVT)ininfinancialcrisisof2007–2008forforwardpositionsilliquidpositionsinimportancesamplinginliquidityconsiderationsinmeasuresofprofitandlossdistributionnonstatisticalmeasuresversus
foroptionpositionsoverallmeasuresoffirmpositionriskoverrelianceonperformancemeasurementandforpositionsthatarebornilliquidinriskcontrolshortfall/expectedshortfallsimulationsofP&Lforspotpositions
Vanillaoptionriskmanagementbuildingavolatilitysurfaceconventionsdeltahedgingdynamichedgingstrategiesoverviewriskreportingandlimitstoolsinvanillacallspreadvanillaoptions,defined
vanNieuwerburgh,StijnVaRanalysis.SeeValueatrisk(VaR)analysisVarian,HalVariancegammamodelVarianceswapsVaRspreadsheetVasicekmodelVause,NicholasVega:definedprice-vol-matrixand
VigorishVolatilitysurfaceextrapolatingbasedontimeperiodinterpolatingbetweenstrikesinterpolationbetweentimeperiodsforpricingvanillaoptions
Volatilityswaps
Volcker,PaulVolckerruleVolCurvespreadsheetVolSurfaceStrikespreadsheetVoseyInheritance,The(Granville-Barker)Wagner,ChristophWallStreetJournalWalter,IngoWang,JinWang,YuanWashingtonMutualWealthofNations,The(Smith)WeatherderivativeoptionsWeinberger,AlfredWeiss,GaryWhaley,ElizabethWhite,AlanWhite,LawrenceWilliams,JeffreyWilliams,MeredithWilmott,PaulWilson,CharlesWilson,HarryWilson,ThomasWinner'scurseapplicationtotradingdefinedmechanismleadingto
WinnersCursespreadsheetWinters,BillWiredmagazineWolfe,EricWolfe,Lan-LingWorldBankWrong-wayrisk
Y2KcrisisYieldcurve,nonstatisticallimitsonyieldcurveshapeYoungblood,Michael

Zandi,MarkZiehmann,ChristineZou,JosephZ-scoremodel
Related Documents