A Polymorphism in CALHM1 Influences Ca 2+ Homeostasis, A b Levels, and Alzheimer’s Disease Risk Ute Dreses-Werringloer, 1 Jean-Charles Lambert, 2 Vale ´ rie Vingtdeux, 1 Haitian Zhao, 1 Horia Vais, 3 Adam Siebert, 3 Ankit Jain, 3 Jeremy Koppel, 1 Anne Rovelet-Lecrux, 4 Didier Hannequin, 4 Florence Pasquier, 5 Daniela Galimberti, 6 Elio Scarpini, 6 David Mann, 7 Corinne Lendon, 8 Dominique Campion, 4 Philippe Amouyel, 2 Peter Davies, 1,9 J. Kevin Foskett, 3 Fabien Campagne, 10, * and Philippe Marambaud 1,9, * 1 Litwin-Zucker Research Center for the Study of Alzheimer’s Disease, The Feinstein Institute for Medical Research, North Shore-LIJ, Manhasset, NY 11030, USA 2 INSERM, U744, Institut Pasteur de Lille, Universite ´ de Lille II, 59019 Lille, France 3 Department of Physiology, University of Pennsylvania School of Medicine, Philadelphia, PA 19104, USA 4 INSERM, U614, Faculte ´ de me ´ decine, 76000 Rouen, France 5 Department of Neurology, University Hospital, 59037 Lille, France 6 Department of Neurological Sciences, Dino Ferrari Center, IRCCS Ospedale Maggiore Policlinico, University of Milan, 20122 Milan, Italy 7 Greater Manchester Neurosciences Centre, University of Manchester, Salford M6 8HD, UK 8 Molecular Psychiatry Group, Queensland Institute of Medical Research, Brisbane 4006, Australia 9 Department of Pathology, Albert Einstein College of Medicine, Bronx, NY 10461, USA 10 Department of Physiology and Biophysics, and HRH Prince Alwaleed Bin Talal Bin Abdulaziz Alsaud Institute for Computational Biomedicine, Weill Medical College of Cornell University, New York, NY 10021, USA *Correspondence: [email protected] (F.C.), [email protected] (P.M.) DOI 10.1016/j.cell.2008.05.048 SUMMARY Alzheimer’s disease (AD) is a genetically heteroge- neous disorder characterized by early hippocampal atrophy and cerebral amyloid-b (Ab) peptide deposi- tion. Using TissueInfo to screen for genes preferen- tially expressed in the hippocampus and located in AD linkage regions, we identified a gene on 10q24.33 that we call CALHM1. We show that CALHM1 encodes a multipass transmembrane gly- coprotein that controls cytosolic Ca 2+ concentra- tions and Ab levels. CALHM1 homomultimerizes, shares strong sequence similarities with the selectiv- ity filter of the NMDA receptor, and generates a large Ca 2+ conductance across the plasma membrane. Importantly, we determined that the CALHM1 P86L polymorphism (rs2986017) is significantly associated with AD in independent case-control studies of 3404 participants (allele-specific OR = 1.44, p = 2 3 10 10 ). We further found that the P86L polymorphism in- creases Ab levels by interfering with CALHM1-medi- ated Ca 2+ permeability. We propose that CALHM1 encodes an essential component of a previously un- characterized cerebral Ca 2+ channel that controls Ab levels and susceptibility to late-onset AD. INTRODUCTION Alzheimer’s disease (AD) is a progressive neurodegenerative disorder characterized by a massive loss of neurons in several brain regions and by the presence of cerebral senile plaques comprised of aggregated amyloid-b (Ab) peptides (Mattson, 2004; Selkoe, 2001). The first atrophy observed in the AD brain occurs in the medial temporal lobe, which includes the hippo- campus, and is the result of a massive synaptic degeneration and neuronal death (Braak and Braak, 1991; de Leon et al., 2007). Two major Ab species are found, Ab40 and Ab42; both are produced from the sequential endoproteolysis of the amyloid precursor protein (APP) by BACE1/b-secretase and by presenilin (PS)/g-secretase complexes. APP can also undergo a nonamy- loidogenic proteolysis by a-secretase, which cleaves APP within the Ab sequence and thereby precludes Ab generation (Maram- baud and Robakis, 2005; Wilquet and De Strooper, 2004). The etiology of the disease is complex because of its strong genetic heterogeneity. Rare autosomal-dominant mutations in the genes encoding APP, PS1, and PS2 cause early-onset AD, whereas complex interactions among different genetic variants and environmental factors are believed to modulate the risk for the vast majority of late-onset AD (LOAD) cases (Kennedy et al., 2003; Lambert and Amouyel, 2007; Pastor and Goate, 2004). To date, the only susceptibility gene unambiguously dem- onstrated worldwide is the 34 allele of APOE on chromosome 19 (Strittmatter et al., 1993). However, epidemiological studies indi- cate that the presence of the APOE 34 allele cannot explain the overall heritability of AD, implying that a significant proportion of LOAD cases is attributable to additional genetic risk factors (Lambert and Amouyel, 2007; Pastor and Goate, 2004). Support- ing this observation, concordant evidence of linkage to LOAD has been observed in different chromosomal regions, including on chromosome 10, where a strong and consensual susceptibil- ity locus is present (Bertram et al., 2000; Blacker et al., 2003; Ertekin-Taner et al., 2000; Farrer et al., 2003; Kehoe et al., 1999; Cell 133, 1149–1161, June 27, 2008 ª2008 Elsevier Inc. 1149

Welcome message from author
This document is posted to help you gain knowledge. Please leave a comment to let me know what you think about it! Share it to your friends and learn new things together.
Transcript
A Polymorphism in CALHM1 InfluencesCa2+ Homeostasis, Ab Levels,and Alzheimer’s Disease RiskUte Dreses-Werringloer,1 Jean-Charles Lambert,2 Valerie Vingtdeux,1 Haitian Zhao,1 Horia Vais,3 Adam Siebert,3
Ankit Jain,3 Jeremy Koppel,1 Anne Rovelet-Lecrux,4 Didier Hannequin,4 Florence Pasquier,5 Daniela Galimberti,6
Elio Scarpini,6 David Mann,7 Corinne Lendon,8 Dominique Campion,4 Philippe Amouyel,2 Peter Davies,1,9
J. Kevin Foskett,3 Fabien Campagne,10,* and Philippe Marambaud1,9,*1Litwin-Zucker Research Center for the Study of Alzheimer’s Disease, The Feinstein Institute for Medical Research, North Shore-LIJ,Manhasset, NY 11030, USA2INSERM, U744, Institut Pasteur de Lille, Universite de Lille II, 59019 Lille, France3Department of Physiology, University of Pennsylvania School of Medicine, Philadelphia, PA 19104, USA4INSERM, U614, Faculte de medecine, 76000 Rouen, France5Department of Neurology, University Hospital, 59037 Lille, France6Department of Neurological Sciences, Dino Ferrari Center, IRCCS Ospedale Maggiore Policlinico, University of Milan, 20122 Milan, Italy7Greater Manchester Neurosciences Centre, University of Manchester, Salford M6 8HD, UK8Molecular Psychiatry Group, Queensland Institute of Medical Research, Brisbane 4006, Australia9Department of Pathology, Albert Einstein College of Medicine, Bronx, NY 10461, USA10Department of Physiology and Biophysics, and HRH Prince Alwaleed Bin Talal Bin Abdulaziz Alsaud Institute for Computational
Biomedicine, Weill Medical College of Cornell University, New York, NY 10021, USA*Correspondence: [email protected] (F.C.), [email protected] (P.M.)
DOI 10.1016/j.cell.2008.05.048
SUMMARY
Alzheimer’s disease (AD) is a genetically heteroge-neous disorder characterized by early hippocampalatrophy and cerebral amyloid-b (Ab) peptide deposi-tion. Using TissueInfo to screen for genes preferen-tially expressed in the hippocampus and locatedin AD linkage regions, we identified a gene on10q24.33 that we call CALHM1. We show thatCALHM1 encodes a multipass transmembrane gly-coprotein that controls cytosolic Ca2+ concentra-tions and Ab levels. CALHM1 homomultimerizes,shares strong sequence similarities with the selectiv-ity filter of the NMDA receptor, and generates a largeCa2+ conductance across the plasma membrane.Importantly, we determined that the CALHM1 P86Lpolymorphism (rs2986017) is significantly associatedwith AD in independent case-control studies of 3404participants (allele-specific OR = 1.44, p = 2 3 10�10).We further found that the P86L polymorphism in-creases Ab levels by interfering with CALHM1-medi-ated Ca2+ permeability. We propose that CALHM1encodes an essential component of a previously un-characterized cerebral Ca2+ channel that controls Ab
levels and susceptibility to late-onset AD.
INTRODUCTION
Alzheimer’s disease (AD) is a progressive neurodegenerative
disorder characterized by a massive loss of neurons in several
brain regions and by the presence of cerebral senile plaques
comprised of aggregated amyloid-b (Ab) peptides (Mattson,
2004; Selkoe, 2001). The first atrophy observed in the AD brain
occurs in the medial temporal lobe, which includes the hippo-
campus, and is the result of a massive synaptic degeneration
and neuronal death (Braak and Braak, 1991; de Leon et al.,
2007). Two major Ab species are found, Ab40 and Ab42; both
are produced from the sequential endoproteolysis of the amyloid
precursor protein (APP) by BACE1/b-secretase and by presenilin
(PS)/g-secretase complexes. APP can also undergo a nonamy-
loidogenic proteolysis by a-secretase, which cleaves APP within
the Ab sequence and thereby precludes Ab generation (Maram-
baud and Robakis, 2005; Wilquet and De Strooper, 2004).
The etiology of the disease is complex because of its strong
genetic heterogeneity. Rare autosomal-dominant mutations in
the genes encoding APP, PS1, and PS2 cause early-onset AD,
whereas complex interactions among different genetic variants
and environmental factors are believed to modulate the risk
for the vast majority of late-onset AD (LOAD) cases (Kennedy
et al., 2003; Lambert and Amouyel, 2007; Pastor and Goate,
2004). To date, the only susceptibility gene unambiguously dem-
onstrated worldwide is the 34 allele of APOE on chromosome 19
(Strittmatter et al., 1993). However, epidemiological studies indi-
cate that the presence of the APOE 34 allele cannot explain the
overall heritability of AD, implying that a significant proportion
of LOAD cases is attributable to additional genetic risk factors
(Lambert and Amouyel, 2007; Pastor and Goate, 2004). Support-
ing this observation, concordant evidence of linkage to LOAD
has been observed in different chromosomal regions, including
on chromosome 10, where a strong and consensual susceptibil-
ity locus is present (Bertram et al., 2000; Blacker et al., 2003;
Ertekin-Taner et al., 2000; Farrer et al., 2003; Kehoe et al., 1999;
Cell 133, 1149–1161, June 27, 2008 ª2008 Elsevier Inc. 1149
Myers et al., 2000). However, despite intensive research efforts
to characterize the genetic factor(s) located within the chromo-
some 10 region, no gene has been conclusively linked to
LOAD risk (Bertram et al., 2006; Grupe et al., 2006; Kuwano
et al., 2006; Minster et al., 2006).
A number of neurodegenerative disorders are caused by muta-
tions in genes expressed principally in the central nervous sys-
tem. This is the case for the brain proteins tau and a-synuclein,
which are linked to autosomal-dominant forms of frontotemporal
dementia and Parkinson’s disease, respectively. Here, we postu-
lated that susceptibility to LOAD could come from genes predom-
inantly expressed in affected brain regions, such as the hippo-
campus. We used TissueInfo (Skrabanek and Campagne, 2001)
and the Alzgene database (Bertram et al., 2007) to screen for
genes predominantly expressed in the hippocampus and located
in linkage regions for LOAD, and identified CALHM1, a gene of
unknown function, located on chromosome 10 at 1.6 Mb of the
LOAD marker D10S1671 (Bertram et al., 2000). We found that
CALHM1 homomultimerizes, controls cytosolic Ca2+ concentra-
tions, and shares similarities with the predicted selectivity filter of
the N-methyl-D-aspartate receptor (NMDAR). Voltage-clamp
analyses further revealed that CALHM1 generates Ca2+-selective
cation currents at the plasma membrane. Importantly, we deter-
mined that the frequency of the rare allele of the nonsynonymous
single-nucleotide polymorphism (SNP) rs2986017 in CALHM1,
which results in a proline-to-leucine substitution at codon 86
(P86L), is significantly increased in AD cases in five independent
cohorts. Further investigation demonstrated the functional signif-
icance of the rs2986017 SNP by showing that the P86L mutation
promotes Ab accumulation via a loss of CALHM1 control on Ca2+
permeability and cytosolic Ca2+ levels. Here, we propose that
CALHM1 is a component of a previously uncharacterized cere-
bral Ca2+ channel family involved in Ab metabolism and that
CALHM1 variants may influence the risk for LOAD.
RESULTS
Gene DiscoveryWe screened the human genome with TissueInfo to annotate hu-
man transcripts with tissue expression levels derived from the
expressed sequence tag database (dbEST) (Campagne and
Skrabanek, 2006; Skrabanek and Campagne, 2001). Out of
33,249 human transcripts, the TissueInfo screen identified 30
transcripts, corresponding to 12 genes, with expression re-
stricted to the hippocampus (Table 1). These transcripts
matched either one or two ESTs sequenced from the hippocam-
pus. Among these genes, one of unknown function, previously
annotated as FAM26C, matched two hippocampal ESTs and
mapped to the AD locus on 10q24.33 (Table 1). This gene, here-
after referred to as calcium homeostasis modulator 1 (CALHM1),
encodes an open reading frame (ORF) of 346 amino acids and is
predicted to contain four hydrophobic domains (HDs; TMHMM
prediction) and two N-glycosylation motifs (NetNGlyc 1.0 predic-
tion) (Figure 1A). No significant amino acid sequence homology
to other functionally characterized proteins was found. Se-
quence database searches identified five human homologs of
CALHM1 (collectively identified as the FAM26 gene family).
Two homologs of human CALHM1 with broader tissue expres-
1150 Cell 133, 1149–1161, June 27, 2008 ª2008 Elsevier Inc.
sion profiles (see the Supplemental Data available online) are
clustered next to CALHM1 in 10q24.33 and are designated
CALHM2 (26% protein sequence identity, previously annotated
as FAM26B) and CALHM3 (39% identity, FAM26A) (Figure 1A).
CALHM1 is conserved across at least 20 species, including
mouse and C. elegans (Figures 1A and 1B).
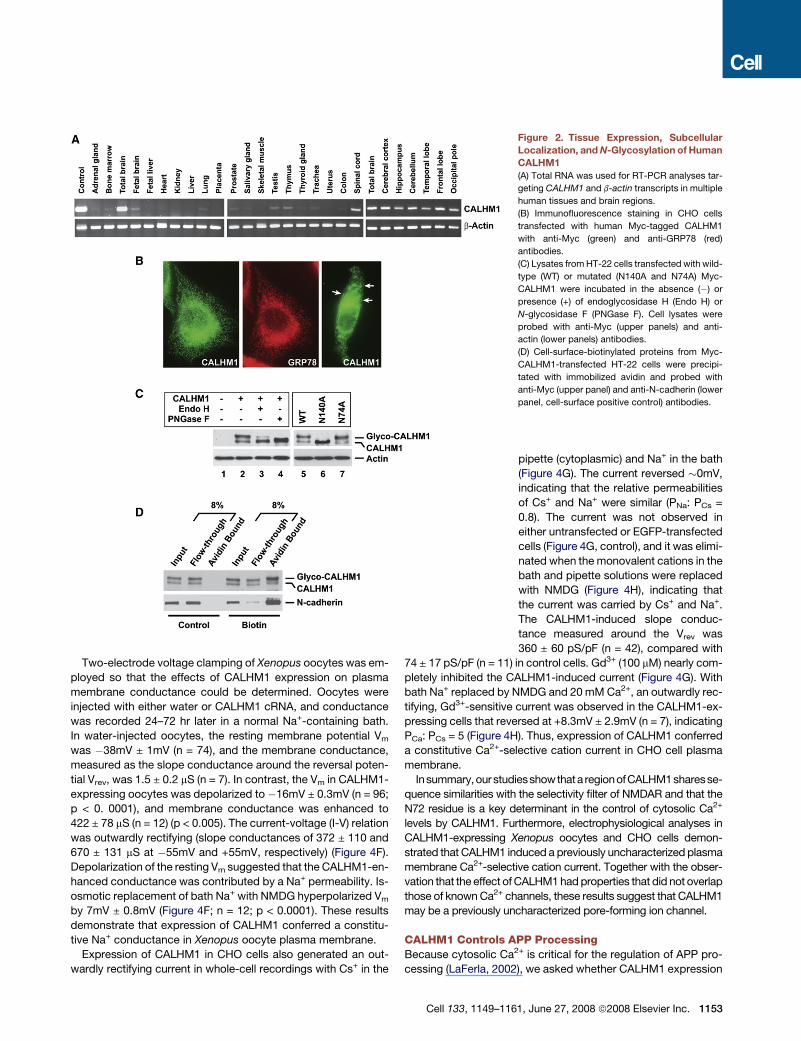
CALHM1 CharacterizationUsing RT-PCR, we analyzed human CALHM1 expression in 20
tissues and six brain regions. The expression of CALHM1 was
highest in the total adult brain and in all brain regions tested.
CALHM1 expression was noticeably lower in all other tissues, in-
cluding fetal brain (Figure 2A). qRT-PCR revealed endogenous
CALHM1 expression in retinoic acid-differentiated SH-SY5Y
cells (Figure S1A), suggesting that CALHM1 is a protein of neu-
ronal origin. Immunofluorescence staining in transiently trans-
fected cells revealed that CALHM1 strongly localized to the
endoplasmic reticulum (ER), where it colocalized with the ER
resident protein GRP78 (Figure 2B, left and middle panels). How-
ever, some cells revealed immunoreactivity for CALHM1 at the
cell surface, suggesting that a pool of CALHM1 was localized
at or near the plasma membrane (Figure 2B, right panel, arrows).
Western blotting (WB) analyses revealed the presence of two im-
munoreactive bands in CALHM1-transfected cells (Figure 2C,
lanes 1 and 2). Because human CALHM1 is predicted to be
N-glycosylated at asparagine residues N74 and N140 (see
Figure 1A, asterisks), we asked whether these bands might rep-
resent different N-glycosylated forms of the protein. Treatment
of CALHM1-transfected cell lysates with N-glycosidase F, which
cleaves all types of asparagine-bound N-glycans, completely
eliminated the appearance of the higher molecular weight band
and resulted in the accumulation of the lower band, which
we conclude corresponds to the unmodified core protein
(Figure 2C, lanes 2 and 4). CALHM1 was partially resistant to en-
doglycosidase H-mediated deglycosylation (Figure 2C, lanes 2
and 3), indicating that CALHM1 can reach the medial Golgi com-
partment and the cell surface, where proteins are terminally gly-
cosylated and acquire resistance to endoglycosidase H. Plasma
membrane expression of CALHM1 was also investigated by
cell surface biotinylation. Figure 2D illustrates that a pool of
CALHM1, enriched in glycosylated forms of the protein, was bio-
tinylated and thus was present at the plasma membrane. We fur-
ther determined that substitution of the N140 residue to alanine
(N140A) completely prevented CALHM1 glycosylation, whereas
N74A substitution had no effect (Figure 2C, lanes 5–7). Thus,
CALHM1 is a multipass transmembrane protein, N-glycosylated
at the residue N140, predominantly expressed in the adult brain,
and localized to the ER and plasma membranes. These data fur-
ther indicate that the HD3-HD4 loop, which contains the N140
residue, is oriented toward the luminal side when CALHM1 is
in the ER membrane and toward the extracellular space when
CALHM1 reaches the plasma membrane.
CALHM1 Controls Cytosolic Ca2+ LevelsThe predicted membrane topology of CALHM1 suggests the
presence of one re-entrant hydrophobic loop that does not cross
the membrane bilayer and three membrane-spanning segments
(TMHMM prediction). In the absence of significant homology to
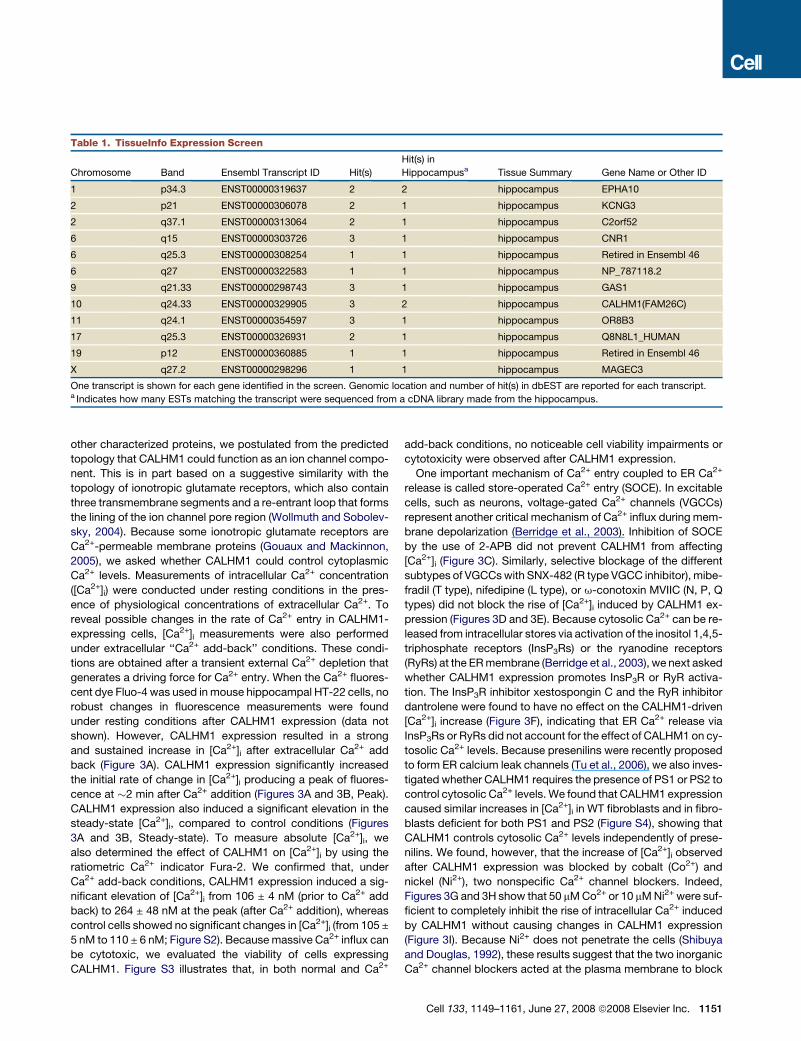
Table 1. TissueInfo Expression Screen
Chromosome Band Ensembl Transcript ID Hit(s)
Hit(s) in
Hippocampusa Tissue Summary Gene Name or Other ID
1 p34.3 ENST00000319637 2 2 hippocampus EPHA10
2 p21 ENST00000306078 2 1 hippocampus KCNG3
2 q37.1 ENST00000313064 2 1 hippocampus C2orf52
6 q15 ENST00000303726 3 1 hippocampus CNR1
6 q25.3 ENST00000308254 1 1 hippocampus Retired in Ensembl 46
6 q27 ENST00000322583 1 1 hippocampus NP_787118.2
9 q21.33 ENST00000298743 3 1 hippocampus GAS1
10 q24.33 ENST00000329905 3 2 hippocampus CALHM1(FAM26C)
11 q24.1 ENST00000354597 3 1 hippocampus OR8B3
17 q25.3 ENST00000326931 2 1 hippocampus Q8N8L1_HUMAN
19 p12 ENST00000360885 1 1 hippocampus Retired in Ensembl 46
X q27.2 ENST00000298296 1 1 hippocampus MAGEC3
One transcript is shown for each gene identified in the screen. Genomic location and number of hit(s) in dbEST are reported for each transcript.a Indicates how many ESTs matching the transcript were sequenced from a cDNA library made from the hippocampus.
other characterized proteins, we postulated from the predicted
topology that CALHM1 could function as an ion channel compo-
nent. This is in part based on a suggestive similarity with the
topology of ionotropic glutamate receptors, which also contain
three transmembrane segments and a re-entrant loop that forms
the lining of the ion channel pore region (Wollmuth and Sobolev-
sky, 2004). Because some ionotropic glutamate receptors are
Ca2+-permeable membrane proteins (Gouaux and Mackinnon,
2005), we asked whether CALHM1 could control cytoplasmic
Ca2+ levels. Measurements of intracellular Ca2+ concentration
([Ca2+]i) were conducted under resting conditions in the pres-
ence of physiological concentrations of extracellular Ca2+. To
reveal possible changes in the rate of Ca2+ entry in CALHM1-
expressing cells, [Ca2+]i measurements were also performed
under extracellular ‘‘Ca2+ add-back’’ conditions. These condi-
tions are obtained after a transient external Ca2+ depletion that
generates a driving force for Ca2+ entry. When the Ca2+ fluores-
cent dye Fluo-4 was used in mouse hippocampal HT-22 cells, no
robust changes in fluorescence measurements were found
under resting conditions after CALHM1 expression (data not
shown). However, CALHM1 expression resulted in a strong
and sustained increase in [Ca2+]i after extracellular Ca2+ add
back (Figure 3A). CALHM1 expression significantly increased
the initial rate of change in [Ca2+]i producing a peak of fluores-
cence at �2 min after Ca2+ addition (Figures 3A and 3B, Peak).
CALHM1 expression also induced a significant elevation in the
steady-state [Ca2+]i, compared to control conditions (Figures
3A and 3B, Steady-state). To measure absolute [Ca2+]i, we
also determined the effect of CALHM1 on [Ca2+]i by using the
ratiometric Ca2+ indicator Fura-2. We confirmed that, under
Ca2+ add-back conditions, CALHM1 expression induced a sig-
nificant elevation of [Ca2+]i from 106 ± 4 nM (prior to Ca2+ add
back) to 264 ± 48 nM at the peak (after Ca2+ addition), whereas
control cells showed no significant changes in [Ca2+]i (from 105 ±
5 nM to 110 ± 6 nM; Figure S2). Because massive Ca2+ influx can
be cytotoxic, we evaluated the viability of cells expressing
CALHM1. Figure S3 illustrates that, in both normal and Ca2+
add-back conditions, no noticeable cell viability impairments or
cytotoxicity were observed after CALHM1 expression.
One important mechanism of Ca2+ entry coupled to ER Ca2+
release is called store-operated Ca2+ entry (SOCE). In excitable
cells, such as neurons, voltage-gated Ca2+ channels (VGCCs)
represent another critical mechanism of Ca2+ influx during mem-
brane depolarization (Berridge et al., 2003). Inhibition of SOCE
by the use of 2-APB did not prevent CALHM1 from affecting
[Ca2+]i (Figure 3C). Similarly, selective blockage of the different
subtypes of VGCCs with SNX-482 (R type VGCC inhibitor), mibe-
fradil (T type), nifedipine (L type), or u-conotoxin MVIIC (N, P, Q
types) did not block the rise of [Ca2+]i induced by CALHM1 ex-
pression (Figures 3D and 3E). Because cytosolic Ca2+ can be re-
leased from intracellular stores via activation of the inositol 1,4,5-
triphosphate receptors (InsP3Rs) or the ryanodine receptors
(RyRs) at the ER membrane (Berridge et al., 2003), we next asked
whether CALHM1 expression promotes InsP3R or RyR activa-
tion. The InsP3R inhibitor xestospongin C and the RyR inhibitor
dantrolene were found to have no effect on the CALHM1-driven
[Ca2+]i increase (Figure 3F), indicating that ER Ca2+ release via
InsP3Rs or RyRs did not account for the effect of CALHM1 on cy-
tosolic Ca2+ levels. Because presenilins were recently proposed
to form ER calcium leak channels (Tu et al., 2006), we also inves-
tigated whether CALHM1 requires the presence of PS1 or PS2 to
control cytosolic Ca2+ levels. We found that CALHM1 expression
caused similar increases in [Ca2+]i in WT fibroblasts and in fibro-
blasts deficient for both PS1 and PS2 (Figure S4), showing that
CALHM1 controls cytosolic Ca2+ levels independently of prese-
nilins. We found, however, that the increase of [Ca2+]i observed
after CALHM1 expression was blocked by cobalt (Co2+) and
nickel (Ni2+), two nonspecific Ca2+ channel blockers. Indeed,
Figures 3G and 3H show that 50 mM Co2+ or 10 mM Ni2+ were suf-
ficient to completely inhibit the rise of intracellular Ca2+ induced
by CALHM1 without causing changes in CALHM1 expression
(Figure 3I). Because Ni2+ does not penetrate the cells (Shibuya
and Douglas, 1992), these results suggest that the two inorganic
Ca2+ channel blockers acted at the plasma membrane to block
Cell 133, 1149–1161, June 27, 2008 ª2008 Elsevier Inc. 1151
Ca2+ entry. Collectively, these results strongly indicate that
CALHM1 expression promotes Ca2+ influx via activation of
a cell-surface ion channel that is distinct from known VGCC or
SOCE channels.
CALHM1 Has Ion Channel PropertiesBecause many channels multimerize to form an ion pore, and be-
cause monomeric CALHM1 cannot create a functional pore with
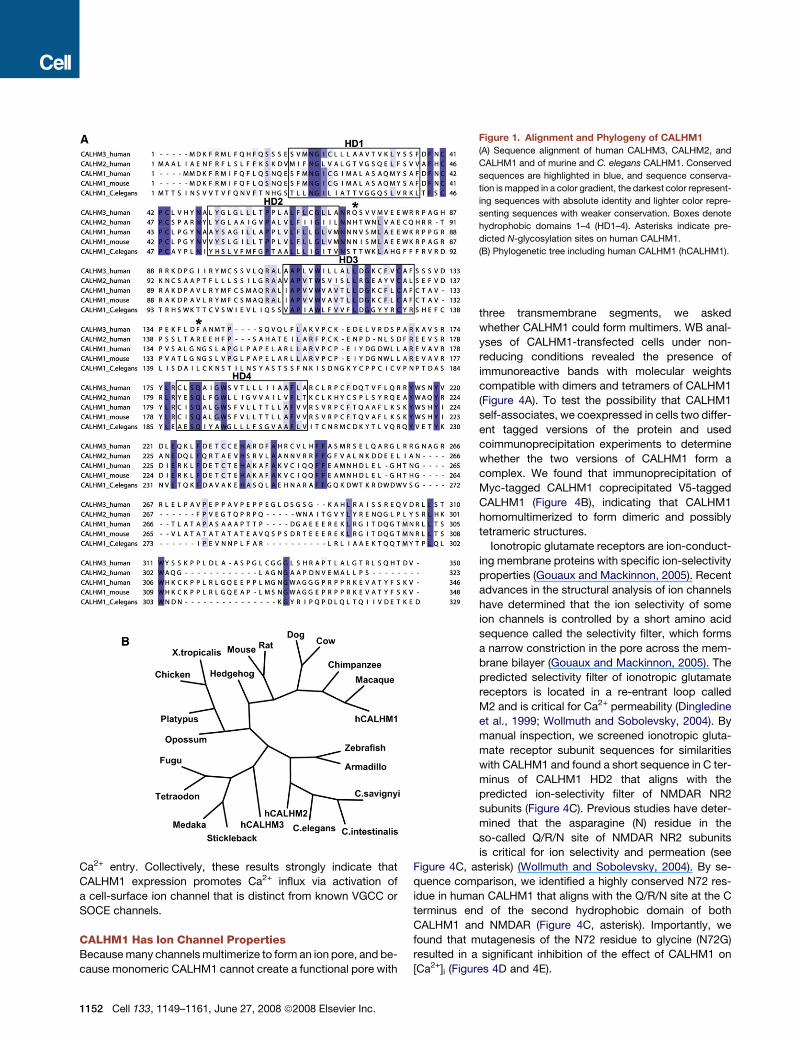
Figure 1. Alignment and Phylogeny of CALHM1
(A) Sequence alignment of human CALHM3, CALHM2, and
CALHM1 and of murine and C. elegans CALHM1. Conserved
sequences are highlighted in blue, and sequence conserva-
tion is mapped in a color gradient, the darkest color represent-
ing sequences with absolute identity and lighter color repre-
senting sequences with weaker conservation. Boxes denote
hydrophobic domains 1–4 (HD1–4). Asterisks indicate pre-
dicted N-glycosylation sites on human CALHM1.
(B) Phylogenetic tree including human CALHM1 (hCALHM1).
three transmembrane segments, we asked
whether CALHM1 could form multimers. WB anal-
yses of CALHM1-transfected cells under non-
reducing conditions revealed the presence of
immunoreactive bands with molecular weights
compatible with dimers and tetramers of CALHM1
(Figure 4A). To test the possibility that CALHM1
self-associates, we coexpressed in cells two differ-
ent tagged versions of the protein and used
coimmunoprecipitation experiments to determine
whether the two versions of CALHM1 form a
complex. We found that immunoprecipitation of
Myc-tagged CALHM1 coprecipitated V5-tagged
CALHM1 (Figure 4B), indicating that CALHM1
homomultimerized to form dimeric and possibly
tetrameric structures.
Ionotropic glutamate receptors are ion-conduct-
ing membrane proteins with specific ion-selectivity
properties (Gouaux and Mackinnon, 2005). Recent
advances in the structural analysis of ion channels
have determined that the ion selectivity of some
ion channels is controlled by a short amino acid
sequence called the selectivity filter, which forms
a narrow constriction in the pore across the mem-
brane bilayer (Gouaux and Mackinnon, 2005). The
predicted selectivity filter of ionotropic glutamate
receptors is located in a re-entrant loop called
M2 and is critical for Ca2+ permeability (Dingledine
et al., 1999; Wollmuth and Sobolevsky, 2004). By
manual inspection, we screened ionotropic gluta-
mate receptor subunit sequences for similarities
with CALHM1 and found a short sequence in C ter-
minus of CALHM1 HD2 that aligns with the
predicted ion-selectivity filter of NMDAR NR2
subunits (Figure 4C). Previous studies have deter-
mined that the asparagine (N) residue in the
so-called Q/R/N site of NMDAR NR2 subunits
is critical for ion selectivity and permeation (see
Figure 4C, asterisk) (Wollmuth and Sobolevsky, 2004). By se-
quence comparison, we identified a highly conserved N72 res-
idue in human CALHM1 that aligns with the Q/R/N site at the C
terminus end of the second hydrophobic domain of both
CALHM1 and NMDAR (Figure 4C, asterisk). Importantly, we
found that mutagenesis of the N72 residue to glycine (N72G)
resulted in a significant inhibition of the effect of CALHM1 on
[Ca2+]i (Figures 4D and 4E).
1152 Cell 133, 1149–1161, June 27, 2008 ª2008 Elsevier Inc.
Two-electrode voltage clamping of Xenopus oocytes was em-
ployed so that the effects of CALHM1 expression on plasma
membrane conductance could be determined. Oocytes were
injected with either water or CALHM1 cRNA, and conductance
was recorded 24–72 hr later in a normal Na+-containing bath.
In water-injected oocytes, the resting membrane potential Vm
was �38mV ± 1mV (n = 74), and the membrane conductance,
measured as the slope conductance around the reversal poten-
tial Vrev, was 1.5 ± 0.2 mS (n = 7). In contrast, the Vm in CALHM1-
expressing oocytes was depolarized to�16mV ± 0.3mV (n = 96;
p < 0. 0001), and membrane conductance was enhanced to
422 ± 78 mS (n = 12) (p < 0.005). The current-voltage (I-V) relation
was outwardly rectifying (slope conductances of 372 ± 110 and
670 ± 131 mS at �55mV and +55mV, respectively) (Figure 4F).
Depolarization of the resting Vm suggested that the CALHM1-en-
hanced conductance was contributed by a Na+ permeability. Is-
osmotic replacement of bath Na+ with NMDG hyperpolarized Vm
by 7mV ± 0.8mV (Figure 4F; n = 12; p < 0.0001). These results
demonstrate that expression of CALHM1 conferred a constitu-
tive Na+ conductance in Xenopus oocyte plasma membrane.
Expression of CALHM1 in CHO cells also generated an out-
wardly rectifying current in whole-cell recordings with Cs+ in the
Figure 2. Tissue Expression, Subcellular
Localization, and N-Glycosylation of Human
CALHM1
(A) Total RNA was used for RT-PCR analyses tar-
geting CALHM1 and b-actin transcripts in multiple
human tissues and brain regions.
(B) Immunofluorescence staining in CHO cells
transfected with human Myc-tagged CALHM1
with anti-Myc (green) and anti-GRP78 (red)
antibodies.
(C) Lysates from HT-22 cells transfected with wild-
type (WT) or mutated (N140A and N74A) Myc-
CALHM1 were incubated in the absence (�) or
presence (+) of endoglycosidase H (Endo H) or
N-glycosidase F (PNGase F). Cell lysates were
probed with anti-Myc (upper panels) and anti-
actin (lower panels) antibodies.
(D) Cell-surface-biotinylated proteins from Myc-
CALHM1-transfected HT-22 cells were precipi-
tated with immobilized avidin and probed with
anti-Myc (upper panel) and anti-N-cadherin (lower
panel, cell-surface positive control) antibodies.
pipette (cytoplasmic) and Na+ in the bath
(Figure 4G). The current reversed �0mV,
indicating that the relative permeabilities
of Cs+ and Na+ were similar (PNa: PCs =
0.8). The current was not observed in
either untransfected or EGFP-transfected
cells (Figure 4G, control), and it was elimi-
nated when the monovalent cations in the
bath and pipette solutions were replaced
with NMDG (Figure 4H), indicating that
the current was carried by Cs+ and Na+.
The CALHM1-induced slope conduc-
tance measured around the Vrev was
360 ± 60 pS/pF (n = 42), compared with
74 ± 17 pS/pF (n = 11) in control cells. Gd3+ (100 mM) nearly com-
pletely inhibited the CALHM1-induced current (Figure 4G). With
bath Na+ replaced by NMDG and 20 mM Ca2+, an outwardly rec-
tifying, Gd3+-sensitive current was observed in the CALHM1-ex-
pressing cells that reversed at +8.3mV ± 2.9mV (n = 7), indicating
PCa: PCs = 5 (Figure 4H). Thus, expression of CALHM1 conferred
a constitutive Ca2+-selective cation current in CHO cell plasma
membrane.
Insummary,ourstudiesshowthata regionofCALHM1sharesse-
quence similarities with the selectivity filter of NMDAR and that the
N72 residue is a key determinant in the control of cytosolic Ca2+
levels by CALHM1. Furthermore, electrophysiological analyses in
CALHM1-expressing Xenopus oocytes and CHO cells demon-
strated that CALHM1 induced a previously uncharacterized plasma
membrane Ca2+-selective cation current. Together with the obser-
vation that the effect of CALHM1 had properties that did not overlap
those of known Ca2+ channels, these results suggest that CALHM1
may be a previously uncharacterized pore-forming ion channel.
CALHM1 Controls APP ProcessingBecause cytosolic Ca2+ is critical for the regulation of APP pro-
cessing (LaFerla, 2002), we asked whether CALHM1 expression
Cell 133, 1149–1161, June 27, 2008 ª2008 Elsevier Inc. 1153
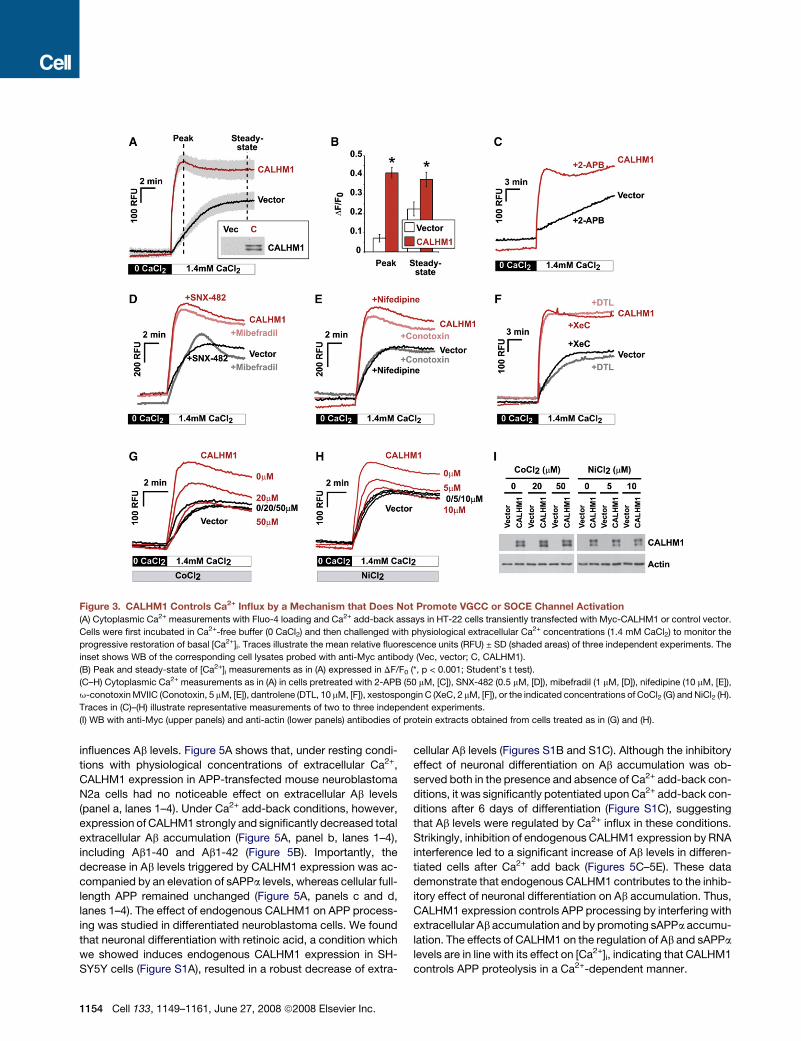
Figure 3. CALHM1 Controls Ca2+ Influx by a Mechanism that Does Not Promote VGCC or SOCE Channel Activation
(A) Cytoplasmic Ca2+ measurements with Fluo-4 loading and Ca2+ add-back assays in HT-22 cells transiently transfected with Myc-CALHM1 or control vector.
Cells were first incubated in Ca2+-free buffer (0 CaCl2) and then challenged with physiological extracellular Ca2+ concentrations (1.4 mM CaCl2) to monitor the
progressive restoration of basal [Ca2+]i. Traces illustrate the mean relative fluorescence units (RFU) ± SD (shaded areas) of three independent experiments. The
inset shows WB of the corresponding cell lysates probed with anti-Myc antibody (Vec, vector; C, CALHM1).
(B) Peak and steady-state of [Ca2+]i measurements as in (A) expressed in DF/F0 (*, p < 0.001; Student’s t test).
(C–H) Cytoplasmic Ca2+ measurements as in (A) in cells pretreated with 2-APB (50 mM, [C]), SNX-482 (0.5 mM, [D]), mibefradil (1 mM, [D]), nifedipine (10 mM, [E]),
u-conotoxin MVIIC (Conotoxin, 5 mM, [E]), dantrolene (DTL, 10 mM, [F]), xestospongin C (XeC, 2 mM, [F]), or the indicated concentrations of CoCl2 (G) and NiCl2 (H).
Traces in (C)–(H) illustrate representative measurements of two to three independent experiments.
(I) WB with anti-Myc (upper panels) and anti-actin (lower panels) antibodies of protein extracts obtained from cells treated as in (G) and (H).
influences Ab levels. Figure 5A shows that, under resting condi-
tions with physiological concentrations of extracellular Ca2+,
CALHM1 expression in APP-transfected mouse neuroblastoma
N2a cells had no noticeable effect on extracellular Ab levels
(panel a, lanes 1–4). Under Ca2+ add-back conditions, however,
expression of CALHM1 strongly and significantly decreased total
extracellular Ab accumulation (Figure 5A, panel b, lanes 1–4),
including Ab1-40 and Ab1-42 (Figure 5B). Importantly, the
decrease in Ab levels triggered by CALHM1 expression was ac-
companied by an elevation of sAPPa levels, whereas cellular full-
length APP remained unchanged (Figure 5A, panels c and d,
lanes 1–4). The effect of endogenous CALHM1 on APP process-
ing was studied in differentiated neuroblastoma cells. We found
that neuronal differentiation with retinoic acid, a condition which
we showed induces endogenous CALHM1 expression in SH-
SY5Y cells (Figure S1A), resulted in a robust decrease of extra-
1154 Cell 133, 1149–1161, June 27, 2008 ª2008 Elsevier Inc.
cellular Ab levels (Figures S1B and S1C). Although the inhibitory
effect of neuronal differentiation on Ab accumulation was ob-
served both in the presence and absence of Ca2+ add-back con-
ditions, it was significantly potentiated upon Ca2+ add-back con-
ditions after 6 days of differentiation (Figure S1C), suggesting
that Ab levels were regulated by Ca2+ influx in these conditions.
Strikingly, inhibition of endogenous CALHM1 expression by RNA
interference led to a significant increase of Ab levels in differen-
tiated cells after Ca2+ add back (Figures 5C–5E). These data
demonstrate that endogenous CALHM1 contributes to the inhib-
itory effect of neuronal differentiation on Ab accumulation. Thus,
CALHM1 expression controls APP processing by interfering with
extracellular Ab accumulation and by promoting sAPPa accumu-
lation. The effects of CALHM1 on the regulation of Ab and sAPPa
levels are in line with its effect on [Ca2+]i, indicating that CALHM1
controls APP proteolysis in a Ca2+-dependent manner.
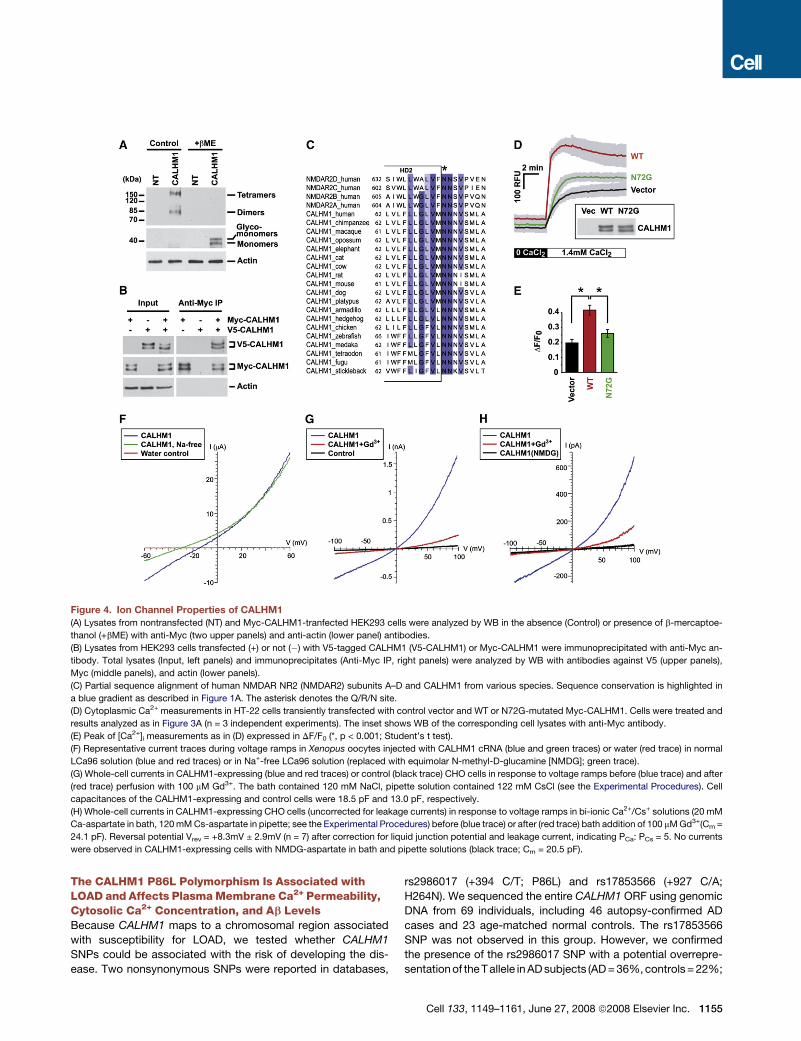
Figure 4. Ion Channel Properties of CALHM1
(A) Lysates from nontransfected (NT) and Myc-CALHM1-tranfected HEK293 cells were analyzed by WB in the absence (Control) or presence of b-mercaptoe-
thanol (+bME) with anti-Myc (two upper panels) and anti-actin (lower panel) antibodies.
(B) Lysates from HEK293 cells transfected (+) or not (�) with V5-tagged CALHM1 (V5-CALHM1) or Myc-CALHM1 were immunoprecipitated with anti-Myc an-
tibody. Total lysates (Input, left panels) and immunoprecipitates (Anti-Myc IP, right panels) were analyzed by WB with antibodies against V5 (upper panels),
Myc (middle panels), and actin (lower panels).
(C) Partial sequence alignment of human NMDAR NR2 (NMDAR2) subunits A–D and CALHM1 from various species. Sequence conservation is highlighted in
a blue gradient as described in Figure 1A. The asterisk denotes the Q/R/N site.
(D) Cytoplasmic Ca2+ measurements in HT-22 cells transiently transfected with control vector and WT or N72G-mutated Myc-CALHM1. Cells were treated and
results analyzed as in Figure 3A (n = 3 independent experiments). The inset shows WB of the corresponding cell lysates with anti-Myc antibody.
(E) Peak of [Ca2+]i measurements as in (D) expressed in DF/F0 (*, p < 0.001; Student’s t test).
(F) Representative current traces during voltage ramps in Xenopus oocytes injected with CALHM1 cRNA (blue and green traces) or water (red trace) in normal
LCa96 solution (blue and red traces) or in Na+-free LCa96 solution (replaced with equimolar N-methyl-D-glucamine [NMDG]; green trace).
(G) Whole-cell currents in CALHM1-expressing (blue and red traces) or control (black trace) CHO cells in response to voltage ramps before (blue trace) and after
(red trace) perfusion with 100 mM Gd3+. The bath contained 120 mM NaCl, pipette solution contained 122 mM CsCl (see the Experimental Procedures). Cell
capacitances of the CALHM1-expressing and control cells were 18.5 pF and 13.0 pF, respectively.
(H) Whole-cell currents in CALHM1-expressing CHO cells (uncorrected for leakage currents) in response to voltage ramps in bi-ionic Ca2+/Cs+ solutions (20 mM
Ca-aspartate in bath, 120 mM Cs-aspartate in pipette; see the Experimental Procedures) before (blue trace) or after (red trace) bath addition of 100 mM Gd3+(Cm =
24.1 pF). Reversal potential Vrev = +8.3mV ± 2.9mV (n = 7) after correction for liquid junction potential and leakage current, indicating PCa: PCs = 5. No currents
were observed in CALHM1-expressing cells with NMDG-aspartate in bath and pipette solutions (black trace; Cm = 20.5 pF).
The CALHM1 P86L Polymorphism Is Associated withLOAD and Affects Plasma Membrane Ca2+ Permeability,Cytosolic Ca2+ Concentration, and Ab LevelsBecause CALHM1 maps to a chromosomal region associated
with susceptibility for LOAD, we tested whether CALHM1
SNPs could be associated with the risk of developing the dis-
ease. Two nonsynonymous SNPs were reported in databases,
rs2986017 (+394 C/T; P86L) and rs17853566 (+927 C/A;
H264N). We sequenced the entire CALHM1 ORF using genomic
DNA from 69 individuals, including 46 autopsy-confirmed AD
cases and 23 age-matched normal controls. The rs17853566
SNP was not observed in this group. However, we confirmed
the presence of the rs2986017 SNP with a potential overrepre-
sentation of the T allele in AD subjects (AD = 36%, controls = 22%;
Cell 133, 1149–1161, June 27, 2008 ª2008 Elsevier Inc. 1155
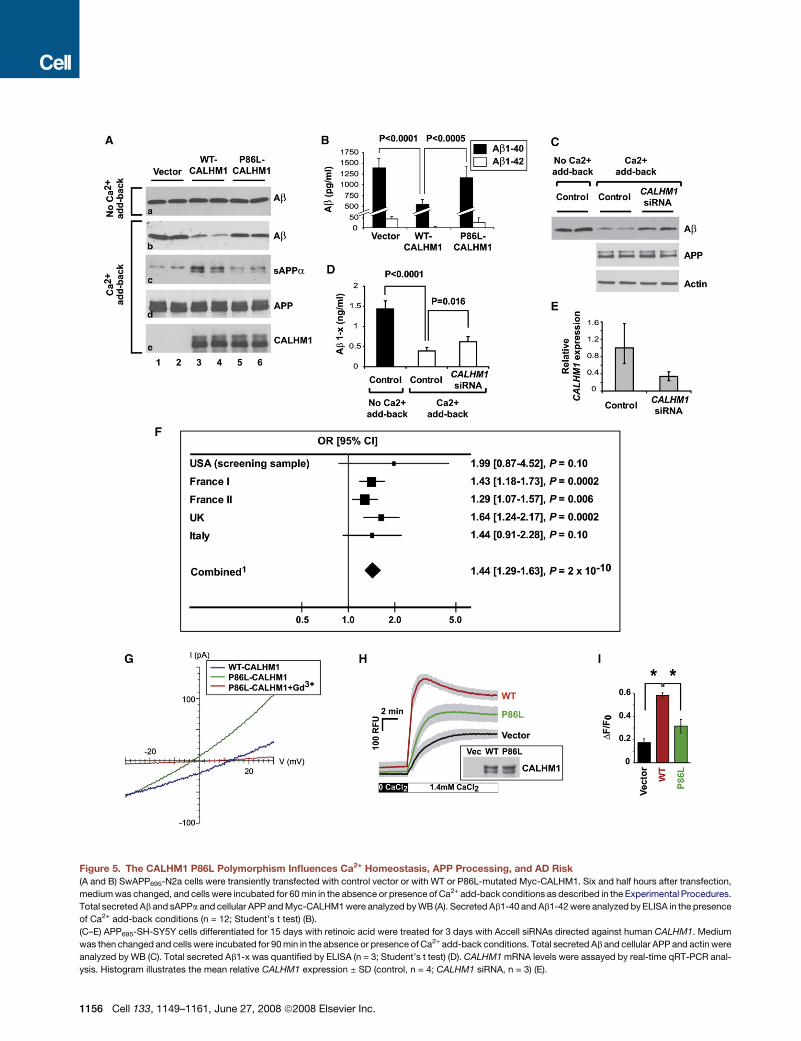
Figure 5. The CALHM1 P86L Polymorphism Influences Ca2+ Homeostasis, APP Processing, and AD Risk
(A and B) SwAPP695-N2a cells were transiently transfected with control vector or with WT or P86L-mutated Myc-CALHM1. Six and half hours after transfection,
medium was changed, and cells were incubated for 60 min in the absence or presence of Ca2+ add-back conditions as described in the Experimental Procedures.
Total secreted Ab and sAPPa and cellular APP and Myc-CALHM1 were analyzed by WB (A). Secreted Ab1-40 and Ab1-42 were analyzed by ELISA in the presence
of Ca2+ add-back conditions (n = 12; Student’s t test) (B).
(C–E) APP695-SH-SY5Y cells differentiated for 15 days with retinoic acid were treated for 3 days with Accell siRNAs directed against human CALHM1. Medium
was then changed and cells were incubated for 90 min in the absence or presence of Ca2+ add-back conditions. Total secreted Ab and cellular APP and actin were
analyzed by WB (C). Total secreted Ab1-x was quantified by ELISA (n = 3; Student’s t test) (D). CALHM1 mRNA levels were assayed by real-time qRT-PCR anal-
ysis. Histogram illustrates the mean relative CALHM1 expression ± SD (control, n = 4; CALHM1 siRNA, n = 3) (E).
1156 Cell 133, 1149–1161, June 27, 2008 ª2008 Elsevier Inc.
Table 2 and Figure 5F; USA screening sample). We next assessed
the impact of rs2986017 on the risk of developing AD in four other
independent case-control populations (2043 AD cases and 1361
controls combined, Table 2). The T allele distribution was in-
creased in AD cases as compared to controls in all the studies,
with odds ratios (ORs) ranging from 1.29 to 1.99 (OR = 1.44, p =
2 3 10�10 in the combined population; Figure 5F). This associa-
tion was highly homogeneous among the different case-control
studies (test for heterogeneity, p = 0.59, I2 = 0%). We also ob-
served that the T allele frequency in autopsy-confirmed AD cases
was similar to that observed in probable AD case populations (Ta-
ble 2). In the combined population, the CT or TT genotypes were
both associated with an increased risk of AD development (re-
spectively, ORCT versus CC ranging from 1.18 to 1.64, OR = 1.37,
p = 3 3 10�5 in the combined population and ORTT versus CC rang-
ing from 1.44 to 4.02, OR = 2.03, p = 2 3 10�7 in the combined
population; Table 2). All these observations were independent
of the APOE status (Table 2 and p for interaction = 0.26).
It is important to note that the rs2986017 distribution was in
Hardy-Weinberg equilibrium in the different control populations
but not in the combined one (c2 = 6.35, df = 1, p = 0.01; Table 2).
Since we mainly used direct sequencing for genotyping, the
potential for technical biases is limited. It is therefore possible
that the slight deviation from the expected genotype distribution
might be linked to a loss of heterozygosity by copy-number var-
iations (CNVs) in the CALHM1 gene. We found no evidence of
common CNV encompassing the rs2986017 locus (see the Sup-
plemental Data). However, we cannot exclude that the deletion
of a short-sized segment around rs2986017 disrupts the
Hardy-Weinberg equilibrium for this marker.
Further evidence of the influence of the CALHM1 gene on the
risk of developing AD comes from the observation that, in the
France I population, patients bearing the TT genotype had an
earlier age at onset compared with the CT and CC carriers
(66.8 ± 8.5 versus 68.7 ± 7.7 years; p = 0.05). We observed the
same trend in the autopsied UK brain cohort (60.5 ± 6.4 versus
65.2 ± 10.3 years; p = 0.12) and in the Italian population (70.6 ±
9.7 versus 74.3 ± 8.5 years; p = 0.10), but not in the France II
population (64.4 ± 8.8 versus 64.6 ± 9.8 years; p = nonsignificant
[ns]). When the AD case populations were combined, the TT ge-
notype was still associated with an earlier age at onset com-
pared with the CT and CC carriers (65.7 ± 8.8 versus 67.1 ±
9.3 years; p = 0.03 adjusted for gender, APOE status, and
center).
In order to gain insight into the relevance of the rs2986017 SNP
to the disease, we first investigated the effect of the correspond-
ing P86L substitution on Ca2+ permeability and [Ca2+]i. Similar to
WT-CALHM1, P86L-CALHM1 expressed in CHO cells gener-
ated a Gd3+-sensitive outwardly rectifying cation current that re-
versed near 0mV with Cs+ and Na+ in the pipette and bath solu-
tions, respectively (data not shown). However, with bath Na+
replaced by NMDG and 20 mM Ca2+, the current reversed at
�8.9mV ± 3.6mV (Figure 5G; n = 6),�17mV hyperpolarized com-
pared with the currents recorded in WT-CALHM1-expressing
cells, resulting in a reduced Ca2+ selectivity, PCa: PCs = 2 (Fig-
ure 5G). Thus, the P86L polymorphism significantly reduced
CALHM1-induced Ca2+ permeability. In addition, we observed
that the P86L mutation caused a significant inhibition of the ef-
fect of CALHM1 on [Ca2+]i (Figures 5H and 5I), reducing its values
at the peak after Ca2+ add back, from 264 ± 48 nM to 192 ±
34 nM (Figure S2). We then asked whether the P86L polymor-
phism affects the control of APP processing by CALHM1.
Whereas expression of WT-CALHM1 was found to stimulate
sAPPa accumulation and to repress total Ab secretion, the ability
of the P86L-mutated CALHM1 to control APP processing
was greatly impaired (Figure 5A, panels b and c), while WT-
and P86L-CALHM1 were expressed at comparable levels
(Figure 5A, panel e). Consequently, compared to WT-CALHM1,
P86L-CALHM1 reduced sAPPa accumulation (Figure 5A, panel
c, lanes 3–6) and led to a significant elevation of total secreted
Ab levels (Figure 5A, panel b, lanes 3–6), including Ab1-40 and
Ab1-42 (Figure 5B), indicating that the P86L mutation signifi-
cantly impaired the effect of CALHM1 on the extracellular accu-
mulation of sAPPa and Ab. Collectively, these data show that the
P86L polymorphism causes a partial loss of CALHM1 function by
interfering with its control of Ca2+ permeability, cytosolic Ca2+
concentration, APP metabolism, and Ab levels.
DISCUSSION
Using a bioinformatics strategy to screen for genes predomi-
nantly expressed in the hippocampus and located in linkage re-
gions for LOAD, we identified CALHM1 on chromosome 10 (Ta-
ble 1). CALHM1 was found to encode an integral membrane
glycoprotein with key characteristics of a Ca2+ channel.
CALHM1 controls cytosolic Ca2+ levels, homomultimerizes,
and shares important sequence similarities with the predicted
selectivity filter of NMDAR (Figures 3 and 4). Significantly, we
have also demonstrated that CALHM1 contains a functionally
important N residue at position 72 that aligns with the Q/R/N
site of the NMDAR selectivity filter (Figure 4). Thus, NMDAR
and CALHM1 share important structural similarities at the se-
quence level in a region that was previously described as a criti-
cal determinant of Ca2+ selectivity and permeability in glutamate
receptor ion channels (Wollmuth and Sobolevsky, 2004). The
potential role of CALHM1 in ion permeability was further investi-
gated by voltage clamping with two different cell models. This
approach demonstrated that expression of CALHM1 generates
(F) Five independent case-control studies were analyzed to assess the association of rs2986017 with AD risk. The allelic OR (T versus C) was estimated in each
population and in the combined one. 1Test for heterogeneity: X2 = 2.84, df = 4, p = 0.59; Test for overall effect: Z = 6.06, p = 2 3 10�9 (Mantel-Haentzel method,
fixed OR = 1.42 [1.27–1.59]).
(G) Whole-cell currents in CHO cells expressing WT (blue trace; Cm = 13.2 pF) or P86L-CALHM1 (green trace; Cm = 22.9 pF) in the same bi-ionic conditions as in
Figure 4H. P86L-CALHM1-expressing cells remained sensitive to block by 100 mM Gd3+ (red trace), but the reversal potential was shifted to more hyperpolarized
voltages (Vrev = �8.9mV ± 3.6mV ; n = 6), indicating a reduced Ca2+ permeability (PCa: PCs = 2) compared with that of WT-CALHM1.
(H) Cytoplasmic Ca2+ measurements in HT-22 cells transiently transfected with control vector and WT or P86L-mutated Myc-CALHM1. Cells were treated and
results analyzed as in Figure 3A (n = 3 independent experiments). The inset shows WB of the corresponding cell lysates with anti-Myc antibody.
(I) Peak of [Ca2+]i measurements as in (H) expressed in DF/F0 (*, p < 0.001; Student’s t test).
Cell 133, 1149–1161, June 27, 2008 ª2008 Elsevier Inc. 1157
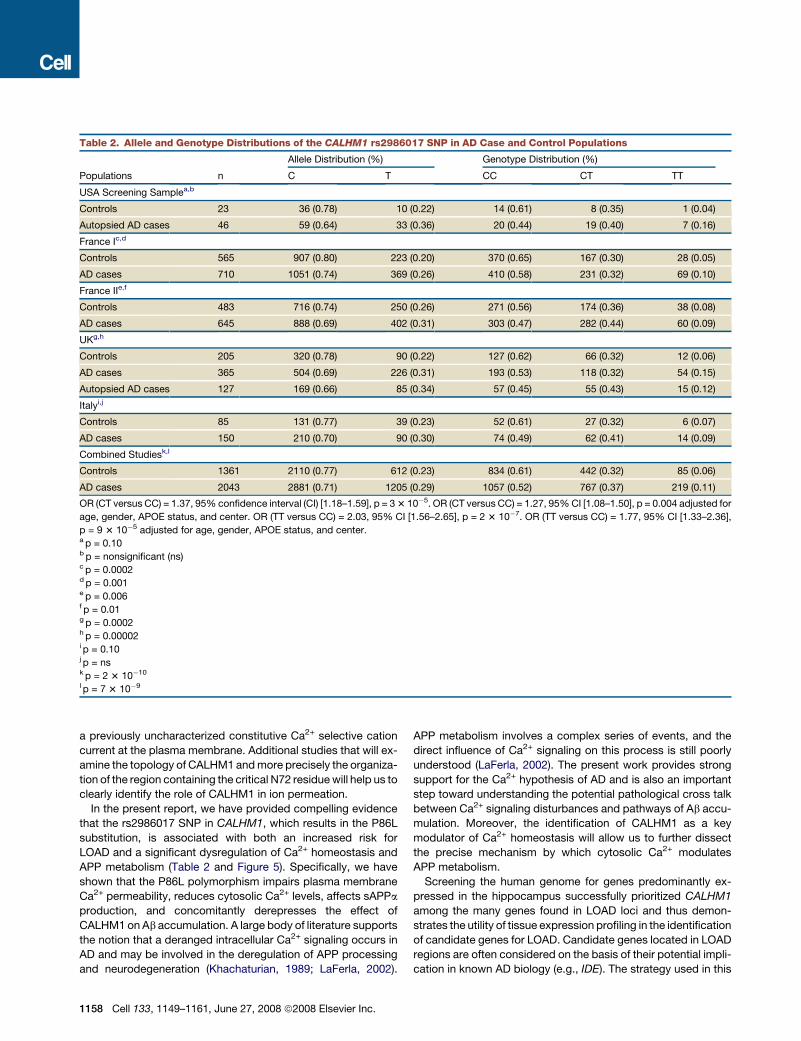
Table 2. Allele and Genotype Distributions of the CALHM1 rs2986017 SNP in AD Case and Control Populations
Allele Distribution (%) Genotype Distribution (%)
Populations n C T CC CT TT
USA Screening Samplea,b
Controls 23 36 (0.78) 10 (0.22) 14 (0.61) 8 (0.35) 1 (0.04)
Autopsied AD cases 46 59 (0.64) 33 (0.36) 20 (0.44) 19 (0.40) 7 (0.16)
France Ic,d
Controls 565 907 (0.80) 223 (0.20) 370 (0.65) 167 (0.30) 28 (0.05)
AD cases 710 1051 (0.74) 369 (0.26) 410 (0.58) 231 (0.32) 69 (0.10)
France IIe,f
Controls 483 716 (0.74) 250 (0.26) 271 (0.56) 174 (0.36) 38 (0.08)
AD cases 645 888 (0.69) 402 (0.31) 303 (0.47) 282 (0.44) 60 (0.09)
UKg,h
Controls 205 320 (0.78) 90 (0.22) 127 (0.62) 66 (0.32) 12 (0.06)
AD cases 365 504 (0.69) 226 (0.31) 193 (0.53) 118 (0.32) 54 (0.15)
Autopsied AD cases 127 169 (0.66) 85 (0.34) 57 (0.45) 55 (0.43) 15 (0.12)
Italyi,j
Controls 85 131 (0.77) 39 (0.23) 52 (0.61) 27 (0.32) 6 (0.07)
AD cases 150 210 (0.70) 90 (0.30) 74 (0.49) 62 (0.41) 14 (0.09)
Combined Studiesk,l
Controls 1361 2110 (0.77) 612 (0.23) 834 (0.61) 442 (0.32) 85 (0.06)
AD cases 2043 2881 (0.71) 1205 (0.29) 1057 (0.52) 767 (0.37) 219 (0.11)
OR (CT versus CC) = 1.37, 95% confidence interval (CI) [1.18–1.59], p = 3 3 10�5. OR (CT versus CC) = 1.27, 95% CI [1.08–1.50], p = 0.004 adjusted for
age, gender, APOE status, and center. OR (TT versus CC) = 2.03, 95% CI [1.56–2.65], p = 2 3 10�7. OR (TT versus CC) = 1.77, 95% CI [1.33–2.36],
p = 9 3 10�5 adjusted for age, gender, APOE status, and center.a p = 0.10b p = nonsignificant (ns)c p = 0.0002d p = 0.001e p = 0.006f p = 0.01g p = 0.0002h p = 0.00002i p = 0.10j p = nsk p = 2 3 10�10
l p = 7 3 10�9
a previously uncharacterized constitutive Ca2+ selective cation
current at the plasma membrane. Additional studies that will ex-
amine the topology of CALHM1 and more precisely the organiza-
tion of the region containing the critical N72 residue will help us to
clearly identify the role of CALHM1 in ion permeation.
In the present report, we have provided compelling evidence
that the rs2986017 SNP in CALHM1, which results in the P86L
substitution, is associated with both an increased risk for
LOAD and a significant dysregulation of Ca2+ homeostasis and
APP metabolism (Table 2 and Figure 5). Specifically, we have
shown that the P86L polymorphism impairs plasma membrane
Ca2+ permeability, reduces cytosolic Ca2+ levels, affects sAPPa
production, and concomitantly derepresses the effect of
CALHM1 on Ab accumulation. A large body of literature supports
the notion that a deranged intracellular Ca2+ signaling occurs in
AD and may be involved in the deregulation of APP processing
and neurodegeneration (Khachaturian, 1989; LaFerla, 2002).
1158 Cell 133, 1149–1161, June 27, 2008 ª2008 Elsevier Inc.
APP metabolism involves a complex series of events, and the
direct influence of Ca2+ signaling on this process is still poorly
understood (LaFerla, 2002). The present work provides strong
support for the Ca2+ hypothesis of AD and is also an important
step toward understanding the potential pathological cross talk
between Ca2+ signaling disturbances and pathways of Ab accu-
mulation. Moreover, the identification of CALHM1 as a key
modulator of Ca2+ homeostasis will allow us to further dissect
the precise mechanism by which cytosolic Ca2+ modulates
APP metabolism.
Screening the human genome for genes predominantly ex-
pressed in the hippocampus successfully prioritized CALHM1
among the many genes found in LOAD loci and thus demon-
strates the utility of tissue expression profiling in the identification
of candidate genes for LOAD. Candidate genes located in LOAD
regions are often considered on the basis of their potential impli-
cation in known AD biology (e.g., IDE). The strategy used in this
study can therefore complement these approaches and suggest
candidates, including those of unknown function, worthy of con-
sideration. Supporting this notion, recent data have shown that
tissue expression profiles can be used to effectively prioritize
candidate genes in another neurodegenerative genetic disorder
(F. Campagne, 2007, Soc. Neurosci., abstract.).
In summary, we propose that CALHM1 is a pore component of
a previously uncharacterized cerebral ion channel family and that
variants in the CALHM genes may constitute robust risk factors
for LOAD. These results not only provide important new insights
into the pathophysiology of Ca2+ homeostasis and APP metab-
olism in the central nervous system but also represent a strong
genetic evidence of a channelopathy contribution to AD etiology.
Finally, given its cell-surface ion channel properties and its re-
stricted expression, our work further establishes CALHM1 as
a potentially important molecular target for an anti-amyloid
therapy in AD.
EXPERIMENTAL PROCEDURES
Bioinformatics Analyses
Tissue Expression Profiles
We generated whole-genome human tissue expression profiles by using Tis-
sueInfo (http://icb.med.cornell.edu/crt/tissueinfo/index.xml), information in
Ensembl (human build NCBI35), and dbEST. TissueInfo profiling was done
as previously described (Campagne and Skrabanek, 2006; Skrabanek and
Campagne, 2001). Whole-genome profiles were filtered with InsightfulMiner
7.0 (Insightful) to extract the subset of transcripts annotated by TissueInfo as
‘‘specific to hippocampus.’’
LOAD Locus Screen
The 30 transcripts predicted to be specific to the hippocampus by TissueInfo
were annotated with their genomic location with EnsMart/Biomart (Kasprzyk
et al., 2004) and data from Ensembl. Chromosome numbers and FISH band
locations were used to identify those transcripts that matched a locus of sus-
ceptibility to AD, as documented in AlzGene (Bertram et al., 2007).
CALHM1 Subcloning and Mutagenesis
Human CALHM1 cDNA was obtained from ATCC. The ORF was subcloned in
frame with a carboxy-terminal Myc-His or V5 tag into the pcDNA3.1 vector for
expression experiments. P86L, N72G, N74A, and N140A mutations were intro-
duced with the QuikChange II site-directed mutagenesis kit (Stratagene) and
confirmed by sequencing.
Ca2+ Measurements and Ca2+ Add-Back Assays
Free cytosolic Ca2+ was measured in transiently transfected HT-22 cells plated
in 6-well plates with the fluorescent Ca2+ indicator Fluo-4. Five and half hours
after transfection, cells were loaded with Fluo-4 per the manufacturer’s recom-
mendations (Fluo-4 NW Ca2+ Assay Kit, Molecular Probes). For Ca2+ add-back
assays, cells were washed with Ca2+/Mg2+-free phosphate-buffered saline
(PBS) and incubated for 10 min in the absence or presence of the indicated in-
hibitors in Ca2+/Mg2+-free Hanks’ balanced salt solution (HBSS), supple-
mented with 20 mM HEPES buffer, 0.5 mM MgCl2, and 0.4 mM MgSO4.
Ca2+ was then added back to a final concentration of 1.4 mM. Fluorescence
measurements were carried out at room temperature with a Tecan GENios
Pro plate reader at 485 nm excitation and 535 nm emission. Cells were then
washed with PBS and analyzed by WB.
WB and ELISA
For APP processing analysis, APP-transfected cells were challenged with
Ca2+ add-back conditions, as described above. Conditioned medium and
cells were harvested after the indicated times of incubation at 37�C in a humid-
ified 5% CO2 incubator. Secreted Ab WB was performed as previously de-
scribed (Marambaud et al., 2005). WB of sAPPa and APP was performed
with 6E10 (Signet) and LN27 (Zymed) antibodies, respectively. For ELISA,
secreted Ab1-40, Ab1-42, and Ab1-x levels were quantified per the manufac-
turer’s recommendations (IBL-America). ELISA plates were read on a Tecan
GENios Pro reader at 450 nm.
CALHM1 Sequencing
CALHM1 ORF was resequenced with genomic DNA preparations obtained
from 23 control individuals (age at study = 71.9 ± 16.0 years, 43% male) and
46 autopsy-confirmed AD patients (age at study = 77.8 ± 8.1 years, 55%
male). Subjects and genomic DNA preparations were described elsewhere
(Conrad et al., 2002). ORFs were amplified by PCR with primers described in
the Supplemental Data, and PCR products were sequenced by GeneWiz.
SNP Analyses
Populations
See the Supplemental Data.
Genotyping
In the France I population, the P86L genotype was determined by genomic
DNA amplification. The genotyping of 176 individuals was checked by direct
sequencing. Only two discrepancies were observed between CC and CT
genotypes. In the UK, France II, and Italy populations, the P86L genotype
was entirely determined by direct sequencing. See Supplemental Data for
experimental details.
Statistical Analyses
Univariate analysis was performed with Pearson’s c2 test. The review manager
software release 5.0 (http://www.cc-ims.net/RevMan/) was used to test for
heterogeneity between the different case-control studies and to estimate the
overall effect (Mantel-Haentzel fixed odds ratio; Figure 5F). For multivariate
analysis, SAS software release 8.02 was used (SAS Institute, Cary, NC), and
homogeneity between populations was tested with Breslow-day computation
(Breslow et al., 1978). The association of the P86L polymorphism with the risk
of developing AD was assessed by a multiple logistic regression model ad-
justed for age, gender, APOE status, and center. Interactions between age,
gender, or APOE and the P86L polymorphism were tested by logistic regres-
sion. No significant statistical interactions were detected. Finally, the potential
impact of the P86L polymorphism on age at onset was assessed with a general
linear model adjusted for gender, APOE status, and center.
Electrophysiology
Xenopus oocyte plasma membrane conductance was recorded 24–72 hr after
cRNA injection. Single oocytes were placed in a 1 ml chamber containing
LCa96 solution. In some studies, Na+ was replaced with NMDG. Conventional
two-electrode voltage clamp was performed. Pulse+PulseFit software (HEKA
Elektronik) was used to ramp the applied transmembrane potential (Vm) at 10 s
intervals from �80mV to 80mV at 16mV/s and to acquire data. Vm was
clamped at the resting membrane potential between voltage ramps. Trans-
membrane current (I) and Vm were digitized at 200 Hz and recorded directly
to hard disk. So that the reversal potential Vrev could be determined, a fifth-
order polynomial was fitted to the raw I-Vm data acquired during each voltage
ramp, with macros developed in Igor Pro software (WaveMetrics). Whole-cell
recordings of CHO cells were performed with 2–5 MU pipettes with an Axo-
patch 200-B amplifier (Axon Instr.). Current-voltage (I-V) relationships were ac-
quired in response to voltage ramps (±100mV, 2 s duration). The recording
chamber was continuously perfused with bath solution (2 ml/min). See the
Supplemental Data for experimental details.
Data analyzed with macros developed in Igor Pro were corrected for leakage
currents (determined from a linear fit of the currents recorded at �80mV to
�100mV in the presence of 100 mM GdCl3 extrapolated over the entire ramping
voltage domain) and for measured junction potentials. I-V curves presented in
the figures have not been corrected for leakage current. Calculated values are
given as means ± SEM.
ACCESSION NUMBERS
Human CALHM1 (previously annotated FAM26C) has Ensembl release 43
accession code ENSG00000185933 (Uniprot Q8IU99). CALHM3 has acces-
sion code ENSG00000183128, and CALHM2 has accession code
Cell 133, 1149–1161, June 27, 2008 ª2008 Elsevier Inc. 1159
ENSG00000138172. See the Supplemental Data for additional accession
numbers.
SUPPLEMENTAL DATA
Supplemental Data include Supplemental Results, Supplemental Experimen-
tal Procedures, Supplemental References, and four figures and can be found
with this article online at http://www.cell.com/cgi/content/full/133/7/1149/
DC1/.
ACKNOWLEDGMENTS
We thank G. Thinakaran (University of Chicago, Chicago, IL) for kindly provid-
ing us with SwAPP695-N2a cells; D. Schubert (Salk Institute, La Jolla, CA) for
HT-22 cells; B. De Strooper (K.U. Leuven and VIB, Leuven, Belgium) for WT
and PS-deficient fibroblasts; N.K. Robakis (Mount Sinai School of Medicine,
New York, NY) for 33B10 antibody; L. Buee (INSERM U837, Lille, France) for
APP695-SH-SY5Y cells; D. Mak (University of Pennsylvania, Philadelphia, PA)
for assistance with electrophysiology data analysis; King-Ho Cheung for assis-
tance with the fura-2 imaging experiments; and A. Chan (North Shore-LIJ,
Manhasset, NY) for assistance with microscopy studies. The authors are
grateful to C. Clancy (Weill Medical College of Cornell University, New York,
NY), and M. Symons and R. Ruggieri (North Shore-LIJ, Manhasset, NY) for
helpful comments on the manuscript. This work was supported by the Alz-
heimer’s Association (P.M.) and the National Institutes of Health grant R01
MH059937 (J.K.F.). F.C. acknowledges support from the resources of the
HRH Prince Alwaleed Bin Talal Bin Abdulaziz Alsaud Institute for Computa-
tional Biomedicine and the David A. Cofrin Center for Biomedical Information
at Weill Cornell.
Received: January 31, 2008
Revised: April 30, 2008
Accepted: May 22, 2008
Published: June 26, 2008
REFERENCES
Berridge, M.J., Bootman, M.D., and Roderick, H.L. (2003). Calcium signalling:
Dynamics, homeostasis and remodelling. Nat. Rev. Mol. Cell Biol. 4, 517–529.
Bertram, L., Blacker, D., Mullin, K., Keeney, D., Jones, J., Basu, S., Yhu, S.,
McInnis, M.G., Go, R.C., Vekrellis, K., et al. (2000). Evidence for genetic linkage
of Alzheimer’s disease to chromosome 10q. Science 290, 2302–2303.
Bertram, L., Hsiao, M., Lange, C., Blacker, D., and Tanzi, R.E. (2006). Single-
nucleotide polymorphism rs498055 on chromosome 10q24 is not associated
with Alzheimer disease in two independent family samples. Am. J. Hum.
Genet. 79, 180–183.
Bertram, L., McQueen, M.B., Mullin, K., Blacker, D., and Tanzi, R.E. (2007).
Systematic meta-analyses of Alzheimer disease genetic association studies:
The AlzGene database. Nat. Genet. 39, 17–23.
Blacker, D., Bertram, L., Saunders, A.J., Moscarillo, T.J., Albert, M.S., Wiener,
H., Perry, R.T., Collins, J.S., Harrell, L.E., Go, R.C., et al. (2003). Results of
a high-resolution genome screen of 437 Alzheimer’s disease families. Hum.
Mol. Genet. 12, 23–32.
Braak, H., and Braak, E. (1991). Neuropathological stageing of Alzheimer-
related changes. Acta Neuropathol. (Berl.) 82, 239–259.
Breslow, N.E., Day, N.E., Halvorsen, K.T., Prentice, R.L., and Sabai, C. (1978).
Estimation of multiple relative risk functions in matched case-control studies.
Am. J. Epidemiol. 108, 299–307.
Campagne, F., and Skrabanek, L. (2006). Mining expressed sequence tags
identifies cancer markers of clinical interest. BMC Bioinformatics 7, 481.
Conrad, C., Vianna, C., Freeman, M., and Davies, P. (2002). A polymorphic
gene nested within an intron of the tau gene: Implications for Alzheimer’s dis-
ease. Proc. Natl. Acad. Sci. USA 99, 7751–7756.
de Leon, M.J., Mosconi, L., Blennow, K., DeSanti, S., Zinkowski, R., Mehta,
P.D., Pratico, D., Tsui, W., Saint Louis, L.A., Sobanska, L., et al. (2007). Imaging
and CSF studies in the preclinical diagnosis of Alzheimer’s disease. Ann. N Y
Acad. Sci. 1097, 114–145.
Dingledine, R., Borges, K., Bowie, D., and Traynelis, S.F. (1999). The glutamate
receptor ion channels. Pharmacol. Rev. 51, 7–61.
Ertekin-Taner, N., Graff-Radford, N., Younkin, L.H., Eckman, C., Baker, M.,
Adamson, J., Ronald, J., Blangero, J., Hutton, M., and Younkin, S.G. (2000).
Linkage of plasma Abeta42 to a quantitative locus on chromosome 10 in
late-onset Alzheimer’s disease pedigrees. Science 290, 2303–2304.
Farrer, L.A., Bowirrat, A., Friedland, R.P., Waraska, K., Korczyn, A.D., and
Baldwin, C.T. (2003). Identification of multiple loci for Alzheimer disease in
a consanguineous Israeli-Arab community. Hum. Mol. Genet. 12, 415–422.
Gouaux, E., and Mackinnon, R. (2005). Principles of selective ion transport in
channels and pumps. Science 310, 1461–1465.
Grupe, A., Li, Y., Rowland, C., Nowotny, P., Hinrichs, A.L., Smemo, S., Kauwe,
J.S., Maxwell, T.J., Cherny, S., Doil, L., et al. (2006). A scan of chromosome 10
identifies a novel locus showing strong association with late-onset Alzheimer
disease. Am. J. Hum. Genet. 78, 78–88.
Kasprzyk, A., Keefe, D., Smedley, D., London, D., Spooner, W., Melsopp, C.,
Hammond, M., Rocca-Serra, P., Cox, T., and Birney, E. (2004). EnsMart: A
generic system for fast and flexible access to biological data. Genome Res.
14, 160–169.
Kehoe, P., Wavrant-De Vrieze, F., Crook, R., Wu, W.S., Holmans, P., Fenton, I.,
Spurlock, G., Norton, N., Williams, H., Williams, N., et al. (1999). A full genome
scan for late onset Alzheimer’s disease. Hum. Mol. Genet. 8, 237–245.
Kennedy, J.L., Farrer, L.A., Andreasen, N.C., Mayeux, R., and St George-Hys-
lop, P. (2003). The genetics of adult-onset neuropsychiatric disease: Complex-
ities and conundra? Science 302, 822–826.
Khachaturian, Z.S. (1989). Calcium, membranes, aging, and Alzheimer’s dis-
ease. Introduction and overview. Ann. N Y Acad. Sci. 568, 1–4.
Kuwano, R., Miyashita, A., Arai, H., Asada, T., Imagawa, M., Shoji, M., Higuchi,
S., Urakami, K., Kakita, A., Takahashi, H., et al. (2006). Dynamin-binding pro-
tein gene on chromosome 10q is associated with late-onset Alzheimer’s dis-
ease. Hum. Mol. Genet. 15, 2170–2182.
LaFerla, F.M. (2002). Calcium dyshomeostasis and intracellular signalling in
Alzheimer’s disease. Nat. Rev. Neurosci. 3, 862–872.
Lambert, J.C., and Amouyel, P. (2007). Genetic heterogeneity of Alzheimer’s
disease: Complexity and advances. Psychoneuroendocrinology 32 (Suppl. 1),
S62–S70.
Marambaud, P., and Robakis, N.K. (2005). Genetic and molecular aspects of
Alzheimer’s disease shed light on new mechanisms of transcriptional regula-
tion. Genes Brain Behav. 4, 134–146.
Marambaud, P., Zhao, H., and Davies, P. (2005). Resveratrol promotes clear-
ance of Alzheimer’s disease amyloid-beta peptides. J. Biol. Chem. 280,
37377–37382.
Mattson, M.P. (2004). Pathways towards and away from Alzheimer’s disease.
Nature 430, 631–639.
Minster, R.L., DeKosky, S.T., and Kamboh, M.I. (2006). Lack of association of
two chromosome 10q24 SNPs with Alzheimer’s disease. Neurosci. Lett. 408,
170–172.
Myers, A., Holmans, P., Marshall, H., Kwon, J., Meyer, D., Ramic, D., Shears,
S., Booth, J., DeVrieze, F.W., Crook, R., et al. (2000). Susceptibility locus for
Alzheimer’s disease on chromosome 10. Science 290, 2304–2305.
Pastor, P., and Goate, A.M. (2004). Molecular genetics of Alzheimer’s disease.
Curr. Psychiatry Rep. 6, 125–133.
Selkoe, D.J. (2001). Alzheimer’s disease: Genes, proteins, and therapy. Phys-
iol. Rev. 81, 741–766.
Shibuya, I., and Douglas, W.W. (1992). Calcium channels in rat melanotrophs
are permeable to manganese, cobalt, cadmium, and lanthanum, but not to
nickel: Evidence provided by fluorescence changes in fura-2-loaded cells.
Endocrinology 131, 1936–1941.
1160 Cell 133, 1149–1161, June 27, 2008 ª2008 Elsevier Inc.

Skrabanek, L., and Campagne, F. (2001). TissueInfo: High-throughput identi-
fication of tissue expression profiles and specificity. Nucleic Acids Res. 29,
E102–E102.
Strittmatter, W.J., Saunders, A.M., Schmechel, D., Pericak-Vance, M.,
Enghild, J., Salvesen, G.S., and Roses, A.D. (1993). Apolipoprotein E: High-
avidity binding to beta-amyloid and increased frequency of type 4 allele in
late-onset familial Alzheimer disease. Proc. Natl. Acad. Sci. USA 90, 1977–
1981.
Tu, H., Nelson, O., Bezprozvanny, A., Wang, Z., Lee, S.F., Hao, Y.H., Serneels,
L., De Strooper, B., Yu, G., and Bezprozvanny, I. (2006). Presenilins form ER
Ca2+ leak channels, a function disrupted by familial Alzheimer’s disease-
linked mutations. Cell 126, 981–993.
Wilquet, V., and De Strooper, B. (2004). Amyloid-beta precursor protein
processing in neurodegeneration. Curr. Opin. Neurobiol. 14, 582–588.
Wollmuth, L.P., and Sobolevsky, A.I. (2004). Structure and gating of the gluta-
mate receptor ion channel. Trends Neurosci. 27, 321–328.
Cell 133, 1149–1161, June 27, 2008 ª2008 Elsevier Inc. 1161
Related Documents