A Points Per Game Rating For NFL Quarterbacks Thesis Presented in Partial Fulfillment of the Requirements for the Degree Master of Sciences in the Graduate School of The Ohio State University By Jon Michael Gober, B.A. Graduate Program in Agricultural, Environmental and Development Economics The Ohio State University 2009 Thesis Committee: Professor Tim Haab, Advisor Professor Brian Roe

A Points Per Game Rating for NFL Quarterbacks
Oct 28, 2015
Welcome message from author
This document is posted to help you gain knowledge. Please leave a comment to let me know what you think about it! Share it to your friends and learn new things together.
Transcript

A Points Per Game Rating For NFL Quarterbacks
Thesis
Presented in Partial Fulfillment of the Requirements for the Degree Master of Sciences in
the Graduate School of The Ohio State University
By
Jon Michael Gober, B.A.
Graduate Program in Agricultural, Environmental and Development Economics
The Ohio State University
2009
Thesis Committee:
Professor Tim Haab, Advisor
Professor Brian Roe

Copyright by
Jon Michael Gober
2009

ii
Abstract
Fans, teams, and commentators frequently use the NFL quarterback rating to
evaluate quarterback performance. Linear programming models, tiered logistic
regressions, and ordinary least squares regressions have also been used to measure
efficiency but the NFL rating is the most frequently used metric. One deficiency of the
NFL rating is that it overvalues completion percentage and interception percentage
relative to passing yards per attempt. This creates a bias in favor of modern quarterbacks
in the rating. I use NFL teams’ season statistics from 1970 through 2006 to derive a
rating estimating a quarterback’s contribution to points-per-game with an ordinary least
squares regression. I find that the points-per-game rating has less historical bias than the
NFL rating and predicts winning percentage equally well.

iii
Acknowledgments
I wish to thank my advisor, Dr. Tim Haab, for his advice and assistance in the
development of this thesis.
I also thank Dr. Brian Roe and Dr. Alan Randall for their comments on the
preliminary drafts of this thesis.
iv
Vita
March 4, 1984…………………………………………..Born-Charleston, West Virginia
2007…………………………………B.A. Mathematics-Economics, Denison University
2008 – Present…………………Graduate Teaching Assistant, The Ohio State University
Field of Study
Major Field: Agricultural, Environmental, and Development Economics

v
Table of Contents
Abstract…………………………………………………………………..……………….ii
Acknowledgments…………………………………………………………..…....………iii
Vita……………………………………………………………………………..…….…..iv
List of Tables………………………………………………………………..……………vi
Chapters:
1. Introduction………………………………………………………………….……..….1
2. Literature Review…………………………………………………………………...…7
3. Methodology and Model Design……………………………………………....….….12
4. Model Results……………………………………………………………….…….….17
5. Comparisons with Modern NFL Quarterback Rating……………………….…….....20
6. The ―Costs‖ of Each Rating System………………………………………….……....24
7. Other Approaches to Estimating Quarterback Efficiency…………………….......….28
8. Conclusions……………………………………………………………………...…....31
Bibliography……………………………………………...………………………....…41

vi
List of Tables
Table Page
1 Time Trends in Certain NFL Statistics…………………………………..…………...33
2 Variables that Impact Points per Game………………………………………..……..33
3 NFL Quarterback Rating versus a Points-per-Game Rating (for 2008)……..…….....34
4 Top 20 Quarterbacks All-Time, Minimum 1,500 Attempts…………….…………...36
5 Quarterbacks Who Benefit From A Points-Per-Game Ranking……………..……....37
6 Quarterbacks Who Benefit From the NFL Quarterback Rating………………..…....38
7 Correlation with Winning Percentage……………………………………..………....38
8 Cap Value and the Quarterback Rating........................................................................38
9 Cap Value and the Points-Per-Game Rating………………………………………....39
10 Offensive Statistics and the Natural Log of Points-Per-Game………...…………....39
11 A Points-Based Quarterback Rating Using Individual Game Data…………….......39
12 Individual Game Stats and the Natural Log of Points…………………...……........40
13 A Probit Model for Wins and Losses……………………………………….…...….40

1
CHAPTER 1
INTRODUCTION
Comparisons of professional athletes’ performances are a common topic of
discussion. Frequently these comparisons are based on statistical metrics that correlate
strongly with team success. In the academic world, most of the economic literature
concerning statistics in sports centers on baseball. A reason for this is that the
performance of an individual baseball player is relatively independent of his
teammates— the skill of the player in question primarily determines such statistics as
batting average, on-base percentage, and slugging percentage. American football
statistics, on the other hand, are highly interdependent. For example, a successful
running back often has a good offensive line and a good wide receiver usually has a good
quarterback throwing him the ball. The statistics of the quarterback position are highly
dependent on other position players: a quarterback needs a good offensive line to attempt
passes without getting tackled, a good running back to draw defensive players away from
the wide receivers, and good wide receivers to increase his passing yards. The current
NFL quarterback rating system1 attempts to accurately measure quarterback performance
in light of these considerations. However, the current NFL quarterback rating system is
1 The National Football League and NCAA football have separate quarterback rating systems. This paper is
concerned with the NFL rating. All references to the quarterback rating system refer to the NFL rating unless stated otherwise.

2
convoluted, has no meaningful interpretation as a statistic, double-counts certain metrics
and excludes some important metrics.
A committee of representatives from the Pro Football Hall of Fame and the Elias
Sports Bureau created the modern NFL quarterback rating in 1973. Fixed statistical
benchmarks are the basis for the NFL rating, while the NCAA rating evaluates
quarterbacks based on statistical averages. The fixed performance benchmarks of the
NFL rating are based on the statistics of all qualified pro passers since 1960. To be
included in the rating, a quarterback must average fourteen pass attempts per team game
played. To demonstrate the convoluted nature of the quarterback rating formula, it is
useful to look at its components: completion percentage, yards per pass attempt, average
touchdowns per pass (i.e. touchdown percentage), and average interceptions per pass (i.e.
interception percentage). The quarterback’s rating is the sum of the following four
components, multiplied by 100/6:
1. (Completion Percentage-0.3) / 0.2
2. (Yards Per Pass Attempt-3)/4
3. Touchdowns Per Pass Attempt/0.05
4. (0.095-Interceptions Per Pass Attempt)/0.04
Each component is bounded between 0 and 2.375. In other words, negative
values are set to zero and values above 2.375 are set to 2.375. This makes the zero the
lowest possible rating and 158.3 the highest possible rating. The rating is one of the most
common measures of quarterback performance used today. It is important economically
because it is frequently used as an incentive in player contracts. For example, Donovan
3
McNabb, Akili Smith, and Tony Banks have all signed contracts with bonuses related to
their quarterback ratings reaching a given threshold. Given NFL quarterbacks’ high
salaries, the difference between a high rating and a low rating can be worth millions of
dollars. In light of the large amounts of money at stake, you would think that the rating
system would have relatively few problems, but, as I will demonstrate, it has several
deficiencies.
One problem with the rating is its creation in 1973 based on statistics after 1960.
From the rating’s creation to the 2007 season, completion percentage has increased from
52.1 to 61.2 percent (a seventeen percent improvement). During the same time frame,
interception percentage has dropped from 5.3 to 3.1 percent (a forty percent
improvement). The time trends in these two categories have caused the average
quarterback rating to rise from 64.9 in 1973 to 80.9 in 2007 (a 24 percent improvement).
This raises the question of whether NFL quarterbacks have improved 24 percent in the
last three decades or whether the nature of pro football has changed in such a way as to
make quarterback statistics better. Given the frequency of West Coast offenses in today’s
game (which focus on easily completed, low risk passes), I believe the latter hypothesis
to be true. The current system is so biased towards modern offenses that fourteen of the
top seventeen career quarterback ratings come from active players.2
When looking at the year by year data, there is further reason to believe that there
is a time trend in these statistics: completion percentage, interception percentage, and
quarterback rating. Table 1 shows that the independent variable year is significant at the
2 http://www.profootballhof.com/history/story.jsp?story_id=2664 Accessed 11-12-2008. Ratings are
from the start of the 2008 season.

4
one percent level for the three statistics, despite there only being 37 observations (the
NFL yearly averages from 1970 through 2006). The table also shows that the variable
year is not statistically related to the yards per attempt statistic. An ideal rating system
for quarterbacks should have less of a time bias.
Another problem with the rating is that it overvalues completion percentage.
Because yards per attempt equals completion percentage times yards per completion,
completion percentage is implicitly double-counted in the formula. For example, an
incomplete pass counts as zero yards per attempt and also negatively impacts completion
percentage. Since completion percentage is implicitly included in yards per attempt, it
would make sense to reduce the weight given to completion percentage in the rating.
Also, the weights of the four components of the rating are arbitrary and unlikely to
correlate precisely with quarterback productivity.
A third problem with the rating is the bounded values of its four components.
Once certain benchmarks are attained, improved statistics do not improve the rating. For
example, once a passer attains a 77.5 completion percentage, the value of this component
cannot be improved. As far as the rating is concerned, a one-hundred percent completion
rate is equal to an eighty percent completion rate. Similarly, once a passer attains a 9.5
interception percentage, the value of this component cannot decline. The rating treats a
ten percent interception percentage the same as a fifty percent interception percentage.
Finally, there are no diminishing returns for yards per attempt below 3 or increasing
returns for yards per attempt beyond 12.5. While bounded values for the rating
components are not an issue over the course of a career or a season, they do become
important when evaluating individual game performances. There is no explicit constraint
5
on points scored in a game (although there is an implicit constraint with the game clock);
therefore the quarterback rating should not be constrained beyond the constraints inherent
in a sixty minute contest on a one hundred yard field.
Finally, the NFL rating excludes several important categories such as quarterback
rushes, fumbles, and sacks. The ability to run for positive yardage adds to a
quarterback’s value. Fumbles are clearly harmful to a team’s success yet they have no
impact on the current rating. Although many sacks are the fault of the offensive line,
sometimes the quarterback is to blame for a sack because he wasn’t mobile enough or
held on to the ball for too long. A sack is clearly worse than an incomplete pass, yet the
former category does not change the rating while the latter category diminishes it.
Including a wider variety of plays would improve the current rating.
Also, the NFL quarterback rating is difficult to interpret because it is not clear
what exactly is being measured. In my opinion, this is the greatest flaw in the rating.
Presumably the rating measures passing efficiency, but in what sense? The current rating
system combines inputs (completion percentage, yards per attempt, etc.), but the output
has no units associated with it. Because the output can’t be explained in terms of a
dependent variable (points, winning percentage, etc.), comparisons between quarterbacks
are difficult. How much better is a 95 quarterback rating than a 75? Later I will explain
why points per game should be the dependent variable in a quarterback rating system.
As a caveat, I do not think there is a perfect quarterback rating system. No rating
can address every possible question or complaint. However, I think there are enough
problems with the current system that it can be improved using statistical tools. Although

6
there is relatively little literature on this topic, some researchers have attempted to
improve the quarterback rating using linear programming, tiered logistic regression, and
least squares regression.

7
CHAPTER 2
LITERATURE REVIEW
DeOliveira and Callum used a linear programming approach called Data
Envelopment Analysis (DEA) to evaluate NFL quarterbacks. Their basic idea is to divide
statistical outputs (multiplied by the corresponding weights) by statistical inputs (again
multiplied by the corresponding weights) to obtain quarterback efficiency. The six
outputs were passing yards, rushing yards, total TDs, attempts per interception,
completions, and passing yards per game. The inputs were passing attempts and rushing
attempts. The weights were chosen in order to maximize each player’s efficiency, which
was bounded to be less than or equal to one (i.e. 100 percent). Their DEA analysis found
many players to be 100 percent efficient. The authors then conducted a cross-evaluation
of all players by assessing each player using every other player’s output and input
weights. Each player was rated based on their average score among these cross-
evaluations.
One advantage of DeOliverira and Callum’s approach is that it calculates the
category weights mathematically instead of choosing them arbitrarily. Another
advantage is that it allows one to compare and rank quarterbacks easily. Also, the rating
can be used to evaluate other football position players. A disadvantage of their approach
is the exclusion of sacks and fumbles. If sacks are occasionally the fault of the
quarterback, then a sack (which results in negative yards) should decrease the

8
quarterback rating more than an incompletion. Also, if lost fumbles are occasionally the
fault of the quarterback, then they should negatively impact the rating because they are
turnovers to the other team and therefore a worse result than an incomplete pass. Also,
the time constraint in football places a premium on scoring quickly when behind late in
the game. In this situation there is an important distinction between scoring on one long
play or several short plays, contrary to what the authors claim.
White and Berry used a tiered logistic regression to evaluate NFL quarterbacks.
Their research uses a per-play analysis rather than a game or seasonal analysis. This
makes their paper much more data intensive. They determined the value of each possible
play by estimating how a given play changed a team’s expected points. In their model
they used eventual points as a proxy for expected points. Eventual points (the dependent
variable) took the value of the next score and could equal 7, 3, 2, 0, -2, -3, or -7. The
independent variables in the model were Down (a dummy variable representing one of
the four possible downs), ToGo (a variable representing the distance from a first down),
and ToGoal (a variable representing the distance to the goal line). The authors used this
model to estimate the expected points from a given situation and by extension the
expected point values for all possible plays. They then ranked quarterbacks by their
average contributions to expected point values per play. The model is a tiered logistic
regression because the dependent variable can take on multiple categories and can be
modeled using tiers for each of the possible outcomes. The authors found that adding
sacks significantly impacts the relative quarterback rankings while adding quarterback
runs does not have a major impact.

9
One problem with the tiered logistic regression method is that it does not take into
account risk aversion on the part of coaches. For example, a completed ten yard pass
would have a larger gain in expected points than a run of just a few yards. However, a
team leading very late in the game would often rather call a running play because a pass
attempt would be considered an unnecessary risk. To the extent that maximizing the
probability of winning (the ultimate objective of all football coaches) differs from
maximizing expected points, the authors’ model is flawed. The authors partially address
this by excluding plays in the last two minutes of a half (although their reason for doing
so is to address the problem of ―prevent‖ defenses); however, excluding plays in the last
two minutes of a half seems inappropriate for a situation based ranking.
I think the authors made reasonable choices with regard to the independent
variables they chose. However, I believe they made a mistake by not including time as a
variable. Early in a half, the odds of there being zero eventual points are very low. For
example, the only way the first play of the half could have zero eventual points would be
if the half ended without any points being scored, which happens very infrequently.
Similarly, late in a half the odds of there being zero eventual points are relatively high.
The only way the last play of the half could have non-zero eventual points would be if a
scoring play occurred on the last play of the half, which happens infrequently. Adding a
variable which gave the time remaining in the half could adjust for this better than simply
excluding plays from the last two minutes of a half.
Another problem with the authors’ method is that the expected points for a given
game situation can vary across teams. For example, a team with good pass blocking
would have a higher expected points value on third and long plays than a team with a

10
mediocre pass blocking. A team with a good running back and offensive line would have
a higher expected points value on third and short plays than a team that could not run the
ball effectively. A team with a good kicker would have a higher expected points value
when possessing the ball in the opponent’s territory than a team with a bad kicker. To the
extent that factors outside of the quarterback’s control (like the strength of the running
back, offensive line, kicker, etc.) determine a team’s expected points value for a given
situation, the authors’ rating is flawed. In spite of the problems with the authors’ method,
I thought their paper was good because it gave a reasonable estimation of a quarterback’s
value.
Allan Ingraham used a three-stage least squares regression to estimate quarterback
production. His first equation used winning percentage as the dependent variable and
points scored and opponents’ points scored as the independent variables. The second
equation has points scored as the dependent variable and various football statistics (yards
per pass, yards per rush, turnovers, etc.) as the independent variables. The third equation
relates team statistics to opponents’ points scored. The idea behind this method is to
estimate how certain quarterback statistics affect points and opponents’ points scored,
and by extension estimate how these statistics affect winning percentage. The
quarterback ratings are thus derived from how each quarterback contributes to winning
percentage. In his paper Ingraham found that rushing yardage, rushing yards per attempt,
passing yardage, and passing yards per attempt all increase points scored per game.
However, rush yards per attempt was not statistically significant. Turnovers and
takeaways (opponent turnovers) were both statistically significant in the expected
directions, but the positive effect of a takeaway was superior to the negative effect of a
11
turnover. Finally, sacks were statistically significant while penalty yards, punt average,
and third down efficiency were not statistically significant.
An advantage of this model is that it allows one to measure the productive ability
of quarterbacks and other football position players. It also can be used to estimate the
value (in terms of contribution to winning percentage) of specific statistics like rush
yards, pass yards, and turnovers, just to name a few. Unfortunately, the dataset used only
includes 127 observations from the years 2001 through 2004. Adding more observations
would provide a more detailed analysis. Also, in this paper predicted net points per game
greatly exceed actual points per game. The author suggests this is due to the
quarterback’s contribution to field goals not being included in actual points per game.
Finally, Ingraham notes three of the top four rated quarterbacks for 2004 played in
domes. This suggests that domes and/or weather may be meaningful variables which are
not included in the model.
12
CHAPTER 3
METHODOLOGY AND MODEL DESIGN
In this paper I chose to take an econometric approach to evaluating quarterback
performance. My approach places great importance on aggregate statistics and does not
evaluate performances in specific situations (down, distance, etc.). My objective is to
derive a quarterback rating based on the statistics that best correlate with points per game.
I plan to rank quarterbacks based on their estimated contributions to points per game.
Like Ingraham, I used least squares to estimate how a given statistic affects points scored.
I used points per game as my dependent variable instead of points scored because I
believe points per game has a clearer interpretation and is more precise.3 I have
expanded on Ingraham’s idea by using 1,061 observations instead of just 127
observations. I used team offensive data from the years 1970 through 2006. My data
came from the 2007 ESPN Football Encyclopedia and were converted into an Excel
spreadsheet.
One might wonder why I used points per game as the dependent variable instead of
winning percentage, which is the variable that all football strategists are really trying to
maximize. There are many factors which affect winning percentage that are outside of
the quarterback’s control: strength of the defensive unit, strength of special teams units,
3 I realize that since points per game is always greater than or equal to zero, the distribution may be
skewed. This issue is addressed later on.

13
the coaches’ ability, and strength of schedule, just to name a few. Quarterbacks have
much more control over their teams’ points per game that they do over winning
percentage. Also, Ingraham and other researchers have demonstrated that points scored
(either for the season or per game) are very strongly correlated with winning percentage.
Also, the idea that points scored per game affects winning percentage is pretty intuitive—
although maximizing points scored per game may cause strategists to be risk-loving in
such a way as to diminish winning percentage. However, football coaches generally do
not recklessly risk losing purely for the sake of scoring more points, so this is probably a
relatively minor problem. Finally, using points per game as the dependent variable gives
the results a concise interpretation: each quarterback is rated based on his estimated
contribution to points per game.
There are many possible independent variables that could be chosen in this model.
The four that compose the quarterback rating are completion percentage, yards per pass
attempt, touchdown percentage, and interception percentage. I decided against including
touchdown percentage as an independent variable because it does not give useful results.
To say that the percentage of passes which result in touchdowns (i.e. points) affects
points scored per game is already obvious and thus not interesting. If this statement were
not true in the model there would a major problem with how the data were assembled
and/or how the model was designed. Perhaps a more questionable decision is to exclude
completion percentage. The reason for this is that completion percentage and yards per
attempt are very strongly correlated, as yards per attempt is equal to completion
percentage times yards per completion. Because yards per attempt incorporate both
passer accuracy and distance, it has more explanatory power than completion percentage

14
does. Therefore completion percentage is excluded to avoid multicollinearity. I am
assuming also that quarterbacks with high yards per attempt will be able to frequently
gain first downs (i.e. I am discounting the possibility that a quarterback could have a high
yards per attempt with a few ―long bombs‖ while gaining first downs infrequently.)
Yards per attempt are included for the reasons mentioned in the previous paragraph.
Interception percentage is included to penalize quarterbacks who frequently turn the ball
over to the other team. Rushing yards per game is included to reward quarterbacks with
running ability. The decision of whether or not to include sacks in the analysis was a
difficult one. Most, but probably not all, sacks are attributable to the offensive line
instead of the quarterback. Penalizing a quarterback for having a poor offensive line
seems unfair. On the other hand, yardage lost from sacks does affect points per game.
Ideally, we would want to know how many times the ―average‖ quarterback would get
sacked with a given offensive line and use that information to estimate the significance of
sacks in a quarterback rating. Unfortunately, such data is very difficult to find.
Therefore, sacks are excluded from this model to avoid any arbitrary assumptions over
what percentage of sacks is the fault of the quarterback and what percentage is the fault
of the offensive line. Takeaways per game are included in the model to incorporate the
importance of improved field position from interceptions and fumble recoveries. Finally,
fumbles lost per game is included in the model due to its statistical significance but not
included in the quarterback rating, as I assume that lost fumbles are generally the fault of
the offensive line for not blocking adequately. Also, there was little variation in
quarterbacks’ fumbles lost per game. These independent variables do not form an
exhaustive list of what statistics affect points per game, but they explain a lot of variation
15
in the dependent variable while avoiding the problem of multicollinearity. Next I will
provide a more thorough explanation of my independent variables.
Many critics of the quarterback rating believe that the yards per attempt statistic
should be given more weight. Yards per attempt is defined as gross passing yards
divided by pass attempts. The average yards per attempt from 1970 through 2006 was
about 6.84. There does not appear to be a time trend in the year-by-year data (see Table
1), although the NFL yearly averages for this statistic range from a low of 6.49 (in 1974
and 1977) to a high of 7.18 (in 1983). The team averages range from 9.49 (San
Francisco, 1989) to 4.88 (Seattle, 1992). It is expected that yards per attempt would have
a positive sign and be statistically significant.
Interception percentage is defined as interceptions thrown divided by passes
attempted, multiplied by 100. The average interception percentage from 1970 through
2006 was 4.03. Over the last few decades, interception percentage has shown a declining
trend from about five to three percent. This trend (along with improved completion
percentages) explains a great deal of the trend towards improved quarterback ratings in
recent years. The NFL yearly averages range from 5.8 percent (in 1971) to 3.1 percent
(six times, all since 1995). The team averages range from 9.45 (Green Bay 1971) to 1.11
(Kansas City 1990). It is expected that interception percentage would have a negative
sign and be statistically significant.
Despite the fact that it is not a quarterback statistic, takeaways per game are included
to incorporate the positive effect of improved field position from interceptions and
fumble recoveries. This variable is defined as interceptions plus fumble recoveries,
16
divided by games played. The average number of takeaways per game for each team
from 1970 through 2006 was 2.14, with a high of 3.94 and a low of 0.75. In the
regression takeaways per game should have a positive sign and be statistically significant.
Rushing yards per game is included to incorporate a quarterback’s running ability into
the rating. The average rushing yards per game per team over the dataset is about 121.7,
with a high of 220.6 (Buffalo 1973) and a low of 66.4 (San Diego 2000). I used rushing
yards per game instead of rushing yards per attempt in my analysis. The reason for this is
that most quarterbacks do not have a lot of rushing attempts. When quarterbacks do run,
the objective is usually to get a first down (―move the chains‖ in football speak) and then
avoid getting hurt. A higher priority is placed on quarterback safety than on getting a
huge running play, making the yards per attempt statistic less important. Including
rushing yards per game is designed to reward quarterbacks who consistently gain first
downs with their feet. It is expected that this statistic will have a positive coefficient and
be statistically significant.
Finally, fumbles lost per game is included in the model due to its statistical
significance. Because it is difficult to determine what proportion of lost fumbles are the
fault of the quarterback (as opposed to the offensive line), this statistic was not included
in my quarterback rating in order to avoid making arbitrary assumptions about this
question. Also, it is possible that whether or not a fumble is lost to the other team is
random, meaning that adding fumbles lost per game may unnecessarily add an element of
chance to the rating. It is expected that fumbles lost per game will have a negative
coefficient and be statistically significant.

17
CHAPTER 4
MODEL RESULTS
Table 2 gives my regression results. The dependent variable is points per game. All
independent variables have the expected signs and are significant at the one-percent level.
To compare the variables’ significance in terms of producing points, one needs to look at
the parameter estimates for each of the variables.
The parameter estimate for yards per attempt is 3.34. This means that an increase of
one yard per pass attempt increases points per game by 3.34. Over the course of a sixteen
game season this translates to about 53 more points. This might not seem like a
significant increase; however, when one takes into account that in 2007 twenty-two
percent of NFL games were decided by three points or less4, this is a meaningful statistic.
In 2007, out of the thirty-three quarterbacks who qualified to be rated, the highest yards-
per-attempt was 8.3 (Tom Brady) and the lowest was 5.5 (Brodie Croyle). This translates
to a difference of about nine and a half points per game. This difference is very
important when one considers that forty-seven percent of NFL games in 2007 were
decided by eight points or less.5
The parameter estimate for interception percentage is -0.82. This means that if
interception percentage increases by one percent, points per game decline by -0.82. This
4 “Parity Pairs with Drama in NFL Saga”, Jarrett Bell, USA Today 10-31-2008. Accessed 11-24-2008.
http://www.usatoday.com/printedition/sports/20081031/scover31.art.htm?loc=interstitialskip 5 Ibid.

18
statistic is useful for evaluating individual games, where interception percentages vary
widely. Over the course of a season, interception percentages among quarterbacks vary
less. In 2007 the best interception percentage among qualifying quarterbacks belonged to
David Garrard (0.92 percent), while the worst percentage belonged to Sage Rosenfels
(5.0 percent). This difference of 4.08 percent translates to a difference of about 3.3
points per game. This is a meaningful difference when one considers the proportion of
NFL games that are very close. However, the data suggest that interception percentage is
relatively less important than yards per attempt.
The parameter estimate for rushing yards per game is 0.04. This means that one
rushing yard per game is worth about 0.04 points per game, or that an increase of twenty-
five rushing yards per game translates to one point per game. In 2007, Vince Young led
qualifying NFL quarterbacks in rushing yards per game with 26.3, while Peyton Manning
was last in the same category with -0.32. This 26.62 yard difference translates to a
difference of about one point per game. The data thus imply that a quarterback’s ability
to rush for positive yards is relatively less important to points per game than a
quarterback’s yards per pass attempt and interception percentage.
Fumbles lost per game has a coefficient of -2.25. This means that an increase of one
lost fumble per game is worth about -2.25 points per game. The best performance in
2007 in this statistic was zero (by several players) and the worst performance was 0.19
fumbles per game (by two players). This difference translates to about four-tenths of a
point per game, which is relatively smaller than the corresponding differences for the
other quarterback statistics. This suggests that the variation in lost fumbles per game

19
among NFL quarterbacks is not wide enough to create meaningful disparities in scoring
averages.
Finally, the coefficient for takeaways per game is 1.75. This means that an increase
of one takeaway per game translates to an increase of about 1.75 points per game. This
statistic is more useful for evaluating individual game performances than season
performances. Still, the difference between the best team performance in this category in
2006 (2.75 takeaways per game) and the worst performance (0.75 takeaways per game)
translates to a difference of about three and a half points per game, which is very
meaningful in a close contest.

20
CHAPTER FIVE
COMPARISIONS WITH MODERN QUARTERBACK RATING
Table 3 compares the 2008 rankings of NFL quarterbacks under the modern
quarterback rating system and the points per game system used in the model. The left
column lists the quarterbacks. The middle column gives the official quarterback ratings
for each player, followed by the rank. The right column gives the points per game rating
for each quarterback, followed by the rank. The points per game rating is the
quarterback’s contribution to points per game and equals 3.34* (Yards per Pass Attempt)-
0.82*(Interception Percentage) +0.04*(Rush Yards per Game). Takeaways per game are
excluded because it is not a quarterback specific statistic. Fumbles lost per game are
excluded because some unknown proportion of lost fumbles is not the quarterback’s
fault. A plus sign indicates where the points-per-game ranking for a quarterback is five
or more slots above his quarterback rating rank. A minus sign indicates where the points
per game ranking for a quarterback is five or more slots below his quarterback rating
rank. Nine of the thirty three quarterbacks who qualified for the NFL rating had plus or
minus signs with their ranking, which suggests some correlation between the NFL rating
and the points per game rating. The advantage of a points based rating is that it has a
meaningful output (the quarterback’s estimated contribution to his team’s points per
game), whereas the NFL rating is not directly associated with any kind of team or
21
individual output. The points rating also provides a rough estimate of the value added
(i.e. increase in points per game) when one quarterback replaces another.
An interesting question to ask is whether the relative historical rankings of
quarterbacks differ under the two rating systems. As mentioned previously, the NFL’s
quarterback rating has a time bias, with fourteen of the top seventeen all time ratings
coming from active players.6 This time bias is caused by the inclusion of completion
percentage and interception percentage as elements of the rating (see Table 1). Because
the points-per-game rating excludes completion percentage, it is expected that it should
have less of a time bias. Table 1 demonstrates that there is a statistically significant time
bias with the points-per-game rating (due to interception percentage being included), but
it is less than the time bias with the official quarterback rating. The coefficient for the
independent variable Year is about eight times bigger for the official quarterback rating
than the points per game rating. If we assume that one point per game is roughly
equivalent to four quarterback rating units (see Table 3), then it is reasonable to estimate
that the points-per-game rating has about half of the time bias of the official quarterback
rating.
Table 4 appears to confirm the idea that the points-per-game rating has less of a time
bias. The table shows the top twenty quarterbacks of all time under both rating systems
and only includes quarterbacks with at least 1,500 pass attempts. Fifteen of the top
twenty quarterbacks under the NFL rating played in 2008, while only ten of the top
twenty in the points-per-game rating played in 2008. Of the six quarterbacks who are
6 http://www.profootballhof.com/history/story.jsp?story_id=2664 Accessed 11-12-2008. Ratings are
from the start of the 2008 season.

22
only in the top twenty of the NFL rating, five played in 2008 and the other (Rich Gannon)
last played in 2004. Of the six quarterbacks who are only in the top twenty of the points-
per-game rating, none played after 1990 and only two (Fouts and Lomax) played after
1980. This information suggests that the points-per-game rating has less of a time bias
than the NFL rating.
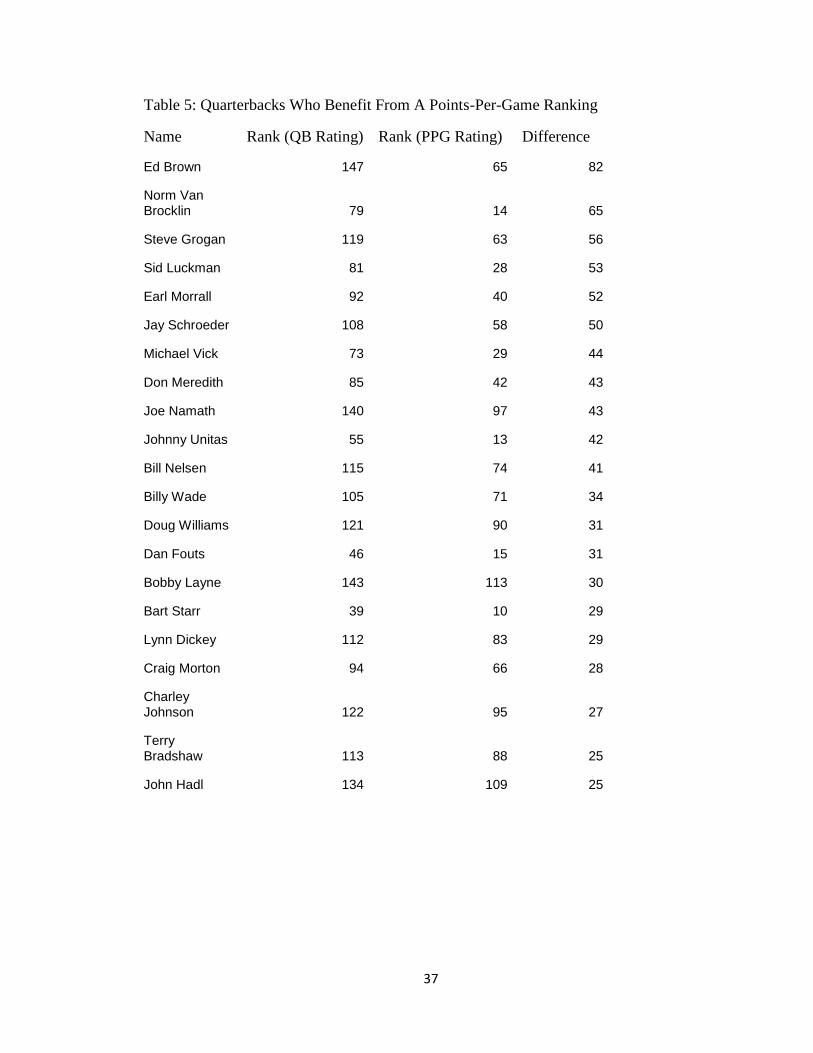
My historical list of quarterbacks includes 158 players. Generally, I included a
quarterback if he was in the top one hundred all time in a major statistical category or if
he had played within the last ten years. Table 5 provides a list of the quarterbacks whose
points-per-game ranking was at least twenty-five slots higher than their relative
quarterback ranking. Two notable characteristics of most of these twenty-one
quarterbacks are a high yards-per-attempt (average of 7.46) and a high interception
percentage (average of 5.29). The averages for all 158 quarterbacks I’ve included are
6.99 yards per attempt and an interception percentage of 4.19. All except Michael Vick
have been out of the NFL for at least ten years. Vick, who jumped from 73rd
overall in
the quarterback rating to 29th
overall in the points-per-game rating, is helped by having a
career average of 52.1 rushing yards per game. This average is approximately seventy-
percent higher than the second place finisher in this category (Randall Cunningham, 30.6
rushing yards per game).
Table 6 provides a list of the quarterbacks whose points-per-game ranking was at
least twenty-five slots lower than their relative quarterback rating. Two notable
characteristics of most of these sixteen quarterbacks are a low yards-per-attempt (average
of 6.56) and a low interception percentage (average of 3.19). Nine of the sixteen were on
an NFL roster in 2008. When Michael Vick’s rushing average is excluded, there is little

23
difference between the Table 5 and Table 6 quarterbacks in this statistic, with the former
group averaging 6.02 rushing yards per game and the latter group averaging 5.44 in the
same category. The information in Tables 5 and 6 suggest that yards-per-attempt is an
undervalued statistic in the NFL quarterback rating while interception percentage is an
overvalued statistic. Also, it appears that only truly exceptional running quarterbacks
gain enough rushing yards to significantly impact their relative points-per-game rating.
Another way to compare the NFL quarterback rating and the points-per-game rating
is to measure which of the two correlates better with winning percentage. To do this, I
used the same 1,061 observations used in Table 2. Unfortunately, this dataset only
contains team rushing yards per game (not quarterback rushing yards per game). Thus
the rushing yards component of my formula must be excluded from the comparison to
avoid inflating the points-per-game rating’s significance by including non-quarterback
statistics. In my comparison I use winning percentage as the dependent variable,
quarterback rating or points-per-game rating as a measure of offensive efficiency, and
points allowed per game as a proxy for defensive efficiency. Ties count as half of a win
and half of a loss. Table 7 shows the results of the two regressions. Despite only
including two independent variables, both equations explain about seventy percent of the
variation in winning percentage. Based on the results in Table 7, it is reasonable to
assume that the two ratings explain winning percentage equally well. The advantages of
the points-per-game rating are that it is easier to calculate and does not have bounded
values.

24
CHAPTER 6
THE ―COSTS‖ OF EACH RATING SYSTEM
Another way to compare the two ratings is to estimate which is ―cheaper‖ to acquire.
Many quarterback contracts contain financial incentives for achieving a given
quarterback rating, so one would expect there to be a statistically significant relationship
between salaries and the rating. Since there is some correlation between the points per
game rating and quarterback rating, one would also expect the points per game rating to
positively correlate with salary even without any corresponding incentives. Other
variables that affect quarterback salaries are experience (with older quarterbacks expected
to earn more on average), number of Pro Bowl appearances, and time (because the salary
cap increases most years, we would expect quarterback salaries to increase from year to
year regardless of performance). The idea behind this kind of analysis is to see if the
market (i.e. the 32 NFL teams) is undervaluing the points per game rating.
One problematic aspect of this kind of analysis is that there are multiple ways to
measure how much a quarterback is paid. NFL quarterbacks have base salaries, signing
bonuses, bonuses for performance, and bonuses for appearing at off season workouts.
Each quarterback also has a cap value, which usually differs from the total salary. Teams
frequently manipulate contracts to gain an advantage in the salary cap, which means that
the payout of contracts may be front-loaded or back-loaded without regard to player
performance. In my regression I used the quarterback’s cap value to measure how much

25
he was paid. The cap value may not be the most important measurement from an
economic standpoint, but it is the most important measurement from a competitive
standpoint because it determines how much ―cap room‖ is remaining for other players on
the roster. If a team overpays for a quarterback, less cap room remains for signing other
players and team competitiveness suffers. A quarterback who is overpaid from a salary
standpoint but is correctly paid in terms of cap value creates less damage for his team’s
salary cap situation and overall competitiveness.
My dataset for this analysis is the USA Today Salaries Database, which is available
online at the USA Today website.7 The database can be used to find quarterback salaries
back to 2000. My dataset includes 183 observations from 55 quarterbacks over the last
nine years (2000 through 2008). I only included observations in which the quarterback
had qualified for the NFL rating the previous year (minimum of 14 pass attempts per
game, or 224 pass attempts per season). The reason for restricting the data this way is to
avoid making any incorrect assumptions about what the quarterback’s passer rating
would have been if he had played a full season.
My dependent variable is the quarterback’s cap value, which is defined as the player’s
signing bonus plus salary and other bonuses for the season. The average quarterback’s
cap value is about 4.9 million dollars, with a range of 328 thousand to 18.7 million
dollars. My independent variables are experience, pro bowl, quarterback rating (or
points-per-game rating) and time. Experience is the number of years the player has been
in the league (including the given season), with a rookie’s experience being equal to one
(although the way the regression is set up, no rookies appear in the dataset). Pro Bowl is
7 http://content.usatoday.com/sports/football/nfl/salaries/default.aspx, last accessed on 4-7-2009.

26
a binary variable which equals one if the player made the Pro Bowl the previous season
and equals zero otherwise. Quarterback rating is defined as the NFL quarterback rating
from the previous season. Likewise, points-per-game rating is defined as the points-per-
game rating from the previous season. I am implicitly assuming that teams make their
expectations of future performance from the previous season’s performance. Finally,
time is included as a variable to account for yearly increases in the salary cap (with the
year 2000 being one, 2001 being two, etc.).
Tables 8 and 9 show the cap value regression results. All variables have the expected
positive signs. Every variable except the points-per-game rating is significant at the one
percent level, with that rating being significant at the five percent level. Table 8 shows
that one year of experience can be offset by improving the quarterback rating by just 2.7
units, making experience a relatively unimportant variable. Likewise, one year of time
(i.e. a typical salary cap increase) can be offset by improving the quarterback rating by
just 3.8 units, making time a relatively unimportant variable. However, the Pro Bowl
variable is very important as it takes about 20.9 quarterback rating units to offset a Pro
Bowl selection. For the points-per-game rating in Table 9, it takes about 1.1 points per
game to offset one year of experience and about 1.6 points per game to offset one year of
time. Also, it takes about 10.3 points per game to offset a Pro Bowl selection. This
information suggests that the experience and time variables can easily be negated by
improved performance, but a Pro Bowl quarterback will make a high salary even if he has
a low passer efficiency rating (which is unlikely). In addition, the low r-squared for
Tables 8 and 9 suggests that salary cap manipulations probably explain most of the
variation in a quarterback’s cap value.

27
Both the quarterback and points-per-game ratings appear to be accurate forecasters of
salary, but which is cheaper? Because the ratings are derived differently, simply
comparing the parameter estimates can’t tell us which measure of performance is cheaper
to acquire. For the 2008 season, the average ratio of quarterback rating to points-per-
game rating was about 3.94 (for qualifying quarterbacks). For the 2007 and 2006
seasons, this ratio was 3.98 and 3.90 respectively. Based on this information, I believe it
is reasonable to assume that one point-per-game is roughly equivalent to four quarterback
rating units. If that is the case, then an additional point-per-game ―costs‖ about $225,000
and the equivalent quarterback rating improvement costs about $346,000 (about fifty
percent more expensive). This suggests that the points-per-game rating is greatly
undervalued by NFL teams even though it correlates with winning percentage about as
well as the official quarterback rating does.

28
CHAPTER 7
OTHER APPROACHES TO ESTIMATING QUARTERBACK EFFICIENCY
A potential problem with the points-per-game rating is that if the independent
variables have particularly extreme values, estimated points per game could be zero or
negative. For example, a team with 3 yards per pass attempt, an interception percentage
of 15, zero takeaways per game, twenty rushing yards per game, and one lost fumble per
game would ―average‖ negative 3.7 points per game. This is obviously not realistic.
Also, given that the data set uses season data, averaging zero points per game is not
realistic. To see if the bias inherent in using points-per-game as the dependent variable
affects the results, one can compare the results with a new regression using the natural
log of points-per-game as the dependent variable. Using the natural log forces points per
game to be positive, thus removing this bias in the dependent variable.
Table 10 is a replication of Table 2 using the natural log of points-per-game as the
dependent variable. Although the parameter estimates are different, the significance
levels of the independent variables do not change significantly. Also, the explanatory
power of the overall regression does not change significantly. This suggests that the
directional bias in Table 2 is not very meaningful. The practical reason for this is that
over the course of a season, teams will not do so poorly statistically that they would be
projected to average zero or negative points per game.
29
Another way to derive a quarterback rating is to use individual game data instead of
aggregate season data. I did this by using game results from the 2008 NFL regular
season. The data set consists of 256 games, which results in 512 lines of data (one line
for each team). I omitted one game which ended in a tie. The most important
difference between the game and season data is that the game data shows more variation.
Yards per pass attempt ranges from a low of 1.4 to a high of 14.5. Interception
percentage ranges from a low of zero to a high of 18.2. Finally, rushing yards per game
varies from a low of 14 to a high of 332. Another difference is that the greater likelihood
of extremely poor offensive statistics increases the chance of the dependent variable
(points) having a significant directional bias.
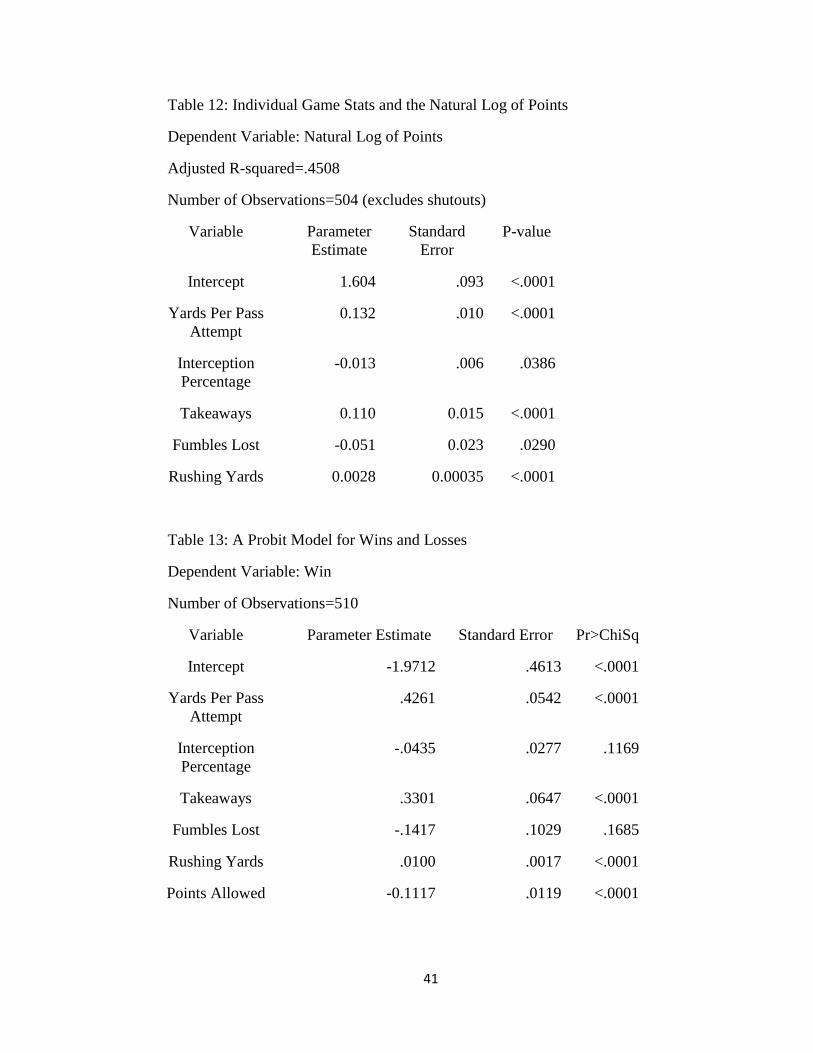
Tables 11 and 12 give the regression results from using individual game data from the
2008 season. Table 11 has points as the dependent variable, while Table 12 has the
natural log of points as the dependent variable. The independent variables are the same
ones used in Table 2. From looking at Table 11, we see that interception percentage is
not quite significant at the five percent level while fumbles lost is significant at the five
percent level. The other three variables are significant at the one percent level. When
comparing the results with those in Table 2, it appears that yards per pass attempt and
interception percentage become less important in the rating while rushing yards become
more important. Table 12 shows that changing the dependent variable to the natural log
of points does not change the results much, although interception percentage becomes
significant at the five percent level. The regressions using individual game data have less
explanatory power than the seasonal data regression in Table 2. This suggests that a

30
situational data approach (as White and Berry used) may be more appropriate to use in
the case of individual games.
Another way to evaluate quarterbacks is to estimate how their performances affect the
probability of winning. A probit model is one way to estimate this. If we make the
dependent variable a binary categorical variable (1 for a win, 0 for a loss), we can
estimate how changes in a given statistic impact a team’s probability of winning. Table
13 shows how certain statistics impact the probability of winning. In addition to the
statistics used previously, a variable for points allowed is included as a proxy for
defensive performance. The results in Table 13 are not as robust as the previous
regressions were, with interception percentage and fumbles lost being statistically
insignificant. It is possible that the results could be made stronger with more
observations. However, whether a team wins a particular game depends on more than
aggregate statistics. When a particular play is made (or not made) has a meaningful
impact on the game’s outcome. Also, it is likely that the probability of winning does not
change linearly with statistical changes. For example, improving from three to four yards
per pass attempt likely would not impact the probability of winning much (as the latter
statistic is still very mediocre), but improving from seven to eight yards per pass attempt
could greatly increase the odds of winning. For these reasons, aggregate statistics should
probably not be used to calculate a probit model of the probability of winning. A
situational analysis involving variables such as the current score, the time, the down, the
distance to a first down, and the distance to a touchdown would probably be a better
approach.

31
CHAPTER 8
CONCLUSIONS
Teams, commentators, and fans have used the NFL quarterback rating to evaluate
quarterbacks for several years. Even though the quarterback rating is commonly used,
there are many problems with it. The rating overvalues completion percentage,
rewarding quarterbacks who attempt short, easy passes. The rating also overvalues
interception percentage relative to yards per pass attempt. This results in most of the
modern quarterbacks having ratings that would be considered outstanding three or four
decades ago. Many hall of fame quarterbacks from the sixties and seventies had
quarterback ratings that would be considered mediocre today. Also, the official
quarterback rating has no units associated with it, which makes it difficult to quantify
how valuable a given change in the rating is.
Linear programming, logistic regression, and ordinary least squares regression
models can be used to estimate a quarterback’s value. I used ordinary least squares
because it can be conveniently used to calculate a quarterback’s value using aggregate
statistics. DeOliveira and Callum’s linear programming method requires the researcher
to use every quarterback’s statistics to calculate one quarterback’s rating. White and
Berry’s tiered logistic model requires the researcher to know the given situation (down,
yards to a first down, and yards to the goal line) for every play involving a quarterback
running or passing before a rating can be calculated. I used season data to derive my

32
points-per-game rating. Individual game data could have been used instead, but the
increased randomness of individual games makes the results less robust. The
advantages of my points-per-game rating are that it has measurable output units, has less
of a time bias, is relatively simple, and is undervalued by the market of NFL teams. The
points-per-game rating also correlates with winning percentage just as well as the
official quarterback rating does. Because NFL quarterbacks have arguably the highest
profile position in professional sports, it is surprising that there hasn’t been more
scrutiny of how their performances are measured. I hope there will be more academic
papers addressing this issue in the future.

33
Table 1: Time Trends in Certain NFL Statistics
Number of Observations= 37
Dependent Variable Relationship P-value Adj. R-squared
Completion Percentage -403.51+.231Year <.0001 .853
Interception Percentage 154.32-.076Year <.0001 .867
Yards Per Attempt 3.47+.002Year .5451 -.018
Quarterback Rating -890.27+.485Year <.0001 .819
PointsPerGame Rating -114.96+.068Year <.0001 .486
Table 2: Variables that Impact Points per Game
Adjusted R squared = .672
Number of Observations: 1,061
Variable Parameter Estimate Standard Error P-value
Intercept -5.30 0.82 <.0001
Yards Per Pass
Attempt
3.34 0.11 <.0001
Interception
Percentage
-0.82 0.06 <.0001
Takeaways Per Game 1.75 0.16 <.0001
Rush Yards Per Game 0.04 0.003 <.0001
Fumbles Lost Per
Game
-2.25 0.27 <.0001

34
Table 3: NFL Quarterback Rating versus a Points-per-Game Rating (for 2008)
Average Ratio of QB Rating to Points-Per-Game Rating=3.94
Player NFL QB Rating Points-per-Game Rating
P. Rivers 105.5 (1) 26.3466 (1)
C. Pennington 97.4 (2) 24.543 (4)
K. Warner 96.9 (3) 23.6932 (8) (-)
D. Brees 96.2 (4) 24.4368 (5)
P. Manning 95 (5) 22.3298 (13) (-)
A. Rodgers 93.8 (6) 23.6998 (7)
M. Schaub 92.7 (7) 24.8686 (2) (+)
T. Romo 91.4 (8) 23.1684 (10)
J. Garcia 90.2 (9) 23.2626 (9)
M. Cassel 89.4 (10) 22.8676 (11)
M. Ryan 87.7 (11) 24.6962 (3) (+)
S. Hill 87.5 (12) 21.9292 (15)
S. Wallace 87 (13) 20.4702 (23) (-)
D. McNabb 86.4 (14) 21.722 (16)
E. Manning 86.4 (15) 20.8816 (21) (-)
J. Cutler 86 (16) 22.671 (12)
T. Edwards 85.4 (17) 22.2352 (14)
J. Delhomme 84.7 (18) 24.194 (6) (+)
J. Campbell 84.3 (19) 21.0706 (20)
D. Garrard 81.7 (20) 21.449 (17)
B. Favre 81 (21) 18.8746 (28) (-)
J. Flacco 80.3 (22) 21.3336 (18)
K. Collins 80.2 (23) 20.2714 (24)
Continued

35
Table 3 Continued
B. Roethlisberger 80.1 (24) 21.142 (19) (+)
K. Orton 79.6 (25) 19.3414 (27)
J. Russell 77.1 (26) 20.512 (22)
T. Thigpen 76 (27) 19.4662 (26)
G. Frerotte 73.7 (28) 19.8734 (25)
D. Orlovsky 72.6 (29) 18.7496 (29)
M. Bulger 71.4 (30) 18.2904 (30)
R. Fitzpatrick 70 (31) 15.1236 (32)
D. Anderson 66.5 (32) 16.9954 (31)

36
Table 4: Top 20 Quarterbacks All-Time, Minimum 1,500 Attempts (Bold=Active)
Source: http://www.pro-football-reference.com/leaders/pass_rating_career.htm
Name QB Rating Name PPG Rating
1. Steve Young 96.8 1. Steve Young 25.5416
2. Peyton Manning 94.7 2. Otto Graham 24.8894
3. Kurt Warner 93.8 3. Kurt Warner 24.3296
4. Tom Brady 92.9 4. Daunte Culpepper 23.8424
5. Joe Montana 92.3 5. Ben Roethlisberger 23.628
6. Chad Pennington 90.6 6. Peyton Manning 23.477
7. Drew Brees 89.4 7. Joe Montana 23.3492
8. Ben Roethlisberger 89.4 8. Roger Staubach 23.2922
9. Daunte Culpepper 89 9. Trent Green 23.2204
10. Carson Palmer 88.9 10. Bart Starr 22.8954
11. Jeff Garcia 87.5 11. Tom Brady 22.4426
12. Otto Graham 86.6 12. Chad Pennington 22.3406
13. Dan Marino 86.4 13. Johnny Unitas 22.2528
14. Trent Green 86 14. Norm Van Brocklin 22.2234
15. Donovan McNabb 85.9 15. Dan Fouts 22.2128
16. Marc Bulger 85.6 16. Neil Lomax 22.1378
17. Brett Favre 85.4 17. Jake Delhomme 22.0812
18. Jake Delhomme 85.1 18. Marc Bulger 22.0664
19. Rich Gannon 84.7 19. Dan Marino 22.0552
20. Matt Hasselbeck 84.5 20. Jeff Garcia 22.0518
37
Table 5: Quarterbacks Who Benefit From A Points-Per-Game Ranking
Name Rank (QB Rating) Rank (PPG Rating) Difference
Ed Brown 147 65 82
Norm Van Brocklin 79 14 65
Steve Grogan 119 63 56
Sid Luckman 81 28 53
Earl Morrall 92 40 52
Jay Schroeder 108 58 50
Michael Vick 73 29 44
Don Meredith 85 42 43
Joe Namath 140 97 43
Johnny Unitas 55 13 42
Bill Nelsen 115 74 41
Billy Wade 105 71 34
Doug Williams 121 90 31
Dan Fouts 46 15 31
Bobby Layne 143 113 30
Bart Starr 39 10 29
Lynn Dickey 112 83 29
Craig Morton 94 66 28
Charley Johnson 122 95 27
Terry Bradshaw 113 88 25
John Hadl 134 109 25

38
Table 6: Quarterbacks Who Benefit From the NFL Quarterback Rating
Name Rank (QB Rating) Rank (PPG Rating) Difference
Eli Manning 71 128 -57
Steve Bono 78 134 -56
Brad Johnson 29 82 -53
Tim Couch 80 129 -49
Brian Griese 26 72 -46
Jon Kitna 68 110 -42
Brett Favre 17 55 -38
Kyle Orton 111 149 -38
Erik Kramer 69 105 -36
Joey Harrington 120 153 -33
Byron Leftwich 45 76 -31
Elvis Grbac 49 80 -31
Neil O'Donnell 32 62 -30
David Carr 83 112 -29
Drew Bledsoe 65 94 -29
Bobby Herbert 58 86 -28
Table 7: Correlation with Winning Percentage
Number of Observations=1,061 (for both)
All p-values <.0001 for both
Dependent Variable Relationship Adjusted R-squared Mean squared error
Winning Percentage .642+.007QBRat-
.031OppPtsPerGame
.6955 .10634
Winning Percentage .554+.029PPGRat-
.031OppPtsPerGame
.6984 .10583

39
Table 8: Cap Value and the Quarterback Rating
Adjusted R-squared=.3212
Number of Observations=183
Variable Parameter Estimate Standard Error P-value
Intercept -6,239,498 1,909,319 .0013
Exper 230,533 63,797 .0004
ProBowl 1,806,134 602,913 .0031
QBRat 86,570 23,727 .0003
Time 331,901 89,955 .0003
Table 9: Cap Value and the Points-Per-Game Rating
Adjusted R-squared=.2953
Number of Observations=183
Variable Parameter Estimate Standard Error P-value
Intercept -4,218,561 1,921,096 .0294
Experience 257,313 64,161 <.0001
ProBowl 2,321,811 584,939 .0001
PPGRat 224,516 89,650 .0132
Time 350,643 91,815 .0002

40
Table 10: Offensive Statistics and the Natural Log of Points-Per-Game
Adjusted R-squared =.6631
Number of Observations=1,061
Variable Parameter
Estimate
Standard Error P-value
Intercept 1.706 .043 <.0001
Yards Per Pass Attempt .168 .006 <.0001
Interception Percentage -.044 .003 <.0001
Takeaways Per Game .089 .008 <.0001
Rush Yards Per Game .002 .0002 <.0001
Fumbles Lost Per Game -.115 .014 <.0001
Table 11: A Points-Based Quarterback Rating Using Individual Game Data
Dependent Variable: Points
Adjusted R-squared=.5260
Number of Observations=510
Variable Parameter Estimate Standard Error P-value
Intercept -5.15 1.57 .0011
Yards Per Pass
Attempt
2.61 0.18 <.0001
Interception
Percentage
-0.21 0.11 .0509
Takeaways 2.34 0.25 <.0001
Fumbles Lost -0.89 0.40 .0271
Rushing Yards 0.05 0.01 <.0001
41
Table 12: Individual Game Stats and the Natural Log of Points
Dependent Variable: Natural Log of Points
Adjusted R-squared=.4508
Number of Observations=504 (excludes shutouts)
Variable Parameter
Estimate
Standard
Error
P-value
Intercept 1.604 .093 <.0001
Yards Per Pass
Attempt
0.132 .010 <.0001
Interception
Percentage
-0.013 .006 .0386
Takeaways 0.110 0.015 <.0001
Fumbles Lost -0.051 0.023 .0290
Rushing Yards 0.0028 0.00035 <.0001
Table 13: A Probit Model for Wins and Losses
Dependent Variable: Win
Number of Observations=510
Variable Parameter Estimate Standard Error Pr>ChiSq
Intercept -1.9712 .4613 <.0001
Yards Per Pass
Attempt
.4261 .0542 <.0001
Interception
Percentage
-.0435 .0277 .1169
Takeaways .3301 .0647 <.0001
Fumbles Lost -.1417 .1029 .1685
Rushing Yards .0100 .0017 <.0001
Points Allowed -0.1117 .0119 <.0001

42
Bibliography:
DeOliveira, Erickson H. and Callum, Robert. ―Who’s the Best? Data Envelopment
Analysis and Ranking Players in the National Football League,‖ in Economics,
Management, and Optimization in Sports. Edited by Butenko et al. Publisher: Springer-
Verlag, Berlin, Germany, 2004.
The ESPN Pro Football Encyclopedia, 2007. Second Edition. Edited by Palmer et al.
Ingraham, Allan T. ―A Methodology for Evaluating Production in Football: An Armchair
Quarterback’s Rating System.‖ Working Paper, 2005.
―Parity Pairs with Drama in NFL Saga‖, Jarrett Bell, USA Today 10-31-2008.
http://www.usatoday.com/printedition/sports/20081031/scover31.art.htm?loc=interstitials
kip
http://www.profootballhof.com/history/story.jsp?story_id=2664 Accessed 11-12-2008.
Ratings are from the start of the 2008 season. Data from Elias Sports Bureau.
USA Today Salaries Database. Accessed April 2009.
http://content.usatoday.com/sports/football/nfl/salaries/default.aspx
White, Chris and Berry, Scott. ―Tiered Polychotomous Regression: Ranking NFL
Quarterbacks.‖ The American Statistician, February 2002, Vol. 56, No. 1, pg. 10-21.
Related Documents