Grab some coffee and enjoy the pre-show banter before the top of the hour!

A Plethora of Options -- The New World of Data Visualization
Aug 20, 2015
Welcome message from author
This document is posted to help you gain knowledge. Please leave a comment to let me know what you think about it! Share it to your friends and learn new things together.
Transcript

Grab some coffee and enjoy the pre-show banter before the top of the hour!

The Briefing Room
A Plethora of Options – The New World of Data Visualization


Twitter Tag: #briefr
The Briefing Room
! Reveal the essential characteristics of enterprise software, good and bad
! Provide a forum for detailed analysis of today’s innovative technologies
! Give vendors a chance to explain their product to savvy analysts
! Allow audience members to pose serious questions... and get answers!
Mission

Twitter Tag: #briefr
The Briefing Room
Topics
This month: DATA DISCOVERY & VISUALIZATION
December: INNOVATORS
2014 Editorial Calendar at www.insideanalysis.com/webcasts/the-briefing-room

Twitter Tag: #briefr
The Briefing Room
Data Discovery & Visualization
! Today’s business challenges call for dynamic, interactive and multi-dimensional visualizations
! Different types of analysis require different types of visualization tools and techniques
! Not all people consume and digest data in the same way; hence, data visualization and discovery products need to cater for diversity

Twitter Tag: #briefr
The Briefing Room
Analyst: John O’Brien
John O’Brien is Founder and CEO of
Radiant Advisors

Twitter Tag: #briefr
The Briefing Room
Actuate
! Actuate is a software company whose suite of products include solutions for business intelligence, information applications, operational and analytic dashboards, data mining and predictive analytics
! Actuate is the founder of the Eclipse BIRT open source project, a development environment for data visualizations
! Visualizations developed and deployed using BIRT can be shared and embedded

Twitter Tag: #briefr
The Briefing Room
Guest: Jason Goodyear
Jason Goodyear has over 15 years of experience in data delivery applications. He has been with Actuate for over 5 years in a technical sales position. Prior to joining Actuate, Jason was involved in the delivery of data applications in a variety of roles including: senior programmer, technical project lead, application architect, project manager and business analyst.

10 Actuate Corporation © 2012
10 Tips for Jaw-‐Dropping Visualiza6ons
Jason Goodyear Solu/ons Engineer

11 Actuate Corpora/on © 2012
Agenda
• Visualiza.ons must augment the message, not overshadow it 1. Highlight one or mul/ple aAributes 2. Summarize very high volume of data
• Visualiza.ons for performance monitoring 1. Set up goals and targets 2. Go beyond gauges and traffic lights
• Visualiza.ons can enable ac.onable intelligence 1. Discover hidden nuggets of informa/on 2. Think forward
• Embedding visualiza.ons everywhere

12 Actuate Corpora/on © 2012
Agenda
• Visualiza.ons must augment the message, not overshadow it 1. Highlight one or mul/ple aAributes 2. Summarize very high volume of data
• Visualiza.ons for performance monitoring 1. Set up goals and targets 2. Go beyond gauges and traffic lights
• Visualiza.ons can enable ac.onable intelligence 1. Discover hidden nuggets of informa/on 2. Think forward
• Embedding visualiza.ons everywhere

13 Actuate Corpora/on © 2012
Geospa.al

14 Actuate Corpora/on © 2012
Geospa.al

15 Actuate Corpora/on © 2012
Interac.on

16 Actuate Corpora/on © 2012
Icon

17 Actuate Corpora/on © 2012
Rich

18 Actuate Corpora/on © 2012
Repe..on

19 Actuate Corpora/on © 2012
Drill

20 Actuate Corpora/on © 2012
Agenda
• Visualiza.ons must augment the message, not overshadow it 1. Highlight one or mul/ple aAributes 2. Summarize very high volume of data
• Visualiza.ons for performance monitoring 1. Set up goals and targets 2. Go beyond gauges and traffic lights
• Visualiza.ons can enable ac.onable intelligence 1. Discover hidden nuggets of informa/on 2. Think forward
• Embedding visualiza.ons everywhere

21 Actuate Corpora/on © 2012
Performance

22 Actuate Corpora/on © 2012
Briefing Book

23 Actuate Corpora/on © 2012
Agenda
• Visualiza.ons must augment the message, not overshadow it 1. Highlight one or mul/ple aAributes 2. Summarize very high volume of data
• Visualiza.ons for performance monitoring 1. Set up goals and targets 2. Go beyond gauges and traffic lights
• Visualiza.ons can enable ac.onable intelligence 1. Discover hidden nuggets of informa/on 2. Think forward
• Embedding visualiza.ons everywhere
24 Actuate Corpora/on © 2012
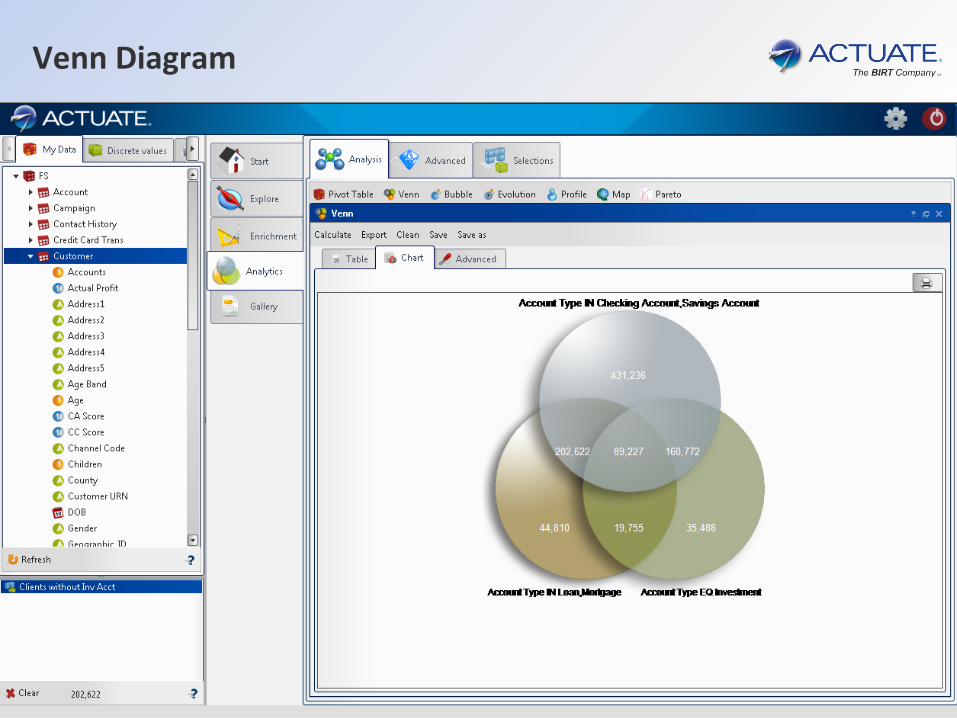
Venn Diagram

25 Actuate Corpora/on © 2012
Profile

26 Actuate Corpora/on © 2012
Agenda
• Visualiza.ons must augment the message, not overshadow it 1. Highlight one or mul/ple aAributes 2. Summarize very high volume of data
• Visualiza.ons for performance monitoring 1. Set up goals and targets 2. Go beyond gauges and traffic lights
• Visualiza.ons can enable ac.onable intelligence 1. Discover hidden nuggets of informa/on 2. Think forward
• Embedding visualiza.ons everywhere

27 Actuate Corpora/on © 2012
Embedding Visualiza.ons

28 Actuate Corpora/on © 2012
Embedding Visualiza.ons

29 Actuate Corpora/on © 2012
Embedded Visualiza.on

30 Actuate Corpora/on © 2012
Ques.ons & Answers

31 Actuate Corporation © 2012
Jason Goodyear– [email protected] www.actuate.com
Thanks for your aDen6on

Twitter Tag: #briefr
The Briefing Room
Perceptions & Questions
Analyst: John O’Brien

© Copyright 2013 Radiant Advisors. All Rights Reserved v1.10.000
WHO ARE YOU IN DATA VISUALIZATION?
33
Inside Analysis – Actuate Data Visualization November 05, 2013
John O’Brien | Principal Analyst and CEO, Radiant Advisors
@obrienjw @radiantadvisors

© Copyright 2013 Radiant Advisors. All Rights Reserved v1.10.000
34
• Common wisdom is wrong
…except when it’s right
• When price drops, jump
• If prices high, hold off
• The day you fly matters
• So does the day you buy
• Markups vary by destination
• Stay an extra day Flight Patterns" shows 141,000 aircraft paths over a 24-hour period. Image: Aaron KoblinRead
Who are you in Data Visualization? FARECAST STORY
http://www.wired.com/science/discoveries/magazine/16-07/pb_airfares##ixzz11h85mCO2

© Copyright 2013 Radiant Advisors. All Rights Reserved v1.10.000
35
Farecast, part of Microsoft’s Bing search engine
Advises to buy or wait for airfare prices to lower
Examines 225 billion flight and price records
Who are you in Data Visualization? VISUALIZATION IS PART OF THE PRODUCT

© Copyright 2013 Radiant Advisors. All Rights Reserved v1.10.000
Visual Types:
1. Technician
2. Analyzer
3. Artist
4. Outsider
5. The Light Bulb
36
Remember when… must be 1980s !
Who are you in Data Visualization? 5 TYPES OF VISUALIZATION PEOPLE

© Copyright 2013 Radiant Advisors. All Rights Reserved v1.10.000
Personality of a Technician:
• All about implementation
• Strong programming background
• Has worked with large databases
• Aesthetics not as important as working
• Visualization comes after everything
works
37
Who are you in Data Visualization? 1 – THE TECHNICIAN

© Copyright 2013 Radiant Advisors. All Rights Reserved v1.10.000
Personality of an Analyzer: • Data is the priority
• Aesthetics not the greatest concern
• Wants to know relationships between variables
• Finds positive and negative trends
• Selects or corrects type of graph or chart used
• Weapons of choice:
• R programming, Excel, SAS
• Programming experience but doesn’t code
38
Sound like anyone you know…
Who are you in Data Visualization? 2 – THE ANALYZER

© Copyright 2013 Radiant Advisors. All Rights Reserved v1.10.000
Personality of the Artist: • Obsessed with the final product
• Designers who think hard about color
and visual indicators
(obsesses over moving box up 2 pixels)
• Not programmers but maybe uses
“Processing” language
• Weapon of choice:
Adobe CS, Illustrator, Photoshop
39
Also the person mostly likely to tell you something is ugly!
Who are you in Data Visualization? 3 – THE ARTIST

© Copyright 2013 Radiant Advisors. All Rights Reserved v1.10.000
Personality of the Outsider: • Field experts with complex data sets
• Wants to visualize their data but not
sure how
• Provides plenty of context and
sense of the data
• Usually explaining things to the
Technicians, Analyzers and Artists
40
Who are you in Data Visualization? 4 - OUTSIDER

© Copyright 2013 Radiant Advisors. All Rights Reserved v1.10.000
Personality of the Light Bulb: • The ideas people
• Some programming, design and
analytical experience but not
necessarily experts in all 3
• Handle bigger data visualization
projects
• Can lead projects and delegate work
• It’s all about the big picture
41
The brightest are Zen Masters of data visualization
Who are you in Data Visualization? 5 – THE LIGHT BULB

© Copyright 2013 Radiant Advisors. All Rights Reserved v1.10.000
THANK YOU!
For more information
www.RadiantAdvisors.com
Twitter: @RadiantAdvisors #ModernBI #RediscoveringBI
RSS: feed://radiantadvisors.com/feed/
Email us at: [email protected]
Linked IN: www.linkedin.com/company/radiant-advisors
Subscribe: Rediscovering BI quarterly e-magazine
www.radiantadvisors.com/rediscoveringbi
42
Inspired by: 5 Types of Data Visualization People – What Type Are You? Blog on FlowingData.com - June 6th, 2008

© Copyright 2013 Radiant Advisors. All Rights Reserved v1.10.000
Questions
• How does Actuate help developers and analysts choose the right
visualization technique?
• Can multiple charts on the same page be linked such that updating one
refreshes the other related views? (ex: Briefing Book)
• Can a screen with multiple visualizations be connected to multiple
underlying databases simultaneously?
• What collaboration features are there? Are there methods for capturing
end user comments, ratings or “like”?
43

Twitter Tag: #briefr
The Briefing Room

Twitter Tag: #briefr
The Briefing Room
Upcoming Topics
www.insideanalysis.com
November: DATA DISCOVERY & VISUALIZATION
December: INNOVATORS
2014 Editorial Calendar at www.insideanalysis.com/webcasts/the-briefing-room

Twitter Tag: #briefr
The Briefing Room
Thank You for Your
Attention
Related Documents
![Propolis: A Complex Natural Product with a Plethora of ... · a Plethora of Biological Activities That Can Be ... [41]. Propolis of Australian stingless bees (Tetragonula carbonaria)](https://static.cupdf.com/doc/110x72/5ac7a2027f8b9a5d718befa2/propolis-a-complex-natural-product-with-a-plethora-of-plethora-of-biological.jpg)


