rsfs.royalsocietypublishing.org Discussion Cite this article: Thomas S, Wolstencroft K, de Bono B, Hunter PJ. 2016 A physiome interoperability roadmap for personalized drug development. Interface Focus 6: 20150094. http://dx.doi.org/10.1098/rsfs.2015.0094 One contribution of 12 to a theme issue ‘The Human Physiome: a necessary key to the creative destruction of medicine’. Subject Areas: computational biology, bioinformatics, systems biology Keywords: physiologically based pharmacokinetic modelling, personalized medicine, interoperability, pharmacogenomics, human physiome, data and model resources Author for correspondence: Bernard de Bono e-mail: [email protected] A physiome interoperability roadmap for personalized drug development Simon Thomas 1 , Katherine Wolstencroft 2 , Bernard de Bono 3,4 and Peter J. Hunter 4 1 Cyprotex Discovery Ltd, 15 Beech Lane, Macclesfield SK10 2DR, UK 2 Leiden Institute of Advanced Computer Science, Leiden University, 111 Snellius, Niels Bohrweg 1, 2333 CA Leiden, The Netherlands 3 Farr Institute, University College London, London NW1 2DA, UK 4 Auckland Bioengineering Institute, The University of Auckland, Auckland 1010, New Zealand ST, 0000-0002-9979-081X; KW, 0000-0002-1279-5133; BdB, 0000-0003-0638-5274; PJH, 0000-0001-9665-4145 The goal of developing therapies and dosage regimes for characterized sub- groups of the general population can be facilitated by the use of simulation models able to incorporate information about inter-individual variability in drug disposition (pharmacokinetics), toxicity and response effect (pharmaco- dynamics). Such observed variability can have multiple causes at various scales, ranging from gross anatomical differences to differences in genome sequence. Relevant data for many of these aspects, particularly related to mol- ecular assays (known as ‘-omics’), are available in online resources, but identification and assignment to appropriate model variables and parameters is a significant bottleneck in the model development process. Through its efforts to standardize annotation with consequent increase in data usability, the human physiome project has a vital role in improving productivity in model development and, thus, the development of personalized therapy regimes. Here, we review the current status of personalized medicine in clinical practice, outline some of the challenges that must be overcome in order to expand its applicability, and discuss the relevance of personalized medicine to the more widespread challenges being faced in drug discovery and development. We then review some of (i) the key data resources available for use in model development and (ii) the potential areas where advances made within the physiome modelling community could contribute to physiologically based pharmacokinetic and physiologically based pharmacokinetic/pharmaco- dynamic modelling in support of personalized drug development. We conclude by proposing a roadmap to further guide the physiome community in its on-going efforts to improve data usability, and integration with modelling efforts in the support of personalized medicine development. 1. Introduction The overarching goal of the human physiome project is to provide a multido- main, multiscale quantitative description of the physiological dynamics and functional behaviour of the intact human (http://physiomeproject.org/ about/a-brief-history). This project seeks to find understanding and quantification of the differences between individuals in terms of their individual physiological behaviour (i.e. their physiomes), by analogy with, and partly resulting from, differences in their individual genomes. The physiome, therefore, represents the phenotype, modulated by environmental and other extra-genomic effects, of the underlying genome. From the description of this behaviour, consequential understanding is expected of the physiome in health and disease. With an understanding of the physiome at the individual, rather than the population level, the factors that lead to an individual’s predisposition, and response, to pathologies can be inves- tigated. In the context of drug treatment, therefore, the human physiome has the potential to contribute significantly to the development of personalized medicine. & 2016 The Author(s) Published by the Royal Society. All rights reserved. on June 11, 2018 http://rsfs.royalsocietypublishing.org/ Downloaded from

Welcome message from author
This document is posted to help you gain knowledge. Please leave a comment to let me know what you think about it! Share it to your friends and learn new things together.
Transcript

on June 11, 2018http://rsfs.royalsocietypublishing.org/Downloaded from
rsfs.royalsocietypublishing.org
DiscussionCite this article: Thomas S, Wolstencroft K,
de Bono B, Hunter PJ. 2016 A physiome
interoperability roadmap for personalized drug
development. Interface Focus 6: 20150094.
http://dx.doi.org/10.1098/rsfs.2015.0094
One contribution of 12 to a theme issue
‘The Human Physiome: a necessary key to the
creative destruction of medicine’.
Subject Areas:computational biology, bioinformatics,
systems biology
Keywords:physiologically based pharmacokinetic
modelling, personalized medicine,
interoperability, pharmacogenomics,
human physiome, data and model resources
Author for correspondence:Bernard de Bono
e-mail: [email protected]
& 2016 The Author(s) Published by the Royal Society. All rights reserved.
A physiome interoperability roadmap forpersonalized drug development
Simon Thomas1, Katherine Wolstencroft2, Bernard de Bono3,4
and Peter J. Hunter4
1Cyprotex Discovery Ltd, 15 Beech Lane, Macclesfield SK10 2DR, UK2Leiden Institute of Advanced Computer Science, Leiden University, 111 Snellius, Niels Bohrweg 1,2333 CA Leiden, The Netherlands3Farr Institute, University College London, London NW1 2DA, UK4Auckland Bioengineering Institute, The University of Auckland, Auckland 1010, New Zealand
ST, 0000-0002-9979-081X; KW, 0000-0002-1279-5133; BdB, 0000-0003-0638-5274;PJH, 0000-0001-9665-4145
The goal of developing therapies and dosage regimes for characterized sub-
groups of the general population can be facilitated by the use of simulation
models able to incorporate information about inter-individual variability in
drug disposition (pharmacokinetics), toxicity and response effect (pharmaco-
dynamics). Such observed variability can have multiple causes at various
scales, ranging from gross anatomical differences to differences in genome
sequence. Relevant data for many of these aspects, particularly related to mol-
ecular assays (known as ‘-omics’), are available in online resources, but
identification and assignment to appropriate model variables and parameters
is a significant bottleneck in the model development process. Through its efforts
to standardize annotation with consequent increase in data usability, the
human physiome project has a vital role in improving productivity in model
development and, thus, the development of personalized therapy regimes.
Here, we review the current status of personalized medicine in clinical practice,
outline some of the challenges that must be overcome in order to expand its
applicability, and discuss the relevance of personalized medicine to the more
widespread challenges being faced in drug discovery and development.
We then review some of (i) the key data resources available for use in model
development and (ii) the potential areas where advances made within the
physiome modelling community could contribute to physiologically based
pharmacokinetic and physiologically based pharmacokinetic/pharmaco-
dynamic modelling in support of personalized drug development. We
conclude by proposing a roadmap to further guide the physiome community
in its on-going efforts to improve data usability, and integration with modelling
efforts in the support of personalized medicine development.
1. IntroductionThe overarching goal of the human physiome project is to provide a multido-
main, multiscale quantitative description of the physiological dynamics and
functional behaviour of the intact human (http://physiomeproject.org/
about/a-brief-history).
This project seeks to find understanding and quantification of the differences
between individuals in terms of their individual physiological behaviour (i.e.
their physiomes), by analogy with, and partly resulting from, differences in
their individual genomes. The physiome, therefore, represents the phenotype,
modulated by environmental and other extra-genomic effects, of the underlying
genome. From the description of this behaviour, consequential understanding is
expected of the physiome in health and disease. With an understanding of the
physiome at the individual, rather than the population level, the factors that
lead to an individual’s predisposition, and response, to pathologies can be inves-
tigated. In the context of drug treatment, therefore, the human physiome has the
potential to contribute significantly to the development of personalized medicine.

Table 1. Cytochrome CYP450 (CYP450) pharmacogenomic biomarkers used in drug labelling by the FDA.
biomarker pharmacogenomics summary reference
CYP2C19 large number (greater than 25) of variant alleles defined. CYP2C19*2 (complete loss of function) has allele frequency
approximately 12% in Caucasians, 15% in African Americans and 29 – 35% in Asians. CYP2C19*3 (also complete
loss of function) has frequency less than 1% in most populations, but 2 – 9% among Asians. CYP2C19*17 having
increased activity has allele frequency of approximately 21% in Caucasians, 16% in African Americans and 3% in
Asians
[3]
CYP2C9 large number of polymorphisms affecting coding and regulatory regions. CYP2C9*2 and *3 have lower activity than
wild-type (*1). *2 is present in approximately 10 – 20% of Caucasian, but rare in African American and Asian
populations. *3 is present in approximately 8 – 15% of Caucasians, less than or equal to 1% in African Americans
and less than or equal to 2% in Asians
[4]
CYP2D6 many polymorphisms affect activity. Different alleles can result in complete loss, partial loss or hyperfunctional activity [5]
rsfs.royalsocietypublishing.orgInterface
Focus6:20150094
2
on June 11, 2018http://rsfs.royalsocietypublishing.org/Downloaded from
In this paper, we roadmap the efforts required for the phy-
siome community to improve interoperability of data and
models, from distinct physiology domains and scales, to effec-
tively predict multiscale drug handling and action in support
of personalized medicine. We start by outlining current chal-
lenges in drug discovery and development in personalized
medicine, as a means to identify the interoperability obstacles
the roadmap must tackle.
1.1. Personalized medicine in current clinical practicePersonalized medicine—defined as the appropriate selection of
therapies and dosing regimes to suit an individual’s genotype
and phenotype—is a concept that is gaining interest within the
pharmaceutical industry as a means of improving patient out-
comes. The term, both in the manner of its most frequent usage
and in its actual clinical implementation to date, primarily
refers to effects of pharmacogenomics (i.e. heritable genomic
variation on drug pharmacokinetics (PK) and pharmaco-
dynamics (PD)) and the consequent alteration of dosing
regimes to minimize unwanted side effects caused by the
impact of these adverse manifestations of the genotype evident
at a molecular, cellular, tissue or whole-organ level [1,2].
The Food and Drug Administration (FDA) lists (3 August
2015) approximately 125 combinations of drug treatments and
biomarkers (approx. 110 treatments and 25 biomarkers) for
which drug labelling information—warnings, dosage, usage,
etc.—can be influenced by patient pharmacogenomics (http://
www.fda.gov/Drugs/ScienceResearch/ResearchAreas/Pharma
cogenetics/ucm083378.htm). Of these, more than 50% are due
to just three markers: CYP2D6 (40 treatments), G6PD (glucose
6-phosphate dehydrogenase) (20) and CYP2C19 (16). All
these biomarkers are related to drug metabolism, as are
three other biomarkers affecting relatively large numbers of
treatments, namely CYP2C9 (4), TPMT (thiopurine methyl-
transferase) (4) and UGT1A1 (5). Currently, therefore, drug
metabolism is overwhelmingly the most significant area
related to the human physiome in which pharmacogenomic
information influences treatment regime.
Table 1 contains details of the three CYP450 biomarkers
mentioned. Details of pharmacogenomics-related labelling
information provided by EMA, FDMA and HCSC in addition
to FDA can be found at https://www.pharmgkb.org/view/
drug-labels.do.
From a therapeutic perspective, the basal issue of allele
functionality is compounded by the tremendous complexity
of the biomolecular system that incorporates redundancy
of function, mediated by overlapping and interconnecting bio-
chemical, signalling and transporter pathways. For drug
metabolizing enzymes, the expected effectsofallelicvariation on
drug metabolism are complicated and obscured by multiple
genetic effects. First, most pharmaceuticals can be metabolized
by several enzymes, or channelled by multiple transporters,
sometimes initiated by a variety of receptors. For instance, the
abnormal activity of a primary metabolizing enzyme can be
compensated by activities of other enzymes. Second, the
expression levels of many polymorphic proteins, including
drug-metabolizing enzymes, are under transcriptional control.
Thus, of the enzymes listed in table 1, only CYP2D6 is not indu-
cible [6]. CYP2C9 and CYP2C19 [3] are under control of the
transcription factors PXR (NR1I2) and CAR (NR1I3) as is
CYP3A4 [7,8], the largest contributor to drug metabolism, and
one with a broad range of in vivo expression levels. PRX and
CAR bind, and respond to, a range of xenobiotics by inducing
or inhibiting transcription of target enzymes. UGT1A1 is
under transcriptional control of the aromatic hydrocarbon
receptor (AhR), in addition to PXR and CAR [9]. CAR
is, itself, subject to genetic variation in its ligand and DNA bind-
ing domains that can affect binding of, and transactivation
response to, the compounds that are able to act as ligands [10].
The above complex molecular network is overlaid with a level
of inter-individual variability comprising chromosomal, epige-
netic, environmental and other factors such as gender, ethnicity,
age, obesity, comorbidities and exposure to xenobiotics via diet,
smoking, environmental chemicals and co-medication [11–15].
While advances are being made in understanding the roles of
each of these factors in drug metabolism and response, their
individual effects are only partially understood and the effects
of their interactions even less so.
It can be seen that the difficulty in converting genomic
data on drug metabolism and activity into actionable infor-
mation on dosing is a consequence of the complexity of the
relationship between the mammalian genome and its phy-
siome, compounded by the need to account for additional,
non-genetic, factors.
1.2. Non-universal therapy in drug discovery anddevelopment
The underlying problems being addressed by personalized
medicine, namely maximization of therapeutic effect coupled

rsfs.royalsocietypublishing.orgInterface
Focus6:20150094
3
on June 11, 2018http://rsfs.royalsocietypublishing.org/Downloaded from
with minimization of side effects in specific individuals as
opposed to a generic population, are the same as those required
for successful development and commercialization of new
drugs for widespread use. Unacceptable toxic side effects,
even in a relatively small proportion of patients, or lack of effi-
cacy in a sufficiently large proportion of patients, are factors that
derail the development or sale of a pharmaceutical. The ability
to identify—with increased probability, even if not certainty—
positive responders or individuals likely to be at greater risk of
adverse effects is a key requirement of drug development.
Currently, however, these issues are not usually addressed
until late stage clinical development and beyond, by which
time investment and financial risk have escalated. Drug discov-
ery and early clinical development are more usually focused on
the behaviour of drugs in generic, homogeneous, populations.
Thus, early characterization of a compound, by means of
in vitro assay for activity, toxicity, as well as absorption, distri-
bution, metabolism and elimination (ADME) is primarily
aimed at predicting behaviour in a model of a standardized
individual. Early clinical trials study safety and PK in small
populations of healthy volunteers (Phase I) and patients
(Phase II). Not until Phase III and beyond are novel compounds
studied in large patient populations. Even here, given the tre-
mendous variability of human genotype and phenotype, the
majority of combinations of phenotypic and genotypic varia-
bility that could impact on therapeutic and toxic outcomes
cannot be tested with significant power.
Failures of new compounds in clinical trials can arise from
any, or all, of the following factors:
(1) excessive toxicity,
(2) insufficient therapeutic effect,
(3) poor PK that may result in:
(a) insufficient drug reaching the pharmacological target
site for a long enough duration to cause the required
effect, possibly in conjunction with
(b) excess drug reaching a non-target site where a
limiting toxic effect is triggered.
Simply put, such failure can be considered to represent an
unacceptable imbalance between therapeutic and toxic effects.
The role of drug discovery and preclinical development is
to produce candidates for clinical trial that have an appropriate
balance of therapeutic potency, acceptable toxicity (which is
context dependent) and PK characteristics that enable the
therapeutic effect to be realized with acceptable side effects.
Prediction for a real heterogeneous, highly variable global
patient population is a daunting challenge. It is, though, a chal-
lenge that must be met for the pharmaceutical industry to
avoid continued and financially ruinous failures. If one of the
steps to be taken to meet this challenge is the development of
personalized (or, perhaps more generally, ‘non-universal’)
therapy, then tools and methodologies must be developed to
facilitate this approach.
Some progress has been made in understanding the varia-
bility of individuals’ responses to pharmaceuticals—in PK,
toxicity and therapeutic effect. The revolutions in data gener-
ation and internet connectivity have led to a range of
databases and other online resources becoming available
to researchers. These data provide the raw material from
which simulation and other modelling approaches can
generate the quantitative insight required to predict thera-
peutic outcomes in individuals and, hence, prescription of
appropriate therapeutic regimes. Simulation modelling, in
particular, provides a powerful means of integrating data
from multiple sources. For predicting PK, data relating to
subjects’ physiology—the major organs and their intercon-
necting blood flows—are combined with data relating to
ADME processes (frequently obtained from in vitro assays
probing the molecular basis of drug disposition) to predict
the time course of administered drugs in the plasma and
major organs/tissues. This specific application is known as
physiologically based pharmacokinetic (PBPK) modelling
[16]. By including measures of inter-individual variability at
the molecular level (e.g. expression of drug-metabolizing
enzymes) drug PK in characterized subpopulations and indi-
viduals can be simulated [17,18]. The performance of PBPK
modelling in predicting PK has been recently assessed [19]
and available methods, including software for performing
PBPK modelling, reviewed [20]. Linking predictions of
time-dependent drug concentrations at molecular targets
with empirical or mechanistic PD models (to create PBPK/
PD models) permits the prediction of therapeutic and/or
toxic responses to drugs as driven by their PK [21].
1.3. Objectives for the physiome interoperabilityroadmap
A core challenge in harnessing resources to support multido-
main, multiscale simulation is one of semantic interoperability,
namely: to develop the requisite informatics machinery in sup-
port of standards-based procedures to correctly identify and
combine data and models about measurements from different
tissues, at different degrees of resolution. To that end, we ask
the following questions:
(1) Where do these data and model resources (DMRs), rel-
evant to drug-related physiome studies, reside and
what information do they contain?
(2) What has been achieved, so far, in ensuring interoperabil-
ity between these physiome DMRs and how is their
content classified?
(3) What remains to be done to significantly improve the
benefit of DMR interoperability to personalized medicine
effort by the physiome community—what should be on
the interoperability roadmap ahead?
Planning the physiome community’s pharmaceutical
effort requires answers to the above questions to provide
the basis of the physiome’s interoperability roadmap. The
following sections address these questions.
Section I reviews core achievements of modellers in
the molecular domain in establishing community-wide
interoperability of their resources, and asks: what can
anatomy-level physiology modellers learn from this com-
munity effort? Section II takes the perspective of the
anatomy-level physiology modeller to outline how patient-
specific anatomical data can be integrated into modelling to
personalize PBPK calculations for flows relevant to drug
disposition. Based on the discussion in the preceding sec-
tions, Section III provides the roadmap as a list of
requirements that the molecular- and anatomy-level model-
lers need to address to provide a general solution in
personalizing multiscale PBPK modelling.

biological regulation, 232
cellular componentorganization orbiogenesis, 17
immunesystem
process, 18
multi-organismprocess, 18
multicellular organismalprocess, 63
cellular process,78
developmentalprocess, 24rhythmic
process, 43
metabolic process, 338response to stimulus, 378
Figure 1. A breakdown of the different biological processes that have been modelled and published in BioModels (source of data: http://www.ebi.ac.uk/biomodels-main/gochart). (Online version in colour.)
rsfs.royalsocietypublishing.orgInterface
Focus6:20150094
4
on June 11, 2018http://rsfs.royalsocietypublishing.org/Downloaded from
2. Section I: What can we learn from theinteroperability successes for molecular-scaledata and model resources?
Molecular and pharmacometric modelling are both already
established in the drug development process, but modelling
at the molecular level is conducted in the early stages, and phar-
macometric techniques tend to be employed later. Toxicity
studies rarely capitalize on existing molecular knowledge
about human variation, for example, and instead focus on
population responses. The potential gains possible from com-
bining molecular and pharmacometric modelling throughout
the drug development process have so far been under-explored.
There are a large collection of models and data at the mol-
ecular level that would be directly relevant to PD and PK
studies. Networks of gene regulation, signalling, metabolism
and protein–protein interaction can be informative for under-
standing genotype to phenotype correlations and such
models exist for both human and model organisms. Quanti-
tative data, on protein expression, enzyme activity and
metabolite concentrations, for example, are also gradually
becoming more available through curated knowledge bases
like SABIO-RK [22]. Community-driven approaches to conso-
lidate current knowledge are also accelerating progress in the
field. For example, Recon 2 [23] is part of the Virtual Meta-
bolic Human project and represents a community-produced
global reconstruction of human metabolism. The general
model of metabolism has been integrated with protein-
expression data from the Human Protein Atlas [24], and/or
gene expression data from ArrayExpress [25], in order to
study cell-type and tissue-specific processes. These tissue-
specific models provide a firm basis for studying the
metabolic effects of drugs in different tissues and the effects
of genetic and environmental variation on metabolism [26].
The PK and PD community can directly exploit the
wealth of molecular-scale resources by linking to initiatives
as described above, but more importantly, they can benefit
from the experiences of integration and interoperability.
Recon 2 and related integration work were only possible
due to the early development and adoption of data and
model standards, such as SBML (Systems Biology Markup
Language) [27]. To date, there are over 1000 models in the
BioModels database [28] (the majority of which are SBML),
and over 250 tools and applications that can import and
export SBML. Figure 1 shows a breakdown of the different
biological functions described by models in BioModels.
Model standards encompass the syntactic format (e.g.
SBML), the metadata content, with MIRIAM (Minimum
Information Required in the Annotation of a Model) [29],
and even the visual representation, with SBGN (Systems
Biology Graphical Notation) [30]. Entities are annotated with
common public identifiers, for example UniPprot [31] for pro-
teins or ChEBI [32] for metabolites and small molecules. Model
functions and properties are annotated with common con-
trolled vocabularies, such as the Gene Ontology [33] and the
Systems Biology Ontology [34], which means that it is possi-
ble to unambiguously link models and their entities with
experimental omics data.
Standardization activities, and the systematic collection
and annotation of data and models into public repositories,
have created a critical mass of resources for modelling at the
molecular level. In recent years, the development of systems
biology standards has been a coordinated effort of COMBINE
(the Computational Modelling in Biology Network), a grass-
roots initiative which is open to the whole community.
However, these activities are difficult to sustain over the long
term and more work is required to enable standardization
across multiple scales, which will facilitate integration between
molecular and PD/PK modelling activities. The PK/PD com-
munity can utilize existing molecular-level standards and can
adopt similar pragmatic approaches for community engage-
ment. A crucial component is the provision of sufficient
incentives for standards adoption. Annotation and curation
are time-consuming activities that benefit researchers who re-
use data, rather than those who initially created it. However,
some incentives are already in place. A number of journals
require data and models to be made available in standard for-
mats before work can be published. For example, most journals
rsfs.royalsocietypublishing.orgInterface
Focus6:20150094
5
on June 11, 2018http://rsfs.royalsocietypublishing.org/Downloaded from
require transcriptomics results to be submitted to a public
repository (e.g. ArrayExpress), compliant with the MIAME
guidelines (Minimum Information about a Microarray
Experiment) [35]. In the molecular modelling world, models
submitted to the FEBS Journal (in SBML) are technically curated
to ensure that the simulation results match those in the
manuscript, and an online interactive version is provided.
In order to make data citation and data availability a
scalable and sustainable possibility, an accessible research infra-
structure is required. ELIXIR (the distributed infrastructure for
life science information; https://www.elixir-europe.org/) and
ISBE (Infrastructure for Systems Biology in Europe; http://pro-
ject.isbe.eu/) address this issue. ELIXIR aims to ensure the
continued access to public data resources, tools and compute
facilities; and ISBE facilitates the use of model-driven
approaches to understand complex biological systems. ISBE
also aims to reduce the current silo structure of data resources
and allow multiple omics datasets and models to be stored
and shared in their collective contexts, using initiatives like
FAIRDOM (http://fair-dom.org/).
Standards activities such as COMBINE may be directly
supported by ISBE or ELIXIR in the future, or they may insti-
gate or coordinate new standardization initiatives. One
standards bottleneck identified by ISBE is the availability of
provenance regarding quantitative values in models. Standard
identifiers enable biological entities to be unambiguously
labelled, but the link to the experiments that determined
the quantitative values of concentration or activity is lost,
hampering interpretation and re-use.
Standardization throughout the omics community has
enabled multi-omics data integration approaches and enables
data and model integration. Exploiting the vast amount of
standardized, distributed data available for molecular and
pharmacological modelling, however, remains a challenge.
Large-scale semantic integration projects such as Open
PHACTS have enabled pre-competitive collaboration between
industrial, academic and small business partners. Open
PHACTS has produced a common discovery platform for pub-
licly available pharmacological data [36]. The Open PHACTS
API provides a uniform interface for designing and building
applications that integrate, explore and visualize associations
between entities of pharmacological interest, such as com-
pounds, target pathways and diseases. Recent applications
include an investigation into alternative therapeutic targets
for vitamin D pathway interventions, for example.
3. Section II: What kind of anatomy-levelpersonalization is relevant to physiologicallybased pharmacokinetic modelling?
In PBPK modelling anatomical detail is usually limited to
representation of each major organ (e.g. liver) and tissue
(e.g. adipose, skeletal muscle) as a homogeneous compart-
ment, each supplied and drained by one or two
unbranched blood vessels. Data on compartment sizes and
perfusion rates can be obtained from standard references,
e.g. [37], that include data on age- and gender-related depen-
dencies, permitting these aspects of inter-subject variability
to be simulated, although not on a personal level. The
reason to include biophysically detailed patient-specific
organ models, with their associated vasculature, into the
PBPK/PD modelling framework is that they allow a much
more accurate analysis of perfusion for estimating the drug
concentration profile delivered to a given tissue, and could
thus facilitate more accurate predictions of drug distribution,
metabolism and excretion.
The cardiovascular system and the digestive system are two
organ systems where patient-specific anatomy could have par-
ticular relevance for personalized PBPK modelling. This
section deals with the acquisition of patient-specific image
data to extract information relevant to the modelling of flow
in the digestive tract and long- (between organs) and
medium-range (within organs) flow for such an application.
3.1. Long-range flowLumped parameter PBPK models could be extended in sev-
eral ways to account for a more personalized representation
of anatomy and physiology. For example, spatially distribu-
ted models of the cardiovascular circulation can be used to
provide pressure and flow throughout the body and if
these are defined in relation to the musculo-skeletal system
and the skin, it is fairly straightforward to adapt a generic
model to the anatomy of a particular person. Further refine-
ment is possible if computed tomography (CT) or magnetic
resonance imaging (MRI) data are available to provide
specific dimensional data for an individual. The extent to
which the cardiovascular circulation model extends to
organ perfusion in a person-specific manner depends on
the availability of CT or MRI data with a resolution high
enough to capture at least the first few generations of blood
vessels in each organ.
Once the blood flow has been computed for an individual,
the advective component of the advection–diffusion equations
can be specified and these equations solved to provide the con-
centration profiles of blood gases and other solutes carried in
the blood. Then, if the concentration-versus-time profile of a
drug injected at a particular point in the circulation is specified,
along with the absorption characteristics for the drug within
various tissue beds, the concentration-versus-time profile of
the drug can be calculated at all points in the vascular
system. The extent to which these calculations can be made
person-specific will depend on tissue parameters being
available for that individual.
We first describe a whole body circulation model and
then indicate how this can be linked to organ perfusion
models using the heart and liver as examples.
The equations governing fluid flow in the cardiovascu-
lar system are the three-dimensional Navier–Stokes
equations, but these are very expensive to solve for the entire
circulation throughout the cardiac cycle. A useful simplification
is to assume unidirectional flow, a specified radially dependent
velocity distribution, and a nonlinear elastic pressure–radius
relation, then integrate over the vessel cross section to yield a
one-dimensional version of the Navier–Stokes equations.
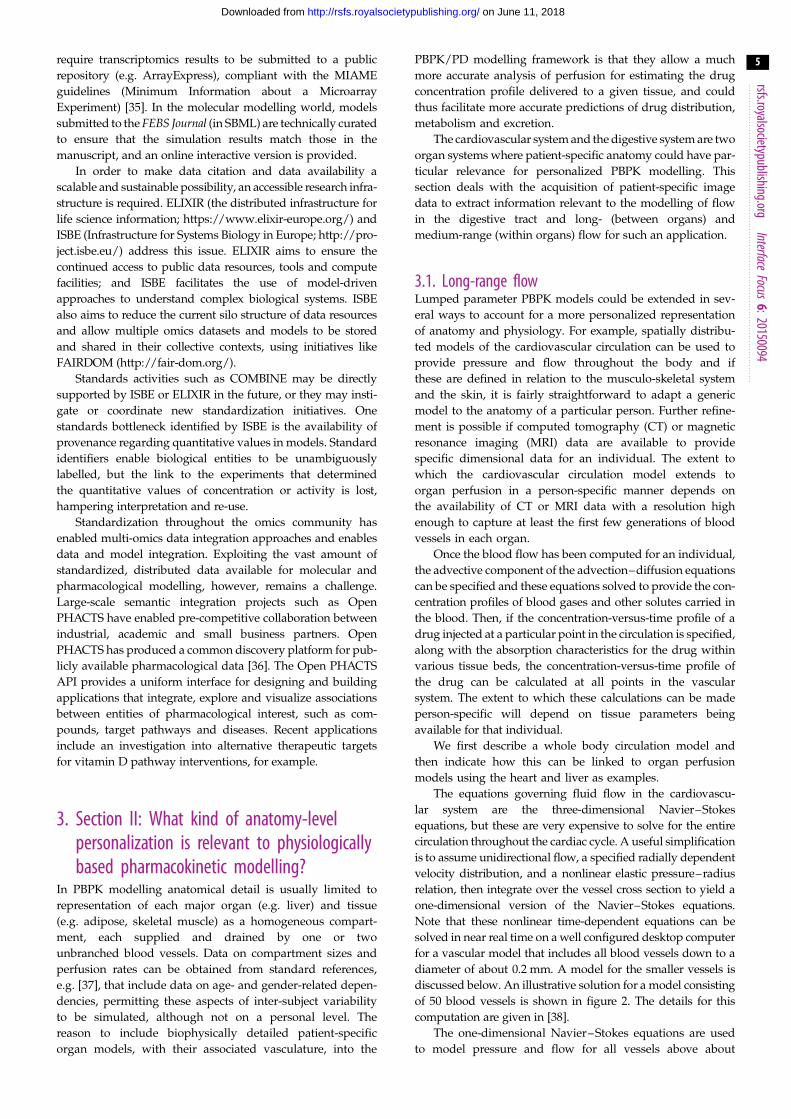
Note that these nonlinear time-dependent equations can be
solved in near real time on a well configured desktop computer
for a vascular model that includes all blood vessels down to a
diameter of about 0.2 mm. A model for the smaller vessels is
discussed below. An illustrative solution for a model consisting
of 50 blood vessels is shown in figure 2. The details for this
computation are given in [38].
The one-dimensional Navier–Stokes equations are used
to model pressure and flow for all vessels above about
14 01. ascending aorta02. aortic arch A
12. aortic arch B
03. brachiocephalic04. R. subclavian
17. L. subclavian
05. R. common carotid06. R. vertebral07. R. brachial08. R. radial09. R. ulnar
18. L. vertebral19. L. brachial20. L. radial21. L. ulnar22. thoracic aorta B
25. hepatic26. gastric27. splenic
24. celiac23. abdominal aorta A
29. abdominal aorta B
34. abdominal aorta D
39. L. femoral
35. L. common iliac36. R. common iliac
38. L. internal iliac500 cm3 s–1
0–505
1015202530
100 200 300 400time (ms)
flow
rat
e (c
m3
s–1)
left subclavian
500 600 700 800
0–50
050
100150200250
400
300350
100 200 300 400time (ms)
flow
rat
e (c
m3
s–1)
thoracic aorta
500 600 700 800
0–505
10152025
4540
3035
100 200 300 400time (ms)
flow
rat
e (c
m3
s–1)
left renal
500 600 700 800
0–10
0
10
20
30
40
50
100 200 300 400time (ms)
flow
rat
e (c
m3
s–1)
right external iliac
500 600 700 800
–10 cm3 s–1
37. L. external iliac
31. R. renal30. L. renal
32. abdominal aorta C
28. superior mesenteric
33. inferior mesenteric
44. R. external iliac
49. R. anterior tibial50. R. fibular
45. R. internal iliac46. R. femoral
48. R. posterior tibial47. R. deep femoral
41. R. posterior tibial40. L. deep femoral
42. L. anterior tibial43. L. fibular
10. R. internal carotid
14. L. internal carotid13. L. common carotid
15. L. external carotid16. thoracic aorta A
11. R. external carotid
15181317
12
1619
22
2327
2930
3234
35
38
37
40
39
21
20
10
11
6
5
43
226
25
2833
36
44
45
47
46
49
41
50
42
43
48
2431
1
7
8
9
Figure 2. A model of the circulation for blood vessels with diameters greater than 0.2 mm. The vessels labelled on the left are used in a model that solves the one-dimensionalNavier – Stokes equations (with inertial terms included). The computed flow distribution is shown in the centre with the transient flow shown as a function of time during thecardiac cycle for four vessels (left subclavian, thoracic aorta, left renal and right external iliac) on the right. Figures provided by Soroush Safaei. (Online version in colour.)
rsfs.royalsocietypublishing.orgInterface
Focus6:20150094
6
on June 11, 2018http://rsfs.royalsocietypublishing.org/Downloaded from
0.2 mm in diameter. This vascular model is defined in
relation to the musculo-skeletal system and skin surface anat-
omy [38] such that it can be adapted to the particular body
size of an individual.
Below 0.2 mm diameter the Reynolds number (the ratio of
inertial forces to viscous forces) is sufficiently low that the
inertial terms in the Navier–Stokes equations can be omitted
and a different approach used to model the 10–15 gener-
ations of branching blood vessels inside organs or in
subcutaneous tissue. The modelling approach under these
circumstances is called a ‘transmission line’ approach and is
extremely fast because the equations are linear in the pressure
and flow variables. An illustrative example (for the liver) is
discussed below. The transmission line approach for each
organ and for the vasculature in subcutaneous tissue is
coupled, at the proximal end, to the small arteries and
veins of the one-dimensional Navier–Stokes model and, at
the distal end, to capillary networks that are modelled as
spatially lumped parameter CellML models (further details
given in [38]).
The transmission line model of the vascular tree within an
organ is generated with an algorithm (specific to each organ)
and so can be adapted to allow for size and shape variation
for an individual body. If a more detailed clinical organ
image is available for an individual (e.g. MRI or CT), the vas-
cular system model can be more specifically adapted to
match the anatomy of that organ.
Once the pressure and flow distributions throughout
the body have been obtained, one-dimensional advection–
diffusion equations can be solved to provide the spatial
distribution of solute concentration in the blood. These
equations are linear in the unknown variables (solute concen-
tration) and can, therefore, be solved rapidly if the previously
computed blood flow is not influenced by the solute
concentration. If it is, an iterative scheme is required [39].
3.2. Medium-range flowFinite-element models of a number of organs have been devel-
oped and these often include the vascular beds. The geometry

(b)(a)
(c) (d ) (e)
Figure 3. The patient-specific pipeline from (a) MRI or CT image, to (b) surface data, that are used to build (c) a finite-element mesh of the left and right ventricles,and then (d ) a coronary mesh embedded within the myocardial model, on which flow equations are solved, the solution of which is shown in (e). (Online version incolour.)
rsfs.royalsocietypublishing.orgInterface
Focus6:20150094
7
on June 11, 2018http://rsfs.royalsocietypublishing.org/Downloaded from
of these anatomical models can be defined in a clinical setting
by segmenting patient images from MRI, CT or ultrasound and
then generating the model to fit image surface data. An
example of a left and right ventricular heart model is shown
in figure 3. The cardiac MRI image shown in figure 3a is seg-
mented to generate surface data (figure 3b) that can be used
to generate a ventricular heart mesh (figure 3c). A coronary
mesh generated algorithmically within the ventricular myocar-
dium is shown in figure 3d and the flow distribution within this
mesh (for a specified flow boundary condition at the coronary
sinus) is shown in figure 3e. The flow solution is influenced by
the contractile state of the myocardium, which compresses the
blood vessels during systole, particularly on the venous side
within the subendocardial region. Note that the vascular tree
shown here is only an approximation to the real coronary archi-
tecture. Newer methods [40] allow a much more detailed
description of the coronaries.
Note that the mechanical deformation of the heart (and
hence the pattern of coronary flow) is strongly influenced
by the fibrous-sheet structure of the myocardium [41]. It is
not currently possible to measure the fibrous-sheet architec-
ture of a particular patient’s heart but, except in certain
pathologies, there is a great deal of consistency in this struc-
ture when examined across a population for a particular
species [42].
The liver has a complex vascular anatomy that relies on a
dual blood supply provided by the portal venous and hepatic
arterial trees, respectively. The bile drains into a separate
complex system of ducts that converge with the vascular
pedicles in the hilum before draining into the small intestine.
The vascular and biliary system show considerable varia-
tion between people, with only 60% of people having
conventional anatomy.
Patient-specific bioengineering models of the vascular
system in the liver are being developed to aid pre-surgical
planning and intra-operative guidance [43,44]. These
models are fitted to geometric data from cross-sectional CT
or MRI of the patient’s liver (figure 4). For example, the
models are currently used pre-operatively (with estima-
ted boundary conditions) to optimize a surgical resection
strategy by predicting blood flow to the liver segments.
Patient-specific anatomical and functional models of the
intra-hepatic bile ducts have also been developed, based on
pre-operative cross-sectional images following a biliscopin
infusion. Note that another approach called ‘Constrained
Constructive Optimization’ (CCO) has been used to generate
vascular trees to arbitrary detail in rodent livers [45].
3.3. Short-range flowThese larger scale liver vascular models are also being linked
by researchers in the German Virtual Liver Network (www.
virtual-liver.de) (VLN) to more detailed vascular models of
the hepatic sinusoids [46,47] and to multiscale and biophysi-
cally based models of physiological liver function [48,49].
Similar work is being done for the heart [40].
Models have also been developed for some functional
aspects of parts of the digestive system including the oesopha-
gus, stomach, duodenum and small intestines [50,51] but a
vascular system model that ties all these together appears to

pressure100
20 0 s 1.0 s0.2 s 0.6 s(mmHg)
(a)
(b)
Figure 4. A blood flow model of the vasculature in the liver. (a) The major branches of the portal venous and hepatic arterial trees. (b) The spatial distribution ofblood pressure in a transmission line model of the liver at four points during the cardiac cycle. These computations rely on a flow profile specified at the majorsupply artery shown. Figures provided by Harvey Ho. (Online version in colour.)
rsfs.royalsocietypublishing.orgInterface
Focus6:20150094
8
on June 11, 2018http://rsfs.royalsocietypublishing.org/Downloaded from
be missing. Note that these models deal with wall motility and
the enteric nervous system [52,53] and three-dimensional flow
processes [54], but are not yet coupled to membrane transport
(although this is under development). The anatomical models
can be personalized using MRI or CT images and could poten-
tially incorporate assessments of motility and transit times for
drugs in the digestive system. They could also incorporate
more detailed three-dimensional flow modelling which
included the spatial distribution of transporters in the crypts
and villi of the small intestines [55].
The vascular systems of a number of other organs have
been modelled in a similar fashion, using patient-specific
MRI or CT data. For example, vascular models of the lungs
are at an advanced level [56–58].
All of these organ level vascular models can be connec-
ted to the whole body circulation model described above.
PBPK/PD models are generally low dimensional (i.e. have
a relatively small number of degrees of freedom) as they
often need to be run over weeks or months of simulation
time. Biophysically and anatomically based finite-element
models, on the other hand, can take hours to run one cardiac
cycle. While the techniques involving transmission line
theory substantially reduce the computation time for an
organ vascular network (where inertial effects are negligible),
this is still an issue for the more detailed PBPK approach
advocated here if the organ models contain further
detail of physiological relevance for PBPK. For instance, the
concentration-dependent induction of drug-metabolizing
enzymes in the liver and other tissues can influence the
future trajectory of the inducing drug concentration–time pro-
file. The solution is to develop ‘reduced’ or multivariate ‘meta’
models using techniques such as partial least-squares
regression [59]. The biophysically detailed model is run mul-
tiple times with various combinations of input parameters to
fill out a state space description of the relationship between
input parameters and output variables. The piece-wise linear
approximation of this state space (the reduced model) then
provides an extremely fast way of running this model in
combination with other similarly reduced models and the
connecting circulation model.
4. Section III: the roadmap: what are the keysteps towards interoperability for personalizedphysiologically based pharmacokineticmodelling?
Achieving interoperability between DMRs at a molecular (e.g.
[23]) and anatomy level (e.g. [24,25,42,48]) in support of the
pharmaceutical R&D goals outlined in the Introduction is a
major challenge for the physiome community. Identifying the
key steps along a roadmap to this kind of interoperability
depends on the collection of requirements from a wide range
of industry experts along the life cycle of drug discovery and
development. To that end, for the specific purpose of the road-
map we present below, we draw upon our interaction with three
Innovative Medicines Initiative (IMI) pharmaceutical industry-
funded projects to collect and collate the high-level require-
ments that can inform our recommendations. We first briefly
describe these projects and requirements they bring to bear on
the roadmap in terms of integrating molecular- and anatomy-
level DMRs. Then, the key milestones of the interoperability
roadmap are discussed in the light of these requirements.

epithelialconduit
endothelialconduit
neuralconduit
functionaltissue unit
gastrointestinal
perineal
cutaneous
nasopharyngeal
Figure 5. The ApiNATOMY circuitboard visualization toolkit [64], display mock-up illustrated here, provides the anatomical layout of a tiled depiction of bodyregions, together with an edge-based illustration of advective conduits, in support of the management of compartmental knowledge as well as associated semanticmetadata. (Online version in colour.)
rsfs.royalsocietypublishing.orgInterface
Focus6:20150094
9
on June 11, 2018http://rsfs.royalsocietypublishing.org/Downloaded from
(a) Requirements from IMI projects.
— DDMoRe: drug and disease modelling resource [60]
This project focuses on DMRs for studies in PK and
PD. These DMRs deal with measurements of drug
concentrations or drug effect in different body
compartments across time to determine dosing,
efficacy and toxicity of a drug through the model-
ling of ADME processes and, in some cases,
linked to compartment-specific downstream PD
processes. Diseases like diabetes mellitus may
also need to be factored in as they interfere with
ADME and PD processes leading to therapeutic
errors, impairing efficacy or triggering toxicity
effects at normal doses.
In practice, the key requirement from DDMoRe
is to develop the means to manage knowledge of
compartments from which drug measurements
are taken, as well as knowledge of how routes of
communication between compartments can be dis-
turbed by disease.
— AETIONOMY: disease mechanisms in neurode-
generation [61]
A second requirement emerges from the effort to
manage knowledge of mechanisms in Alzheimer’s
and Parkinson’s diseases. A key goal for this project
is to map clinical scores from neuropsychometric
tests that correlate with functional measurements
(e.g. radiology, functional studies, post-mortem,
animal studies) taken from well-characterized brain
compartments. Given such a map of brain compart-
ments directly linked to clinical and functional
measurements, then it is possible to generate hypoth-
eses of physiological mechanisms that could be
responsible for patient behaviour. One avenue to
answer this question is to look for routes of communi-
cation between these brain compartments, based
upon neural tracer studies in model organisms.
Although the inferencing of communication routes
is a novel requirement emerging from this IMI pro-
ject, the core requisite of this approach still relies on
the establishment of a map of compartments, and
corresponding routes of communication, that was
already articulated with the DDMoRe use case.
— OpenPHACTS: molecular biology knowledge for
drug discovery [62]
Introduced in Section I, this molecular-level project
gives rise to a special case of the knowledge manage-
ment requirements put forward by DDMoRe.
In particular, this project manages knowledge
about the ecosystem of drug-specific receptors and
transporters for particular body compartments,
based on gene- and protein-expression data. This
type of information is crucial to link PD models
that depend on the triggering of receptor or
membrane channel behaviour in response to drug
binding in tissue-specific compartments. In that
sense, interoperability of OpenPHACTS resource
with DDMoRe is a key requirement to facilitate the
automated combination of (i) PK models that predict
the drug concentration–time curves in specific
tissue compartments and (ii) protein- and tissue-
specific PD models that determine drug effects in
those compartments.
The above three use cases thus provide a strong basis for a cross-
physiome standardization of knowledge about body compart-
ments (e.g. as discussed in [63]) and intervening flow routes, a
knowledge combination referred to as a physiology circuit-
board. This standardized physiome circuitboard would,
therefore, support interoperability for:
(1) the coherent recording of measurements from different,
yet related compartments (e.g. MRI-derived brain
region volume [61], drug concentration in liver
[60], immunohistochemical staining intensity for some
protein in the glomerulus [62]),

rsfs.royalsocietypublishing.orgInterface
Focus6:20150094
10
on June 11, 2018http://rsfs.royalsocietypublishing.org/Downloaded from
(2) flow process modelling (e.g. crucial for ADME studies),
and
(3) the management of knowledge of normal (e.g. the neuro-
biological basis of behaviour) and pathological (e.g. the
impact of DM on ADME) mechanisms in terms of the
same compartments and flow routes (e.g. as modelled
in [28]).
(b) Key milestones for the physiome interoperability
roadmap.
Given the interoperability requirements articulated above,
the key milestones for the interoperability roadmap are for
the physiome community to:
(1) develop the formal definitions of body compartments
and routes of flow through these compartments that
leverage semantic standards discussed in Section II to
ensure that molecular process DMRs are interoperable
with the anatomical descriptors of the compartments
housing these processes;
(2) provide (existing or newly developed) tools to collabora-
tively build generic as well as organism-specific reference
maps of compartments and routes on the basis of the
above definitions;
(3) organize physiome-wide editorial teams of experts to (i)
collect construction priorities and requests from the com-
munity and (ii) leverage the above tools to cumulatively
build a knowledgebase of organ- and organism-specific
reference circuitboards consisting of components with
the above stable identifiers;
(4) establish an editorial strategy for the regular updating of
the public release of the circuitboard knowledgebase;
(5) agree on the community-wide adoption of the above
public knowledgebase as a stable source of compartment
identifiers for the semantic annotation of molecular- and
anatomy-level physiome DMRs;
(6) agree on the community-wide open publication of
semantic annotations to the above physiome DMRs; and
(7) provide tools for the visualization, browsing and search-
ing of both the circuitboard knowledge as well as the
overlay of semantic metadata linking out to physiome
DMRs (e.g. figure 5 [64]).
5. ConclusionIn this work, we outline a roadmap to improve data usability
and the integration of these data with modelling efforts in the
support of personalized medicine development. Through its
efforts to standardize annotation and increase data interoper-
ability across scales, the human physiome project has a vital
role to play in improving productivity in model development
and personalized therapy regimes. Achieving such multiscale
interoperability is key in the identification and assignment of
data to appropriate model variables and parameters, which is
currently a significant bottleneck in the model development
process. In addition, such interoperability is essential for
models from different scales to be combined effectively in
support of the study of the anatomical and physiological conse-
quences of genomic variability influencing inter-individual
differences in gene expression and protein function. Such multi-
scale efforts are necessary to characterize subpopulations in
terms of drug disposition, toxicity and response effect.
Competing interests. We declare we have no competing interests.
Funding. S.T. and B.d.B. received funding from IMI grant agreementno. 115156 (DDMoRe).
References
1. Lam YW. 2013 Scientific challenges andimplementation barriers to translation ofpharmacogenomics in clinical practice. ISRNPharmacol. 2013, 641089. (doi:10.1155/2013/641089)
2. Lee JW, Aminkeng F, Bhavsar AP, Shaw K, CarletonBC, Hayden MR, Ross CJ. 2014 The emerging era ofpharmacogenomics: current successes, futurepotential, and challenges. Clin. Genet. 86, 21 – 28.(doi:10.1111/cge.12392)
3. Scott SA, Sangkuhl K, Shuldiner AR, Hulot JS, ThornCF, Altman RB, Klein TE. 2012 PharmGKB summary:very important pharmacogene information forcytochrome P450, family 2, subfamily C,polypeptide 19. Pharmacogenet. Genomics 22,159 – 165. (doi:10.1097/FPC.0b013e32834d4962)
4. Van Booven D, Marsh S, McLeod H, Carrillo MW,Sangkuhl K, Klein TE, Altman RB. 2010 CytochromeP450 2C9-CYP2C9. Pharmacogenet. Genomics 20,277 – 281. (doi:10.1097/FPC.0b013e3283349e84)
5. Owen RP, Sangkuhl K, Klein TE, Altman RB. 2009Cytochrome P450 2D6. Pharmacogenet. Genomics19, 559 – 562. (doi:10.1097/FPC.0b013e32832e0e97)
6. Ingelman-Sundberg M, Sim SC, Gomez A,Rodriguez-Antona C. 2007 Influence of cytochromeP450 polymorphisms on drug therapies:pharmacogenetic, pharmacoepigenetic and clinicalaspects. Pharmacol. Ther. 116, 496 – 526. (doi:10.1016/j.pharmthera.2007.09.004)
7. Wang XD et al. 2009 Impact of the haplotypesof the human pregnane X receptor gene on thebasal and St John’s wort-induced activity ofcytochrome P450 3A4 enzyme. Br. J. Clin.Pharmacol. 67, 255 – 261. (doi:10.1111/j.1365-2125.2008.03344.x)
8. Tompkins LM, Wallace AD. 2007 Mechanisms ofcytochrome P450 induction. J. Biochem. Mol. Toxicol.21, 176 – 181. (doi:10.1002/jbt.20180)
9. Barbarino JM, Haidar CE, Klein TE, Altman RB. 2014PharmGKB summary: very important pharmacogeneinformation for UGT1A1. Pharmacogenet. Genomics24, 177 – 183. (doi:10.1097/FPC.0000000000000024).
10. Li H, Wang H. 2010 Activation of xenobioticreceptors: driving into the nucleus. Expert Opin.Drug Metab. Toxicol. 6, 409 – 426. (doi:10.1517/17425251003598886)
11. Hanley MJ, Abernethy DR, Greenblatt DJ. 2010Effect of obesity on the pharmacokinetics of drugsin humans. Clin. Pharmacokinet. 49, 71 – 87.(doi:10.2165/11318100-000000000-00000)
12. Franconi F, Campesi I. 2014 Pharmacogenomics,pharmacokinetics and pharmacodynamics:interaction with biological differences between menand women. Br. J. Pharmacol. 171, 580 – 594.(doi:10.1111/bph.12362)
13. Pavek P, Dvorak Z. 2008 Xenobiotic-inducedtranscriptional regulation of xenobioticmetabolizing enzymes of the cytochrome P450superfamily in human extrahepatic tissues. Curr.Drug Metab. 9, 129 – 143. (doi:10.2174/138920008783571774)
14. Kang D, Verotta D, Krecic-Shepard ME, Modi NB,Gupta SK, Schwartz JB. 2003 Population analyses ofsustained-release verapamil in patients: effects ofsex, race, and smoking. Clin. Pharmacol. Ther. 73,31 – 40. (doi:10.1067/mcp.2003.21)
15. Hernandez JP, Mota LC, Baldwin WS. 2009Activation of CAR and PXR by dietary,environmental and occupational chemicals altersdrug metabolism, intermediary metabolism, and
rsfs.royalsocietypublishing.orgInterface
Focus6:20150094
11
on June 11, 2018http://rsfs.royalsocietypublishing.org/Downloaded from
cell proliferation. Curr. Pharmacogenomics Person.Med. 7, 81 – 105. (doi:10.2174/187569209788654005)
16. Peters SA. 2012 Physiologically-basedpharmacokinetic (PBPK) modeling and simulations:principles, methods, and applications in thepharmaceutical industry. New York, NY: John Wileyand Sons.
17. Dickschen K, Willmann S, Thelen K, Lippert J,Hempel G, Eissing T. 2012 Physiologically basedpharmacokinetic modeling of tamoxifen and itsmetabolites in women of different CYP2D6phenotypes provides new insight into the tamoxifenmass balance. Front. Pharmacol. 3, 92. (doi:10.3389/fphar.2012.00092)
18. Eissing T, Lippert J, Willmann S. 2012Pharmacogenomics of codeine, morphine, andmorphine-6-glucuronide: model-based analysis ofthe influence of CYP2D6 activity, UGT2B7 activity,renal impairment, and CYP3A4 inhibition. Mol.Diagn. Ther. 16, 43 – 53. (doi:10.2165/11597930-000000000-00000)
19. Poulin P et al. 2011 PHRMA CPCDC initiative onpredictive models of human pharmacokinetics, part5. Prediction of plasma concentration-time profilesin human by using the physiologically-basedpharmacokinetic modeling approach. J. Pharm. Sci.100, 4127 – 4157. (doi:10.1002/jps.22550)
20. Bouzom F, Ball K, Perdaems N, Walther B. 2012Physiologically based pharmacokinetic (PBPK)modelling tools: how to fit with our needs? Biopharm.Drug Dispos. 33, 55 – 71. (doi:10.1002/bdd.1767)
21. Chetty M, Li L, Rose R, Machavaram K, Jamei M,Rostami-Hodjegan A, Gardner I. 2014 Prediction of thepharmacokinetics, pharmacodynamics, and efficacy ofa monoclonal antibody, using a physiologically basedpharmacokinetic FcRn model. Front. Immunol. 5, 670.(doi:10.3389/fimmu.2014.00670)
22. Wittig U et al. 2012 SABIO-RK—database forbiochemical reaction kinetics. Nucleic Acids Res. 40,D790 – D796. (doi:10.1093/nar/gkr1046)
23. Thiele I et al. 2013 A community-driven globalreconstruction of human metabolism. Nat.Biotechnol. 31, 419 – 425. (doi:10.1038/nbt.2488)
24. Uhlen M et al. 2015 Proteomics. Tissue-based mapof the human proteome. Science 347, 1260419.(doi:10.1126/science.1260419)
25. Parkinson H et al. 2011 ArrayExpress update—anarchive of microarray and high-throughputsequencing-based functional genomics experiments.Nucleic Acids Res. 39, D1002 – D1004. (doi:10.1093/nar/gkq1040)
26. Sahoo S, Haraldsdottir HS, Fleming RM, Thiele I.2014 Modeling the effects of commonly used drugson human metabolism. FEBS J. 282, 297 – 317.(doi:10.1111/febs.13128)
27. Hucka M et al. 2003 The systems biology markuplanguage (SBML): a medium for representation andexchange of biochemical network models.Bioinformatics 19, 524 – 531. (doi:10.1093/bioinformatics/btg015)
28. Li C et al. 2010 BioModels database: an enhanced,curated and annotated resource for published
quantitative kinetic models. BMC Syst. Biol. 4, 92(doi:10.1186/1752-0509-4-92)
29. Le Novere N et al. 2005 Minimum informationrequested in the annotation of biochemical models(MIRIAM). Nat. Biotechnol. 23, 1509 – 1515. (doi:10.1038/nbt1156)
30. Le Novere N et al. 2009 The systems biologygraphical notation. Nat. Biotechnol. 27, 735 – 741.(doi:10.1038/nbt.1558)
31. Bateman A et al. 2015 UniProt: a hub for proteininformation. Nucleic Acids Res. 43, D204 – D212.(doi:10.1093/nar/gku989)
32. Degtyarenko K et al. 2008 ChEBI: a database andontology for chemical entities of biological interest.Nucleic Acids Res. 36, D344 – D350. (doi:10.1093/nar/gkm791)
33. Ashburner M et al. 2000 Gene ontology: tool for theunification of biology. The Gene OntologyConsortium. Nat. Genet. 25, 25 – 29. (doi:10.1038/75556)
34. Courtot M et al. 2011 Controlled vocabularies andsemantics in systems biology. Mol. Syst. Biol. 7, 543.(doi:10.1038/msb.2011.77)
35. Brazma A et al. 2001 Minimum information about amicroarray experiment (MIAME)—toward standardsfor microarray data. Nat. Genet. 29, 365 – 371.(doi:10.1038/ng1201-365)
36. Ratnam J et al. 2014 The application of the openpharmacological concepts triple store (open PHACTS)to support drug discovery research. PLoS ONE 9,e115460. (doi:10.1371/journal.pone.0115460)
37. ICRP. 2002 Basic anatomical and physiologicaldata for use in radiological protection: referencevalues. A report of age- and gender-relateddifferences in the anatomical and physiologicalcharacteristics of reference individuals. ICRPPublication 89. Ann. ICRP 32, 5 – 265. (doi:10.1016/S0146-6453(02)00021-0)
38. Safaei S. 2015 Simulating blood flow in ananatomical arterial network. PhD thesis, Universityof Auckland, New Zealand.
39. Hunter PJ, Pullan AJ, Smaill BH. 2003 Modelingtotal heart function. Annu. Rev. Biomed. Eng. 5,147 – 177. (doi:10.1146/annurev.bioeng.5.040202.121537)
40. Sinclair MD, Lee J, Cookson AN, Rivolo S, Hyde ER,Smith NP 2015 Measurement and modeling ofcoronary blood flow. WIREs Syst. Biol. Med. 7,335 – 356. (doi:10.1002/wsbm.1309)
41. LeGrice IJ, Smaill BH, Chai LZ, Edgar SG, Gavin JB,Hunter PJ. 1995 Laminar structure of the heart:ventricular myocyte arrangement and connectivetissue architecture in the dog. Am. J. Physiol. 269,H571 – H582.
42. Nielsen PM, Le Grice IJ, Smaill BH, Hunter PJ. 1991Mathematical model of geometry and fibrousstructure of the heart. Am. J. Physiol. 260,H1365 – H1378.
43. Ho H, Bartlett A, Hunter P. 2012 Geometricmodelling of patient-specific hepatic structuresusing cubic hermite elements. Abdom. ImagingComput. Clin. Appl. 7029, 264 – 271. (doi:10.1007/978-3-642-28557-8_33)
44. Ho H, Sorrell K, Bartlett A, Hunter P. 2013 Modelingthe hepatic arterial buffer response in the liver.Med. Eng. Phys. 35, 1053 – 1058. (doi:10.1016/j.medengphy.2012.10.008)
45. Schwen LO, Wei W, Gremse F, Ehling J, Wang L,Dahmen U, Preusser T. 2015 Algorithmicallygenerated rodent hepatic vascular trees in arbitrarydetail. J. Theor. Biol. 365, 289 – 300. (doi:10.1016/j.jtbi.2014.10.026)
46. Friebel A, Neitsch J, Johann T, Hammad S, HengstlerJG, Drasdo D, Hoehme S. 2015 TiQuant: software fortissue analysis, quantification and surfacereconstruction. Bioinformatics 31, 3234 – 3236.(doi:10.1093/bioinformatics/btv346)
47. Hoehme S et al. 2010 Prediction and validation ofcell alignment along microvessels as order principleto restore tissue architecture in liver regeneration.Proc. Natl Acad. Sci. USA 107, 10 371 – 10 376.(doi:10.1073/pnas.0909374107).
48. Holzhutter HG, Drasdo D, Preusser T, Lippert J,Henney AM. 2012 The virtual liver: amultidisciplinary, multilevel challenge for systemsbiology. WIREs Syst. Biol. Med. 4, 221 – 235. (doi:10.1002/wsbm.1158)
49. D’Alessandro LA, Hoehme S, Henney A, Drasdo D,Klingmuller U. 2015 Unraveling liver complexityfrom molecular to organ level: challenges andperspectives. Prog. Biophys. Mol. Biol. 117, 78 – 86.(doi:10.1016/j.pbiomolbio.2014.11.005)
50. Cheng LK, O’Grady G, Du P, Egbuji JU,Windsor JA, Pullan AJ. 2010 Gastrointestinal system.WIREs Syst. Biol. Med. 2, 65 – 79. (doi:10.1002/wsbm.19)
51. Du P, O’Grady G, Davidson JB, Cheng LK, Pullan AJ.2010 Multiscale modeling of gastrointestinalelectrophysiology and experimental validation. Crit.Rev. Biomed. Eng. 38, 225 – 254. (doi:10.1615/CritRevBiomedEng.v38.i3.10)
52. O’Grady G, Du P, Egbuji JU, Lammers WJ, Wahab A,Pullan AJ, Cheng LK, Windsor JA. 2009 A novellaparoscopic device for measuring gastrointestinalslow-wave activity. Surg. Endosc. 23, 2842 – 2848.(doi:10.1007/s00464-009-0515-2)
53. Cheng LK, Du P, O’Grady, G. 2013 Mapping andmodeling gastrointestinal bioelectricity: fromengineering bench to bedside. Physiology 28,310 – 317. (doi:10.1152/physiol.00022.2013)
54. Pal A, Indireshkumar K, Schwizer W, AbrahamssonB, Fried M, Brasseur JG. 2004 Gastric flow andmixing studied using computer simulation.Proc. R. Soc. Lond. B 271, 2587 – 2594. (doi:10.1098/rspb.2004.2886)
55. Lindfors L, Jonsson M, Weibull E, Brasseur JG,Abrahamsson B. 2015 Hydrodynamic effects on drugdissolution and deaggregation in the smallintestine—a study with felodipine as a modeldrug. J. Pharm. Sci. 104, 2969 – 2976. (doi:10.1002/jps.24487)
56. Howatson Tawhai M, Pullan AJ, Hunter PJ. 2000Generation of an anatomically based three-dimensional model of the conducting airways. Ann.Biomed. Eng. 28, 793 – 802. (doi:10.1114/1.1289457)

rsfs.royalsocietypublishing.orgInterface
F
12
on June 11, 2018http://rsfs.royalsocietypublishing.org/Downloaded from
57. Tawhai M, Clark A, Donovan G, Burrowes K.2011 Computational modeling of airway andpulmonary vascular structure and function:development of a ‘lung physiome’. Crit. Rev.Biomed. Eng. 39, 319 – 336. (doi:10.1615/CritRevBiomedEng.v39.i4.50)
58. Burrowes KS, Doel T, Brightling C. 2014Computational modeling of the obstructivelung diseases asthma and COPD. J. Transl.Med. 12(Suppl 2), S5. (doi:10.1186/1479-5876-12-S2-S5)
59. Wu T, Martens H, Hunter P, Mithraratne K. 2014Emulating facial biomechanics using multivariatepartial least squares surrogate models.
Int. J. Numer. Methods Biomed. Eng. 30,1103 – 1120. (doi:10.1002/cnm.2646)
60. Harnisch L, Matthews I, Chard J, Karlsson MO.2013 Drug and disease model resources: aconsortium to create standards and tools toenhance model-based drug development. CPTPharmacometrics Syst. Pharmacol. 2, e34. (doi:10.1038/psp.2013.10)
61. Hofmann-Apitius M, Alarcon-Riquelme ME,Chamberlain C, McHale D. 2015 Towards thetaxonomy of human disease. Nat. Rev. Drug Discov.14, 75 – 76. (doi:10.1038/nrd4537)
62. Chichester C, Digles D, Siebes R, Loizou A, Groth P,Harland L. 2015 Drug discovery FAQs: workflows for
answering multidomain drug discovery questions.Drug Discov. Today 20, 399 – 405. (doi:10.1016/j.drudis.2014.11.006)
63. de Bono B, Hoehndorf R, Wimalaratne S, Gkoutos G,Grenon P. 2011 The RICORDO approach tosemantic interoperability for biomedical dataand models: strategy, standards and solutions.BMC Res. Notes 4, 313. (doi:10.1186/1756-0500-4-313)
64. de Bono B, Grenon P, Sammut SJ. 2012 ApiNATOMY:a novel toolkit for visualizing multiscale anatomyschematics with phenotype-related information.Hum. Mutat. 33, 837 – 848. (doi:10.1002/humu.22065)
o
cus 6:20150094
on June 11, 2018http://rsfs.royalsocietypublishing.org/Downloaded from
Related Documents