A physical map of the human genome The International Human Genome Mapping Consortium* * A partial list of authors appears at the end of this paper. A full list is available as Supplementary Information. ............................................................................................................................................................................................................................................................................ The human genome is by far the largest genome to be sequenced, and its size and complexity present many challenges for sequence assembly. The International Human Genome Sequencing Consortium constructed a map of the whole genome to enable the selection of clones for sequencing and for the accurate assembly of the genome sequence. Here we report the construction of the whole-genome bacterial artificial chromosome (BAC) map and its integration with previous landmark maps and information from mapping efforts focused on specific chromosomal regions. We also describe the integration of sequence data with the map. The International Human Genome Sequencing Consortium (IHGSC) used a hierarchical mapping and sequencing strategy to construct the working draft of the human genome. This clone-based approach involves generating an overlapping series of clones that covers the entire genome. Each clone is ‘fingerprinted’ on the basis of the pattern of fragments generated by restriction enzyme digestion 1,2 . Clones are then selected for shotgun sequencing and the whole genome sequence is reconstructed by map-guided assembly of overlapping clone sequences 3 . The availability of the whole-genome clone-based map assisted the sequencing of the human genome in many respects. The fingerprinted BAC map made it possible to select clones for sequencing that would ensure comprehensive coverage of the genome and reduce sequencing redundancy. In addition, the challenge of sequence assembly was minimized by restricting random shotgun sequencing to individual clones. Furthermore, the clone-based map also enabled the identification of large seg- ments of the genome that are repeated, thereby simplifying the assembly. Many IHGSC centres had developed chromosomal maps and resources that were not integrated, so it was essential to have a unifying genome map to enable localization of clones, with respect to previously sequenced clones, before they were sequenced. The accurate fingerprinting and sizing of each clone enabled us to verify the accuracy of shotgun sequence 4 assembly of each clone. The human genome presented unique challenges for the devel- opment of a clone-based physical map. Its size of 3.2 gigabases (Gb), which is 25 times as large as any previously mapped genome, meant that proportionately more clones had to be analysed. Its greater complexity also made it more difficult to distinguish true overlaps, which was further complicated by the repeat-rich nature of the genome. Early efforts to construct clone-based regional and even chromosomal physical maps of the human genome using cosmid libraries derived from isolated human chromosomes met with limited success 5,6 . By contrast, maps based on sequence-tagged site (STS) landmarks provided greater coverage of the genome 7–9 , as did genetic maps based on variations in simple sequence repeats in STS landmarks 10,11 . The development of P1-artificial chromosome (PAC) 12 and bacterial artificial chromosome (BAC) 13 cloning sys- tems was pivotal to the success of the whole-genome map. They provided larger inserts, more stable clones and better coverage of the genome. Clone-based maps similar to that described here have been important in the sequencing of most large genomes, including those of Saccharomyces cerevisiae 1 , Caenorhabditis elegans 2 and Arabidopsis thaliana 14 . A clone-based map also contributed to the sequencing of the Drosophila melanogaster genome 15,16 and a combined mapping and sequencing strategy is being applied to the mouse genome 17,18 . This work illustrates the benefit of using the clone-based map in the assembly of the human genome sequence. Construction of the whole-genome BAC map The pilot phase of the sequencing project began in 1995, at which time efforts were renewed to develop clone-based maps covering specific regions of the genome. To construct these regional maps, we screened PAC and BAC clones for STS markers, fingerprinted the positive clones, integrated them into the existing maps, and selected the largest, intact clones with minimal overlap for sequencing. To keep pace with the ramping up of the sequencing effort in 1998, the ongoing efforts to construct the whole-genome BAC map were increased approximately tenfold. The whole-genome BAC map was constructed in several steps. First we collected fingerprint data for a large sample of random clones from a genome-wide BAC library. We then assembled the BAC map, first by using the fingerprint data to cluster highly related clones automatically, then by further refining them manually, and last by merging contigs with related clones at their ends. Finally, in parallel with construc- tion of the BAC map, we mapped the chromosomal positions of individual clones on the basis of landmarks from existing landmark maps. Fingerprinting the BAC clones In October 1998, we began fingerprinting 300,000 BACs from the RPCI-11 library 19 (http://www.chori.org/bacpac/). Redundancy of sampling was vital to achieve high continuity in the final map 14 . Assuming an average BAC insert size of 150,000 base pairs (bp) and a genome size of 3.2 Gb, this level of fingerprinting would provide roughly 15-fold coverage of the genome. The library was derived from male DNA, providing full coverage of all 24 human chromo- somes but with half as much coverage of the sex chromosomes as of the autosomes. Our experience with the library found it to be of high quality with uniformly large-insert clones, few non-recombi- nant clones and little cross-contamination of source plates. The RPCI-11 library was one of the first libraries to meet the informed consent criteria in accordance with the NHGRI policy for the Use of Human Subjects in Large Scale Sequencing (http://www.nhgri.nih. gov/Grant_info/Funding/Statements/RFA/Human_subjects.html). To meet the goal of fingerprinting 300,000 BAC clones in one year, we devised a tandem 121-lane agarose gel format, allowing the simultaneous electrophoresis of 50 standard ‘marker’ DNA lanes and of 192 BAC restriction digests (Fig. 1), thereby reducing the number of gels, without loss of restriction fragment size accuracy or fidelity of clone tracking (see Supplementary Information). With these and other improvements in the fingerprinting technology and resources, we increased throughput tenfold to process more than 20,000 fingerprints (which equates to approximately onefold clone coverage of the human genome) each week. We also sampled clones from the RPCI-13 and CT-C/D1 BAC libraries, which were con- structed using a different restriction enzyme (Table 1). This pro- vided differential sampling of the genome, given the different distribution of the restriction enzyme sites within the genome. In articles 934 NATURE | VOL 409 | 15 FEBRUARY 2001 | www.nature.com © 2001 Macmillan Magazines Ltd

Welcome message from author
This document is posted to help you gain knowledge. Please leave a comment to let me know what you think about it! Share it to your friends and learn new things together.
Transcript
A physical map of the human genomeThe International Human Genome Mapping Consortium*
* A partial list of authors appears at the end of this paper. A full list is available as Supplementary Information.............................................................................................................................................................................................................................................................................
The human genome is by far the largest genome to be sequenced, and its size and complexity present many challenges forsequence assembly. The International Human Genome Sequencing Consortium constructed a map of the whole genome to enablethe selection of clones for sequencing and for the accurate assembly of the genome sequence. Here we report the construction ofthe whole-genome bacterial arti®cial chromosome (BAC) map and its integration with previous landmark maps andinformation from mapping efforts focused on speci®c chromosomal regions. We also describe the integration of sequence datawith the map.
The International Human Genome Sequencing Consortium(IHGSC) used a hierarchical mapping and sequencing strategy toconstruct the working draft of the human genome. This clone-basedapproach involves generating an overlapping series of clones thatcovers the entire genome. Each clone is `®ngerprinted' on the basisof the pattern of fragments generated by restriction enzymedigestion1,2. Clones are then selected for shotgun sequencing andthe whole genome sequence is reconstructed by map-guidedassembly of overlapping clone sequences3.
The availability of the whole-genome clone-based map assistedthe sequencing of the human genome in many respects. The®ngerprinted BAC map made it possible to select clones forsequencing that would ensure comprehensive coverage of thegenome and reduce sequencing redundancy. In addition, thechallenge of sequence assembly was minimized by restrictingrandom shotgun sequencing to individual clones. Furthermore,the clone-based map also enabled the identi®cation of large seg-ments of the genome that are repeated, thereby simplifying theassembly. Many IHGSC centres had developed chromosomal mapsand resources that were not integrated, so it was essential to have aunifying genome map to enable localization of clones, with respectto previously sequenced clones, before they were sequenced. Theaccurate ®ngerprinting and sizing of each clone enabled us to verifythe accuracy of shotgun sequence4 assembly of each clone.
The human genome presented unique challenges for the devel-opment of a clone-based physical map. Its size of 3.2 gigabases (Gb),which is 25 times as large as any previously mapped genome, meantthat proportionately more clones had to be analysed. Its greatercomplexity also made it more dif®cult to distinguish true overlaps,which was further complicated by the repeat-rich nature of thegenome. Early efforts to construct clone-based regional and evenchromosomal physical maps of the human genome using cosmidlibraries derived from isolated human chromosomes met withlimited success5,6. By contrast, maps based on sequence-tagged site(STS) landmarks provided greater coverage of the genome7±9, as didgenetic maps based on variations in simple sequence repeats in STSlandmarks10,11. The development of P1-arti®cial chromosome(PAC)12 and bacterial arti®cial chromosome (BAC)13 cloning sys-tems was pivotal to the success of the whole-genome map. Theyprovided larger inserts, more stable clones and better coverage of thegenome.
Clone-based maps similar to that described here have beenimportant in the sequencing of most large genomes, includingthose of Saccharomyces cerevisiae1, Caenorhabditis elegans2 andArabidopsis thaliana14. A clone-based map also contributed tothe sequencing of the Drosophila melanogaster genome15,16 and acombined mapping and sequencing strategy is being applied tothe mouse genome17,18. This work illustrates the bene®t of usingthe clone-based map in the assembly of the human genomesequence.
Construction of the whole-genome BAC mapThe pilot phase of the sequencing project began in 1995, at whichtime efforts were renewed to develop clone-based maps coveringspeci®c regions of the genome. To construct these regional maps, wescreened PAC and BAC clones for STS markers, ®ngerprinted thepositive clones, integrated them into the existing maps, and selectedthe largest, intact clones with minimal overlap for sequencing.
To keep pace with the ramping up of the sequencing effort in1998, the ongoing efforts to construct the whole-genome BAC mapwere increased approximately tenfold. The whole-genome BACmap was constructed in several steps. First we collected ®ngerprintdata for a large sample of random clones from a genome-wide BAClibrary. We then assembled the BAC map, ®rst by using the®ngerprint data to cluster highly related clones automatically,then by further re®ning them manually, and last by merging contigswith related clones at their ends. Finally, in parallel with construc-tion of the BAC map, we mapped the chromosomal positions ofindividual clones on the basis of landmarks from existing landmarkmaps.
Fingerprinting the BAC clonesIn October 1998, we began ®ngerprinting 300,000 BACs from theRPCI-11 library19 (http://www.chori.org/bacpac/). Redundancy ofsampling was vital to achieve high continuity in the ®nal map14.Assuming an average BAC insert size of 150,000 base pairs (bp) anda genome size of 3.2 Gb, this level of ®ngerprinting would provideroughly 15-fold coverage of the genome. The library was derivedfrom male DNA, providing full coverage of all 24 human chromo-somes but with half as much coverage of the sex chromosomes as ofthe autosomes. Our experience with the library found it to be ofhigh quality with uniformly large-insert clones, few non-recombi-nant clones and little cross-contamination of source plates. TheRPCI-11 library was one of the ®rst libraries to meet the informedconsent criteria in accordance with the NHGRI policy for the Use ofHuman Subjects in Large Scale Sequencing (http://www.nhgri.nih.gov/Grant_info/Funding/Statements/RFA/Human_subjects.html).
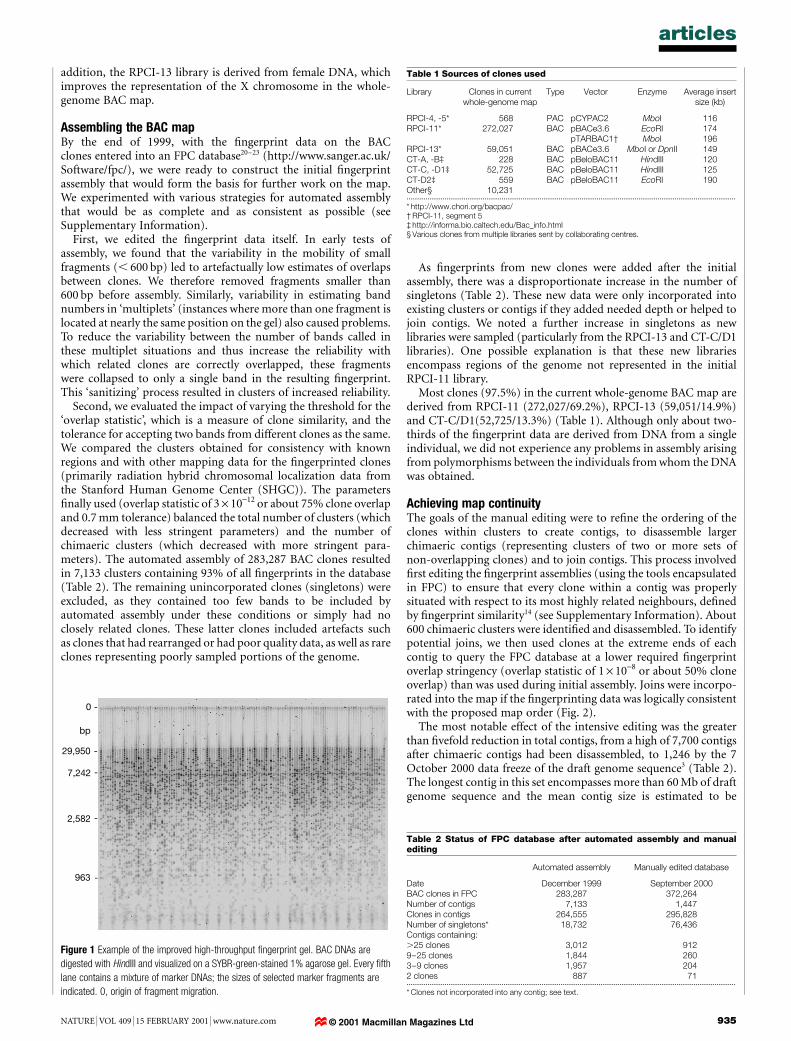
To meet the goal of ®ngerprinting 300,000 BAC clones in oneyear, we devised a tandem 121-lane agarose gel format, allowing thesimultaneous electrophoresis of 50 standard `marker' DNA lanesand of 192 BAC restriction digests (Fig. 1), thereby reducing thenumber of gels, without loss of restriction fragment size accuracy or®delity of clone tracking (see Supplementary Information). Withthese and other improvements in the ®ngerprinting technology andresources, we increased throughput tenfold to process more than20,000 ®ngerprints (which equates to approximately onefold clonecoverage of the human genome) each week. We also sampled clonesfrom the RPCI-13 and CT-C/D1 BAC libraries, which were con-structed using a different restriction enzyme (Table 1). This pro-vided differential sampling of the genome, given the differentdistribution of the restriction enzyme sites within the genome. In
articles
934 NATURE | VOL 409 | 15 FEBRUARY 2001 | www.nature.com© 2001 Macmillan Magazines Ltd
addition, the RPCI-13 library is derived from female DNA, whichimproves the representation of the X chromosome in the whole-genome BAC map.
Assembling the BAC mapBy the end of 1999, with the ®ngerprint data on the BACclones entered into an FPC database20±23 (http://www.sanger.ac.uk/Software/fpc/), we were ready to construct the initial ®ngerprintassembly that would form the basis for further work on the map.We experimented with various strategies for automated assemblythat would be as complete and as consistent as possible (seeSupplementary Information).
First, we edited the ®ngerprint data itself. In early tests ofassembly, we found that the variability in the mobility of smallfragments (, 600 bp) led to artefactually low estimates of overlapsbetween clones. We therefore removed fragments smaller than600 bp before assembly. Similarly, variability in estimating bandnumbers in `multiplets' (instances where more than one fragment islocated at nearly the same position on the gel) also caused problems.To reduce the variability between the number of bands called inthese multiplet situations and thus increase the reliability withwhich related clones are correctly overlapped, these fragmentswere collapsed to only a single band in the resulting ®ngerprint.This `sanitizing' process resulted in clusters of increased reliability.
Second, we evaluated the impact of varying the threshold for the`overlap statistic', which is a measure of clone similarity, and thetolerance for accepting two bands from different clones as the same.We compared the clusters obtained for consistency with knownregions and with other mapping data for the ®ngerprinted clones(primarily radiation hybrid chromosomal localization data fromthe Stanford Human Genome Center (SHGC)). The parameters®nally used (overlap statistic of 3 ´ 10-12 or about 75% clone overlapand 0.7 mm tolerance) balanced the total number of clusters (whichdecreased with less stringent parameters) and the number ofchimaeric clusters (which decreased with more stringent para-meters). The automated assembly of 283,287 BAC clones resultedin 7,133 clusters containing 93% of all ®ngerprints in the database(Table 2). The remaining unincorporated clones (singletons) wereexcluded, as they contained too few bands to be included byautomated assembly under these conditions or simply had noclosely related clones. These latter clones included artefacts suchas clones that had rearranged or had poor quality data, as well as rareclones representing poorly sampled portions of the genome.
As ®ngerprints from new clones were added after the initialassembly, there was a disproportionate increase in the number ofsingletons (Table 2). These new data were only incorporated intoexisting clusters or contigs if they added needed depth or helped tojoin contigs. We noted a further increase in singletons as newlibraries were sampled (particularly from the RPCI-13 and CT-C/D1libraries). One possible explanation is that these new librariesencompass regions of the genome not represented in the initialRPCI-11 library.
Most clones (97.5%) in the current whole-genome BAC map arederived from RPCI-11 (272,027/69.2%), RPCI-13 (59,051/14.9%)and CT-C/D1(52,725/13.3%) (Table 1). Although only about two-thirds of the ®ngerprint data are derived from DNA from a singleindividual, we did not experience any problems in assembly arisingfrom polymorphisms between the individuals from whom the DNAwas obtained.
Achieving map continuityThe goals of the manual editing were to re®ne the ordering of theclones within clusters to create contigs, to disassemble largerchimaeric contigs (representing clusters of two or more sets ofnon-overlapping clones) and to join contigs. This process involved®rst editing the ®ngerprint assemblies (using the tools encapsulatedin FPC) to ensure that every clone within a contig was properlysituated with respect to its most highly related neighbours, de®nedby ®ngerprint similarity14 (see Supplementary Information). About600 chimaeric clusters were identi®ed and disassembled. To identifypotential joins, we then used clones at the extreme ends of eachcontig to query the FPC database at a lower required ®ngerprintoverlap stringency (overlap statistic of 1 ´ 10-8 or about 50% cloneoverlap) than was used during initial assembly. Joins were incorpo-rated into the map if the ®ngerprinting data was logically consistentwith the proposed map order (Fig. 2).
The most notable effect of the intensive editing was the greaterthan ®vefold reduction in total contigs, from a high of 7,700 contigsafter chimaeric contigs had been disassembled, to 1,246 by the 7October 2000 data freeze of the draft genome sequence3 (Table 2).The longest contig in this set encompasses more than 60 Mb of draftgenome sequence and the mean contig size is estimated to be
articles
NATURE | VOL 409 | 15 FEBRUARY 2001 | www.nature.com 935
0 -
-
-
-
-
bp
29,950
7,242
2,582
963
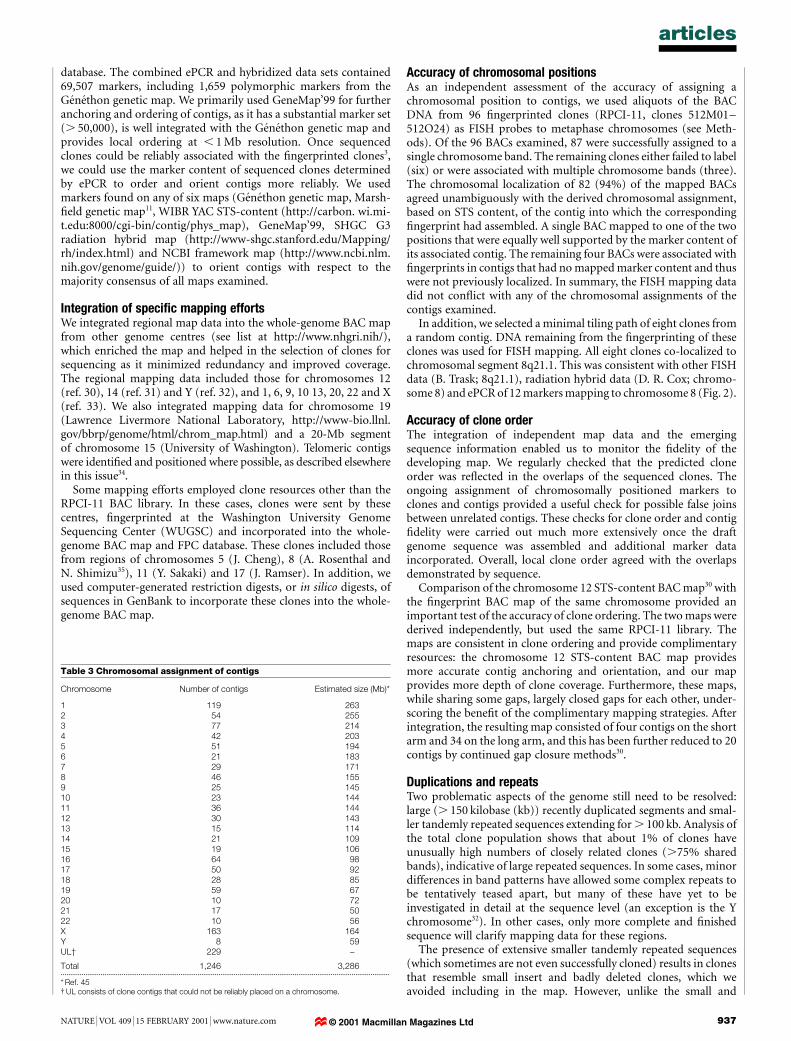
Figure 1 Example of the improved high-throughput ®ngerprint gel. BAC DNAs are
digested with HindIII and visualized on a SYBR-green-stained 1% agarose gel. Every ®fth
lane contains a mixture of marker DNAs; the sizes of selected marker fragments are
indicated. 0, origin of fragment migration.
Table 2 Status of FPC database after automated assembly and manualediting
Automated assembly Manually edited database
Date December 1999 September 2000BAC clones in FPC 283,287 372,264Number of contigs 7,133 1,447Clones in contigs 264,555 295,828Number of singletons* 18,732 76,436Contigs containing:.25 clones 3,012 9129±25 clones 1,844 2603±9 clones 1,957 2042 clones 887 71.............................................................................................................................................................................
* Clones not incorporated into any contig; see text.
Table 1 Sources of clones used
Library Clones in currentwhole-genome map
Type Vector Enzyme Average insertsize (kb)
RPCI-4, -5* 568 PAC pCYPAC2 MboI 116RPCI-11* 272,027 BAC pBACe3.6 EcoRI 174
pTARBAC1² MboI 196RPCI-13* 59,051 BAC pBACe3.6 MboI or DpnII 149CT-A, -B³ 228 BAC pBeloBAC11 HindIII 120CT-C, -D1³ 52,725 BAC pBeloBAC11 HindIII 125CT-D2³ 559 BAC pBeloBAC11 EcoRI 190Other§ 10,231.............................................................................................................................................................................* http://www.chori.org/bacpac/² RPCI-11, segment 5³ http://informa.bio.caltech.edu/Bac_info.html§ Various clones from multiple libraries sent by collaborating centres.
© 2001 Macmillan Magazines Ltd
around 2.9 Mb. At the time of writing, the number of contigs hadfallen further, to just 965 contigs.
As the contigs became accurately positioned and oriented withrespect to one another (see below) and with the emergence of thedraft sequence, end clones of adjacent contigs with overlappingsequence were recognized. After inspection of the sequence overlapto rule out shared sequence resulting from internal repeated seg-ments, about half of the candidate joins were well supported by the®ngerprint data and were integrated into the map. Another 62 hadunconvincing evidence of overlap based on ®ngerprints but weretagged as overlapping on the basis of sequence alone.
The contigs appeared to be appropriately distributed among thechromosomes on the basis of the expected size of the chromosomes.The number of contigs per chromosome varies with the size of thechromosomes and the efforts made at closure (Table 3). Chromo-somes 6, 7, 13, 14, 15, 20 and Y have relatively few remaining gaps,with 21, 29, 15, 21, 19, 10 and 8 contigs, respectively.
Integration of other map dataTo increase the utility of the whole-genome BAC map, we incorpo-rated various map data to anchor the contigs along the 24 chromo-somes. Using selected markers from the CEPH GeÂneÂthon geneticmap10, the GeneMap'99 genome-wide radiation hybrid map (http://www.ncbi.nlm.nih.gov/genemap/)24±26 and from plasmid library
sequences prepared from ¯ow-sorted chromosomes (SangerCentre, unpublished data), we hybridized 13,695 markers againstcolony ®lter replicas of the RPCI-11 library. This enabled us toposition 96,283 different BAC clones as genome anchor points forthe contigs.
In addition, because the RPCI-11 library was used for othergenome initiatives, much additional marker information was avail-able from other laboratories. Importantly, 9,018 STSs derived fromBAC end sequences were assigned to chromosomes (D. R. Cox,unpublished data), with many of these selected deliberately becausethey came from clones in unlocalized contigs. Although over 15% ofthe available BAC end sequences of the RPCI-11 library are reportedto be apparently mislabelled with respect to the microtitre welladdress from which they originated27, two or more independentlyderived BAC end positions reliably yielded the correct chromoso-mal assignment of many contigs. In addition, chromosomalassignment and integration of cytogenetic map positions wereachieved by utilizing 3,412 BACs mapped by ¯uorescence in situhybridization (FISH) data28.
As the working draft sequence accumulated, known markerswithin the sequence were readily identi®ed by electronic PCR(ePCR), a program that searches sequence for STSs by identifyingthe associated primer sequences in the correct orientation and withcorrect spacing29. These data were incorporated into the FPC
articles
936 NATURE | VOL 409 | 15 FEBRUARY 2001 | www.nature.com
a
b
c
d
e
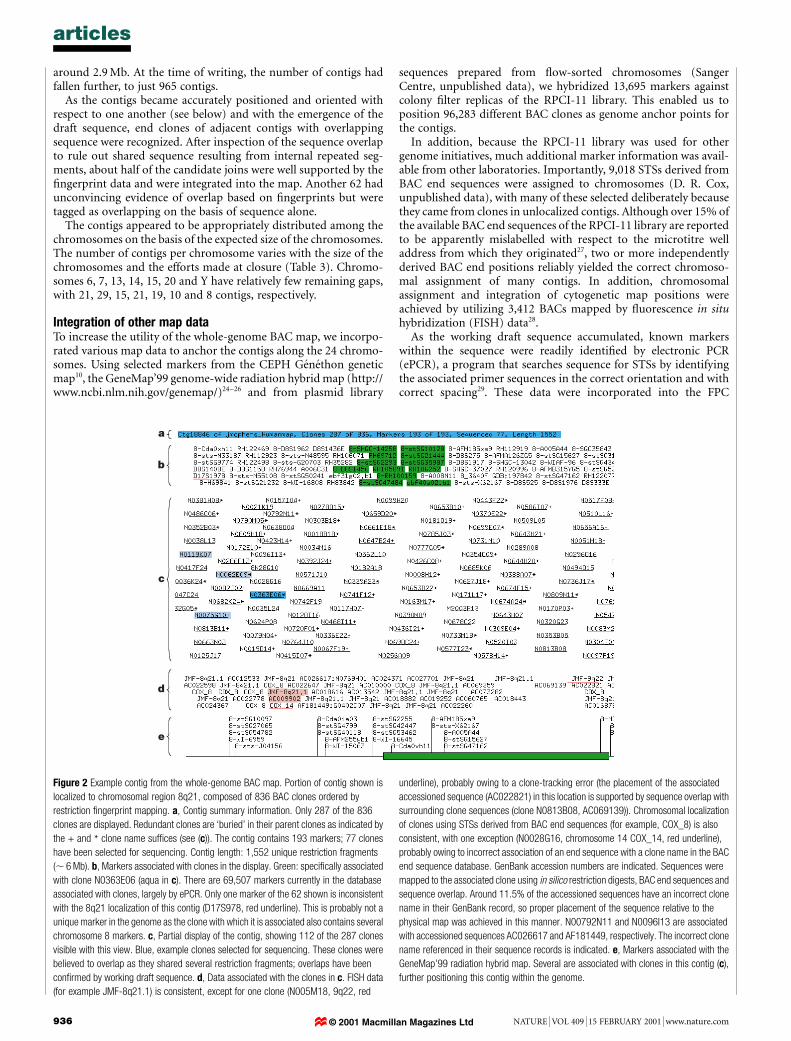
Figure 2 Example contig from the whole-genome BAC map. Portion of contig shown is
localized to chromosomal region 8q21, composed of 836 BAC clones ordered by
restriction ®ngerprint mapping. a, Contig summary information. Only 287 of the 836
clones are displayed. Redundant clones are `buried' in their parent clones as indicated by
the + and * clone name suf®ces (see (c)). The contig contains 193 markers; 77 clones
have been selected for sequencing. Contig length: 1,552 unique restriction fragments
(, 6 Mb). b, Markers associated with clones in the display. Green: speci®cally associated
with clone N0363E06 (aqua in c). There are 69,507 markers currently in the database
associated with clones, largely by ePCR. Only one marker of the 62 shown is inconsistent
with the 8q21 localization of this contig (D17S978, red underline). This is probably not a
unique marker in the genome as the clone with which it is associated also contains several
chromosome 8 markers. c, Partial display of the contig, showing 112 of the 287 clones
visible with this view. Blue, example clones selected for sequencing. These clones were
believed to overlap as they shared several restriction fragments; overlaps have been
con®rmed by working draft sequence. d, Data associated with the clones in c. FISH data
(for example JMF-8q21.1) is consistent, except for one clone (N005M18, 9q22, red
underline), probably owing to a clone-tracking error (the placement of the associated
accessioned sequence (AC022821) in this location is supported by sequence overlap with
surrounding clone sequences (clone N0813B08, AC069139)). Chromosomal localization
of clones using STSs derived from BAC end sequences (for example, COX_8) is also
consistent, with one exception (N0028G16, chromosome 14 COX_14, red underline),
probably owing to incorrect association of an end sequence with a clone name in the BAC
end sequence database. GenBank accession numbers are indicated. Sequences were
mapped to the associated clone using in silico restriction digests, BAC end sequences and
sequence overlap. Around 11.5% of the accessioned sequences have an incorrect clone
name in their GenBank record, so proper placement of the sequence relative to the
physical map was achieved in this manner. N00792N11 and N0096I13 are associated
with accessioned sequences AC026617 and AF181449, respectively. The incorrect clone
name referenced in their sequence records is indicated. e, Markers associated with the
GeneMap'99 radiation hybrid map. Several are associated with clones in this contig (c),
further positioning this contig within the genome.
© 2001 Macmillan Magazines Ltd
database. The combined ePCR and hybridized data sets contained69,507 markers, including 1,659 polymorphic markers from theGeÂneÂthon genetic map. We primarily used GeneMap'99 for furtheranchoring and ordering of contigs, as it has a substantial marker set(. 50,000), is well integrated with the GeÂneÂthon genetic map andprovides local ordering at , 1 Mb resolution. Once sequencedclones could be reliably associated with the ®ngerprinted clones3,we could use the marker content of sequenced clones determinedby ePCR to order and orient contigs more reliably. We usedmarkers found on any of six maps (GeÂneÂthon genetic map, Marsh-®eld genetic map11, WIBR YAC STS-content (http://carbon. wi.mi-t.edu:8000/cgi-bin/contig/phys_map), GeneMap'99, SHGC G3radiation hybrid map (http://www-shgc.stanford.edu/Mapping/rh/index.html) and NCBI framework map (http://www.ncbi.nlm.nih.gov/genome/guide/)) to orient contigs with respect to themajority consensus of all maps examined.
Integration of speci®c mapping effortsWe integrated regional map data into the whole-genome BAC mapfrom other genome centres (see list at http://www.nhgri.nih/),which enriched the map and helped in the selection of clones forsequencing as it minimized redundancy and improved coverage.The regional mapping data included those for chromosomes 12(ref. 30), 14 (ref. 31) and Y (ref. 32), and 1, 6, 9, 10 13, 20, 22 and X(ref. 33). We also integrated mapping data for chromosome 19(Lawrence Livermore National Laboratory, http://www-bio.llnl.gov/bbrp/genome/html/chrom_map.html) and a 20-Mb segmentof chromosome 15 (University of Washington). Telomeric contigswere identi®ed and positioned where possible, as described elsewherein this issue34.
Some mapping efforts employed clone resources other than theRPCI-11 BAC library. In these cases, clones were sent by thesecentres, ®ngerprinted at the Washington University GenomeSequencing Center (WUGSC) and incorporated into the whole-genome BAC map and FPC database. These clones included thosefrom regions of chromosomes 5 (J. Cheng), 8 (A. Rosenthal andN. Shimizu35), 11 (Y. Sakaki) and 17 (J. Ramser). In addition, weused computer-generated restriction digests, or in silico digests, ofsequences in GenBank to incorporate these clones into the whole-genome BAC map.
Accuracy of chromosomal positionsAs an independent assessment of the accuracy of assigning achromosomal position to contigs, we used aliquots of the BACDNA from 96 ®ngerprinted clones (RPCI-11, clones 512M01±512O24) as FISH probes to metaphase chromosomes (see Meth-ods). Of the 96 BACs examined, 87 were successfully assigned to asingle chromosome band. The remaining clones either failed to label(six) or were associated with multiple chromosome bands (three).The chromosomal localization of 82 (94%) of the mapped BACsagreed unambiguously with the derived chromosomal assignment,based on STS content, of the contig into which the corresponding®ngerprint had assembled. A single BAC mapped to one of the twopositions that were equally well supported by the marker content ofits associated contig. The remaining four BACs were associated with®ngerprints in contigs that had no mapped marker content and thuswere not previously localized. In summary, the FISH mapping datadid not con¯ict with any of the chromosomal assignments of thecontigs examined.
In addition, we selected a minimal tiling path of eight clones froma random contig. DNA remaining from the ®ngerprinting of theseclones was used for FISH mapping. All eight clones co-localized tochromosomal segment 8q21.1. This was consistent with other FISHdata (B. Trask; 8q21.1), radiation hybrid data (D. R. Cox; chromo-some 8) and ePCR of 12 markers mapping to chromosome 8 (Fig. 2).
Accuracy of clone orderThe integration of independent map data and the emergingsequence information enabled us to monitor the ®delity of thedeveloping map. We regularly checked that the predicted cloneorder was re¯ected in the overlaps of the sequenced clones. Theongoing assignment of chromosomally positioned markers toclones and contigs provided a useful check for possible false joinsbetween unrelated contigs. These checks for clone order and contig®delity were carried out much more extensively once the draftgenome sequence was assembled and additional marker dataincorporated. Overall, local clone order agreed with the overlapsdemonstrated by sequence.
Comparison of the chromosome 12 STS-content BAC map30 withthe ®ngerprint BAC map of the same chromosome provided animportant test of the accuracy of clone ordering. The two maps werederived independently, but used the same RPCI-11 library. Themaps are consistent in clone ordering and provide complimentaryresources: the chromosome 12 STS-content BAC map providesmore accurate contig anchoring and orientation, and our mapprovides more depth of clone coverage. Furthermore, these maps,while sharing some gaps, largely closed gaps for each other, under-scoring the bene®t of the complimentary mapping strategies. Afterintegration, the resulting map consisted of four contigs on the shortarm and 34 on the long arm, and this has been further reduced to 20contigs by continued gap closure methods30.
Duplications and repeatsTwo problematic aspects of the genome still need to be resolved:large (. 150 kilobase (kb)) recently duplicated segments and smal-ler tandemly repeated sequences extending for . 100 kb. Analysis ofthe total clone population shows that about 1% of clones haveunusually high numbers of closely related clones (.75% sharedbands), indicative of large repeated sequences. In some cases, minordifferences in band patterns have allowed some complex repeats tobe tentatively teased apart, but many of these have yet to beinvestigated in detail at the sequence level (an exception is the Ychromosome32). In other cases, only more complete and ®nishedsequence will clarify mapping data for these regions.
The presence of extensive smaller tandemly repeated sequences(which sometimes are not even successfully cloned) results in clonesthat resemble small insert and badly deleted clones, which weavoided including in the map. However, unlike the small and
articles
NATURE | VOL 409 | 15 FEBRUARY 2001 | www.nature.com 937
Table 3 Chromosomal assignment of contigs
Chromosome Number of contigs Estimated size (Mb)*
1 119 2632 54 2553 77 2144 42 2035 51 1946 21 1837 29 1718 46 1559 25 14510 23 14411 36 14412 30 14313 15 11414 21 10915 19 10616 64 9817 50 9218 28 8519 59 6720 10 7221 17 5022 10 56X 163 164Y 8 59UL² 229 ±
Total 1,246 3,286.............................................................................................................................................................................
* Ref. 45² UL consists of clone contigs that could not be reliably placed on a chromosome.
© 2001 Macmillan Magazines Ltd
deleted clones, tandem repeats are present in multiple independentclones that display a similar ®ngerprint pattern. Sequence analysisof some of these repeat sequences shows that they are related tocentromeric and ribosomal-repeat-related repeats, among others.
Gaps in the mapThe remaining gaps, currently fewer than 1,000, are likely to stemfrom a variety of causes. There may be overlaps between end clonesthat are too small to be detected by ®ngerprints and which will onlybe recognized once the end clones are sequenced. Gaps can also arisebecause of misassemblies in the map, particularly where a dupli-cated segment is inappropriately designated to represent just oneregion. Some gaps may be detected from analysis of other BAC DNAlibraries constructed using different restriction enzymes. Other gapsmay arise simply because clones are not recovered at suf®cientfrequencies in BAC or PAC large insert librariesÐclones spanningthese gaps could potentially be detected in YAC libraries or mightneed to be recovered using special approaches.
Coverage of the genomeTo estimate the fraction of the genome that was represented in thewhole-genome map, we analysed chromosomes 21 and 22. Usingin silico digest methods, we estimated the coverage of the ®ngerprintmap encompassing ®nished chromosomes 21 (ref. 36) and 22(ref. 37). Simulated 175-kb clones were created and digestedin silico from the contiguous sequences for these chromosomes;each clone overlapped by 40%. We compared these digestedsimulated clones against the FPC database at high ®ngerprintoverlap stringency. For chromosome 21, 316 simulated cloneswere created, of which 315 had at least 15 HindIII restrictionfragments; clones containing fewer bands are dif®cult to compare.Of the 315 simulated ®ngerprints, 309 (98%) matched a relatedclone in the whole-genome BAC ®ngerprint FPC database. Simi-larly, for chromosome 22, 308 simulated clones were created. Ofthose, 303 had more than 15 HindIII restriction fragments and,when compared to the entire FPC ®ngerprint database, 297 (98%)found a related clone. This analysis was repeated using a 210-kb insilico clone size with 90% overlap, with similar results. Each of thesechromosomes has four sequence gaps that are estimated to encom-pass 1.6% of the chromosome; therefore, the con®rmed clone cover-age of the euchromatic region of these chromosomes is around 96%.Collectively, these chromosomes represent approximately 3% of thegenome. It is probably reasonable to extrapolate that this level ofclone coverage will be found throughout the genome.
Clone selection for sequencingThe whole-genome BAC map was, and continues to be, used toselect clones for sequencing. We devised algorithms for automatichigh-throughput selection of BACs, which speci®cally choosesclones from contigs lacking sequenced clones (`seed clones') andclones that extend from already selected clones (see SupplementaryInformation). We took several issues into account when developingthese programs. First, we had to devise methods compatible with aconstantly and rapidly evolving map, which had considerable newinformation added to it each week. Second, we had to avoid clonesrepresenting genomic regions already sequenced from librariesother than RPCI-11. Third, we wished to select only clones notdeleted or otherwise rearranged and thus faithfully represent theunderlying genome.
The ®ngerprint map was used initially to identify nonredundantseed clones for sequencing when only a small portion of the RPCI-11 clones had been ®ngerprinted. As described above, we used allavailable forms of mapping data to localize the clones, and thus thecontig. Once an appropriate contig was identi®ed, the programlooked for the largest clone (smaller than 225 kb to avoid artefacts)in the contig. The program also checked the ®delity of the clone bycomparing its bands against other clones. We avoided end clones, as
they inevitably had bands that could not be con®rmed. In addition,a clone registry was developed (NCBI) to track clones selected forsequencing by any centre, and contigs with these clones were alsoavoided, as were contigs containing clones with similarities to otherclones in GenBank as detected by in silico digest.
The next step in automated clone selection was to extendprogressively from the seed clones using tools to search for appro-priately overlapping clones. Neighbouring clones were evaluatedusing the overlap statistic to provide a tentative clone order. Cloneswithin a speci®ed range of overlap statistic were evaluated for thetotal size of shared bands. The amount of acceptable overlap wasalso speci®ed (typically 25%). Any candidate in turn was evaluatedagainst an intermediately positioned clone to ensure that the over-lap was genuine and was compared to existing data using the cloneregistry and in silico digests to avoid redundancy.
These automated tools were used until late January 2000, whenthe manually evaluated contigs became available, allowing theselection of minimal tiling paths based on these clone orders. Inthe course of generating the working draft, more than 10,000 BACclones were selected for the sequencing pipelines at the WUGSC,Whitehead Institute for Biomedical Research and the StanfordGenome and Technology Center using these tools and the evolvingwhole-genome BAC map. A check of 518 overlaps between ®nishedclones selected both manually and through the automated methodsat WUGSC shows that they have an average overlap of 47.5 kb withtheir neighbours, or about 28%: this is an acceptable degree ofoverlap, given the relatively dense seeding that occurred, and theimportance placed on achieving coverage.
Sequence map of the human genomeAlthough the whole-genome BAC map was constructed primarilyto exploit the coverage of high-redundancy BAC libraries for use insequencing the human genome, it has served to integrate thesequences in GenBank38 with the physical map. This was neededto guide the long-range assembly of the working draft sequence andto identify all remaining gaps in this sequence map so that spanningclones could be selected. By using in silico digests to generatefragment size information that could be compared to the ®nger-prints in the FPC database, virtually all except for short sequences(such as individual cosmids) in GenBank were positioned onto thewhole-genome BAC map (see Methods). Additional information,such as BAC end sequence alignment and clone sequence overlap,was used to augment the in silico digest placement (if needed) and,in some cases, multiple sequences were positioned as part of largerassemblies of overlapping sequences (NT segments, NCBI). Fromthese analyses, we determined that as many as 11.5% of thesequences in GenBank had incorrect clone names referenced intheir GenBank records, probably owing mostly to data tracking andclone retrieval errors at the genome centres. A consequence of thesenaming errors was that many contigs contained clones associatedwith multiple markers determined by ePCR that mapped collec-tively to a single region of the genome, but were inconsistent withthe remaining clone-to-marker associations in the contig. This wasa direct result of incorrect clone names being associated withsequences and hence, incorrect assignment of the markers tothose clones in the FPC database. Mapping of sequences to theclone map corrected the naming errors and resolved seemingly outof place ePCR markers once the sequence in which they weredetected was properly situated within the ordered contigs. Wehave found that the correct clone can be retrieved 95% of thetime using the whole-genome BAC map, as judged by comparingthe ®ngerprint obtained for the retrieved clone with that in thedatabase. Some clones could not be retrieved owing to growthfailures, and others represent data-tracking errors within the ®n-gerprint set. The high level of redundancy of the whole-genomeBAC map allows a substitute clone to be readily selected to replacethe 5% of clones that are not recovered on the ®rst attempt.
articles
938 NATURE | VOL 409 | 15 FEBRUARY 2001 | www.nature.com© 2001 Macmillan Magazines Ltd
Once the sequences were aligned to the whole-genome BAC®ngerprint map, we used these data as a foundation for determininga nonredundant sequence path across the genome. The map orderand placement of the sequences with respect to the whole-genomeBAC map were considered in the sequence assembly to minimizeerrors due to potential false assignment of overlaps between relatedbut not identical sequences. The BAC map placements were used asa localization guide only and did not completely constrain thesequence assembly, to avoid any propagation of errors and impreci-sion of clone placement. The analysis of markers identi®ed withinthe genome sequence enables a detailed comparison of the whole-genome BAC map with other established landmark-content, radia-tion hybrid and genetic maps3. There was overall agreement betweenthe sequence assembly that overlays the whole-genome BAC mapand other existing maps, with local exceptions. In most instances,these local disagreements indicated the need simply to reverse thecurrent orientation of the underlying BAC contig, and this has beendone in the present version of the map.
ConclusionsThe whole-genome BAC map allowed the integration of a range ofdata, including FISH cytogenetic clone localizations, landmark dataobtained by PCR and hybridization screening, clones from otherlibraries with associated map data, and working draft and ®nishedclone sequence and associated ePCR landmarks. New data willcontinue to be incorporated into this growing database. Theentire FPC database of the human genome BAC ®ngerprintmap can be obtained from http://genome.wustl.edu/gsc/human/Mapping/index.shtml. A searchable AceDb39 version of the whole-genome BAC map is also accessible at http://genome.wustl.edu/ gsc/Search/db.shtml, and an overview of the map is available asSupplementary Information.
This clone-based map has been vital for the accurate assembly ofthe human genome sequence3. The BAC clones comprising theclone-based map also provide an integrated resource for analysis ofchromosome structure, comparative genome hybridization40 andfunctional genetics, including gene inactivation41. Together, thehuman genome clone map and the anchored sequence map providesynergistic resources for future analysis of the human genome. M
MethodsRegional approach to large-scale physical map construction
The general approach involved screening genomic BAC and PAC libraries by PCR or byprobe hybridization using overgo probes42 to identify clones corresponding to speci®c STSmarkers. Overgo probes are made by ®lling in the single-stranded overhangs of twooverlapping oligonucleotides using radiolabelled nucleotides and Klenow polymerase.Typically, we used two 24-mers overlapping by 8 bp to generate a radiolabelled double-stranded 40-mer. Overgo probes were arranged in three-dimensional arrays with sixprobes on each axis (giving 216 probes each). A ®ve-directional pooling strategy allowedresolution of 80±90% of all markers with only 30 hybridizations. More than 25,000 humanand mouse markers have been associated with BACs using this probe type at the WUGSC(J. McPherson). Once identi®ed, ®ngerprints were generated from marker-positive clonesusing HindIII restriction enzyme digests with fragment separation on 1% agarose gels43,analysed using Image (http://www.sanger.ac.uk/Software/Image/)20,21 and the ®ngerprintsexamined manually within FPC to build contigs and to select clones for sequencing thatspan contigs. Manual editing of the automated band calls was required because ofinconsistencies in band identi®cation.
Fluorescence in situ hybridization
Probes were generated from aliquots of the BAC DNA used to generate the HindIII®ngerprints using the Prime-it Fluor labelling kit (Stratagene), which incorporates ¯uor-12-dUTP into the probe fragments by random priming. Probes were hybridized tochromosome spreads on slides with competitor DNA present. Slides were processedessentially according to standard methods44. Data were collected and analysed using a ZeissAxiophot microscope equipped with the Genus camera setup and software (AppliedImaging Corporation).
Integration of sequenced clones using synthetic ®ngerprints from in silico
digests
BAC-sized clones were simulated from ®nished contiguous sequenced regions of DNA.
The sequences were cut into 175-kb fragments each with 40% overlap with the previoussegments. Bands less than 600 bp were then removed from consideration to be consistentwith the ®ngerprint data. Fingerprint data were converted from mobilities to sizes andclones from the ®ngerprinting effort could then be directly compared to sequenced clonesfrom any library or group (when comparing size data, the FPC tolerance variable was set to10). For clones that were not ®nished, each contig of the sequence was digested and all endfragments were removed. The remaining fragments were summed to create an in silicodigest for un®nished clones.
Received 28 November; accepted 27 December 2000.
1. Olson, M. V. et al. Random-clone strategy for genomic restriction mapping in yeast. Proc. Natl Acad.
Sci. USA 83, 7826±7830 (1986).
2. Coulson, A., Sulston, J., Brenner, S. & Karn, J. Towards a physical map of the genome of the nematode
Caenorhabditis elegans. Proc. Natl Acad. Sci. USA 83, 7821±7825 (1986).
3. International Human Genome Sequencing Consortium. Initial sequencing and analysis of the human
genome. Nature 409, 860±921 (2001).
4. Wilson, R. K. & Mardis, E. R. in Analyzing DNA (eds Birren, B., Green, E. D., Klapholz, S., Myers, R. M.
& Roskams, J.) 398±454 (Cold Spring Harbor Laboratory Press, Cold Spring Harbor, New York, 1997).
5. Doggett, N. A. et al. An integrated physical map of human chromosome 16. Nature 377, 335±365
(1995).
6. Ashworth, L. K. et al. An integrated metric physical map of human chromosome 19. Nature Genet. 11,
422±427 (1995).
7. Crollius, H. R. et al. An integrated YAC map of the human X chromosome. Genome Res. 6, 943±955
(1996).
8. Bouffard, G. G. et al. A physical map of human chromosome 7: an integrated YAC contig map with
average STS spacing of 79 kb. Genome Res. 7, 673±692 (1997).
9. Whitehead Institute for Biomedical Research. YAC STS-content map of the human genome (cited
October 2000) hhttp://carbon.wi.mit.edu:8000/cgi-bin/contig/phys_mapi (1997).
10. Dib, C. et al. A comprehensive genetic map of the human genome based on 5,264 microsatellites.
Nature 380, 152±154 (1996).
11. Broman, K. W., Murray, J. C., Shef®eld, V. C., White, R. L. & Weber, J. L. Comprehensive human
genetic maps: individual and sex-speci®c variation in recombination. Am. J. Hum. Genet. 63, 861±869
(1998).
12. Ioannou, P. A. et al. A new bacteriophage P1-derived vector for the propagation of large human DNA
fragments. Nature Genet. 6, 84±89 (1994).
13. Shizuya, H. et al. Cloning and stable maintenance of 300-kilobase-pair fragments of human DNA in
Escherichia coli using an F-factor-based vector. Proc. Natl Acad. Sci. USA 89, 8794±8797 (1992).
14. Marra, M. et al. A map for sequence analysis of the Arabidopsis thaliana genome. Nature Genet. 22,
265±270 (1999).
15. Adams, M. D. et al. The genome sequence of Drosophila melanogaster. Science 287, 2185±2195 (2000).
16. Hoskins, R. A. et al. A BAC-based physical map of the major autosomes of Drosophila melanogaster
[published erratum appears in Science 288, 1751 (2000)]. Science 287, 2271±2274 (2000).
17. Pennisi, E. Genomics. Mouse sequencers take up the shotgun. Science 287, 1179±1181 (2000).
18. Bouck, J. B., Metzker, M. L. & Gibbs, R. A. Shotgun sample sequence comparisons between mouse and
human genomes. Nature Genet. 25, 31±33 (2000).
19. Osoegawa, K. et al. A bacterial arti®cial chromosome library for sequencing the complete human
genome. Genome Res. (in the press).
20. Sulston, J. et al. Software for genome mapping by ®ngerprinting techniques. Comput. Appl. Biosci. 4,
125±132 (1988).
21. Sulston, J., Mallett, F., Durbin, R. & Horsnell, T. Image analysis of restriction enzyme ®ngerprint
autoradiograms. Comput. Appl. Biosci. 5, 101±106 (1989).
22. Soderlund, C., Humphray, S., Dunham, A. & French, L. Contigs built with ®ngerprints, markers, and
FPC V4.7. Genome Res. 10, 1772±1787 (2000).
23. Soderlund, C., Longden, I. & Mott, R. FPC: a system for building contigs from restriction
®ngerprinted clones. Comput. Appl. Biosci. 13, 523±535 (1997).
24. Schuler, G. D. et al. A gene map of the human genome. Science 274, 540±546 (1996).
25. Deloukas, P. et al. A physical map of 30,000 human genes. Science 282, 744±746 (1998).
26. The International Radiation Hybrid Mapping Consortium. A new gene map of the human genome:
GeneMap'99. (cited October 2000) hhttp://www.ncbi.nlm.nih.gov/genemapi (1999).
27. Zhao, S. et al. Human BAC ends quality assessment and sequence analyses. Genomics 63, 321±332
(2000).
28. The BAC Resource Consortium. Integration of autogenetic landmarks into the draft sequence of the
human genome. Nature 409, 953±958 (2001).
29. Schuler, G. D. Electronic PCR: bridging the gap between genome mapping and genome sequencing.
Trends Biotechnol. 16, 456±459 (1998).
30. Montgomery, K. et al. A high-resolution map of human chromosome 12. Nature 409, 945±946
(2001).
31. Bruls, T. et al. A physical map of human chromosome 14. Nature 409, 947±948 (2001).
32. Tilford, C. A. et al. A physical map of the human Y chromosome. Nature 409, 943±945 (2001).
33. Bentley, D. R. et al. The physical maps for sequencing human chromosomes 1, 6, 9, 10, 13, 20 and X.
Nature 409, 942±943 (2001).
34. Reithman, H. C. et al. Integration of telomere sequences with the draft human genome sequences.
Nature 409, 948±951 (2001).
35. Asakawa, S. et al. Human BAC library: construction and rapid screening. Gene 191, 69±79 (1997).
36. The chromosome 21 mapping and sequencing consortium. The DNA sequence of human chromo-
some 21. Nature 405, 311±319 (2000).
37. Dunham, I. et al. The DNA sequence of human chromosome 22. Nature 402, 489±495 (1999).
38. Benson, D. A. et al. GenBank. Nucleic Acids Res. 28, 15±18 (2000).
39. Eeckman, F. H. & Durbin, R. ACeDB and macace. Methods Cell Biol. 48, 583±605 (1995).
40. Pinkel, D. et al. High resolution analysis of DNA copy number variation using comparative genomic
hybridization to microarrays. Nature Genet. 20, 207±211 (1998).
41. Capecchi, M. R. Choose your target. Nature Genet. 26, 159±161 (2000).
42. Ross, M. T., LaBrie, S., McPherson, J. & Stanton, V. P. in Current Protocols in Human Genetics (eds
Dracopoli, N. C. et al.) 5.6.1±5.6.5 (Wiley, New York, 1999).
articles
NATURE | VOL 409 | 15 FEBRUARY 2001 | www.nature.com 939© 2001 Macmillan Magazines Ltd
43. Marra, M. A. et al. High throughput ®ngerprint analysis of large-insert clones. Genome Res. 7, 1072±
1084 (1997).
44. Lichter, P., Boyle, A. L., Cremer, T. & Ward, D. C. Analysis of genes and chromosomes by nonisotopic
in situ hybridization. Genet. Anal. Tech. Appl. 8, 24±35 (1991).
45. Morton, N. E. Parameters of the human genome. Proc. Natl Acad. Sci. USA 88, 7474±7476
(1991).
Supplementary Information is available on Nature's World-Wide Web site(http://www.nature.com) or as paper copy from the London editorial of®ce of Nature.
Acknowledgements
We thank everyone who has contributed to mapping the human genome by providing datato GenBank and other publicly accessible web sites. As much as possible, these data havebeen incorporated into the map presented here. The ®ngerprinting project was funded as
part of the Human Genome Project sequencing initiative of the NHGRI. The Keio groupwas supported in part by the Fund for Human Genome Sequencing Project from the JSTand the Fund for `̀ Research for the Future'' Program from the Japan Society for thePromotion of Science. The RIKEN GSC group is supported by the Special Fund forHuman Genome Sequencing from Science and Technology Agency, Japan and a Grant-in-Aid Scienti®c Research on Priority Area, `̀ Genome Science'' from Monbusho, Japan.Multiple US groups were funded by NIH/NCI and DOE. The MPIMG acknowledge grantsfrom the Max-Planck-Society and the Federal German Ministry of Education, Researchand Technology (BMBF) through Projekttraeger DLR, in the framework of the GermanHuman Genome Project. Data management throughout the project was facilitated byusing a suitably modi®ed AceDb database (R. Durbin and J. Thierry-Mieg). For acomplete list of all authors, see Supplementary Information.
Correspondence and requests for materials should be addressed to J.D.M.(e-mail: [email protected]).
articles
940 NATURE | VOL 409 | 15 FEBRUARY 2001 | www.nature.com
The International Human Genome Mapping Consortium*
Washington University School of Medicine, Genome SequencingCenter: John D. McPherson1, Marco Marra1*, LaDeana Hillier1,Robert H. Waterston1, Asif Chinwalla1, John Wallis1,Mandeep Sekhon1, Kristine Wylie1, Elaine R. Mardis1,Richard K. Wilson1, Robert Fulton1, Tamara A. Kucaba1,Caryn Wagner-McPherson1 & William B. Barbazuk1
Wellcome Trust Genome Campus: Simon G. Gregory2,Sean J. Humphray2, Lisa French2, Richard S. Evans2, Graeme Bethel2,Adam Whittaker2, Jane L. Holden2, Owen T. McCann2,Andrew Dunham2, Carol Soderlund2*, Carol E. Scott2 &David R. Bentley2
National Center for Biotechnology Information: Gregory Schuler3,Hsiu-Chuan Chen3 & Wonhee Jang3
National Human Genome Research Insititute: Eric D. Green4,Jacquelyn R. Idol4 & Valerie V. Braden Maduro4
Albert Einstein College of Medicine: Kate T. Montgomery5,Eunice Lee5, Ashley Miller5, Suzanne Emerling5 & Raju Kucherlapati5
Baylor College of Medicine, Human Genome Sequencing Center:Richard Gibbs6, Steve Scherer6, J. Harley Gorrell6, Erica Sodergren6,Kerstin Clerc-Blankenburg6, Paul Tabor6, Susan Naylor7 &Dawn Garcia7
Roswell Park Cancer Institute: Pieter J. de Jong8*,Joseph J. Catanese8*, Norma Nowak8 & Kazutoyo Osoegawa8*
Multimegabase Sequencing Center: Shizhen Qin9, Lee Rowen9,Anuradha Madan9, Monica Dors9 & Leroy Hood9
Fred Hutchinson Cancer Research Institute: Barbara Trask10,Cynthia Friedman10 & Hillary Massa10
The Children's Hospital of Philadelphia: Vivian G. Cheung11,Ilan R. Kirsch12, Thomas Reid12 & Raluca Yonescu12
Genoscope: Jean Weissenbach13, Thomas Bruls13 & Roland Heilig13
US DOE Joint Genome Institute: Elbert Branscomb14, Anne Olsen14,Norman Doggett14, Jan-Fang Cheng14 & Trevor Hawkins14
Stanford Human Genome Center and Department of Genetics:Richard M. Myers15, Jin Shang15, Lucia Ramirez15, Jeremy Schmutz15,Olivia Velasquez15, Kami Dixon15, Nancy E. Stone15 & David R. Cox15
University of California, Santa Cruz: David Haussler16,17,W. James Kent18, Terrence Furey17, Sanja Rogic17 & Scot Kennedy19
British Columbia Cancer Research Centre: Steven Jones20
Department of Genome Analysis, Institute of MolecularBiotechnology: Andre Rosenthal21, Gaiping Wen21,Markus Schilhabel21, Gernot Gloeckner21, Gerald Nyakatura21*,Reiner Siebert22 & Brigitte Schlegelberger22
Departments of Human Genetics and Pediatrics, University ofCalifornia: Julie Korenberg23 & Xiao-Ning Chen23
RIKEN Genomic Sciences Center: Asao Fujiyama24,Masahira Hattori24, Atsushi Toyoda24, Tetsushi Yada24,Hong-Seok Park24 & Yoshiyuki Sakaki24
Department of Molecular Biology, Keio University School ofMedicine: Nobuyoshi Shimizu25, Shuichi Asakawa25,Kazuhiko Kawasaki25, Takashi Sasaki25, Ai Shintani25,Atsushi Shimizu25, Kazunori Shibuya25, Jun Kudoh25 &Shinsei Minoshima25
Max-Planck-Institute for Molecular Genetics: Juliane Ramser26,Peter Seranski26,27, Celine Hoff26,27, Annemarie Poustka26,27,Richard Reinhardt26 & Hans Lehrach26
1, Washington University School of Medicine, Genome Sequencing Center,
Department of Genetics, 4444 Forest Park Boulevard, St. Louis, Missouri 63108,
USA; 2, Wellcome Trust Genome Campus, Hinxton, Cambridge, CB10 1SA, UK;
3, National Center for Biotechnology Information, National Institutes of Health,Bethesda, Maryland 20894, USA; 4, National Human Genome Research Institute,
National Institutes of Health, Bethesda, Maryland 20892, USA; 5, Department of
Molecular Genetics, Albert Einstein College of Medicine, 1300 Morris Park
Avenue, Bronx, New York 10461, USA; 6, Baylor College of Medicine, HumanGenome Sequencing Center, Houston, Texas, USA; 7, University of Texas,
San Antonio, Texas, USA; 8, Roswell Park Cancer Institute, Buffalo, New York
14263, USA; 9, Multimegabase Sequencing Center, Institute for Systems Biology,Seattle, Washington 98105, USA; 10, Division of Human Biology, Fred
Hutchinson Cancer Research Institute, Seattle, Washington 98109, USA;
11, Department of Pediatrics, The Children's Hospital of Philadelphia, University
of Pennsylvania, Philadelphia, Pennsylvania 19104, USA; 12, GeneticsDepartment, Medicine Branch, National Cancer Institute, Washington DC, USA;
13, Genoscope, Centre National de SeÂquencage, 2 Rue Gaston CreÂmieux, CP 5706,
91057 Evry, France; 14, US DOE Joint Genome Institute, Walnut Creek,
California, USA; 15, Stanford Human Genome Center and Department ofGenetics, Stanford University School of Medicine, Stanford, California 94305,
USA; 16, Howard Hughes Medical Institute, University of California, Santa Cruz,
Santa Cruz, California 95064, USA; 17, Department of Computer Science,
University of California, Santa Cruz, Santa Cruz, California 95064, USA;18, Department of Biology, University of California, Santa Cruz, Santa Cruz,
California 95064, USA; 19, Department of Mathematics, University of California,
Santa Cruz, Santa Cruz, California 95064, USA; 20, British Columbia CancerResearch Centre, 600 West 10th Avenue, Room 3427, Vancouver, British Columbia
V5Z 4E6, Canada; 21, Dept. of Genome Analysis, Institute of Molecular
Biotechnology, Beutenbergstrasse 11, D-07745 JENA, Germany; 22, Institute of
Human Genetics, University of Kiel, Germany; 23, Departments of HumanGenetics and Pediatrics, University of California, Los Angeles, California, USA;
© 2001 Macmillan Magazines Ltd

articles
NATURE | VOL 409 | 15 FEBRUARY 2001 | www.nature.com 941
24, RIKEN Genomic Sciences Center, 1-7-22 Suehiro-cho, Tsurumi-ku,
Yokohama 230-0045, Japan; 25, Department of Molecular Biology, Keio
University School of Medicine, 35 Shinanomachi Shinjuku-ku, Tokyo 160-8582,
Japan; 26, Max Planck Institute for Molecular Genetics, Ihnestrasse 73, D-14195,Berlin, Germany; 27, Abteilung Molekulare Genomanalyse, Deutsches
Krebstorschungszentrum, Im Neuenheimer Feld 280, 69120, Heidelberg,
Germany.
* Present addresses: British Columbia Cancer Research Centre, 600 West 10th
Avenue, Room 3427, Vancouver, British Columbia V5Z 4E6, Canada (M.M.);
Clemson University Genome Institute, 100 Jordan Hall, Clemson University,
Clemson, South Carolina 29634-5727, USA (C.S.); Children's Hospital OaklandResearch Institute, BACPAC Resources, Oakland, California 94609, USA and P®zer
Global Research & Development, Alameda Laboratories, Alameda, California
94502 USA (P.J.d.J., J.J.C., K.O.); MWG-Biotech AG, Ebersberg, Germany (G.N.).
© 2001 Macmillan Magazines Ltd
A physical map of the human genome � supplementalinformation and detail.
The International Human Genome Mapping Consortium*
*Complete author list.
Regional approach to large-scale map physical map construction.
Following the positional cloning model, most centers employed sequence tagged site(STS)1
landmark-content maps to identify regional markers suitable for isolating clones.� Once identified,
regional clones were characterized by either STS-content alone or in conjunction with restriction
enzyme digest fingerprinting methods and assembled into contigs. �As an example, the availability
of a high-quality, high-resolution yeast artificial chromosome (YAC)2 STS-content map of
chromosome 73 made it a logical first target for the Washington University Genome Sequencing
Center (WUGSC) human genome sequencing pilot project.� In early 1996 the WUGSC began
experimenting with an STS-driven clone identification paradigm using collective markers from
approximately one megabase intervals simultaneously for clone identification.� Initially, clones from
a Genome Systems BAC library (Human BAC Release I; http://www.incyte.com/reagents/index.shtml) and
from the early California Technical Institute BAC library (http://informa.bio.caltech.edu
/Bac_info.html) were identified by the PCR using specific STSs in the laboratory of Eric Green,
(NHGRI) and the well locations of STS-positive clones were communicated to the mapping group at
the WUGSC.� Simultaneously, methods for high-throughput hybridization-based BAC filter
screening were developed at the WUGSC (J. McPherson).� The general approach involved
screening genomic BAC and PAC libraries by hybridization using overgo probes4 to identify clones
corresponding to specific STS markers. Overgo probes are made by filling in the single-stranded
overhangs of two overlapping oligonucleotides using radiolabeled nucleotides and Klenow
polymerase.� Typically, two 24mers overlapping by 8 bp were used to generate a radiolabeled
double-stranded 40mer.� Overgo probes were arranged in three-dimensional arrays with 6 probes on
� Description of the layout of the BACs onto the genome http://www.nature.com/nature/journal/v409/n6822/extref/40993...
1 of 23 10/15/13 10:42 AM
each axis (6x6x6=216 probes each).� A five directional pooling strategy allowed resolution of
80-90% of all markers with only 30 hybridizations.� To date, greater than 25,000 human and mouse
markers have been associated with BACs using this probe type at the WUGSC (J. McPherson).�
These efforts targeted the Genome Systems BAC library and the RPCI-4 and RPCI-5 PAC libraries
constructed by P. de Jong (http://www.chori.org/bacpac/).� Evolution of the BAC filter screening
method resulted in a procedure capable of simultaneous multiplex hybridization of 36 overgo4 probes
at a rate of 450 markers weekly.� Once identified, BAC clones were retrieved from 384-well
glycerol stocks and colony purified by re-streaking on agar plates.� Individual colonies were
cultured and DNA purified in 96-well format.� DNA was digested with HindIII, the resulting
restriction products resolved by agarose gel electrophoresis and analyzed using the FPC fingerprint
assembly software package5,6.� Subsequent efforts utilizing this strategy focused on chromosomes 2
and Y.
Whole Genome BAC map
To generate fingerprint maps of the Caenorhabditis briggsae and Arabidopsis thaliana
genomes, we had evolved the capacity to produce weekly approximately 2,000 BAC fingerprints with
a team of six technicians.� Each gel analyzed consisted of 40 BACs and 11 standard �marker�
DNA lanes.� We calculated that to achieve our aim of 300,000 human BAC fingerprints using this
gel technology would require 7,500 gels.� We devised a tandem 121-lane agarose gel format,
allowing the simultaneous electrophoresis of 50 standard �marker� DNA lanes and of 192 BAC
restriction digests, thereby reducing the number of gels required.� This system, with the increased
density of fingerprint information on the gels, would produce the target 300,000 fingerprints in only
1,600 gels.� We verified that the new agarose gel format produced accurate fingerprints by
comparing fragment sizes between clones prepped and digested in duplicate and by fingerprinting
previously sequenced clones and comparing the in silico digests of the sequence to the agarose gel
fingerprints as shown in Figures 1a and 1b, respectively.� With these and other improvements in the
fingerprinting technology, and with addition of staff, throughput rose from 2,000 fingerprints weekly
� Description of the layout of the BACs onto the genome http://www.nature.com/nature/journal/v409/n6822/extref/40993...
2 of 23 10/15/13 10:42 AM
to a high of more than 20,000 weekly, the latter number representing approximately one human
genome equivalent of fingerprinted DNA produced each week.� The majority of the clones
fingerprinted were from 3 libraries, RPCI-11, RPCI-13 and CT-C/D1.� The fingerprint
characteristics of the clones from these libraries are listed in Table 1.
Manipulation of fingerprint data
Due to considerable variability in the mobility of small fragments and that these small fragments wereinconsistently identified during subsequent gel image analysis.� Hence, fragments smaller than 600base pairs (corresponding to a an Image mobility value greater than 3590) were removed prior toassembly.� In addition, because of the difficulty in determining multiplets (cases where more thanone fragment is located at nearly the same position on the gel), all fragments within mobilities of 8were collapsed to only a single band in the resulting fingerprint.� This �sanitizing� processresulted in assemblies of increased reliability.� Assembly parameters were determined empiricallyby changing various build parameters to obtain assemblies and then evaluating them for consistencyusing other mapping data associated with clones in the assembly (primarily radiation hybrid (RH)chromosomal localization data from the Stanford Human Genome Center (SHGC; D.R. Cox)).�After assembly of the fingerprints with each set of parameters, the number of chimeric assemblies wasdetected by the presence of conflicting map information affixed to clones in the assembly.� Optimalassembly parameters minimizing both the total number of assemblies and the number of chimericassemblies are given in Table 2.� Incremental assemblies of the fingerprints accumulated throughoutthe project are shown in Figure 2.
Using the FPC parameter values listed in Table 2, an automated assembly of the 283,287
clones resulted in 7,133 assemblies that contained 93% of all fingerprints in the database (December
1999).� The remaining unincorporated clones (i.e. singletons) were excluded as they contained
fewer than the 3 fragments specified as the minimum number required for assembly (min band = 3) or
contained fewer than the total of 6 fragments that were empirically determined necessary for
automated assembly under these conditions.� Although the initial automated assemblies produced
when using the FPC parameter values in Table 2 were generally reliable with respect to the
�binning� of related clones, determination of the correct relative order of the clones within the
assemblies remained a manual task.
Achieving map continuity by manual editing of assemblies
The initial goals of the manual assembly editing were to refine the relative ordering of the clones
� Description of the layout of the BACs onto the genome http://www.nature.com/nature/journal/v409/n6822/extref/40993...
3 of 23 10/15/13 10:42 AM
within contigs, to identify joins between contigs and to disassemble larger chimeric contigs.� Thisprocess involved first editing the fingerprint assemblies, using the tools encapsulated in FPC, toensure that every clone within a contig was properly situated with respect to its most highly relatedneighbors.� A detailed discussion of the manual editing process can be found in Marra et al.,1999.7� Briefly, this was determined by minimizing the �Sulston� score8 (a statistical measure ofthe of coincidental overlap)� between adjacent clones and inspecting the fingerprint data extractedfrom the original gel image.� Redundant clones contributing no unique fragment data to theassembly were also �buried� under their parent clones to simplify the contig view if this had notalready been done in the automated process.� During this manual inspection, additional clones wereincorporated into the contig from the remaining pool of previously unassembled clones and newlyfingerprinted clones that were not yet part of any assembly.� Once the clone order had beenestablished within each contig, clones at the extreme ends of each contig were used to query the FPCdatabase at a reduced required fingerprint overlap stringency from that used to perform the initialassembly.� In this way, potential joins between contigs were identified.� Fingerprints of clonesinvolved in potential joins were visually inspected to confirm that all restriction fragments werelogically consistent and the joins were made if appropriate.� The results of this editing activity areillustrated in Table 3.� The most notable effect of the intensive editing effort was the nearly 5-foldreduction of total assemblies.� The large increase in the number of singletons was due to thecontinued addition of new clones to the database without a total assembly being performed.� Clonesfrom the singleton pool were only manually incorporated into assemblies as needed to extend the endsof the contigs.� As a rule, clones from the singleton pool were not incorporated into the interior ofcontigs where additional redundancy was not needed.
Integration of map data with the BAC contig database
The main purpose of generating a whole genome BAC contig map was to coordinate activities of thelarger sequencing groups by making the FPC database available and to specifically select clones tofeed the human sequencing capacities of the WUGSC, the Whitehead Institute for BiomedicalResearch (WIBR) and the Stanford Genome and Technology Center (SGTC).� An essentialcomponent of the working draft strategy was that the selected clones for these centers be restricted asmuch as possible to chromosomes 2, 4, 7, 8, 11, 15, 17,18 and Y.� Early on, mapped BACs wereidentified primarily from the hybridization of 13,695 overgo probes generated from sequencesmapped to these chromosomes.� These consisted predominantly of selected markers from the CEPHG�n�thon genetic map9, the GeneMap�99 genome-wide RH map (http://www.ncbi.nlm.nih.gov/genemap/).10-12 and from plasmid library sequences prepared from flow-sorted chromosomes(Sanger Centre, unpublished data).� The 13,695 markers identified 96,283 unique clones, providingmany anchor points for the assembled contigs.� As the BAC assemblies enlarged and the fingerprintresource gained popularity as a tool for coordinating large-scale sequencing efforts, markers acrossthe genome were sought to anchor all contigs.� The remainder of the genome was to be sequencedby other members of the International Sequencing Consortium;13 however, it was realized that theWG BAC map would also be a useful resource for other centers.� To enhance the utility of the mapto all centers, as many markers as possible were integrated into the FPC database, resulting in thechromosomal localization of most BAC contigs.� Because the RPCI-11 library was being used for
� Description of the layout of the BACs onto the genome http://www.nature.com/nature/journal/v409/n6822/extref/40993...
4 of 23 10/15/13 10:42 AM
many genome initiatives there was a wealth of marker information available.� A significant sourceof such information came from the inclusion of chromosomal assignment data for 9,018 STS derivedfrom BAC end sequences (D.R. Cox, unpublished data).� Although greater than 15% of theavailable BAC end sequences of the RPCI-11 library are apparently mislabeled with respect to thecorrect BAC name14, the number of accurately mapped BAC ends facilitated the correctchromosomal assignment of contigs by considering the consistent trend of these data for a givencontig.� As the working draft sequence accumulated, known markers were readily identifiedutilizing electronic PCR (ePCR; a program that searches sequence for STS by identifying theassociated primer sequences in the correct orientation and with correct spacing),15 which identifiesprimers and these data provided for inclusion in the FPC database (G. Schuler, NCBI).� Thecombined ePCR and hybridized data sets contained 69,507 markers, including 1,659 polymorphicmarkers from the G�n�thon genetic map.� In addition, chromosomal assignment and integrationof cytogenetic map positions were achieved by identification of 3,412 BACs mapped by fluorescencein situ hybridization (FISH) data as described in an accompanying manuscript.
The GeneMap�99 map was chosen for the purpose of anchoring and ordering contigs as it
has a substantial marker set (> 50,000), is well-integrated with the G�n�thon genetic map and
provides local ordering at <1 Mb resolution.� It was also the most widely known genome map at that
time.� To ensure that markers assigned to BACs provided consistent localizations, single markers
associated with clones in multiple contigs were not used for contig placement.� For each contig, all
chromosome assignment data associated with its clones were tallied and the contig was assigned to
the chromosome with the majority of supportive data.� Each chromosomal assignment datum was
given equal weight with the exception of FISH data, which was considered the strongest evidence for
placement.� A clone could have more than one piece of supportive datum.� For example, a clone
with one chromosome 7 STS marker, chromosome 7 FISH data and BAC end sequence RH data for
chromosome 2 would contribute two supportive data points for contig assignment to chromosome 7
and one for chromosome 2. In the case of a tie in the cumulative data for the contig, no initial
chromosomal assignment was made.
Once a chromosomal assignment was made, the majority of contigs could be further localized
to the median RH map position of all markers associated with the contig and assigned to that
chromosome.� To determine the median map position of a contig: 1. Each clone was allowed only
one map position.� This was the median position of all markers associated with that clone; 2.
� Description of the layout of the BACs onto the genome http://www.nature.com/nature/journal/v409/n6822/extref/40993...
5 of 23 10/15/13 10:42 AM
Markers that are likely outliers were removed.� A contig may have outliers if the map distance
covered by the contig is greater than expected for a contig with the given number of clones.� The
outlier markers likely represent local mapping errors; 3. The median position was taken from the
markers that remain.
The orientation of the contig with respect to the map was determined next.� The marker
content of accessioned sequences associated with the clones from the contig was determined by
ePCR.� Those markers found on one of five maps were examined (G�n�thon genetic map,
Marshfield genetic map16, WIBR YAC STS-content (http://carbon.wi.mit.edu:8000/cgi-bin/contig
/phys_map), GeneMap�99, SHGC G3 RH map (http://www-shgc.stanford.edu/Mapping
/rh/index.html), NCBI framework map (http://www.ncbi.nlm.nih.gov/genome/guide/)) and all mapped
markers were then compared with their adjacent neighboring markers to determine if the order of
markers within a contig for any given map were ascending or descending with respect to that map.�
Contigs were flipped as needed to orient them with respect to the majority consensus of all maps
examined.
Lastly, finished map data provided by other groups for several chromosomes was examined.�
Although the contigs ordered by the methods above were largely consistent with these data, a few
manual adjustments were made to more accurately reflect these well-characterized maps.� The maps
considered at this stage were for chromosomes 14 (Genoscope, J. Weissenbach)17, 19 (Lawrence
Livermore National Laboratory, http://www-bio.llnl.gov/bbrp/genome/html/chrom_map.html), X
(Sanger Centre, D. Bentley) and a 20 Mb segment of chromosome 15 (University of Washington, L.
Rowen).� Telomeric contigs were identified and positioned where possible.� The data for the
telomeric contigs is discussed in a separate manuscript in this issue of Nature.18
Automated clone selection for sequencing
To maximize the amount of sequence produced while still ensuring the integrity of the clones
selected, seed clones were chosen from contigs consisting of at least eight clones by finding the
� Description of the layout of the BACs onto the genome http://www.nature.com/nature/journal/v409/n6822/extref/40993...
6 of 23 10/15/13 10:42 AM
largest clone in each contig that had no more than 2 bands that were not confirmed by neighboring
clones.� Two fragments in each clone were assumed to be the insert-vector junction fragments as
HindIII was used to generate fingerprints from this BAC library constructed using a partial EcoRI
restriction digest.� Once selected, each seed clone was compared to in silico digests of all of the
human clones in GenBank to identify any clones that may overlap previously generated sequence.�
If clones were found to excessively overlap an existing sequence by a Sulston score of <3x10⁻⁶, or if
the overlap suggested localization to a chromosome other than those specifically targeted, then the
seed clone was discarded.� Based on the estimated sizes of the chromosomes and the number of seed
clones selected from contigs localized to each chromosome, it was determined whether each
chromosome had been seeded to a point of saturation at approximately one contig per 500 kb.�
When this point was reached, seed clones were no longer chosen from that chromosome and these
nucleation points were extended to avoid excessive gaps when completing the sequence map.� Since
the fingerprint database was growing weekly and all data were not yet incorporated into existing
contigs, a set of tools was developed that allowed extension from seed clones by identifying
overlapping fingerprints in the rest of the database independent of contig assembly.� Once manually
ordered contigs became available, the automated clone selection tools attempted to walk in a minimal
tiling path, except in cases where a clone chosen for a walk overlapped heavily with another
sequenced clone.� In this case, a bridging clone with significant overlap to both neighbors was
chosen to complete the coverage.� For choosing gap-spanning clones and for choosing minimal
tiling paths, BAC end data, when available and consistent, were used in conjunction with fingerprint
data.� To complete the working draft, the end of each contig was extended where possible using
fingerprint analysis, even if the degree of overlap was higher than our allowed degree of overlap for
automated clone selection (25%). Clones were automatically selected from the ends of contigs when
at least 30 kb of new sequence data would likely be obtained.
Throughout the clone selection process for the working draft, a central registry was maintained
at the NCBI to track clones being sequenced by all groups in the consortium.� Incorrect clone names
and the depth of clone coverage for any given region limited the usefulness of this registry but it did
� Description of the layout of the BACs onto the genome http://www.nature.com/nature/journal/v409/n6822/extref/40993...
7 of 23 10/15/13 10:42 AM
provide a means for examining maps for conflicts.� In addition, the first set of 96 sequence reads for
any clone was used to check for overlap with known sequences.� Initially, a clone was discarded at
this stage if greater than 25% of sequences matched another clone.� This overlap cutoff was
increased as the working draft accumulated to allow for gap-spanning clones to enter the pipeline.�
Even with all these efforts, redundancy within the working draft sequence is higher than the <20%
that was targeted; however, this redundancy in fact may have benefits for analysis of sequence
variation within the genome.
Mapping of accessioned sequences.
For the placement of each accessioned sequence, in silico digests of each sequence were used
to query the FPC human BAC database.� If the FPC database fingerprint with the highest restriction
fragment similarity to the in silico digest corresponded to the clone referenced in the associated
GenBank record, then the accessioned sequence was mapped to this position; however, if it
corresponded to a different clone than that referenced in the GenBank record, additional information
was used to position this sequence as accurately as possible.� In many cases, the highest matching
fingerprint was associated with a clone overlapping with, or completely redundant to, the referenced
clone.� This could occur when working draft sequence was used as all restriction fragments may not
be adequately represented in the assembled sequence and thus would be absent from the in silico
digest.� In these cases, the accessioned sequence was positioned with respect to the GenBank
referenced clone.� In a third scenario, the highest matching fingerprint was associated with a clone
mapping independently of that referenced in the GenBank record.� If the in silico digest match to the
fingerprint was sufficiently stringent (Sulston score <1x10⁻⁹) then the accessioned sequence was
mapped to the matching position.� If the match was less stringent, then two pieces of additional
information were required to confirm this placement.� Additional information considered was the
alignment of BAC end sequences to the accessioned sequence.� If the majority of these BAC end
alignments represented clones overlapping with the matching clone, then the accessioned sequence
was placed in that position on the map.� At the time of last analysis, there were 302,351 BAC end
� Description of the layout of the BACs onto the genome http://www.nature.com/nature/journal/v409/n6822/extref/40993...
8 of 23 10/15/13 10:42 AM
sequences that could be aligned to 32,235 HTGS human sequences.� Of these alignments, 83,219 of
them were from clones contained in the WG BAC map and confirmed or contributed to accessioned
sequence placement.� Additional evidence for placement of the sequence came from examining
believed sequence overlaps with neighboring sequenced clones.� The believed overlaps were
generated by an all-against-all sequence comparison of all accessioned sequences (G. Schuler and J.
Kent).� The believed overlaps were ranked as either strong (includes additional supporting data such
as paired BAC end linkages) or weak (sequence overlap alone) and were weighted accordingly in this
consideration.
1.�������� Olson, M., Hood, L., Cantor, C. & Botstein, D. A common language for
physical mapping of the human genome. Science 245, 1434-5 (1989).
2.�������� Burke, D. T., Carle, G. F. & Olson, M. V. Cloning of large segments of
exogenous DNA into yeast by means of artificial chromosome vectors. Science 236, 806-12 (1987).
3.�������� Bouffard, G. G. et al. A physical map of human chromosome 7: an
integrated YAC contig map with average STS spacing of 79 kb. Genome Res 7, 673-92 (1997).
4.�������� Ross, M. T., LaBrie, S., McPherson, J. & Stanton, V. P. in Current
Protocols in Human Genetics (eds. Dracopoli, N. C. et al.) 5.6.1-5.6.5 (John Wiley and Sons, New
York, 1999).
5.�������� Soderlund, C., Longden, I. & Mott, R. FPC: a system for building
contigs from restriction fingerprinted clones. Comput Appl Biosci 13, 523-35 (1997).
6.�������� Soderlund, C., Humphray, S., Dunham, A. & French, L. Contigs Built
with Fingerprints, Markers, and FPC V4.7. Genome Res 10, 1772-1787 (2000).
7.�������� Marra, M. et al. A map for sequence analysis of the Arabidopsis
thaliana genome. Nat Genet 22, 265-70 (1999).
� Description of the layout of the BACs onto the genome http://www.nature.com/nature/journal/v409/n6822/extref/40993...
9 of 23 10/15/13 10:42 AM
8.�������� Sulston, J. et al. Software for genome mapping by fingerprinting
techniques. Comput Appl Biosci 4, 125-32 (1988).
9.�������� Dib, C. et al. A comprehensive genetic map of the human genome based
on 5,264 microsatellites. Nature 380, 152-4 (1996).
10.������ Schuler, G. D. et al. A gene map of the human genome. Science 274, 540-6
(1996).
11.������ Deloukas, P. et al. A physical map of 30,000 human genes. Science 282,
744-6 (1998).
12.������ The International Radiation Hybrid Mapping Consortium, A new gene map
of the human genome: GeneMap'99. (cited October 2000) http://www.ncbi.nlm.nih.gov/genemap/
(1999).
13.������ The International Human Genome Sequencing Consortium. Initial
sequencing and analysis of the human genome. Nature, (this issue).
14.������ Zhao, S. et al. Human BAC ends quality assessment and sequence analyses.
Genomics 63, 321-32 (2000).
15.������ Schuler, G. D. Electronic PCR: bridging the gap between genome mapping
and genome sequencing. Trends Biotechnol 16, 456-9 (1998).
16.������ Broman, K. W., Murray, J. C., Sheffield, V. C., White, R. L. & Weber, J. L.
Comprehensive human genetic maps: individual and sex-specific variation in recombination. Am J
Hum Genet 63, 861-9 (1998).
17.������ Bruls, T. et al. A physical map of human chromosome 14. Nature (this
issue).
� Description of the layout of the BACs onto the genome http://www.nature.com/nature/journal/v409/n6822/extref/40993...
10 of 23 10/15/13 10:42 AM

18.������ Reithman, H. C. et al. Integration of telomeric DNA sequences with the
human working draft sequence. Nature (this issue).
� Description of the layout of the BACs onto the genome http://www.nature.com/nature/journal/v409/n6822/extref/40993...
11 of 23 10/15/13 10:42 AM
The International Human Genome Mapping Consortium
Full author list
Washington University School of Medicine, Genome Sequencing Center:
http://genome.wustl.edu
John D. McPherson1, Marco Marra1*, LaDeana Hillier1, Robert H. Waterston1, Asif Chinwalla1, JohnWallis1, Mandeep Sekhon1, Kristine Wylie1, Elaine R. Mardis1, Richard K. Wilson1, Robert Fulton1,Tamara A. Kucaba1, Caryn Wagner-McPherson1, William B. Barbazuk1 Amanda Aabbott1, JoharAli1, Stephanie Andrews1, Larisa Belaygorod1, Gary Bemis1, Amy Berghoff1, Merry Brook1, MarcoCardenas1, Jason Carter1, Jim Cloud1, Marc Cotton1, Jye'mon Crockett1, Kristy Drone1, Feiyu Du1,Jen Edwards1, Jackie Fedele1, Dan Fischer1, Nat Florence1, Catherine Franklin1, Tony Gaige1, DianeGaige1, Marilyn Gibbons1, Neenu Grewal1, Heather Grover1, Chris Gund1, Gwen Harmon1, NjataHarvey1, Shunfang Hou1, Sara Jaeger1, Corrie Joshu1, Sara Kohlberg1, Colin Kremitzki1, DanLayman1, Shawn Leonard1, Jason Maas1, Ken MacDonald1, Catherine Marquis-Homeyer1, RachelMaupin1, Ryan Mcadow1, Cindy McCabe1, Rebecca McGrane1, Kelly Mead1, Richard Morales1,Nancy Mudd1, Christine Nguyen1, Phil Ozersky1, Carrie Ragan1, Amy Reiley1, Kerry Robinson1,Ellen Ryan1, Samuel Sasso1, Debra Scheer1, Kelsi Scott1, Kelsi Scott1, Ryan Seim1, Karina Shapiro1,Proteon Shelby1, Aimee Smith1, Tamberlyn Stoneking1, Hui Sun1, Carrie Sutterer1, Elizabeth Sweet1,Brenda Theising1, Jane Threideh1, Rebecca Walker1, J. Patrick Woolley1, & Martin Yoakum1
Wellcome Trust Genome Campus:
http://www.sanger.ac.uk/
Simon G. Gregory2, Sean J. Humphray2, Lisa French2, Richard S. Evans2, Graeme Bethel2, AdamWhittaker2, Jane L. Holden2, Owen T. McCann2, Andrew Dunham2, Carol Soderlund2*, Carol E.Scott2 & David R. Bentley2
National Center for Biotechnology Information:
http://www.ncbi.nlm.nih.gov
Gregory Schuler3, Hsiu-Chuan Chen3 & Wonhee Jang3
National Human Genome Research Insititute:
http://genome.nhgri.nih.gov/chr7/
Eric D. Green4, Jacquelyn R. Idol4 & Valerie V. Braden Maduro4
� Description of the layout of the BACs onto the genome http://www.nature.com/nature/journal/v409/n6822/extref/40993...
12 of 23 10/15/13 10:42 AM
Albert Einstein College of Medicine:
http://sequence.aecom.yu.edu/chr12/
Kate T. Montgomery5, Eunice Lee5, Ashley Miller5, Suzanne Emerling5 & Raju Kucherlapati5
Baylor College of Medicine, Human Genome Sequencing Center:
http://www.hgsc.bcm.tmc.edu/
Richard Gibbs6, Steve Scherer6, J. Harley Gorrell6, Erica Sodergren6, Kerstin Clerc-Blankenburg6,Paul Tabor6, Susan Naylor7 & Dawn Garcia7
Roswell Park Cancer Institute:
Pieter J. de Jong8*, Joseph J. Catanese8*, Norma Nowak8 & Kazutoyo Osoegawa8*
Multimegabase Sequencing Center:
Shizhen Qin9, Lee Rowen9, Anuradha Madan9, Monica Dors9 & Leroy Hood9
Fred Hutchinson Cancer Research Institute:
Barbara Trask10, Cynthia Friedman10& Hillary Massa10The Children's Hospital of Philadelphia:Vivian G. Cheung11, Ilan R. Kirsch12, Thomas Reid12 & Raluca Yonescu12
Genoscope:
Jean Weissenbach13, Thomas Bruls13 & Roland Heilig13
US DOE Joint Genome Institute:
http://www.jgi.doe.gov/JGI_home.html
Elbert Branscomb14, Anne Olsen14, Norman Doggett14, Jan-Fang Cheng14 & Trevor Hawkins14
Stanford Human Genome Center and Department of Genetics:
http://www-shgc.stanford.edu/
Richard M. Myers15, Jin Shang15, Lucia Ramirez15, Jeremy Schmutz15, Olivia Velasquez15, KamiDixon15, Nancy E. Stone15 & David R. Cox15
University of California, Santa Cruz:
http://genome.ucsc.edu
David Haussler16,17, W. James Kent18 , Terrence Furey17 , Sanja Rogic17 & Scot Kennedy19
� Description of the layout of the BACs onto the genome http://www.nature.com/nature/journal/v409/n6822/extref/40993...
13 of 23 10/15/13 10:42 AM
Department of Genome Analysis, Institute of Molecular Biotechnology:
http://genome.imb-jena.de/printHum.html
Andr� Rosenthal21, Gaiping Wen21, Markus Schilhabel21, Gernot Gloeckner21, GeraldNyakatura21*, Reiner Siebert22 & Brigitte Schlegelberger22
Departments of Human Genetics and Pediatrics, University of California:
Julie Korenberg23 & Xiao-Ning Chen23
RIKEN Genomic Sciences Center:
http://hgp.gsc.riken.go.jp/
Asao Fujiyama24, Masahira Hattori24 , Atsushi Toyoda24 , Tetsushi Yad24 ,
Hong-Seok Park24 & Yoshiyuki Sakaki24
Department of Molecular Biology, Keio University School of Medicine:
http://www.dmb.med.keio.ac.jp
Nobuyoshi Shimizu25, Shuichi Asakawa25, Kazuhiko Kawasaki25, Takashi Sasaki25, Ai Shintani25,Atsushi Shimizu25, Kazunori Shibuya25, Jun Kudoh25 & Shinsei Minoshima25
Max-Plank-Institute for Molecular Genetics:
http://seq.molgen.mpg.de/hgs/
Juliane Ramser26 , Peter Seranski26,27 , Celine Hoff26,27 , Uwe Radelof26, Ralf Sudbrak26,AnnemariePoustka26,27, Richard Reinhardt26 & Hans Lehrach26
1. Washington University School of Medicine, Genome Sequencing Center, Department of Genetics,4444 Forest Park Boulevard, St. Louis, Missouri 63108, USA
2. Wellcome Trust Genome Campus, Hinxton, Cambridge, CB10 1SA, UK
3. National Center for Biotechnology Information, National Institutes of Health, Bethesda, Maryland20894, USA
4. National Human Genome Research Institute, National Institutes of Health, Bethesda, Maryland20892, USA
5. Department of Molecular Genetics, Albert Einstein College of Medicine, 1300 Morris ParkAvenue, Bronx, New York 10461, USA
� Description of the layout of the BACs onto the genome http://www.nature.com/nature/journal/v409/n6822/extref/40993...
14 of 23 10/15/13 10:42 AM
6. Baylor College of Medicine, Human Genome Sequencing Center, Houston, Texas, USAhttp://www.hgsc.bcm.tmc.edu/
7. University of Texas, San Antonio, Texas, USA
8. Roswell Park Cancer Institute, Buffalo, New York 14263, USA
9. Multimegabase Sequencing Center, Institute for Systems Biology, Seattle, Washington 98105, USA
10. Division of Human Biology, Fred Hutchinson Cancer Research Institute, Seattle, Washington98109, USA
11. Department of Pediatrics, The Children's Hospital of Philadelphia, University of Pennsylvania,Philadelphia, Pennsylvania 19104, USA
12. Genetics Department, Medicine Branch, National Cancer Institute, Washington DC, USA
13. Genoscope, Centre National de S�quencage, 2 Rue Gaston Cr�mieux, CP 5706, 91057 Evry,France
14. US DOE Joint Genome Institute, Walnut Creek, California, USA
15. Stanford Human Genome Center and Department of Genetics, Stanford University School ofMedicine, Stanford, California 94305, USA
16. Howard Hughes Medical Institute, University of California, Santa Cruz, Santa Cruz, California95064, USA
17. Department of Computer Science, University of California, Santa Cruz, Santa Cruz, California95064, USA
18. Department of Biology, University of California, Santa Cruz, Santa Cruz, California 95064, USA
19. Department of Mathematics, University of California, Santa Cruz, Santa Cruz, California 95064,USA
20. British Columbia Cancer Research Centre, 600 West 10th Avenue, Room 3427, Vancouver,British Columbia V5Z 4E6, Canada
21. Dept. of Genome Analysis, Institute of Molecular Biotechnology, Beutenbergstrasse 11, D-07745JENA, Germany
22. Institute of Human Genetics, University of Kiel, Germany
23. Departments of Human Genetics and Pediatrics, University of California, Los Angeles, California,USA
24. RIKEN Genomic Sciences Center, 1-7-22 Suehiro-cho, Tsurumi-ku, Yokohama 230-0045, Japan
� Description of the layout of the BACs onto the genome http://www.nature.com/nature/journal/v409/n6822/extref/40993...
15 of 23 10/15/13 10:42 AM
25. Department of Molecular Biology, Keio University School of Medicine, 35 ShinanomachiShinjuku-ku, Tokyo 160-8582, Japan
26. Max-Plank-Institute for Molecular Genetics, Ihnestrasse 73, D-14195, Berlin, Germany
27. Abteilung Molekulare Genomanalyse, Deutsches Krebsforschungszentrum, Im Neuenheimer Feld280, 69120 Heidelberg, Germany
*Present addresses: British Columbia Cancer Research Centre, 600 West 10th Avenue, Room 3427,Vancouver, British Columbia V5Z 4E6, Canada (M.M.); Clemson University Genome Institute, 100Jordan Hall, Clemson University, Clemson, South Carolina 29634-5727, USA (C.S.); Children'sHospital Oakland Research Institute, BACPAC Resources, Oakland, California 94609, USA andPfizzer Global Research & Development, Alameda Laboratories, Alameda, California 94502 USA(P.J.d.J., J.J.C., K.O.); MWG-Biotech AG, Ebersberg, Germany (G.N.).
� Description of the layout of the BACs onto the genome http://www.nature.com/nature/journal/v409/n6822/extref/40993...
16 of 23 10/15/13 10:42 AM
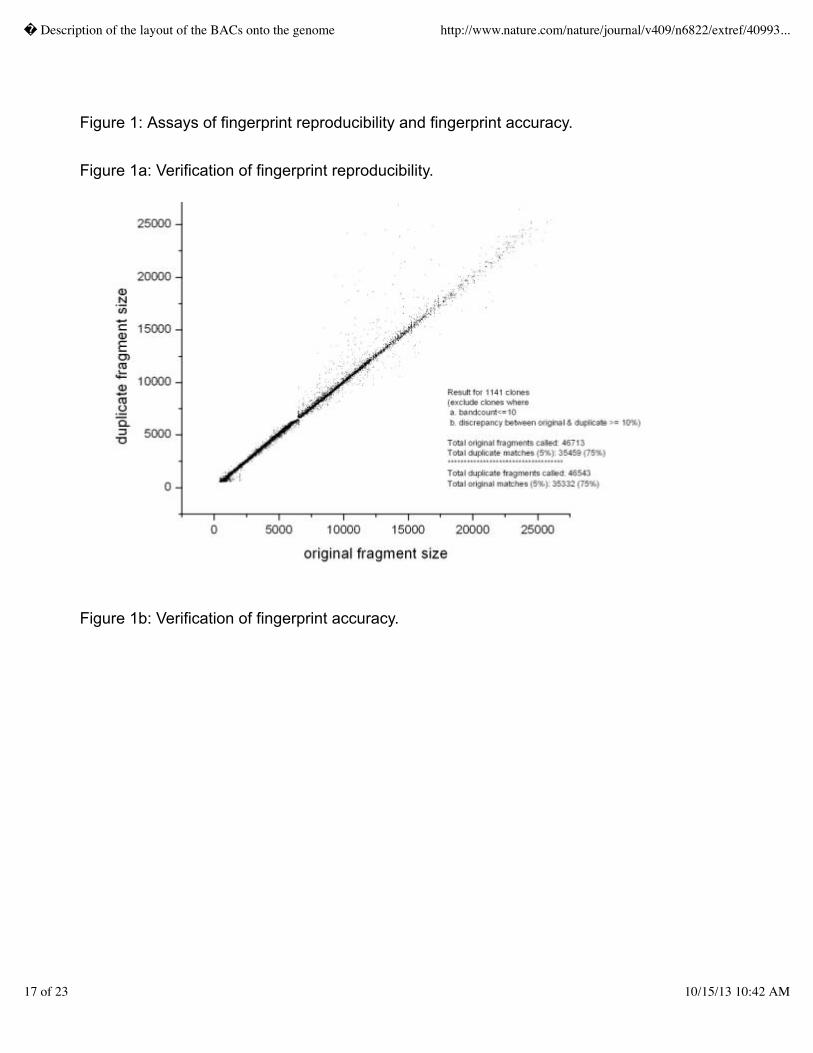
Figure 1: Assays of fingerprint reproducibility and fingerprint accuracy.
Figure 1a: Verification of fingerprint reproducibility.
Figure 1b: Verification of fingerprint accuracy.
� Description of the layout of the BACs onto the genome http://www.nature.com/nature/journal/v409/n6822/extref/40993...
17 of 23 10/15/13 10:42 AM
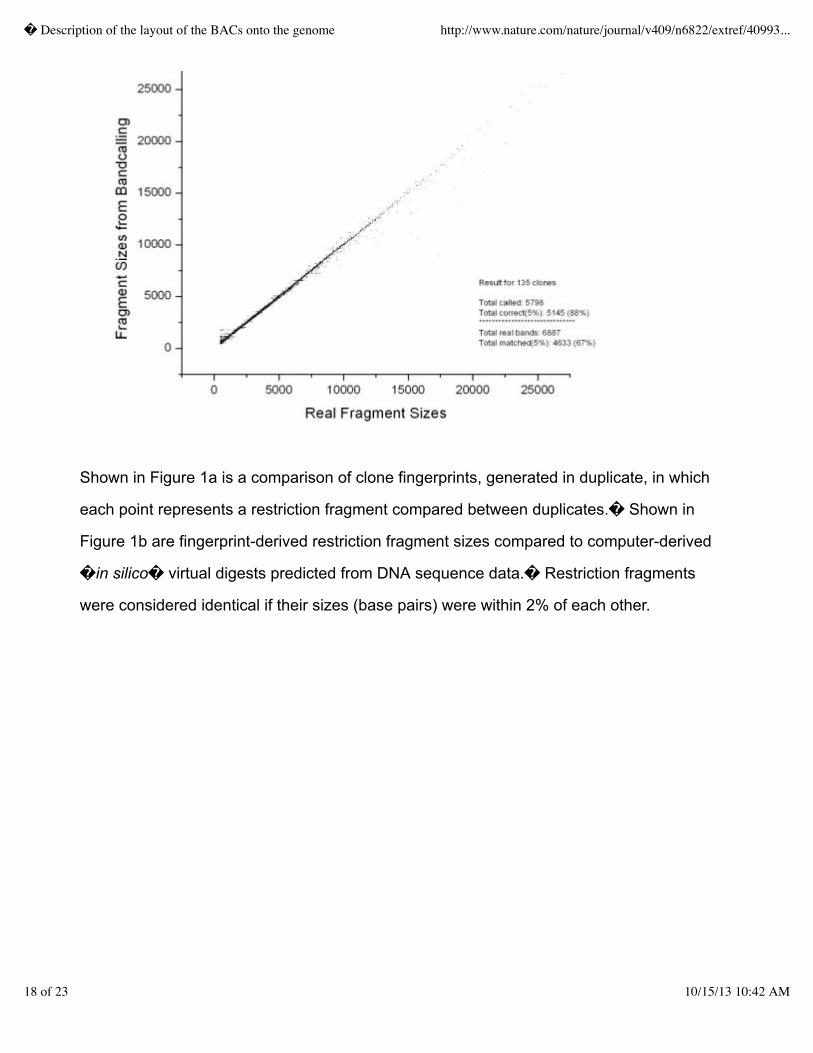
Shown in Figure 1a is a comparison of clone fingerprints, generated in duplicate, in which
each point represents a restriction fragment compared between duplicates.� Shown in
Figure 1b are fingerprint-derived restriction fragment sizes compared to computer-derived
�in silico� virtual digests predicted from DNA sequence data.� Restriction fragments
were considered identical if their sizes (base pairs) were within 2% of each other.
� Description of the layout of the BACs onto the genome http://www.nature.com/nature/journal/v409/n6822/extref/40993...
18 of 23 10/15/13 10:42 AM
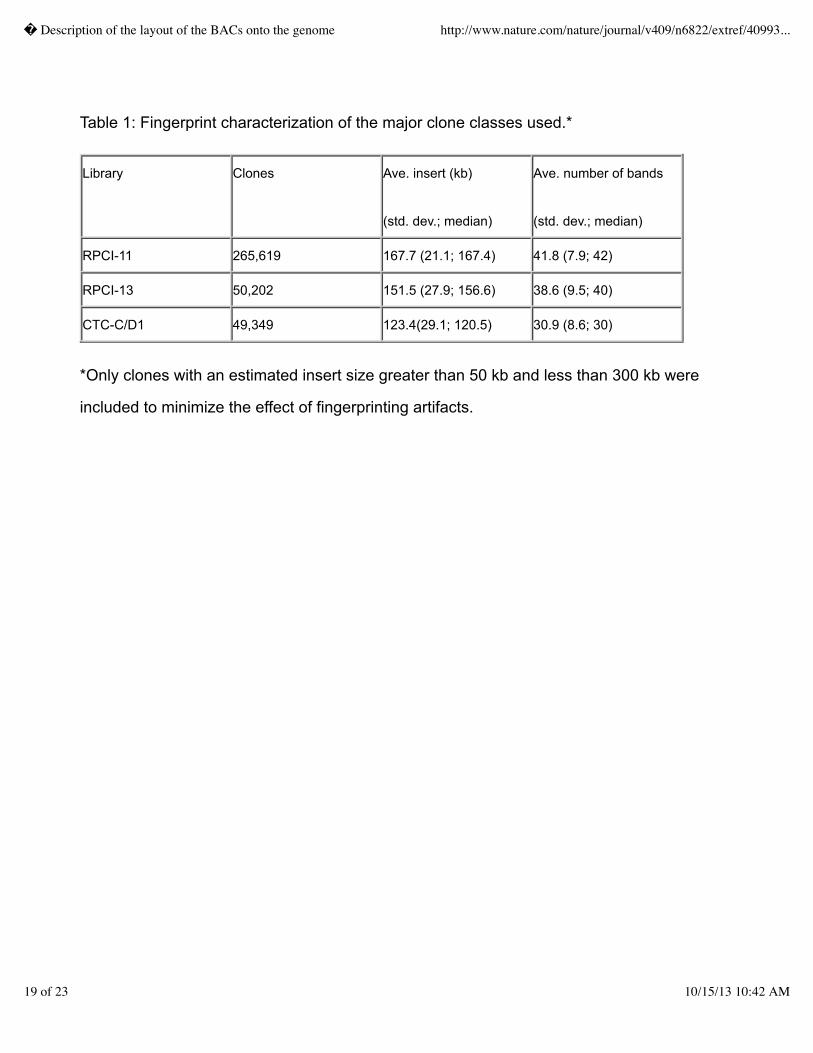
Table 1: Fingerprint characterization of the major clone classes used.*
Library Clones Ave. insert (kb)
(std. dev.; median)
Ave. number of bands
(std. dev.; median)
RPCI-11 265,619 167.7 (21.1; 167.4) 41.8 (7.9; 42)
RPCI-13 50,202 151.5 (27.9; 156.6) 38.6 (9.5; 40)
CTC-C/D1 49,349 123.4(29.1; 120.5) 30.9 (8.6; 30)
*Only clones with an estimated insert size greater than 50 kb and less than 300 kb were
included to minimize the effect of fingerprinting artifacts.
� Description of the layout of the BACs onto the genome http://www.nature.com/nature/journal/v409/n6822/extref/40993...
19 of 23 10/15/13 10:42 AM
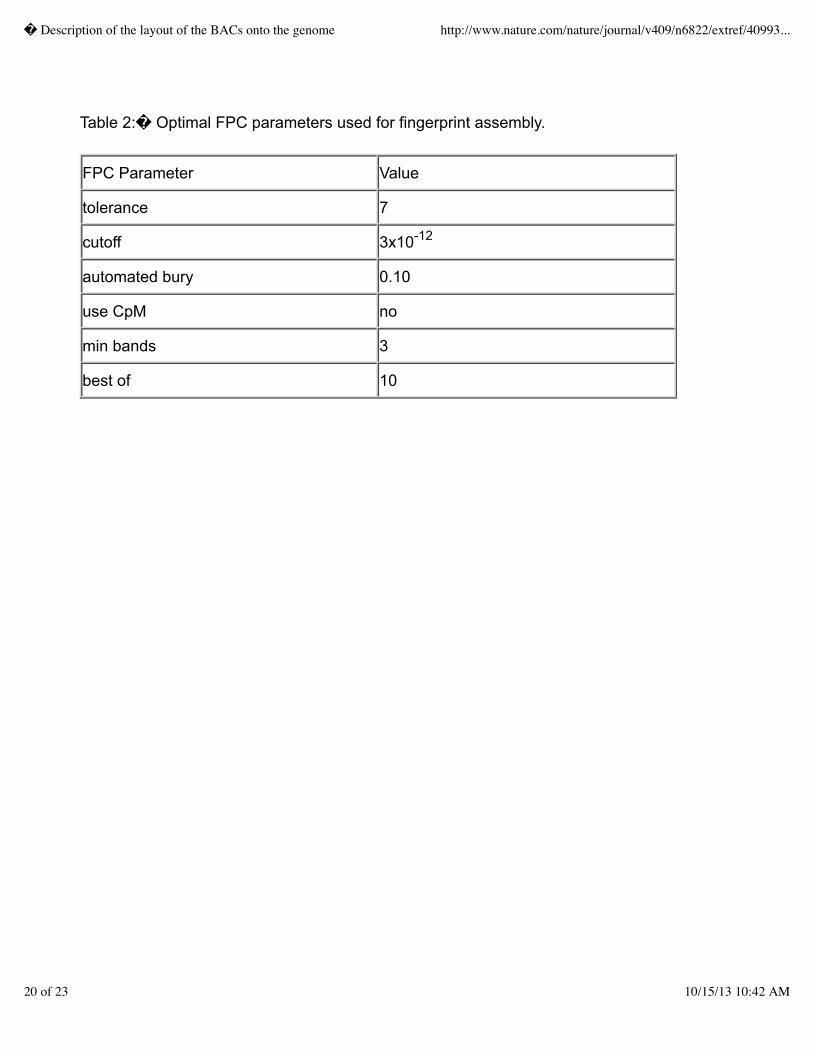
Table 2:� Optimal FPC parameters used for fingerprint assembly.
FPC Parameter Value
tolerance 7
cutoff 3x10-12
automated bury 0.10
use CpM no
min bands 3
best of 10
� Description of the layout of the BACs onto the genome http://www.nature.com/nature/journal/v409/n6822/extref/40993...
20 of 23 10/15/13 10:42 AM
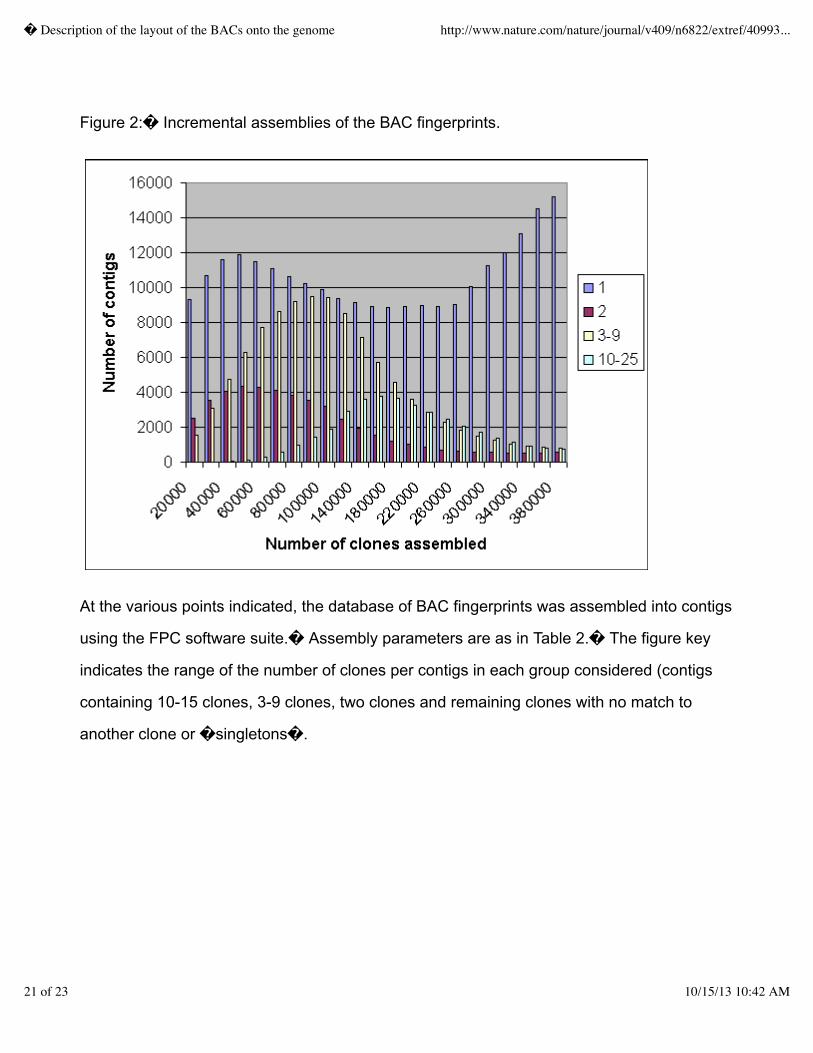
Figure 2:� Incremental assemblies of the BAC fingerprints.
At the various points indicated, the database of BAC fingerprints was assembled into contigs
using the FPC software suite.� Assembly parameters are as in Table 2.� The figure key
indicates the range of the number of clones per contigs in each group considered (contigs
containing 10-15 clones, 3-9 clones, two clones and remaining clones with no match to
another clone or �singletons�.
� Description of the layout of the BACs onto the genome http://www.nature.com/nature/journal/v409/n6822/extref/40993...
21 of 23 10/15/13 10:42 AM
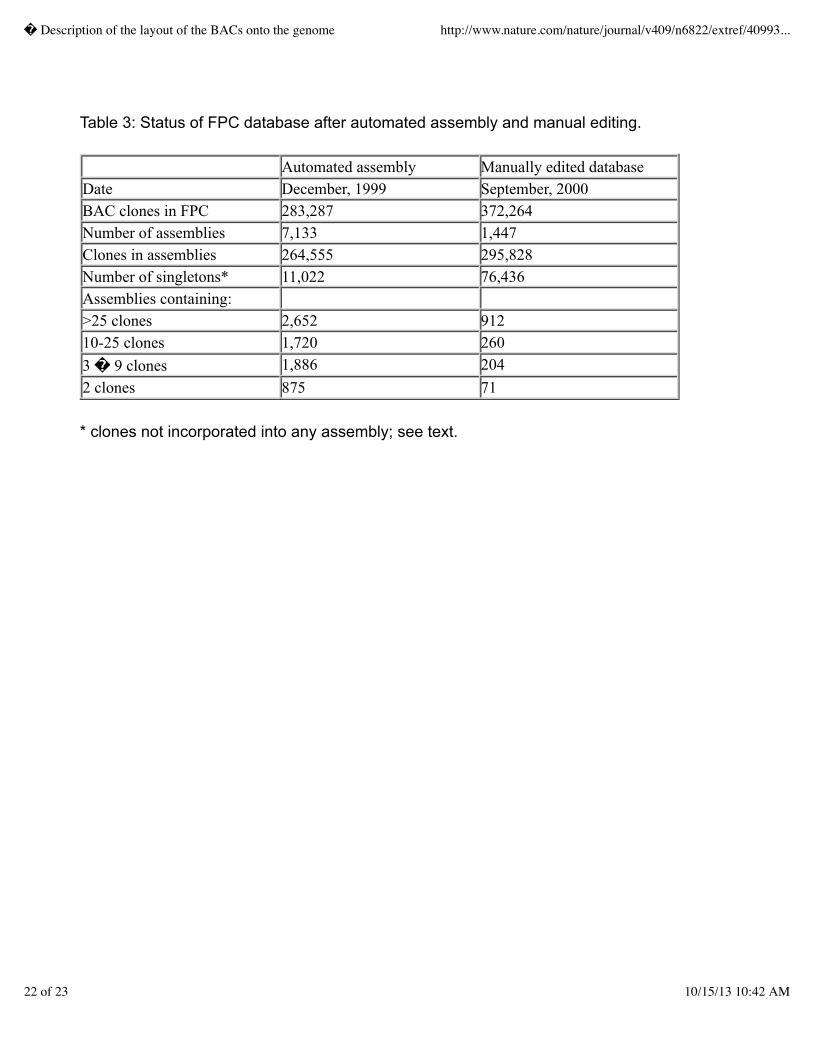
Table 3: Status of FPC database after automated assembly and manual editing.
Automated assembly Manually edited databaseDate December, 1999 September, 2000BAC clones in FPC 283,287 372,264Number of assemblies 7,133 1,447Clones in assemblies 264,555 295,828Number of singletons* 11,022 76,436Assemblies containing: >25 clones 2,652 91210-25 clones 1,720 2603 � 9 clones 1,886 2042 clones 875 71
* clones not incorporated into any assembly; see text.
� Description of the layout of the BACs onto the genome http://www.nature.com/nature/journal/v409/n6822/extref/40993...
22 of 23 10/15/13 10:42 AM

� Description of the layout of the BACs onto the genome http://www.nature.com/nature/journal/v409/n6822/extref/40993...
23 of 23 10/15/13 10:42 AM
Related Documents