RESEARCH ARTICLE A parallel proteomic and metabolomic analysis of the hydrogen peroxide- and Sty1p-dependent stress response in Schizosaccharomyces pombe Mark E. Weeks 1 , John Sinclair 1 , Amna Butt 2 , Yuen-Li Chung 3 , Jessica L. Worthington 2 , Caroline R. M. Wilkinson 2 , John Griffiths 3 , Nic Jones 2 , Michael D. Waterfield 1 and John F. Timms 1, 4 1 Ludwig Institute for Cancer Research, University College London, Cruciform Building, London, UK 2 Paterson Institute for Cancer Research, Christie Hospital, Manchester, UK 3 Department of Basic Medical Sciences, Medical Biomics Centre, St. George’s Hospital Medical School, Cranmer Terrace, London, UK 4 Department of Biochemistry and Molecular Biology, University College London, Cruciform Building, London, UK Using an integrated approach incorporating proteomics, metabolomics and published mRNA data, we have investigated the effects of hydrogen peroxide on wild type and a Sty1p-deletion mutant of the fission yeast Schizosaccharomyces pombe. Differential protein expression analysis based on the modification of proteins with matched fluorescent labelling reagents (2-D-DIGE) is the foundation of the quantitative proteomics approach. This study identifies 260 differentially expressed protein isoforms from 2-D-DIGE gels using MALDI MS and reveals the complexity of the cellular response to oxidative stress and the dependency on the Sty1p stress-activated protein kinase. We show the relationship between these protein changes and mRNA expression levels identified in a parallel whole genome study, and discuss the regulatory mechanisms involved in protecting cells against hydrogen peroxide and the involvement of Sty1p-dependent stress-acti- vated protein kinase signalling. Metabolomic profiling of 29 intermediates using 1 H NMR was also conducted alongside the protein analysis using the same sample sets, allowing examination of how the protein changes might affect the metabolic pathways and biological processes involved in the oxidative stress response. This combined analysis identifies a number of inter- linked metabolic pathways that exhibit stress- and Sty1-dependent patterns of regulation. Received: October 11, 2005 Revised: November 17, 2005 Accepted: November 23, 2005 Keywords: Hydrogen peroxide / Metabolomics / Redox stress 2772 Proteomics 2006, 6, 2772–2796 1 Introduction The stress responses by which organisms react to environ- mental changes are complex and involve the regulation of many genes [1–4]. Studies of stress responses in human cell lines has led to apparent contradictory results because of their complex regulatory networks, making the use of sim- pler model cell systems more desirable [5]. The fission yeast Schizosaccharomyces pombe is one such model organism for which the complete genome has been sequenced [6] and which can be easily genetically manipulated [7]. In particular, its stress-activation pathways share homology with higher organisms and transduce signals to the nucleus, resulting in Correspondence: Dr. John F. Timms, Ludwig Institute for Cancer Research, University College London, Cruciform Building, Gower Street, London WC1E 6BT, UK E-mail: [email protected] Fax: 144-20-7679-6334 Abbreviations: CESR, core environmental stress response; Cy2, 3- (4-carboxymethyl) phenylmethyl-3’-ethyloxacarbocyanine halide; Cy3, 1-(5-carboxypentyl)-1’-propylindocarbocyanine halide; Cy5, 1-(5-carboxypentyl)-1’-methylindocarbocyanine halide; 2-D-DIGE, 2-D difference gel electrophoresis; GPC, glycerophosphocholine; GSH, glutathione; Hsp, heat shock protein; NHS, N-hydroxysuccin- imidyl; ROS, reactive oxygen species; TMAO, trimethylamine-N- oxide; WT , wild-type DOI 10.1002/pmic.200500741 2006 WILEY-VCH Verlag GmbH & Co. KGaA, Weinheim www.proteomics-journal.com

Welcome message from author
This document is posted to help you gain knowledge. Please leave a comment to let me know what you think about it! Share it to your friends and learn new things together.
Transcript

RESEARCH ARTICLE
A parallel proteomic and metabolomic analysis of the
hydrogen peroxide- and Sty1p-dependent stress
response in Schizosaccharomyces pombe
Mark E. Weeks1, John Sinclair1, Amna Butt2, Yuen-Li Chung3, Jessica L. Worthington2,Caroline R. M. Wilkinson2, John Griffiths3, Nic Jones2, Michael D. Waterfield1
and John F. Timms1, 4
1 Ludwig Institute for Cancer Research, University College London, Cruciform Building, London, UK2 Paterson Institute for Cancer Research, Christie Hospital, Manchester, UK3 Department of Basic Medical Sciences, Medical Biomics Centre, St. George’s Hospital Medical School,
Cranmer Terrace, London, UK4 Department of Biochemistry and Molecular Biology, University College London, Cruciform Building, London, UK
Using an integrated approach incorporating proteomics, metabolomics and published mRNAdata, we have investigated the effects of hydrogen peroxide on wild type and a Sty1p-deletionmutant of the fission yeast Schizosaccharomyces pombe. Differential protein expression analysisbased on the modification of proteins with matched fluorescent labelling reagents (2-D-DIGE) isthe foundation of the quantitative proteomics approach. This study identifies 260 differentiallyexpressed protein isoforms from 2-D-DIGE gels using MALDI MS and reveals the complexity ofthe cellular response to oxidative stress and the dependency on the Sty1p stress-activated proteinkinase. We show the relationship between these protein changes and mRNA expression levelsidentified in a parallel whole genome study, and discuss the regulatory mechanisms involved inprotecting cells against hydrogen peroxide and the involvement of Sty1p-dependent stress-acti-vated protein kinase signalling. Metabolomic profiling of 29 intermediates using 1H NMR wasalso conducted alongside the protein analysis using the same sample sets, allowing examinationof how the protein changes might affect the metabolic pathways and biological processesinvolved in the oxidative stress response. This combined analysis identifies a number of inter-linked metabolic pathways that exhibit stress- and Sty1-dependent patterns of regulation.
Received: October 11, 2005Revised: November 17, 2005
Accepted: November 23, 2005
Keywords:
Hydrogen peroxide / Metabolomics / Redox stress
2772 Proteomics 2006, 6, 2772–2796
1 Introduction
The stress responses by which organisms react to environ-mental changes are complex and involve the regulation ofmany genes [1–4]. Studies of stress responses in human celllines has led to apparent contradictory results because oftheir complex regulatory networks, making the use of sim-pler model cell systems more desirable [5]. The fission yeastSchizosaccharomyces pombe is one such model organism forwhich the complete genome has been sequenced [6] andwhich can be easily genetically manipulated [7]. In particular,its stress-activation pathways share homology with higherorganisms and transduce signals to the nucleus, resulting in
Correspondence: Dr. John F. Timms, Ludwig Institute for CancerResearch, University College London, Cruciform Building, GowerStreet, London WC1E 6BT, UKE-mail: [email protected]: 144-20-7679-6334
Abbreviations: CESR, core environmental stress response; Cy2, 3-(4-carboxymethyl) phenylmethyl-3’-ethyloxacarbocyanine halide;Cy3, 1-(5-carboxypentyl)-1’-propylindocarbocyanine halide; Cy5,1-(5-carboxypentyl)-1’-methylindocarbocyanine halide; 2-D-DIGE,2-D difference gel electrophoresis; GPC, glycerophosphocholine;GSH, glutathione; Hsp, heat shock protein; NHS, N-hydroxysuccin-imidyl; ROS, reactive oxygen species; TMAO, trimethylamine-N-oxide; WT, wild-type
DOI 10.1002/pmic.200500741
2006 WILEY-VCH Verlag GmbH & Co. KGaA, Weinheim www.proteomics-journal.com
Proteomics 2006, 6, 2772–2796 Animal Proteomics 2773
altered patterns of gene expression that are critical for theresponse to environmental stresses such as heat, hyper-osmolarity and oxidative stress. A central element of thestress-activated protein kinase cascade in S. pombe is theprotein kinase Sty1p (Spc1/Phh1p), a homologue of mam-malian p38 kinase, which becomes activated in response tosimilar stresses and whose inactivation results in a pleio-tropic sensitivity to stress [8–10]. Sty1p regulates stress-de-pendent gene transcription, at least in part, through thedirect phosphorylation of the b-ZIP transcription factor,Atf1p which anchors Sty1p in the nucleus [11–14]. Impor-tantly, atf1 mutants show defects in Sty1p-dependent tran-scription, but only display a subset of the phenotypes dis-played by sty1 mutants, suggesting that Sty1p controls otheras yet unidentified proteins and pathways [11, 13].
In the study of oxidative stress, it is particularly relevantthat each human cell metabolizes approximately 1012 mole-cules of oxygen per day with 1% of oxygen metabolismresulting in the production of reactive oxygen species (ROS),such as the superoxide anion (O2
-), the hydroxyl radical(?OH) and hydrogen peroxide (H2O2) [15]. Because of theirhigh reactivity, ROS can bring about cellular damage to var-ious macromolecules. For example, oxidative DNA damagecan alter purine and pyrimidine bases, as well as cleave thephosphodiester DNA backbone leading to genetic mutation[15], whilst oxidation of protein cysteine thiol groups cancause intermolecular protein cross-linking and enzymeinactivation which potentially lead to cell death. Importantly,ROS have been implicated in a number of human diseases[16–18], and for example, it is recognized that many types ofcancer cells exhibit increased production of H2O2 that hasbeen linked to proliferative signalling and tumourigenesis[19–22], although low levels of H2O2 appear to be required fornormal proliferative signalling [23].
Cells have evolved a number of mechanisms to counteractoxidative damage including the direct reversal of mutationsthrough mismatch repair and DNA excision pathways [24], theswift elimination of ROS and the reversal of oxidative damage.The latter are achieved through the induction of antioxidantand redox enzymes such as catalase, superoxide dismutase,peroxidases and thioredoxin, through the maintenance of highlevels of molecular scavengers such as glutathione (GSH) andascorbic acid and by S-thiolation, whereby oxidized thiolgroups form mixed disulphides with GSH which are thenregenerated by glutaredoxins and GSH reductase [25, 26]. Thiolgroups are reported to have numerous roles within the cell andtheir redox states affect the activity and structure of many pro-teins including transcription factors, proteases and phospha-tases. It is not surprising, therefore, that all organisms containregulatory machinery whose purpose is to maintain the redoxstatus of SH groups in both proteins and low-molecular-massthiols [27–29]. In yeast, it has been shown that basal protein S-thiolation is maintained at a low level, but is increased duringoxidative stress where it serves an adaptive function by repro-gramming metabolism and protecting protein synthesisagainst irreversible oxidation [30, 31].
Traditionally, molecular and cellular studies have tendedto concentrate on individual genes and their products, al-though more recently, several microarray studies havedetailed the global genomic responses of yeast to a variety ofstresses including oxidative stress [1–3, 32]. In addition, theglobal analysis of gene products by proteomics has alloweda systematic overview of thousands of proteins at the sametime. 2-DE is one of the most widely used proteomicseparation methods and is often employed for the analysisof differential protein expression across biological samples[33, 34]. A significant improvement came with the intro-duction of 2-D-difference gel electrophoresis (2-D-DIGE), inwhich several samples can be codetected on the same 2-DEgel after differential covalent labelling with matched fluo-rescent tags [35–37]. By alleviating the problems of gel-to-gelvariation, the 2-D-DIGE strategy provides improved accu-racy in quantifying protein differences between samples. Afurther level of global investigation has been realized withthe advent of metabolomics where, for example, NMRspectroscopy can be used to measure changes in the levelsof multiple low-molecular weight metabolites across bio-logical samples. Moreover, by integrating data from metab-olite analysis, gene expression profiling and proteomics, keyperturbed metabolic pathways can be identified providing agreater understanding of the biological processes involvedin the response to environmental changes. Metabolomicshas already been used to study toxicological mechanismsand disease processes and offers great potential as a meansof investigating the complex relationship between stressand metabolism [38, 39].
In this study, we have used 2-D-DIGE to examine prote-omic changes generated by the application of peroxide stressto fission yeast and have compared this data with thatobtained from transcriptional and metabolomic profilingacquired under identical growth conditions. The degree towhich each data set correlates and how the changes relate toaltered biological function is shown and discussed. Further-more, we have examined the effects of the loss of the stress-dependent MAP kinase Sty1 on the peroxide stress responseand have been able to differentiate altered gene expressionstates and metabolic pathways between the unstressed andperoxide-stressed cell types.
2 Materials and methods
2.1 Growth and hydrogen peroxide treatment of
S. pombe
Yeast strains used were wild-type (WT) strain 972 h2 and anisogenic Sty1p-deleted mutant strain sty1D (sty1::ura41 ura4-D18 h2). Two litre cultures of WT or sty1D in yeast extract(YE) medium [40] were grown to mid-exponential phase(56106 cells/mL), and subjected to oxidative stress by addi-tion of 0.5 mM H2O2 for 60 min or left untreated. Cells wereharvested by centrifugation (580g), washed twice in water
2006 WILEY-VCH Verlag GmbH & Co. KGaA, Weinheim www.proteomics-journal.com

2774 M. E. Weeks et al. Proteomics 2006, 6, 2772–2796
and re-suspended in 1 mL of grinding/resuspension buffer(10 mM HEPES–HCl pH 7.4, 0.1% IGEPAL CA-630 (pre-viously NP 40), 2 mM EDTA, 4 mg/mL leupeptin, 4 mg/mLaprotinin and 5 mg/mL pepstatin A). Cell suspensions wereimmediately frozen by addition of liquid N2.
2.2 Cell lysis and CyDye-labelling of protein extracts
Frozen cells were broken by grinding for 20 min underliquid N2 in a RM100 mortar grinder (Retsch, Germany) asdescribed [41] and ground lysates stored at 2807C. ForNHS-Cy dye labelling 100 mL aliquots of the lysates weresuspended in 2-D buffer (8 M urea, 2 M thiourea, 4%CHAPS, 0.5% IGEPAL CA-630, 10 mM Tris-HCl pH 8.3)without reductant to give a sample volume of 600 mL. Sam-ples were homogenized by passing through a 25-gaugeneedle six times prior to agitation at room temperature for10–15 min. Insoluble material was removed by centrifuga-tion (12 0006g/10 min/47C). Protein concentrations weredetermined using Coomassie Protein Assay Reagent(Pierce) and a BSA standard curve with four replicate assaysperformed per sample.
A sample amount of 150 mg was aliquoted into tubes forNHS-Cy dye labelling. Equal amounts of protein from eachsample were also mixed to create an internal standard to belabelled with Cy2 and run on each gel. NHS-Cy2 was pur-chased from GE Healthcare (Amersham, UK) whilst NHS-Cy3 and Cy5 were synthesized in-house and stored asdescribed [42]. They are structurally identical to the com-mercially available compounds and highly pure. Sampleswere labelled by addition of 4 pmol of NHS-Cy dye permicrogram of protein (600 pmol/150 mg) and incubation onice in the dark for 30 min. Reactions were quenched with a20-fold molar excess of L-lysine to dye and further incubationon ice in the dark for 10 min. Cy3 and Cy5 were randomlyassigned to biological triplicate samples from separatelygrown and treated cultures for the four conditions underinvestigation. Cy3- and Cy5-labelled samples were mixedappropriately (Table 1) and the same amount (150 mg) of theCy2-labelled pool was added. Samples were reduced withDTT at a final concentration at 65 mM. Carrier ampholines/pharmalyte mixture was added to a final 2% v/v and bromo-phenol blue added. The volume was adjusted to 450 mL withlysis buffer and the samples were agitated prior to cen-trifugation at 12 0006g for 10 min.
Table 1. Typical experimental design showing allocation of Cydye labelling of biological replicates across gels. Cy2was used to label an equal pool (by protein amount) ofall sample replicates
1 2 3 4 5 6
Cy2 Pool Pool Pool Pool Pool PoolCy3 sty1D-60’ WT-60’ WT-0’ sty1D-60’ WT-0’ WT-60’Cy5 WT-0’ Sty1D-0’ WT-60’ Sty1D-0’ Sty1D-0’ Sty1D-60’
2.3 2-DE, fluorescence imaging and image analysis
2-DE was carried out essentially as previously described [43]using 24 cm pH 4–7 L and pH 3–10 NL IPG strips (GEHealthcare) and 12% homogenous SDS-PAGE gels bonded tolow-fluorescence glass plates. Gels were run in Ettan12 geltanks (GE Healthcare) at 2.2 mA per gel and 167C until the dyefront had run off the bottom. All steps were carried out in adedicated clean room. Gels were scanned between glass platesusing a Typhoon 9400 variable mode imager and Image-Quant software (both GE Healthcare). The photomultipliertube voltage was adjusted on each channel (Cy2, Cy3 and Cy5)for preliminary low-resolution scans to give maximum pixelvalues within 5–10% for each Cy-image, but below the satura-tion level. These settings were then used for high-resolution(100 mm) scans of all gels. Images were exported as tiff files forimage analysis. Images were then curated and analysed usingDeCyder software v5.0 (GE Healthcare) essentially as pre-viously described [43]. Here comparison of test spot volumes(Cy3 or Cy5 labelled) with the corresponding standard spotvolume (Cy2 labelled) gave a standardized abundance for eachmatched spot and values were averaged across biological tri-plicates. Only spots displaying a �1.5 average-fold increase ordecrease in abundance between each condition, matchingacross all gel images and having p values ,0.05 were selectedfor identification.
2.4 Spot picking, tryptic digestion and protein
identification
All gels were poststained with colloidal Coomassie Blue G-250 (CCB) and imaged as previously described [43]. CCB-stained images were then matched with the correspondingfluorescent images using DeCyder and a pick list of coordi-nates relative to two reference markers (stuck to plates atcasting) was generated for robotic excision from gels usingan Ettan automated spot picker (GE Healthcare). Spots werecollected in 96-well plates, proteins digested with trypsin andresultant peptides extracted as described previously [43].Extracts were dried, resuspended in 5 mL of 20 mM ammo-nium phosphate and spotted (0.5 mL/sample) onto MALDItarget plates with 1 mL of saturated 2,5-dihydroxybenzoic acid(DHB) in 20 mM ammonium phosphate using the drieddroplet method.
MALDI-TOF MS with peptide mass fingerprinting wasused for protein identification. MALDI mass spectra wereacquired using an Ultraflex mass spectrometer (Bruker Dal-tonics) in the reflector mode externally calibrated using an‘in-house’ mixture of standard peptides. Spectra were ana-lysed in FlexAnalysis (Bruker Daltonics). Where possiblethe spectra were internally calibrated using the trypsin auto-lysis peaks at m/z 842.51 and m/z 2211.10. The SNAP algo-rithm in FlexAnalysis was used to pick up to the 100 mostprominent peaks in the mass range m/z 600–5000. Masslists were extracted from the Ultraflex data files using an in-house Perl script, UltraMassList (http://www.ludwig.ucl.
2006 WILEY-VCH Verlag GmbH & Co. KGaA, Weinheim www.proteomics-journal.com
Proteomics 2006, 6, 2772–2796 Animal Proteomics 2775
ac.uk/bachem_html/software.htm). Another Perl script Com-monContam (http://www.ludwig.ucl.ac.uk/bachem_html/software.htm), based on the software of Schimdt et al. [44], wasused to identify masses common to all peak lists (i.e. matrixpeaks, trypsin peaks) above a user-defined threshold. Com-mon masses were removed and the resulting peptide massfingerprints were searched against an up-to-date NCBI andS. pombe database using MASCOT with the automated MAS-COT Daemon (Matrix Sciences v1.9.0 or later v.2.0). A positiveidentification was accepted when a minimum of six peptidemasses matched to a particular protein (mass error of650 ppm allowing one missed cleavage), matched peptidesrepresented�25% of the protein sequence, the MOWSE scorewas over the threshold score (p = 0.05), the hit appeared in thetop five hits in both database searches and the gel-based mo-lecular weight was in general agreement with the predictedmolecular weight of the identified protein.
2.5 Deletion of SPACUNK4.17 and SPAC23H3.15c
S. pombe gene deletions were constructed using establishedmethods [45]. All oligonucleotide sequences used are avail-able upon request. To test for sensitivity to H2O2, 8 mL ofserial five-fold dilutions of cells were plated on YE mediawith and without H2O2 and grown for 4 days at 307C prior toexamination of growth. The starting concentration of cellswas 46106 cells/mL. The sty1D and atf1D mutants, whichhave known sensitivity to H2O2, were used as controls.
2.6 1H NMR analysis of cellular metabolites
Ground yeast lysate (corresponding to 7.5 mg of total protein)from five biological replicates were extracted in 6% perchloricacid as previously described [46]. Neutralized extracts werefreeze-dried and reconstituted in 1 mL of D2O, and the extracts(0.5 mL) were placed in 5 mm NMR tubes. 1H NMR of cellextracts was performed on a Bruker 600 MHz NMR system(pulse angle: 907; repetition time: 5 s). The water resonancewas suppressed by gated irradiation centred on the waterfrequency. Sodium 3-trimethylsilyl-2,2,3,3-tetradeuteropro-pionate (25 mL, 10 mM) was added to the samples for chemicalshift calibration and quantification. All cell extract spectrawere acquired under identical conditions.
3 Results and discussion
3.1 2-D-DIGE and MS analysis of H2O2 and
Sty1p-dependent protein expression
Lysates of control and H2O2-treated WT and sty1D mutantS. pombe cells were compared as biological triplicates using2-D-DIGE allowing the averaging of possible variations ingrowth conditions, sample processing and gel running. Atreatment of 0.5 mM H2O2 for 60 min (60’) was chosen as anoxidative stress since this is known to induce stress genes
while causing minimal cell death and was the concentrationused in a previous parallel global transcriptional analysis [1].It should be noted that the transcriptional responses ofS. pombe vary with H2O2 concentration [47], and here wedescribe the responses to an intermediate level of oxidant.Samples were labelled with either Cy3 or Cy5 and run againsta Cy2-labelled pool of all samples, run on all gels as an inter-nal standard for improved cross-gel matching and quantita-tion [35, 48]. Three experiments were conducted using pH 3–10 nonlinear pH range IPG strips and two with pH 4–7separations. For each experiment DeCyder software was usedto find protein features displaying a .1.5 average fold-change in abundance in WT and sty1D cells in response toH2O2 or between the WT and sty1D cells. Figure 1 shows atypical master gel as an overlay of images (WT-60’ vs. sty1D-60’) with the position of all proteins for which unambiguousidentifications were obtained by MALDI-TOF MS and pep-tide mass fingerprinting.
A total of 260 protein isoforms were identified whichdisplayed significant differences in expression in one ormore of the comparisons (WT-60’ vs. WT-0’, sty1D-60’ vs.sty1D-0’, sty1D-0’ vs. WT-0’ and sty1D-60’ vs. WT-60’). Thecomplete data set is shown in Table S1 of SupplementaryMaterial. Average abundance ratios (based on fluorescenceintensity) for 836 data points out of a possible 1040 wereobtained. Unrecorded data points fell outside the selectionparameters (i.e. not matching across all gels or had p values.0.2). There were 777 data points with significant p values of,0.05. The 260 proteins represented 158 different geneproducts demonstrating a high degree of PTMs or proteo-lysis. Within the entire sample set, 33 spots yielded dataindicating that they contained two proteins with one spotyielding three. In these instances, the quantitative data can-not be assigned to an individual gene product, although thetarget of altered expression could be inferred in some casesfrom correlative changes in mRNA levels (see below). Acomparison of predicted vs. gel-based Mr and pI was con-ducted (Fig. 2). The correlation of Mr was reasonable and wasused as an additional level of confidence for protein identifi-cations, although it was skewed for higher Mr gene productsas these are under-represented on 2-D gels. The pIs corre-lated much less well, again demonstrating a high degree ofPTMs that affect pI (see below).
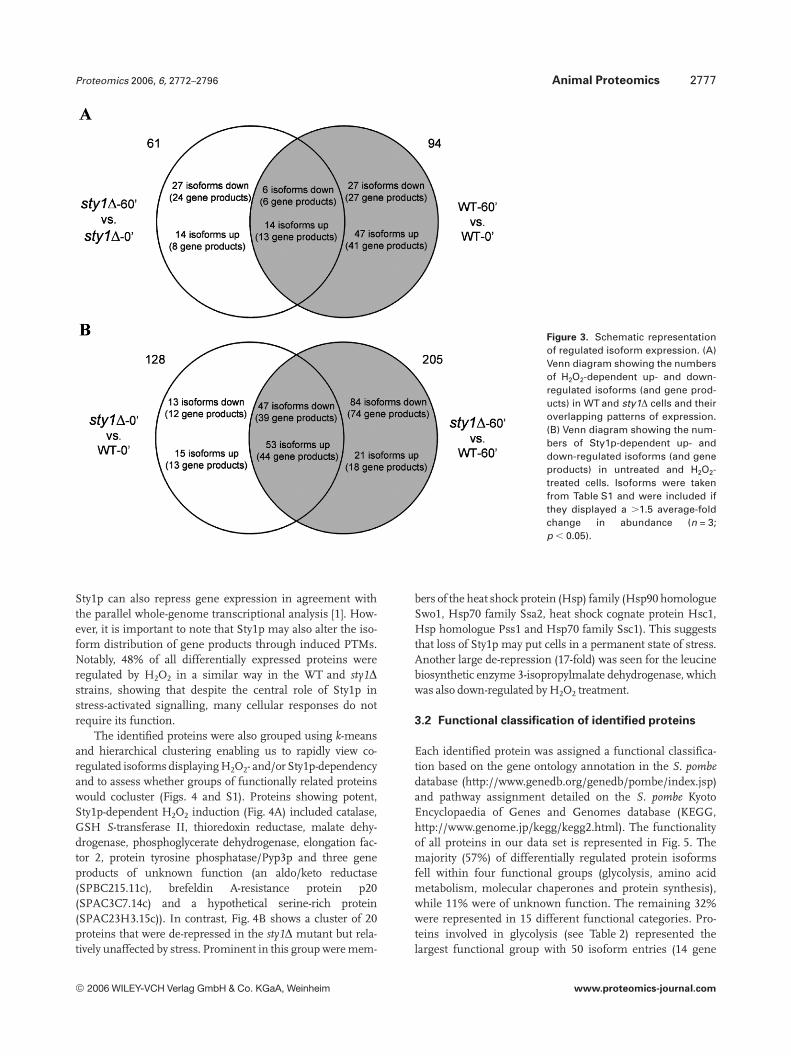
Figure 3A shows the number and direction of regulationof proteins changing due to H2O2 treatment for each strainand how these overlap, whilst Fig. 3B shows the number anddirection of regulation between cell types in the absence andpresence of stress. The greatest number of differences wasobserved when comparing WT-60’ with sty1D-60’ indicating acritical role of Sty1p in the stress response. Indeed, 47 pro-tein isoforms were up-regulated in WT in response to H2O2
compared to 14 for sty1D, whilst there were a similar numberof down-regulated proteins. Differences were also observedbetween unstressed WT and sty1D with 60 proteins (51 geneproducts) requiring Sty1p for basal expression. A number ofgene products were also de-repressed in sty1D showing that
2006 WILEY-VCH Verlag GmbH & Co. KGaA, Weinheim www.proteomics-journal.com

2776 M. E. Weeks et al. Proteomics 2006, 6, 2772–2796
Figure 1. Master gel image showing the positions of S. pombe protein isoforms displaying peroxide and/or Sty1p-dependent changes inexpression. Figure shows an overlay of two pseudo-coloured images of a WT-60’ sample repeat (Cy3, red) and a sty1D-60’ sample repeat(Cy5, blue) created in Photoshop v7. Images were taken from a bonded pH 3–10 NL IPG, 24 cm624 cm61 mm, 12.5% bis/acrylamide gel.Numbers and arrows indicate positions of differentially expressed spots selected by DeCyder software that were identified with high con-fidence by MALDI-TOF MS (see Table S1).
Figure 2. (A) Graphical compar-ison of predicted vs. experimen-tally/gel-determined Mr and (B)pIs for the identified protein iso-forms. Predicted pI and Mr weretaken from databases. Gel-based pI and Mr were calculatedusing DeCyder software basedon selected reference proteinswhere gel-based values andpredicted values were in agree-ment.
2006 WILEY-VCH Verlag GmbH & Co. KGaA, Weinheim www.proteomics-journal.com
Proteomics 2006, 6, 2772–2796 Animal Proteomics 2777
Figure 3. Schematic representationof regulated isoform expression. (A)Venn diagram showing the numbersof H2O2-dependent up- and down-regulated isoforms (and gene prod-ucts) in WT and sty1D cells and theiroverlapping patterns of expression.(B) Venn diagram showing the num-bers of Sty1p-dependent up- anddown-regulated isoforms (and geneproducts) in untreated and H2O2-treated cells. Isoforms were takenfrom Table S1 and were included ifthey displayed a .1.5 average-foldchange in abundance (n = 3;p , 0.05).
Sty1p can also repress gene expression in agreement withthe parallel whole-genome transcriptional analysis [1]. How-ever, it is important to note that Sty1p may also alter the iso-form distribution of gene products through induced PTMs.Notably, 48% of all differentially expressed proteins wereregulated by H2O2 in a similar way in the WT and sty1Dstrains, showing that despite the central role of Sty1p instress-activated signalling, many cellular responses do notrequire its function.
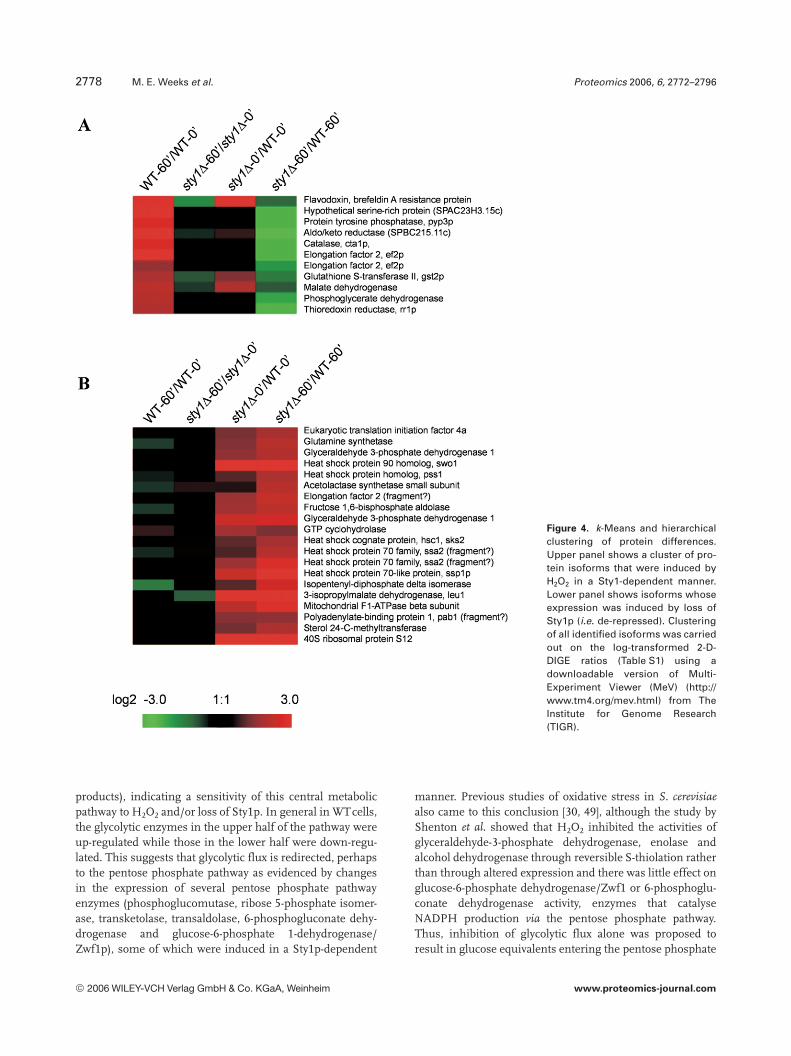
The identified proteins were also grouped using k-meansand hierarchical clustering enabling us to rapidly view co-regulated isoforms displaying H2O2- and/or Sty1p-dependencyand to assess whether groups of functionally related proteinswould cocluster (Figs. 4 and S1). Proteins showing potent,Sty1p-dependent H2O2 induction (Fig. 4A) included catalase,GSH S-transferase II, thioredoxin reductase, malate dehy-drogenase, phosphoglycerate dehydrogenase, elongation fac-tor 2, protein tyrosine phosphatase/Pyp3p and three geneproducts of unknown function (an aldo/keto reductase(SPBC215.11c), brefeldin A-resistance protein p20(SPAC3C7.14c) and a hypothetical serine-rich protein(SPAC23H3.15c)). In contrast, Fig. 4B shows a cluster of 20proteins that were de-repressed in the sty1D mutant but rela-tively unaffected by stress. Prominent in this group were mem-
bers of the heat shock protein (Hsp) family (Hsp90 homologueSwo1, Hsp70 family Ssa2, heat shock cognate protein Hsc1,Hsp homologue Pss1 and Hsp70 family Ssc1). This suggeststhat loss of Sty1p may put cells in a permanent state of stress.Another large de-repression (17-fold) was seen for the leucinebiosynthetic enzyme 3-isopropylmalate dehydrogenase, whichwas also down-regulated by H2O2 treatment.
3.2 Functional classification of identified proteins
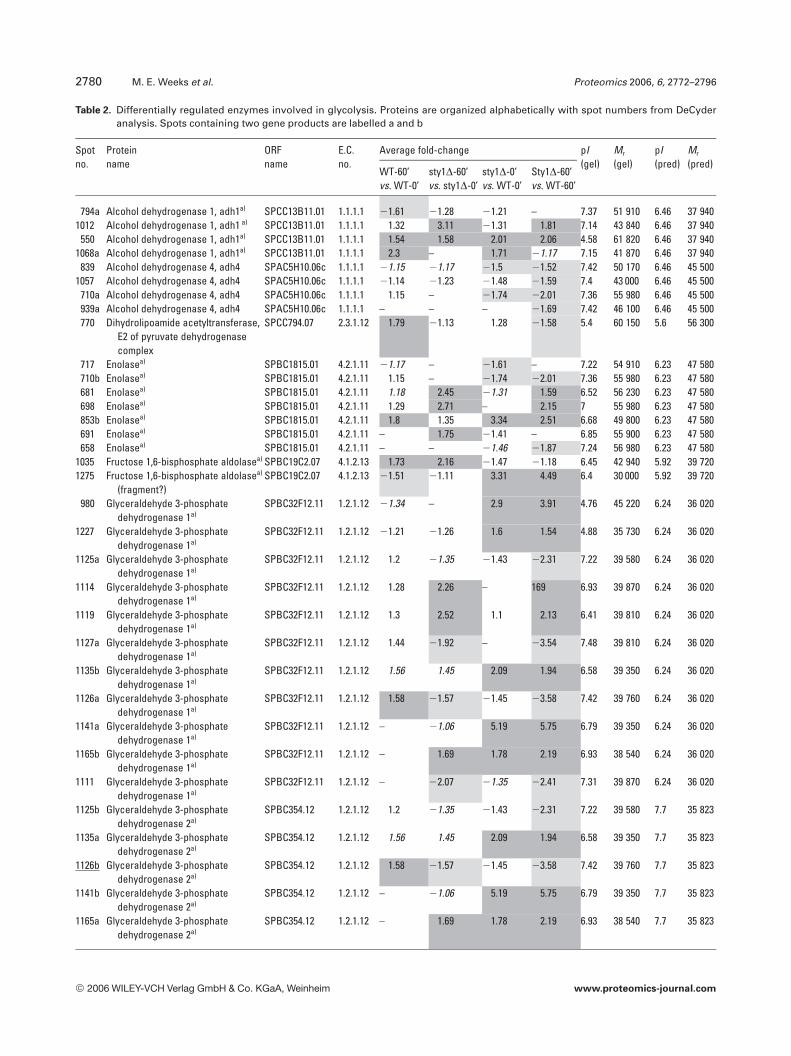
Each identified protein was assigned a functional classifica-tion based on the gene ontology annotation in the S. pombedatabase (http://www.genedb.org/genedb/pombe/index.jsp)and pathway assignment detailed on the S. pombe KyotoEncyclopaedia of Genes and Genomes database (KEGG,http://www.genome.jp/kegg/kegg2.html). The functionalityof all proteins in our data set is represented in Fig. 5. Themajority (57%) of differentially regulated protein isoformsfell within four functional groups (glycolysis, amino acidmetabolism, molecular chaperones and protein synthesis),while 11% were of unknown function. The remaining 32%were represented in 15 different functional categories. Pro-teins involved in glycolysis (see Table 2) represented thelargest functional group with 50 isoform entries (14 gene
2006 WILEY-VCH Verlag GmbH & Co. KGaA, Weinheim www.proteomics-journal.com
2778 M. E. Weeks et al. Proteomics 2006, 6, 2772–2796
Figure 4. k-Means and hierarchicalclustering of protein differences.Upper panel shows a cluster of pro-tein isoforms that were induced byH2O2 in a Sty1-dependent manner.Lower panel shows isoforms whoseexpression was induced by loss ofSty1p (i.e. de-repressed). Clusteringof all identified isoforms was carriedout on the log-transformed 2-D-DIGE ratios (Table S1) using adownloadable version of Multi-Experiment Viewer (MeV) (http://www.tm4.org/mev.html) from TheInstitute for Genome Research(TIGR).
products), indicating a sensitivity of this central metabolicpathway to H2O2 and/or loss of Sty1p. In general in WTcells,the glycolytic enzymes in the upper half of the pathway wereup-regulated while those in the lower half were down-regu-lated. This suggests that glycolytic flux is redirected, perhapsto the pentose phosphate pathway as evidenced by changesin the expression of several pentose phosphate pathwayenzymes (phosphoglucomutase, ribose 5-phosphate isomer-ase, transketolase, transaldolase, 6-phosphogluconate dehy-drogenase and glucose-6-phosphate 1-dehydrogenase/Zwf1p), some of which were induced in a Sty1p-dependent
manner. Previous studies of oxidative stress in S. cerevisiaealso came to this conclusion [30, 49], although the study byShenton et al. showed that H2O2 inhibited the activities ofglyceraldehyde-3-phosphate dehydrogenase, enolase andalcohol dehydrogenase through reversible S-thiolation ratherthan through altered expression and there was little effect onglucose-6-phosphate dehydrogenase/Zwf1 or 6-phosphoglu-conate dehydrogenase activity, enzymes that catalyseNADPH production via the pentose phosphate pathway.Thus, inhibition of glycolytic flux alone was proposed toresult in glucose equivalents entering the pentose phosphate
2006 WILEY-VCH Verlag GmbH & Co. KGaA, Weinheim www.proteomics-journal.com

Proteomics 2006, 6, 2772–2796 Animal Proteomics 2779
Figure 5. Functional classification and distribution of all identified protein isoforms. Gene Ontology (GO) annotation terms for biologicalprocess and molecular function were taken from the S. pombe gene database (http://www.genedb.org/genedb/pombe/index.jsp), theKyoto Encyclopaedia of Genes and Genomes (KEGG) Pathways Database (http://www.genome.jp/kegg/kegg2.html) and the Swiss-Prot/TrEMBL protein database (http://us.expasy.org/sprot/). Unknown proteins include those which have no ascribed function, but may fall intoa putative enzyme class based on sequence homology.
pathway for the generation of NADPH and reductive capacity[30]. Phosphoglucomutase (induced in a Sty1-dependentmanner) is also required for the synthesis of the knownstress-protectant sugar trehalose, in agreement with obser-vations made in S. cerevisiae [49]; however, other enzymes inthis pathway were not found.
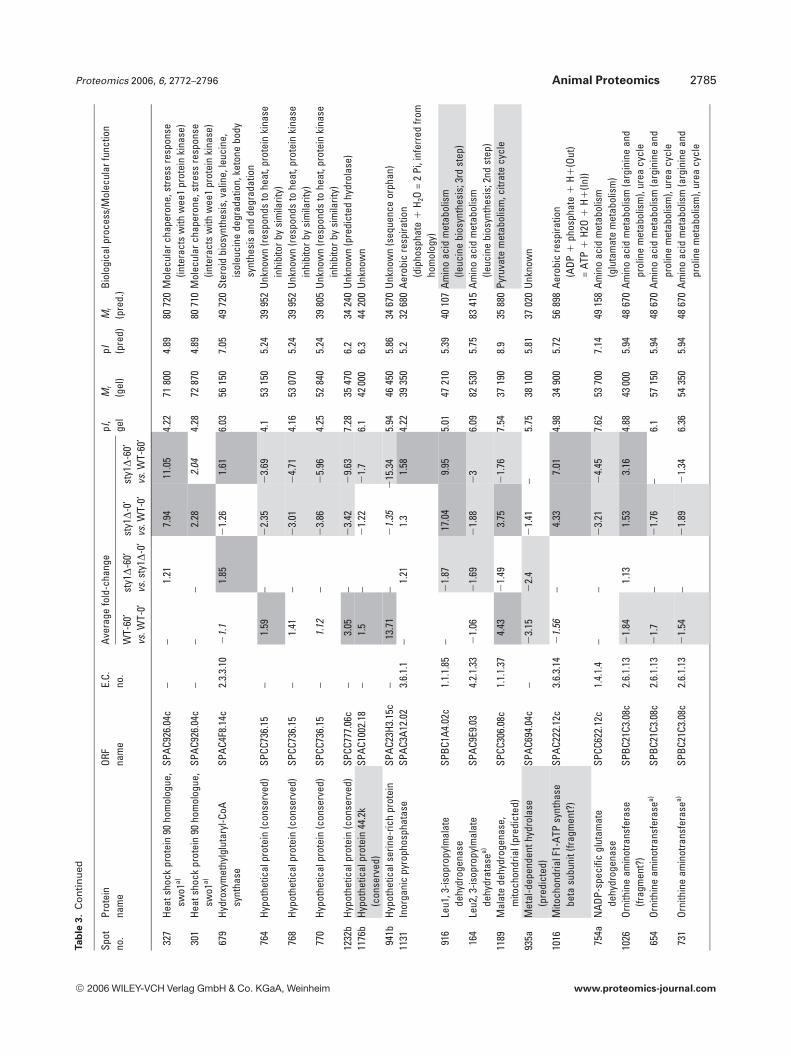
Amino acid metabolism also featured heavily with 42identified isoforms (25 gene products), as did protein syn-thesis (27 identifications) and protein degradation/proces-sing (9 identifications). These results suggest that globalalterations in protein turnover may occur in response toH2O2 through the regulation of amino acid synthesis, pro-tein synthesis and degradation. Although oxidative stress hasbeen shown to inhibit protein synthesis in S. cerevisiae [30],here, no broad pattern of coregulation could be discernedwhich might suggest a global switch in translational activity.For example, whilst isoforms of five eukaryotic translationinitiation factors were identified (eIF2a, eIF2Bg, eIF3 RNA-binding subunit, eIF3 p39 subunit and eIF4A), they dis-played different patterns of expression in response to H2O2,as did the seven ribosomal proteins identified. Molecularchaperones appeared 29 times, the majority of which wereHsps (Table 3). These changes may be required to aid proteinfolding in a more oxidizing environment or for the removalof aggregated or misfolded proteins; however, there was nocommon pattern of regulation apparent.
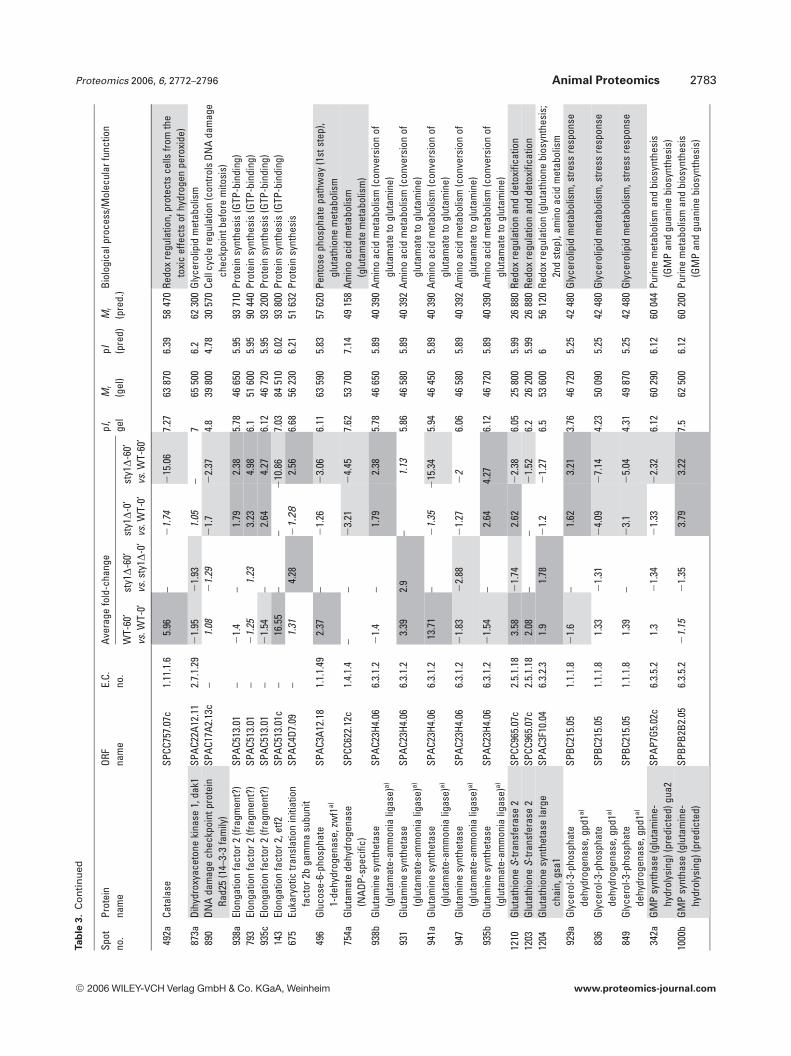
Of particular interest to this study were proteins knownto be involved in redox regulation and it is not surprising thatthere were 32 oxidoreductases in the 158 gene productsidentified. The redox enzymes catalase, thioredoxin reduc-tase, GST2 and thioredoxin peroxidase were all up-regulatedin WT cells exposed to H2O2, but were not induced in sty1D
cells (Table 3). This demonstrates the critical role played bySty1p signalling in the induction of antioxidants for removalof cellular H2O2 and protection from oxidative stress. Inter-estingly, one of these antioxidant enzymes, the highly con-served 2 cys-peroxiredoxin thioredoxin peroxidase (Tpx1p),was recently shown to directly activate Sty1p by a mechanisminvolving the formation of a peroxide-induced disulphidecomplex between Tpx1p and Sty1p, with overexpression ofTpx1p resulting in hyperactivation of Sty1p [50]. Thus, thereappears to be a feedback mechanism whereby Sty1 activity isrequired for the induction of one of its own activators. Nota-bly, GSH synthetase large chain/Gsa1p (SPAC3F10.04) wasinduced by H2O2 in both cell types (Table 3) and may berequired to increase GSH production, whilst Sty1p-depend-ent glucose-6-phosphate dehydrogenase induction andinduction of succinate semialdehyde dehydrogenase wouldalso increase NADPH reducing equivalents for reduction ofGSH and protein. Several gene products of unknown func-tion also displayed Sty1p-dependent induction (aldo/ketoreductase SPBC215.11c, brefeldin A-resistance protein p20SPAC3C7.14c, sugar oxidoreductase SPACUNK4.17 and hy-pothetical proteins SPAC23H3.15c, SPCC777.06c,SPAC1002.18), suggesting that they too may be antioxidants.To further investigate the function of two of these unchar-acterized gene products, whose mRNAs were also induced(namely hypothetical serine-rich protein SPAC23H3.15c andsugar oxidoreductase SPACUNK4.17), we constructedmutant strains lacking these genes and tested their sensitiv-ity to H2O2. Figure 6 shows that growth of the sty1D mutant,and to a lesser extent an atf1D mutant, was as expected, sen-sitive to H2O2. However, there was no apparent effect ofdeleting SPAC23H3.15c or SPACUNK4.17. Thus, being
2006 WILEY-VCH Verlag GmbH & Co. KGaA, Weinheim www.proteomics-journal.com
2780 M. E. Weeks et al. Proteomics 2006, 6, 2772–2796
Table 2. Differentially regulated enzymes involved in glycolysis. Proteins are organized alphabetically with spot numbers from DeCyderanalysis. Spots containing two gene products are labelled a and b
Spotno.
Proteinname
ORFname
E.C.no.
Average fold-change pI(gel)
Mr
(gel)pI(pred)
Mr
(pred)WT-60’vs. WT-0’
sty1D-60’vs. sty1D-0’
sty1D-0’vs. WT-0’
Sty1D-60’vs. WT-60’
794a Alcohol dehydrogenase 1, adh1a) SPCC13B11.01 1.1.1.1 21.61 21.28 21.21 – 7.37 51 910 6.46 37 9401012 Alcohol dehydrogenase 1, adh1 a) SPCC13B11.01 1.1.1.1 1.32 3.11 21.31 1.81 7.14 43 840 6.46 37 940
550 Alcohol dehydrogenase 1, adh1a) SPCC13B11.01 1.1.1.1 1.54 1.58 2.01 2.06 4.58 61 820 6.46 37 9401068a Alcohol dehydrogenase 1, adh1a) SPCC13B11.01 1.1.1.1 2.3 – 1.71 21.17 7.15 41 870 6.46 37 940
839 Alcohol dehydrogenase 4, adh4 SPAC5H10.06c 1.1.1.1 21.15 21.17 21.5 21.52 7.42 50 170 6.46 45 5001057 Alcohol dehydrogenase 4, adh4 SPAC5H10.06c 1.1.1.1 21.14 21.23 21.48 21.59 7.4 43 000 6.46 45 500
710a Alcohol dehydrogenase 4, adh4 SPAC5H10.06c 1.1.1.1 1.15 – 21.74 22.01 7.36 55 980 6.46 45 500939a Alcohol dehydrogenase 4, adh4 SPAC5H10.06c 1.1.1.1 – – – 21.69 7.42 46 100 6.46 45 500770 Dihydrolipoamide acetyltransferase,
E2 of pyruvate dehydrogenasecomplex
SPCC794.07 2.3.1.12 1.79 21.13 1.28 21.58 5.4 60 150 5.6 56 300
717 Enolasea) SPBC1815.01 4.2.1.11 21.17 – 21.61 – 7.22 54 910 6.23 47 580710b Enolasea) SPBC1815.01 4.2.1.11 1.15 – 21.74 22.01 7.36 55 980 6.23 47 580681 Enolasea) SPBC1815.01 4.2.1.11 1.18 2.45 21.31 1.59 6.52 56 230 6.23 47 580698 Enolasea) SPBC1815.01 4.2.1.11 1.29 2.71 – 2.15 7 55 980 6.23 47 580853b Enolasea) SPBC1815.01 4.2.1.11 1.8 1.35 3.34 2.51 6.68 49 800 6.23 47 580691 Enolasea) SPBC1815.01 4.2.1.11 – 1.75 21.41 – 6.85 55 900 6.23 47 580658 Enolasea) SPBC1815.01 4.2.1.11 – – 21.46 21.87 7.24 56 980 6.23 47 580
1035 Fructose 1,6-bisphosphate aldolasea) SPBC19C2.07 4.1.2.13 1.73 2.16 21.47 21.18 6.45 42 940 5.92 39 7201275 Fructose 1,6-bisphosphate aldolasea)
(fragment?)SPBC19C2.07 4.1.2.13 21.51 21.11 3.31 4.49 6.4 30 000 5.92 39 720
980 Glyceraldehyde 3-phosphatedehydrogenase 1a)
SPBC32F12.11 1.2.1.12 21.34 – 2.9 3.91 4.76 45 220 6.24 36 020
1227 Glyceraldehyde 3-phosphatedehydrogenase 1a)
SPBC32F12.11 1.2.1.12 21.21 21.26 1.6 1.54 4.88 35 730 6.24 36 020
1125a Glyceraldehyde 3-phosphatedehydrogenase 1a)
SPBC32F12.11 1.2.1.12 1.2 21.35 21.43 22.31 7.22 39 580 6.24 36 020
1114 Glyceraldehyde 3-phosphatedehydrogenase 1a)
SPBC32F12.11 1.2.1.12 1.28 2.26 – 169 6.93 39 870 6.24 36 020
1119 Glyceraldehyde 3-phosphatedehydrogenase 1a)
SPBC32F12.11 1.2.1.12 1.3 2.52 1.1 2.13 6.41 39 810 6.24 36 020
1127a Glyceraldehyde 3-phosphatedehydrogenase 1a)
SPBC32F12.11 1.2.1.12 1.44 21.92 – 23.54 7.48 39 810 6.24 36 020
1135b Glyceraldehyde 3-phosphatedehydrogenase 1a)
SPBC32F12.11 1.2.1.12 1.56 1.45 2.09 1.94 6.58 39 350 6.24 36 020
1126a Glyceraldehyde 3-phosphatedehydrogenase 1a)
SPBC32F12.11 1.2.1.12 1.58 21.57 21.45 23.58 7.42 39 760 6.24 36 020
1141a Glyceraldehyde 3-phosphatedehydrogenase 1a)
SPBC32F12.11 1.2.1.12 – 21.06 5.19 5.75 6.79 39 350 6.24 36 020
1165b Glyceraldehyde 3-phosphatedehydrogenase 1a)
SPBC32F12.11 1.2.1.12 – 1.69 1.78 2.19 6.93 38 540 6.24 36 020
1111 Glyceraldehyde 3-phosphatedehydrogenase 1a)
SPBC32F12.11 1.2.1.12 – 22.07 21.35 22.41 7.31 39 870 6.24 36 020
1125b Glyceraldehyde 3-phosphatedehydrogenase 2a)
SPBC354.12 1.2.1.12 1.2 21.35 21.43 22.31 7.22 39 580 7.7 35 823
1135a Glyceraldehyde 3-phosphatedehydrogenase 2a)
SPBC354.12 1.2.1.12 1.56 1.45 2.09 1.94 6.58 39 350 7.7 35 823
1126b Glyceraldehyde 3-phosphatedehydrogenase 2a)
SPBC354.12 1.2.1.12 1.58 21.57 21.45 23.58 7.42 39 760 7.7 35 823
1141b Glyceraldehyde 3-phosphatedehydrogenase 2a)
SPBC354.12 1.2.1.12 – 21.06 5.19 5.75 6.79 39 350 7.7 35 823
1165a Glyceraldehyde 3-phosphatedehydrogenase 2a)
SPBC354.12 1.2.1.12 – 1.69 1.78 2.19 6.93 38 540 7.7 35 823
2006 WILEY-VCH Verlag GmbH & Co. KGaA, Weinheim www.proteomics-journal.com
Proteomics 2006, 6, 2772–2796 Animal Proteomics 2781
Table 2. Continued
Spotno.
Proteinname
ORFname
E.C.no.
Average fold-change pI(gel)
Mr
(gel)pI(pred)
Mr
(pred)WT-60’vs. WT-0’
sty1D-60’vs. sty1D-0’
sty1D-0’vs. WT-0’
Sty1D-60’vs. WT-60’
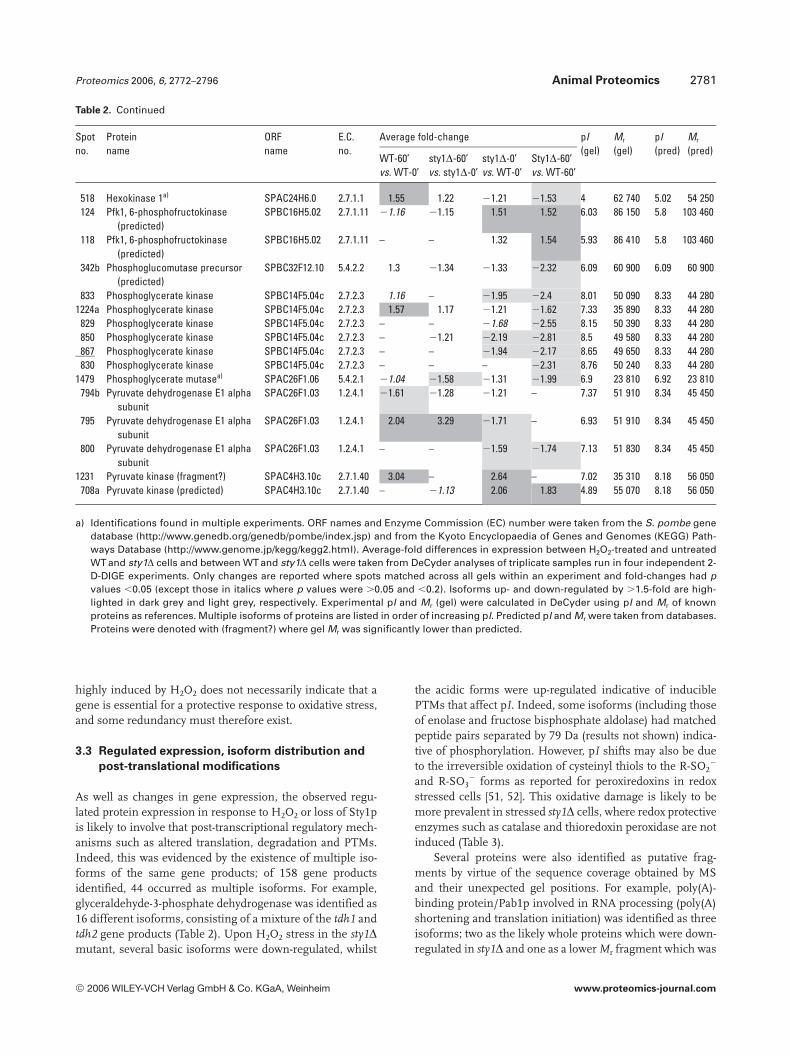
518 Hexokinase 1a) SPAC24H6.0 2.7.1.1 1.55 1.22 21.21 21.53 4 62 740 5.02 54 250124 Pfk1, 6-phosphofructokinase
(predicted)SPBC16H5.02 2.7.1.11 21.16 21.15 1.51 1.52 6.03 86 150 5.8 103 460
118 Pfk1, 6-phosphofructokinase(predicted)
SPBC16H5.02 2.7.1.11 – – 1.32 1.54 5.93 86 410 5.8 103 460
342b Phosphoglucomutase precursor(predicted)
SPBC32F12.10 5.4.2.2 1.3 21.34 21.33 22.32 6.09 60 900 6.09 60 900
833 Phosphoglycerate kinase SPBC14F5.04c 2.7.2.3 1.16 – 21.95 22.4 8.01 50 090 8.33 44 2801224a Phosphoglycerate kinase SPBC14F5.04c 2.7.2.3 1.57 1.17 21.21 21.62 7.33 35 890 8.33 44 280
829 Phosphoglycerate kinase SPBC14F5.04c 2.7.2.3 – – 21.68 22.55 8.15 50 390 8.33 44 280850 Phosphoglycerate kinase SPBC14F5.04c 2.7.2.3 – 21.21 22.19 22.81 8.5 49 580 8.33 44 280867 Phosphoglycerate kinase SPBC14F5.04c 2.7.2.3 – – 21.94 22.17 8.65 49 650 8.33 44 280830 Phosphoglycerate kinase SPBC14F5.04c 2.7.2.3 – – – 22.31 8.76 50 240 8.33 44 280
1479 Phosphoglycerate mutasea) SPAC26F1.06 5.4.2.1 21.04 21.58 21.31 21.99 6.9 23 810 6.92 23 810794b Pyruvate dehydrogenase E1 alpha
subunitSPAC26F1.03 1.2.4.1 21.61 21.28 21.21 – 7.37 51 910 8.34 45 450
795 Pyruvate dehydrogenase E1 alphasubunit
SPAC26F1.03 1.2.4.1 2.04 3.29 21.71 – 6.93 51 910 8.34 45 450
800 Pyruvate dehydrogenase E1 alphasubunit
SPAC26F1.03 1.2.4.1 – – 21.59 21.74 7.13 51 830 8.34 45 450
1231 Pyruvate kinase (fragment?) SPAC4H3.10c 2.7.1.40 3.04 – 2.64 – 7.02 35 310 8.18 56 050708a Pyruvate kinase (predicted) SPAC4H3.10c 2.7.1.40 – 21.13 2.06 1.83 4.89 55 070 8.18 56 050
a) Identifications found in multiple experiments. ORF names and Enzyme Commission (EC) number were taken from the S. pombe genedatabase (http://www.genedb.org/genedb/pombe/index.jsp) and from the Kyoto Encyclopaedia of Genes and Genomes (KEGG) Path-ways Database (http://www.genome.jp/kegg/kegg2.html). Average-fold differences in expression between H2O2-treated and untreatedWT and sty1D cells and between WT and sty1D cells were taken from DeCyder analyses of triplicate samples run in four independent 2-D-DIGE experiments. Only changes are reported where spots matched across all gels within an experiment and fold-changes had pvalues ,0.05 (except those in italics where p values were .0.05 and ,0.2). Isoforms up- and down-regulated by .1.5-fold are high-lighted in dark grey and light grey, respectively. Experimental pI and Mr (gel) were calculated in DeCyder using pI and Mr of knownproteins as references. Multiple isoforms of proteins are listed in order of increasing pI. Predicted pI and Mr were taken from databases.Proteins were denoted with (fragment?) where gel Mr was significantly lower than predicted.
highly induced by H2O2 does not necessarily indicate that agene is essential for a protective response to oxidative stress,and some redundancy must therefore exist.
3.3 Regulated expression, isoform distribution and
post-translational modifications
As well as changes in gene expression, the observed regu-lated protein expression in response to H2O2 or loss of Sty1pis likely to involve that post-transcriptional regulatory mech-anisms such as altered translation, degradation and PTMs.Indeed, this was evidenced by the existence of multiple iso-forms of the same gene products; of 158 gene productsidentified, 44 occurred as multiple isoforms. For example,glyceraldehyde-3-phosphate dehydrogenase was identified as16 different isoforms, consisting of a mixture of the tdh1 andtdh2 gene products (Table 2). Upon H2O2 stress in the sty1Dmutant, several basic isoforms were down-regulated, whilst
the acidic forms were up-regulated indicative of induciblePTMs that affect pI. Indeed, some isoforms (including thoseof enolase and fructose bisphosphate aldolase) had matchedpeptide pairs separated by 79 Da (results not shown) indica-tive of phosphorylation. However, pI shifts may also be dueto the irreversible oxidation of cysteinyl thiols to the R-SO2
2
and R-SO32 forms as reported for peroxiredoxins in redox
stressed cells [51, 52]. This oxidative damage is likely to bemore prevalent in stressed sty1D cells, where redox protectiveenzymes such as catalase and thioredoxin peroxidase are notinduced (Table 3).
Several proteins were also identified as putative frag-ments by virtue of the sequence coverage obtained by MSand their unexpected gel positions. For example, poly(A)-binding protein/Pab1p involved in RNA processing (poly(A)shortening and translation initiation) was identified as threeisoforms; two as the likely whole proteins which were down-regulated in sty1D and one as a lower Mr fragment which was
2006 WILEY-VCH Verlag GmbH & Co. KGaA, Weinheim www.proteomics-journal.com

2782 M. E. Weeks et al. Proteomics 2006, 6, 2772–2796Tab
le3.
Dif
fere
nti
ally
reg
ula
ted
pro
tein
iso
form
so
fin
tere
st.E
xpre
ssio
nd
ata
are
sho
wn
for1
13se
lect
edis
ofo
rms,
som
eo
fwh
ich
are
dis
cuss
edin
the
text
.An
no
tati
on
fort
he
tab
leis
asfo
rTa
ble
2,ex
cep
tth
atsh
aded
pro
tein
nam
esin
dic
ate
tho
seid
enti
fied
inp
H4–
7g
els
and
on
tolo
gy
ann
ota
tio
nte
rms
for
bio
log
ical
pro
cess
and
mo
lecu
lar
fun
ctio
nw
ere
take
nfr
om
the
S.
po
mb
eg
ene
dat
abas
e(h
ttp
://w
ww
.gen
edb
.org
/gen
edb
/po
mb
e/in
dex
.jsp
),th
eS
wis
s-P
rot/
TrE
MB
Lp
rote
ind
atab
ase
(htt
p://
us.
exp
asy.
org
/sp
rot/
)an
dfr
om
the
Kyo
toE
ncy
clo
pae
dia
of
Gen
esan
dG
eno
mes
(KE
GG
)P
ath
way
sD
atab
ase
(htt
p://
ww
w.g
eno
me.
jp/k
egg
/keg
g2.
htm
l).S
had
edb
iolo
gic
alp
roce
ss/m
ole
cula
rfu
nct
ion
ind
icat
esp
rote
ins
wit
hkn
ow
nro
les
inre
do
xre
gu
lati
on
or
po
sses
sin
gkn
ow
no
rp
red
icte
do
xid
ore
du
ctas
eac
tivi
ty
Spot
no.
Prot
ein
nam
eOR
Fna
me
E.C.
no.
Aver
age
fold
-cha
nge
pI,
gel
Mr
(gel
)pI (p
red)
Mr
(pre
d.)Bi
olog
ical
proc
ess/
Mol
ecul
arfu
nctio
n
WT-
60’
vs.W
T-0’
sty1D
-60’
vs.s
ty1D
-0’
sty1D
-0’
vs.W
T-0’
sty1D
-60’
vs.W
T-60
’
1176
a2-
Hydr
oxy
acid
dehy
drog
enas
e(p
redi
cted
)SP
ACUN
K4.1
0–
1.5
–2
1.22
21.
76.
142
000
6.1
3670
0Am
ino
acid
met
abol
ism
(ser
ine
bios
ynth
esis
)13
1740
SRi
boso
mal
prot
ein
S12
SPCC
962.
04–
––
11.9
611
.22
4.45
1445
04.
4616
000
Prot
ein
synt
hesi
s(s
truct
ural
cons
titue
ntof
ribos
ome)
1727
60S
Ribo
som
alpr
otei
nL6
(frag
men
t?)
SPCC
622.
18–
1.69
–2
2.28
23.
785.
9294
7010
.27
2129
0Pr
otei
nsy
nthe
sis
(stru
ctur
alco
nstit
uent
ofrib
osom
e)65
56-
Phos
phog
luco
nate
dehy
dro-
gena
se,d
ecar
boxy
latin
gSP
BC66
0.16
1.1.
1.44
1.26
21.
132
1.48
22.
17.
4756
980
6.73
5422
0Pe
ntos
eph
osph
ate
path
way
and
hexo
sem
onop
hosp
hate
shun
t33
8Ac
etol
acta
tesy
ntha
seSP
BP35
G2.0
72.
2.1.
51.
262
1.17
21.
272
1.88
8.01
7085
09.
2873
370
Amin
oac
idm
etab
olis
m(v
alin
ean
dis
oleu
cine
bios
ynth
esis
;1st
step
)12
92Ac
etol
acta
tesy
ntha
sesm
all
subu
nitp
recu
rsor
(pre
dict
ed)
SPBC
14C8
.04
2.2.
1.6
21.
481.
71.
684.
224.
9733
080
5.94
3210
0Am
ino
acid
met
abol
ism
(val
ine
and
isol
euci
nebi
osyn
thes
is;1
stst
ep)
182
Ade1
,min
4,ph
osph
orib
osyl
amin
e-gl
ycin
elig
ase
SPBC
405.
016.
3.4.
132
1.26
21.
472
1.6
21.
864.
8880
480
5.37
8591
0Pu
rine
met
abol
ism
and
bios
ynth
esis
(2nd
step
)33
2Ad
e10,
bifu
nctio
nalp
urin
ebi
osyn
thes
ispr
otei
n(A
ICAR
trans
form
ylas
e/IM
Pcy
cloh
ydro
lase
)
SPCP
B16A
4.03
c2.
1.2.
3/3.
5.4.
101.
142
1.14
21.
252
1.62
7.05
7159
06.
3564
600
Purin
em
etab
olis
man
dbi
osyn
thes
is(9
than
d10
thst
eps)
1000
aAd
e6,m
in1,
phos
phor
ibos
ylam
ino-
imid
azol
eca
rbox
ylas
eSP
CC13
22.1
34.
1.1.
212
1.15
21.
353.
793.
227.
165
000
6.5
6000
0Pu
rine
met
abol
ism
and
bios
ynth
esis
(6th
step
)99
0bAd
e6,m
in1,
phos
phor
ibos
ylam
ino-
imid
azol
eca
rbox
ylas
eSP
CC13
22.1
34.
1.1.
212
1.56
–2
2.16
21.
297.
365
000
6.5
6000
0Pu
rine
met
abol
ism
and
bios
ynth
esis
(6th
step
)72
6Ad
enyl
osuc
cina
tesy
nthe
tase
SPAC
144.
036.
3.4.
42
1.04
1.11
21.
512
1.3
6.41
5459
06.
0548
250
Purin
em
etab
olis
man
dbi
osyn
thes
is(A
MP
bios
ynth
esis
;1st
step
),al
anin
ean
das
parta
tem
etab
olis
m11
28Al
do/k
eto
redu
ctas
eSP
BC8E
4.04
–1.
132
1.9
21.
642
3.52
7.61
3981
06.
6136
720
Carb
ohyd
rate
met
abol
ism
(oxi
dore
duct
ase
activ
ity)
1197
Aldo
/ket
ore
duct
ase
(role
infe
rred
from
hom
olog
y)SP
BC21
5.11
c–
8.41
21.
41.
792
6.59
7.02
3670
06.
4834
070
Unkn
own
(oxi
dore
duct
ase
activ
ity)
1232
aAl
do/k
eto
redu
ctas
eN
ADPH
-de
pend
ent(
pred
icte
d)SP
AC19
G12.
09–
3.05
–2
3.42
29.
637.
2835
470
6.33
3172
0Un
know
n(o
xido
redu
ctas
eac
tivity
)
1586
Bref
eldi
nA
resi
stan
cepr
otei
np2
0(fl
avod
oxin
-like
)a)SP
AC3C
7.14
c–
7.26
22.
8110
.22
21.
996.
6521
400
6.29
2189
0Un
know
n(ta
rget
ofpa
p1tra
nscr
iptio
nfa
ctor
and
conf
ers
bref
eldi
nA
resi
stan
ce)
1597
Bref
eldi
nA
resi
stan
cepr
otei
np2
0(fl
avod
oxin
-like
)a)SP
AC3C
7.14
c–
7.65
22.
3310
.66
21.
686.
720
530
6.29
2189
0Un
know
n(ta
rget
ofpa
p1tra
nscr
iptio
nfa
ctor
and
conf
ers
bref
eldi
nA
resi
stan
ce)
2006 WILEY-VCH Verlag GmbH & Co. KGaA, Weinheim www.proteomics-journal.com
Proteomics 2006, 6, 2772–2796 Animal Proteomics 2783Tab
le3.
Co
nti
nu
ed
Spot
no.
Prot
ein
nam
eOR
Fna
me
E.C.
no.
Aver
age
fold
-cha
nge
pI,
gel
Mr
(gel
)pI (p
red)
Mr
(pre
d.)Bi
olog
ical
proc
ess/
Mol
ecul
arfu
nctio
n
WT-
60’
vs.W
T-0’
sty1D
-60’
vs.s
ty1D
-0’
sty1D
-0’
vs.W
T-0’
sty1D
-60’
vs.W
T-60
’
492a
Cata
lase
SPCC
757.
07c
1.11
.1.6
5.96
–2
1.74
215
.06
7.27
6387
06.
3958
470
Redo
xre
gula
tion,
prot
ects
cells
from
the
toxi
cef
fect
sof
hydr
ogen
pero
xide
)87
3aDi
hydr
oxya
ceto
neki
nase
1,da
k1SP
AC22
A12.
112.
7.1.
292
1.95
21.
931.
05–
765
500
6.2
6230
0Gl
ycer
olip
idm
etab
olis
m89
0DN
Ada
mag
ech
eckp
oint
prot
ein
Rad2
5(1
4–3-
3fa
mily
)SP
AC17
A2.1
3c–
1.08
21.
292
1.7
22.
374.
839
800
4.78
3057
0Ce
llcy
cle
regu
latio
n(c
ontro
lsDN
Ada
mag
ech
eckp
oint
befo
rem
itosi
s)93
8aEl
onga
tion
fact
or2
(frag
men
t?)
SPAC
513.
01–
21.
4–
1.79
2.38
5.78
4665
05.
9593
710
Prot
ein
synt
hesi
s(G
TP-b
indi
ng)
793
Elon
gatio
nfa
ctor
2(fr
agm
ent?
)SP
AC51
3.01
–2
1.25
1.23
3.23
4.98
6.1
5160
05.
9590
440
Prot
ein
synt
hesi
s(G
TP-b
indi
ng)
935c
Elon
gatio
nfa
ctor
2(fr
agm
ent?
)SP
AC51
3.01
–2
1.54
–2.
644.
276.
1246
720
5.95
9320
0Pr
otei
nsy
nthe
sis
(GTP
-bin
ding
)14
3El
onga
tion
fact
or2,
etf2
SPAC
513.
01c
–16
.55
––
210
.86
7.03
8451
06.
0293
800
Prot
ein
synt
hesi
s(G
TP-b
indi
ng)
675
Euka
ryot
ictra
nsla
tion
initi
atio
nfa
ctor
2bga
mm
asu
buni
tSP
AC4D
7.09
–1.
314.
282
1.28
2.56
6.68
5623
06.
2151
632
Prot
ein
synt
hesi
s
496
Gluc
ose-
6-ph
osph
ate
1-de
hydr
ogen
ase,
zwf1
a)SP
AC3A
12.1
81.
1.1.
492.
37–
21.
262
3.06
6.11
6359
05.
8357
620
Pent
ose
phos
phat
epa
thw
ay(1
stst
ep),
glut
athi
one
met
abol
ism
754a
Glut
amat
ede
hydr
ogen
ase
(NAD
P-sp
ecifi
c)SP
CC62
2.12
c1.
4.1.
4–
–2
3.21
24.
457.
6253
700
7.14
4915
8Am
ino
acid
met
abol
ism
(glu
tam
ate
met
abol
ism
)93
8bGl
utam
ine
synt
heta
se(g
luta
mat
e-am
mon
ialig
ase)
a)SP
AC23
H4.0
66.
3.1.
22
1.4
–1.
792.
385.
7846
650
5.89
4039
0Am
ino
acid
met
abol
ism
(con
vers
ion
ofgl
utam
ate
togl
utam
ine)
931
Glut
amin
esy
nthe
tase
(glu
tam
ate-
amm
onia
ligas
e)a)
SPAC
23H4
.06
6.3.
1.2
3.39
2.9
–1.
135.
8646
580
5.89
4039
2Am
ino
acid
met
abol
ism
(con
vers
ion
ofgl
utam
ate
togl
utam
ine)
941a
Glut
amin
esy
nthe
tase
(glu
tam
ate-
amm
onia
ligas
e)a)
SPAC
23H4
.06
6.3.
1.2
13.7
1–
21.
352
15.3
45.
9446
450
5.89
4039
0Am
ino
acid
met
abol
ism
(con
vers
ion
ofgl
utam
ate
togl
utam
ine)
947
Glut
amin
esy
nthe
tase
(glu
tam
ate-
amm
onia
ligas
e)a)
SPAC
23H4
.06
6.3.
1.2
21.
832
2.88
21.
272
26.
0646
580
5.89
4039
2Am
ino
acid
met
abol
ism
(con
vers
ion
ofgl
utam
ate
togl
utam
ine)
935b
Glut
amin
esy
nthe
tase
(glu
tam
ate-
amm
onia
ligas
e)a)
SPAC
23H4
.06
6.3.
1.2
21.
54–
2.64
4.27
6.12
4672
05.
8940
390
Amin
oac
idm
etab
olis
m(c
onve
rsio
nof
glut
amat
eto
glut
amin
e)12
10Gl
utat
hion
eS-
trans
fera
se2
SPCC
965.
07c
2.5.
1.18
3.58
21.
742.
622
2.38
6.05
2580
05.
9926
880
Redo
xre
gula
tion
and
deto
xific
atio
n12
03Gl
utat
hion
eS-
trans
fera
se2
SPCC
965.
07c
2.5.
1.18
2.08
––
21.
526.
226
200
5.99
2688
0Re
dox
regu
latio
nan
dde
toxi
ficat
ion
1204
Glut
athi
one
synt
heta
sela
rge
chai
n,gs
a1SP
AC3F
10.0
46.
3.2.
31.
91.
782
1.2
21.
276.
553
600
656
120
Redo
xre
gula
tion
(glu
tath
ione
bios
ynth
esis
;2n
dst
ep),
amin
oac
idm
etab
olis
m92
9aGl
ycer
ol-3
-pho
spha
tede
hydr
ogen
ase,
gpd1
a)SP
BC21
5.05
1.1.
1.8
21.
6–
1.62
3.21
3.76
4672
05.
2542
480
Glyc
erol
ipid
met
abol
ism
,stre
ssre
spon
se
836
Glyc
erol
-3-p
hosp
hate
dehy
drog
enas
e,gp
d1a)
SPBC
215.
051.
1.1.
81.
332
1.31
24.
092
7.14
4.23
5009
05.
2542
480
Glyc
erol
ipid
met
abol
ism
,stre
ssre
spon
se
849
Glyc
erol
-3-p
hosp
hate
dehy
drog
enas
e,gp
d1a)
SPBC
215.
051.
1.1.
81.
39–
23.
12
5.04
4.31
4987
05.
2542
480
Glyc
erol
ipid
met
abol
ism
,stre
ssre
spon
se
342a
GMP
synt
hase
(glu
tam
ine-
hydr
olys
ing)
(pre
dict
ed)g
ua2
SPAP
7G5.
02c
6.3.
5.2
1.3
21.
342
1.33
22.
326.
1260
290
6.12
6004
4Pu
rine
met
abol
ism
and
bios
ynth
esis
(GM
Pan
dgu
anin
ebi
osyn
thes
is)
1000
bGM
Psy
ntha
se(g
luta
min
e-hy
drol
ysin
g)(p
redi
cted
)SP
BPB2
B2.0
56.
3.5.
22
1.15
21.
353.
793.
227.
562
500
6.12
6020
0Pu
rine
met
abol
ism
and
bios
ynth
esis
(GM
Pan
dgu
anin
ebi
osyn
thes
is)
2006 WILEY-VCH Verlag GmbH & Co. KGaA, Weinheim www.proteomics-journal.com

2784 M. E. Weeks et al. Proteomics 2006, 6, 2772–2796Tab
le3.
Co
nti
nu
ed
Spot
no.
Prot
ein
nam
eOR
Fna
me
E.C.
no.
Aver
age
fold
-cha
nge
pI,
gel
Mr
(gel
)pI (p
red)
Mr
(pre
d.)Bi
olog
ical
proc
ess/
Mol
ecul
arfu
nctio
n
WT-
60’
vs.W
T-0’
sty1D
-60’
vs.s
ty1D
-0’
sty1D
-0’
vs.W
T-0’
sty1D
-60’
vs.W
T-60
’
1230
GTP-
bind
ing
nucl
earp
rote
insp
i1(R
anGT
Pase
fam
ilym
embe
r)SP
BC12
89.0
3c–
–2
1.15
21.
432
1.62
4.75
3547
05.
424
150
Prot
ein
trans
port
(requ
ired
forp
rote
inim
-po
rtin
toth
enu
cleu
san
dfo
rRN
Aex
port)
1507
GTP-
bind
ing
nucl
earp
rote
insp
i1(R
anGT
Pase
fam
ilym
embe
r)SP
BC12
89.0
3c–
––
1.99
1.74
6.9
2500
07
2477
0Pr
otei
ntra
nspo
rt(re
quire
dfo
rpro
tein
im-
port
into
the
nucl
eus
and
forR
NA
expo
rt)39
2He
atsh
ock
cogn
ate
prot
ein,
hsc1
,sks
2a)SP
BC17
09.0
5–
21.
56–
1.31
2.13
5.02
6848
05.
8267
450
Mol
ecul
arch
aper
one,
stre
ssre
spon
se
331
Heat
shoc
kco
gnat
epr
otei
n,hs
c1,s
ks2a)
SPBC
1709
.05
–2
1.67
1.17
21.
241.
595.
3671
910
5.82
6745
0M
olec
ular
chap
eron
e,st
ress
resp
onse
328
Heat
shoc
kco
gnat
epr
otei
n,hs
c1,s
ks2a)
SPBC
1709
.05
–2
2.09
21.
212
1.5
1.15
5.61
7169
05.
8267
450
Mol
ecul
arch
aper
one,
stre
ssre
spon
se
314
Heat
shoc
kco
gnat
epr
otei
n,hs
c1,s
ks2a)
SPBC
1709
.05
––
–2
1.32
21.
65.
8972
440
5.82
6745
0M
olec
ular
chap
eron
e,st
ress
resp
onse
318
Heat
shoc
kco
gnat
epr
otei
n,hs
c1,s
ks2a)
SPBC
1709
.05
––
21.
062
1.45
21.
566.
1672
230
5.82
6745
0M
olec
ular
chap
eron
e,st
ress
resp
onse
354
Heat
shoc
kco
gnat
epr
otei
n,hs
c1,s
ks2a)
SPBC
1709
.05
–1.
54–
1.37
–7.
7169
600
5.82
6745
0M
olec
ular
chap
eron
e,st
ress
resp
onse
737
Heat
shoc
kco
gnat
epr
otei
n,hs
c1,s
ks2a)
(frag
men
t?)
SPBC
1709
.05
––
1.45
2.21
3.45
6.55
5443
05.
8267
450
Mol
ecul
arch
aper
one,
stre
ssre
spon
se
1320
Heat
shoc
kpr
otei
n16
SPBC
3E7.
02c
–2.
782.
88–
–5.
5113
900
5.72
1596
8M
olec
ular
chap
eron
e,st
ress
resp
onse
390
Heat
shoc
kpr
otei
n60
prec
urso
rSP
AC12
G12.
04–
1.11
–2
1.42
21.
574.
5668
070
5.76
6241
0M
olec
ular
chap
eron
e,st
ress
resp
onse
407
Heat
shoc
kpr
otei
n60
prec
urso
rSP
AC12
G12.
04–
21.
252
1.09
22.
082
1.82
4.68
6757
05.
7662
410
Mol
ecul
arch
aper
one,
stre
ssre
spon
se30
6He
atsh
ock
prot
ein
70fa
mily
mito
chon
dria
l,ss
c1,s
sp1a)
SPAC
664.
11–
21.
231.
042
1.66
21.
35.
4372
660
6.73
7316
0M
olec
ular
chap
eron
e,st
ress
resp
onse
287
Heat
shoc
kpr
otei
n70
fam
ilym
itoch
ondr
ial,
ssc1
,ssp
1a)SP
AC66
4.11
–2
1.13
21.
65–
21.
55.
6573
630
6.73
7316
0M
olec
ular
chap
eron
e,st
ress
resp
onse
668
Heat
shoc
kpr
otei
n70
fam
ily,s
sa2
(frag
men
t?)
SPCC
1739
.13
–2
1.57
1.34
3.21
6.74
5.55
5640
05.
1370
101
Mol
ecul
arch
aper
one,
stre
ssre
spon
se
716
Heat
shoc
kpr
otei
n70
fam
ily,s
sa2
(frag
men
t?)
SPCC
1739
.13
–2
1.4
1.49
24.
165.
9255
070
5.13
7010
1M
olec
ular
chap
eron
e,st
ress
resp
onse
324
Heat
shoc
kpr
otei
n70
fam
ily,s
sa2a)
SPCC
1739
.13
––
–1.
441.
544.
3372
800
5.13
7010
1M
olec
ular
chap
eron
e,st
ress
resp
onse
292
Heat
shoc
kpr
otei
n70
fam
ily,s
sa2a)
SPCC
1739
.13
–1.
062
1.21
21.
32
1.67
4.36
7280
05.
1370
101
Mol
ecul
arch
aper
one,
stre
ssre
spon
se27
6He
atsh
ock
prot
ein
70fa
mily
,ssa
2a)SP
CC17
39.1
3–
1.17
–2
1.37
21.
554.
4274
620
5.13
7010
1M
olec
ular
chap
eron
e,st
ress
resp
onse
299
Heat
shoc
kpr
otei
n70
fam
ily,s
sa2a)
SPCC
1739
.13
––
1.12
2.34
2.51
4.67
7280
05.
1370
101
Mol
ecul
arch
aper
one,
stre
ssre
spon
se98
3He
atsh
ock
prot
ein
70ho
mol
ogue
pss1
SPAC
110.
04c
–2
1.65
1.29
5.13
10.8
93.
8466
700
5.02
8055
4M
olec
ular
chap
eron
e,st
ress
resp
onse
625
Heat
shoc
kpr
otei
n70
hom
olog
ueps
s1SP
AC11
0.04
c–
21.
341.
312.
113.
685.
8668
010
5.02
8055
4M
olec
ular
chap
eron
e,st
ress
resp
onse
224
Heat
shoc
kpr
otei
n90
hom
olog
ue,
swo1
a)SP
AC92
6.04
c–
–2
1.32
21.
192
1.64
4.1
7906
04.
8980
710
Mol
ecul
arch
aper
one,
stre
ssre
spon
se(in
tera
cts
with
wee
1pr
otei
nki
nase
)
2006 WILEY-VCH Verlag GmbH & Co. KGaA, Weinheim www.proteomics-journal.com
Proteomics 2006, 6, 2772–2796 Animal Proteomics 2785Tab
le3.
Co
nti
nu
ed
Spot
no.
Prot
ein
nam
eOR
Fna
me
E.C.
no.
Aver
age
fold
-cha
nge
pI,
gel
Mr
(gel
)pI (p
red)
Mr
(pre
d.)Bi
olog
ical
proc
ess/
Mol
ecul
arfu
nctio
n
WT-
60’
vs.W
T-0’
sty1D
-60’
vs.s
ty1D
-0’
sty1D
-0’
vs.W
T-0’
sty1D
-60’
vs.W
T-60
’
327
Heat
shoc
kpr
otei
n90
hom
olog
ue,
swo1
a)SP
AC92
6.04
c–
–1.
217.
9411
.05
4.22
7180
04.
8980
720
Mol
ecul
arch
aper
one,
stre
ssre
spon
se(in
tera
cts
with
wee
1pr
otei
nki
nase
)30
1He
atsh
ock
prot
ein
90ho
mol
ogue
,sw
o1a)
SPAC
926.
04c
––
–2.
282.
044.
2872
870
4.89
8071
0M
olec
ular
chap
eron
e,st
ress
resp
onse
(inte
ract
sw
ithw
ee1
prot
ein
kina
se)
679
Hydr
oxym
ethy
lglu
tary
l-CoA
synt
hase
SPAC
4F8.
14c
2.3.
3.10
21.
11.
852
1.26
1.61
6.03
5615
07.
0549
720
Ster
oid
bios
ynth
esis
,val
ine,
leuc
ine,
isol
euci
nede
grad
atio
n,ke
tone
body
synt
hesi
san
dde
grad
atio
n76
4Hy
poth
etic
alpr
otei
n(c
onse
rved
)SP
CC73
6.15
–1.
59–
22.
352
3.69
4.1
5315
05.
2439
952
Unkn
own
(resp
onds
tohe
at,p
rote
inki
nase
inhi
bito
rby
sim
ilarit
y)76
8Hy
poth
etic
alpr
otei
n(c
onse
rved
)SP
CC73
6.15
–1.
41–
23.
012
4.71
4.16
5307
05.
2439
952
Unkn
own
(resp
onds
tohe
at,p
rote
inki
nase
inhi
bito
rby
sim
ilarit
y)77
0Hy
poth
etic
alpr
otei
n(c
onse
rved
)SP
CC73
6.15
–1.
12–
23.
862
5.96
4.25
5284
05.
2439
805
Unkn
own
(resp
onds
tohe
at,p
rote
inki
nase
inhi
bito
rby
sim
ilarit
y)12
32b
Hypo
thet
ical
prot
ein
(con
serv
ed)
SPCC
777.
06c
–3.
05–
23.
422
9.63
7.28
3547
06.
234
240
Unkn
own
(pre
dict
edhy
drol
ase)
1176
bHy
poth
etic
alpr
otei
n44
.2k
(con
serv
ed)
SPAC
1002
.18
–1.
5–
21.
222
1.7
6.1
4200
06.
344
200
Unkn
own
941b
Hypo
thet
ical
serin
e-ric
hpr
otei
nSP
AC23
H3.1
5c–
13.7
1–
21.
352
15.3
45.
9446
450
5.86
3467
0Un
know
n(s
eque
nce
orph
an)
1131
Inor
gani
cpy
roph
osph
atas
eSP
AC3A
12.0
23.
6.1.
1–
1.21
1.3
1.58
4.22
3935
05.
232
680
Aero
bic
resp
iratio
n(d
ipho
spha
te1
H 2O
=2
Pi,i
nfer
red
from
hom
olog
y)91
6Le
u1,3
-isop
ropy
lmal
ate
dehy
drog
enas
eSP
BC1A
4.02
c1.
1.1.
85–
21.
8717
.04
9.95
5.01
4721
05.
3940
107
Amin
oac
idm
etab
olis
m(le
ucin
ebi
osyn
thes
is;3
rdst
ep)
164
Leu2
,3-is
opro
pylm
alat
ede
hydr
atas
ea)SP
AC9E
9.03
4.2.
1.33
21.
062
1.69
21.
882
36.
0982
530
5.75
8341
5Am
ino
acid
met
abol
ism
(leuc
ine
bios
ynth
esis
;2nd
step
)11
89M
alat
ede
hydr
ogen
ase,
mito
chon
dria
l(pr
edic
ted)
SPCC
306.
08c
1.1.
1.37
4.43
21.
493.
752
1.76
7.54
3719
08.
935
880
Pyru
vate
met
abol
ism
,citr
ate
cycl
e
935a
Met
al-d
epen
dent
hydr
olas
e(p
redi
cted
)SP
AC69
4.04
c–
23.
152
2.4
21.
41–
5.75
3810
05.
8137
020
Unkn
own
1016
Mito
chon
dria
lF1-
ATP
synt
hase
beta
subu
nit(
fragm
ent?
)SP
AC22
2.12
c3.
6.3.
142
1.56
–4.
337.
014.
9834
900
5.72
5689
8Ae
robi
cre
spira
tion
(ADP
1ph
osph
ate1
H1(O
ut)
=AT
P1
H2O1
H1(In
))75
4aN
ADP-
spec
ific
glut
amat
ede
hydr
ogen
ase
SPCC
622.
12c
1.4.
1.4
––
23.
212
4.45
7.62
5370
07.
1449
158
Amin
oac
idm
etab
olis
m(g
luta
mat
em
etab
olis
m)
1026
Orni
thin
eam
inot
rans
fera
se(fr
agm
ent?
)SP
BC21
C3.0
8c2.
6.1.
132
1.84
1.13
1.53
3.16
4.88
4300
05.
9448
670
Amin
oac
idm
etab
olis
m(a
rgin
ine
and
prol
ine
met
abol
ism
),ur
eacy
cle
654
Orni
thin
eam
inot
rans
fera
sea)
SPBC
21C3
.08c
2.6.
1.13
21.
7–
21.
76–
6.1
5715
05.
9448
670
Amin
oac
idm
etab
olis
m(a
rgin
ine
and
prol
ine
met
abol
ism
),ur
eacy
cle
731
Orni
thin
eam
inot
rans
fera
sea)
SPBC
21C3
.08c
2.6.
1.13
21.
54–
21.
892
1.34
6.36
5435
05.
9448
670
Amin
oac
idm
etab
olis
m(a
rgin
ine
and
prol
ine
met
abol
ism
),ur
eacy
cle
2006 WILEY-VCH Verlag GmbH & Co. KGaA, Weinheim www.proteomics-journal.com
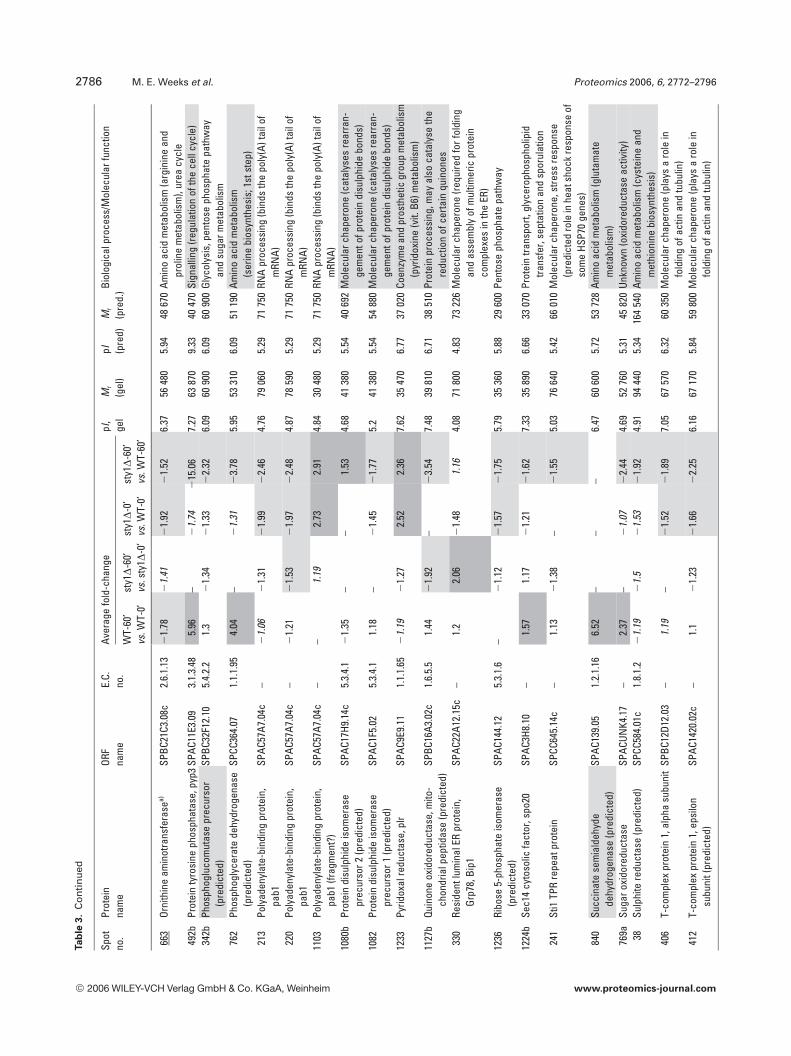
2786 M. E. Weeks et al. Proteomics 2006, 6, 2772–2796Tab
le3.
Co
nti
nu
ed
Spot
no.
Prot
ein
nam
eOR
Fna
me
E.C.
no.
Aver
age
fold
-cha
nge
pI,
gel
Mr
(gel
)pI (p
red)
Mr
(pre
d.)Bi
olog
ical
proc
ess/
Mol
ecul
arfu
nctio
n
WT-
60’
vs.W
T-0’
sty1D
-60’
vs.s
ty1D
-0’
sty1D
-0’
vs.W
T-0’
sty1D
-60’
vs.W
T-60
’
663
Orni
thin
eam
inot
rans
fera
sea)
SPBC
21C3
.08c
2.6.
1.13
21.
782
1.41
21.
922
1.52
6.37
5648
05.
9448
670
Amin
oac
idm
etab
olis
m(a
rgin
ine
and
prol
ine
met
abol
ism
),ur
eacy
cle
492b
Prot
ein
tyro
sine
phos
phat
ase,
pyp3
SPAC
11E3
.09
3.1.
3.48
5.96
–2
1.74
215
.06
7.27
6387
09.
3340
470
Sign
allin
g(re
gula
tion
ofth
ece
llcy
cle)
342b
Phos
phog
luco
mut
ase
prec
urso
r(p
redi
cted
)SP
BC32
F12.
105.
4.2.
21.
32
1.34
21.
332
2.32
6.09
6090
06.
0960
900
Glyc
olys
is,p
ento
seph
osph
ate
path
way
and
suga
rmet
abol
ism
762
Phos
phog
lyce
rate
dehy
drog
enas
e(p
redi
cted
)SP
CC36
4.07
1.1.
1.95
4.04
–2
1.31
23.
785.
9553
310
6.09
5119
0Am
ino
acid
met
abol
ism
(ser
ine
bios
ynth
esis
;1st
step
)21
3Po
lyad
enyl
ate-
bind
ing
prot
ein,
pab1
SPAC
57A7
.04c
–2
1.06
21.
312
1.99
22.
464.
7679
060
5.29
7175
0RN
Apr
oces
sing
(bin
dsth
epo
ly(A
)tai
lof
mRN
A)22
0Po
lyad
enyl
ate-
bind
ing
prot
ein,
pab1
SPAC
57A7
.04c
–2
1.21
21.
532
1.97
22.
484.
8778
590
5.29
7175
0RN
Apr
oces
sing
(bin
dsth
epo
ly(A
)tai
lof
mRN
A)11
03Po
lyad
enyl
ate-
bind
ing
prot
ein,
pab1
(frag
men
t?)
SPAC
57A7
.04c
––
1.19
2.73
2.91
4.84
3048
05.
2971
750
RNA
proc
essi
ng(b
inds
the
poly
(A)t
ailo
fm
RNA)
1080
bPr
otei
ndi
sulp
hide
isom
eras
epr
ecur
sor2
(pre
dict
ed)
SPAC
17H9
.14c
5.3.
4.1
21.
35–
–1.
534.
6841
380
5.54
4069
2M
olec
ular
chap
eron
e(c
atal
yses
rear
ran-
gem
ento
fpro
tein
disu
lphi
debo
nds)
1082
Prot
ein
disu
lphi
deis
omer
ase
prec
urso
r1(p
redi
cted
)SP
AC1F
5.02
5.3.
4.1
1.18
–2
1.45
21.
775.
241
380
5.54
5488
0M
olec
ular
chap
eron
e(c
atal
yses
rear
ran-
gem
ento
fpro
tein
disu
lphi
debo
nds)
1233
Pyrid
oxal
redu
ctas
e,pl
rSP
AC9E
9.11
1.1.
1.65
21.
192
1.27
2.52
2.36
7.62
3547
06.
7737
020
Coen
zym
ean
dpr
osth
etic
grou
pm
etab
olis
m(p
yrid
oxin
e(v
it.B6
)met
abol
ism
)11
27b
Quin
one
oxid
ored
ucta
se,m
ito-
chon
dria
lpep
tidas
e(p
redi
cted
)SP
BC16
A3.0
2c1.
6.5.
51.
442
1.92
–2
3.54
7.48
3981
06.
7138
510
Prot
ein
proc
essi
ng,m
ayal
soca
taly
seth
ere
duct
ion
ofce
rtain
quin
ones
330
Resi
dent
lum
inal
ERpr
otei
n,Gr
p78,
Bip1
SPAC
22A1
2.15
c–
1.2
2.06
21.
481.
164.
0871
800
4.83
7322
6M
olec
ular
chap
eron
e(re
quire
dfo
rfol
ding
and
asse
mbl
yof
mul
timer
icpr
otei
nco
mpl
exes
inth
eER
)12
36Ri
bose
5-ph
osph
ate
isom
eras
e(p
redi
cted
)SP
AC14
4.12
5.3.
1.6
–2
1.12
21.
572
1.75
5.79
3536
05.
8829
600
Pent
ose
phos
phat
epa
thw
ay
1224
bSe
c14
cyto
solic
fact
or,s
po20
SPAC
3H8.
10–
1.57
1.17
21.
212
1.62
7.33
3589
06.
6633
070
Prot
ein
trans
port,
glyc
erop
hosp
holip
idtra
nsfe
r,se
ptat
ion
and
spor
ulat
ion
241
Sti1
TPR
repe
atpr
otei
nSP
CC64
5.14
c–
1.13
21.
38–
21.
555.
0376
640
5.42
6601
0M
olec
ular
chap
eron
e,st
ress
resp
onse
(pre
dict
edro
lein
heat
shoc
kre
spon
seof
som
eHS
P70
gene
s)84
0Su
ccin
ate
sem
iald
ehyd
ede
hydr
ogen
ase
(pre
dict
ed)
SPAC
139.
051.
2.1.
166.
52–
––
6.47
6060
05.
7253
728
Amin
oac
idm
etab
olis
m(g
luta
mat
em
etab
olis
m)
769a
Suga
roxi
dore
duct
ase
SPAC
UNK4
.17
–2.
37–
21.
072
2.44
4.69
5276
05.
3145
820
Unkn
own
(oxi
dore
duct
ase
activ
ity)
38Su
lphi
tere
duct
ase
(pre
dict
ed)
SPCC
584.
01c
1.8.
1.2
21.
192
1.5
21.
532
1.92
4.91
9444
05.
3416
454
0Am
ino
acid
met
abol
ism
(cys
tein
ean
dm
ethi
onin
ebi
osyn
thes
is)
406
T-co
mpl
expr
otei
n1,
alph
asu
buni
tSP
BC12
D12.
03–
1.19
–2
1.52
21.
897.
0567
570
6.32
6035
0M
olec
ular
chap
eron
e(p
lays
aro
lein
fold
ing
ofac
tinan
dtu
bulin
)41
2T-
com
plex
prot
ein
1,ep
silo
nsu
buni
t(pr
edic
ted)
SPAC
1420
.02c
–1.
12
1.23
21.
662
2.25
6.16
6717
05.
8459
800
Mol
ecul
arch
aper
one
(pla
ysa
role
info
ldin
gof
actin
and
tubu
lin)
2006 WILEY-VCH Verlag GmbH & Co. KGaA, Weinheim www.proteomics-journal.com
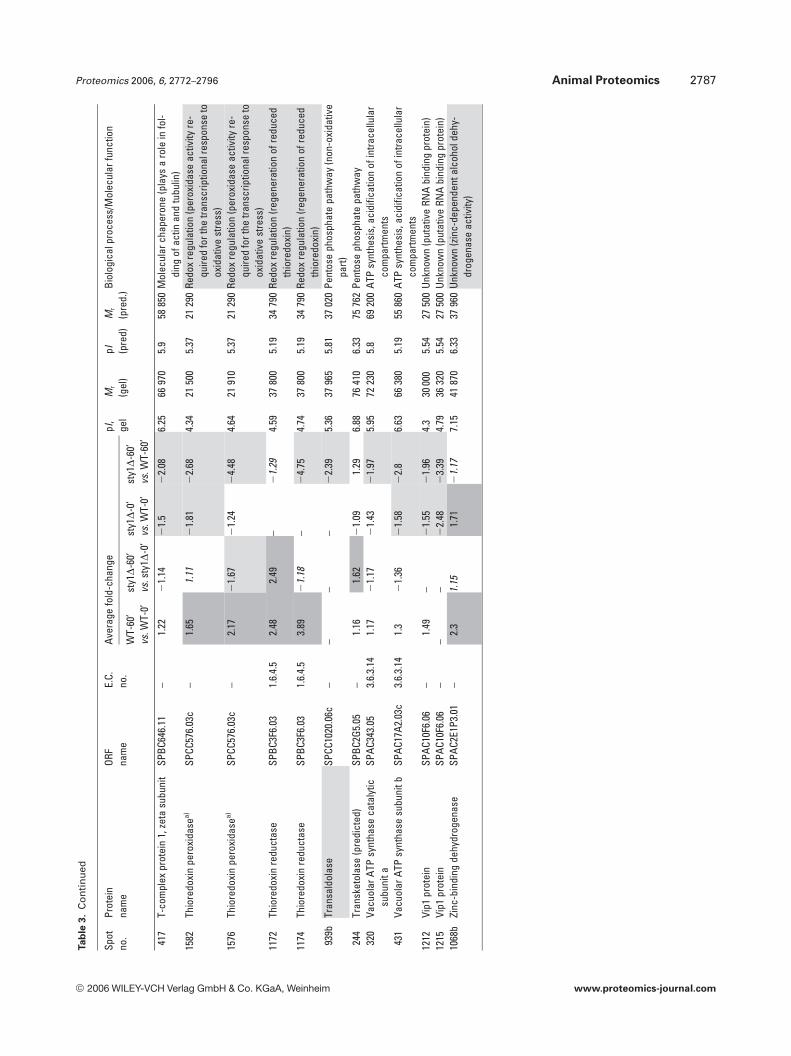
Proteomics 2006, 6, 2772–2796 Animal Proteomics 2787Tab
le3.
Co
nti
nu
ed
Spot
no.
Prot
ein
nam
eOR
Fna
me
E.C.
no.
Aver
age
fold
-cha
nge
pI,
gel
Mr
(gel
)pI (p
red)
Mr
(pre
d.)Bi
olog
ical
proc
ess/
Mol
ecul
arfu
nctio
n
WT-
60’
vs.W
T-0’
sty1D
-60’
vs.s
ty1D
-0’
sty1D
-0’
vs.W
T-0’
sty1D
-60’
vs.W
T-60
’
417
T-co
mpl
expr
otei
n1,
zeta
subu
nit
SPBC
646.
11–
1.22
21.
142
1.5
22.
086.
2566
970
5.9
5885
0M
olec
ular
chap
eron
e(p
lays
aro
lein
fol-
ding
ofac
tinan
dtu
bulin
)15
82Th
iore
doxi
npe
roxi
dase
a)SP
CC57
6.03
c–
1.65
1.11
21.
812
2.68
4.34
2150
05.
3721
290
Redo
xre
gula
tion
(per
oxid
ase
activ
ityre
-qu
ired
fort
hetra
nscr
iptio
nalr
espo
nse
toox
idat
ive
stre
ss)
1576
Thio
redo
xin
pero
xida
sea)
SPCC
576.
03c
–2.
172
1.67
21.
242
4.48
4.64
2191
05.
3721
290
Redo
xre
gula
tion
(per
oxid
ase
activ
ityre
-qu
ired
fort
hetra
nscr
iptio
nalr
espo
nse
toox
idat
ive
stre
ss)
1172
Thio
redo
xin
redu
ctas
eSP
BC3F
6.03
1.6.
4.5
2.48
2.49
–2
1.29
4.59
3780
05.
1934
790
Redo
xre
gula
tion
(rege
nera
tion
ofre
duce
dth
iore
doxi
n)11
74Th
iore
doxi
nre
duct
ase
SPBC
3F6.
031.
6.4.
53.
892
1.18
–2
4.75
4.74
3780
05.
1934
790
Redo
xre
gula
tion
(rege
nera
tion
ofre
duce
dth
iore
doxi
n)93
9bTr
ansa
ldol
ase
SPCC
1020
.06c
––
––
22.
395.
3637
965
5.81
3702
0Pe
ntos
eph
osph
ate
path
way
(non
-oxi
dativ
epa
rt)24
4Tr
ansk
etol
ase
(pre
dict
ed)
SPBC
2G5.
05–
1.16
1.62
21.
091.
296.
8876
410
6.33
7576
2Pe
ntos
eph
osph
ate
path
way
320
Vacu
olar
ATP
synt
hase
cata
lytic
subu
nita
SPAC
343.
053.
6.3.
141.
172
1.17
21.
432
1.97
5.95
7223
05.
869
200
ATP
synt
hesi
s,ac
idifi
catio
nof
intra
cellu
lar
com
partm
ents
431
Vacu
olar
ATP
synt
hase
subu
nitb
SPAC
17A2
.03c
3.6.
3.14
1.3
21.
362
1.58
22.
86.
6366
380
5.19
5586
0AT
Psy
nthe
sis,
acid
ifica
tion
ofin
trace
llula
rco
mpa
rtmen
ts12
12Vi
p1pr
otei
nSP
AC10
F6.0
6–
1.49
–2
1.55
21.
964.
330
000
5.54
2750
0Un
know
n(p
utat
ive
RNA
bind
ing
prot
ein)
1215
Vip1
prot
ein
SPAC
10F6
.06
––
–2
2.48
23.
394.
7936
320
5.54
2750
0Un
know
n(p
utat
ive
RNA
bind
ing
prot
ein)
1068
bZi
nc-b
indi
ngde
hydr
ogen
ase
SPAC
2E1P
3.01
–2.
31.
151.
712
1.17
7.15
4187
06.
3337
960
Unkn
own
(zin
c-de
pend
enta
lcoh
olde
hy-
drog
enas
eac
tivity
)
2006 WILEY-VCH Verlag GmbH & Co. KGaA, Weinheim www.proteomics-journal.com
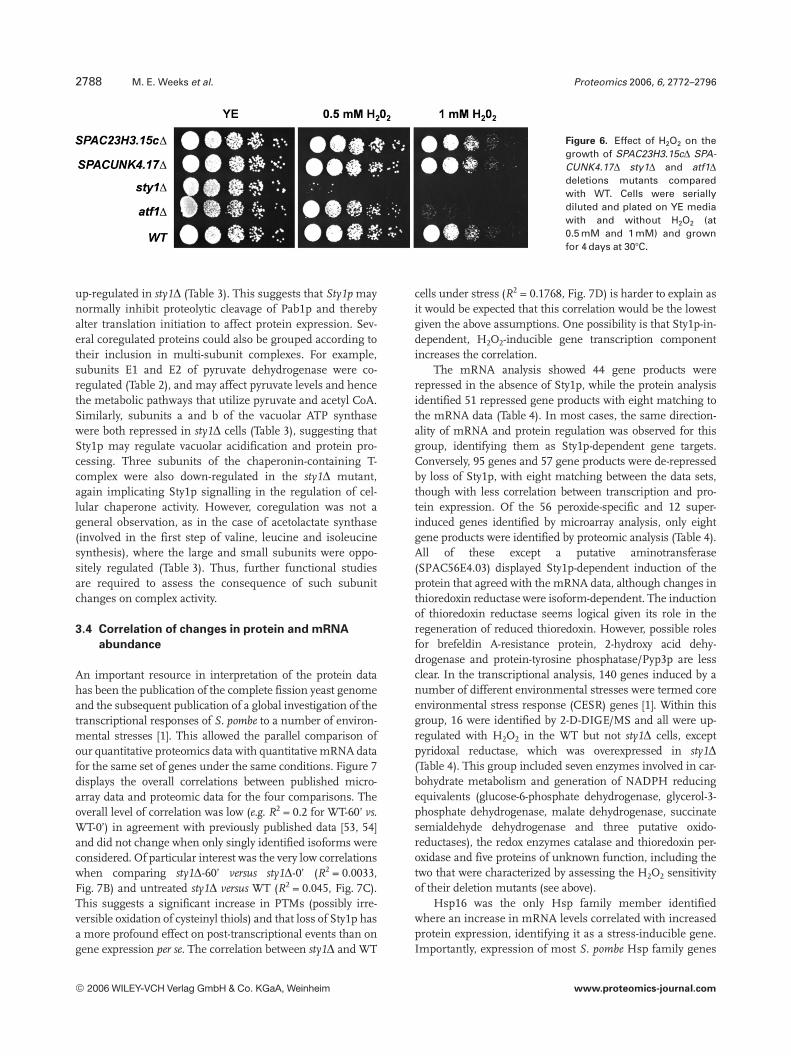
2788 M. E. Weeks et al. Proteomics 2006, 6, 2772–2796
Figure 6. Effect of H2O2 on thegrowth of SPAC23H3.15cD SPA-CUNK4.17D sty1D and atf1Ddeletions mutants comparedwith WT. Cells were seriallydiluted and plated on YE mediawith and without H2O2 (at0.5 mM and 1 mM) and grownfor 4 days at 307C.
up-regulated in sty1D (Table 3). This suggests that Sty1p maynormally inhibit proteolytic cleavage of Pab1p and therebyalter translation initiation to affect protein expression. Sev-eral coregulated proteins could also be grouped according totheir inclusion in multi-subunit complexes. For example,subunits E1 and E2 of pyruvate dehydrogenase were co-regulated (Table 2), and may affect pyruvate levels and hencethe metabolic pathways that utilize pyruvate and acetyl CoA.Similarly, subunits a and b of the vacuolar ATP synthasewere both repressed in sty1D cells (Table 3), suggesting thatSty1p may regulate vacuolar acidification and protein pro-cessing. Three subunits of the chaperonin-containing T-complex were also down-regulated in the sty1D mutant,again implicating Sty1p signalling in the regulation of cel-lular chaperone activity. However, coregulation was not ageneral observation, as in the case of acetolactate synthase(involved in the first step of valine, leucine and isoleucinesynthesis), where the large and small subunits were oppo-sitely regulated (Table 3). Thus, further functional studiesare required to assess the consequence of such subunitchanges on complex activity.
3.4 Correlation of changes in protein and mRNA
abundance
An important resource in interpretation of the protein datahas been the publication of the complete fission yeast genomeand the subsequent publication of a global investigation of thetranscriptional responses of S. pombe to a number of environ-mental stresses [1]. This allowed the parallel comparison ofour quantitative proteomics data with quantitative mRNA datafor the same set of genes under the same conditions. Figure 7displays the overall correlations between published micro-array data and proteomic data for the four comparisons. Theoverall level of correlation was low (e.g. R2 = 0.2 for WT-60’ vs.WT-0’) in agreement with previously published data [53, 54]and did not change when only singly identified isoforms wereconsidered. Of particular interest was the very low correlationswhen comparing sty1D-60’ versus sty1D-0’ (R2 = 0.0033,Fig. 7B) and untreated sty1D versus WT (R2 = 0.045, Fig. 7C).This suggests a significant increase in PTMs (possibly irre-versible oxidation of cysteinyl thiols) and that loss of Sty1p hasa more profound effect on post-transcriptional events than ongene expression per se. The correlation between sty1D and WT
cells under stress (R2 = 0.1768, Fig. 7D) is harder to explain asit would be expected that this correlation would be the lowestgiven the above assumptions. One possibility is that Sty1p-in-dependent, H2O2-inducible gene transcription componentincreases the correlation.
The mRNA analysis showed 44 gene products wererepressed in the absence of Sty1p, while the protein analysisidentified 51 repressed gene products with eight matching tothe mRNA data (Table 4). In most cases, the same direction-ality of mRNA and protein regulation was observed for thisgroup, identifying them as Sty1p-dependent gene targets.Conversely, 95 genes and 57 gene products were de-repressedby loss of Sty1p, with eight matching between the data sets,though with less correlation between transcription and pro-tein expression. Of the 56 peroxide-specific and 12 super-induced genes identified by microarray analysis, only eightgene products were identified by proteomic analysis (Table 4).All of these except a putative aminotransferase(SPAC56E4.03) displayed Sty1p-dependent induction of theprotein that agreed with the mRNA data, although changes inthioredoxin reductase were isoform-dependent. The inductionof thioredoxin reductase seems logical given its role in theregeneration of reduced thioredoxin. However, possible rolesfor brefeldin A-resistance protein, 2-hydroxy acid dehy-drogenase and protein-tyrosine phosphatase/Pyp3p are lessclear. In the transcriptional analysis, 140 genes induced by anumber of different environmental stresses were termed coreenvironmental stress response (CESR) genes [1]. Within thisgroup, 16 were identified by 2-D-DIGE/MS and all were up-regulated with H2O2 in the WT but not sty1D cells, exceptpyridoxal reductase, which was overexpressed in sty1D(Table 4). This group included seven enzymes involved in car-bohydrate metabolism and generation of NADPH reducingequivalents (glucose-6-phosphate dehydrogenase, glycerol-3-phosphate dehydrogenase, malate dehydrogenase, succinatesemialdehyde dehydrogenase and three putative oxido-reductases), the redox enzymes catalase and thioredoxin per-oxidase and five proteins of unknown function, including thetwo that were characterized by assessing the H2O2 sensitivityof their deletion mutants (see above).
Hsp16 was the only Hsp family member identifiedwhere an increase in mRNA levels correlated with increasedprotein expression, identifying it as a stress-inducible gene.Importantly, expression of most S. pombe Hsp family genes
2006 WILEY-VCH Verlag GmbH & Co. KGaA, Weinheim www.proteomics-journal.com
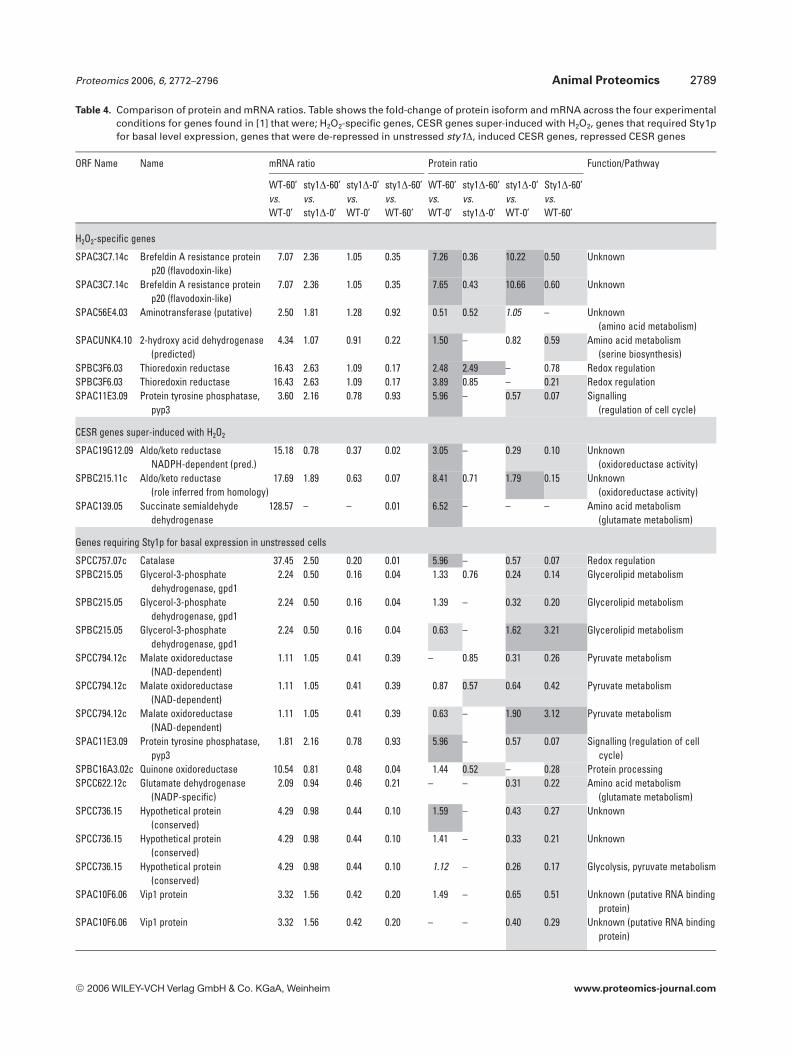
Proteomics 2006, 6, 2772–2796 Animal Proteomics 2789
Table 4. Comparison of protein and mRNA ratios. Table shows the fold-change of protein isoform and mRNA across the four experimentalconditions for genes found in [1] that were; H2O2-specific genes, CESR genes super-induced with H2O2, genes that required Sty1pfor basal level expression, genes that were de-repressed in unstressed sty1D, induced CESR genes, repressed CESR genes
ORF Name Name mRNA ratio Protein ratio Function/Pathway
WT-60’vs.WT-0’
sty1D-60’vs.sty1D-0’
sty1D-0’vs.WT-0’
sty1D-60’vs.WT-60’
WT-60’vs.WT-0’
sty1D-60’vs.sty1D-0’
sty1D-0’vs.WT-0’
Sty1D-60’vs.WT-60’
H2O2-specific genes
SPAC3C7.14c Brefeldin A resistance proteinp20 (flavodoxin-like)
7.07 2.36 1.05 0.35 7.26 0.36 10.22 0.50 Unknown
SPAC3C7.14c Brefeldin A resistance proteinp20 (flavodoxin-like)
7.07 2.36 1.05 0.35 7.65 0.43 10.66 0.60 Unknown
SPAC56E4.03 Aminotransferase (putative) 2.50 1.81 1.28 0.92 0.51 0.52 1.05 – Unknown(amino acid metabolism)
SPACUNK4.10 2-hydroxy acid dehydrogenase(predicted)
4.34 1.07 0.91 0.22 1.50 – 0.82 0.59 Amino acid metabolism(serine biosynthesis)
SPBC3F6.03 Thioredoxin reductase 16.43 2.63 1.09 0.17 2.48 2.49 – 0.78 Redox regulationSPBC3F6.03 Thioredoxin reductase 16.43 2.63 1.09 0.17 3.89 0.85 – 0.21 Redox regulationSPAC11E3.09 Protein tyrosine phosphatase,
pyp33.60 2.16 0.78 0.93 5.96 – 0.57 0.07 Signalling
(regulation of cell cycle)
CESR genes super-induced with H2O2
SPAC19G12.09 Aldo/keto reductaseNADPH-dependent (pred.)
15.18 0.78 0.37 0.02 3.05 – 0.29 0.10 Unknown(oxidoreductase activity)
SPBC215.11c Aldo/keto reductase(role inferred from homology)
17.69 1.89 0.63 0.07 8.41 0.71 1.79 0.15 Unknown(oxidoreductase activity)
SPAC139.05 Succinate semialdehydedehydrogenase
128.57 – – 0.01 6.52 – – – Amino acid metabolism(glutamate metabolism)
Genes requiring Sty1p for basal expression in unstressed cells
SPCC757.07c Catalase 37.45 2.50 0.20 0.01 5.96 – 0.57 0.07 Redox regulationSPBC215.05 Glycerol-3-phosphate
dehydrogenase, gpd12.24 0.50 0.16 0.04 1.33 0.76 0.24 0.14 Glycerolipid metabolism
SPBC215.05 Glycerol-3-phosphatedehydrogenase, gpd1
2.24 0.50 0.16 0.04 1.39 – 0.32 0.20 Glycerolipid metabolism
SPBC215.05 Glycerol-3-phosphatedehydrogenase, gpd1
2.24 0.50 0.16 0.04 0.63 – 1.62 3.21 Glycerolipid metabolism
SPCC794.12c Malate oxidoreductase(NAD-dependent)
1.11 1.05 0.41 0.39 – 0.85 0.31 0.26 Pyruvate metabolism
SPCC794.12c Malate oxidoreductase(NAD-dependent)
1.11 1.05 0.41 0.39 0.87 0.57 0.64 0.42 Pyruvate metabolism
SPCC794.12c Malate oxidoreductase(NAD-dependent)
1.11 1.05 0.41 0.39 0.63 – 1.90 3.12 Pyruvate metabolism
SPAC11E3.09 Protein tyrosine phosphatase,pyp3
1.81 2.16 0.78 0.93 5.96 – 0.57 0.07 Signalling (regulation of cellcycle)
SPBC16A3.02c Quinone oxidoreductase 10.54 0.81 0.48 0.04 1.44 0.52 – 0.28 Protein processingSPCC622.12c Glutamate dehydrogenase
(NADP-specific)2.09 0.94 0.46 0.21 – – 0.31 0.22 Amino acid metabolism
(glutamate metabolism)SPCC736.15 Hypothetical protein
(conserved)4.29 0.98 0.44 0.10 1.59 – 0.43 0.27 Unknown
SPCC736.15 Hypothetical protein(conserved)
4.29 0.98 0.44 0.10 1.41 – 0.33 0.21 Unknown
SPCC736.15 Hypothetical protein(conserved)
4.29 0.98 0.44 0.10 1.12 – 0.26 0.17 Glycolysis, pyruvate metabolism
SPAC10F6.06 Vip1 protein 3.32 1.56 0.42 0.20 1.49 – 0.65 0.51 Unknown (putative RNA bindingprotein)
SPAC10F6.06 Vip1 protein 3.32 1.56 0.42 0.20 – – 0.40 0.29 Unknown (putative RNA bindingprotein)
2006 WILEY-VCH Verlag GmbH & Co. KGaA, Weinheim www.proteomics-journal.com
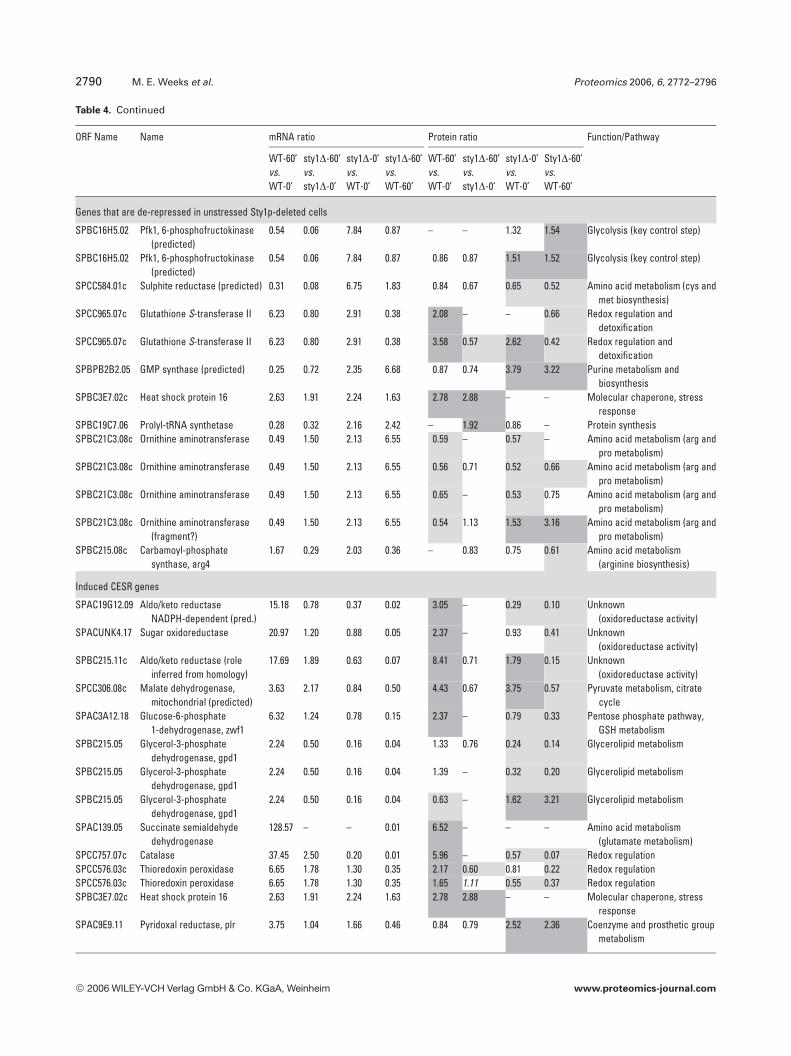
2790 M. E. Weeks et al. Proteomics 2006, 6, 2772–2796
Table 4. Continued
ORF Name Name mRNA ratio Protein ratio Function/Pathway
WT-60’vs.WT-0’
sty1D-60’vs.sty1D-0’
sty1D-0’vs.WT-0’
sty1D-60’vs.WT-60’
WT-60’vs.WT-0’
sty1D-60’vs.sty1D-0’
sty1D-0’vs.WT-0’
Sty1D-60’vs.WT-60’
Genes that are de-repressed in unstressed Sty1p-deleted cells
SPBC16H5.02 Pfk1, 6-phosphofructokinase(predicted)
0.54 0.06 7.84 0.87 – – 1.32 1.54 Glycolysis (key control step)
SPBC16H5.02 Pfk1, 6-phosphofructokinase(predicted)
0.54 0.06 7.84 0.87 0.86 0.87 1.51 1.52 Glycolysis (key control step)
SPCC584.01c Sulphite reductase (predicted) 0.31 0.08 6.75 1.83 0.84 0.67 0.65 0.52 Amino acid metabolism (cys andmet biosynthesis)
SPCC965.07c Glutathione S-transferase II 6.23 0.80 2.91 0.38 2.08 – – 0.66 Redox regulation anddetoxification
SPCC965.07c Glutathione S-transferase II 6.23 0.80 2.91 0.38 3.58 0.57 2.62 0.42 Redox regulation anddetoxification
SPBPB2B2.05 GMP synthase (predicted) 0.25 0.72 2.35 6.68 0.87 0.74 3.79 3.22 Purine metabolism andbiosynthesis
SPBC3E7.02c Heat shock protein 16 2.63 1.91 2.24 1.63 2.78 2.88 – – Molecular chaperone, stressresponse
SPBC19C7.06 Prolyl-tRNA synthetase 0.28 0.32 2.16 2.42 – 1.92 0.86 – Protein synthesisSPBC21C3.08c Ornithine aminotransferase 0.49 1.50 2.13 6.55 0.59 – 0.57 – Amino acid metabolism (arg and
pro metabolism)SPBC21C3.08c Ornithine aminotransferase 0.49 1.50 2.13 6.55 0.56 0.71 0.52 0.66 Amino acid metabolism (arg and
pro metabolism)SPBC21C3.08c Ornithine aminotransferase 0.49 1.50 2.13 6.55 0.65 – 0.53 0.75 Amino acid metabolism (arg and
pro metabolism)SPBC21C3.08c Ornithine aminotransferase
(fragment?)0.49 1.50 2.13 6.55 0.54 1.13 1.53 3.16 Amino acid metabolism (arg and
pro metabolism)SPBC215.08c Carbamoyl-phosphate
synthase, arg41.67 0.29 2.03 0.36 – 0.83 0.75 0.61 Amino acid metabolism
(arginine biosynthesis)
Induced CESR genes
SPAC19G12.09 Aldo/keto reductaseNADPH-dependent (pred.)
15.18 0.78 0.37 0.02 3.05 – 0.29 0.10 Unknown(oxidoreductase activity)
SPACUNK4.17 Sugar oxidoreductase 20.97 1.20 0.88 0.05 2.37 – 0.93 0.41 Unknown(oxidoreductase activity)
SPBC215.11c Aldo/keto reductase (roleinferred from homology)
17.69 1.89 0.63 0.07 8.41 0.71 1.79 0.15 Unknown(oxidoreductase activity)
SPCC306.08c Malate dehydrogenase,mitochondrial (predicted)
3.63 2.17 0.84 0.50 4.43 0.67 3.75 0.57 Pyruvate metabolism, citratecycle
SPAC3A12.18 Glucose-6-phosphate1-dehydrogenase, zwf1
6.32 1.24 0.78 0.15 2.37 – 0.79 0.33 Pentose phosphate pathway,GSH metabolism
SPBC215.05 Glycerol-3-phosphatedehydrogenase, gpd1
2.24 0.50 0.16 0.04 1.33 0.76 0.24 0.14 Glycerolipid metabolism
SPBC215.05 Glycerol-3-phosphatedehydrogenase, gpd1
2.24 0.50 0.16 0.04 1.39 – 0.32 0.20 Glycerolipid metabolism
SPBC215.05 Glycerol-3-phosphatedehydrogenase, gpd1
2.24 0.50 0.16 0.04 0.63 – 1.62 3.21 Glycerolipid metabolism
SPAC139.05 Succinate semialdehydedehydrogenase
128.57 – – 0.01 6.52 – – – Amino acid metabolism(glutamate metabolism)
SPCC757.07c Catalase 37.45 2.50 0.20 0.01 5.96 – 0.57 0.07 Redox regulationSPCC576.03c Thioredoxin peroxidase 6.65 1.78 1.30 0.35 2.17 0.60 0.81 0.22 Redox regulationSPCC576.03c Thioredoxin peroxidase 6.65 1.78 1.30 0.35 1.65 1.11 0.55 0.37 Redox regulationSPBC3E7.02c Heat shock protein 16 2.63 1.91 2.24 1.63 2.78 2.88 – – Molecular chaperone, stress
responseSPAC9E9.11 Pyridoxal reductase, plr 3.75 1.04 1.66 0.46 0.84 0.79 2.52 2.36 Coenzyme and prosthetic group
metabolism
2006 WILEY-VCH Verlag GmbH & Co. KGaA, Weinheim www.proteomics-journal.com
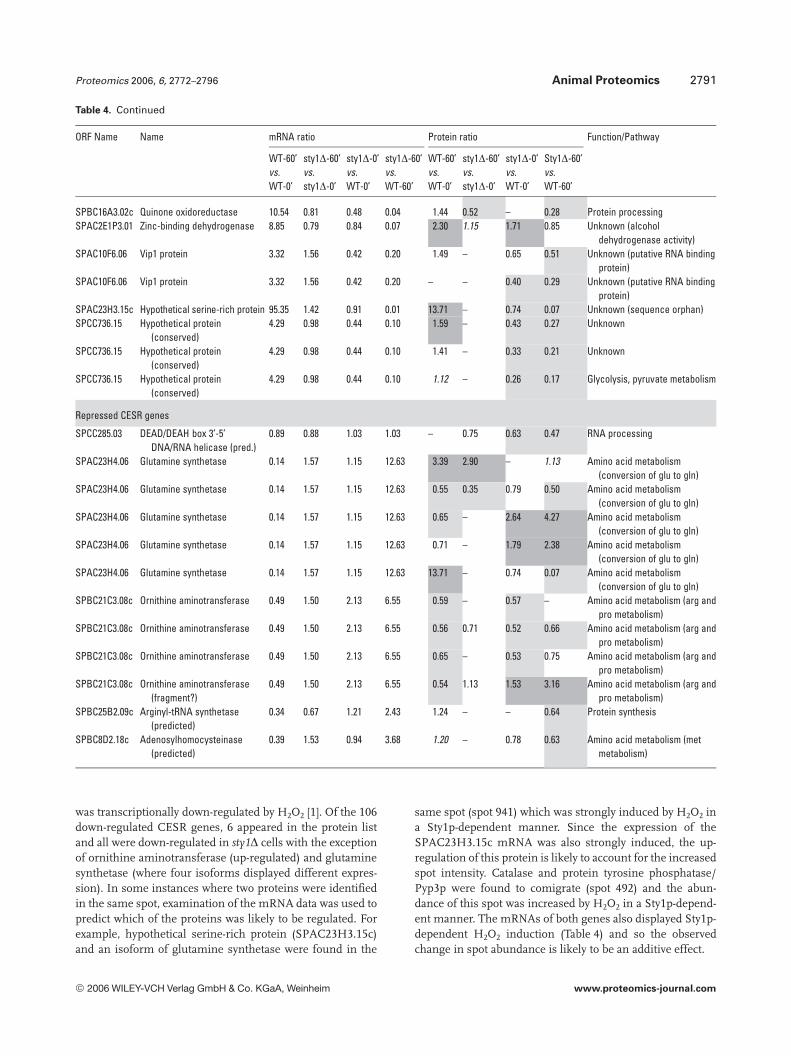
Proteomics 2006, 6, 2772–2796 Animal Proteomics 2791
Table 4. Continued
ORF Name Name mRNA ratio Protein ratio Function/Pathway
WT-60’vs.WT-0’
sty1D-60’vs.sty1D-0’
sty1D-0’vs.WT-0’
sty1D-60’vs.WT-60’
WT-60’vs.WT-0’
sty1D-60’vs.sty1D-0’
sty1D-0’vs.WT-0’
Sty1D-60’vs.WT-60’
SPBC16A3.02c Quinone oxidoreductase 10.54 0.81 0.48 0.04 1.44 0.52 – 0.28 Protein processingSPAC2E1P3.01 Zinc-binding dehydrogenase 8.85 0.79 0.84 0.07 2.30 1.15 1.71 0.85 Unknown (alcohol
dehydrogenase activity)SPAC10F6.06 Vip1 protein 3.32 1.56 0.42 0.20 1.49 – 0.65 0.51 Unknown (putative RNA binding
protein)SPAC10F6.06 Vip1 protein 3.32 1.56 0.42 0.20 – – 0.40 0.29 Unknown (putative RNA binding
protein)SPAC23H3.15c Hypothetical serine-rich protein 95.35 1.42 0.91 0.01 13.71 – 0.74 0.07 Unknown (sequence orphan)SPCC736.15 Hypothetical protein
(conserved)4.29 0.98 0.44 0.10 1.59 – 0.43 0.27 Unknown
SPCC736.15 Hypothetical protein(conserved)
4.29 0.98 0.44 0.10 1.41 – 0.33 0.21 Unknown
SPCC736.15 Hypothetical protein(conserved)
4.29 0.98 0.44 0.10 1.12 – 0.26 0.17 Glycolysis, pyruvate metabolism
Repressed CESR genes
SPCC285.03 DEAD/DEAH box 3’-5’DNA/RNA helicase (pred.)
0.89 0.88 1.03 1.03 – 0.75 0.63 0.47 RNA processing
SPAC23H4.06 Glutamine synthetase 0.14 1.57 1.15 12.63 3.39 2.90 – 1.13 Amino acid metabolism(conversion of glu to gln)
SPAC23H4.06 Glutamine synthetase 0.14 1.57 1.15 12.63 0.55 0.35 0.79 0.50 Amino acid metabolism(conversion of glu to gln)
SPAC23H4.06 Glutamine synthetase 0.14 1.57 1.15 12.63 0.65 – 2.64 4.27 Amino acid metabolism(conversion of glu to gln)
SPAC23H4.06 Glutamine synthetase 0.14 1.57 1.15 12.63 0.71 – 1.79 2.38 Amino acid metabolism(conversion of glu to gln)
SPAC23H4.06 Glutamine synthetase 0.14 1.57 1.15 12.63 13.71 – 0.74 0.07 Amino acid metabolism(conversion of glu to gln)
SPBC21C3.08c Ornithine aminotransferase 0.49 1.50 2.13 6.55 0.59 – 0.57 – Amino acid metabolism (arg andpro metabolism)
SPBC21C3.08c Ornithine aminotransferase 0.49 1.50 2.13 6.55 0.56 0.71 0.52 0.66 Amino acid metabolism (arg andpro metabolism)
SPBC21C3.08c Ornithine aminotransferase 0.49 1.50 2.13 6.55 0.65 – 0.53 0.75 Amino acid metabolism (arg andpro metabolism)
SPBC21C3.08c Ornithine aminotransferase(fragment?)
0.49 1.50 2.13 6.55 0.54 1.13 1.53 3.16 Amino acid metabolism (arg andpro metabolism)
SPBC25B2.09c Arginyl-tRNA synthetase(predicted)
0.34 0.67 1.21 2.43 1.24 – – 0.64 Protein synthesis
SPBC8D2.18c Adenosylhomocysteinase(predicted)
0.39 1.53 0.94 3.68 1.20 – 0.78 0.63 Amino acid metabolism (metmetabolism)
was transcriptionally down-regulated by H2O2 [1]. Of the 106down-regulated CESR genes, 6 appeared in the protein listand all were down-regulated in sty1D cells with the exceptionof ornithine aminotransferase (up-regulated) and glutaminesynthetase (where four isoforms displayed different expres-sion). In some instances where two proteins were identifiedin the same spot, examination of the mRNA data was used topredict which of the proteins was likely to be regulated. Forexample, hypothetical serine-rich protein (SPAC23H3.15c)and an isoform of glutamine synthetase were found in the
same spot (spot 941) which was strongly induced by H2O2 ina Sty1p-dependent manner. Since the expression of theSPAC23H3.15c mRNA was also strongly induced, the up-regulation of this protein is likely to account for the increasedspot intensity. Catalase and protein tyrosine phosphatase/Pyp3p were found to comigrate (spot 492) and the abun-dance of this spot was increased by H2O2 in a Sty1p-depend-ent manner. The mRNAs of both genes also displayed Sty1p-dependent H2O2 induction (Table 4) and so the observedchange in spot abundance is likely to be an additive effect.
2006 WILEY-VCH Verlag GmbH & Co. KGaA, Weinheim www.proteomics-journal.com

2792 M. E. Weeks et al. Proteomics 2006, 6, 2772–2796
Figure 7. Global correlations ofmRNA and protein data. Log10values of the mRNA ratios for allidentified gene products [1]were plotted against the log10protein ratios from the prote-omic analysis for the fourexperimental comparisons; (A)WT-60’ vs. WT-0’, (B) sty1D-60’vs. sty1D-0’, (C) sty1D-60’ vs.WT-0’ and (D) sty1D-60’ vs. WT-60’ and linear regression coeffi-cients (R2) for the data deter-mined.
3.5 Metabolomic analysis
A metabolite analysis was also conducted on the same sam-ple sets using 1H-NMR. Samples from five biological repli-cates were prepared for identical analyses with an internalstandard for calibration and quantitation of metabolitepeaks. In total 31 individual peaks were quantified and ofthese 29 have been previously assigned to a specific cellularmetabolite. Both Sty1p- and H2O2-specific changes wereapparent (Fig. 8). Loss of Sty1p resulted in a significant(p,0.05) reduction of the amino acids leucine, isoleucine,valine, alanine, glutamate, glutamine, tyrosine, histidine,phenylalanine and of the metabolites lactate, U1 (uni-dentified peak), glycerophosphocholine (GPC), trimethyl-amine-N-oxide (TMAO), glycerol and UTP 1 UDP. Con-versely, betaine (involved in glycine metabolism), glycine, b-D-glucose, orotic acid (involved in pyrimidine metabolism)and the ATP 1 ADP pool were increased in unstressed sty1Dcells (Fig. 8A). Peroxide treatment of WT cells resulted in theinduction of acetate, glutamate, lysine, choline, GPC,TMAO, betaine, glycine, glycerol, U2, UTP 1 UDP and ino-sine, and all of these, with the exception of inosine, displayeda lower level of induction or even repression in sty1D(Fig. 8B). Of the metabolites repressed in the WT, leucine,valine and U1 were actually induced in sty1D. The moststriking difference was a six-fold increase in b-D-glucose inthe sty1D cells, but not the WT, in response to H2O2. Togetherthese data show that the Sty1p pathway is a critical regulatorof multiple, diverse metabolic pathways, including aminoacid biosynthesis and metabolism, and is required for thenormal response to oxidative stress. Repression of amino
acids in sty1D may be due to a slower rate of cellular metab-olism, resulting in reduced protein synthesis (lowered levelsof branched amino acids) and membrane turnover(decreased GPC level). With a slower rate of cell metabolism,less energy will be required by these cells, which in turncould lead to reduced glycolysis (reduced level of lactate andelevated glucose level) and amino acid metabolism.
The changing metabolite profiles were compared withthe protein data to identify correlations between the regula-tion of specific enzymes and their substrates or products. Forexample, higher levels of glycine in sty1D may be explainedby the lower expression of the major glycine-degrading en-zyme glycine dehydrogenase (SPAC13G6.06c), which may inturn affect betaine levels and purine metabolism, since gly-cine is essential for purine synthesis. The data also suggestthat an H2O2- and Sty1p-dependent conversion of glutamineto glutamate, possibly involving the regulated expression ofglutamine synthetase (SPAC23H4.06), glutamate dehy-drogenase (SPCC622.12c) and/or succinate semialdehydedehydrogenase (SPAC139.05). Induction of the latter mayalso produce the observed reduction in succinate (Fig. 8B).Sty1p-dependent induction of D-1-pyroline-5-carboxylatedehydrogenase (SPBC24C6.04) could also raise glutamatelevels by conversion from proline, whilst overexpression ofthe glutamine-hydrolysing enzyme GMP synthase(SPBPB2B2.05) in sty1D would reduce glutamine and alterpurine metabolism (Table 3). Enzymatic synthesis of GSHoccurs from the component amino acids (glutamate, cyste-ine, and glycine) via the sequential action of two ATP-de-pendent cytosolic enzymes, so it may be that the observedincreases in glutamate and glycine levels enable increased de
2006 WILEY-VCH Verlag GmbH & Co. KGaA, Weinheim www.proteomics-journal.com
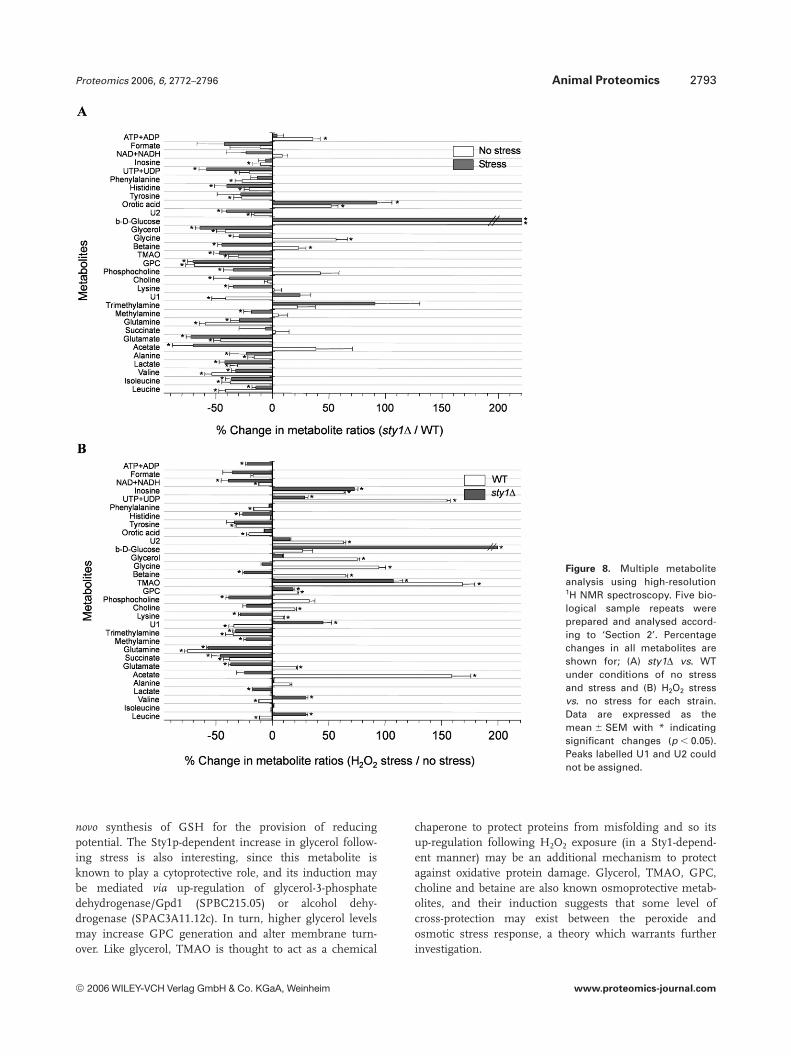
Proteomics 2006, 6, 2772–2796 Animal Proteomics 2793
Figure 8. Multiple metaboliteanalysis using high-resolution1H NMR spectroscopy. Five bio-logical sample repeats wereprepared and analysed accord-ing to ‘Section 2’. Percentagechanges in all metabolites areshown for; (A) sty1D vs. WTunder conditions of no stressand stress and (B) H2O2 stressvs. no stress for each strain.Data are expressed as themean 6 SEM with * indicatingsignificant changes (p , 0.05).Peaks labelled U1 and U2 couldnot be assigned.
novo synthesis of GSH for the provision of reducingpotential. The Sty1p-dependent increase in glycerol follow-ing stress is also interesting, since this metabolite isknown to play a cytoprotective role, and its induction maybe mediated via up-regulation of glycerol-3-phosphatedehydrogenase/Gpd1 (SPBC215.05) or alcohol dehy-drogenase (SPAC3A11.12c). In turn, higher glycerol levelsmay increase GPC generation and alter membrane turn-over. Like glycerol, TMAO is thought to act as a chemical
chaperone to protect proteins from misfolding and so itsup-regulation following H2O2 exposure (in a Sty1-depend-ent manner) may be an additional mechanism to protectagainst oxidative protein damage. Glycerol, TMAO, GPC,choline and betaine are also known osmoprotective metab-olites, and their induction suggests that some level ofcross-protection may exist between the peroxide andosmotic stress response, a theory which warrants furtherinvestigation.
2006 WILEY-VCH Verlag GmbH & Co. KGaA, Weinheim www.proteomics-journal.com

2794 M. E. Weeks et al. Proteomics 2006, 6, 2772–2796
Figure 9. Schematic representations ofmetabolic responses to H2O2 in (A) WTand (B) sty1D. Arrows between path-ways indicate known connections takenfrom the Kyoto Encyclopaedia of Genesand Genomes (KEGG) Pathways Data-base. Vertical arrows indicate a predic-tion of the up- or down-regulation of apathway based upon how protein and/ormetabolite levels change in response tostress. Stress response of the WT glyco-lytic pathway is more complex, sincethere was down-regulation of theenzymes in the lower half of pathwayand up-regulation of the enzymes in theupper part of the pathway (see text).Metabolic pathways in bold italic typeindicate that the predicted direction ofregulation of this pathway is supportedby protein data only whilst those in nor-mal type face indicate that the directionof regulation is supported by bothmetabolite and protein data.
4 Concluding remarks
In this study, we have identified a large number of S. pombeprotein isoforms that display H2O2-dependent changes inabundance and have related these changes to alterations inthe mRNA and metabolic profiles of cells treated underidentical conditions. This work shows that a diverse range ofcellular processes are affected by oxidative stress and furtherdemonstrates the role of the Sty1p signalling pathway inregulating some of these processes. Although a number ofthe recorded protein changes correlated well with alteredgene expression (Table 4), there was a low overall correlationbetween protein and mRNA expression in agreement withsome previous studies [53, 54], but not others, where higher
correlations were observed for specific subsets of genes [55,56]. Our work thus highlights the complexity of the cellularresponse to stress and indicates that many levels of regula-tion are at play. Indeed, a large number of proteins appearedto be post-translationally altered through proteolysis, phos-phorylation and/or oxidation with no correlative change intheir mRNA expressions. However, mRNA stability or theefficiency of translation may also be regulated by stress [57]and therefore may contribute to the low correlation observed.This emphasizes the requirement for more detailed prote-omic analyses if we are to fully understand the molecularmechanisms involved in responses to stress and other sti-muli. Moreover, given the relatively poor sensitivity and cov-erage of current proteomic methodologies, it is likely that
2006 WILEY-VCH Verlag GmbH & Co. KGaA, Weinheim www.proteomics-journal.com

Proteomics 2006, 6, 2772–2796 Animal Proteomics 2795
there are many more low-abundance targets to be identified,although it is important to note that 2-D-DIGE does provide arobust, quantitative method for global expression profiling.
When interpreted alone, each experimental methodidentifies putative targets of the oxidative stress response andspecifically the Sty1p-responsive elements of numerousmetabolic pathways. However, the real value of the data canonly be discerned when data sets are combined and theresults viewed globally. Such a systems approach allows sig-nificantly more detail to be proposed regarding how variouscellular processes are affected by oxidative stress and Sty1psignalling and how regulation is achieved. It is clear that thestress response is global and has profound effects on multi-ple, diverse metabolic pathways and that the Sty1p stress-activated protein kinase is a critical modulator of these eventsbasally, and in particular, during the stress response. Itinvolves a number of changes including alterations in pro-tein and amino acid synthesis, a switch in energy productionfrom glycolysis to the pentose phosphate pathway for thegeneration of NADPH and the induction of stress-specificantioxidant enzymes and cytoprotectants that would act toreduce cellular ROS, protect against molecular damage andreverse oxidative protein modification. This is in generalagreement with the conclusions of a previous proteomicanalysis of the H2O2 response in the budding yeast S. cerevi-siae [49], and indeed, there was considerable overlap in theprotein changes identified between this study and ours, par-ticularly of enzymes involved in carbohydrate and aminoacid metabolism. Finally, whilst WT cells elicit a robust re-sponse that is required for their survival, the sty1D responseis muted and appears to involve shutting down of proteinsynthesis, a number of metabolic pathways and energy pro-duction possibly in preparation for entering a dormant phaseor prior to cell death (Fig. 9).
We would like to thank Mr. Richard Jacob (UCL) for soft-ware writing and support for MS data analysis and the EMFBiological Research Trust for funding. We would also like toacknowledge The Medical Biomics Centre at St George’s, London,for the use of their 600 MHz NMR Spectrometer.
5 References
[1] Chen, D., Toone, W. M., Mata, J., Lyne, R. et al., Mol. Biol. Cell2003, 14, 214–229.
[2] Gasch, A. P., Spellman, P. T., Kao, C. M., Carmel-Harel, O. etal., Mol. Biol. Cell 2000, 11, 4241–4257.
[3] Causton, H. C., Ren, B., Koh, S. S., Harbison, C. T. et al., Mol.Biol. Cell 2001, 12, 323–337.
[4] Weeks, M. E., James, D. C., Robinson, G. K., Smales, C. M.,Proteomics 2004, 4, 123–135.
[5] Madeo, F., Engelhardt, S., Herker, E., Lehmann, N. et al., Curr.Genet. 2002, 41, 208–216.
[6] Wood, V., Gwilliam, R., Rajandream, M. A., Lyne, M. et al.,Nature 2002, 415, 871–880.
[7] Sunnerhagen, P., Curr. Genet. 2002, 42, 73–84.
[8] Degols, G., Russell, P., Mol. Cell Biol. 1997, 17, 3356–3363.
[9] Degols, G., Shiozaki, K., Russell, P., Mol. Cell. Biol. 1996, 16,2870–2877.
[10] Shiozaki, K., Russell, P., Nature 1995, 378, 739–743.
[11] Wilkinson, M. G., Samuels, M., Takeda, T., Toone, W. M. etal., Genes Dev. 1996, 10, 2289–2301.
[12] Gaits, F., Degols, G., Shiozaki, K., Russell, P., Genes Dev.1998, 12, 1464–1473.
[13] Shiozaki, K., Russell, P., Genes Dev. 1996, 10, 2276–2288.
[14] Takeda, T., Toda, T., Kominami, K., Kohnosu, A. et al.,Embo. J. 1995, 14, 6193–6208.
[15] Jackson, A. L., Loeb, L. A., Mutat. Res. 2001, 477, 7–21.
[16] Ames, B. N., Gold, L. S., Willett, W. C., Proc. Natl. Acad. Sci.USA 1995, 92, 5258–5265.
[17] Olinski, R., Gackowski, D., Foksinski, M., Rozalski, R. et al.,Free Radic. Biol. Med. 2002, 33, 192–200.
[18] Taniyama, Y., Griendling, K. K., Hypertension 2003, 42, 1075–1081.
[19] Suh, Y. A., Arnold, R. S., Lassegue, B., Shi, J. et al., Nature1999, 401, 79–82.
[20] Szatrowski, T. P., Nathan, C. F., Cancer Res. 1991, 51, 794–798.
[21] Rhee, S. G., Exp. Mol. Med. 1999, 31, 53–59.
[22] Behrend, L., Henderson, G., Zwacka, R. M., Biochem. Soc.Trans. 2003, 31, 1441–1444.
[23] Sundaresan, M., Yu, Z. X., Ferrans, V. J., Irani, K. et al., Sci-ence 1995, 270, 296–299.
[24] Gros, L., Saparbaev, M. K., Laval, J., Oncogene 2002, 21,8905–8925.
[25] Klatt, P., Lamas, S., Eur. J. Biochem. 2000, 267, 4928–4944.
[26] Thomas, J. A., Poland, B., Honzatko, R., Arch. Biochem.Biophys. 1995, 319, 1–9.
[27] Carmel-Harel, O., Storz, G., Annu. Rev. Microbiol. 2000, 54,439–461.
[28] Grant, C. M., Mol. Microbiol. 2001, 39, 533–541.
[29] Rietsch, A., Beckwith, J., Annu. Rev. Genet. 1998, 32, 163–184.
[30] Shenton, D., Grant, C. M., Biochem. J. 2003, 374, 513–519.
[31] Luikenhuis, S., Perrone, G., Dawes, I. W., Grant, C. M., Mol.Biol. Cell 1998, 9, 1081–1091.
[32] Viladevall, L., Serrano, R., Ruiz, A., Domenech, G. et al., J.Biol. Chem. 2004, 279, 43614–43624.
[33] Rabilloud, T., Proteomics 2002, 2, 3–10.
[34] Herbert, B. R., Harry, J. L., Packer, N. H., Gooley, A. A. et al.,Trends Biotechnol. 2001, 19, S3–S9.
[35] Gharbi, S., Gaffney, P., Yang, A., Zvelebil, M. J. et al., Mol.Cell. Proteom. 2002, 1, 91–98.
[36] Tonge, R., Shaw, J., Middleton, B., Rowlinson, R. et al., Pro-teomics 2001, 1, 377–396.
[37] Unlu, M., Morgan, M. E., Minden, J. S., Electrophoresis1997, 18, 2071–2077.
[38] Griffin, J. L., Bollard, M. E., Curr. Drug Metab. 2004, 5, 389–398.
2006 WILEY-VCH Verlag GmbH & Co. KGaA, Weinheim www.proteomics-journal.com
2796 M. E. Weeks et al. Proteomics 2006, 6, 2772–2796
[39] Viant, M. R., Rosenblum, E. S., Tieerdema, R. S., Environ.Sci. Technol. 2003, 37, 4982–4989.
[40] Moreno, S., Klar, A., Nurse, P., Methods Enzymol. 1991, 194,795–823.
[41] Schultz, M. C., Methods 1999, 17, 161–172.
[42] Chan, H. L., Gharbi, S., Gaffney, P. R., Cramer, R. et al., Pro-teomics 2005, 5, 2908–2926.
[43] Weeks, M. E., Sinclair, J., Jacob, R. J., Saxton, M. J. et al.,Proteomics 2005, 5, 1669–1685.
[44] Schmidt, F., Schmid, M., Jungblut, P. R., Mattow, J. et al., J.Am. Soc. Mass Spectrom. 2003, 14, 943–956.
[45] Bahler, J., Wu, J. Q., Longtine, M. S., Sah, Nh. G. et al., Yeast1998, 14, 943–951.
[46] Bergmeyer, H., Methods of Enzymatic Analysis, Verlag Che-mie, Germany 1974, Vol. 1, pp. 425–426.
[47] Quinn, J., Findlay, V. J., Dawson, K., Millar, J. B. et al., Mol.Biol. Cell 2002, 13, 805–816.
[48] Alban, A., David, S. O., Bjorkesten, L., Andersson, C. , Prote-omics 2003, 3, 36–44.
[49] Godon, C., Lagniel, G., Lee, J., Buhler, J. M. et al., J. Biol.Chem. 1998, 273, 22480–22489.
[50] Veal, E. A., Findlay, V. J., Day, A. M., Bozonet, S. M. et al.,Mol. Cell 2004, 15, 129–139.
[51] Wagner, E., Luche, S., Penna, L., Chevallet, M. et al., Bio-chem. J. 2002, 366, 777–785.
[52] Rabilloud, T., Heller, M., Gasnier, F., Luche, S. et al., J. Biol.Chem. 2002, 277, 19396–19401. Epub 12002 Mar 19319.
[53] Gygi, S. P., Rochon, Y., Franza, B. R., Aebersold, R., Mol. CellBiol. 1999, 19, 1720–1730.
[54] Anderson, L., Seilhamer, J., Electrophoresis 1997, 18, 533–537.
[55] White, S. L., Gharbi, S., Bertani, M. F., Chan, H. L. et al., Br. J.Cancer 2004, 90, 173–181.
[56] Bro, C., Regenberg, B., Lagniel, G., Labarre, J. et al., J. Biol.Chem. 2003, 278, 32141–32149.
[57] Ptushkina, M., Malys, N., McCarthy, J. E., EMBO Rep. 2004,5, 311–316.
2006 WILEY-VCH Verlag GmbH & Co. KGaA, Weinheim www.proteomics-journal.com
Related Documents


![Systems Metabolomic Lecture[1]](https://static.cupdf.com/doc/110x72/546af5e0b4af9f486b8b45b1/systems-metabolomic-lecture1.jpg)