ELSEVIER 13504533(95)00040-2 A numerical model of an intensive care ventilator- humidifier system T. Drew*, A. Vardy, W. Taruow-Mordiz and R. Lerski* *Department of Medical Physics, Ninewells Hospital, Dundee DD1 9SY, UK, tDepartment of Civil Engineering, University of Dundee, Dundee DDl 4HN, UK TDepartment of Child Health, Ninewells Hospital, Dundee DDl 9SY, UK ABSTRACT ~~urren/ intensiw cure zlenlilc~tor-humidi~ syslems neither monitor nor ndrqunle(~ control inspired gas humidity. f’tnhlems o/low deliwred humidity and rondensnlion within oenlilator rirruity are cornmon(y encounkred. To help lo c~~dress the~w /woblems, CL numerirnl model of N complete 7~entilator-hu~r~idi~~-~alie~II inlensir~e car-e vys/em has hwtc da~elofi~d. Thp model. based on a finite di/ffprence technique. can predict prrssuwc. flou-rates. lempern t uw an 11 wln/kw humidi1ie.s a/ disrrete points throughout the s~sirm. .i comparison o/ n umericnl predictions and mea~uremen1.s in n r-eal system is reported. A strong qunlil&i7le apee- m(,nl i.\ demon.slraled in a11 cases ‘studied. rind u good yunntitaliuf agreement is obtained in mosl caw. I/ l.s rontluded /hat such models could be used lo ass~,ss methods of conirulling 7lentilntor-humidiJivr systems /II f,rwrn/ /he orwrrenre of condenscction. Similar mod& could be de7wloped li,r olher medical ga.s deli7wy c;~.slems. C.i~/~yriglr/ Q I W6 lXse7~in- Science I,td jw IPfiMH. Keywords: Numerical model, intensive care, ~entililtor-hllmidifier svstem Med. Eng. Phys., 19%. Vol. 18. 251~261, April NOMENCLATURE wave speed (m/s) diameter (m) surface heat transfer coefficient (J/kgK) inspired gas humidity (mg/l) resistance coefficient constant in equations (1 l)-( 13) length of tube (m) mass (kg) mass flow-rate (kg/s) defined in equation 2 (N/m’) Nusselt number = LD/A pressure (Pa) Prandtl number density (kg/m”) rate of heat flow (W) rate of heat flow per unit length (W/m) Reynolds number = pD\‘/p relative humidity absolute temperature (K) time (s) integration time step (s) velocity (m/s) distance along tube axis (m) grid length (m) ratio of specific heats thermal conductivity (J/m’K) im absolute viscosity (Pa.s) TX, wall shear stress (Pa) Suffices amb ambient conditions H humidifier chamber i inflow T tube \ valve w tube wall wi tube wall inner surface wo tube wall outer surface INTRODUCTION Medically, the term ‘ventilation’ refers to the delivery of oxygen to, and the removal of carbon dioxide from, the lungs. When the body’s own mechanisms to perform these tasks are &paired or have failed, it becomes necessary to provide an artificial means to achieve ventilation. The machines used for this purpose must supply air at the appropriate pressure, temperature and humidity. Currently, the first two of these require- ments are satisfied much more so than the third. A wide range of respiratory disorders require ventilator support. Most fall into the following three categories:

Welcome message from author
This document is posted to help you gain knowledge. Please leave a comment to let me know what you think about it! Share it to your friends and learn new things together.
Transcript

ELSEVIER 13504533(95)00040-2
A numerical model of an intensive care ventilator- humidifier system
T. Drew*, A. Vardy, W. Taruow-Mordiz and R. Lerski*
*Department of Medical Physics, Ninewells Hospital, Dundee DD1 9SY, UK, tDepartment of Civil Engineering, University of Dundee, Dundee DDl 4HN, UK TDepartment of Child Health, Ninewells Hospital, Dundee DDl 9SY, UK
ABSTRACT ~~urren/ intensiw cure zlenlilc~tor-humidi~ syslems neither monitor nor ndrqunle(~ control inspired gas humidity.
f’tnhlems o/low deliwred humidity and rondensnlion within oenlilator rirruity are cornmon(y encounkred. To help
lo c~~dress the~w /woblems, CL numerirnl model of N complete 7~entilator-hu~r~idi~~-~alie~II inlensir~e car-e vys/em has
hwtc da~elofi~d. Thp model. based on a finite di/ffprence technique. can predict prrssuwc. flou-rates. lempern t uw an 11
wln/kw humidi1ie.s a/ disrrete points throughout the s~sirm.
.i comparison o/ n umericnl predictions and mea~uremen1.s in n r-eal system is reported. A strong qunlil&i7le apee-
m(,nl i.\ demon.slraled in a11 cases ‘studied. rind u good yunntitaliuf agreement is obtained in mosl caw. I/ l.s
rontluded /hat such models could be used lo ass~,ss methods of conirulling 7lentilntor-humidiJivr systems /II f,rwrn/
/he orwrrenre of condenscction. Similar mod& could be de7wloped li,r olher medical ga.s deli7wy c;~.slems. C.i~/~yriglr/
Q I W6 lXse7~in- Science I,td jw IPfiMH.
Keywords: Numerical model, intensive care, ~entililtor-hllmidifier svstem
Med. Eng. Phys., 19%. Vol. 18. 251~261, April
NOMENCLATURE
wave speed (m/s) diameter (m) surface heat transfer coefficient (J/kgK) inspired gas humidity (mg/l) resistance coefficient constant in equations (1 l)-( 13) length of tube (m) mass (kg) mass flow-rate (kg/s) defined in equation 2 (N/m’) Nusselt number = LD/A pressure (Pa) Prandtl number density (kg/m”) rate of heat flow (W) rate of heat flow per unit length (W/m) Reynolds number = pD\‘/p relative humidity absolute temperature (K) time (s) integration time step (s) velocity (m/s) distance along tube axis (m) grid length (m) ratio of specific heats thermal conductivity (J/m’K)
im absolute viscosity (Pa.s) TX, wall shear stress (Pa)
Suffices
amb ambient conditions H humidifier chamber i inflow T tube \ valve w tube wall w i tube wall inner surface wo tube wall outer surface
INTRODUCTION
Medically, the term ‘ventilation’ refers to the delivery of oxygen to, and the removal of carbon dioxide from, the lungs. When the body’s own mechanisms to perform these tasks are &paired or have failed, it becomes necessary to provide an artificial means to achieve ventilation. The machines used for this purpose must supply air at the appropriate pressure, temperature and humidity. Currently, the first two of these require- ments are satisfied much more so than the third.
A wide range of respiratory disorders require ventilator support. Most fall into the following three categories:
A nutical model o/ nn intensive care ventilator-humidzjier system: T. Drtw et al
1.
2.
3.
The body’s ventilatory system 1ack.s muscle drive. This may be due to muscle weakness or paralysis, or damage to the thoracic wall structure. Abnormalities in the resistance of the lungs. Abnor- mally high resistance can be caused by tumour growth, muscle constriction of the airways, inflammation and swelling of the airway linings, or excessive mucosal secretion into the airways. The latter is often caused by allergic bronchial asthma. Ab~o~~lit~es in the com$iance of the lungs. These can occur when the chest wall is restricted by diseases leading to skeletal deformations, such as kyphoscoliosis, or tuberculosis. Traumatic damage, as in a car accident, can also lead to thoracic restriction.
More specifically, abnormality in the compliance of the lung, caused by Hyaline membrane disease (HMD) is the single most common cause for ven- tilator-y support of the new-born in the UK’. The treatment of this condition is directed at main- taining respiration and other vital functions until spontaneous recovery occurs. It is reported that, in Europe and North America, about l-2% of new-born babies (up to 200000 per year) now receive mechanical ventilation’. Other less com- mon reasons for ventilator support in a neonatal intensive care unit include birth asphyxia, apnoea, congenital abnormalities, and pneumonia.
In general, there are three ways to deliver oxy- gen and remove carbon dioxide artificially:
1. The application of intermittent negative press- ure to the body (excluding the head).
2. The application of intermittent positive press- ure to the airway (the mechanism considered herein).
3. Electrical stimulation of the nerves and muscles that produce inspiration.
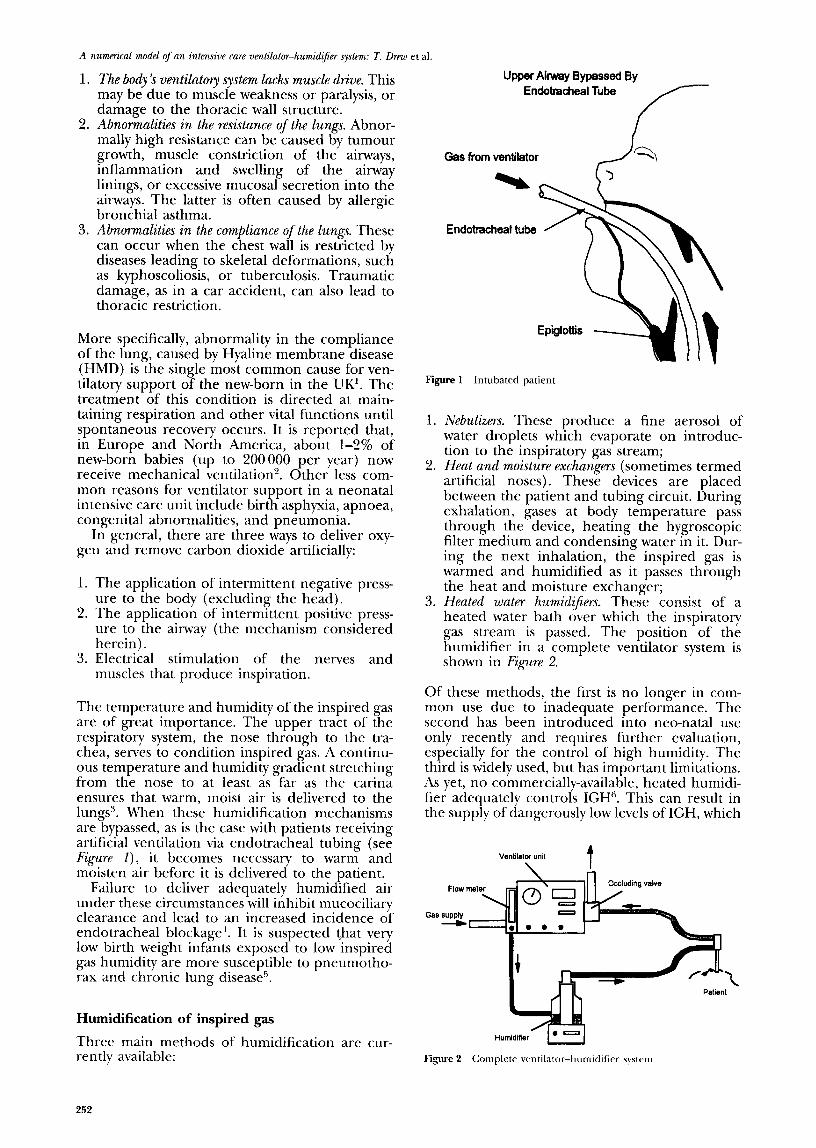
The temperature and humidity of the inspired gas are of great importance. The upper tract of the respiratory system, the nose through to the tra- chea, serves to condition inspired gas. A continu- ous temperature and humidity gradient stretching from the nose to at least as far as the carina ensures that warm, moist air is delivered to the lungs’. When these humidification mechanisms are bypassed, as is the case with patients receiving artificial ventilation via endotracheal tubing (see Figure I), it becomes necessary to warm and moisten air before it is delivered to the patient.
Failure to deliver adequately humidified air under these circumstances will inhibit mucociliary clearance and lead to an increased incidence of endotracheal blockage ‘. It is suspected that very low birth weight infants exposed to low inspired gas humidity are more susceptible to pneumotho- rax and chronic lung disease”.
Humidification of inspired gas
Three main methods of humidification are cur- rently available:
252
Upper Airway Bypassed By Endotracheal Tube
Gas from ventilator
Endotracheaf tube
Figure 1 Intubated patient
1.
2.
3.
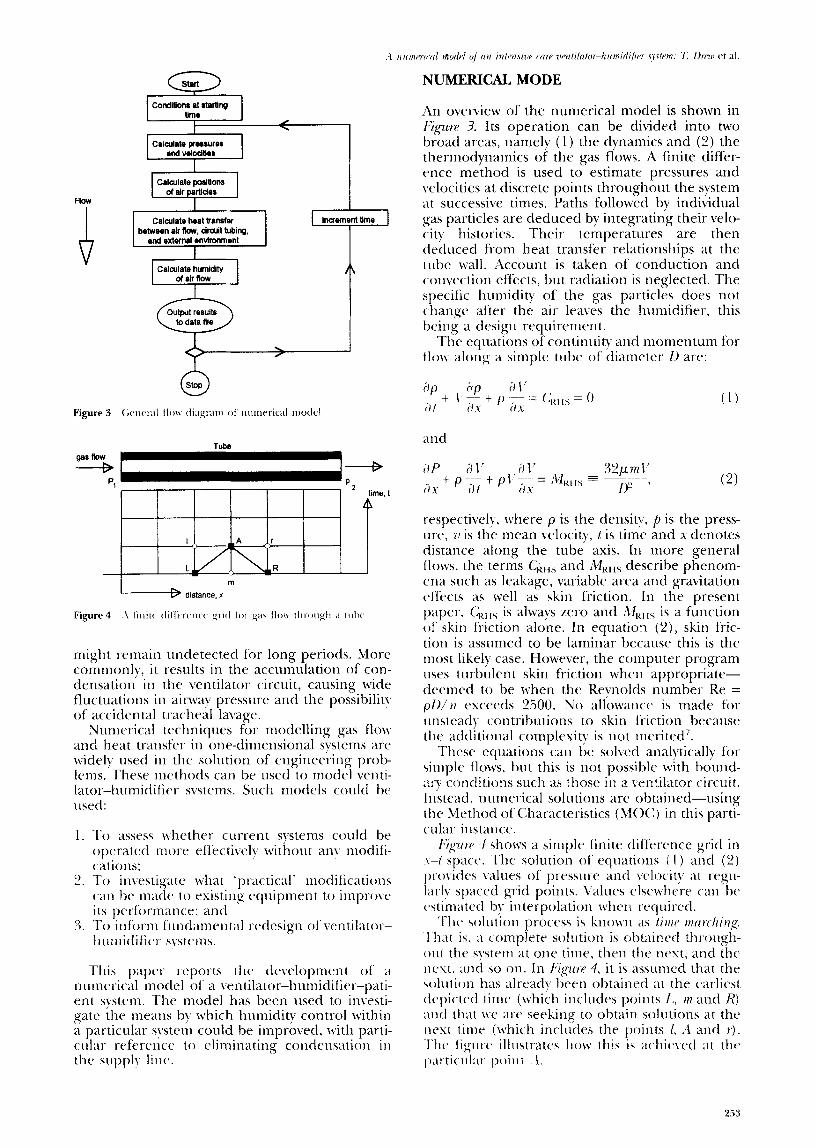
Nebulirers. These produce a fine aerosol of water droplets which evaporate on introduc- tion to the inspiratory gas stream; Heat and moisture exchangers (sometimes termed artificial noses). These devices are placed between the patient and tubing circuit. During exhalation, gases at body temperature pass through the device, heating the hygroscopic filter medium and condensing water in it. Dur- ing the next inhalation, the inspired gas is warmed and humidified as it passes through the heat and moisture exchanger; Heated water humidz@rs. These consist of a heated water bath over which the inspiratory gas stream is passed. The position of the humidifier in a complete ventilator system is shown in Figure 2.
Of these methods, the first is no longer in com- mon use due to inadequate performance. The second has been introduced into neo-natal use only recently and requires further evaluation, especially for the control of high humidity. The third is widely used, but has important limitations. As yet, no commercially-available, heated humidi- fier adequately controls IGH”. This can result in the supply of dangerously low levels of IGH, which
Ventilator unit $
\ Patient
Figure 2 Complete \,entilator-humidifiel- systrm
Ga 1 CondlUona at alartlrg 1 I Urn* I
t / . I
Calarlata humldlly o( air flow
I distance, x m
tnight remain undetected for long periods. More commonly, it results in the accumulation of con- densation in the ventilator circuit, causing wide fluctuations in airway pressure and the possibilit! of accidental tracheal lavage.
Nut~~erical techniques for modelling gas flop and heat transfer in one-dimensional systems are widel?, used in the solution of engineering prob- Icms.‘These methods can be used to model venti- latot--1l~tmidific.r systems. Such models could be 11srtl:
1. To assess lvhether current systems could be operated II~OIX effectiveh. without any modifi- cations:
2. To investigate cvhat ‘practical’ modifications (2ti be made to existing tquiptnent to impro\t~ its perfi)rmance; and
3. ‘l‘o infi)rm f’ittlrl~lmctit~tl t-cdesign of \:entilatot.- lit~tnidific~r- svstems.
This papc~r reports the d~elopmetit of’ ;I nutnerical model of a ventilator-humidificr-pati- ent system. The model has been used to investi- gate the meatts by which humidity control within a particular system could be improved. M’ith parti- cular rcfercnce to eliminating condcnsaGoti iti tlte sripphr lint..
NUMERICAL MODE
An overview of the numerical model is shown in Figure 3. Its operation can be divided into two broad areas, namely (1) the dynamics and (2) the thertnodynatnics of the gas flows. A finite differ- cwcc method is used to estimate pressures and velocities at discrete points throughout the system at successive times. Paths followed by individual gas particles are deduced by integrating their velo- city histories. Their temperatures are then tleduced from heat transfer relationships at the tube wall. Account is taken of conduction and convection effects, but radiation is neglected. The specific humiditv of the gas particles does not change after th& air leaves the humidifier, this being a design requirement.
The equattons of continuity and tnomenLum for flow along a simple tube of diameter I) are:
(1)
respectively, where p is the dettsily. f) is the press- ure, 71 is the mean velocity, t is time and x denotes distance along the tube axis. In more general flows. the terms C,,,, and A&t!, describe phenom- cna such as leakage, variable area and gravitation effects as lvell as skin friction. In the present paper, C;ills is always zero and Al,<,,, is a function of‘ skin friction alone. In equation (21, skin fric- tion is assumed to be laminar because this is the most likely case. However, the computer program uses turbulent skin friction when appropriate- deemed to be when the Reynolds number Re = pU/ )I rxceeds 2500. No allowance is tnade for rtnstcadv contributions to skin friction because tht. additional complexity is ttot tncrited’.
These t.quations can be solved analvtically fi)t- simple flows, but this is not possible with botund- at? conditions such as those in a ventilator circuit. Itlstead. numerical solutions are obtained-using the Method of Characteristics (MO<:) in this parti- cular instance.
I~~<~zIw 4 shotvs a simple finite difference grid in r-t space. The solution of’ eqttations i 1 ) and (2) provides values of pt-esswc~ and \,clocity at regu-
lar1~. spaced grid points. \Talues elsc~vhrre can bc c~stiinatcd bv inlerpolation wltctt rtquircd.
‘I’hr soluiion process is known as lirtrr nlrird~ing: That is. a complerc soltttion is oblaincc-I through- oltt the system at one time, then tlte ncs~, and the Itest. and so on. In ~~~uw 4. it is assuntcd that the solutiott has already been obtainctl at the earliest dcpicrcd time (which includes points I,. VI and R) and that xvc art’ seeking to obtain solutions at 111~ nest titiirx (which includes the I)oirits 1. ‘4 and I‘).
The figtirc* illustrates ltow this iq acliic7.4 at thr p;tt-ticrilar poittl i.
A numerical model of an intensive care ventilator-humid$e system: T. DEW et al.
Figure 5 Positions of flow boundary conditions
Reservoir To patient
%
(LeakRow)
Figure 6 Gas supply boundary
Humidifier, H Circuit tube, T
A,, A,
Figure 7 Humidifier boundary
Time
I
Method of characteristics (MOC)
Before describing the numerical procedure in detail, it is necessary to develop the partial differ- ential equations (1) and (2) into a more con- venient form. It is assumed that changes in press- ure and density are mutually dependent and satisfy:
dP -= _I z (3) dP
where c = > (yp/p) is the local speed of sound and y is the ratio of the principal specific heat capacities of the air. Using this relationship to eliminate ap from equation (1) and combining the result with equation (2)) it can be shown that:
dP dV dt+pc-=cMwS
dt
when dx/dt = v + c, and
dP x - pc $= - cMRHs
when dx/dt = v - c. The great advantage of these equations, in com-
parison with equations (1) and (2) is that they are ordinaly differential equations, not partial differen- tial equations. An apparent disadvantage is that their ranges of validity are restricted to particular directions (dx/dt). In practice, however, we shall see that this need not be a serious disadvantage.
Consider the finite difference grid in Figure 4 and suppose that the solution has already been obtained at the earliest time depicted. Construct a line through the point L satisfying dx/dt = v + c and another line through the point R satisfying dx/dt = u - c. These lines will meet at a point A at a later time which can be selected as the next time at which solutions are to be obtained. The point A will not coincide exactly with a grid point, but it will be very close when the air velocity is tiny in comparison with the speed of sound (340 m/s, say>.
Whether or not the point A is close to a grid point, equation (4) can be integrated along the line LA to give:
(PA - PL) t pc (V, - V,) = cMR,,At. (6)
Similarly, equation (5) can be integrated along the line RA to give:
(PA - PR) - pc (V’ - V,) = cMRHSAt. (7)
Provided that suitable values can be estimated for the terms MRHs, the only unknowns in equations (6) and (7) will be V, and p,. The equations can therefore be used to deduce the values of these unknowns, thereby completing the dynamic sol- ution at the point A.
The complete solution at the current time is obtained by:
1. Repeating this procedure at all other internal grid points; and
2. Following a closely related procedure at all boundary grid points.
Having done this, the complete process can be repeated at the next time shown in Figure 4, and so on. In this way, it is never necessary to deal with more than two time levels simultaneously- so relatively little computer memory is required. Results needed for subsequent processing
254
0 2 4 6
Figure 9 Patient houndan
T- i-’ liid r 1 T-
Temperature
Figure 10 Steady state thermal condition and lateral trmperature distribution in rircxlit
$i3nht;rva1s. s etc.) may be sent to a disk file at reg-
BOUNDARY CONDITIONS
The calculation procedure at boundaries differs from that at internal points because the L-A-R pattern shown in Figure 4 is inappropriate. By inspection, if the point A is at one end of the regime, then one of the lines LA, RA must lie out- side the re ime. tions (6 or 5
It follows that one of the equa- ) is unavailable and must be replaced
by some other equation. This complication arises
6 10 12 14 16
Fkhwde Umin
at both ends of every tube-i.e. at the positions l-6 in Figure 5.
Gas supply (Boundary 1 in FQztre 5)
Inspection of a Sechrist infant ventilator revealed the supply side of the system to be of a type shown in Figure 6. Air is received at a constant mass flow- rate Mi from the hospital’s high pressure line (typically 4 bar). The rate of flow into the venti- lator system is controlled by a bleed valve. The continuity equation for the supply unit is:
I@ = PI&l/,. t pa* If, (8)
in which the suffix A denotes conditions inside the end of the MOC tube. The rate of leak-flow depends on the pressure and the valve resistance. Denoting the latter by k., we may write:
I’, - C,,,,h = k, y. (9)
Equations (8) and (9) are solved simultaneously with the MOC equation (7) to give the pressure It)% and the two velocities KY and \,l.
Humidifier (Boundaries 2 and 3 in Figure 5)
The humidifier is treated as a tube in its own right. The junctions with the main ventilator tubes are typified by Figure 7. Two MOC equations can be written, but an additional relationship is needed because there is a discontinuity in the velocity. Solution closure is provided by the conti- nuity equation:
wkVH = pa,&. (10)
It is assumed that there is negligible change in pressure across the discontinuity.
255
A numerical model of an intensive care ventilator-humidtjier system: T. Drew et al.
7-c
48
40
44
42
40
38
36
34
32 I I , I I I I 1 k
I 0.125 0.25 0.375 0.5 0.625 0.75 0.875 1
Tubehgthm
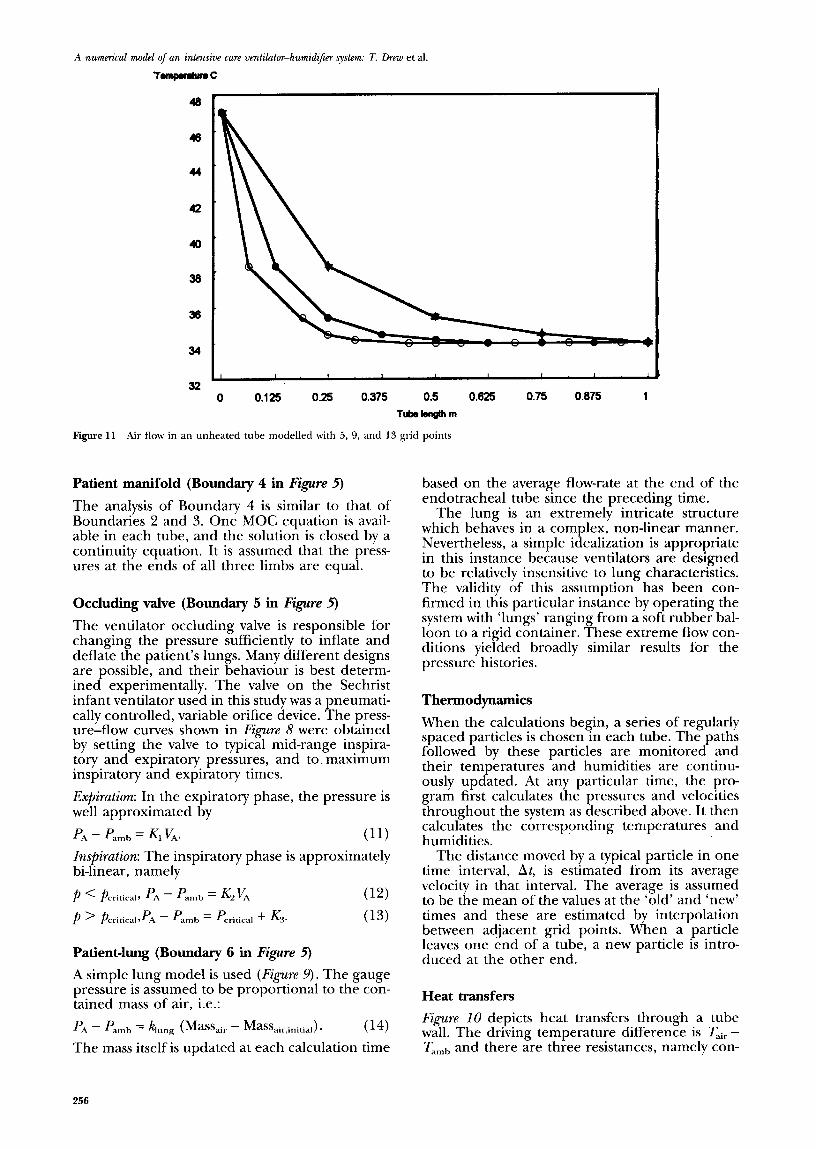
Figure 11 Air flow in an unheated tube modelled with 5, 9, and 13 grid points
Patient manifold (Boundary 4 in Figure 5)
The analysis of Boundary 4 is similar to that of Boundaries 2 and 3. One MOC equation is avail- able in each tube, and the solution is closed by a continuity equation. It is assumed that the press- ures at the ends of all three limbs are equal.
Occluding valve (Boundary 5 in Figure 5)
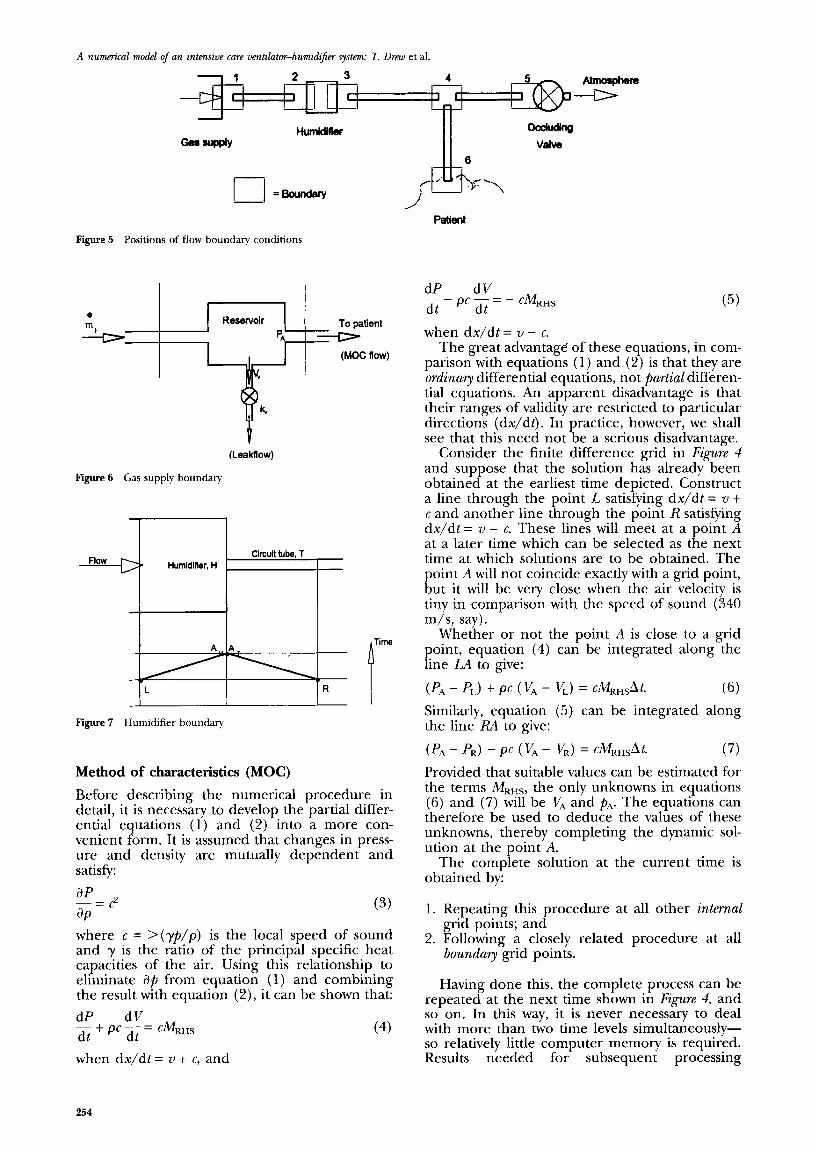
The ventilator occluding valve is responsible for changing the pressure sufficiently to inflate and deflate the patient’s lungs. Many different designs are possible, and their behaviour is best determ- ined experimentally. The valve on the Sechrist infant ventilator used in this study was a pneumati- cally controlled, variable orifice device. The press- ure-flow curves shown in Figure 8 were obtained by setting the valve to typical mid-range inspira- tory and expiratory pressures, and to maximum inspiratory and expiratory times.
E@kztion: In the expiratory phase, the pressure is well approximated by
PA - P..mb = KI VA. (11)
Inspiration: The inspiratory phase is approximately bi-linear, namely
p < pcritical, PA - Pamb = &K (12)
p ’ pcritica,A - f’amb = P,ritical + &a (13)
Patient-lung (Boundary 6 in Figure 5)
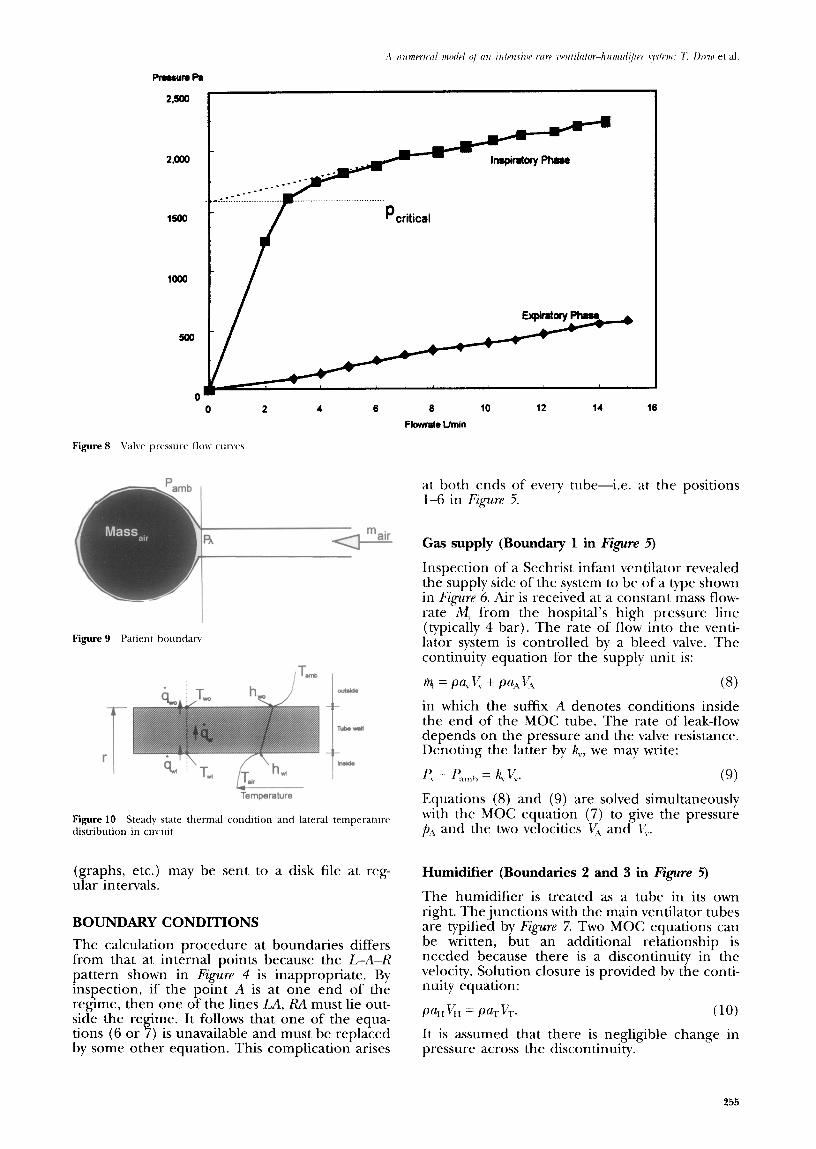
A simple lung model is used (Figure 9). The gauge pressure is assumed to be proportional to the con- tained mass of air, i.e.:
PA - Pamb = kng (Massair - Massair,initial). (14)
The mass itself is updated at each calculation time
based on the average flow-rate at the end of the endotracheal tube since the preceding time.
The lung is an extremely intricate structure which behaves in a complex, non-linear manner. Nevertheless, a simple idealization is appropriate in this instance because ventilators are designed to be relatively insensitive to lung characteristics. The validity of this assumption has been con- firmed in this particular instance by operating the system with ‘lungs’ ranging from a soft rubber bal- loon to a rigid container. These extreme flow con- ditions yielded broadly similar results for the pressure histories.
Thermodynamics
When the calculations begin, a series of regularly spaced particles is chosen in each tube. The paths followed by these particles are monitored and their temperatures and humidities are continu- ously updated. At any particular time, the pro- gram first calculates the pressures and velocities throughout the system as described above. It then calculates the corresponding temperatures and humidities.
The distance moved by a typical particle in one time interval, At, is estimated from its average velocity in that interval. The average is assumed to be the mean of the values at the ‘old’ and ‘new’ times and these are estimated by interpolation between adjacent grid points. When a particle leaves one end of a tube, a new particle is intro- duced at the other end.
Heat transfers
Figurn 10 depicts heat transfers through a tube wall. The driving temperature difference is T,i, - T arnh and there are three resistances, namely con-
256

Plug racorded at 1OUmin 1%.4W wlti 2=8.488 uolts 3=8.486 uolts Vdiu) tsu~=7.%7 Ret mintw24El
End of Pile - B:828BlB4B.PRW bane 8 l-l Snapshot Storage Scope (TM>
Plug modelled at 1OUmin - l=fl.4fKl uotts 2=9.488 volts 3=8.488 ualts (/diu) tuup=7.%7 Set points=248
Replay &mu Active File: B:WLID.PRN Frame tl l-l Snapshot Storage Scope (ItI)
--
I
Pressure
--
Pressure
vective heat transfers at the inner and outer inter- faces and conduction through the wall itself. The relevant equations are:
inner: II= &, ( Y:,l, - ‘Ii,,) (15)
wall: q= A, ( 7;,,i - ,I;,,,) (16)
outer: ij= h, ,,,, (Y;,.,, - T/I ,,,, I,) (17)
where hi and h,, are convective heat transfer coed- ficients and A, is the thermal conductivity of the wall material. When all of these are known, equa- tions (15)-( 18) can be combined to give a single relationship between the rate of heat transfer Q and the temperature difference &,. - T,,,,,,.
The convection processes at the inner and outer surfaces are different. At the internal inter- face, a forced convection relationshipX is used, namely Eckert:
(18) At the outer surface, a free convection relation- ship is used”, namely Holman:
I (19)
where 1, denotes the length of the tube. Roth of these expressions are empirical. The former is appropriate when the heat flux is uniform along the tube. It has been confirmed experimentally that this is a reasonable approximation in the pre- sent application; it is much more representative
257
A numa’cal model of an intensive caw ventilator-humidifier system: 7: llrew et al.
Rubber glove recorded at 1 OUmin _ .._.... . . . l=B.lBB uoltr Z=fj;l~"<a: &.lEM volts i/diu)"' tsup=7.967 Sac mints=240
Replay Nmlu Actiw File: B:8288185D.PRN Frame II l-l Snapshot Storage Scope (TN3
--
I
Pressure
Time
Rubber glove rnodelled at 1 OUmin i=Cl.lfHi uolts ZEi.188 volts 3=El.lElEl uolts Vdiu) tsup=7.%? Set points=248
Replay knu Actiw File: B:WLID.PRN Frame t l-l Snapshot Storage Scope (TIl)
-
1 Pressure
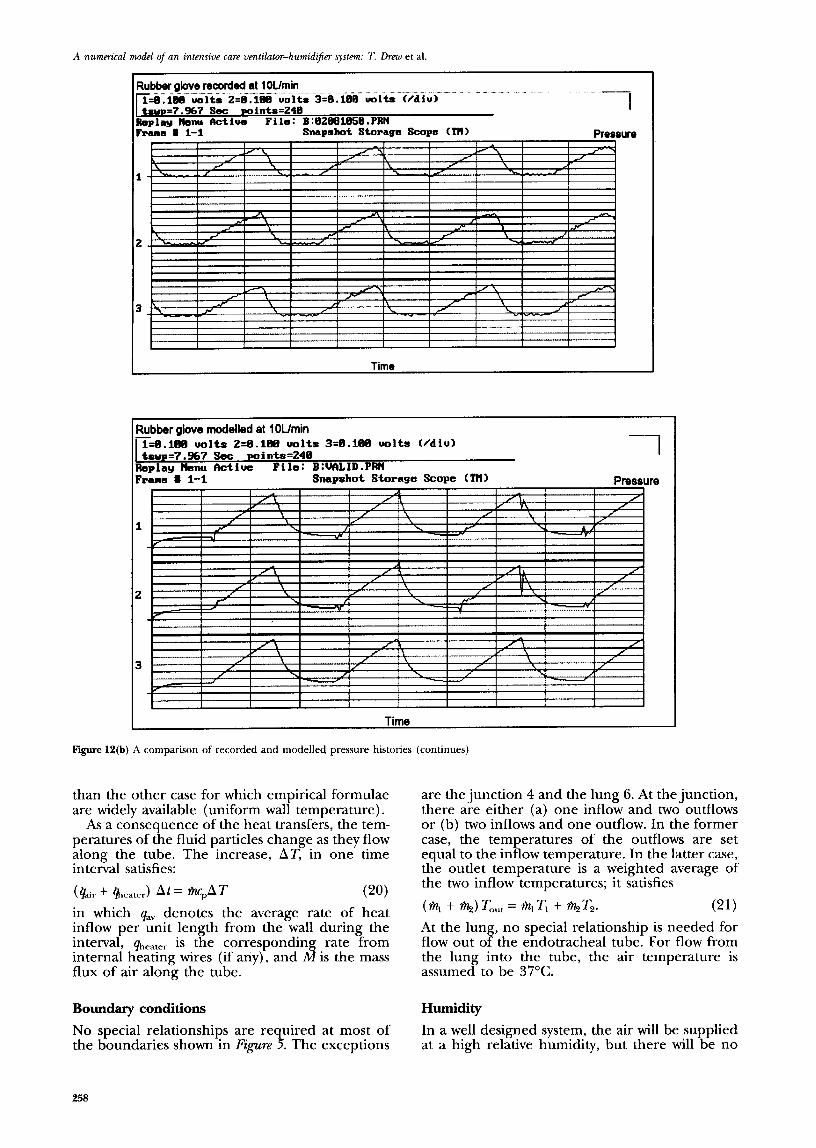
Figure 12(b) A comparison of recorded and modelled pressure histories (continues)
than the other case for which empirical formulae are widely available (uniform wall temperature).
As a consequence of the heat transfers, the tem- peratures of the fluid particles change as they flow along the tube. The increase, AT, in one time interval satisfies:
(&ir + heater) At = *PAT rw
in which qav denotes the average rate of heat inflow per unit length from the wall during the interval, qheater is the correspondin
A5 rate from
internal heating wires (if any), and is the mass flux of air along the tube.
Boundary conditions HlUllidity
No special relationships are required at most of the boundaries shown in Figure 5. The exceptions
In a well designed system, the air will be supplied at a high relative humidity, but there will be no
are the junction 4 and the lung 6. At the junction, there are either (a) one inflow and two outflows or (b) two inflows and one outflow. In the former case, the temperatures of the outflows are set equal to the inflow temperature. In the latter case, the outlet temperature is a weighted average of the two inflow temperatures; it satisfies
(% + a) Tout = % TI + %tTz. (21) At the lung, no special relationship is needed for flow out of the endotracheal tube. For flow from the lung into the tube, the air temperature is assumed to be 37°C.
258
Figul 12(c)
-- uoltr Vdiu)
I
SnapAot Stopage Scope (TN> Pressure
Condom recorded at Wmin =&.288 uoltr Z=ff..ZMi uolts 3=8.288 volts C/diu) -1
tw=7.%7 Set wintrr=248 Replay Nenu fktiua File: B:BZBBlB59.PRN Frame # l-l Snapshot Storage Scope (TN)
I
Pressure
condensation in any tube. The absence of conden- sation in the supply tubes is a fLmdamenta1 requirement because its presence prevents adequate control.
The sp~ciJ(. humidity of an individual air particle does not change as it travels along a simple tube. Changes are possible only (a) at the humidifier, (b) at junction 4 in Figure 5 and (c) in the lung. The latter two cases are treated in the same wa! as temperatures in the same locations. Air leaving the lung is assumed to have a relative humidit): of lOO%, which, at 37”C, corresponds to a specific humidity of 44 mg/l.
The humidifier is treated in a similar manner to the lung. That is, the temperature and humidity at outlet are stipulated, the particular values being determined b) direct measurement. In the absence of such measurements, appropriate
values could be obtained from manufacturer’s literature.
Relative humidity
Althou.gh the analysis is logically based on specific humidity, z~se~s are primarily interested in relative humidity. At the end of each calculation time step, therefore, the program uses the predicted temperatures and specific humidities to deduce the relative humidities at every grid point. When values in excess of 100% occur, condensation will result, and the subsequent predictions will be false. However, no action is taken by the program except to display a warning message. There is no need to model the effects of condensation because this is an unacceptable operating con- dition.
259

A numm’ral model of an intensive care vatilatw-humidifier system: 7: Drew et al.
Temperature C
*
Tempemtum C
Air flow tempemture Outer wall
tMllpW3tUfe
0 0.25 0.0 0.70 1 n ” >I “I ” II ’ Rebtttn dktanrn IllrvKl hsnkmtm tclhn fblattue distance akm hsptatow tube
Taweratum C
YxmQmootrawnc
I
0 0.0 f Rebtke dbtmx abng hspiratory tube
mH
l m..ti
x
Temperature C 40
x x l
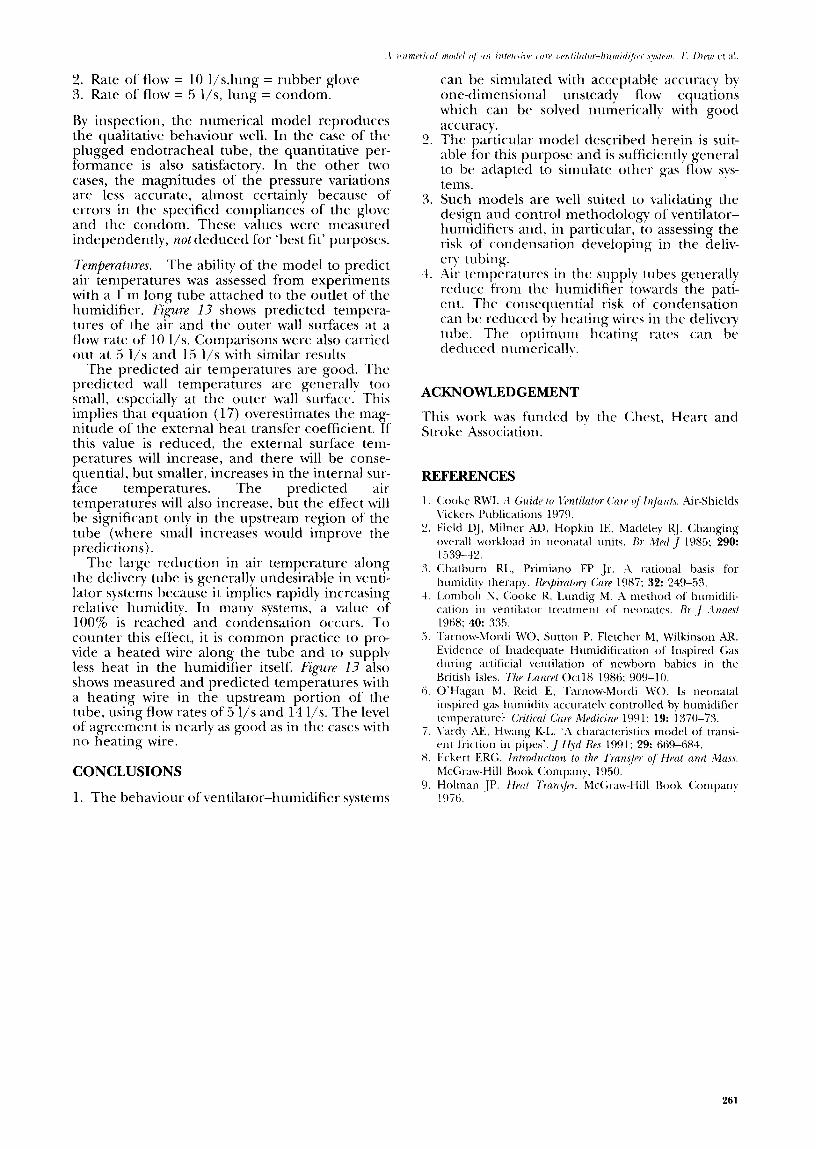
Figure 13 A comparison of recorded and modelled air temperatures in unheated and heated tube
PROGRAM VALIDATION Numerical experiments
The program is written and compiled in Microsoft Fortran 5.1 and is run on a 486 DX2/66 MHz PC. Simple examples run in less than a minute; more complex cases have taken as much as an hour. The required time is directly proportional to the length of real time simulated. It is also strongly dependent on the required detail, i.e. the spacing between adjacent grid points. This dependence is strong because the time intervals between success- ive calculations are directly proportional to the grid length. That is, fine detail in space is neces- sarily accompanied by fine detail in time.
The primary method of validating the program is by direct comparisons with experimental data. In principle, however, there are two stages to the process, namely confirmation that:
F@~re II shows numerical predictions with 5, 9 and 13 grid points in a 1 m long tube. The upstream air temperature is prescribed, and the temperature distribution along the tube is deduced for a case where the ambient air tem- perature is 34°C. The internal air temperature approaches this value rapidly, thereby showing that most of the heat transfer occurs in the upstream portion of the tube. All three predic- tions show an outlet temperature of about 34°C; the two with finer grid lengths are sufficiently similar throughout the tube to justifjr confidence in the predictions with 13 grid points.
1. The analytical model is a satisfactory represen- tation of the physical phenomenon; and
2. The numerical algorithms yield valid solutions of the analytical expressions.
Physical experiments
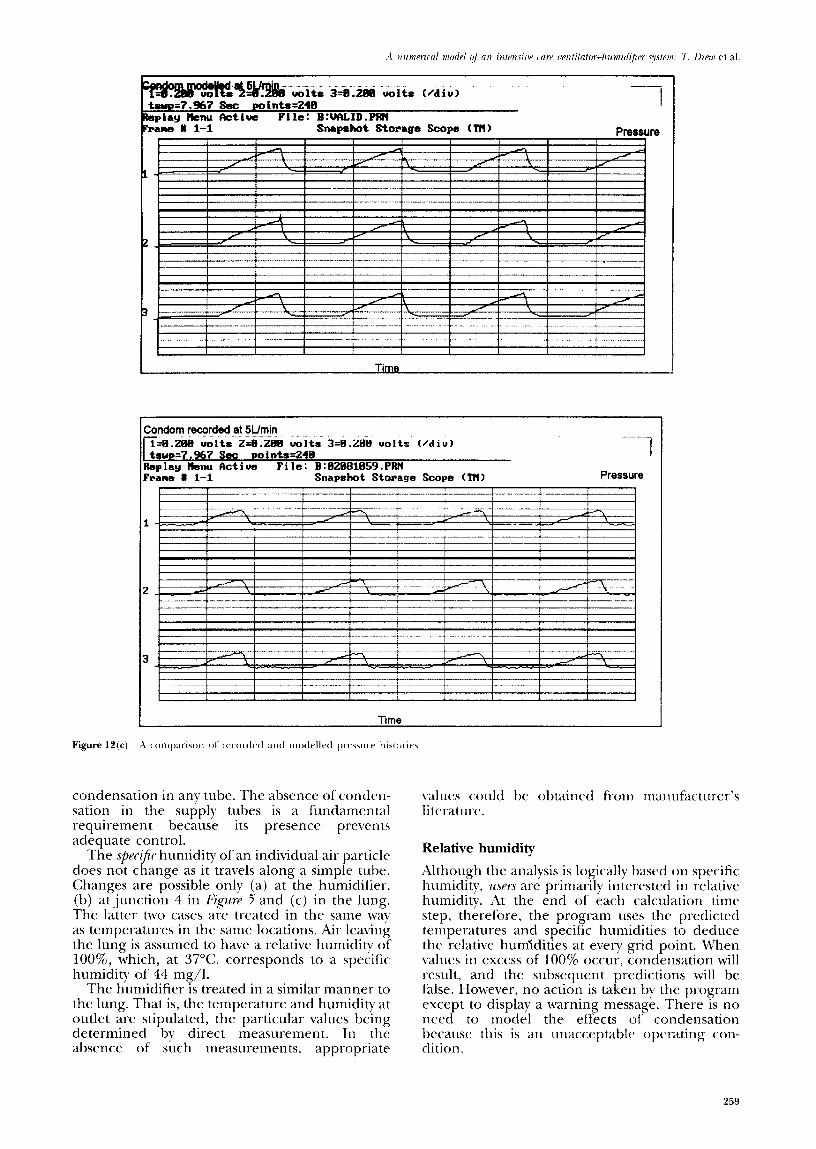
Pressures. Having determined a suitable grid size, the next stage is to compare the computed predic- tions with experimental measurements. Figures 12a, b, c show comparisons of measurements (upper graphs) with predictions (lower graphs) for three cases, namely:
We address the second of these first. 1. Rate of flow = 10 l/s,lung = plugged
2. Rate of flow = 10 l/s,lung = rubber glove 3. Rate of flow = 5 I/s, lung = condom.
By inspection, the numerical model reproduces the qualitative behaviour well. In the case of the plugged endotracheal tube, the quantitative per- formance is also satisfactory. In the other two cases, the magnitudes of the pressure variations are less accurate, almost certainly because of errors in the specified compliances of the glove and the condom. These values were measured independently, not deduced for ‘best fit’ purposes.
Tumperatuws. The ability of the model to predict air temperatures was assessed from experiments with a 1 m long tube attached to the outlet of the humidifier. F@LW 13 shows predicted tempera- tures of the air and the outer wall surfaces at a flow rate of 10 l/s. Comparisons were also carried out at 5 l/s and 15 l/s with similar results
The predicted air temperatures are good. The predicted wall temperatures are generally too small, especially at the outer wall surface. This implies that equation (17) overestimates the mag- nitude of the external heat transfer coefficient. If this value is reduced, the external surface tem- peratures will increase, and there will be conse- quential, but smaller, increases in the internal sur- face temperatures. The predicted air temperatures will also increase, but the effect will be significant only in the upstream region of the tube (where small increases would improve the predictions).
The large reduction in air temperature along the delivery tube is generally undesirable in ventl- lator systems because it implies rapidly increasing relative humidity. In many systems, a value of 100% is reached and condensation occurs. To counter this effect, it is common practice to pro- vide a heated wire along the tube and to suppl) less heat in the humidifier itself. F&-uw 13 also shows measured and predicted temperatures with a heatiilg wire in the upstream portion of the tube, using flow rates of 5 l/s and 14 l/s. The level of agreement is nearly as good as in the cases with no heating wire.
CONCLUSIONS
1. The behaviour of ventilator-humidifier systems
9 6.
s I .
4.
can be simulated with acceptable accuracy by one-dimensional unstead) flow equations which can be solved numerically with good accurdcy. The particular model described herein is suit- able for this purpose and is sufficiently general to be adapted to simulate other gas flow sys- tems. Such models are well suited to validating the design and control methodoloCgy of ventllator- humidifiers and, in particular, to assessing the risk of condensation developing in the deliv- ery tubing. Air temperatures in the supply tubes generally reduce from the humidifier towards the pati- ent. The consequential risk of condensation can be reduced by heating wires in the deliver) tube. The optimum heat.ing rates can be deduced numericallv.
ACKNOWLEDGEMENT
This work was funded by the Chest, Heart and Stroke Association.
REFERENCES
(&kc RW’I. .-i Guirlu to Ibnli&or C,‘nru uf Irzju~//.\. Air-Shields \‘ickcrs Publications 1979. Field QJ, Milner AD, Hopkin IE. Madeley RJ. Changing overall workload in neonatal units. Kr :Llrtl,/ 1985: 290: 153942. Chatburn RI+ Primiano FP Jr. A rational basis for humidity therapy. l&@,n/ory Cnrr 1987; 32: 249-53. I.omholt N, Cooke R, Lundig M. A method of humidifi- cation in ventilator treatmrnt of fwonat~s. Rr ,I .-tnn& 1968; 40: 3.35. Tarnow-Mordi WO, Sutton P, Fletcher- M, Wilkinson AR. Evidence of Inadequate Humidification of Inspired Gas during artificial ventilation of newborn babies in the British Isles. Thr Lnnr~t Oct18 1986: 909-10. O’Hagan bl. Reid E, Tarnow-Mordi WO. Is neonatal inspired gas htunidit) accuratelv controlled by humidifier trmperaturr? Cri/icnl Car-~ Md&r 199 1: 19: 1370-73. \‘ardv AE. Hwang K-L.. ‘A characteristics model of transi- rnt friction in pipes’. / Hid Rr.7 1991; 29: 669-684. Eckert ERG. Introriucl&~ >o thr Trm~/n of Ffrnl nmd A4a.c.c. McGraw-Iii11 Book Company, 1950. Holman JP. Ifd TrmmJm M&t-ax\-Hill Book <:ompanl 1976.
261
Related Documents


