A Novel Technique for using Polymers as Optical Interconnects and Sensors for Biological Recognition by SEEMA DEEPAK YARDI DEPARTMENT OF ELECTRONICS AND COMMUNICATION ENGINEERING Submitted in fulfilment of the requirements of the degree of DOCTOR OF PHILOSOPHY to the MALAVIYA NATIONAL INSTITUTE OF TECHNOLOGY JAIPUR, INDIA August 2016

Welcome message from author
This document is posted to help you gain knowledge. Please leave a comment to let me know what you think about it! Share it to your friends and learn new things together.
Transcript

A Novel Technique for using Polymers as Optical Interconnects and Sensors for
Biological Recognition
by SEEMA DEEPAK YARDI
DEPARTMENT OF ELECTRONICS AND COMMUNICATION ENGINEERING
Submitted in fulfilment of the requirements
of the degree of
DOCTOR OF PHILOSOPHY to the
MALAVIYA NATIONAL INSTITUTE OF
TECHNOLOGY JAIPUR, INDIA
August 2016

Dedicated in the name of Lord Shriganeshji,
to my father Late Prof. G. S. Pandit
& my mother Smt. Asha G. Pandit …

ii
Acknowledgement
I wish to thank AICTE, Department of Technical Education [M.S.],
Principals of Government Polytechnic, Mumbai and Aurangabad, Shri. D.P. Nathe
and Dr. Prashant Pattalwar for giving me this opportunity to pursue Ph.D. under QIP
(Poly) Scheme.
I sincerely thank authorities of both MNIT, Jaipur and IIT, Kanpur for
allowing me to work in their various laboratories and facilities. I thank my thesis
supervisor Dr. D. Boolchandani Sir for his consistent, all encompassing and
unconditional support in all the research related activities. His understanding,
encouraging and positive approach towards my work has enabled me to complete
this journey. I wish to express my deep sense of gratitude for always providing a
guiding light to me.
My joint supervisor, Dr. Shantanu Bhattacharya Sir, is the force behind
fabricating and shaping my research objectives into a novel implemented method of
optical sensing. His constructive and disciplinary instructions, criticism has oriented
my way of thinking Suitable for research methodologies. I am extremely thankful
for his uncompromising, unbiased and relentless support, participation in achieving
my research goals and always wish to remain in his debt for giving this opportunity
of lifetime to work under his guidance, in this esteem Institute.
I wish to express my deep sense of gratitude towards all the Staff members
of ECE department of MNIT Jaipur Dr. Vineet Sahula, Dr. Mohammad Salim,
Dr. Vijay Janyani, Dr. M.M. Sharma, Dr. K.K.Sharma, Dr. Perisamy, Dr. Samar
Ansari. I wish to thank Dr. A.B. Gupta Sir for his timely support.
My colleagues from ECE, MNIT, Nikhil Gupta, Sanjeev Methya, Janrao sir,
Amit, Priti, Jyoti Dr. Lokesh, Dr. Renu, Arun have helped me during my initial days
at MNIT, I wish to acknowledge their help. I wish to thank my colleagues from
Microsystems lab, IIT Kanpur, specially Dr.Ankur Gupta, Monalisha Nayak,
Deepak Singh, Rajeev Kumar Singh, Rishi Kant for co-operating me during the

iii
initial training in various aspects of Microfabrication. They have made life on
campuses of MNIT Jaipur and IIT Kanpur memorable and enriched.
I also wish to thank Virendra Singh, 4i lab, for all the laser machine related
work and ever supportive, co-operative approach towards my work.
I wish to sincerely thank reviewers of this work Dr. Venumadhav Korepally,
North Illinois University, Dr. Ramesh Singh, IIT, Mumbai and Dr. Ashish K. Sen
for giving in-depth and detailed review, which turned this work into a better,
specific and more concise endeavor. I must also thank Officers of Sterlite
technologies Ltd., Aurangabad for providing me with the optical fibers sufficient for
many more such experiments.
I must mention all my friends, those on social networks for keeping me
updated and connected.
I am grateful to my (Late) parents-in-laws Shri Diwakar and Shrimati
Anuradha Yardi, my father Late Prof. G.S. Pandit, my mother Shrimati Asha Pandit
and family for their faith and pride in my work, their compromises, care, strong
support and broadmindedness.
My sons Dhruv, Saleel, daughter-in-law Pooja, grandson Hriyaan are my
booster angels, their uncomplicated love and encouragement has shown me the way.
I wish to acknowledge the love, support and a welcoming place provided by my
uncle Late Dr. Prof. G.S. Pandit and his family in Jaipur. I can never thank, my
husband Deepak, enough, for always being a strong support system, to support me
with love and patience, while cruising through thicks and thins of life.
Seema Deepak Yardi

iv
Abstract
Amongst various techniques of bio-sensing, such as impedance based,
electrochemical, surface based, mass based, optical sensing of analytes [DNA,
Bacteria, viruses] from sample solutions based; optical sensing is found to be most
accurate, operating in full UV-VIS-IR range and clean method of sensing. It is
important that the sensing surface can be modified, if required to suite the sensing
conditions of analytes. The optical signals emitted after the interaction between
analytes and reagents are very weak and need tobe transmitted to the signal
processing system with signal conditioner circuits in between. As the sizes of the
analytes, diagnostic micro-chips is shrinking, the accessibility of signal on chip to
the outer world is becoming a difficult problem due to the standard sizes of SMP
connectors. The alignment of patterned optical signal carrying waveguides with the
fiber connectors in all three directions is an important point of consideration, where
the loss in signal is inversely proportional to the square of the distance between the
two waveguides. Optical fibers are most commonly used waveguides for carrying
signals into and out of the chip in Lab-on –chip applications and communication
applications. The connections of fibers at specific locations on the microchips, is a
crucial task. It is definitely one of the important reasons, why the growth of
diagnostic chips, optically sensitive microchips is not as it was predicted to be. It is
in this regard, the bonding of fibers to patterned waveguides on chip and fiber to
fiber bonding was undertaken as a research objective. Besides bonding of fibers,
sensing strategy is also required to be incorporated in the scheme. Initial study had
shown coupling through chain of dielectric microsphere, which was a less efficient
method, ring resonator coupling, microsphere grating and rib waveguide coupling,
fiber to waveguide coupling with a tapered fiber. Each of these methods required
extensive processing, alignment adjustments.
The study undertaken describes use of low power laser machine for bonding
fiber to the substrate and a waveguide/ another fiber. Apart from micro- structure
fabrication, ablation, lithography etc., lasers find a lot of utility in various areas like
precision joining, device fabrication, local heat delivery for surface texturing and
local change of microstructure so on and so forth. It is pertinent to mention that the

v
significance of Laser processing comes owing to the small spot size and fine
manoeuvrability of laser beam on various complex topologies at various length
scales. This makes such processing widely applicable to the fabrication of
standalone optical micro-devices like microspheres, micro-prisms, micro-scale ring
resonators, optical switches etc. There is a wide utility of such systems in chemical/
biochemical diagnostics and also communications where the standalone optical
devices are heavily employed although printed and patterned structures are not well
explored. One of the reasons why chip based printed optical waveguides are less
frequently used is the issue of joining such structures with standalone single or
multimode optical fibres which otherwise form a concrete basis of the bulk
transmissibility of signals in opto-electronic platforms. Diagnostics can become very
easy if chip based structures are explored more in comparison to standalone optical
components, owing to their high sensitivity and low volume of analytes.
In this study we have developed a strategy of joining of standalone optical
fibres to each other and microchip based printed optics (developed on SU8 (M/S
Microchem) through lithography) using a SU8 microdrop. The materials explored
for the microdrop, required to be essentially bio-materials, having good optical
properties, higher refractive index, patternable with good weldability. SU8, a
transparent, negative photoresist material came up as the best material for the job. A
thin film of a SU8 material formulating an extended waveguide contact has been
utilized for bonding with optical fibres by precise heat delivery of a CO2 lasing
system. The laser heat transmitted is used to form a strong bond between the
patterned thin film and the optical fibre, with a small SU8 micro-droplet. A similar
strategy has been used by joining two optical fibers on a hard substrate [Silicon
wafer / Glass] by using a SU8 micro-droplet. Optimization of various dimensional
parameters of the bonded assembly has been achieved as a function of laser power,
speed, cycle control, spot size so on so forth. The optimization is performed with
Design of experiments (DOE) in which Response surface methodology (RSM)
based on central composite design (CCD) has been used to evaluate the
experimental parameters for the lasing system. Finite element heat transfer model is
utilized for finding out the temperature distribution at the joint, the fibre end and the
SU8 structure end and further optimization is performed by localizing the heating
vi
zone to the joint area. Exclusive optical [RF] modelling has been performed to
estimate the transmissibility of the optical fibers bonded to each other on a surface
with SU8 and a similar analysis is done for the free standing waveguides patterned
in SU8. Our studies indicate the formation of a Whispering gallery modes [WGM]
across the micro-droplet leading to very high transmissibility of the signal. It also
shows heavy dependence of the temperature scale on the joint thickness. Finite
element software and photonic software are used to understand and control the
WGM effect on coupling, output signal & transmission of the signal. Through this
work we have thus been able to develop a method for fiber stitching to each other
and also to printed optical structures in microchips with smaller confinement,
reduced power and lesser time for formulating these joints. The study shows
impending advantages of such coupling through microdrop, viz. a) aligned and
misaligned separation can provide good coupling between two waveguides; which is
not the case in other methods of coupling, where alignment in elevation, lateral,
spatial is most important for controlling losses in transmission. b) The laser treated
bond provides a strong bond instantly like a tagged or stitched pair of waveguides.
c) The lasing action does not affect surrounding microstructures on the microchip. d)
The SU8 microdrop can be functionalized, micromachined and processed to suite
the bio –sensing / coupling requirements. GFP, BSA protein antigen –antibody
binding is sensed, characterized and analysed with this coupler- sensor. Signal
sensing and coupling are two important aspects of a system, be it electrical, optical
or mechanical control signal. If both these functions are carried out effectively and
efficiently by a single component, then it will be considered a multifunction unit.
This study describes successfully fabricated one such component called
Laser treated SU8 microdrop. It can be used as an optical signal coupler using
WGM effect. It can function as an optical signal sensor, sensing any activity or
coating on the functionalized SU8 surface. Interestingly in future study it can be
explored as a signal modulator, which modulates output signal with the type of
binding, immobilization on the microdrop surface. Construction of the spheres is a
real problem and involves Laser irradiation of fiber tip followed by chemical etching
which is very low yield process. Micro-spheres are not free from vibrations and as
the change of wavelength if in ‘pm’ level it can be very sensitive to thermal noise or
vii
any other noise. The whole body of the Micro-sphere which is around 100-150
microns in radius needs to be immersed in the analyte thus necessitating the analyte
volume to be high which is always very difficult to obtain. The solution that has
been developed through this work is as following:
• SU8 microdroplet on a silicon/ glass chip for coupling of standalone optical
fiber and fiber/ waveguide.
• Process of application of droplet on microchip is highly innovative and is
developed in laboratory.
• Extensive COMSOL Multiphysics simulations performed for investigating
the WGM phenomenon on chip.
• Further WGM used in silicon/ glass chips to study rapid GFP protein –G/
antibody binding kinetics.
The whole research work has involved interdisciplinary activities, some of
the activities are:
• Analysis of problem statement on coupling between optical fibers for high
transmission.
• Simulation of the problem using COMSOL Multi-physics and RSOFT
photonics platforms to arrive at a good estimate of the micro-droplet shape
which will be used for actual transmission of optical power.
• Exposure of the SU8 micro-droplet which is on glass / ceramic substrate to
CO2 Laser to provide Laser welding.
• Modeling and experimental realization of whispering gallery modes [WGM]
inside the spherical & elliptical micro-droplet with aligned and misaligned
optical fibers or waveguides.
• Analysis of absorptivity of SU8 and calculation of micro-volume of SU8
through optical imaging techniques.
• Carrying out Design of Experiment [DOE] for optimization of Laser
machine parameters for laser welding of SU8 Microdrolets.
• The SU8 microdrop bonded fiber-to-fiber coupling is extensively optimized ,
so that it can be used as a sensitive biosensor in sensing analytes in
proteolytic activity, BSA protein antigen immobilization, GFP, antigen –
antibody binding.
viii
• Design and development of an experimental test set-up for analysis of optical
transmittance.
Whispering gallery modes were recognized for the first time in 19th century
and described by Rayleigh for sound waves inside surface of St. Paul Cathedral
dome. This technology was extended to study of Resonances inside cavity
resonators: torroidal, disk, spheroidal, ring using light, based on the principle of
continuous total internal reflection. Light waves are confined to circular geometries
as the light after one roundtrip, returns at the same point, with same angle of
incidence and with the same phase, so that they interfere constructively with
themselves forming waves similar to standing waves inside these circular structures.
The smaller the size of the cavity the higher is the Q-factor, higher is the power
density. We have been able to stitch fibers using relatively large sized microdroplets
and been able to tag the micro-droplet with laser processing.
As the SU8 micro-droplet is top irradiated with laser, the heat transfer occurs
across the surface of the droplet through its bulk to the substrate (Si or Glass) along
a small polar region of the droplet. Depending on the heat transfer coefficient of the
substrate if the heat is not conducted away by the substrates it can result in more
localized heating although there is a chance of the droplet to totally melt and
develop splashes. In this process the heat also flows across the embedded fibers thus
melting and partially dissolving the fiber in SU8 so that on resolidification there is
strong adherence between the substrate surface and the fiber. The softening of the
optical fiber takes place at a temperature of 1600-1710 deg. C. DOE and number of
tests carried out on Si and glass substrate for laser based bonding lead to optimized
values of laser machine parameters. The strength of the fiber, weld after the laser
heat delivery and resolidification period, is qualitatively judged and is accordingly
categorized. Optical fibre softening can be reached on Si or glass surface by
controlling laser machine parameters.
Thermal direct bonding between the Silicon substrate and the optical fiber
(without using SU8) has also been attempted but the bond strength obtained was
poor due to an unnecessary spill over of the fiber melt and hence this option was
ruled out. The fiber softening temperature could be estimated to be in the higher
ix
range [1600-17100C] as compared to SU8 so that there is no degradation of the fiber
material or SU8. The machining parameters for Laser machining are optimized
using Design of Experiment [DOE].
The DOE performed has helped us to carry out systematic and planned
method of varying system parameters to get desired output conditions, out of a set of
samples. Response surface methodology (RSM) based on central composite design
(CCD) used to evaluate the experimental parameters for the lasing system. The
Software Design Expert 7.0, with analysis technique ANOVA is used for the
parametric optimization of all machining parameters. Both Simulation and
experimental results supported the WGM theory, in which the transmissibility of
aligned and misaligned fibers, at spatial, lateral separation of 650 µm and 700 µm
was [% Tr] > 60%. Transmissibility was checked with aligned and misaligned cases
of optical fibers using SU8 microdroplet technology and simulations performed
extensively were also validated through experimental data acquisition.
We have plans to apply this technology to the sensitive detection of
biological analytes. Figure 4 shows a schematic describing the analyte testing part
wherein the SU8 microdroplet was used to find out the binding kinetics between
antigen and antibodies. We have been able to see some very preliminary level
observations for changing the surface of SU8 into a biosurface which can adhere
well to BSA protein and also some micro-organisms.
In this work we have further initiated the ability of high intensity fluorescent
detection of micro- organisms using porous PDMS structures infiltrated with
Acridine Orange which may result in sensitive detection of biological agents.

x
Table of Contents
Certificate i
Acknowledgement ii
Abstract iv
List of Figures xiv
List of Tables & Graphs xviii
Chapter/ Section No.
Details Page No.
1 Introduction 1-6
1.1 Motivation 1
1.2 Aspects of the Optical Interconnect 2
1.3 Enhanced Coupling and Biosensing 2
1.4 Scope of our work 3
1.5 Future Scope 4
1.6 Organization of the Thesis 5
2 Software Simulation: Polymer Waveguide Coupling using Elliptical Microsleeve
7-20
2.1 Introduction 7
2.2 Whispering Gallery Mode [WGM]: Basic principle 8
2.3 Simulation using Photonic Software 11
2.4 Coupling Methods 12
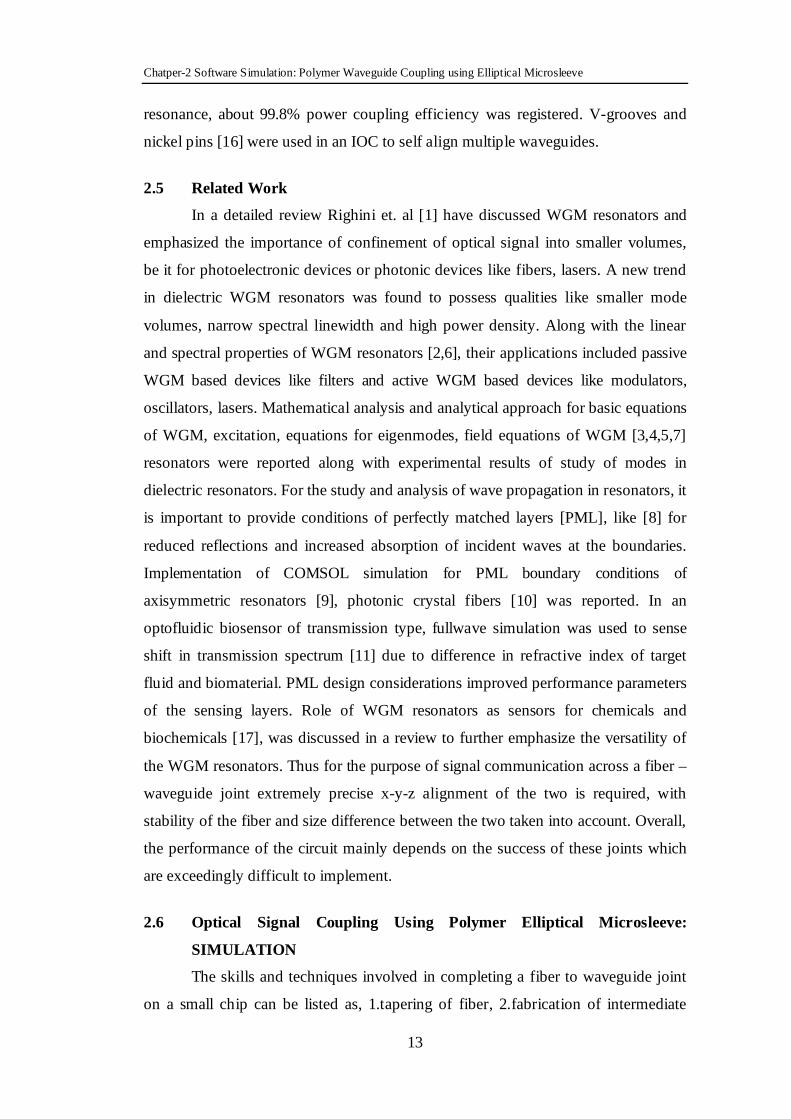
2.5 Related Work 13
2.6 Optical Signal Coupling Using Polymer Elliptical Microsleeve: SIMULATION
13
2.7 Result and Analysis 16
2.7.1 Simulation results 16
2.7.2 Calculations at WGM condition 16
2.7.3 Graphs of total energy profile over the spectrum 17
2.7.4 Graph of energy density time average value 17
2.8 Future Scope 19
2.9 Conclusion 19
Reference 19

xi
Chapter/ Section No.
Details Page No.
3 Laser Heat Transmission For High Efficiency Bonding Of Two Optical Fibers Using SU8 Microdroplet
21-64
3.1 Introduction 21
3.2 Lab-on-Chip 22
3.2.1 Merits of Miniaturization 24
3.2.2 Limitations of Miniaturization 24
3.3 Methods of Microfabrication 24
3.3.1 Laser Micromachining 24
3.3.2 Photolithography 25
3.3.3 Soft Lithography 25
3.4 Types of Optical Signal Coupling 26
3.4.1 Tapered signal coupler 27
3.4.2 Grating coupler 28
3.4.3 Optical Fiber Splicing 29
3.5 Epilog Laser machine 30
3.6 SU8 as bonding material 31
3.7 Design of Experiments [DOE] 32
3.8 COMSOL Simulation 32
3.8.1 Laser Heat transmission Coupling 33
3.8.2 Effect of Heating on Optical property 34
3.8.3 Whispering gallery mode [WGM ]based Optical signal coupling between two fibers
34
3.9 Measurement of optical properties –Spectra Suite Ocean Optics software
34
3.10 Related Work – Literature Survey 35
3.11 Laser Heat transmission Based Bonding of Optical Fibers Using SU8
37
3.11.1 Experimental procedures 38
3.11.1.1 SU8 microdrop dispensing on fibers set for bond formation 39
3.11.2 Laser heat treatment 40
3.11.3 COMSOL Simulation for modeling Laser heat transmission 41
3.11.4 COMSOL multiphysics simulation for modeling the whispering gallery mode WGM
43
xii
Chapter/ Section No.
Details Page No.
3.11.5 Fabrication of optical waveguides 44
3.11.6 Measurement of % Transmittance across the coupling 47
3.11.7 Measurement of absorptivity of SU8 48
3.11.8 Calculating the SU8 droplet Volume 49
3.12 Result and Analysis 50
3.12.1 Optimization of Machining Parameter 50
3.12.2 COMSOL simulations for Laser heat transfer 52
3.12.3 Calculating microvolume and absorptivity of SU8 microdroplet 54
3.12.4 Simulation of WGM using COMSOL modeling 55
3.12.5 Measurement of optical transmittance in a test set up 57
3.13 Future Scope 59
3.14 Conclusion 59
Reference 60
4 Interaction of Biomolecules with Solid Polymeric Surfaces of SU8 Microdroplet and Porous Fluorescent PDMS: Its Utility in Optical Bio-sensing
65-108
4.1 Introduction
A Polymer- SU8
B Polymer- Fluorescent PDMS
65
A Exploring use of Biocompatible photoresist SU8 material as a biosensor
4.2 Need to Study Interaction of Biomolecules on Solid Surfaces 68
4.3 Solid Polymeric Surface modification for Biomolecule Interaction
69
4.4 Surface Modification Techniques of Solid Polymeric Surfaces
72
4.5.1 Need to Explore Polymeric Sensors 74
4.5.2 Related Work 74
4.6 Steps involved in fabrication of an optical biosensor connector
76
4.6.1 SU8 Microdroplet used as WGM Resonating sensor 76
4.6.2 Fabrication of SU8 Microdroplet Sensors [Laser or UV] 78
4.6.3 Extraction of SU8 microdroplets from Substrate 79
4.6.4 Surface immobilization 80

xiii
Chapter/ Section No.
Details Page No.
4.6.5 Characterization of the Microdroplet Sensors 81
4.7 Some Elementary Results and Analysis a. Fabrication of SU8 microdroplets
b. SU8 Microdroplet dispensed using micropipette and syringe
c. Fabrication of fiber bonded SU8 microdroplet [CO2 Laser exposure]
d. Fabrication of fiber bonded SU8 microdroplet [UV exposure]
e. Extraction of SU8 microdroplets
f. Surface immobilization
81
B. Porous Polydimethyl Siloxane- Acridine Orange as Biomaterial
4.8 Introduction 86
4.9 Literature Survey 89
4.10 Porous PDMS- AO as a Biomaterial in Opto-Biosensing 91
4.10.1 Experimental Procedure 92
4.10.2 Instruments and tests 93
4.11 Result and Analysis
A. Physical Observation
B. SEM images
C. Ocean Optics SpectraSuite characterization
D. UV-VIS Spectrometer readings
E. NIKON Fluorescence Microscope Tests
93
4.12 Conclusion 97
4.13 Future Scope 97
Reference 98
List of Publications
Bio-Data
Appendix

xiv
List of Figures
Fig. No.
Details of Figure Page No.
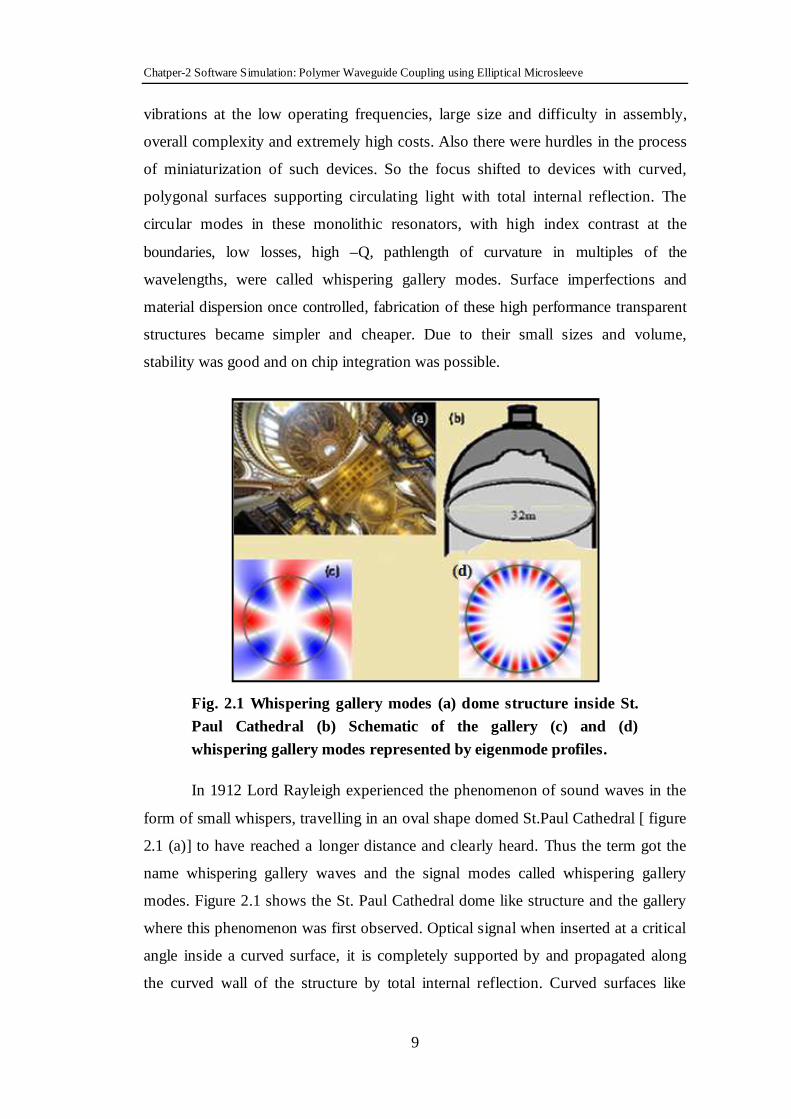
2.1 Whispering gallery modes (a) inside St. Paul Cathedral (b) Schematic of the gallery (c) and (d) whispering gallery modes represented by eigenmode profiles
9
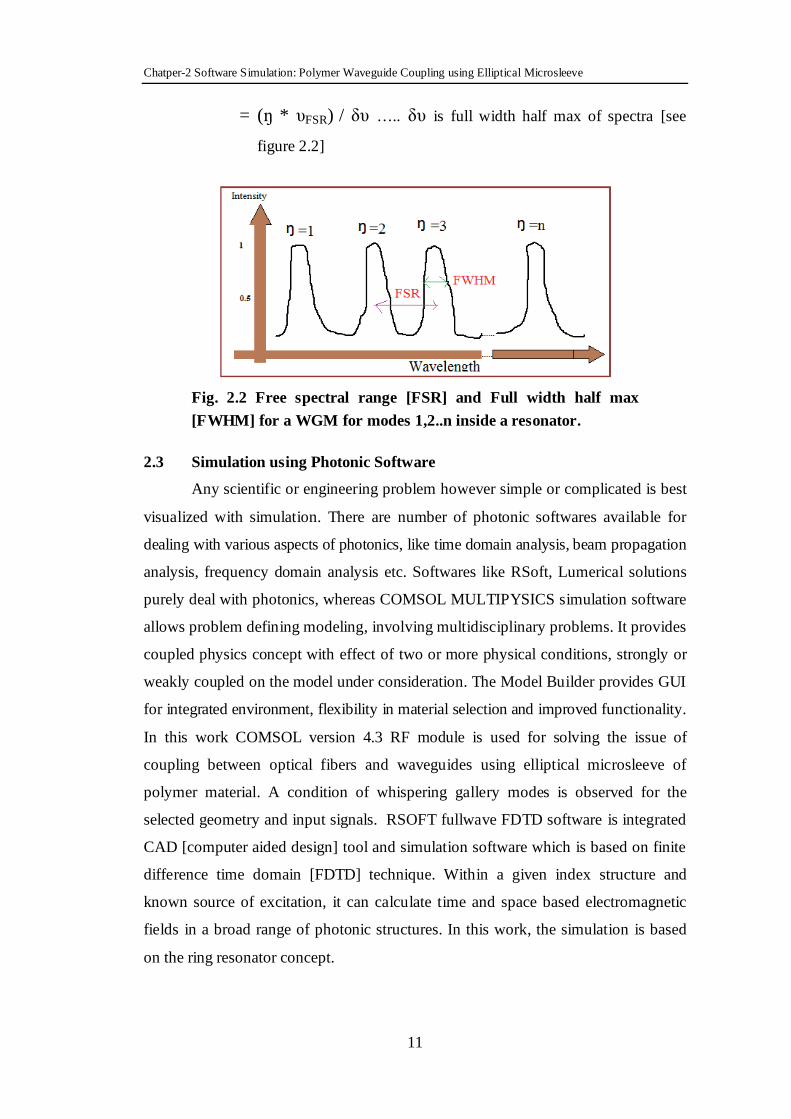
2.2 Free spectral range [FSR] and Full width half max [FWHM] for a WGM for modes 1,2..n inside a resonator
11
2.3 Schematic diagram of (a) Ring resonator (b)(c)(d) designs of elliptical microsleeve bond
14
2.4 Simulation of (a) optical ring resonator (b), (d) electric field and WGM inside two models of elliptical microsleeve (c) signal coupling and propagation
16
2.5 Signal coupling and WGM at wavelength (a)Large contrast : 2.6µm [115.25THz] with ( b) power graph (c) Small contrast : 515.15 nm [582THz]
18
2.6 Signal coupling and WGM at wavelength (a) 493nm [ 608THz] (b) 574.7nm [522THz] (c) 655nm [458 THz ] with Low Contrast.
18
3.1 Images of two categories of lab-on-chips.(a) microfluific chip [Lab-On-Chip] (b) Microfluidic system with multipurpose programmable controller chip.
23
3.2 Schematic diagrams of fiber coupling and causes of losses (a) Fibers with different Numerical apertures (b) Core concentricity (c) Core diameter mismatch (D1>D2) (d) Linear gap between two fibers/ waveguides.
27
3.3 Techniques used to minimise coupling losses (a) schematic diagram of a tapered coupler used to couple optical signal from fiber to SOI (b) SEM image showing coupler stack layers with parabolic index profile (c)SOI waveguide and mode converter cross section
28
3.4 Coupling between optical fiber and SOI waveguide (a) schematic of waveguide diffractive grating coupler (b) SEM image of varied coupling strength grating coupler
29
3.5 Various optical fiber-to-fiber splicing techniques (a) (b) (c) Schematic diagram of Arc fusion of two optical fibers (d) Mechanical-fiber-to-fiber splice.
30

xv
Fig. No.
Details of Figure Page No.
3.6 Schematic diagram of test setup for measurement of % optical signal transmittance
35
3.7 Fibers set, aligned, spaced before and after mocrodroplet dispensing (a) Before dispensing of microdroplet at the circle position on the misaligned fibers (b) Before dispensing of microdroplet at the circle position on the aligned fibers (c) After dispensing of the microdroplet circling the fiber joint.
39
3.8 (a) a visible spot on fiber covered with SU8 droplet after laser heat transfers without optimization of machine parameters (b) a highly optimized laser heat transmission procedure for bonding two optical fibers with SU8 microdroplet
41
3.9 Simulation of laser heat transmission process for a moving laser exposing along a circular path on a 10 microns thick patterned SU8 layer.
43
3.10 Fiber bonding (a) the schematic diagram for coupling between two pairs of optical fibers using the SU8 microdrop along with a SU8-waveguide-fibers coupling, (b) shows various stages of optimization of laser machining with the optical micrographs of the laser tagged micro-droplet surfaces for the fiber/ fiber joints
45
(c) Volume Measurements of microdrop 49
3.11 The design of experiments [DOE] results indicating the transmission as output with speed and power as input parameters.
51
3.12 The simulation output of bulk temperature of SU8-2025 vs. time in sec of heat treatment
52
3.13 Simulated estimation of effective bi-refringence with respect to distance from the surface for Air/SU8/Si combination
54
3.14 Comparison of absorptivity of SU-8 over Si and glass substrates through experimental results
55
3.15 Simulation output of the aligned case with inter-fiber distance (a) 5.5µm (b) 4.8 micron.
56
3.16 Simulation results showing % Transmittance with respect to inter-fiber distance for (a) Aligned fiber and (b) Misaligned fiber cases
57
3.17 Acquired data through spectra suite software using ocean optics spectrophotometer for (a) Aligned fibers (b) Misaligned fibers
58
4.1 Side chains of the twenty different naturally occurring amino acid chains
70
4.2 Schematic of silanization reaction on polymer surfaces. 74
xvi
Fig. No.
Details of Figure Page No.
4.3 BSA coated microrobots with bioactuators [a] Extraction of selectively BSA coated microcubes [b] Bacteria attached to bottom uncoated side [c] Fluorescent microscope images of bacteria attached to uncoated, selectively BSA coated, BSA whole coated microcubes, [d] Comparison between three configurations on the basis of number of attached bacteria
76
4.4 Silica microsphere for isolating proteins (a) unconjugated silica micro-sphere (b) Protein A conjugated silica microsphere with bound mouse IgG. For visualization of bound biotinylated goat anti-mouse IgG, NeutrAvidinTM conjugated to silica nano-particles doped with FAM dye is used
76
4.5 (a) Micro-sphere developed on the tip of an optical fiber using low power Laser processing (b) Ninhydrin treated biomimetic SU8 microdroplet.
77
4.6 (a) Analyte sensing using SU8 microdroplet in a PDMS well (b) Challenging goal to get a perfect SU8 microsphere
78
4.7 Method of BSA immobilisation on microdroplet [with and without optical fiber] and its applications (a) Microdroplet dispensing (b) UV exposed microdroplets (c) BSA immobilised on microdroplet surfaces (d) Microdroplets detached from substrate with heat treatment and then subjected to stain & dye test
80
4.8 Silica microspheres using (a) and (b) gas flame, (c) CO2 Laser (Gold Thin film coated) (d) CO2 Laser
83
4.9 Microdroplets dispensed using micropipette 83
4.10 CO2 laser heat treated fiber bonded SU8 microdroplet 84
4.11 UV exposed fiber bonded SU8 microdroplet, Inset showing fiber gap of 11µm
84
4.12 SU8 microdroplets extracted from the substrate 85
4.13 UV functionalized bare SU8 microdroplets, selectively immobilized with BSA solution [A1,B1,C1] incubated with E-Coli cells [A2,B2,C2] observed under the microscope.
85
4.14 SU8 microdroplet sensing GFP tagged E-Coli cells (a) E-Coli cells under Microscope
86
4.15 Application areas, products of biomaterials. 87
xvii
Fig. No.
Details of Figure Page No.
4.16 Acridine orange interacting differentially amongst base pairs of double-stranded DNA [Green Fluorescence] and denatured DNA bases [Red Fluorescence].
90
4.17 Microstructures (a) and (c) Porous PDMS Acridine Orange (b) PDMS
93
4.18 SEM image of micropores in Porous PDMS/AO device surface 94
4.19 (a) and (b) SEM images of surfaces of PPA microstructures 95
4.20 Optical characteristics of PPA using [RED source] Spectra Suite optics test setup
95
4.21 UV-VIS spectrophotometer spectral characteristics of the PPA device 96
4.22 Photo image of PPA device administered with AO tagged DNA solution, taken with NIKON still camera.
96

xviii
List of Tables & Graphs
Tables & Graphs
No.
Details of Tables & Graphs Page No.
Table 2.1 Calculations at WGM condition 16
Graph 2.1 A
High contrast performance: Peak resonance at [153.75e12Hz], FSR = 0.55THz.
17
Graph 2.1 B
Total energy profile inside the SU8 microdroplet over the full visible spectrum [430 THz to 770 THz]
17
Graph 2.2 Energy Density Time Average value inside Elliptical microsleeve
18
Table 3.1 Properties of SU8 33
Table 3.2 Laser based bonding: % transmittance obtained with variation in speed and power of laser beam.
46

Chapter 1 Introduction
Chatper-1 Introduction
1
Chapter 1
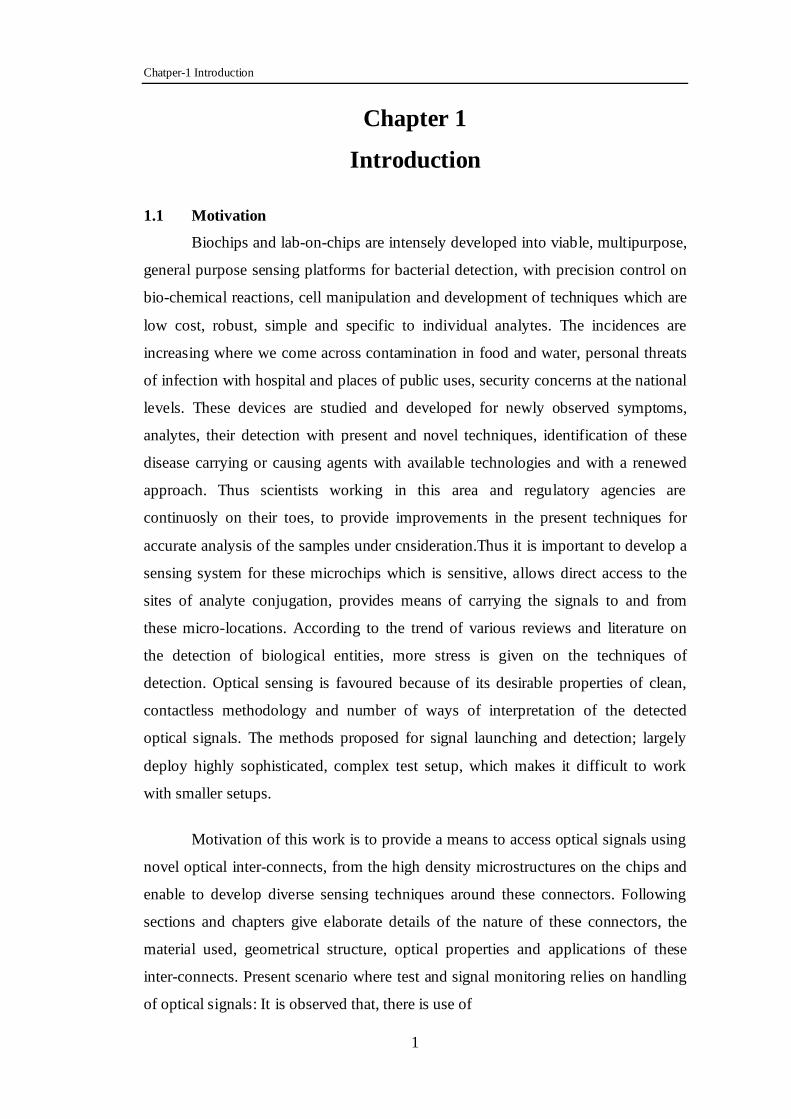
Introduction 1.1 Motivation
Biochips and lab-on-chips are intensely developed into viable, multipurpose,
general purpose sensing platforms for bacterial detection, with precision control on
bio-chemical reactions, cell manipulation and development of techniques which are
low cost, robust, simple and specific to individual analytes. The incidences are
increasing where we come across contamination in food and water, personal threats
of infection with hospital and places of public uses, security concerns at the national
levels. These devices are studied and developed for newly observed symptoms,
analytes, their detection with present and novel techniques, identification of these
disease carrying or causing agents with available technologies and with a renewed
approach. Thus scientists working in this area and regulatory agencies are
continuosly on their toes, to provide improvements in the present techniques for
accurate analysis of the samples under cnsideration.Thus it is important to develop a
sensing system for these microchips which is sensitive, allows direct access to the
sites of analyte conjugation, provides means of carrying the signals to and from
these micro-locations. According to the trend of various reviews and literature on
the detection of biological entities, more stress is given on the techniques of
detection. Optical sensing is favoured because of its desirable properties of clean,
contactless methodology and number of ways of interpretation of the detected
optical signals. The methods proposed for signal launching and detection; largely
deploy highly sophisticated, complex test setup, which makes it difficult to work
with smaller setups.
Motivation of this work is to provide a means to access optical signals using
novel optical inter-connects, from the high density microstructures on the chips and
enable to develop diverse sensing techniques around these connectors. Following
sections and chapters give elaborate details of the nature of these connectors, the
material used, geometrical structure, optical properties and applications of these
inter-connects. Present scenario where test and signal monitoring relies on handling
of optical signals: It is observed that, there is use of

Chatper-1 Introduction
2
1. SMF /MMF connectors: standard in their sizes.
2. Microscopy.
3. Standalone optical micro devices like optical switches, microspheres, ring
resonators, microprisms.
4. Increasing number of parallel /array like high density connections, port lines:
With micro-dimensions & circuit complexity.
5. Multilevel PCBs, microchip designs, optical network connections.
6. Precision fabrication steps and high precision alignment set ups.
It indicates that to make the optical signal measurement or sensing suitable
for small and medium system users, there is need of:
1. Smaller fibre connectors, having lesser number of precision parts, reduced
manufacturing cost and a new range of potential applications.
2. Simpler, low cost fabrication steps and alignment requirements.
3. Smaller size, reliability of bond and lower losses.
4. Connectors having Biosensing feature with surface modification /
functionalization possibility.
1.2 Aspects of the Optical Interconnect
1. The interconnect must provide connection between on-chip and off-chip
optical waveguides, between two waveguides.
2. The optical interconnect must be essentially low cost, simple and robust.
3. Along with signal coupling, signal sensing feature must be incorporated.
4. The material used for such interconnects must be biocompatible and possess
excellent optical properties
5. The material can be functionalized to suite immobilization of biological
analytes.
6. Provide signal amplification to specific range of optical wavelengths.
1.3 Enhanced Coupling and Biosensing
A sensor, transducer signal in a system is generally weak and need boosting,
particularly when it is the biological signal which is being sensed. The optical
interconnect will be highly beneficial if it can selectively enhance the microsignal.
Signal coupling is another issue, which takes lot of time, alignments and adjustments
Chatper-1 Introduction
3
to transmit signal with minimum losses across the joint. The proposed interconnect
will be extremely valuable if it can help reduce the task of waveguide alignment to
some extent and still grant enhanced coupling.
1.4 Scope of our Work In a typical laboratory environment, where tests and signal monitoring relies
on handling of optical signals; use of SMF /MMF connectors, Microscopy or
standalone optical micro devices like optical switches, microspheres, ring
resonators, microprisms; is most commonly observed. SMF/ MMF connectors are
standard in their sizes and most suitable, where frequent connections and
disconnections are needed and the dimensions of the work platform housing all
optical circuits or networks, is not an important consideration. With the advent of
technology, the scaling down feature is observed in almost every field. The circuit
sizes are decreasing and the complexity of the circuits leads to increasing number of
parallel /array like high density connections, port lines, making the signal handling
even more critical. In case of multilevel PCBs, microchip designs, optical network
connections, the size of connectors is a crucial design consideration. It is important
for such connectors to have low cost, low losses and ease of operation. Optical fiber
outer diameter is 125µm whereas the standard ferrule size for fiber connectors varies
between 1.25mm to 12.5mm. Therefore smaller fiber connectors, having lesser
number of precision parts, may lead to reduced manufacturing cost and provide with
a new range of potential applications.
Splicing is another method of joining two fibers, where the fibers can be just
held together [mechanical splice] or permanently joined [fusion splice] using heat.
Heat is provided by electric arcs, gas flames or CO2 Lasers. Size of mechanical
splice is large and fusion splice needs protector tube for the bare fiber joint. Both
types of splicing mechanisms use precision alignment of fibers in X-Y-Z plane.
Another area where the signal coupling becomes difficult, is coupling optical
fiber to on chip waveguides of smaller feature size. To address these issues number
of signal coupling methods including use of prisms, fiber gratings, vertical taper
structures, microspheres with tapered fibers are considered. All these methods need
additional precision fabrication steps or high precision alignment set ups.
Chatper-1 Introduction
4
In our work we have conceptualized a simple method of coupling two
waveguides [spaced and aligned suitably], using SU8 microdroplet; strengthening
the bond using localized precision heat transmission using CO2 laser. Further the
microdroplet is used to sense biochemical activities occurring in the evanescent field
zone of its functionalized surface. Thus this coupling method is a permanent
coupling method, with number of advantages like stability of bond, reliability of
connection, low cost, smallest size [droplet size of diameter 200µm], possibility of
connections of multiple fiber and fiber arrays in high density applications, lower
losses, less overheads of precision alignment, detachable fiber bonded assembly for
flexibility of operation, ease of installation, potential use in number of biosensing
applications with proper surface modification so on and so forth.
To outline the Specific objectives of this work:
1. To develop a means for high efficiency optical coupling between optical
fibers and printed waveguides for effective transmission of optical signals.
2. To provide means to access optical signals using novel optical inter-
connects, from the high density chip based optics.
3. To explore alternate polymer materials for both interconnect and sensing.
4. To explore the development of small forces sensing from biological systems
and biodiagnostics. (This is more a material exploration with ideas for future
directions).
1.5 Future Scope
1. To use elliptical microsleeves of different dimensions, sizes, materials;
verify them with simulation software and experiments; use these devices as
optical couplers, sensors of biological entities.
2. To get smaller (diameter < 350 microns) SU8 droplets over the two fibers or
fiber-waveguide-fiber, may provide improved and optimized solutions for
signal transmission and sensing of biological entities.
3. Contact angle of the droplet must be nearing 90˚ to get a near spherical
droplet.
4. Both labelled and label free techniques may be used on Laser exposed and
UV exposed microdroplets.

Chatper-1 Introduction
5
5. A range of porous PDMS - AO materials of differing physical, chemical,
optical properties can be produced by varying concentrations of curing agent
and Acridine Orange (AO) in polydimethyl Siloxane (PDMS) gel.
6. Experimenting, usage of the Porous PDMS –AO material as wound dressing
strip, opto-biosensor, filter or as an implant.
7. To explore the change in the image contrast by looking at the fluorescent
PDMS.
8. To study nanolevel locomotory motions of the organisms.
1.6 Organization of the Thesis
The nature of our work, as discussed in subsequent chapters is
multidisciplinary. It involved tasks that need knowledge and understanding of
diverse range of branches of Science and Engineering. Along with modeling of the
problem, extensive experimental work of varied nature and characterization was
carried out to achieve the goals. Starting with problem formulation, some of the
major activities can be listed as photonic simulation of signal coupling, process of
laser heat transmission, simulation of temperature conditions at the time of heat
transfer, optimization of process parameters, testing of optical signal, surface
modification for biosensing, experimental test setup for sensing biological analytes,
fabrication of microstructures, micromachining, use of biomaterials and characterization
using high end instrumentation. Thus it was necessary that each major task be
separately discussed in a chapter.
In chapter 2 we present the review on different coupling techniques used to
transmit optical signal between two optical waveguides. Theoretical discussion on
Dielectric microspheres, whispering gallery modes [WGM] phenomenon inside a
curved surface is important to highlight applications of microspheres as resonators,
biosensors, active and passive photonic devices. Based on the research problem, a
novel method of signal coupling between two optical waveguides using elliptical
microsleeve is presented. Two simulation softwares COMSOL Multiphysics and
RSoft were used to model this bond and explore polymeric materials suitable for the
waveguides and the microsleeve. Simulation results supported the possible efficient
coupling between optical fiber and polymer waveguide. Chapter 3 discusses
implementation aspects of the model conceptualized and simulated in chapter 2.

Chatper-1 Introduction
6
Photoresist material SU8 with its excellent optical properties is selected as a
microdroplet material, to couple the signal and bind the waveguides to substrate and
eachother. A model based on laser heat transmission to strengthen the bond by first
melting SU8 and then resolidifying it, uses finite element method, COMSOL Solid
heat transfer module. Another model is based on optical signal coupling between
these bonded waveguides, experiencing WGM inside the curved surface for specific
excitation wavelength. Laser machine parameters are optimized on the basis of
simulation results and Design of Experiment [DOE] methodology used for the same.
Experimental results indicated strength of the coupling bond and measure of optical
transmittance across the bond.
In chapter 4, we present review on interaction of biomolecules, various
biological entities, with surfaces of a range of different substrate materials. Focus of
this study is on A. solid polymeric materials, their sensitivity and specificity towards
select analytes. Surface modification and functionalization techniques are discussed
to make these material surfaces suitable for the chemical- biochemical actions and
reactions required for interacting with the target analytes. As SU8 material is the
microdroplet bond material, as discussed in chapter 3, a review on surface modification
techniques of SU8 is presented. Next before implementing these techniques on a
small SU8 microdroplet, they were used to check surface sensitivity of thin SU8
film to biomolecule protein BSA, with methods like Laser exposure, UV exposure,
chemical treatment, acid treatment.
Based on the results UV exposure was selected as a simple and robust
method for SU8 microdroplets to immobilize BSA proteins. Also SU8 microdroplet
bonding two optical fibers was surface treated for protein immobilization.
Characterization of GFP tagged E-coli cells immobilized on UV exposed SU8
microdroplets and as SU8 microdroplet coupler, sensor was done using microscopy.
In chapter 4 B. a new bio material is presented. It is a porous PDMS and
AOD material of reddish color and spongy appearance, suitable in filters, band-aids,
sensors. Fabrication procedure involves soft lithography technique. With variations
in the proportions of constituting materials, conditions of post treatment; a wide
range of materials with desired properties and applications can be realized.
Each chapter is concluded with the results of the simulation or experimental
work and references.
Chapter 2 Software Simulation:
Polymer Waveguide Coupling using Elliptical Microsleeve
Chatper-2 Software Simulation: Polymer Waveguide Coupling using Elliptical Microsleeve
7
Chapter 2
Software Simulation: Polymer Waveguide Coupling
using Elliptical Microsleeve 2.1 Introduction
Integrated Optics & photonics have intrigued researchers, scientists and
application engineers equally for a long time, because of their excellent set of
properties and features, innumerable applications encompassing the entire universe.
Both the terms broadly deal with quantum mechanical theory, linear, non linear
optics, optical engineering, optical communication, simulation and application
softwares, branches of science and technology dealing with optics or optics related
applications. The operating range of optical frequencies is wide enough to
accommodate Ultra violet-Visible –Infrared [UV-VIS-IR] spectrum. Search is
always on, for technologies, designs for better quality components, devices, circuits
and circuit solutions, providing integration capability, scaled down features, tunability
and stable performances in applications ranging from spacecraft engineering,
communication engineering, spectrometry, micromachining and bio-sensing. Several
approaches are directed towards the development of communication links of high
performance laser sources, high efficiency waveguides and high sensitive detectors
along with anlog and digital signal conditioning or processing functions. Integrated
optics besides compactness also help address issues of losses, cost, alignment,
handling of optical signals at various stages of the system under consideration. The
area of Integrated Optical Circuits [IOC] which needs further exploration and cost
effective approach is signal coupling between external signal carrying, off chip
optical fibers, fiber ribbons and on chip waveguide like structures. The large
disparity between dimensions of single mode fibers and the on-chip waveguide
micro-structures needs tobe handled with critical and precise setup to minimise losses
and signal degradation. Thus chip level signal alignment and coupling needs
sophisticated instruments and alignment equipments.
In this work of simulation using photonic softwares, some of the important
points related to optical signal coupling are considered:

Chatper-2 Software Simulation: Polymer Waveguide Coupling using Elliptical Microsleeve
8
1. Tapered fibers can be used with the on-chip waveguides using novel
elliptical microsleeve structures.
2. Single fiber, fiber ribbon or array of fibers can be connected to
corresponding waveguides
3. The coupling strategy though used for polymer waveguide material, can be
extended and tested for variety of substrate and waveguide materials.
4. Optical fibers can become part of the IOC with proper pretreatment and on
chip support provided by the microsleeve.
5. Simulation conditions cover boundary conditions like perfect matched
layers, perfect conductors etc.
6. The resultant modal and electric field patterns show the coupling beween
two waveguides at desired frequency, occurrence of whispering gallery
modes at regular spectral intervals, effective refractive indices, Q-factor,
eigen modes.
The photonic simulation softwares, RSOFT Fullwave FDTD [Finite difference
time domain] module and COMSOL Multiphysics software with RF module are
used to demonstrate elliptical microsleeve supported coupling between an optical
fiber and waveguide in an IOC environment. The operating frequency range is in
THz covering VIS –IR spectra. Also importance of whispering gallery mode
resonators [WGR] and WGR based devices in confinement of light in smallest
volume, providing high power density has levitated this humble coupling concept
into a versatile WGM phenomenon.
2.2 Whispering Gallery Mode [WGM]: Basic principle
A bent single mode waveguide, upto a certain limit becomes multimodal; if
its core width is increased, same as a straight waveguide. Beyond that the inner
dielectric interface becomes irrelevant and the outer dielectric interface guides the
bent mode, these are whispering gallery modes [WGM]. This phenomenon occurs in
monolithic resonators with curved geometrical shapes like cylinder, ring and sphere.
Conventional resonators used two or more mirrors, [5] to recirculate optical power,
by way of reflection between the highly reflecting, low loss mirrors; to improve
resolution, pathlength or to maintain oscillations. Although high Q quality and
finesses were features of these resonators, they suffered from low stability due to
Chatper-2 Software Simulation: Polymer Waveguide Coupling using Elliptical Microsleeve
9
vibrations at the low operating frequencies, large size and difficulty in assembly,
overall complexity and extremely high costs. Also there were hurdles in the process
of miniaturization of such devices. So the focus shifted to devices with curved,
polygonal surfaces supporting circulating light with total internal reflection. The
circular modes in these monolithic resonators, with high index contrast at the
boundaries, low losses, high –Q, pathlength of curvature in multiples of the
wavelengths, were called whispering gallery modes. Surface imperfections and
material dispersion once controlled, fabrication of these high performance transparent
structures became simpler and cheaper. Due to their small sizes and volume,
stability was good and on chip integration was possible.
Fig. 2.1 Whispering gallery modes (a) dome structure inside St. Paul Cathedral (b) Schematic of the gallery (c) and (d) whispering gallery modes represented by eigenmode profiles.
In 1912 Lord Rayleigh experienced the phenomenon of sound waves in the
form of small whispers, travelling in an oval shape domed St.Paul Cathedral [ figure
2.1 (a)] to have reached a longer distance and clearly heard. Thus the term got the
name whispering gallery waves and the signal modes called whispering gallery
modes. Figure 2.1 shows the St. Paul Cathedral dome like structure and the gallery
where this phenomenon was first observed. Optical signal when inserted at a critical
angle inside a curved surface, it is completely supported by and propagated along
the curved wall of the structure by total internal reflection. Curved surfaces like
Chatper-2 Software Simulation: Polymer Waveguide Coupling using Elliptical Microsleeve
10
micro-spheres support modes with radial, axial and polar fields which demand
complicated analysis. Further modifications in the spherical structure like in case of
ellipsoidal, hemispherical structures the analysis becomes even more complex.
Inside the curved surface a resonance like condition occurs when after one
roundtrip, the waves return with the same angle of incidence, at the same point and
with the same phase, to form a constructive interference similar to standing waves.
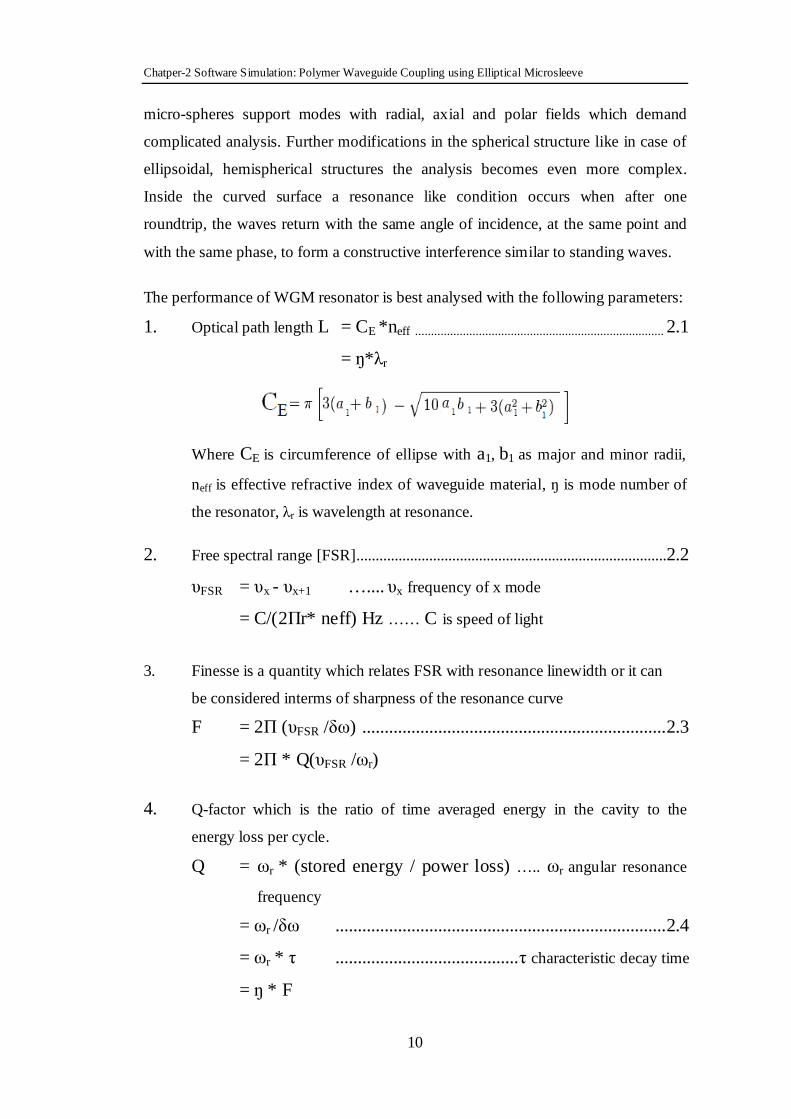
The performance of WGM resonator is best analysed with the following parameters:
1. Optical path length L = CE *neff .............................................................................. 2.1
= ŋ*λr
Where CE is circumference of ellipse with a1, b1 as major and minor radii,
neff is effective refractive index of waveguide material, ŋ is mode number of
the resonator, λr is wavelength at resonance.
2. Free spectral range [FSR].................................................................................2.2
υFSR = υx - υx+1 ….... υx frequency of x mode
= C/(2Пr* neff) Hz …… C is speed of light
3. Finesse is a quantity which relates FSR with resonance linewidth or it can
be considered interms of sharpness of the resonance curve
F = 2П (υFSR /δω) .................................................................... 2.3
= 2П * Q(υFSR /ωr)
4. Q-factor which is the ratio of time averaged energy in the cavity to the
energy loss per cycle.
Q = ωr * (stored energy / power loss) ….. ωr angular resonance
frequency
= ωr /δω .......................................................................... 2.4
= ωr * τ ......................................... τ characteristic decay time
= ŋ * F
Chatper-2 Software Simulation: Polymer Waveguide Coupling using Elliptical Microsleeve
11
= (ŋ * υFSR) / δυ ….. δυ is full width half max of spectra [see
figure 2.2]
Fig. 2.2 Free spectral range [FSR] and Full width half max [FWHM] for a WGM for modes 1,2..n inside a resonator.
2.3 Simulation using Photonic Software
Any scientific or engineering problem however simple or complicated is best
visualized with simulation. There are number of photonic softwares available for
dealing with various aspects of photonics, like time domain analysis, beam propagation
analysis, frequency domain analysis etc. Softwares like RSoft, Lumerical solutions
purely deal with photonics, whereas COMSOL MULTIPYSICS simulation software
allows problem defining modeling, involving multidisciplinary problems. It provides
coupled physics concept with effect of two or more physical conditions, strongly or
weakly coupled on the model under consideration. The Model Builder provides GUI
for integrated environment, flexibility in material selection and improved functionality.
In this work COMSOL version 4.3 RF module is used for solving the issue of
coupling between optical fibers and waveguides using elliptical microsleeve of
polymer material. A condition of whispering gallery modes is observed for the
selected geometry and input signals. RSOFT fullwave FDTD software is integrated
CAD [computer aided design] tool and simulation software which is based on finite
difference time domain [FDTD] technique. Within a given index structure and
known source of excitation, it can calculate time and space based electromagnetic
fields in a broad range of photonic structures. In this work, the simulation is based
on the ring resonator concept.
Chatper-2 Software Simulation: Polymer Waveguide Coupling using Elliptical Microsleeve
12
2.4 Coupling Methods
As mentioned previously one of the most critical aspect of design of
integrated optics circuits [IOC] is signal coupling from off chips sources to on-chip
microstructures and off chip detectors. Optical fibers are normally connected to the
test jigs of an optical setup using SMF [single mode fiber] or MMF [multimode
fiber] connectors. With ever decreasing feature sizes, the space constraints on chip
designs make it impossible to use these connectors for multiple input output
connections. The topic of signal coupling is also crucial, from the point of view of
size disparity between fibers and waveguides on chip. A great deal of work is done
to achieve high efficiency coupling between the fiber and waveguide, by guided
means where the light is confined to the optical fibers and waveguides or unguided
means where prisms, microlenses are used to concentrate light on the waveguide.
Silicon-on-insulator [SOI] devices are known for manufacturability with available
technologies, ultra compactness, strong confinement of light and transparency at
1550nm wavelength of optical communication. High index contrast is important for
confinement of light and roughly it is defined as the ratio of difference to sum of
highest and lowest refractive indices of the waveguide materials, tobe greater than
50%. Polymer materials as optical waveguides, though not having high index
contrast as per definition, are very much used in recent cost effective fabrication
technologies, for visible operating ranges, choice of materials and flexibility of
designs. Tapered coupling with longer taper increases efficiency of coupling in case
of fiber to waveguide coupling. The taper can be a vertical taper converter or a
grayscale taper to match the dimensions of fiber to waveguide. Inverse tapered
couplers, grating based couplers and prism couplers are some of the other types of
coupling where sizes of waveguides are important criterion. In all these techniques
high precision lithography technology or critical adjustments are involved. In 1990
permanent coupling of fibers to thin film waveguides was presented [12] by
cementing fibers to the etched Si-grooves and using evanescent wave coupling. This
method was reported tobe suitable for fiber arrays, different waveguide materials
and for higher coupling efficiency. Anti-resonant reflective optical waveguide
[ARROW], chemically etched tapered fibers were used [13, 14] to couple light with
dielectric microsphere resonators having whispering gallery modes to achieve 98%
power efficiency. With dual coupling of fused [15] microsphere for WGM
Chatper-2 Software Simulation: Polymer Waveguide Coupling using Elliptical Microsleeve
13
resonance, about 99.8% power coupling efficiency was registered. V-grooves and
nickel pins [16] were used in an IOC to self align multiple waveguides.
2.5 Related Work
In a detailed review Righini et. al [1] have discussed WGM resonators and
emphasized the importance of confinement of optical signal into smaller volumes,
be it for photoelectronic devices or photonic devices like fibers, lasers. A new trend
in dielectric WGM resonators was found to possess qualities like smaller mode
volumes, narrow spectral linewidth and high power density. Along with the linear
and spectral properties of WGM resonators [2,6], their applications included passive
WGM based devices like filters and active WGM based devices like modulators,
oscillators, lasers. Mathematical analysis and analytical approach for basic equations
of WGM, excitation, equations for eigenmodes, field equations of WGM [3,4,5,7]
resonators were reported along with experimental results of study of modes in
dielectric resonators. For the study and analysis of wave propagation in resonators, it
is important to provide conditions of perfectly matched layers [PML], like [8] for
reduced reflections and increased absorption of incident waves at the boundaries.
Implementation of COMSOL simulation for PML boundary conditions of
axisymmetric resonators [9], photonic crystal fibers [10] was reported. In an
optofluidic biosensor of transmission type, fullwave simulation was used to sense
shift in transmission spectrum [11] due to difference in refractive index of target
fluid and biomaterial. PML design considerations improved performance parameters
of the sensing layers. Role of WGM resonators as sensors for chemicals and
biochemicals [17], was discussed in a review to further emphasize the versatility of
the WGM resonators. Thus for the purpose of signal communication across a fiber –
waveguide joint extremely precise x-y-z alignment of the two is required, with
stability of the fiber and size difference between the two taken into account. Overall,
the performance of the circuit mainly depends on the success of these joints which
are exceedingly difficult to implement.
2.6 Optical Signal Coupling Using Polymer Elliptical Microsleeve:
SIMULATION
The skills and techniques involved in completing a fiber to waveguide joint
on a small chip can be listed as, 1.tapering of fiber, 2.fabrication of intermediate
Chatper-2 Software Simulation: Polymer Waveguide Coupling using Elliptical Microsleeve
14
microstructure as an interface between the two, 3.alignment of all three to minimize
losses, 4.monitoring with high end equipment the efficacy of such a bond.
The design conceptualised in this work mainly minimizes the work on
remaining three except the first where fiber tapering is essentially required. Single
mode fiber is tapered to its more than core and less than cladding dimensions,
aligned with the waveguide or structures on chip using microscope, after using
fixing arrangements, a small, uniform, polymeric microsleeve like elliptical or
spherical, drop is dispensed on the waveguide joint, to completely cover it. Then the
whole assembly may be post processed for a longer shelf life. A novel WGM
phenomenon is explored inside the hemispherical or semi-ellipsoidal drop, which
assists in transmitting the optical signal across the bond. Simulation of these designs
is carried out using RSoft and COMSOL Multiphysics software, to verify feasibility
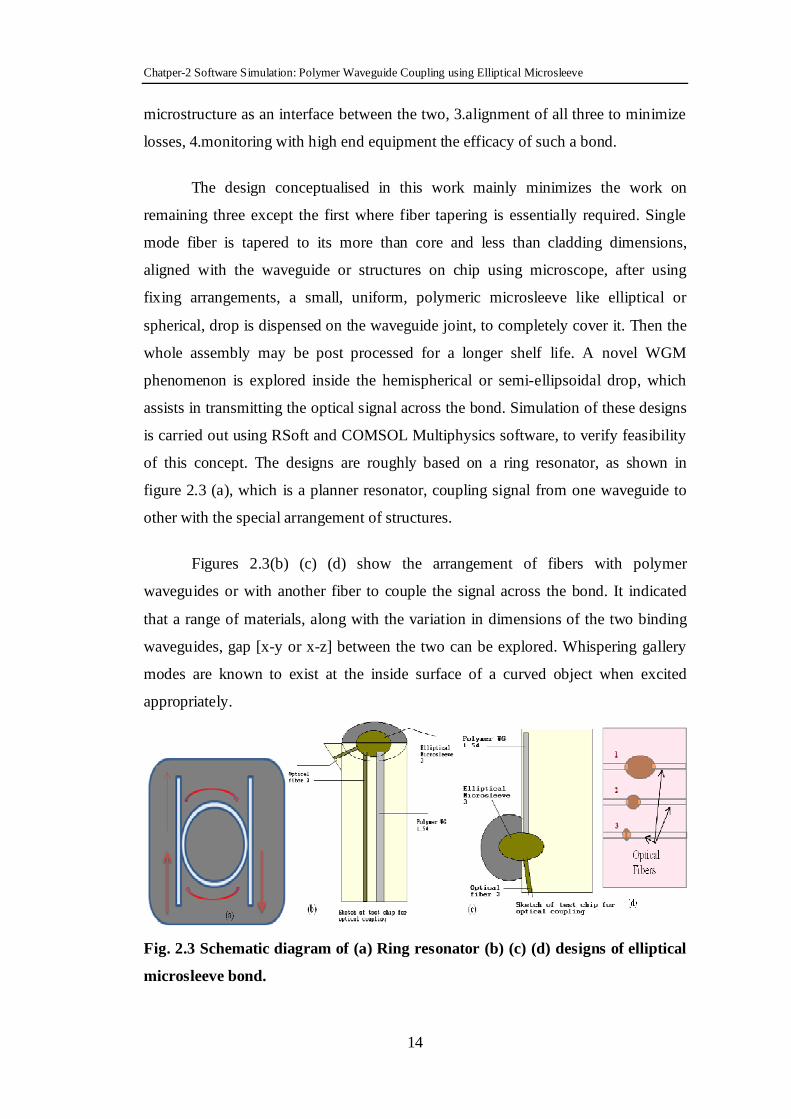
of this concept. The designs are roughly based on a ring resonator, as shown in
figure 2.3 (a), which is a planner resonator, coupling signal from one waveguide to
other with the special arrangement of structures.
Figures 2.3(b) (c) (d) show the arrangement of fibers with polymer
waveguides or with another fiber to couple the signal across the bond. It indicated
that a range of materials, along with the variation in dimensions of the two binding
waveguides, gap [x-y or x-z] between the two can be explored. Whispering gallery
modes are known to exist at the inside surface of a curved object when excited
appropriately.
Fig. 2.3 Schematic diagram of (a) Ring resonator (b) (c) (d) designs of elliptical
microsleeve bond.

Chatper-2 Software Simulation: Polymer Waveguide Coupling using Elliptical Microsleeve
15
The elliptical microsleeve is expected to support signal coupling with the
WGM phenomenon. WGM is characterized for high – Q values and confinement of
circulating energy inside a cavity.
The light propagation through an optical fiber, elliptical microsleeve and
through a polymer waveguide is explored over a range of optical signal wavelengths.
COMSOL simulation platform executed designs shown in figure 2.4 (b) (d)
with boundary conditions viz. electric field, perfect magnetic conductor [PMC],
perfect electric conductor [PEC] and domain condition, perfect matching layers
[PML] to get appropriate simulating conditions and control dispersive, reflective
outer region. RF module of COMSOL supported the model demonstrating WGM
inside the microsleeve, with governing equations [equation (2.5) to (2.9)] from the
electromagnetic wave physics and frequency domain study.
�������. �� � � � � �� � ��
���� � 0 ............................................ 2.5)
�������. �� � � � �� � 0 ................................... ……………..(2.6)
Where ω= angular frequency of the incident signal, σ = conductivity [S/m], εr = (
n-ik) 2 is relative permittivity [F/m] (where ‘n’ is real part and ‘k’ is complex part
of the refractive index of the material ), µr is relative permeability [H/m] (both εr
and µr are with respect to the permittivity and permeability of free space, ε0 and µ0
respectively), K0 is the wave number of free space represented by the following:
� � ��� � � ���
� !". #��$ ..................................
………….(2.7)
Where c1 = Speed of light in vacuum [3 x 10⁸m/s ].
% � &�'
∆& ……………………..(2.8)
Where Qo is quality factor, f0r is resonance frequency, ∆f is 3-db bandwidth at
resonance.
Qo can be calculated from complex eigen-frequency value, Wr as
% � )*�+'�,-.�+', (2.9)
Chatper-2 Software Simulation: Polymer Waveguide Coupling using Elliptical Microsleeve
16
RSoft simulation using fullwave analysis is implemented for design of figure
2.3 (c). The design ensures proper simulating conditions with perfectly matched
layer and material conditions in this 2-D model. A range of frequencies falling in the
optical spectrum are utilized to observe signal coupling and WGM effect between
two waveguides bonded by an elliptical microsleeve. 2.7 Result and Analysis
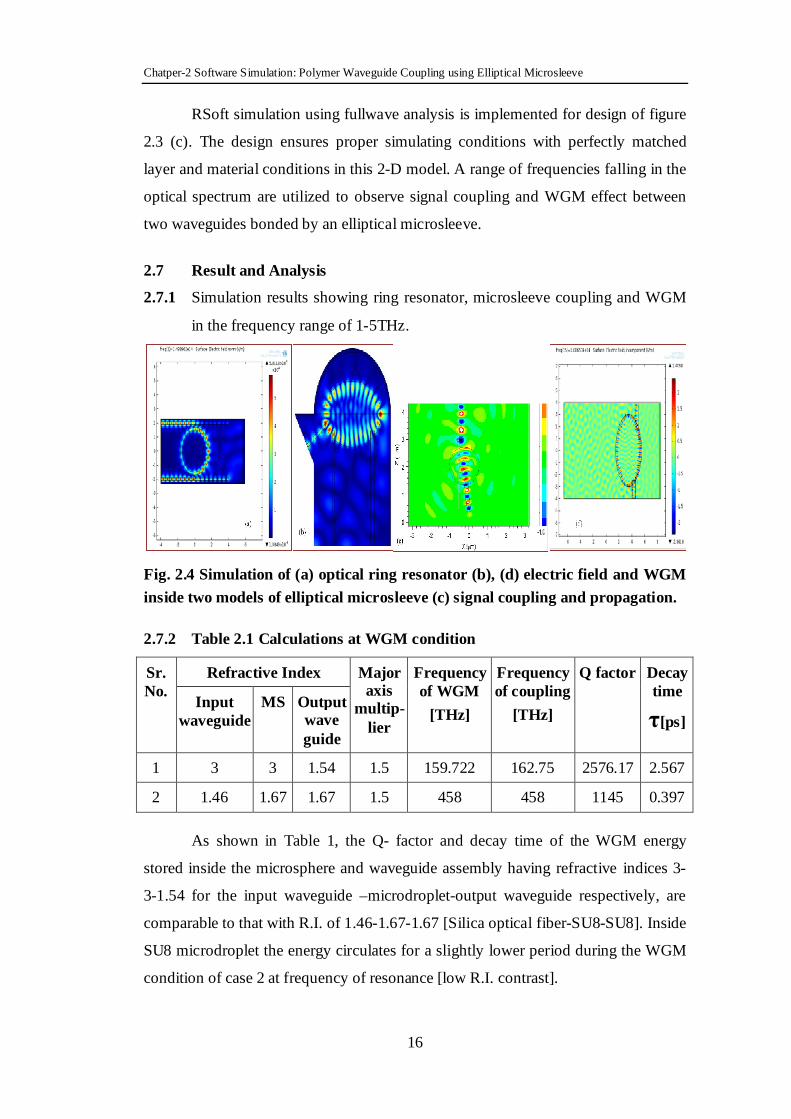
2.7.1 Simulation results showing ring resonator, microsleeve coupling and WGM
in the frequency range of 1-5THz.
Fig. 2.4 Simulation of (a) optical ring resonator (b), (d) electric field and WGM inside two models of elliptical microsleeve (c) signal coupling and propagation. 2.7.2 Table 2.1 Calculations at WGM condition
Sr. No.
Refractive Index Major axis
multip-lier
Frequency of WGM
[THz]
Frequency of coupling
[THz]
Q factor Decay time
τ[ps] Input
waveguide MS Output
wave guide
1 3 3 1.54 1.5 159.722 162.75 2576.17 2.567
2 1.46 1.67 1.67 1.5 458 458 1145 0.397
As shown in Table 1, the Q- factor and decay time of the WGM energy
stored inside the microsphere and waveguide assembly having refractive indices 3-
3-1.54 for the input waveguide –microdroplet-output waveguide respectively, are
comparable to that with R.I. of 1.46-1.67-1.67 [Silica optical fiber-SU8-SU8]. Inside
SU8 microdroplet the energy circulates for a slightly lower period during the WGM
condition of case 2 at frequency of resonance [low R.I. contrast].

Chatper-2 Software Simulation: Polymer Waveguide Coupling using Elliptical Microsleeve
17
2.7.3 Graphs 2.1 [A & B] of total energy inside the elliptical microsleeve resonator
vs Frequency over full spectrum.
2.1 A. High contrast performance: Peak resonance at [153.75e12Hz],
FSR = 0.55THz.
2.1 B. Total energy profile inside the SU8 microdroplet over the full visible
spectrum [430 THz to 770 THz ]
2.7.4 Graph 2.2 of Energy density time average value inside the elliptical
microsleeve resonator [low index contrast] vs Frequency, 0ver 2.061THz
range, Peak resonance at 458THz [655nm], Q –factor = 1145.

Chatper-2 Software Simulation: Polymer Waveguide Coupling using Elliptical Microsleeve
18
Graph 2.2 Enrgy Density Time Average Value
Fig. 2.5 Signal coupling and WGM at wavelength (a) Large contrast: 2.6µm
[115.25THz] with (b) power graph (c) Small contrast: 515.15 nm [582THz] [RSoft]
Fig. 2.6 Signal coupling and WGM at wavelength (a) 493nm [608THz] (b)
574.7nm [522THz] (c) 655nm [458 THz] with Low Contrast. [COMSOL]

Chatper-2 Software Simulation: Polymer Waveguide Coupling using Elliptical Microsleeve
19
2.8 Future Scope
Once the concept of elliptical microsleeve coupling and its feasibility is
verified using the simulation softwares, the coupling can be experimentally verified
using elliptical microsleeves of different dimensions, sizes, materials. Future scope
is to use this device as an optical coupler as well as a sensor of biological entities.
2.9 Conclusion
Both RSoft and COMSOL Multiphysics software supported the 2D –models
of elliptical microsleeve based coupling of optical fibers and waveguides. There was
high efficiency coupling and WGM phenomenon observed for certain wavelengths.
The performance was checked interms of the simulation graphical results, Q-factor,
electro-magnetic fields, coupling efficiency. Results in Table 1 show that in case 2,
WGM at 458THz, in the polymer waveguide and optical fiber tagged by polymer
microdroplet assembly, Q-factor = 1145, decay time 0.3978 ps. Thus it can be
concluded that polymeric waveguides and microsleeve can be used to couple two
optical waveguides.
Reference
1. G.C. Righini, Y.Dumeige, P. F’eron, M. Ferrari, G. Nunzi Conti, D. Ristic, S.Soria,
“Whispering gallery mode microresonators: Fundamentals and applications”,
Rivista Del Nuovo Cimento 34 7 (2011).
2. A.B.Matsko, A.A. Savchenkov, D. Strekalov, V.S.Ilchenko, L.Maleki, “Review of
applications of whispering gallery mode resonators in photonics and non-linear
optics”, IPN progress report (2005).
3. M.L.Gorodetsky, A.E.Fomin,“ Geometrical theory of whispering gallery modes”,
Physics –Optics (2005).
4. A.N.Oraevsky, “Whispering gallery waves”, Quantum Electronics, (2002).
5. A.B. Matsko, V. S. Ilchenko, “Optical resonators with whispering gallery modes –
part I: Basics”, IEEE JSTQE, 12 1 (2006).
6. A.B. Matsko, V. S. Ilchenko, “Optical resonators with whispering gallery modes
part II: Basics”, IEEE JSTQE 12 1 (2006).
7. M.Ornigotti, A. Aiello, “Analytical approximation of whispering gallery modes in
anisotropic ellipsoidal resonators”, Physics.optics (2011).

Chatper-2 Software Simulation: Polymer Waveguide Coupling using Elliptical Microsleeve
20
8. S.G. Johnson, “Notes on perfectly matched layers [PML]”, Book.
9. M.Imran Cheema, A.G. Kirk,” Implementation of PML to determine the quality
factor of axisymmetric resonator in COMSOL”, COMSOL Conferenc, Boston,
(2010).
10. Pierre Viale, S. Fevrier, F. Gerome,H. Vilard, “Confinement loss computations in
photonic crystal fibers using novel perfectly matched layer design”, COMSOL
Multiphysics user’s Conference ,Paris, (2005).
11. Furlani, Biswas, Litchinitser, “WGM-Fullwave simulation of an optofluidic
transmission mode biosensor”, COMSOL conference Boston, (2009).
12. D.J. Albares, T.W. Trask, “Optical fiber to waveguide coupling technique”,
Technical report (1990).
13. J.P.Laine, B.E.Little, D.Lim, H.A.Haus, “Novel techniques for whispering gallery
mode excitation in silica nanosphere”, OSA, IPR (1999).
14. J.P.Laine, B.E.Little, D. Lim, H.A.Haus, “Microsphere resonator mode
characterization by pedestal antiresonant reflecting waveguide (ARROW) coupler”,
IEEE Photonics Technology Letters, 2000.
15. M.Cai, K. Vahala, “Highly efficient optical transfer to WGM by use of symmetrical
dual coupling configuration”, Optics letter 2000, OSA.
16. M.de Labachelerie, N.Kaou,”A micromachined connector for the coupling of
optical waveguides & ribbon optical fibers”, Elsevier; Sensors & Actuators, 2001.
17. Yuze Sun, Xudong Fan,”Optical ring resonators for biochemical and chemical
sensing”, (2011).

Chapter 3 Laser Heat Transmission for
High Efficiency Bonding of Two Optical Fibers Using SU8
Microdroplet

Chatper-3 Laser Heat Transmission for High Efficiency Bonding of Two Optical Fibers Using SU8 Microdroplet
21
Chapter 3 Laser Heat Transmission for High Efficiency
Bonding of Two Optical Fibers Using SU8 Microdroplet
3.1 Introduction
Lasers are versatile in their applications including precision optical test
setups, entertainment displays, micro- structure fabrication, precision joining, device
fabrication, ablation, lithography, local heat delivery, optical fiber splicing, etc. In
specific application areas like surface texturing and local variation in microstructure
fabrication of standalone optical micro-devices like micro-scale ring resonators,
microspheres, optical switches micro-prisms, etc lasers are indispensable. These
standalone optical devices are widely utilized in chemical/ biochemical diagnostics
systems, sensing systems and also in communications systems whereas printed and
patterned structures are not so well explored. One of the reasons for this gap might
be, the issue of joining these structures with standalone single or multimode optical
fibres which otherwise provide total transmissibility of signals in opto-electronic
platforms. Diagnostics can become very easy, flexible, adaptable to new situations if
chip based structures are explored more in comparison to standalone optical
components because of their high sensitivity, stability and low intake volume of
analytes.
In this chapter we have explored and conceptualized a strategy of joining
optical fibres to microchip based printed optics using a SU8 micro-drop. The fibers
are placed straight in close proximity, with proper consideration of gap and
alignment between the two. The adjoining fiber ends are covered with a small SU8
microdroplet which is carefully and precisely exposed to Laser beam for specified
period and with optimum power. The heat transferred to the microdroplet locally
melts the SU8 and then solidifies again to form a solid bond. Long monomers of
SU8 are cross linked and hardened, with the laser exposure and subsequent chemical
reactions. SU8 has low absorbance in the mid Infra Red [MIR] range. Hence laser
power control is the key to strong and perfect bond formation. The technology
developed is presently analysed and evaluated on optical fiber to fiber bonds on

Chatper-3 Laser Heat Transmission for High Efficiency Bonding of Two Optical Fibers Using SU8 Microdroplet
22
glass or silicon wafer. It can be a directly implemented in an application where
coupling process between optical fibre and extended contact of SU8 thin film optical
waveguide, utilizes precise heat delivery of a CO2 lasing system on a SU8 micro-
droplet. Optimization of some physical/dimensional parameters of the bonded
assembly was possible with the control of laser frequency, speed, power, spot size
and cycle control. The optimization is performed with Design of experiments (DOE)
technique, in which Response surface methodology (RSM) based on central
composite design (CCD) is used to evaluate suitable experimental parameters for the
lasing system. Study of temperature distribution at the fiber joint, SU8 droplet and
SU8 structure end was possible with finite element heat transfer model.
Consequently further optimization was carried out by focussing the heating zone to
the joint area. Exclusive optical [RF] modelling is performed to estimate the optical
transmission property of the optical fibers bonded to each other on a substrate with
SU8. Our studies indicate the possibility of formation of Whispering gallery modes
[WGM] at the inside surface of the micro-droplet leading to very high transmissibility
of the optical signal. It also shows that, the thickness of the joint, on heating might
control the temperature at the spot. Thus through this work we have been able to
develop a novel method for fiber stitching to each other and also to printed optical
structures on microchips with reduced power, smaller confinement and lesser time
for forming these joints.
Various aspects of this work are discussed from sections 3.2 to 3.10, to
introduce different processes and concepts on the basis of which this work is
developed.
3.2 Lab-on-Chip
Lab-on-a-chip [LOC] integrates one or many diagnostic or laboratory
operations on a singlechip of compact, small size. It handles smaller volumes of
samples and deals with its transport from one section to other. Thus dispensing of
measured quantities of specific chemical, reagent in specific port, setting time,
stir/mixing the same and subjecting it to the sensing section are some of the
operations LOC does as a regular feature. Thus all the required laboratory sample
handling equipments are scaled down and cramped into a square millimeter size
chip. Also it is important that the sequence of events and analysis is maintained. It

Chatper-3 Laser Heat Transmission for High Efficiency Bonding of Two Optical Fibers Using SU8 Microdroplet
23
finds applications in point-of-care diagnostics, low cost global health diagnostic kits,
diagnostic tools, immunoassays. Merits of LOC are many including 1.Compact size,
fast response and smaller volumes of fluids, smaller heat capacities, low cost 2.Fast
analysis and improved process control 3. Analysis with high throughput
4.Disposable, low cost chips, better quality control, redesignable platform.
A few demerits are 1. Cleaning, predicting effects of previous reactions on
the chip material is difficult 2. Precision engineering accuracy decides accuracies
and performance parameters of the device. 3. Scale down principle may not be
applicable to sensors, detectors and sources.
Lab-on-chip technology when used in diagnostics, it is designed to monitor
microorganisms in the environment, count cells and other molecules in the sample,
separate required biological entity from sample for future investigations. Figure 3.1
(a) shows a typical microfluidic system on a palm size chip. It conducts around 1000
reactions in this small area [Lab-On-Chip]. Normally a programmable microfluidic
chip mixes and stores samples, the LOC shown in figure 3.1 (b) mixes, stores, heats
and senses the samples. This chip consists of an electronic control region and
microfluidic section [Purdue University News]. Thus sensing is an important aspect
of LOC design which still relies on add-on instrumentation like microscopes.
Fig. 3.1 Images of two categories of lab-on-chips.(a) microfluific chip [Lab-
On-Chip] (b) Microfluidic system with multipurpose programmable controller chip [Purdue University News].
Chatper-3 Laser Heat Transmission for High Efficiency Bonding of Two Optical Fibers Using SU8 Microdroplet
24
3.2.1 Merits of Miniaturization
A few of the benefits of micro-miniaturization are accounted as 1.Reduced
overall power consumption, 2.Compact size, shape, smaller weight 3.Rapid
interaction between components 4.Optimized material, solution, reagent usage
5.Specificity in operations and design.
3.2.2 Limitations of Miniaturization
1. Reduced reliability 2. Stability is compromised 3. Poor serviceability after
manufacturing 4. Increased design complexity may lead to poor performance
5. Increased cost due to improved R and D engineering.
3.3 Methods of Microfabrication
Microfabrication essentially means fabricating devices with one of the
feature sizes in micrometer range. Previously this phenomenon was dominated by Si
based systems. Current status is that a range of new materials are being explored to
reduce the cost of material, process and complexity of the endeavour. Microfabrication
has a source from steady and compelling need of miniaturization in every field of
life, be it manufacturing, automotives and electronic goods, defence and military,
medicine and diagnostics, communication systems. Some of the microfabrication
technologies are employing laser machining, photolithography, soft lithography
amongst many.
3.3.1 Laser Micromachining
Modern Laser machines have computer controlled movement of the beam. A
software defined pattern, along with pulse frequency, speed, time and intensity of
beam control, can monitor the depth of exposure, damage due to polymerization or
nucleation of the material. The laser beam can be of CW or pulse type. It is the
wavelength and power of laser beam which decide end use of the machine. Based on
wavelengths there are three main types of lasers: Excimer Laser [193nm, 248nm,
308nm, 351nm], Nd: YAG laser [1064 nm, 532nm, 473nm], CO2 laser [10.6µm].
The selection of wavelength depends on desired minimum feature size, transparency
of the material to the wavelength and optical properties of the material. Smallest
feature size or resolution of the laser machine is ideally double the wavelength in

Chatper-3 Laser Heat Transmission for High Efficiency Bonding of Two Optical Fibers Using SU8 Microdroplet
25
nm. For a CO2 minimum feature size is 21.2µm. Besides laser based 2-D, 3-D
microfabrication using a range of polymer materials; for materials like glass, wood,
some soft metals it can be utilized to make moulds or dies for soft lithography,
masks for photo-lithography. Lasers find applications in thermotherapy, medicines
[soft, micro surgery, cancer treatment], defence, manufacturing [cut, drill, weld,
rapid prototyping].
3.3.2 Photolithography
Photolithography is selective exposure of a photosensitive/ resist material
coated on a substrate, to the Ultra Voilet [UV] light source, development of the
photo exposed material in a developing solution to realize desired features on the
substrate. Resolution of the mask decides smallest feature size. Positive photoresist
delink and weaken when exposed to UV rays whereas negative photoresist link and
harden when subjected to UV exposure. Prebaking and postbaking are essential
procedural steps to chemically control other ingredients of the photoresist. After
development in the developer solution the unbonded material is etched away.
Masking is done using hard [pattern printed on transparent sheet] or soft masks
[Computerized black and white pattern]. Two high resolution image producing
lithography wavelengths are 365nm and 436nm. It is mostly recognized for its use in
fabrication of highly complex electronics integrated circuits.
3.3.3 Soft Lithography
Soft lithography according to definition is the technology involving molds,
masks, stamps to replicate structures very often in elastomeric materials. Feature
sizes of micro and nano are possible with this technique. It has merits of lower cost,
suitability in 2D as well as 3D surfaces, can achieve smaller feature sizes of 6-10nm
appropriate in biotechnology, more methods of pattern transfers or replication are
available to suit specific applications. In replica molding, PMMA or PDMS is normally
used as replica mold or mask for the prepolymer. After making a bubblefree, clear
composition with the curing agent the polymer gel is poured in a suitable container
along with the replica mold or mask. The assembly is then cured by heating or
exposing it to UV rays.

Chatper-3 Laser Heat Transmission for High Efficiency Bonding of Two Optical Fibers Using SU8 Microdroplet
26
3.4 Types of Optical Signal Coupling
Optical fiber –fiber, fiber to waveguide, thinfilm waveguide to waveguide
and fiber –to-thin film waveguide are four possible optical signal coupling
conditions. There is a large disparity between dimensions of single mode fiber
[SMF-10µm] and the silicon-on Insulator [SOI very small cross-section] waveguide.
In-plane and out-of plane mode transformation couplers are used to to match the
fiber and waveguide [1]. The coupling is very inefficient if the two are not properly
matched. With gray scale technology the input waveguide can be tapered. Grating
coupler and photonic crystal coupler are two other coupling methods. Signal
coupling using asymmetric GRIN lens was tested with a coupling loss of 0.3db.
Optical coupling loss can be affected by multimode to single mode fiber coupling,
fiber mismatch, launch conditions while launching light into the fiber, quality and
type of test, reference chords being used.
Loss due to fiber mismatch is caused by the fiber characteristics and not due
to joining techniques used. Fiber mismatches are due to (a)difference in numerical
aperture [NA] (b) Core/cladding concentricity error (c) Core diameter mismatch [4]
(d) Linear gap between two fibers/ waveguides.
NA2= n2sinӨ2 ................................................................................................................ (3.1)
Coupling Loss = -10 [NA1/ NA2]2..................................................................... (3.2)
Coupling Loss = -10 [D1/ D2]2 .............................................................................
(3.3)
I2 = I1 e –Ad Beer -Lamberts law............................................................... (3.4)
I2(λ) = I1(λ) e –A(λ)d Beer Lambert law as function of λ .......................... (3.5)
Where n2 is refractive index of second fiber core in the joint, Ө2 is the maximum
cone of light half angle for the amount of light to enter or exit, NA1, NA2 Numerical
apertures of first and second waveguide, D1, D2 are diameters of two fiber cores, I1
is intensity of light at the input of first fiber, I2 intensity of light at the output of
second fiber, d is the gap or thickness of material in between input and output fibers/
waveguides, A is the coefficient of linear attenuation [if scattering is ignored, it can
be equated to absorption coefficient in cm-1], λ is wavelength in nm, A(λ) is
Coefficient of linear attenuation which is function of wavelength, I2(λ), I1(λ) are
ouput and input light intensities which are functions of λ, see figure 3.2 .

Chatper-3 Laser Heat Transmission for High Efficiency Bonding of Two Optical Fibers Using SU8 Microdroplet
27
Fig. 3.2 Schematic diagrams of fiber coupling and causes of losses (a) Fibers
with different Numerical apertures (b) Core concentricity (c) Core diameter mismatch (D1>D2) (d) Linear gap between two fibers/ waveguides.
3.4.1 Tapered signal coupler
The inequality between single mode fiber and Silicon-on-insulator [SOI]
waveguides dimensions is prominent and cause of coupling losses. Figure 3.3 (a)
Shows schematic diagram of a tapered coupler [31] used to couple optical signal
from fiber to SOI waveguide with minimum coupling losses. The light is confined to
the bottommost layer of the stacked tapered coupler which had highest refractive
index. Linear taper confines and guides the light to the narrow waveguide. Figure
3.3 (b) SEM image showing coupler stack layers with parabolic index profile.
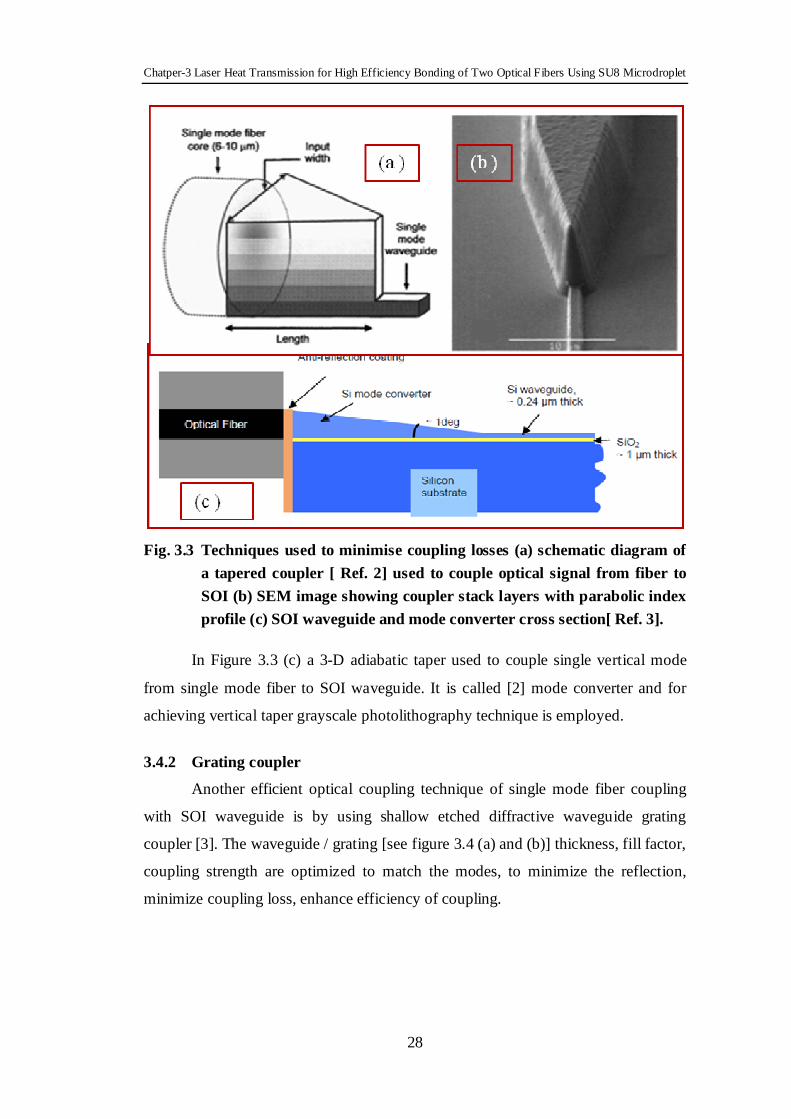
Chatper-3 Laser Heat Transmission for High Efficiency Bonding of Two Optical Fibers Using SU8 Microdroplet
28
Fig. 3.3 Techniques used to minimise coupling losses (a) schematic diagram of
a tapered coupler [ Ref. 2] used to couple optical signal from fiber to SOI (b) SEM image showing coupler stack layers with parabolic index profile (c) SOI waveguide and mode converter cross section[ Ref. 3].
In Figure 3.3 (c) a 3-D adiabatic taper used to couple single vertical mode
from single mode fiber to SOI waveguide. It is called [2] mode converter and for
achieving vertical taper grayscale photolithography technique is employed.
3.4.2 Grating coupler
Another efficient optical coupling technique of single mode fiber coupling
with SOI waveguide is by using shallow etched diffractive waveguide grating
coupler [3]. The waveguide / grating [see figure 3.4 (a) and (b)] thickness, fill factor,
coupling strength are optimized to match the modes, to minimize the reflection,
minimize coupling loss, enhance efficiency of coupling.
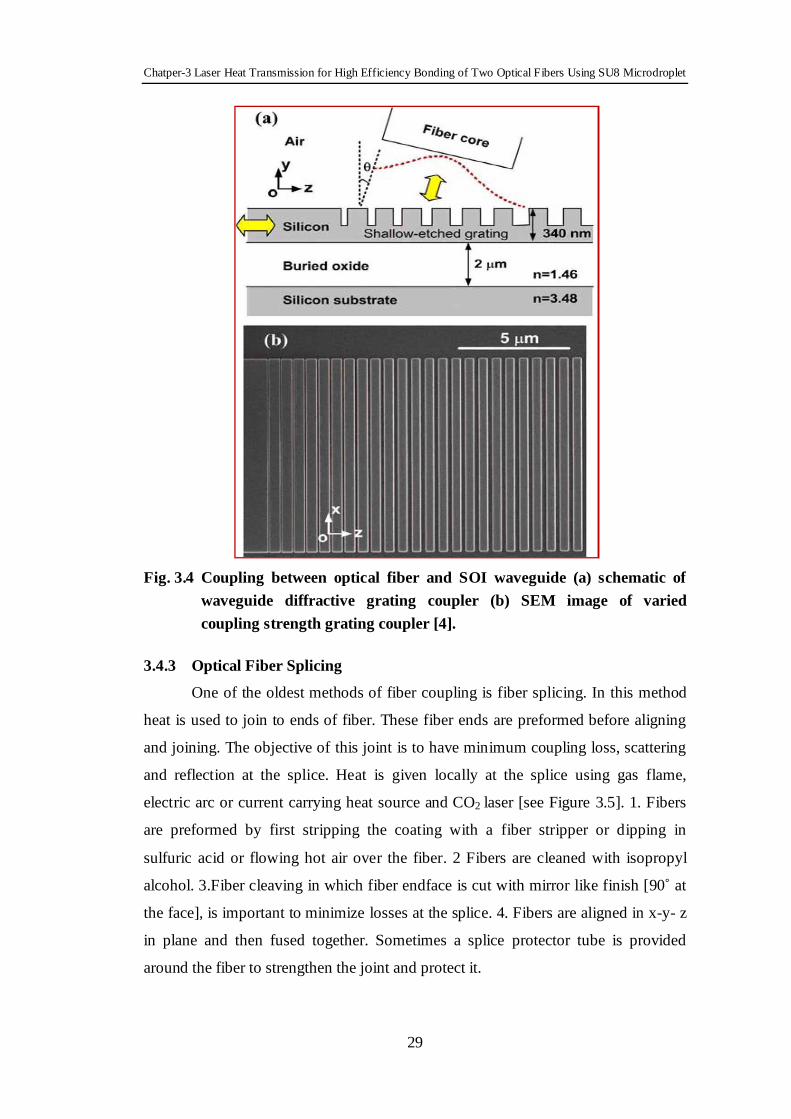
Chatper-3 Laser Heat Transmission for High Efficiency Bonding of Two Optical Fibers Using SU8 Microdroplet
29
Fig. 3.4 Coupling between optical fiber and SOI waveguide (a) schematic of
waveguide diffractive grating coupler (b) SEM image of varied coupling strength grating coupler [4].
3.4.3 Optical Fiber Splicing
One of the oldest methods of fiber coupling is fiber splicing. In this method
heat is used to join to ends of fiber. These fiber ends are preformed before aligning
and joining. The objective of this joint is to have minimum coupling loss, scattering
and reflection at the splice. Heat is given locally at the splice using gas flame,
electric arc or current carrying heat source and CO2 laser [see Figure 3.5]. 1. Fibers
are preformed by first stripping the coating with a fiber stripper or dipping in
sulfuric acid or flowing hot air over the fiber. 2 Fibers are cleaned with isopropyl
alcohol. 3.Fiber cleaving in which fiber endface is cut with mirror like finish [90˚ at
the face], is important to minimize losses at the splice. 4. Fibers are aligned in x-y- z
in plane and then fused together. Sometimes a splice protector tube is provided
around the fiber to strengthen the joint and protect it.
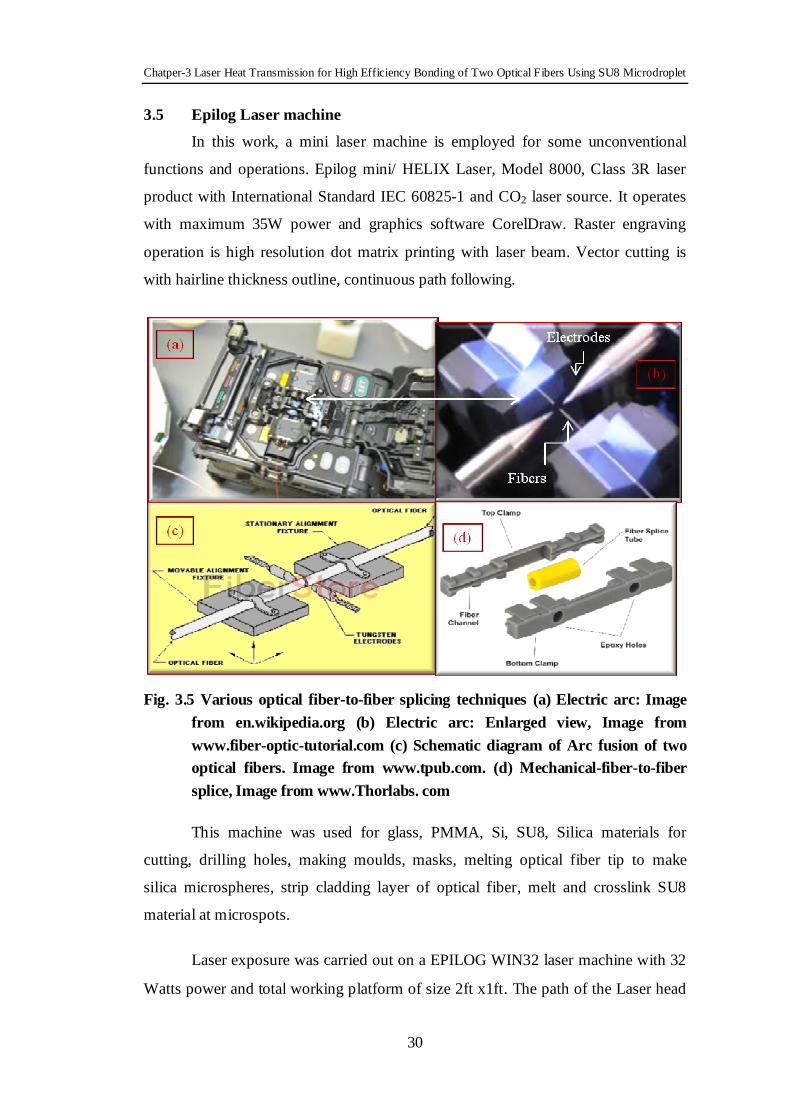
Chatper-3 Laser Heat Transmission for High Efficiency Bonding of Two Optical Fibers Using SU8 Microdroplet
30
3.5 Epilog Laser machine
In this work, a mini laser machine is employed for some unconventional
functions and operations. Epilog mini/ HELIX Laser, Model 8000, Class 3R laser
product with International Standard IEC 60825-1 and CO2 laser source. It operates
with maximum 35W power and graphics software CorelDraw. Raster engraving
operation is high resolution dot matrix printing with laser beam. Vector cutting is
with hairline thickness outline, continuous path following.
Fig. 3.5 Various optical fiber-to-fiber splicing techniques (a) Electric arc: Image
from en.wikipedia.org (b) Electric arc: Enlarged view, Image from www.fiber-optic-tutorial.com (c) Schematic diagram of Arc fusion of two optical fibers. Image from www.tpub.com. (d) Mechanical-fiber-to-fiber splice, Image from www.Thorlabs. com
This machine was used for glass, PMMA, Si, SU8, Silica materials for
cutting, drilling holes, making moulds, masks, melting optical fiber tip to make
silica microspheres, strip cladding layer of optical fiber, melt and crosslink SU8
material at microspots.
Laser exposure was carried out on a EPILOG WIN32 laser machine with 32
Watts power and total working platform of size 2ft x1ft. The path of the Laser head

Chatper-3 Laser Heat Transmission for High Efficiency Bonding of Two Optical Fibers Using SU8 Microdroplet
31
was pre-programmed using Corel draw (CorelDRAW Graphics Suite X5) which was
subsequently converted into a machine readable file of format ‘.dwf’ or ‘.cdr’and
imported into the EPILOG machine.
3.6 SU8 as bonding material
In photolithography technology epoxy based SU8 photoresist is used to
selectively make structures out of a plain Silicon substrate. It is also used to produce
structures of high aspect ratio. It is dissolved in Gama Butyrolacton [GBL] an
organic solvent, quantity of which in SU8 decides, viscocity and feature thickness of
SU8 structure. Thus this negative photoresist is basically a photopatternable,
microfabrication and micromachining material. Its highest absorbtion is at 365nm
near UV wavelength. Hence UV processing is observed in 350 to 400nm near UV
range. It also has very high optical transmission above this range. Once the SU8 film
is exposed to UV rays, the exposed portion has long molecular chains of SU8
crosslinked causing hardening of the region. Once hardened, it is difficult to remove
this portion from substrate. The unexposed portion has no crosslinks, so it dissolves
easily in the developer solution. SU8 has very good imaging characteristics and it is
a regular practice to image, cure and allow the SU8 structures to remain on the
substrate. Thus the process steps involved in Photolithography for making high
resolution SU8 structures are: 1.Substrate cleaning and treatment 2.SU8 spin coating
with speed in RPM and time controlled according to desired thickness of film 3.Soft
bake time set according to thickness of SU8 film 4.UV Exposure with 365nm
wavelength [long pass filter to eliminate wavelengths below 350nm]. 5.Post
exposure bake time set according to film thickness 6. Developing to etch away
unbounded SU8, using SU8 developer 7.Wash with Isopropyl alcohol and dry
8.Hard bake 150˚-250˚C for 5-30 min helps in maintaining properties of SU8
9.Removal of structures from substrate is difficult.
Fabrication of optical waveguides using SU8 material for experimenting
optical fiber -to-wave-guide bond following procedure and optimized parameters
were used:

Chatper-3 Laser Heat Transmission for High Efficiency Bonding of Two Optical Fibers Using SU8 Microdroplet
32
Substrates (Glass, Si wafer) were spin coated with SU8-2025, maintaining
1000 rpm speed of rotation, for 30 sec. Pre-baking temperature was 95º, period 4-5
min. Then photo-lithography was used using M/S Union Optics mask alignment
system. The spincoated SU8 surface was exposed to UV rays for 80sec. Post
exposure baking at 95º C for 5 min was carried out to harden the photoresist. The
substrates were developed in a suitable developer solution (M/S Microchem Inc.) for
2-3mins.
Besides use of SU8 as a microfabrication material, it possesses some
important properties which are found suitable for its use as a fiber bond material: It
has 1. High bond strength, 2. Post UV exposure, chemical resistance due to
crosslinking, 3. Biocompatible nature, 4. Low bonding temperature [90˚], 5.
Excellent optical properties 6.Transparent appearance.
3.7 Design of Experiments [DOE]
DOE is a statistical way of carrying out experimental studies in number of
engineering processes. It helps in establishing a relation between process parameters
and output responses to optimize the system. Thus in the fields of science and
technology, DOE finds application of system optimization, development, management
and validation. This is a systematic way of planning experiments, accessing and
predicting the data output. Amongst various analysis techniques, ANOVA, Taguchi’s
methods are commonly used techniques [44].
3.8 COMSOL Simulation
Simulation softwares help plan the design parameters of a process, system,
device; allow to optimize them with frequent variations and provide a data base to
predict output conditions. Thus they are software DOE techniques, which provide
knowledge of feasibility and performance before actually embarking upon the
fabrication and experimentation. COMSOL Multiphysics software is one such
software. In this simulation different physics modules handling physical parameters
like flow, heat, stress and radiation can be linked together in a multi disciplinary,
multiphysics environment. Effect of one physics and process can be predicted on
other physics and process. It is graphical user interface software with illustrative

Chatper-3 Laser Heat Transmission for High Efficiency Bonding of Two Optical Fibers Using SU8 Microdroplet
33
design models, physics and studies. COMSOL Simulations were carried out using
an Intel (R) Core (TM) 2 Quad CPU, with 8.0 GB RAM and 64 bit operating
system. The research work, discussed in this chapter, also involves interdisciplinary
studies, laser heat transmission and optical signal transmission, behavior of optical
fiber and SU8 material under these conditions.
3.8.1 Laser Heat transmission Coupling
To synthesize a fiber-to-fiber bond using SU8, COMSOL Multiphysics solid
heat conduction model, as proposed in this chapter, is used. A moving laser source is
simulated to provide heat transmission at the joint. It helps design parameters to
achieve end temperature conditions at the microspot and at the location of bond.
COMSOL heat transfer module supports laser heat transfer model with the
governing mathematical equation: It is for the circular symmetry, based on
simplified heat transfer equation.
.............. 3.6)
Where zs = distance from irradiated SU8 film/contact in m, rL = distance from center
of laser beam in m, t = interaction time in sec, k= thermal conductivity [W.m-1.c-1],
T= Temperature in K, I = radiation intensity in Wm-2.
Refractive index of SU8 is in the range of 1.668 -1.575 for wavelength range
365nm-1550nm respectively [R. Muller et.al. 43].
Table 3.1 enlists properties of SU8 relevant to this model.
Table 3.1 Properties of SU8
Thermal conductivity k [W.m-1 .c-1] 0.2
Heat Capacity Cp [ J .Kg-1 .c-1] 1500
Density ρ [Kg. m-3] 1200
Absorption coefficient α [cm-1] 40

Chatper-3 Laser Heat Transmission for High Efficiency Bonding of Two Optical Fibers Using SU8 Microdroplet
34
3.8.2 Effect of Heating on Optical property
Laser heat transmission affects at microlevel the structural properties of SU8
material joining the two fibers. The stress at the joint is interpreted in terms of
change in optical properties at the joint.
3.8.3 Whispering gallery mode [WGM] based Optical signal coupling between
two fibers
The two fibers or planner waveguides are joined using SU8 microdroplet
which possess excellent optical properties and refractive index as high as 1.67 at the
operating range of frequencies. Simulation results in a 2-D design show whispering
gallery modes phenomenon [see chapter 2. for details] in the elliptical microdroplet
with selective input wavelengths. RF model used for this support the concept that
two fibers can have high efficiency coupling with WGM effect in a semicircular or
elliptical joint.
3.9 Measurement of optical properties - SpectraSuite Ocean Optics software
Ocean Optics Spectrometer [Model Name: USB 4000 UV-VIS Miniature
fiber optic Spectrometer, Spectra-Suite Software, Model No. USB4H02846 M/S
Ocean Optics, Inc. Dunedin, FL 34698 with Halogen light source (HL-2000-HP-
FHSA 034990459)] is used for optical signal measurements.
Important performance criterion of the laser heated SU8 bond is transmission
efficiency of the two fibers joined together through the bond. The fiber alignment,
position, dropsize taken care of, the bonded assembly is irradiated with CO2 laser
source to strengthen the bond. The device is then characterized with SpectraSuite
Optics mini spectrometer software and array detector. Figure 3.6 shows the
schematic diagram of the SpectraSuite optical measurement setup. Using a
broadband light source, optical signal was given to input fiber and corresponding
wavelength wise % transmittance was available on the SpectraSuite screen.
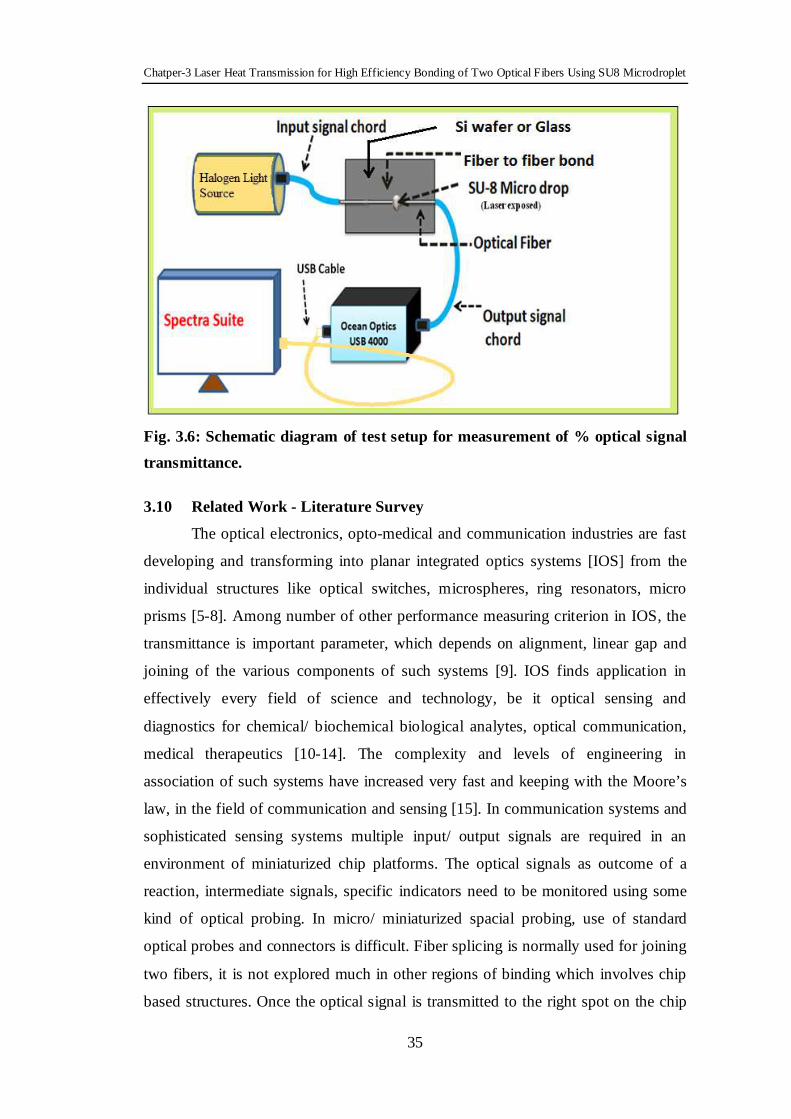
Chatper-3 Laser Heat Transmission for High Efficiency Bonding of Two Optical Fibers Using SU8 Microdroplet
35
Fig. 3.6: Schematic diagram of test setup for measurement of % optical signal
transmittance.
3.10 Related Work - Literature Survey
The optical electronics, opto-medical and communication industries are fast
developing and transforming into planar integrated optics systems [IOS] from the
individual structures like optical switches, microspheres, ring resonators, micro
prisms [5-8]. Among number of other performance measuring criterion in IOS, the
transmittance is important parameter, which depends on alignment, linear gap and
joining of the various components of such systems [9]. IOS finds application in
effectively every field of science and technology, be it optical sensing and
diagnostics for chemical/ biochemical biological analytes, optical communication,
medical therapeutics [10-14]. The complexity and levels of engineering in
association of such systems have increased very fast and keeping with the Moore’s
law, in the field of communication and sensing [15]. In communication systems and
sophisticated sensing systems multiple input/ output signals are required in an
environment of miniaturized chip platforms. The optical signals as outcome of a
reaction, intermediate signals, specific indicators need to be monitored using some
kind of optical probing. In micro/ miniaturized spacial probing, use of standard
optical probes and connectors is difficult. Fiber splicing is normally used for joining
two fibers, it is not explored much in other regions of binding which involves chip
based structures. Once the optical signal is transmitted to the right spot on the chip

Chatper-3 Laser Heat Transmission for High Efficiency Bonding of Two Optical Fibers Using SU8 Microdroplet
36
and taken from other important test points on the mini chips, the signal can be taken
over by existing connectors, splicing connectors for readers, recording systems, mini
spectrophotmeters and other such testing instruments. Thus fiber bonding is an
important interface between the mini and mega world of optical technology.
Biomedical diagnostics as in the lab-on-chip technology heavily depend on proper
input, output connecting probes for the largely used optically driven high speed
strategies of signal transmission from chip to reader and need further explorations
for a truly compact and independent LOC environment. Precaution and care must be
taken while developing these interconnects, to ensure that a strong bond is
developed between the optical fibre and the patterned structure in micro-chip
architecture, so that they remain in position, occupying much less space, provide
lossless transmission amongst various structures.
In this work we have conceptualized through literature survey, simulation
and implemented ,verified with Design of experiments, experimental work, data,
that optical fibres can be firmly bonded to substrates (both glass and silicon), to
extended contacts of patterned SU8 waveguides/ other optical fiber with laser
processed SU8 micro-droplets. The droplets further provide indication of
characteristic whispering galleries and resultant transfer of energy modes from
signal input to output sides in such an unusual optical joint. The parameters of Laser
welding process are decided by the material properties like absorption coefficient,
their behaviour under laser irradiation. Thus proper use of laser machining
parameters is important to get a perfect, shining bond for the fiber-to-fiber or fiber-
to-waveguide joint. To further elaborate the point, considering a transparent polymer
film coated over absorbent/ opaque substrates which when exposed to a small laser
spot with high energy density enables a much faster heat transfer to take place across
the film, eventhough the film material may have high reflectivity, transmissibility
and probably less absorptivity. If the substrate is thermally insulating then the
absorbent substrate below the thin transparent film layer melts and transfers the heat
back to the transparent film layer. This melting, solidification and re-melting at the
film substrate interface create a well bonded region. The advantage offered by the
laser is its ability to machine and work in a small area without affecting the
surrounding material, keeping it intact. [16-19].

Chatper-3 Laser Heat Transmission for High Efficiency Bonding of Two Optical Fibers Using SU8 Microdroplet
37
Literaure survey on laser assisted machining, heating provided, mathematical
modeling of stationary and moving laser beam [20,21], experimental procedures
[22] and computer simulation of the moving and still laser source [23, 25,28], helped
predict laser assisted bonding for various materials speculating different machining
conditions. A range of work is carried out for micro-fabrication of optical
waveguides using photoresist SU8 material spun in a thin film on desired substrate
[24]. The major problem as discussed is access to the optical signal coming out of
these waveguides.
Alternate materials other than SU8 were ABS (Acrylonitrile Butadiene
Styrene) polymeric material[26], PC (poly carbonate) and PMMA (Poly methyl
methacrylate) have shown good quality joining strength when exposed to laser
source although their optical properties may not be suitable to apply them for wave-
guiding function as in case of ABS and PC materials[27]. Optical waveguides are
subjected to various coupling strategies including usage of hybridized rib-like
waveguides with polystyrene microsphere [29], gap filling between the fiber and
waveguide using optical solder [30], to confine light in both vertical and horizontal
directions, stepwise parabolic graded index profile is used for a vertically
asymmetric design and combined it with a horizontal taper [31], optical fiber end
with miniature waveguide grating structure [32]. The methods described in all these
works are either complex in nature, accommodated outside the planar architecture of
the IOC or associated with self assembly/ difficult micro-fabrication strategies,
requiring one or the other form of alignment.
3.11 Laser Heat transmission Based Bonding of Optical Fibers Using SU8
In this research work, SU8 photoresist with laser heat transmission
processing was used as a contact bond material to assist a high coupling efficiency
amid chip bonded optical fibers. Low power CO2 laser was used for stitching or
welding of two optical fibers using SU8 micro-droplet acting as a contact pad or
optical fiber solder bond for the coupling and coupled ends of the optical transmitter
test set up. The coupling end of the optical transmitter was an off-chip fiber and the
coupled end a well located fiber on a microchip substrate. The fiber coupled end
indicates whispering gallery mode formation happening along the SU8 microdroplet
ensuring good transmissibility of input signal between the two coupled fibers. The
simulation models and experiments based on fiber-to-fiber interconnects gave us
Chatper-3 Laser Heat Transmission for High Efficiency Bonding of Two Optical Fibers Using SU8 Microdroplet
38
clear idea of the physics of whispering gallery modes occurring in the micro-droplet.
Silicon and glass, both substratres were used for evaluating the performance of these
contacts. CO2 laser based engraving system [EPILOG] was used with precise control
on beam traversing pattern, power, exposure time, speed, frequency, resolution for
bonding optical fibers to the IOC or LOC with an SU8 micro-droplet and %
transmittance as the experimentally measured output parameter of this coupler
presented the quality of the bond interms of transmissibility and strength. COMSOL
Multiphysics version 4.3 based Modeling of the heat transfer process was excercised
with initial scanning speed/ power, pattern and other Lasing parameters estimated
before using them on the actual laser engraving machine. Design of experiments
(DOE) technology was implemented to plan number of experiments, to further
optimize the heat transfer control of laser machining process. The SU8 micro-
droplet bond joining both the fibers exhibited whispering gallery mode (WGM)
phenomenon along its circumference. With suitable positioning of fiber ends with
respect to the diameter of the microdroplet, light could be transmitted between the
two fibers aligned or misaligned with high efficacy. Thus we could provide with
simulations and experimentation a basis to endorse high transmittance couplings in
this manner between the two bonded off chip fibers.
3.11.1 Experimental procedures
SU8 photoresist polymer (M/S Micro chem. Inc.) with its inherent properties
[section 3.6] was utilized as a bonding material for stitching optical fiber to Si or
Glass substrate. Advantages of SU-8 over other polymers are, its chemical resistance
after UV exposure due to cross linking, high bond strength, transparent appearance,
suitability in bio-sensing applications due to bio-compatible nature, excellent optical
properties and low bonding temperature [90ºC]. SU8 being an epoxy based negative
photo resist is also photo-patternable and is used to create waveguides on microchips
and thus it is possible to translate, the coupling strategy developed in this paper to
patterned optical devices on microchips. It offers resistance to removal once coated
on the substrate and is otherwise a very good bonding material sometimes used to
bond multiple layers of microchips [33, 34].

Chatper-3 Laser Heat Transmission for High Efficiency Bonding of Two Optical Fibers Using SU8 Microdroplet
39
3.11.1.1 SU8 microdrop dispensing on fibers set for bond formation
The optical fibers are aligned using a fixing ,clamping and positioning
system over the substrate (Glass or Si) and a 1.05 µl in volume microdrop of SU8
2025, is dispensed over the prior set optical fibers on the substrate, which is heat
treated with laser to firmly glue the two optical fibers to the substrate. The exact
nature of the drop volume is set through an off-chip syringe pump with a 1ml
syringe [pretreated if required] and a prior modification of the surface energy of the
substrate is performed if required to generate the requisite contact angle of the
dispensed SU8 fluid formulating
Fig. 3.7 Fibers set, aligned, spaced before and after mocrodroplet dispensing (a) Before dispensing of microdroplet at the circle position on the misaligned fibers (b) Before dispensing of microdroplet at the circle position on the aligned fibers (c) After dispensing of the microdroplet circling the fiber joint.
The droplet with the substrate surface. The substrate is moved in z-direction
after adjusting the two fibers in the x or y directions accordingly to set the proper
[linear and lateral] distance between them, before applying the SU8 micro-droplet
and the two different states that are achieved by this process are categorized as
misaligned and aligned fibers [Figure 3.7 (a) and (b)].
In a two-stage X-Y-Z fiber alignment and microdroplet dispensing,
following procedure was used .The first fiber was fixed on the substrate which was

Chatper-3 Laser Heat Transmission for High Efficiency Bonding of Two Optical Fibers Using SU8 Microdroplet
40
mounted and fixed on one of the XYZ stages. The other fiber was mounted on a
holder near the X-Y-Z stage and carried near the previously mounted glass substrate.
Once the fibers are aligned and found satisfactory, when observed under the
magnifying lens the second XYZ stage containing the syringe pump with a projected
syringe is aligned first in the X-Y platform with respect to the coupling region. Then
the syringe pump is moved down in the - Z direction so that the droplet starts
touching over the substrate at exact spot of the desired bond. The droplet adheres to
the substrate and the syringe is pulled back in the –X direction to break the contact
and release the droplet over the coupling region. This way the small distances
between the fibers for both the aligned and misaligned cases could be easily
maintained. The drop volume was recorded as 1.05 µl. Accurate laser beam
exposure of the precise location and spot-size in the polar zone of the droplet could
be obtained to ensure a perfect adherence at the spot to the substrate surface. SU8
grade 2025 was found to offer the right viscosity to undertake these repeated
dispensing. The substrate plays a major role in offering a relatively higher level of
adhesion to the SU-8 drop and the de-adherance of the drop from the needle body.
Goniometric contact angle studies were conducted on the SU-8 droplet getting
formulated over the silicon substrate and over the thermal grown oxide layer on
surface. The contact angle formed by the droplet was approximately 101°C. This
fabrication technique ensured precision dispensing of SU8-2025 without affecting
the surrounding miniaturized devices or structures.
3.11.2 Laser heat treatment
To provide laser heat with a preselected and preset pattern for the laser head,
CorelDraw software was used. Laser exposure was carried out by 32 Watt powered
EPILOG WIN32 laser machine. The laser parameters were fully optimized using
DOE technique in which a Central Composite Design (CCD) was used to fit a model
by least square technique. The software tool Software Design Expert 7.0, is used for
this purpose. After carrying out all experiments, images of the fabricated designs
were captured with top illuminated fluorescence microscope (Nikon 80i) in the
bright-field mode. Transmittances of these welded pairs were measured using test
setup of Ocean Optics Spectra Suite including its software, a broadband [Halogen]
light Source and array detector [UV-VIS miniature fiber optic spectrometer]. Figure

Chatper-3 Laser Heat Transmission for High Efficiency Bonding of Two Optical Fibers Using SU8 Microdroplet
41
3.8 shows the effect of optimization of laser machining parameters, on the quality
and appearance of the bond.
3.11.3 COMSOL Simulation for modeling Laser heat transmission
The processing problem is multi disciplinary and involves Multiphysics
considerations and studies. In process modeling, finite element solid heat transfer
model was used to get temperature distribution at the Air-fiber-SU8 interfaces and
estimate the heat induced stress in the fiber. Using this information as preset input
data in optical [RF] model, birefringence at the SU8 bonded fiber was obtained.
Fig. 3.8 (a) a visible spot on fiber covered with SU8 droplet after laser heat transfers without optimization of machine parameters (b) a highly optimized laser heat transmission procedure for bonding two optical fibers with SU8 microdroplet
Software COMSOL multiphysics was used to model the temperature
distribution on the irradiated SU8 contact surface. 3-D model and geometry was
designed to simulate laser heat transfer, on temperature at the bond, the fiber, SU8
interface and investigate effect of varying thickness of the SU8 film on the
temperature. Equation (3.7) was modified to suit the simulation conditions,
boundary conditions [19-20]. Mathematical model considered circular symmetry for
the simplified heat conduction equation
.................. (3.7)
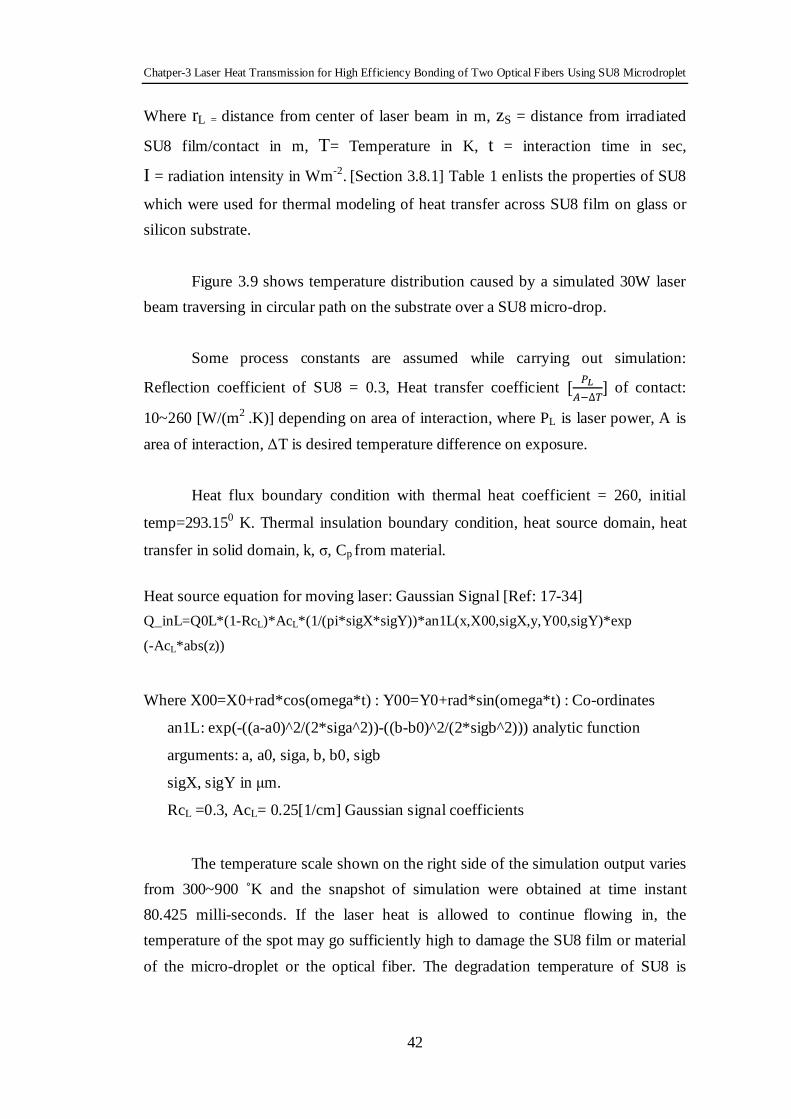
Chatper-3 Laser Heat Transmission for High Efficiency Bonding of Two Optical Fibers Using SU8 Microdroplet
42
Where rL = distance from center of laser beam in m, zS = distance from irradiated
SU8 film/contact in m, T= Temperature in K, t = interaction time in sec,
I = radiation intensity in Wm-2. [Section 3.8.1] Table 1 enlists the properties of SU8
which were used for thermal modeling of heat transfer across SU8 film on glass or
silicon substrate.
Figure 3.9 shows temperature distribution caused by a simulated 30W laser
beam traversing in circular path on the substrate over a SU8 micro-drop.
Some process constants are assumed while carrying out simulation:
Reflection coefficient of SU8 = 0.3, Heat transfer coefficient � /01�∆2$ of contact:
10~260 [W/(m2 .K)] depending on area of interaction, where PL is laser power, A is
area of interaction, ∆T is desired temperature difference on exposure.
Heat flux boundary condition with thermal heat coefficient = 260, initial
temp=293.150 K. Thermal insulation boundary condition, heat source domain, heat
transfer in solid domain, k, σ, Cp from material.
Heat source equation for moving laser: Gaussian Signal [Ref: 17-34]
Q_inL=Q0L*(1-RcL)*AcL*(1/(pi*sigX*sigY))*an1L(x,X00,sigX,y,Y00,sigY)*exp
(-AcL*abs(z))
Where X00=X0+rad*cos(omega*t) : Y00=Y0+rad*sin(omega*t) : Co-ordinates
an1L: exp(-((a-a0)^2/(2*siga^2))-((b-b0)^2/(2*sigb^2))) analytic function
arguments: a, a0, siga, b, b0, sigb
sigX, sigY in µm.
RcL =0.3, AcL= 0.25[1/cm] Gaussian signal coefficients
The temperature scale shown on the right side of the simulation output varies
from 300~900 ˚K and the snapshot of simulation were obtained at time instant
80.425 milli-seconds. If the laser heat is allowed to continue flowing in, the
temperature of the spot may go sufficiently high to damage the SU8 film or material
of the micro-droplet or the optical fiber. The degradation temperature of SU8 is

Chatper-3 Laser Heat Transmission for High Efficiency Bonding of Two Optical Fibers Using SU8 Microdroplet
43
recorded as 380°C and should be reached for proper fusion of the melt polymer and
fiber so that a firm bond can be obtained after it cools down.
3.11.4 COMSOL multiphysics simulation for modeling the whispering gallery
mode (WGM):
RF module of COMSOL multi-physics tool was used for analyzing the SU8
micro-drop bonding the optical fiber to a polymeric waveguide. The governing
equations in the Electro-magnetic wave frequency domain physics that was used to
model the whispering gallery modes are [equations3.8-3.12] as follows:
Fig. 3.9 Simulation of laser heat transmission process for a moving laser exposing along a circular path on a 10 microns thick patterned SU8 layer.
�������. �� � � � � �� � ��
���� � 0 ......................................................(3.8)
...............................................................(3.9)
Where εr =( n-ik) 2
is relative permittivity [F/m] (‘n’ being the real part and ‘k’
being the complex part of the refractive index of the material SU8 in our case), µr is
relative permeability [H/m], both these quantities are considered with respect to the
permittivity and permeability of free space (ε0 and µ0 respectively) σ = conductivity
[S/m], ω= angular frequency of the incident signal, K0 is the wave number of free
space represented by the following:

Chatper-3 Laser Heat Transmission for High Efficiency Bonding of Two Optical Fibers Using SU8 Microdroplet
44
� � ��� � � ���
� !". #��$ ...................................................(3.10)
Where c0 = Speed of light in vacuum [3X10⁸m/s].
% � 3!456 � &�∆& ............................................................................(3.11)
Where f0 is resonance frequency and ∆f the 3-db bandwidth at resonance. Q, the
quality factor when cacalculated from complex eigen-frequency value Wr as
% � )*�+'�,-.�+', .................................................................................(3.12)
For WGM simulation, boundary conditions were selected as perfect electric
conductor [PEC], perfect magnetic conductor, electric field and the domain
condition was perfectly matched layer [PML] to control dispersive outer region.
3.11.5 Fabrication of optical waveguides:
Fiber to fiber laser welding using SU8 was done with two pairs of optical
fibers placed in close proximity on glass slide, Si-wafer or Si/SiO2 substrate. The
distance between each individual pair and its alignment were adjusted using
microscope, X-Y-Z stage. The interfaces were covered with small drops of SU8-
2025. SU8 material was also used for fabricating the optical waveguides and
interconnects [detailed procedure is given in section 3.6]. These structures were
suitably aligned with the, off the chip optical fibers using clamping or positioning
system and SU8 micro-droplet was dispensed over the respective joints in volume of
about [ 2.42E-10 m3 ] 0.242 micro-liter. One-by-one the SU8 micro-droplets were
then exposed to the CO2 Laser beam of Epilog Laser Engraving Machine according
to the pre-programmed pattern and select parameters of the machine. The beam
diameter of this machine is around 80µm and the system emits at 10.6µm
wavelength. The laser path was designed using Corel Draw and is described to
move the laser head over the assembly, connecting the coupling to coupled fibers in
a pre-designed layout. Each exposure of the laser is coincided with the geometric
pole of the individual SU-8 micro-droplet and only a very small zone of the droplet
was laser exposed. The laser power being highly focused in a small area guides the
light past the whole radius of the micro-droplet all the way to the substrate over
which the droplet is placed. The advantages of these laser welding processes are
1.They prepare the bonded fiber and waveguide or bonded fibers for external
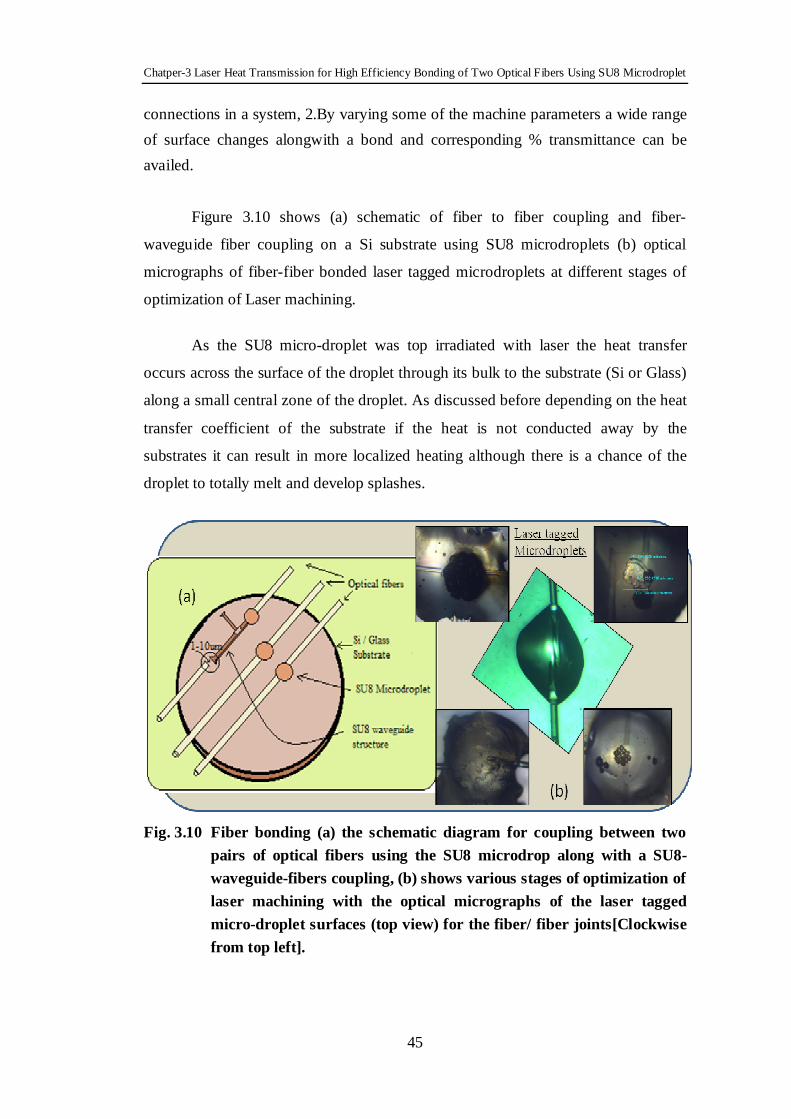
Chatper-3 Laser Heat Transmission for High Efficiency Bonding of Two Optical Fibers Using SU8 Microdroplet
45
connections in a system, 2.By varying some of the machine parameters a wide range
of surface changes alongwith a bond and corresponding % transmittance can be
availed.
Figure 3.10 shows (a) schematic of fiber to fiber coupling and fiber-
waveguide fiber coupling on a Si substrate using SU8 microdroplets (b) optical
micrographs of fiber-fiber bonded laser tagged microdroplets at different stages of
optimization of Laser machining.
As the SU8 micro-droplet was top irradiated with laser the heat transfer
occurs across the surface of the droplet through its bulk to the substrate (Si or Glass)
along a small central zone of the droplet. As discussed before depending on the heat
transfer coefficient of the substrate if the heat is not conducted away by the
substrates it can result in more localized heating although there is a chance of the
droplet to totally melt and develop splashes.
Fig. 3.10 Fiber bonding (a) the schematic diagram for coupling between two
pairs of optical fibers using the SU8 microdrop along with a SU8-waveguide-fibers coupling, (b) shows various stages of optimization of laser machining with the optical micrographs of the laser tagged micro-droplet surfaces (top view) for the fiber/ fiber joints[Clockwise from top left].
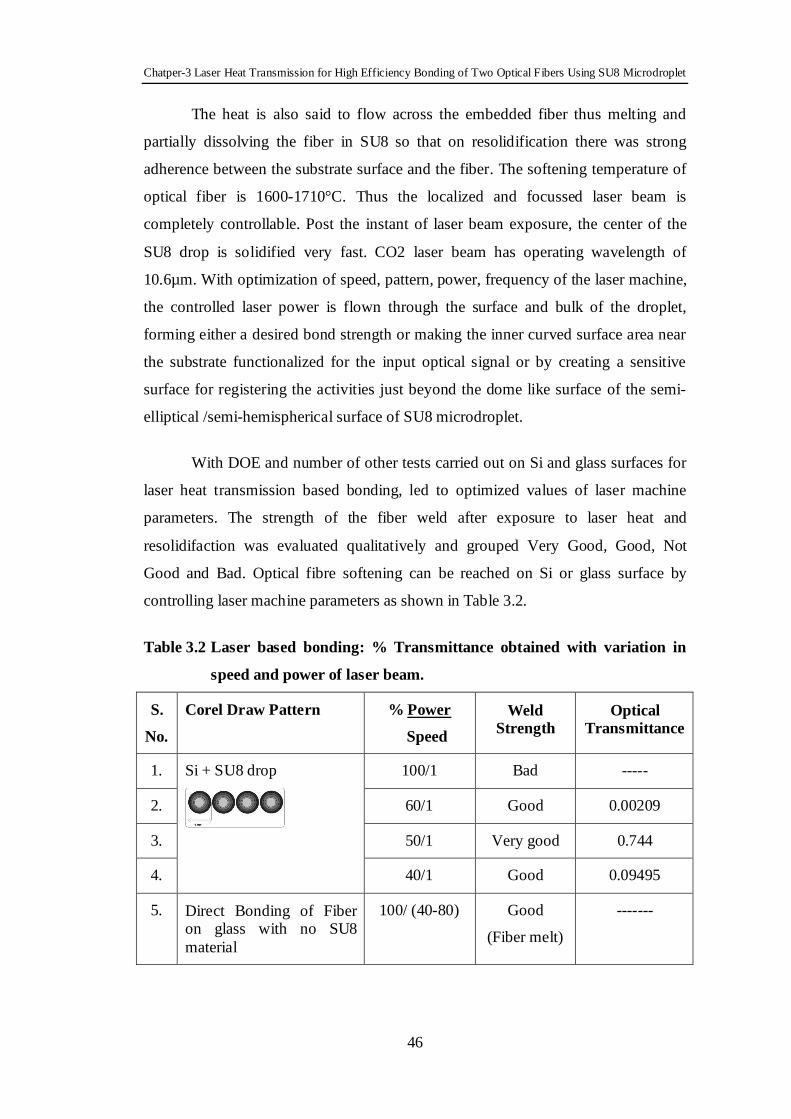
Chatper-3 Laser Heat Transmission for High Efficiency Bonding of Two Optical Fibers Using SU8 Microdroplet
46
The heat is also said to flow across the embedded fiber thus melting and
partially dissolving the fiber in SU8 so that on resolidification there was strong
adherence between the substrate surface and the fiber. The softening temperature of
optical fiber is 1600-1710°C. Thus the localized and focussed laser beam is
completely controllable. Post the instant of laser beam exposure, the center of the
SU8 drop is solidified very fast. CO2 laser beam has operating wavelength of
10.6µm. With optimization of speed, pattern, power, frequency of the laser machine,
the controlled laser power is flown through the surface and bulk of the droplet,
forming either a desired bond strength or making the inner curved surface area near
the substrate functionalized for the input optical signal or by creating a sensitive
surface for registering the activities just beyond the dome like surface of the semi-
elliptical /semi-hemispherical surface of SU8 microdroplet.
With DOE and number of other tests carried out on Si and glass surfaces for
laser heat transmission based bonding, led to optimized values of laser machine
parameters. The strength of the fiber weld after exposure to laser heat and
resolidifaction was evaluated qualitatively and grouped Very Good, Good, Not
Good and Bad. Optical fibre softening can be reached on Si or glass surface by
controlling laser machine parameters as shown in Table 3.2.
Table 3.2 Laser based bonding: % Transmittance obtained with variation in
speed and power of laser beam.
S.
No.
Corel Draw Pattern % Power
Speed
Weld Strength
Optical Transmittance
1. Si + SU8 drop
100/1 Bad -----
2. 60/1 Good 0.00209
3. 50/1 Very good 0.744
4. 40/1 Good 0.09495
5. Direct Bonding of Fiber on glass with no SU8 material
100/ (40-80)
Good
(Fiber melt)
-------

Chatper-3 Laser Heat Transmission for High Efficiency Bonding of Two Optical Fibers Using SU8 Microdroplet
47
Direct bonding of optical fiber on the glass surface without SU8 thin film or
drop was attempted to know % power/ speed. The bond strength was found to be
poor and there was spill over of the fiber melt, so this option was not investgated in
further studies. The fiber softening temperature is in the higher range [1600-17100C]
than SU8. So fiber material or SU8 do not experience degradation [600~ 900 K
max] in this study.
3.11.6 Measurement of % Transmittance across the coupling
Once the strategy of coupling of optical fibers is established, it can be
applied and extended to microchip based waveguide like structures using SU8
micro-drop. To evaluate performance and optical characteristics of this bond, its use
as a tool or probe to access optical signal from source, microchip and deliver it to
desired external setup; the bonded assembly must be tested for % transmittance
using an optical test setup. The laser bonded fiber-fiber and fiber-waveguide-fiber
bond assemblies were optically characterized for % Transmittance measurement
using Ocean Optics Spectra Suite Spectrometer in an integrated test setup, see figure
3.6.
A halogen lamp [wavelength 300-1100 nm peak measured value [Rλ] of
60000 counts (this 60000 count is considered as reference value for further
discussion)] was used as light source for the input fiber chord which fed the signal to
coupling fiber bonded on chip. The alignment process of the fiber and SU8
microdroplet dispensing was done using two precision XYZ stages. The ouput signal
[SOλ] is connected by optical fiber cable or chord to the Ocean optics USB4000
which is a UV-VIS miniature Fiber optic spectrometer. USB 4000 has 16-bit A/D
convertor, a set of CCD arrays, GPIOs, enhanced electronics with increased signal-
to-noise ratio. It is connected to a computer system at the USB port and Spectra-
Suite spectroscopy software of Ocean Optics with advanced data capture attributes,
was used to analyse signal from the array detector. The output spectra has
wavelength in ‘nm’ on X-axis and intensity (counts) on Y-axis. It can be used to
measure wavelength dependent transmittance of a sample or structure, its
absorbance, reflectance and relative irradiance. Before starting with the actual
measurement, reference [Rλ], dark [DRλ] files referring to background subtraction
must be first stored, see equation (3.13).
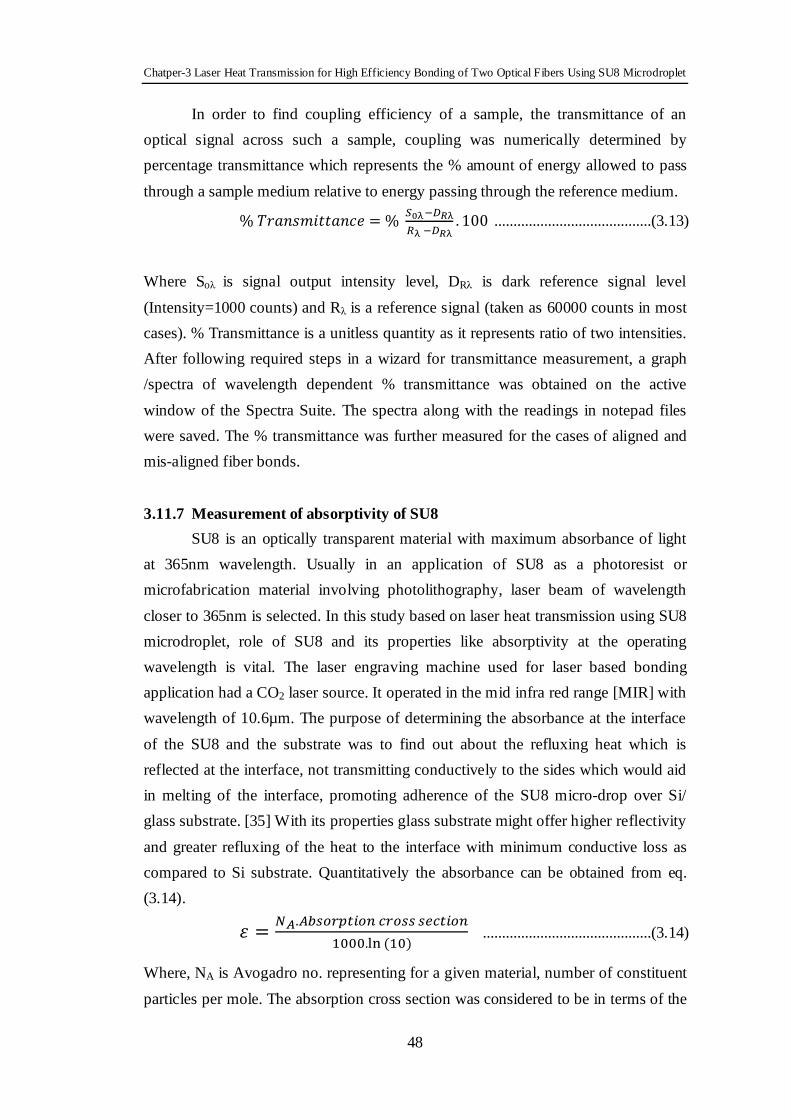
Chatper-3 Laser Heat Transmission for High Efficiency Bonding of Two Optical Fibers Using SU8 Microdroplet
48
In order to find coupling efficiency of a sample, the transmittance of an
optical signal across such a sample, coupling was numerically determined by
percentage transmittance which represents the % amount of energy allowed to pass
through a sample medium relative to energy passing through the reference medium.
% 8 !9:#;55!94< � % =�>�?@>)> �?@>
. 100 .........................................(3.13)
Where Soλ is signal output intensity level, DRλ is dark reference signal level
(Intensity=1000 counts) and Rλ is a reference signal (taken as 60000 counts in most
cases). % Transmittance is a unitless quantity as it represents ratio of two intensities.
After following required steps in a wizard for transmittance measurement, a graph
/spectra of wavelength dependent % transmittance was obtained on the active
window of the Spectra Suite. The spectra along with the readings in notepad files
were saved. The % transmittance was further measured for the cases of aligned and
mis-aligned fiber bonds.
3.11.7 Measurement of absorptivity of SU8
SU8 is an optically transparent material with maximum absorbance of light
at 365nm wavelength. Usually in an application of SU8 as a photoresist or
microfabrication material involving photolithography, laser beam of wavelength
closer to 365nm is selected. In this study based on laser heat transmission using SU8
microdroplet, role of SU8 and its properties like absorptivity at the operating
wavelength is vital. The laser engraving machine used for laser based bonding
application had a CO2 laser source. It operated in the mid infra red range [MIR] with
wavelength of 10.6µm. The purpose of determining the absorbance at the interface
of the SU8 and the substrate was to find out about the refluxing heat which is
reflected at the interface, not transmitting conductively to the sides which would aid
in melting of the interface, promoting adherence of the SU8 micro-drop over Si/
glass substrate. [35] With its properties glass substrate might offer higher reflectivity
and greater refluxing of the heat to the interface with minimum conductive loss as
compared to Si substrate. Quantitatively the absorbance can be obtained from eq.
(3.14).
� � BC.1DEF�GHIFJ ��FEE E*�HIFJ� .KL �� ............................................(3.14)
Where, NA is Avogadro no. representing for a given material, number of constituent
particles per mole. The absorption cross section was considered to be in terms of the

Chatper-3 Laser Heat Transmission for High Efficiency Bonding of Two Optical Fibers Using SU8 Microdroplet
49
laser beam spot-size on the exposed substrate, assumed to be in cm2. So an exercise
was undertaken to find absorptivity of SU8 at this wavelength. A comparison of
absorptivity with and without SU8 on glass/ Si was made where, Absorptivity (ε)
was measured at 10.6 µm. Number of substrates of glass, Si were prepared with
coating of Su8 in the form of small circles prepared for the Laser exposure. Half the
Si/ glass sample substrates were kept uncoated for the exposure. Then systematically
number of CO2 laser exposures were carried out on all the four sets [Si, Si+SU8,
Glass, Glass+SU8] of substrates with varying power and speed parameter of the
lasing machine. The spot-sizes thus obtained were imaged and measured using
Nikon epifluorescence microscope. As the glass - SU8 interface is the most heated
up and high temperature zone in the whole cross-section of the droplet owing to the
heat reflux back into the SU8 at the interface we thought it important to observe the
absorption at this interface. Hence the absorptivity at the interface of the SU8 was
subsequently calculated by using the equation (3.15).
Absorptivity of SU8=Absorptivity of Glass-Absorptivity of (Glass+SU8) …….
(3.15)
Method of averaging was used to get the final value of SU8 absorptivity.
3.11.8 Calculating the SU8 droplet Volume
The cross-sectional area [for a, b] of the SU8 micro-droplet was imaged
using the Nikon epifluorescence microscope using the bright field option. Then
vertical cross-section plane of the droplet, perpendicular to the plate (both major and
minor axes) was imaged and measured [for h]. This was achieved by aligning the
glass slide in the vertical direction perpendicular to the sample stage of the
microscope. The volume of the droplet was calculated by using the expression (3.16)
see Figure 3.10 (c):
3.10 (c) Volume Measurements of microdrop

Chatper-3 Laser Heat Transmission for High Efficiency Bonding of Two Optical Fibers Using SU8 Microdroplet
50
M � NO P Q P �3!� S 3T� S Q�) .......................................................(3.16)
Where a, b and h were the major radius, minor radius and height of the
hemispherical droplet, respectively. The first job was to see the consistency in
dispensing identically sized volumes and then based on this data the average
interface area of the glass SU8 interface was calculated.
3.12 Result and Analysis
After considering methodologies of analysis, simulations, calculations,
measurements of various quantities, following subsections present results and
correlation between them.
3.12.1 Optimization of Machining Parameter
In the laser stitching experiments the lasing parameters like span time,
power, pattern of lasing, speed, frequency were varied and optimization of these
parameters was carried out using design of experiment (DOE) software. Table 3.2
shows the strength of the laser welding process with respect to the power/ speed
percentage of maximum values. The maximum power of the laser source was 32
Watts and the maximum speed with which the beam traverses the X-Y stage of the
laser machine was 15.4 cm/sec. Desired strength of the laser welded fiber bond was
obtained with the parameters mentioned in row 2-5 of Table 2. Poor weld strength
was obtained at row no. 1. It is observed that the optical transmittance values across
such joints as mentioned in the last column of table 1 are also low in case the
strength of the fiber joint is poor indicating that the coupling is inappropriate if the
fiber SU8 melt pool is not properly formed due to insufficient heating of the
microdroplet. It is further noticed that a power level equalizing the full power value
provided insufficient bond strength. The cause of this condition may be overheating
or burning of the SU8 material at the spot. This probably can be accounted for by
looking into the thermal expansion coefficient of the Glass (1.1x10⁻⁸ / K) and SU8
(5.2x10⁻⁵/ K) respectively. In the direct bonding of fiber to glass the coefficient of
expansion being more or less similar demonstrated no inter-layer shear between the
fiber and glass resulting in good bond strength between both. There was a spillover
of melted fiber when direct bond was formulated. Out of all the combinations of
power / speed parameters, experiments showed that ratio of 50% power and 1%
speed correlated to the best bonding between the fiber, SU8 photo-resist and the
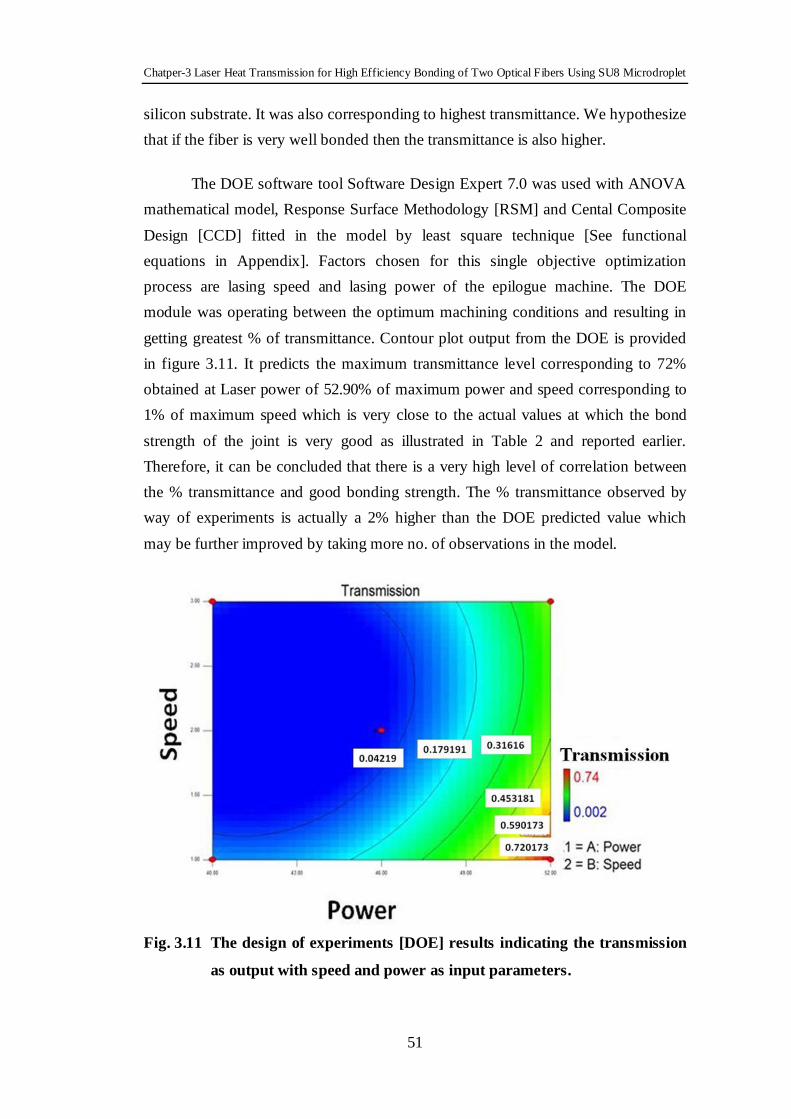
Chatper-3 Laser Heat Transmission for High Efficiency Bonding of Two Optical Fibers Using SU8 Microdroplet
51
silicon substrate. It was also corresponding to highest transmittance. We hypothesize
that if the fiber is very well bonded then the transmittance is also higher.
The DOE software tool Software Design Expert 7.0 was used with ANOVA
mathematical model, Response Surface Methodology [RSM] and Cental Composite
Design [CCD] fitted in the model by least square technique [See functional
equations in Appendix]. Factors chosen for this single objective optimization
process are lasing speed and lasing power of the epilogue machine. The DOE
module was operating between the optimum machining conditions and resulting in
getting greatest % of transmittance. Contour plot output from the DOE is provided
in figure 3.11. It predicts the maximum transmittance level corresponding to 72%
obtained at Laser power of 52.90% of maximum power and speed corresponding to
1% of maximum speed which is very close to the actual values at which the bond
strength of the joint is very good as illustrated in Table 2 and reported earlier.
Therefore, it can be concluded that there is a very high level of correlation between
the % transmittance and good bonding strength. The % transmittance observed by
way of experiments is actually a 2% higher than the DOE predicted value which
may be further improved by taking more no. of observations in the model.
Fig. 3.11 The design of experiments [DOE] results indicating the transmission
as output with speed and power as input parameters.

Chatper-3 Laser Heat Transmission for High Efficiency Bonding of Two Optical Fibers Using SU8 Microdroplet
52
3.12.2 COMSOL simulations for Laser heat transfer
Simulation of the laser heat transmission process used for welding between
fibers by using SU8 micro-droplet had shown time dependent variation in
temperature distribution of the laser exposed area. The heat was rapidly dissipated
across the micro-droplet as well as the surface. As detailed previously the heated
substrate was responsible for refluxing and reflecting back the heat to the SU8 layer
along the interface had it been a poor heat conductor. In fact due to the rapid
temperature rise and a cross-over of the ‘Tg’ [glass transition temperature] value of
uncross-linked SU8 2025 (50° - 65°C), it melted and then got superheated near the
interface due to the heat refluxing action of the substrate [36]. This is clear in the
simulation output which is reported in Figure 3.9 and Figure 3.12.
Fig. 3.12 The simulation output of bulk temperature of SU8-2025 vs. time in sec of heat treatment. [Different plots show the temperature behavior from a surface 10 micron above the interface in the SU8 layer treated as ‘zero datum’ towards the interface]
The temperature started rising as the Laser started radiating at time instant
‘0’ at the micro-droplet and simultaneously heat transfer processes occured so that
equilibrium was achieved in around 125 milliseconds. The equilibrating temperature
is shown as 560°K (287°C) for 10 micron thickness, away from the interface [based
on sectional plot of figure 3.9] and the temperature further decreased, away from the

Chatper-3 Laser Heat Transmission for High Efficiency Bonding of Two Optical Fibers Using SU8 Microdroplet
53
interface towards the bulk of the SU8 material. In fact at a distance 1 micron from
the interface the temperature is at a value of 470° K [197°C]. Thus very near to the
Si surface, the temperature reached the melting point of SU8 but it did not go into
the degradation temperature for SU8 which is about 380°C. [40] The glass being a
higher reflector of incident beam shooted up to above 380°C which may degrade the
SU8 in actual practice, due to very less absorbance of the substrate on beam incident
side. So, we can see that as the laser processing involved similar conditions of the
laser frequency, scan rate, laser power and resolution, speed as obtained in the
earlier section, the exposed zone always had a molten state which solidified on
removal of the Laser power. The interface therefore was found ideal for the
placement of input/ output fibers. A stronger joint was formed as the fibers were
aligned or misaligned as per figure 3.7 on the surface of the substrate (interface of
SU8 and substrate). The model accounted for the conductivity of the wafer and if the
conductivity resulting in interfacial heat loss was considered then the overall
maximum temperatures achieved at the interface should be lower for Silicon
substrate as the thermal conductivity of silicon will be higher than that of glass.
The birefringence estimation was performed on a combination of COMSOL
modules, including structural mechanics model giving stress due to rise in laser
heated material temperature [Solid heat transfer model]. This stress was monitored
over a short portion of the model to find birefringence or change in effective
refractive index and corresponding change in optical properties of the material.
Birefringence prediction if performed starting from the interface to the bulk of the
droplet, then the superheated molten state of SU8 that was formulated closer to the
interface will have more refractive index homogeneity thus causing less amount of
birefringence. As the distance from surface was increased then away from the hot
zone as the SU8 may still be semi solid there may be large variation of refractive
index causing an increase in the overall birefringence. Simulated effective
birefringence data was plotted for Air/SU8/Si combination. Figure 3.13 shows the
birefringence plot drawn using COMSOL multiphysics simulation software.
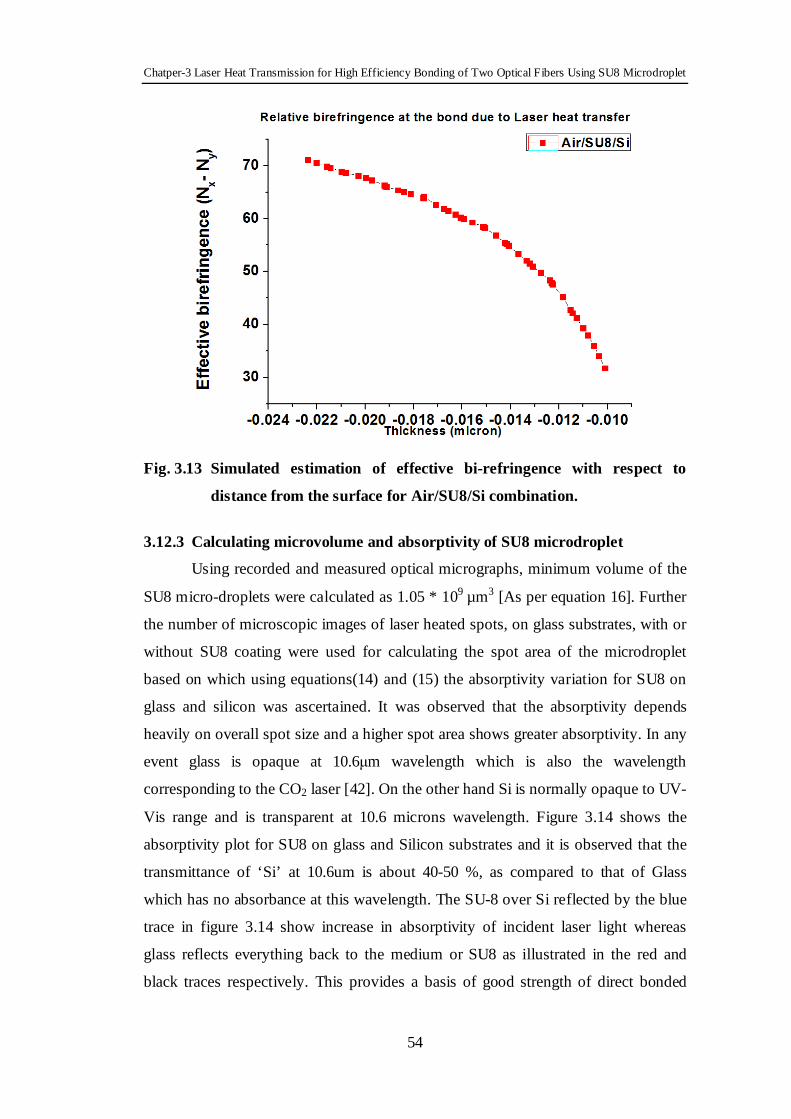
Chatper-3 Laser Heat Transmission for High Efficiency Bonding of Two Optical Fibers Using SU8 Microdroplet
54
Fig. 3.13 Simulated estimation of effective bi-refringence with respect to
distance from the surface for Air/SU8/Si combination.
3.12.3 Calculating microvolume and absorptivity of SU8 microdroplet
Using recorded and measured optical micrographs, minimum volume of the
SU8 micro-droplets were calculated as 1.05 * 109 µm3 [As per equation 16]. Further
the number of microscopic images of laser heated spots, on glass substrates, with or
without SU8 coating were used for calculating the spot area of the microdroplet
based on which using equations(14) and (15) the absorptivity variation for SU8 on
glass and silicon was ascertained. It was observed that the absorptivity depends
heavily on overall spot size and a higher spot area shows greater absorptivity. In any
event glass is opaque at 10.6µm wavelength which is also the wavelength
corresponding to the CO2 laser [42]. On the other hand Si is normally opaque to UV-
Vis range and is transparent at 10.6 microns wavelength. Figure 3.14 shows the
absorptivity plot for SU8 on glass and Silicon substrates and it is observed that the
transmittance of ‘Si’ at 10.6um is about 40-50 %, as compared to that of Glass
which has no absorbance at this wavelength. The SU-8 over Si reflected by the blue
trace in figure 3.14 show increase in absorptivity of incident laser light whereas
glass reflects everything back to the medium or SU8 as illustrated in the red and
black traces respectively. This provides a basis of good strength of direct bonded

Chatper-3 Laser Heat Transmission for High Efficiency Bonding of Two Optical Fibers Using SU8 Microdroplet
55
fibers over glass substrates,eventhough the reflected light would add much reflux
which may degrade the SU8 overshooting its ‘Tg’ and go upto the degradation
temperature (380°C) value. Thus a preferable usage of Si substrates is considered by
this analysis.
Fig.3.14 Comparison of absorptivity of SU-8 over Si and glass substrates
through experimental results.
3.12.4 Simulation of WGM using COMSOL modelling
Two different aspects were studied in this 2-D model, corresponding to the
aligned and misaligned cases as detailed in figure 3.7 earlier. In the aligned case the
input and output fibers were aligned axially and the distance between them was
varied from 1 ~5.5 microns. The geometry constructed while simulating in RF
module of COMSOL that demonstrated the WGM effect most prominently
happened for an ellipsoidal droplet [39] of overall diameter of 6.0 microns along the
major axis and 4.0 microns along the minor axis. Therefore it was used with a
refractive index =1.67 boundary of the SU8 and a refractive index = 1.46 of the
optical fiber for carrying out the simulations. Initially the fibers are at the two axial
ends of the microdroplet in the aligned case, so maximum distance between them is
5.5 microns, to capture the WGM based transmission of optical power inside the
droplet. This was followed by a gradual movement of the output fiber towards the
Chatper-3 Laser Heat Transmission for High Efficiency Bonding of Two Optical Fibers Using SU8 Microdroplet
56
input fiber (spatially fixed) upto an extent where the fiber almost touched each other.
The transmissibility of the input signal in all these cases is simulated and figure 3.15
(a), (b) show output of such simulations.
Figure 3.15 Simulation output of the aligned case with inter-fiber distance (a)
5.5µm (b) 4.8 micron.
In case of misaligned fibers, they were separated perpendicularly to their
axes. The fibers were initially positioned tangentially to the ellipsoidal micro-droplet
on and later manoeuvred, with input fiber fixed and the output fiber varying radially
inwards. The simulation results for the same were observed and recorded. Figure
3.16 shows a bar graph with the simulation predicted % transmittances corresponding
to figure 3.15.
The simulation output in the aligned case shows that as the inter-fiber
distance approaches the diameter of the micro-droplet there was a tremendous
increase in % transmittance between the input and output fibers almost to the extent
of 100%. At other distances of separation the overall transmittance was lower than
45 % owing to scattering effects of the microdroplet material. Similarly, in the
misaligned case the maximum % transmittance of 65% occured at an inter-fiber
distance of 2.0 microns. This separation distance brings both the fibers close to the
circumference of the ellipse. Therefore, through simulation it can be predicted that
when the interfiber spacing was matched with the WGM zone in the ellipsoidal
droplet, there was a sudden increase in % transmittance, even though the fibers are
misaligned and at a distance from each other.
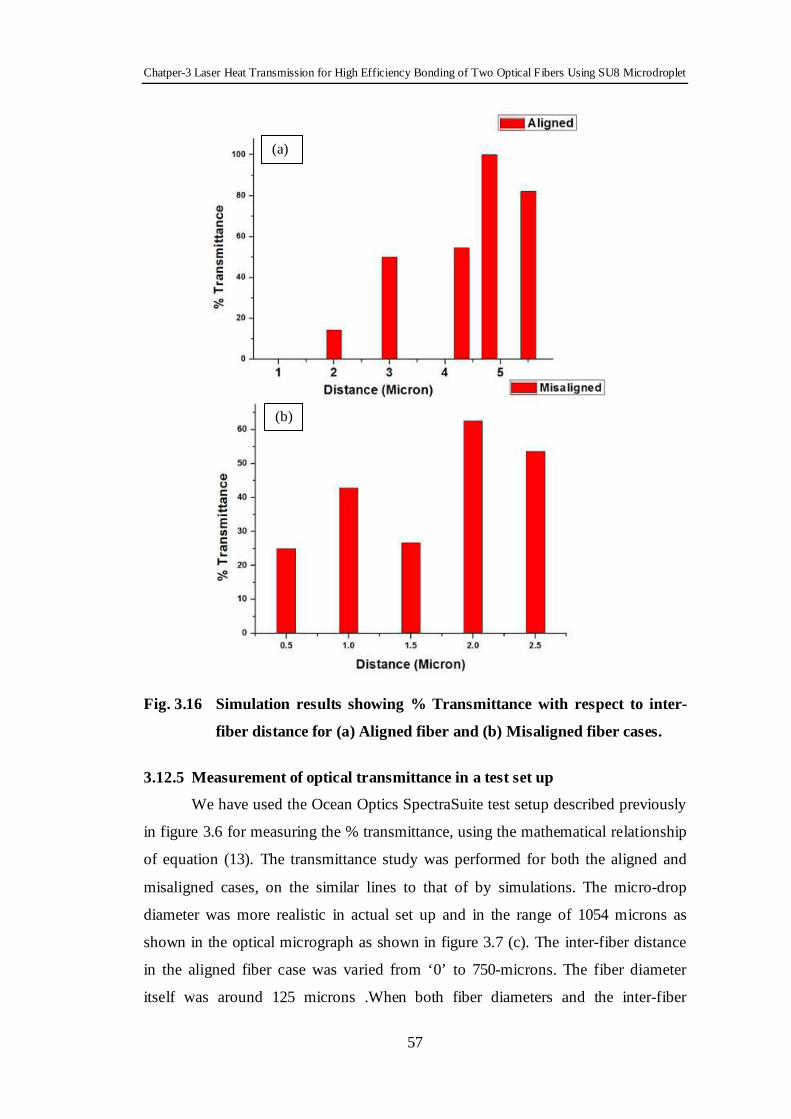
Chatper-3 Laser Heat Transmission for High Efficiency Bonding of Two Optical Fibers Using SU8 Microdroplet
57
Fig. 3.16 Simulation results showing % Transmittance with respect to inter-
fiber distance for (a) Aligned fiber and (b) Misaligned fiber cases.
3.12.5 Measurement of optical transmittance in a test set up
We have used the Ocean Optics SpectraSuite test setup described previously
in figure 3.6 for measuring the % transmittance, using the mathematical relationship
of equation (13). The transmittance study was performed for both the aligned and
misaligned cases, on the similar lines to that of by simulations. The micro-drop
diameter was more realistic in actual set up and in the range of 1054 microns as
shown in the optical micrograph as shown in figure 3.7 (c). The inter-fiber distance
in the aligned fiber case was varied from ‘0’ to 750-microns. The fiber diameter
itself was around 125 microns .When both fiber diameters and the inter-fiber
(a)
(b)
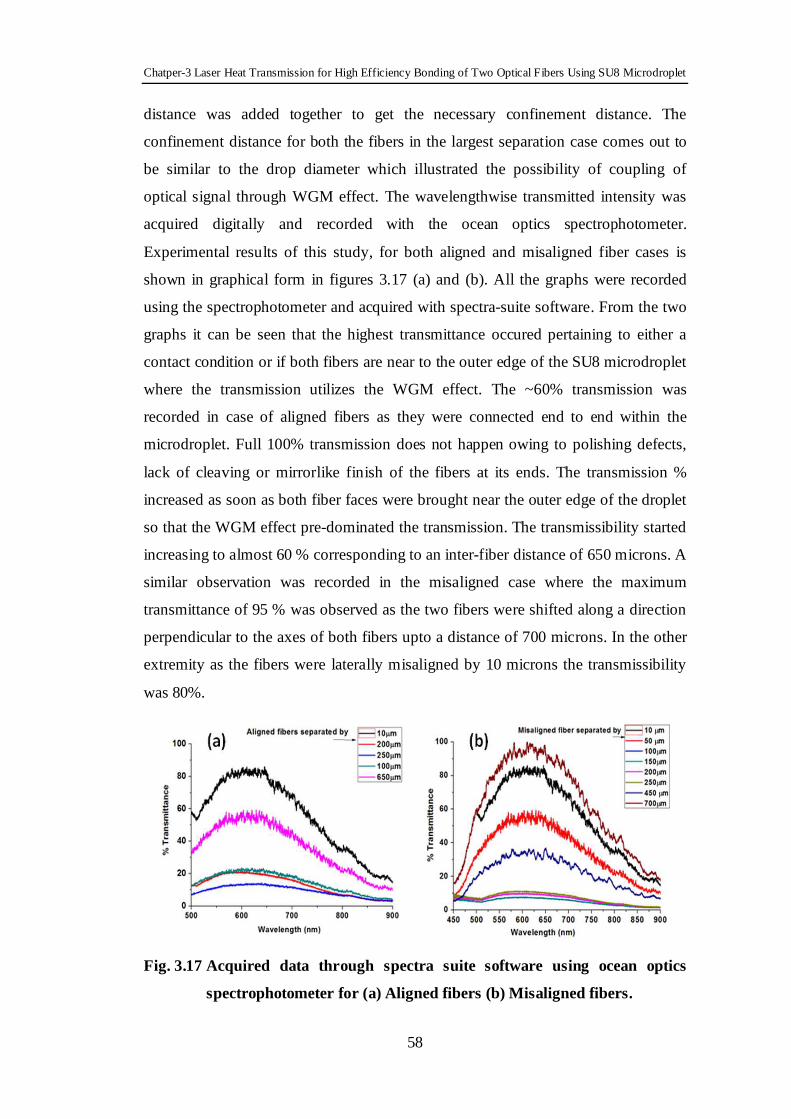
Chatper-3 Laser Heat Transmission for High Efficiency Bonding of Two Optical Fibers Using SU8 Microdroplet
58
distance was added together to get the necessary confinement distance. The
confinement distance for both the fibers in the largest separation case comes out to
be similar to the drop diameter which illustrated the possibility of coupling of
optical signal through WGM effect. The wavelengthwise transmitted intensity was
acquired digitally and recorded with the ocean optics spectrophotometer.
Experimental results of this study, for both aligned and misaligned fiber cases is
shown in graphical form in figures 3.17 (a) and (b). All the graphs were recorded
using the spectrophotometer and acquired with spectra-suite software. From the two
graphs it can be seen that the highest transmittance occured pertaining to either a
contact condition or if both fibers are near to the outer edge of the SU8 microdroplet
where the transmission utilizes the WGM effect. The ~60% transmission was
recorded in case of aligned fibers as they were connected end to end within the
microdroplet. Full 100% transmission does not happen owing to polishing defects,
lack of cleaving or mirrorlike finish of the fibers at its ends. The transmission %
increased as soon as both fiber faces were brought near the outer edge of the droplet
so that the WGM effect pre-dominated the transmission. The transmissibility started
increasing to almost 60 % corresponding to an inter-fiber distance of 650 microns. A
similar observation was recorded in the misaligned case where the maximum
transmittance of 95 % was observed as the two fibers were shifted along a direction
perpendicular to the axes of both fibers upto a distance of 700 microns. In the other
extremity as the fibers were laterally misaligned by 10 microns the transmissibility
was 80%.
Fig. 3.17 Acquired data through spectra suite software using ocean optics
spectrophotometer for (a) Aligned fibers (b) Misaligned fibers.

Chatper-3 Laser Heat Transmission for High Efficiency Bonding of Two Optical Fibers Using SU8 Microdroplet
59
Therefore, in conculsion, the micro-droplet method using SU8 photo-resist
and aligned fibers, followed by laser machining shown in the above work ideally
offers a good methodology for optical tagging and joining of standalone optical
fibers to furnish high transmittance even if the fibers were in misaligned orientation.
3.13 Future Scope
The methodology discussed above when supported by smaller (diameter <
350 microns) SU8 droplets over the two fibers or fiber-waveguide-fiber, may
provide improved and optimized solutions for signal transmission and sensing of
biological entities.
3.14 Conclusion
Through this work, we have attempted to explore and develop a new
technique to tag optical fibers on the surface of a substrate with the aid of SU8
microdroplet and CO2 laser source. The exposure parameters of the laser machine
were optimized in such a way that the SU8 material very close to the substrate
melted locally up to several layers due to heat reflux from the surface of the
substrate. This melt then resolidified to ensure a good bond between the fibers,
droplet and the surface. It was further ensured through heat transfer simulations that
the fiber or SU8 are not degraded while getting heated. The DOE factors are lasing
speed and lasing power with single objective of Transmittance. The optimization
process gives optimized values of these laser machine parameters with the
mathematical model set on least square techniques. Speed /power = 52/1 was
obtained for transmittance of 0.792. The stitched or bonded optical fiber was then
extensively evaluated for % transmittance or optical characteristics when input light
was transmitted through the SU8 microdrolet to the output fiber. It was observed
through simulations as well as experiments that the fibers demonstrated high
transmissibility in two circumstances. One is in which the fiber is completely
connected end to end. In the other configuration the fiber ends were shifted away
from each other till they come very close to the outer surface of the drop where due
to the WGM effect the transmissibility was found to increase. The method was
further evaluated for aligned and misaligned fibers and transmissibility was found to
have similar behaviour in both the cases. Thus the work ascertains that optimized
laser beam exposed SU8 micro-droplet can be used to couple two or more optical
fibers maintaining an overall high level of optical coupling efficiency.
Chatper-3 Laser Heat Transmission for High Efficiency Bonding of Two Optical Fibers Using SU8 Microdroplet
60
Reference
1. Book: Maria L. Calvo, Vasudevan Lakshminarayanan ,“ Optical
waveguides: from theory to applied technologies”, CRC Press Taylor and
Francis Group.
2. M.B.Frish, J. Fijol, E.E. Fike, S.A. Jacobson, P.B. Keating, W. J. Kessler, J.
LeBlanc, C. Bozler, M. Fritze, C. Keast, J. Knecht, R. Willamson, C.
Manolatou, “ Coupling of single mode fibers to planar Si Waveguides using
vertically tapered mode converters ”.
3. X.Chen, C.Li, C.K.Y.Fung, S.M.G. Lo, H.K.Tsang , “ Apodized waveguide
grating couplers for efficient coupling to optical fibers”, IEEE PHOTONICS
TECHNOLOGY LETTERS 22 15 2010.
4. Technical Support 1.800.BELDEN.1 www.belden.com
5. Zhigang Chen and Allen Taflove, "Highly efficient optical coupling and
transport phenomena in chains of dielectric microspheres", optics letters,
2006, Vol. 31, No. 3.
6. Shih Hao Huang, Fan Gang Tseng, "Development of a monolithic total
internal reflection-based biochip utilizing a micro-prism array for
fluorescence sensing", Journal of Micromechanics and Micro engineering,
2005,15, 2235–2242.
7. Amnon Yariv," Critical Coupling and Its Control in Optical Waveguide-Ring
Resonator Systems", IEEE photonics technology letters,2002, vol. 14, No. 4.
8. Stephen R. Friberg And Peter W. Smith, "Nonlinear Optical Glasses for
Ultrafast Optical Switches", IEEE Journal Of Quantum Electronics, 1987,
Vol. Qe-23, No. 12.
9. Hirohito Yamada, Analysis of Optical Coupling for SOI Waveguides, Piers
Online, Vol. 6, No. 2, 2010 165.
10. Erik pennings, Giok - Djan Khoe, Meint K. Smit, Toine Staring, "Integrated
- optic versus Microoptic devices for Fiber-optic telecommunication
systems: A comparison ", IEEE Journal of selected topics in quantum
electronics, vol. 2, No. 2, June 1996.
Chatper-3 Laser Heat Transmission for High Efficiency Bonding of Two Optical Fibers Using SU8 Microdroplet
61
11. Bambang Kuswandi, Nuriman, Jurrian Huskens, Willem Verboom, "Optical
sensing systems for microfluidic devices; A review", Analytica Chimica
Acta 60I 2007 141-155.
12. Liang Tang, Yongjie Ren , Bin Hong , Kyung A. Kang, " Fluorphore -
mediated , fiber-optic , multianalyte, immunosensing system for rapid
diagnosis and prognosis of cardiovascular diseases" , SPIE, Journal of
Biomedical optics, vol 11, Issue 2, 2006.
13. Simin Mehrabani , Ashley J. Maker , Andrea M. Armani, " Hybrid integrated
label - free chemical and biological sensors" , Sensors, 2014, 14, 5890 –
5928
14. Z. Wang, N. Chocat, "Fiber-Optic Technologies in Laser-Based
Therapeutics: Threads for a Cure", Current Pharmaceutical Biotechnology,
Volume 11, Number 4, 2010, pp. 384-397(14)
15. Gorden E. Moore, “Lithography and the future of Moore's law”, Proc. SPIE
2440, Optical/Laser Microlithography VIII, 2 ,May 26, 1995.
16. D.Hulsenberg, A.Hamisch, A. Bismarck,”Microstructuring of glasses”,
Springer Series in material science.
17. Patent: WO 2012094737 – “Laser reinforced direct bonding of optical
components”.
18. Domański R., Jaworski Μ.," Laser beam interaction with solid materials
coated by layers with micron thickness", Archives of Thermodynamics.
1989, Vol. 10, No. 1-2.
19. A.J.C. Grellier, N.K. Zayer, C.N. Pannell, “Heat transfer modeling in CO2
laser processing of optical fibers”,Optics Communications,1998, 152 (4-6).
pp. 324-328A.
20. Helebrant, C. Buerhop, R. Weiβmann, “Mathematical modelling of
temperature distribution during CO2 laser irradiation of glass”, Glass
Technology, 1993.

Chatper-3 Laser Heat Transmission for High Efficiency Bonding of Two Optical Fibers Using SU8 Microdroplet
62
21. G.Casalino, E.Ghorbel, “Numerical model of CO2 laser welding of
thermoplastic polymers”, Volume 207, Issues 1–3, 16 October 2008, Pages
63–71.
22. S Z Shuja, B S Yibas, O Momin,“ Laser heating of a moving slab: Influence
of laser intensity and scanning speed on temperature field and melt size”,
Optics and Lasers in Engineering, 01/2011; 49.
23. Bappa Acherjee, Arunanshu Kaur, Soren mitra, Dipen Misra, “Finite element
simulation of laser transmission welding of dissimilar materials between
Polyvinylidene fluoride and titanium”, International Journal of Engineering,
Science and Technology, 2010.
24. J.Melai, C. Salm, S. Smith, J. Visschen, J.Schmitz, “The electrical
conduction and dielectric strength of SU8”, Journal of micromechanics and
microengineering, 2009.
25. Rekhviashvili. et.al. “Modelling of laser pulse heating of solid dielectric with
a fractal structure”, American Journal of Condensed Matter Physics, 2012.
26. M.Ilie, E. Cicala , D. Grevey, S. Maltei, V. Stoica , “ Diode laser welding of
ABS : experiments and process modeling ”, Optics And Laser Technology
41, 5 (2009) 608-614
27. Mirko Aden, Andreas Roesner, Alexander Olowinsky, "Optical
Characterization of Polycarbonate: Influence of Additives on Optical
Properties", Journal of Polymer Science: Part B: Polymer Physics, Vol. 48,
451–455 (2010)
28. Ching Yen Ho, Moa – Yu Wen, Chung Ma, “Computer simulation for laser
welding of thermoplastic polymers”, International Conference on Computer
Engineering and Applications, 2010.
29. Chao Yi Tai, Bayram Unal, James S. Wilkinson, Mohamed A. Ghanem,
Philip N. Barlett, "Optical coupling between a self assembled microsphere
grating and rib waveguide", Applied Physics Letters,2004, Vol. 84, No.18.
30. Tjioe, Fidelia,"Evaluation of optical solder for fiber-to-waveguide coupling
in silicon photonics", http://hdl.handle.net/1721.1/45352
Chatper-3 Laser Heat Transmission for High Efficiency Bonding of Two Optical Fibers Using SU8 Microdroplet
63
31. Victor Nguyen, Trisha Montalbo, Christina Manolatou, Anu Agarwal,
Ching-yin Hong, John Yasaitis, L. C. Kimerling, and Jurgen Michel, "Silicon
based highly efficient fiber to waveguide coupling for high index contrast
systems", Applied physics letters, 2006, Vol.88, p.081112.
32. Shengfei Feng, Xinping Zhang, Hao Wang, Mudi Xin, Zhenzhen Lu," Fiber
coupled waveguide grating structures ", Applied physics letters, 96, 133101
(2010).
33. Santeri Tuomikoski, Sami Franssila, "Free- standing SU-8 microfluidic chips
by adhesive bonding and release etching ", Sensors and Actuators A 120
(2005) 408-415.
34. Jasbir Patel, Bozena Kaminska, Bonnie Gray, Byron Gates, "PDMS as a
sacrificial substrate for SU-8 based biomedical and microfluidic
applications" , Journal of Micromechanics and Microengineering 18 (2008)
095028 (11pp) .
35. Don McMasters, M.L. Gillette, "Approximating Avogadro's number using
glass beads and monomolecular film",Chemical education resources,Inc.
36. Blanco F J, Agirregabiria M, Garcia J et al. Novel three-dimensional
embedded SU-8 microchannels fabricated using a low temperature full wafer
adhesive bonding. J. Micromech. Microeng. 14 (2004), 1047–1056.
37. A. Kumar, et al. “Optimization of laser machining process for the
preparation of photomasks, and its application to microsystems fabrication”,
J. Micro/Nanolith. MEMS MOEMS. 12(4), 041203, 2013.
38. Richard Grzybowski, Stephan Logunov, Alexander Streltsov and James
Sutherland, "Extraordinary laser-induced swelling of oxide glasses", Optics
Express, Vol. 17, Issue 7, pp. 5058-5068 (2009).
39. Seema Yardi, D.Boolchandani, Shantanu Bhattacharya, "Polymer
Waveguide and Optical Fiber Coupling Using Whispering Gallery Modes in
an Elliptical Micro- Sleeve", Optics in the Life Sciences Congress Technical
Digest ©2013 The Optical Society (OSA).

Chatper-3 Laser Heat Transmission for High Efficiency Bonding of Two Optical Fibers Using SU8 Microdroplet
64
40. Ru Feng and Richard J Farris, “Influence of processing conditions on the
thermal and mechanical properties of SU8 negative photoresist coatings”, J.
Micromech. Microeng. 13 (2003) 80–88.
41. Installation and Operation Manual, Document Number 000-20000-300-02-
201110, SpectraSuite® Spectrometer Operating Software.
42. P. Lucas, M.R. Riley, C. Boussard-Plédel, B. Bureau, Anal. Biochem. 351
[1] (2006) 1-10.
43. R.Muller, D. Cristea, M. Kusko, P. Obreja, D. Esineco, V. Damian, P.C.
Logofatu, SU8 Polumer materials used in Intgrated Optic Microsystems ”,
Optoelectronics and Advanced materials –Rapid Communictions Vol. 4, No.
2, February 2010.
44. Sivarao, Shukor, T.J.S.Anand & Ammar, “ DOE Based Statistical
Approaches in Modeling of Laser Processing – Review & Suggestion ”,
International Journal of Engineering & Technology IJET-IJENS Vol:10
No:04 1 101304-8787 IJET-IJENS © August 2010 IJENS I J E N S.
Chapter 4 Interaction of Biomolecules with Solid Polymeric Surfaces of SU8
Microdroplet and Porous Fluorescent PDMS: Its Utility
in Optical Bio-sensing

Chatper-4 Interaction of Biomolecules with Solid Polymeric Surfaces of SU8 Microdroplet and Porous…
65
Chapter 4 Interaction of Biomolecules with Solid Polymeric
Surfaces of SU8 Microdroplet and Porous Fluorescent PDMS: Its Utility in Optical Bio-sensing 4.1 Introduction
It is vital to associate, incessant research activity in the field of interaction of
biomolecules on solid surfaces and molecular substrates; to the growth of industries
like clinical diagnostics, food, pharmaceutical, biomedical, biomaterials and
biotechnology. The applications and strategies of immobilisation of innumerable
small, intermediate and complex biomolecules on the solid surfaces; is as diverse as
the two groups of reactants involved. The nature of the required bioactive or passive
surfaces may be ranging from antifouling, protein resistant, highly resistive of
nonspecific adsorption of biomolecules, to extremely sensitive surface of protein
microarrays. Surface modification or functionalization is required to condition the
desired substrate according to the nature of handling and application of the target
biomolecules.
A sensitive substrate deciphers reduced sample loss caused due to non-
specific adsorption, increased performance and sensitivity, reduced possibility of
contamination in the re-run of the samples using same devices, reduced
inflammation or contamination in the body implants, food products. Select strategies
of surface modification of hydrophobic and hydrophilic solid polymeric substrates
for attaching bioactive molecules with protein resistant or protein specific
antifouling surfaces are discussed in this chapter. Nature has a way of providing
simple solutions to intricate problems. Researchers always come across clean,
efficient and biomimmetic concepts to put forth, solutions of which bring the nature
closer to our lives and also help provide steps to conserve environment in general.
Over decades semiconductors have ruled the world of communication, electronics
and sensing. Optical fibers made of SiO2 were the backbone of world wide network
for communication, called optical communication network. Thus dielectric materials
have replaced the Cu and other metals due to scaling down technologies and need of
insulating materials with low-K [dielectric constant] values in ever decreasing

Chatper-4 Interaction of Biomolecules with Solid Polymeric Surfaces of SU8 Microdroplet and Porous…
66
feature sizes on microchips. Optical fibers made of SiO2, offer high bandwidth,
independent of the cable size, low attenuation, low electromagnetic interference,
crosstalk; are light in weight, suitable for long distance communication at
comparatively lower cost. Optical fibers are now available with compositions of part
SiO2 and Polymer or only polymer. Polymer optical fibers [POF] provide higher
tensile strength, operate in visible range and they can be produced at a lower cost.
They are widely used in industries and medical instruments inspite of having higher
loss. Research is carried on, Cu wiring being widely replaced by POF. Polymers are
also slowly finding their ways in optical devices like waveguides, optical
components, sources and detectors. Research is carried out on functionalizing or
modifying polymer surfaces to suit the conditions for sensing of biological entities.
Yet there is a need to study a solid state polymer based sensor which is flexible and
adaptable to the application situation.
In this chapter we have elaborately discussed prospects of bio-sensing in
following materials:
A. The ongoing work on two optical sensors in biological applications, Optical
fiber and ring resonator or microspheres. In our work discussed here, we are
presenting two types of SU8 microdroplets, with and without bonded fibers,
being used as optical and biosensors. SU8 material is biocompatible, has
excellent optical characteristics and a proven microfabrication material. The
farication method, functionalization and immobilization methods are kept
simple to provide a clean, biomimmetic and efficient solution to the sensing
issues. Although very few characterization methods are available for 3-D
structures, we have attempted to use Fluorimetry for sample solution based
sensing and Spectra Suite Ocean Optics spectrometer for chip based sensing
using fiber bonded microdroplets. Further both types of microdroplets can be
extracted from substrate and used in most unusual and novel ways to suit the
application.
Fluorescence microscopy is used wherever possible. We believe that the
whispering gallery mode [WGM] phenomenon is occurring inside the elliptical or
circular shaped microdroplets, based on the experiments and analysis of these
devices. The devices are not perfect spheres or ellipsoids, so any mathematical,

Chatper-4 Interaction of Biomolecules with Solid Polymeric Surfaces of SU8 Microdroplet and Porous…
67
analytical or theoretical analysis will be highly complex which need involved
computing and simulating facilities.
Both labeled and labelfree sensing can be experimented with suitable
pretreatment. Various experiments were carried out using different concentrations of
ethanol, Bovine Serum Albumin [BSA] samples, Dye doped E-Coli and GFP tagged
E-Coli cell samples. This work reviews strategies of surface modification,
previously used for epoxy based, negative photoresist SU8 material and relates them
to the SU8 microdroplet surface modification for waveguide bonding and optical
bio-sensing application. Surface modification for protein immobilisation is explored
for standalone SU8 microdroplets, which are detached and treated suitably for
biosensing in sample solution, microscopy detection, can be flown in opto-micro-
biofluidic channels, wells, for optical biosensing in a microfluidic reaction chamber.
The surface immobilisation techniques are also applied on on- chip SU8
microdroplets used for bonding two optical waveguides on a microchip and sensing
the biomolecular activities on its domelike surface.
B. In this work a novel bio-material is reported. It is a micro-porous fluorescent
PDMS material with PDMS [Poly dimethyl siloxane] and Acridine Orange
[AO] dye as its major constituents. PDMS is biocompatible with applications
in fabrication of lab-on-chips, in bioseparation and in microfabrication. It is
an artificial polymer with methyl groups and repeating silicon to oxygen
bonds. Properties of PDMS material are oxygen permeability, non-toxicity
and blood compatibility.
This new material is physically and characteristically dissimilar from the two
combining bio-materials mixed in soft-lithography process. A range of
characterization techniques, such as SEM, UV–VIS spectroscopy, Fluorescence
microscopy, SpectraSuite optics signal setup, support the novel attributes of the
material. Although extensive literature survey was done, it provided no references
for a similar microstructure.
Chatper-4 Interaction of Biomolecules with Solid Polymeric Surfaces of SU8 Microdroplet and Porous…
68
A Exploring use of Biocompatible photoresist SU8 material as a
biosensor
4.2 Need to Study Interaction of Biomolecules on Solid Surfaces
We are surrounded in nature by objects, materials, surfaces, liquid bodies
which are susceptible to reactions with an assortment of bioactive molecules. The
behaviour of these entities, which are in abundance, when they come in contact with
an internal body implant or above mentioned substrates, is a reason why we need to
study their interaction with these surfaces. This study has been recognized and found
responsible for the steady development in the field of sensors, detectors, food
packaging and processing industries, textile and pharmaceutical units, biomedical
and biotechnology laboratories. Individual molecules like antibodies, peptides,
enzymes, nucleic acids are included in the broad term biological entities along with
complex, independent, viable biological entities like viruses, cells, spores, bacteria.
Proteins and enzymes are known to have affinity towards specific targets which
make it characteristic recognition behaviour. Normally oriented and randomized
strategies of immobilisation are broadly considered. First is covalent strategy which
provides enhanced biological activity and reduced signa - to - noise ratio, whereas
second one is a covalent or other strategy which leads to reduced protein
functionality and stability. The areas which are most affected due to non-specific
adsorption and binding of biomolecules or colonization of microorganisms into
formation of bio-films are biological implants, food packaging and hospital supplies.
These are known to lose their sensitivity and performance resulting into
inflammation, infection or contamination. It is of high level of importance in
diagnostic devices, to know the adhesion or immobilization behaviour of proteins
and DNA in varied system matrices.
Researchers need strong, robust, sensitive biomarkers in early detection of
life threatening diseases. Biomarkers decipher an act of separation of cells, DNA,
proteins from samples, body fluids, blood. Other methods involve controller beads,
resins, filters to attract or process desired biomolecules. Surface functionalization or
modification; involve processing of the surface to suit chemical interaction with
specific biomolecules for its surface immobilization. Thus it is vital to know, effect

Chatper-4 Interaction of Biomolecules with Solid Polymeric Surfaces of SU8 Microdroplet and Porous…
69
of micro-organisms, their types, behaviour in known, standard environment;
specificity of the surfaces to these molecules to gain control in their detection.
4.3 Solid Polymeric Surface modification for Biomolecule Interaction
Once it is established that biomolecules bind to surfaces naturally or in
chemically induced situation and cause undesired, unprecedented nuisance, if their
properties are not known or behaviour not predicted in advance. It becomes essential
to study them, analyse their adhesion chemistry and prepare surfaces accordingly to
capture them in unknown sample matrix. Surface immobilization of specific
analytes on a solid surface need modification to suite its surface chemistry with
specific biomolecule. Four chemical binding or coupling strategies in connection
with biomolecules are
1. Adsorption 2. Encapsulation
3. Entrapment 4. Covalent bonding
It is essential that biomedical polymers are biocompatible to have surface
interaction with biological systems. Polymer materials are considered to be capable
of reducing nonspecific interactions and enhancing specific adsorptions in a
biological complex. A polymer –organism is best mediated by proteins which play
vital role in every biological entity. Protein is a natural biopolymer and it consists of
group of amino acids. Thus both protein, polymer are complex and their interaction
is extremely complicated. Each amino acid or peptide residue has general backbone
structure of (–NH–CαHR–CO–) in which R denotes a specific side-group structure
enabling the chain to have specific functional characteristics. The amino acids may
have side chains of phosphates and oligosaccharides or lipids and formulate the
monomeric units of complex protein chain. Figure 4.1 shows the side chains of the
20 naturally occurring amino acids [1]. It can be seen that, typically the ‘R’ group is
characterized into different categories such as nonpolar, polar, negatively charged or
positively charged amino acids. These different functional groups make it highly
amphiphilic. Three main chemical strategies which govern solid polymeric
hydrophobic or hydrophilic surface interaction with proteins are adsorption, covalent
bonding and absorption. The small and rigid proteins like Lysozyme, β-
Lactoglobulin are more immune to structural alteration after adsorption and are
regarded as ‘hard’ proteins [2-4].
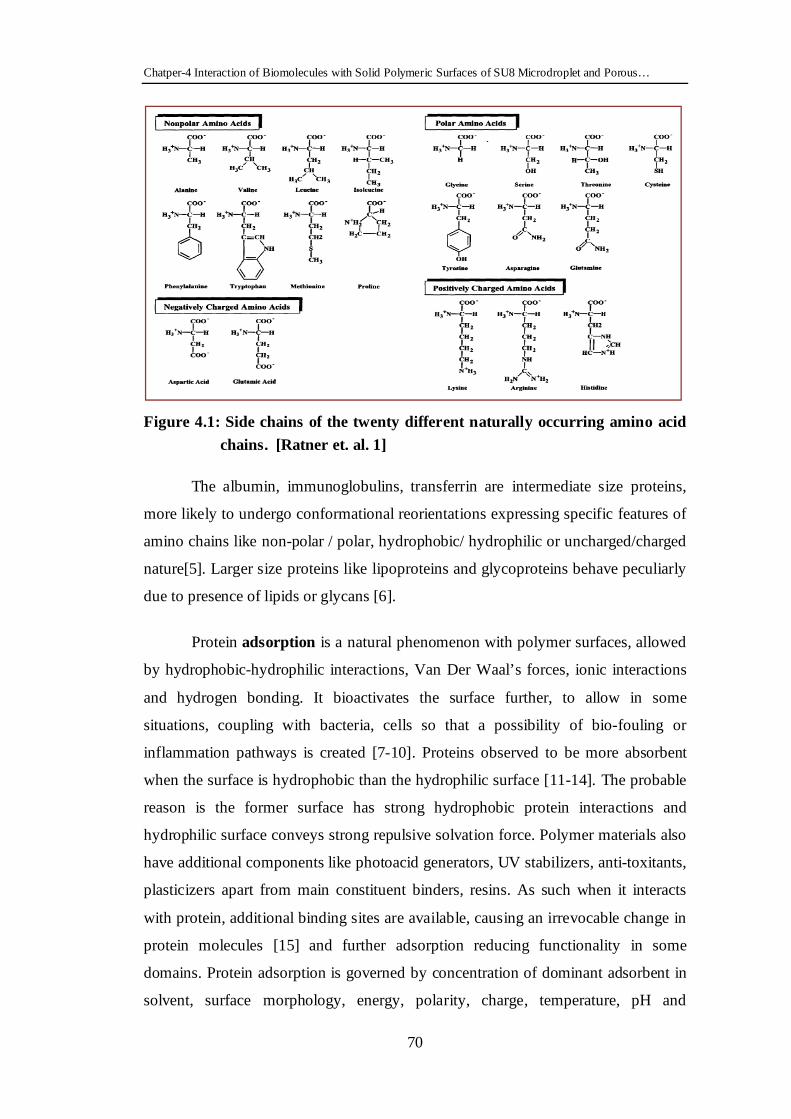
Chatper-4 Interaction of Biomolecules with Solid Polymeric Surfaces of SU8 Microdroplet and Porous…
70
Figure 4.1: Side chains of the twenty different naturally occurring amino acid
chains. [Ratner et. al. 1] The albumin, immunoglobulins, transferrin are intermediate size proteins,
more likely to undergo conformational reorientations expressing specific features of
amino chains like non-polar / polar, hydrophobic/ hydrophilic or uncharged/charged
nature[5]. Larger size proteins like lipoproteins and glycoproteins behave peculiarly
due to presence of lipids or glycans [6].
Protein adsorption is a natural phenomenon with polymer surfaces, allowed
by hydrophobic-hydrophilic interactions, Van Der Waal’s forces, ionic interactions
and hydrogen bonding. It bioactivates the surface further, to allow in some
situations, coupling with bacteria, cells so that a possibility of bio-fouling or
inflammation pathways is created [7-10]. Proteins observed to be more absorbent
when the surface is hydrophobic than the hydrophilic surface [11-14]. The probable
reason is the former surface has strong hydrophobic protein interactions and
hydrophilic surface conveys strong repulsive solvation force. Polymer materials also
have additional components like photoacid generators, UV stabilizers, anti-toxitants,
plasticizers apart from main constituent binders, resins. As such when it interacts
with protein, additional binding sites are available, causing an irrevocable change in
protein molecules [15] and further adsorption reducing functionality in some
domains. Protein adsorption is governed by concentration of dominant adsorbent in
solvent, surface morphology, energy, polarity, charge, temperature, pH and
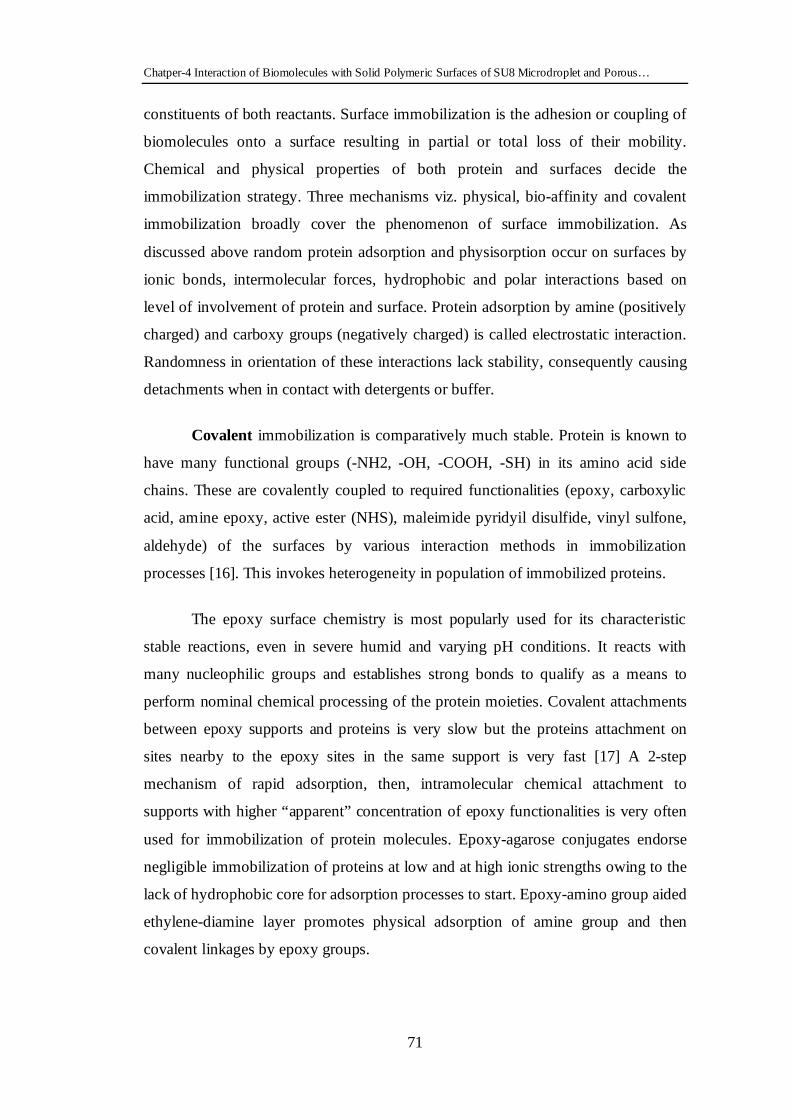
Chatper-4 Interaction of Biomolecules with Solid Polymeric Surfaces of SU8 Microdroplet and Porous…
71
constituents of both reactants. Surface immobilization is the adhesion or coupling of
biomolecules onto a surface resulting in partial or total loss of their mobility.
Chemical and physical properties of both protein and surfaces decide the
immobilization strategy. Three mechanisms viz. physical, bio-affinity and covalent
immobilization broadly cover the phenomenon of surface immobilization. As
discussed above random protein adsorption and physisorption occur on surfaces by
ionic bonds, intermolecular forces, hydrophobic and polar interactions based on
level of involvement of protein and surface. Protein adsorption by amine (positively
charged) and carboxy groups (negatively charged) is called electrostatic interaction.
Randomness in orientation of these interactions lack stability, consequently causing
detachments when in contact with detergents or buffer.
Covalent immobilization is comparatively much stable. Protein is known to
have many functional groups (-NH2, -OH, -COOH, -SH) in its amino acid side
chains. These are covalently coupled to required functionalities (epoxy, carboxylic
acid, amine epoxy, active ester (NHS), maleimide pyridyil disulfide, vinyl sulfone,
aldehyde) of the surfaces by various interaction methods in immobilization
processes [16]. This invokes heterogeneity in population of immobilized proteins.
The epoxy surface chemistry is most popularly used for its characteristic
stable reactions, even in severe humid and varying pH conditions. It reacts with
many nucleophilic groups and establishes strong bonds to qualify as a means to
perform nominal chemical processing of the protein moieties. Covalent attachments
between epoxy supports and proteins is very slow but the proteins attachment on
sites nearby to the epoxy sites in the same support is very fast [17] A 2-step
mechanism of rapid adsorption, then, intramolecular chemical attachment to
supports with higher “apparent” concentration of epoxy functionalities is very often
used for immobilization of protein molecules. Epoxy-agarose conjugates endorse
negligible immobilization of proteins at low and at high ionic strengths owing to the
lack of hydrophobic core for adsorption processes to start. Epoxy-amino group aided
ethylene-diamine layer promotes physical adsorption of amine group and then
covalent linkages by epoxy groups.

Chatper-4 Interaction of Biomolecules with Solid Polymeric Surfaces of SU8 Microdroplet and Porous…
72
Another important group of surfaces is photoactive surfaces.
Photolithography was applied in spatially-directed fabrication of oligonucleotide
arrays on selective surfaces using photolabile protecting groups [18, 19]. This photo-
reaction strategy is a well-organized and quick one-step reaction with no
functionalization requirement of target molecules. It can be utilized for biomolecules
which lacks sufficient active functional groups. The reaction needs moderate
surrounding conditions and is unaffected by temperature and pH conditions.
Photoactive reactions confer biocompatible surfaces. The common photo-reagents
such as diazirines, arylazides and benzophenones are activated by photolysis via
incident light of wavelengths ≥350 nm, but most of the other biomolecules are
transparent. Arylazides on photolysis are converted into reactive nitrene
intermediates which can be inserted into C-H bond. It provides slow binding.
Diazirines upon photolysis creates reactive carbenes which act in response with
proteins within microseconds forming covalent chemical bonds. An irreversible
linkage between the proteins and surfaces is generated, thus enhancing the molecular
immobilization. Nitrobenzyl linker provides the attachment of labile chemical
groups which on UV exposure generates CO2, freed reactive groups, ketone and
CO2.
Bio-affinity immobilization is creation of biochemical affinity-bonds of a
certain group of protein sequence (e.g. biotin, histidine, carbohydrate residue etc.)
with the activated substrate (e.g. avidin, lectin, metal chelates etc.). It has benefit of
having oriented and homogeneous immobilization of biomolecules on the surfaces.
Proteins can be detached from the surface and the same surface can be reused for
other purposes. Clinical and biomedical microdevices are required to be
characterized to have chemically inert surfaces to avoid non-specific adsorption of
proteins. Antifouling surfaces are highly protein resistant surfaces. Polymer surfaces
are passivated and made resistant to adsorption of proteins or adhesion of cells with
the treatment of PEG Poly (ethylene glycol).
4.4 Surface Modification Techniques of Solid Polymeric Surfaces
Solid polymeric surfaces can be modified with plasma or chemical treatment.
In plasma modification there are two categories:
1. Exposure to gas plasma for physical or chemical surface alteration
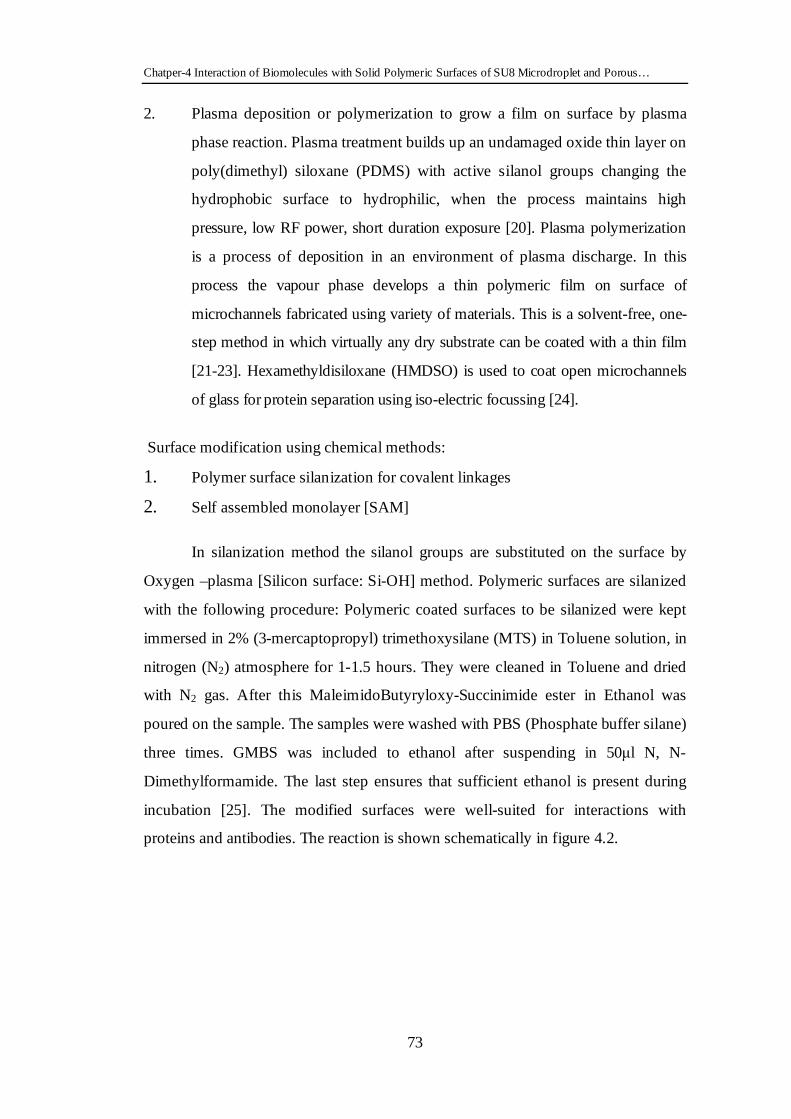
Chatper-4 Interaction of Biomolecules with Solid Polymeric Surfaces of SU8 Microdroplet and Porous…
73
2. Plasma deposition or polymerization to grow a film on surface by plasma
phase reaction. Plasma treatment builds up an undamaged oxide thin layer on
poly(dimethyl) siloxane (PDMS) with active silanol groups changing the
hydrophobic surface to hydrophilic, when the process maintains high
pressure, low RF power, short duration exposure [20]. Plasma polymerization
is a process of deposition in an environment of plasma discharge. In this
process the vapour phase develops a thin polymeric film on surface of
microchannels fabricated using variety of materials. This is a solvent-free, one-
step method in which virtually any dry substrate can be coated with a thin film
[21-23]. Hexamethyldisiloxane (HMDSO) is used to coat open microchannels
of glass for protein separation using iso-electric focussing [24].
Surface modification using chemical methods:
1. Polymer surface silanization for covalent linkages
2. Self assembled monolayer [SAM]
In silanization method the silanol groups are substituted on the surface by
Oxygen –plasma [Silicon surface: Si-OH] method. Polymeric surfaces are silanized
with the following procedure: Polymeric coated surfaces to be silanized were kept
immersed in 2% (3-mercaptopropyl) trimethoxysilane (MTS) in Toluene solution, in
nitrogen (N2) atmosphere for 1-1.5 hours. They were cleaned in Toluene and dried
with N2 gas. After this MaleimidoButyryloxy-Succinimide ester in Ethanol was
poured on the sample. The samples were washed with PBS (Phosphate buffer silane)
three times. GMBS was included to ethanol after suspending in 50µl N, N-
Dimethylformamide. The last step ensures that sufficient ethanol is present during
incubation [25]. The modified surfaces were well-suited for interactions with
proteins and antibodies. The reaction is shown schematically in figure 4.2.

Chatper-4 Interaction of Biomolecules with Solid Polymeric Surfaces of SU8 Microdroplet and Porous…
74
Fig.4.2 Schematic of silanization reaction on polymer surfaces. [J-J Chen et.al.
(25)].
4.5.1 Need to Explore Polymeric Sensors
As per discussion in chapter 2 [Simulation of coupling elliptical
microsleeve], chapter 3 [ binding and Coupling with a microdroplet ], chapter 4 [
Interaction of solid polymeric surfaces ], on various aspects of polymers used as
biosensors; need of research and efforts in exploration of possibility of role of
polymeric devices in the field of low cost, sensitive biosensing, seems evident. The
facts that polymers can be easily doped, polymer resonators can lower losses, they
were realized in microlasers, chemical sensors [75]. Polymer waveguide like
microstructures make integrated devices highly efficient, with its capacity to carry
light over a longer distance while enabling interaction of better quality between
optical signal and the host material. Polymeric materials are available in wide range,
type, cost. Fabrication of these devices is easier and optical properties are good.
They are mostly biocompatible and adapt well with the application situation. Simple
surface functionalization and immobilization methods are used for these
materials.Hence it is pertinent to study and explore the biosensing feature of
polymeric materials; SU8, a negative photoresist material in particular.
4.5.2 Related Work
It is important for researchers looking for early detection in life threatening
diseases, to identify biomarkers in sensitive and robust way, for further investigations.
Biomarkers involve separating DNA, Cells and proteins from blood, body fluid or
other samples. Conventional methods involve beads, filters, resins amongst other
controllers. They have properties to attract or process specific biomolecules. Surface
immobilization of required analytes need surface modification or functionalization

Chatper-4 Interaction of Biomolecules with Solid Polymeric Surfaces of SU8 Microdroplet and Porous…
75
to suite the chemical interaction. The chemical coupling is caused by covalent
bonding, adsorption, encapsulation or entrapment. In case of solid polymeric
surfaces, to be more precise, of epoxy based, negative photoresist SU8 material,
M.Joshi et.al. [76] used Sulfochromic solution to remove C-O bonds and instill
hydroxyl groups on the UV exposed SU8 coated surface. Amino groups were
created with silanization treatment for bonding of antibodies. Wang et. al [77 ] used
Cerium (IV) ammonium nitrate [CAN] with nitric acid or sulfuric acid on residual
epoxy groups of fabricated SU8 surface for grafting hydroxyl groups by method of
oxidation. In a detailed study [78] reports of interaction of proteins with polymer
material surfaces were seen. Blagoi et.al. [79] compared CAN treated surfaces with
bare fabricated SU8 surfaces for investigating binding kinetics of proteins. Result
according to the report was, better performance of bare SU8 surfaces, making the
process of protein immobilization simpler. In another paper [80] it was reported that
silanization was necessary in case of positive photoresist surfaces for desired protein
immobilization. Techniques of smart immobilization were discussed in a review
paper [81]. After the immobilization step it was characterized by AFM , FTIR , FT-
VIS-IR spectroscopy, stain and dye tests [82,83] for confirmation. Label free
technique of detection of protein antigen-antibody binding was preferred over
labeled technique due to sheer simplicity and rapidness of the assay. One of these
techniques was refractometric which was used in detection of proteolytic activity,
BSA antibody-antigen binding by noting the spectral shifts [84, 85] after each step.
BSA coating protects possible adherence between substrate and analyte, this
property was made use of in a novel microrobots-bioactuator to prove [86] the
concept. Bare UV exposed SU8 microcubes were selectively coated by fluorescence
tagged BSA layer to allow and observe attachment of specific bacteria cells to only
uncoated cube surfaces. Fluorescence imaging was used to see the result. Figure 4.3
shows the resultant selective binding.
Some methods of isolation of protein, DNA for biomarkers of life
threatening diseases involved functionalized microspheres, instead of conventional
methods to capture specific analyte from samples. Making of cost effective, simple
to dope silica microsphere was the research topic in the interest of highly specific
target sensing [87].
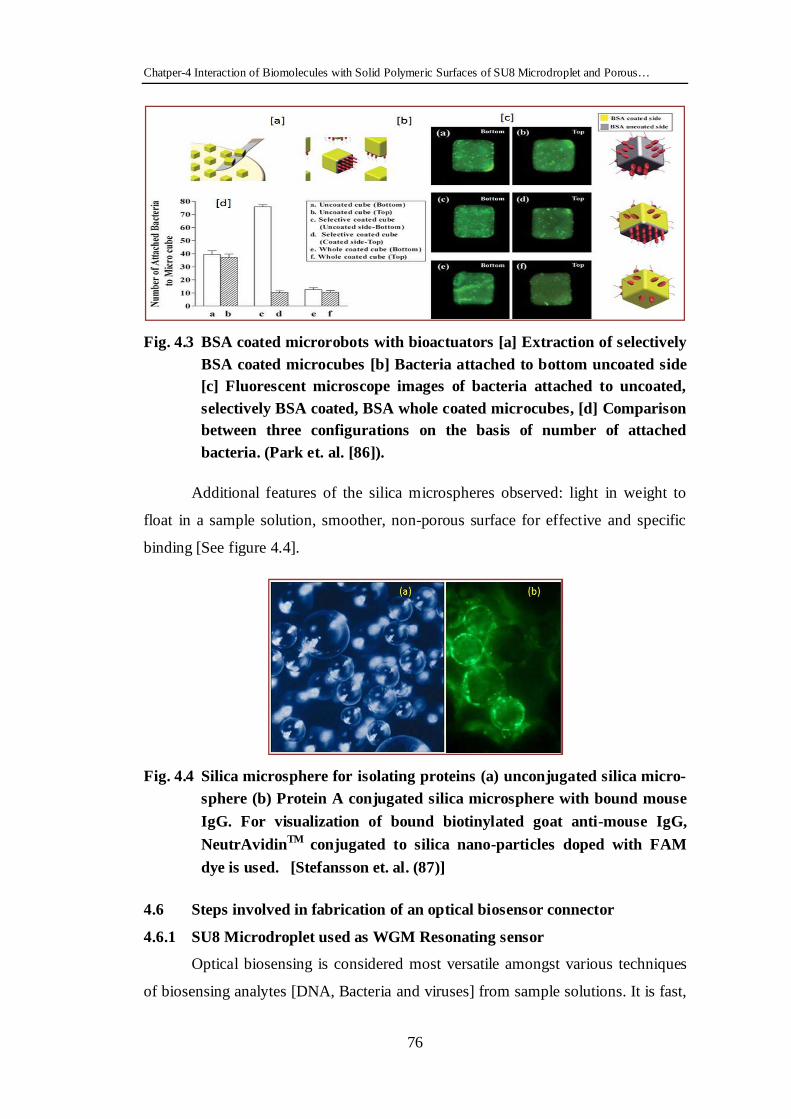
Chatper-4 Interaction of Biomolecules with Solid Polymeric Surfaces of SU8 Microdroplet and Porous…
76
Fig. 4.3 BSA coated microrobots with bioactuators [a] Extraction of selectively
BSA coated microcubes [b] Bacteria attached to bottom uncoated side [c] Fluorescent microscope images of bacteria attached to uncoated, selectively BSA coated, BSA whole coated microcubes, [d] Comparison between three configurations on the basis of number of attached bacteria. (Park et. al. [86]).
Additional features of the silica microspheres observed: light in weight to
float in a sample solution, smoother, non-porous surface for effective and specific
binding [See figure 4.4].
Fig. 4.4 Silica microsphere for isolating proteins (a) unconjugated silica micro-sphere (b) Protein A conjugated silica microsphere with bound mouse IgG. For visualization of bound biotinylated goat anti-mouse IgG, NeutrAvidin TM conjugated to silica nano-particles doped with FAM dye is used. [Stefansson et. al. (87)]
4.6 Steps involved in fabrication of an optical biosensor connector
4.6.1 SU8 Microdroplet used as WGM Resonating sensor
Optical biosensing is considered most versatile amongst various techniques
of biosensing analytes [DNA, Bacteria and viruses] from sample solutions. It is fast,
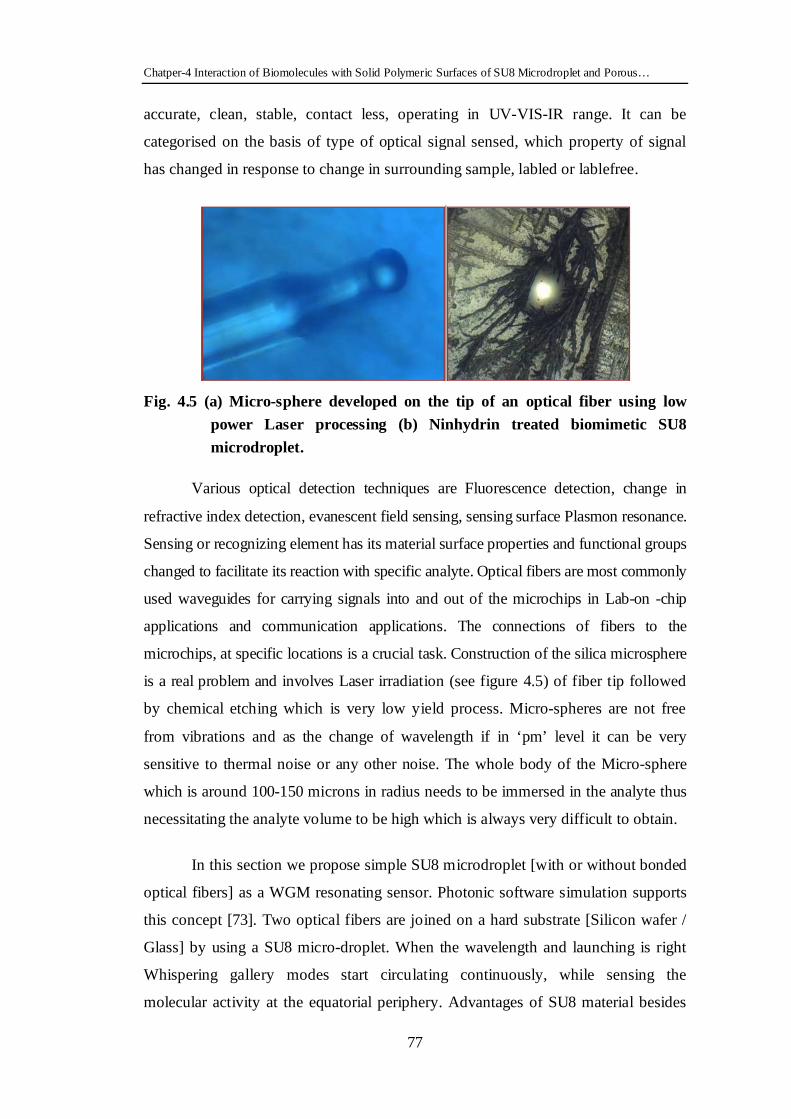
Chatper-4 Interaction of Biomolecules with Solid Polymeric Surfaces of SU8 Microdroplet and Porous…
77
accurate, clean, stable, contact less, operating in UV-VIS-IR range. It can be
categorised on the basis of type of optical signal sensed, which property of signal
has changed in response to change in surrounding sample, labled or lablefree.
Fig. 4.5 (a) Micro-sphere developed on the tip of an optical fiber using low power Laser processing (b) Ninhydrin treated biomimetic SU8 microdroplet.
Various optical detection techniques are Fluorescence detection, change in
refractive index detection, evanescent field sensing, sensing surface Plasmon resonance.
Sensing or recognizing element has its material surface properties and functional groups
changed to facilitate its reaction with specific analyte. Optical fibers are most commonly
used waveguides for carrying signals into and out of the microchips in Lab-on -chip
applications and communication applications. The connections of fibers to the
microchips, at specific locations is a crucial task. Construction of the silica microsphere
is a real problem and involves Laser irradiation (see figure 4.5) of fiber tip followed
by chemical etching which is very low yield process. Micro-spheres are not free
from vibrations and as the change of wavelength if in ‘pm’ level it can be very
sensitive to thermal noise or any other noise. The whole body of the Micro-sphere
which is around 100-150 microns in radius needs to be immersed in the analyte thus
necessitating the analyte volume to be high which is always very difficult to obtain.
In this section we propose simple SU8 microdroplet [with or without bonded
optical fibers] as a WGM resonating sensor. Photonic software simulation supports
this concept [73]. Two optical fibers are joined on a hard substrate [Silicon wafer /
Glass] by using a SU8 micro-droplet. When the wavelength and launching is right
Whispering gallery modes start circulating continuously, while sensing the
molecular activity at the equatorial periphery. Advantages of SU8 material besides
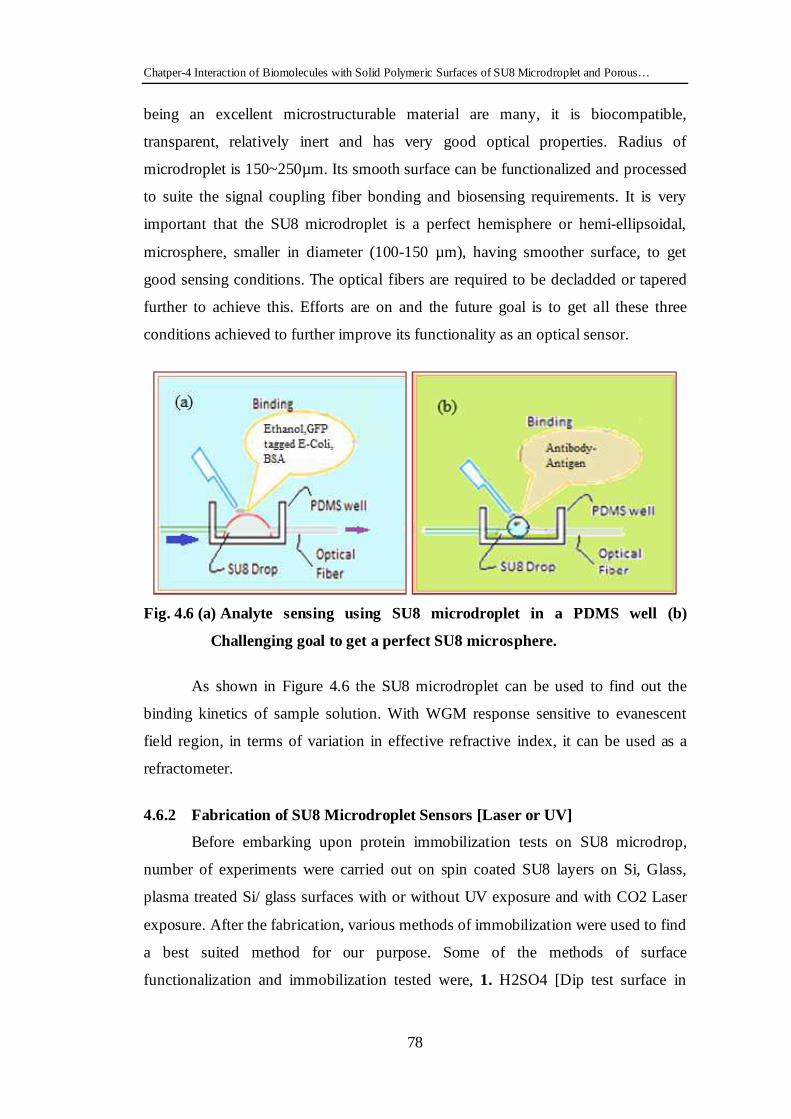
Chatper-4 Interaction of Biomolecules with Solid Polymeric Surfaces of SU8 Microdroplet and Porous…
78
being an excellent microstructurable material are many, it is biocompatible,
transparent, relatively inert and has very good optical properties. Radius of
microdroplet is 150~250µm. Its smooth surface can be functionalized and processed
to suite the signal coupling fiber bonding and biosensing requirements. It is very
important that the SU8 microdroplet is a perfect hemisphere or hemi-ellipsoidal,
microsphere, smaller in diameter (100-150 µm), having smoother surface, to get
good sensing conditions. The optical fibers are required to be decladded or tapered
further to achieve this. Efforts are on and the future goal is to get all these three
conditions achieved to further improve its functionality as an optical sensor.
Fig. 4.6 (a) Analyte sensing using SU8 microdroplet in a PDMS well (b)
Challenging goal to get a perfect SU8 microsphere.
As shown in Figure 4.6 the SU8 microdroplet can be used to find out the
binding kinetics of sample solution. With WGM response sensitive to evanescent
field region, in terms of variation in effective refractive index, it can be used as a
refractometer.
4.6.2 Fabrication of SU8 Microdroplet Sensors [Laser or UV]
Before embarking upon protein immobilization tests on SU8 microdrop,
number of experiments were carried out on spin coated SU8 layers on Si, Glass,
plasma treated Si/ glass surfaces with or without UV exposure and with CO2 Laser
exposure. After the fabrication, various methods of immobilization were used to find
a best suited method for our purpose. Some of the methods of surface
functionalization and immobilization tested were, 1. H2SO4 [Dip test surface in

Chatper-4 Interaction of Biomolecules with Solid Polymeric Surfaces of SU8 Microdroplet and Porous…
79
95% Sulphuric acid for 10sec, coat entire surface with BSA to incubate for 90 min,
rinse with Deionised water [DIW] thrice and dry with N2 gas] 2. MCPTS [Dip
surface in mixture of 2% MCPTS in Toluene for 60 min, wash with Phosphate
Buffer Saline[PBS], dip in 0.005 NDMFM in ethanol for 60 min, wash thrice with
PBS, immobilize in PBS solution of BSA overnight, wash with PBS buffer]
3. Get the SU8 surfaces UV exposed suitably.
According to the results of this exercise, it was observed that:
1. Laser treated SU8 Micro-droplets were suitable for signal coupling [Ref:
chapter 3], hence they can be easily adapted to refractometric sensing of
solutions under test with varying refractive indices.
2. UV exposed SU8 surfaces were functionalized suitably for protein
immobilization, so protein assisted or repellent [antifouling surfaces] analyte
sensing can be explored. Based on results of SU8 thin film coated surfaces,
immobilization techniques were implemented on SU8 microdroplets.
Fabrication, functionalization and immobilization procedures for both types
of microdroplet were similar; it involved manual dispension of drop using
2.5µl micropipette. In one of the methods of dispensing, X-Y-Z stage and
flow controlled dispensing pump for 1ml Syringe was used to carry out
precise and controlled dispensing. Glass slides and Si wafers were cut into
1cm size to dispense SU8 microdroplets. One set of glass slides was used for
UV exposure and treatment, other set for CO2 Laser exposure as methods of
surface functionalization .In UV exposure microdroplets on glass/ Si
substrates were preheated at 95˚C for 5min, exposed to UV light for 80 sec,
then post exposure bake was another 5min heating at 95˚C. The devices were
ready for post processing. Similarly laser exposure procedure involved
precise control on power /speed, center position, time to get perfect bond
[Ref.: Chapter 3] and sensing.
4.6.3 Extraction of SU8 microdroplets from Substrate
The work presents possibility of both stand alone and chip based sensing
scheme. The microdroplet devices can be used on the substrate or extracted to use as
independent sensing component. The extraction step may be before or after
immobilization, accordingly the substrates were heated at 80˚C for 24 hrs [87]. Then

Chatper-4 Interaction of Biomolecules with Solid Polymeric Surfaces of SU8 Microdroplet and Porous…
80
carefully they were detached from substrate with the help of a knife. Extracted or
attached micrdroplets with or without fiber bonding were then subjected to
refractometric test [CO2 Laser treated] or protein immobilization test [UV exposed].
4.6.4 Surface Immobilization
UV exposed bare SU8 microdroplets [87] were used for further processing.
Figure 4.20 shows BSA immobilisation, microdroplet removal and stain and dye
tests along with its applications. The microdroplets thus detached were tested for
bonding of E-Coli cells on selectively coated and uncoated surfaces. Microdroplets
in 3 groups were incubated with BSA for a period of 8 hours. First group had
droplets extracted from the substrate and completely immersed in BSA solution for
full coating. Second group had droplets attached and intact on the substrate. Only
top dome like surface was subjected to BSA coating. Extraction step was after
immobilization. Third group was kept aside; it was not incubated in BSA solution.
Thus there were o6 groups; attached, extracted; fully coated, partial top coated and
not coated microdroplets. These microdroplets were stored separately and marked
for reference. Now they can be flown in a channel for observation of fluorescence
effect under microscope. Figure 4.13 Shows images of various test results of these 3
groups. Some optical fiber bonded microdroplets were detached and placed in a
1cm2 PDMS [Polydimethylsilicone 10:1 curing agent after desiccation, in plastic
mould for 45 min in oven at 95˚] well for carrying out similar sensing experiment.
Thus the hemispherical microdroplets as shown in figure 4.7, 4.10, 4.12 can be used
as standalone or chip-based sensing entities.
Fig. 4.7 Method of BSA immobilisation on microdroplet [with and without optical fiber] and its applications (a) Microdroplet dispensing (b) UV exposed microdroplets (c) BSA immobilised on microdroplet surfaces (d) Microdroplets detached from substrate with heat treatment and then subjected to stain & dye test.
Chatper-4 Interaction of Biomolecules with Solid Polymeric Surfaces of SU8 Microdroplet and Porous…
81
Fiber bonded microdroplets were used to sense varying concentrations of
ethanol. In another set of experiments, BSA coating, dye doped E-Coli binding,
ninyhydrin test, AOD tests were carried out to check the sensitivity of the sensing
device.
Further Green Fluorscence Protein [GFP] tagged E-Coli was administered on
the UV exposed selectively BSA coated microdroplets to conform the protein
immobilisation sensing.
4.6.5 Characterization of the Microdroplet Sensors
As mentioned previously because of the curved nature of surface, thickness
in sub mm range and 3-D appearance, none of the conventional imaging or
characterization schemes is suitable. Being a solid state device fluorimetry method is
difficult to incorporate. Best solution was to characterize fiber bonded sensor
microdroplets with microscopy and Spectra-Suite mini spectrometer test setup for
measurement of light intensity with its array detector and supporting software. LED
sources of suitable excitation wavelengths can be used. As mentioned above only
elimentary results were obtained and spectrometer results are possible subjected to
the perfect microdroplet shape, size and smoothness. The future work entails this for
a perfect optical biosensor connector. The independent microdroplets were
characterized for detecting fluorescence intensity on attachment of GFP [Green
Fluorescence protein] tagged E.Coli on selectively BSA coated Microdroplet
surfaces [87]. Number of suitable arrangements, such as use of PDMS well,
Channels etc. can be thought of, for sensing purpose.
4.7 Some Elementary Results and Analysis
In view of the objective of making an SU8 microdroplet sensitive to thin
layers of sample solutions in its evanescent region, surface immobilization methods
were carefully selected as any chemical reactions were likely to corrode the smooth
glistening surface of the SU8 microdroplet, loosing its transparent appearance. The
immobilization procedures found suitable for thin films, were applied on fabricated
SU8 microdroplets. The tabulated results, when analysed, it was observed that UV
exposed bare microdroplets were suitable for protein immobilisation. Acridine
orange dye and Ninhydrin stain tests were carried out for confirmation. Next
Chatper-4 Interaction of Biomolecules with Solid Polymeric Surfaces of SU8 Microdroplet and Porous…
82
mobility and accessibility was checked with detachment procedure made applicable
to both, with and without fiber bonded, microdroplets [Figure 4.12 & 4.13]. The
detached selectively BSA coated microdroplets were allowed to separately interact
with small quantity of E-Coli cell solution. The results were tabulated, for ease of
understanding, the methods used for ensuring E-Coli cell binding on Microdroplet
surface. The procedure is to use one fiber bonded microdroplet to detect change in
concentration of Ethanol [0.025ml/ml to 0.825ml/ml]. The microdroplet acts as a
whispering gallery mode resonator with BLUE [446-483nm] wavelength source.
With change in concentration of sample solution in the evanescent region of the
microdroplet, effective refractive index or effective radius of the device will change,
causing a Blue shift [towards left of Visual spectrum [300-1100nm] or Red shift
[towards right of visual spectrum] of the peak output wavelength. The equation (4.1)
defining this relation is
..........……………………………….(4.1)
where λm is resonant wavelength of microdroplet , Rm is radius of micro-droplet, Nm
is refractive index of microdroplet under consideration. Proportionality sign of
equation (1) signifies that the microdroplet is not a perfect sphere, it is deformed.
The output optical signal intensity can be detected by USB 4000 array photo
detector [Mini spectrometer] and supporting software. Graphical presentation of
change in concentration of Ethanol vs wavelength in nm gives sensitivity of the
device. Further to check BSA immobilization, E-Coli cell attachment, dye and stain
test, fiber bonded microdroplet as shown in figures 4.6 can be kept in a PDMS well
for sensing spectral shift due to sample solution administration.
a. Fabrication of SU8 microdroplets
Fabrication of Silica microspheres using gas flame and CO2 Laser:
Initial efforts were concentrated on getting a perfect silica microsphere .Glass
blowing section possessed a gas flame. Figure 4.8 (a), (b) are images of silica
microspheres fabricated by melting an optical fiber tip in an extremely high
temperature gas flame. Resultant microspheres were extremely round and small
[diameter~ 374µm], very brittle. Using CO2 Laser, the microspheres were fabricated.

Chatper-4 Interaction of Biomolecules with Solid Polymeric Surfaces of SU8 Microdroplet and Porous…
83
It required high level of optimization to get moderately good, smaller [diameter
~60µm] microspheres. Fig. 4.8 (c), (d) show the microspheres.
Fig. 4.8 Silica microspheres using (a) and (b) gas flame, (c) CO2 Laser (Gold
Thin film coated) (d) CO2 Laser.
The gold thin film coating on the microsphere was deposited in a sputtering
machine. It strengthened the microsphere and reduced the brittleness.
b. SU8 Microdroplet dispensed using micropipette and syringe:
SU8 is highly viscous in nature and 1µl drop volume was initially required to
be used. Using both X-Y-Z stage, dispensing pump, syringe and manual
micropipette methods the droplets were dispensed. See figure 4.9.
c. Fabrication of fiber bonded SU8 microdroplet [CO2 Laser exposure]:
As shown in figure 4.10, it was difficult to form a rounded SU8 droplet
across the fiber pair because of surface energy of the SU8 and very small volumes
involved. Subsequent coatings on the droplet are shown in the figure. The laser
tagging ensures a strong bond between SU8 and fibers with the substrate.
Fig. 4.9 Microdroplets dispensed using micropipette.

Chatper-4 Interaction of Biomolecules with Solid Polymeric Surfaces of SU8 Microdroplet and Porous…
84
Fig. 4.10 CO2 laser heat treated fiber bonded SU8 microdroplet.
d. Fabrication of fiber bonded SU8 microdroplet [UV exposure] :
The fiber pair shown in figure 4.11 is covered with an SU8 droplet which
was then UV exposed.
Fig. 4.11 UV exposed fiber bonded SU8 microdroplet, Inset showing fiber gap
of 11µm.

Chatper-4 Interaction of Biomolecules with Solid Polymeric Surfaces of SU8 Microdroplet and Porous…
85
e. Extraction of SU8 microdroplets
Figure 4.12 shows pretreated and extracted SU8 microdroplets.
Fig. 4.12 SU8 microdroplets extracted from the substrate.
f. Surface immobilization
Figure 4.13 tabulates the results of BSA incubation and E-Coli attachment to
the selectively coated microdroplets. A2 shows E-Coli attachment to the fully BSA
coated microdroplet surfaces. Its density is comparatively less than the other two. B2
shows the cell attachment at the bottom surface of microdroplet. C2 has higher
density and more uniform cell attachment. This proves the point that E-Coli can
attach to functionalized SU8 surfaces; BSA covering, protecting SU8 acts as a
repellent for E-Coli.
Fig. 4.13 UV functionalized bare SU8 microdroplets, selectively immobilized with BSA solution [A1,B1,C1] incubated with E-Coli cells [A2,B2,C2] observed under the microscope.

Chatper-4 Interaction of Biomolecules with Solid Polymeric Surfaces of SU8 Microdroplet and Porous…
86
Fig. 4.14 SU8 microdroplet sensing GFP tagged E-Coli cells (a) E-Coli cells
under Microscope.
See Figure 4.14. Refractive index of BSA in general is 1.355 as against 1.67
of that of SU8. Due to overnight incubation changes in effective refractive index
may occur in BSA-SU8 interface, leading to higher value of intensity and spectral
shift at the output.
B. Porous Polydimethyl Siloxane- Acridine Orange as
Biomaterial
4.8 Introduction
A biomaterial is a structure, material or surface that interacts, functions with
living organisms, biological systems. It possesses the quintessential property of
biocompatibility to react with biomolecules. It is about 50 year old science and it
covers disciplines, domains like medicine, tissue engineering, bio- technology,
material science, surgery, therapeutics, agriculture, pharmaceuticals. Biomaterials
have become very much part of our lives and for some, part of body. They imitate in
a way natural functions with artificial bones, drug delivery vehicles, tissues,
dentures, biosensors, organs, contact lenses, intraocular lenses, vascular grafts, heart
valves, implants, pacemakers to improve life [see figure 4.15].

Chatper-4 Interaction of Biomolecules with Solid Polymeric Surfaces of SU8 Microdroplet and Porous…
87
Fig.4.15 Application areas, products of biomaterials. [Ref: Dantenium.com,
Water Forest School of Medicine]
Ceramic materials, metals, polymers and their composites fall in the category
of biomaterials. Both [82, 88, 89], natural polymers and artificial polymers can be
biomaterials. With higher proportions of carbon, oxygen and nitrogen; starch,
proteins, DNA, genes, complex sugars, cellulose become natural polymers. Man
made or artificial polymers with higher proportions of oxygen and nitrogen are
Poly(vinyl alcohol), poly(ethylene alcohol), PTFE, PMMA, polycarbons polylactide
, polyglycolide, silicones, polyurethanes .There is a reason why these artificial
polymers are accepted by living organisms as biomaterials. They possess some of
the following properties: 1. Biological inertness 2. Control in cell adhesion 3.
Interactive functionality or bioactive feature 4. Excellent mechanical strength 5. Bio-
degradable & Bio-recyclable nature 6. Bioresorbable capabilities 7. Thermal
stability 8. Biodurability. Modern medical devices are produced with more than one
such biomaterials mentioned above. Integrated behavioural analysis of these
materials in various situations like, chemical, physical, environmental, inside or
outside of a body of an organism decides its biocompatibility. Properties of these
materials are mostly application specific. They carry out functions like replace, treat,
augment or evaluate a tissue or organ of a body. It is observed that third generation
biomaterials can provide stimulation for specific cell response [101]. Surface
functionalization [section 4.3] helps in transforming these properties into desired
ones [98, 100]. Proteins are important ingredient in all biological molecules. It plays
primary mediating role in polymer- organism interactions. Their status on a material
Chatper-4 Interaction of Biomolecules with Solid Polymeric Surfaces of SU8 Microdroplet and Porous…
88
substrate is known to decide the ultimate biocompatibility of the polymer device. It
is important to study methods of surface functionalization of various polymer
materials, immobilization of proteins on these surfaces to know its behaviour and
characteristics in similar environmental situations. Polymer surfaces are passivated
to minimize protein interactions which are non-specific [specific protein repelling];
in turn specific protein adsorption and cell responses are induced by staining
polymer surfaces with biomolecules. “Plastic” like polymers used in paints,
packaging, containers, pipes and other forms in nature are exposed to or are in
contact with biological systems. They have to face problems like recycling, disposal,
delivery of chemicals and pollutants, sustainability. Polycarbonate based materials
are oxidation resistant and biodurable as they do not possess ether linkages, which
are affected by macrophagic enzymes causing deterioration of the device. Study of
biomaterials, their properties, behavior in various situation, surface modification
techniques to suite application needs, thus gives the insight about a material in a
specific application.
In this work a novel bio-material is reported. It is a nano-porous material
with PDMS [Poly dimethyl siloxane] and Acridine Orange [AO] dye as its major
constituents. PDMS is biocompatible and biodurable with applications in facial
prostheses [101], fabrication of lab-on-chips, in bioseparation. It is an artificial
polymer with methyl groups and repeating silicon to oxygen bonds. It is most
popularly used material for bioengineering, microfabrication and bio-medical
applications. Most commonly named as silicone, PDMS can be processed to easily
acquire unique properties, when the methyl group is replaced with vinyl, phenyl etc.
groups[102]. This will modify the organic linkages into inorganic backbone of the
material. Properties of PDMS material like oxygen permeable, non toxic and blood
compatible find applications [95-102] in shunts, implants, bladder stimulators, heart
valves, burn dressings. With the properties of PDMS material, its tunable elastic
nature and all the applications, features mentioned above, the references 95 to 102
more or less have it treated as one of the biomaterials with very bright future role to
play in bioengineering. Researchers [S.M. Khare et.al. 103] have tried to use images
of micropillars of dye doped PDMS to study locomotory forces of genetically
modified organisms.

Chatper-4 Interaction of Biomolecules with Solid Polymeric Surfaces of SU8 Microdroplet and Porous…
89
This new material is physically and characteristically dissimilar from the two
combining bio-materials mixed in soft-lithography process. A range of
characterization techniques, such as SEM, UV–VIS spectroscopy, Fluorescence
microscopy, SpectraSuite optics signal setup, support the novel attributes of the
material. Although extensive literature survey was done, it provided no references
for a similar microstructure.
4.9 Literature Survey
Way back in 1998 in a journal paper [82] interaction between bovine serum
alumin [BSA] and acridine orange [AO] was investigated. Using fluorescence
spectra method, binding reaction and energy transfer effect between BSA and AO
was probed. Absorption curves [300-500 nm] were interpreted to know status of AO
as monomer, dimer or aggregation of AO inside a cell. Fluorescence curves
[excitation 280nm emission 300-500nm] analysis was based on the forster energy
transference. With this analysis distance between acceptor AO and BSA, energy
transfer efficiency was found. AO fluorescent dye was introduced as cationic basic.
It is a neutral, nucleophilic, proton acceptor and can penetrate into membranes of
cell organs to accept protons. H+ cationic molecules can not penetrate the membrane
and cause variation in concentration. Thus the absorption and fluorescence maximas
shift accordingly, to Red or Blue wavelengths. AO dye is normally used as a liquid
dye solution. Solid phase AO dye solution can be an alternative and it has additional
advantages such as better solubility. AO has its peak absorbance and fluorescence
wavelengths blue shifted when in solid matrix [89]. Spectral characteristics were
used to observe effect of solution concentration and content on absorbance and
fluorescence peaks. Refractive index was measured using the dye doped polymer
film and n-butyl acetate (nBA). AO was subjected to a Z-scan technique which
deduced a negative non-linear refractive index.
MEMS [microelectromechanical systems] research and development activity
was increasing in biomedical, clinical and therapeutics application field. Its pace
was controlled by cost and limited access to silicon based microfabrication which
mainly employed highly planner, expensive photolithography process. Also it
invariably used a small set of materials. With commercialization and range of
applications in the fields of medicine and biomedical, research community was

Chatper-4 Interaction of Biomolecules with Solid Polymeric Surfaces of SU8 Microdroplet and Porous…
90
encouraged to find BIOMEMS applications, alternate processes, materials. Thus
soft-lithography technique was developed for satisfying objective of mass
production, reduced cost and use of polymer materials. Some of the prominent
members of this polymer group of materials are polymethylsiloxane [PDMS],
polymethylmethacrylate [PMMA], polycarbonate [PC], polyvinylchloride [PVC].
PDMS a silicon elastomer, is chemically inert, simple to handle and manipulate, can
conform to submicron features in microfabrication, operates at lower cost and is
thermally stable. It is most suitable for soft lithography solvent based moulding.
PDMS formulations, fabricated using various processes and concentrations, were
analysed [90] with SEM, goniometry, tensile testing, FTIR, chemical tests. In a
detailed review, on biocomptible polymer materials, importance of protein- surface
interaction is highlighted [91]. Fernandez [92] et.al. have discussed effect of
porosity on PDMS cell immobilization and formation of bacterial biofilm. Further
applications of these biomaterials were surveyd in the fields of tissue engineering,
drug delivery, skin grafting, medical sensing, medical adhesives, textiles. Medical
applications of these polymer biomaterials can be broadly classified as 1. Temperory
implants: arterial stents, implantable drug delivery systems, degradable sutures 2.
Fig. 4.16 Acridine orange interacting differentially amongst base pairs of
double-stranded DNA [Green Fluorescence] and denatured DNA
bases [Red Fluorescence]. [Huang et.al. [7]]

Chatper-4 Interaction of Biomolecules with Solid Polymeric Surfaces of SU8 Microdroplet and Porous…
91
Extra- corporeal uses: ocular devices, wound dressings, catheters 3.
Permanent implants: dental, orthopedic devices, sensory devices. Hydrogels [93]
were prepared with biopolymers or with combination of synthetic and biopolymers
for prospective biomedical applications like tool for transdermal drug delivery,
dressing material for burns or cut wounds. AO differentially stain tests, double
stranded DNA and denatured DNA [figure 4.16]. The dye fluoresces red (> 600 nm)
when it binds to single-stranded DNA section and its binding to double-stranded
DNA sections leads to green fluorescence (∼530 nm) [94].
4.10 Porous PDMS- AO as a Biomaterial in Opto-Biosensing
A breathing polymer material is very much desired in recent biomedical
research. PDMS [(Polydimethylsiloxane) molecular formula: (C2H6OSi)n ] is a good
mould material. Characteristic optically transparent structures can be fabricated with
moulding and curing. It is known as a bio-compatible material. In soft lithography
the bubbles formed when PDMS base is mixed with curing agent are removed in
desiccator to get a clear, white, transparent device. References, however show work
on getting porous polymer structures for immobilization of cells and formation of
bio films. Another biomaterial Acridine orange [(AO) molecular formula: C17H19N3
] is a metachromatic dye useful in living cell detection. Its probing capability in dead
cell detection is yet to be proved. The motive and thinking behind this study was,
that PDMS is a biocompatible material. AO is a fluorescent dye used in DNA, RNA
cell detection. When these two were mixed together a more suitable biomaterial may
be produced. Thus experiments were carried out using soft lithography technique,
which produced a reddish, spongy structure with pore sizes as low as 998.8nm. This
paper being first to report the material, there are no references. Spectral
characteristics of waveguide like structure microfabricated with this porous PDMS–
AO [PPA] material when compared with similar PDMS structure, significant
variation was observed. PPA material when exposed to cell detection test it glowed
under the near IR excitation signal. Varying proportion, concentration in sensitive
structures of PPA may lead to a live torch effect. Further exploration of this
material, having properties like porous, spongy, flexible, puffed up structure and AO
content, was found to be easier to post-process. Applications in life sciences like
microfilters, in-vivo/vitro sensors, biosensor, concentration detector, implants may
be investigated as a future scope. It can be better analyzed as a dye doped material.
The composite of PDMS/AO was developed by mixing in 10:1:1 ratio of [PDMS]

Chatper-4 Interaction of Biomolecules with Solid Polymeric Surfaces of SU8 Microdroplet and Porous…
92
primer to curing agent and AO solution [AO powder 1mg/ml in DI water to make
AO solution]. PDMS (Polydimethylsiloxane) [molecular formula: (C2H6OSi)n] is a
material often used in micro/nano fabrication, replication of microstructures and in
biosensing applications. Soft lithography provides variety of ways in handling
materials like PDMS, PMMA in gel form with varying proportions of their curing
agents. Brittle and soft are the two possible extreme end results. It uses moulding
masks on glass, Si wafer, PMMA substrate to be replicated into final structure. It is
the resolution of mask, which decides the resolution of structure. Negative mask
structures are made out of Si-wafer, PMMA and SU8 on Si or glass using photo-
lithography and laser engraving on PMMA.
PDMS is spin coated on the mask substrate and speed, time are controlled for
desired thickness. The PDMS coated structure is kept at 95ºC on hot plate (7 min) or
in oven (45min). Further it is kept in oven at 200ºC for 1 hour to get stick free
PDMS structure. Acridine orange [molecular formula: C17H19N3] is a metachromatic
fluorescence dye in powder form. It is mixed 1mg/ml with DI water to make a
solution. It interacts with DNA, RNA and is cell permeable nucleic acid selective.
For excitation maximum 502nm (DNA) and 650nm (RNA), it spectrally fluoresces
with emission maximum at 525nm and 650nm respectively.
4.10.1 Experimental Procedure
Fabrication of device: Epilog Laser engraving machine was used to get
negative microstructure masks on PMMA sheet. The masks are complex optical
waveguide like structures with test sample channels for the biosensing application.
Two pairs of mask patterns were used. Following fabrication procedure discusses
steps of one of the pairs. Speed, Power of the laser machine were controlled to get
high resolution, mirror finish wall structures. Following all defined procedures of
soft- lithography, PDMS base was mixed with curing agent in 10:1 proportion. Half
of the PDMS material was kept aside and in the other half AO was mixed with
10:1:1 proportion. After desiccation both PDMS and PDMS-AO mix were
separately spin coated on two similar PMMA masks. For larger base PDMS /
PDMS-AO can be molded in a suitable plastic container. The moulds were ready for
heating, so a preheated oven set at 95º C was used for the purpose for 45 min curing.
The devices were set and allowed to cool.
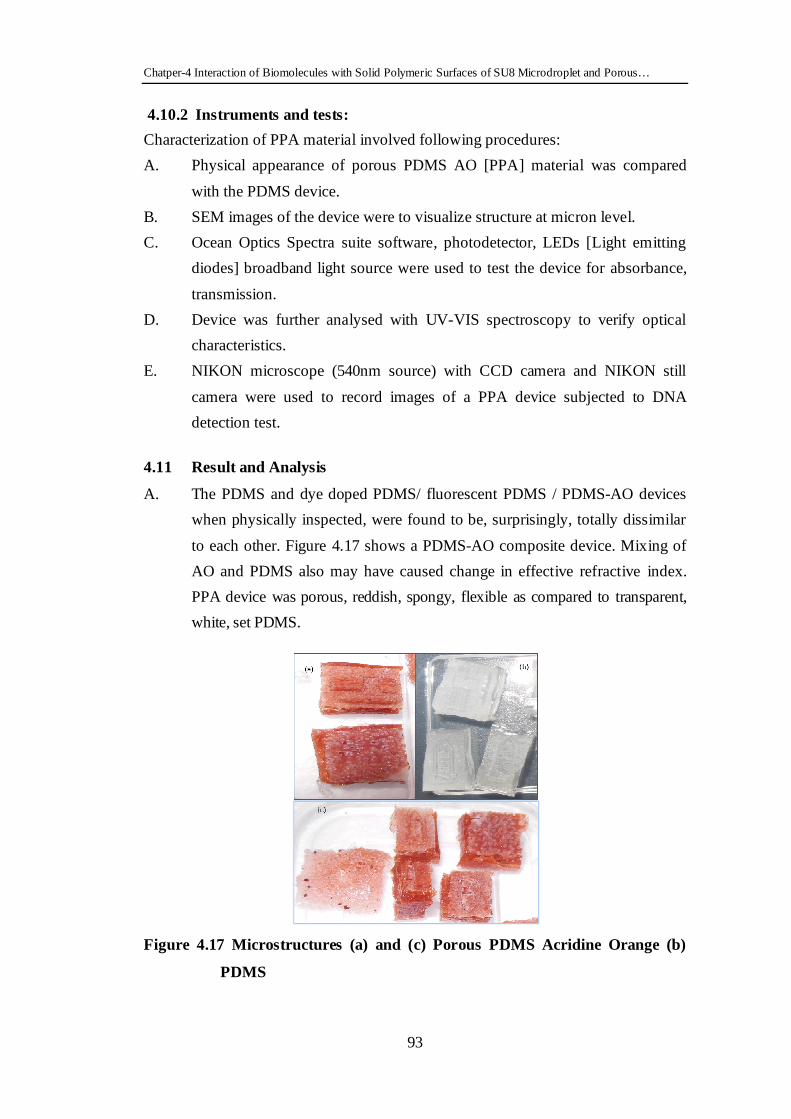
Chatper-4 Interaction of Biomolecules with Solid Polymeric Surfaces of SU8 Microdroplet and Porous…
93
4.10.2 Instruments and tests:
Characterization of PPA material involved following procedures:
A. Physical appearance of porous PDMS AO [PPA] material was compared
with the PDMS device.
B. SEM images of the device were to visualize structure at micron level.
C. Ocean Optics Spectra suite software, photodetector, LEDs [Light emitting
diodes] broadband light source were used to test the device for absorbance,
transmission.
D. Device was further analysed with UV-VIS spectroscopy to verify optical
characteristics.
E. NIKON microscope (540nm source) with CCD camera and NIKON still
camera were used to record images of a PPA device subjected to DNA
detection test.
4.11 Result and Analysis
A. The PDMS and dye doped PDMS/ fluorescent PDMS / PDMS-AO devices
when physically inspected, were found to be, surprisingly, totally dissimilar
to each other. Figure 4.17 shows a PDMS-AO composite device. Mixing of
AO and PDMS also may have caused change in effective refractive index.
PPA device was porous, reddish, spongy, flexible as compared to transparent,
white, set PDMS.
Figure 4.17 Microstructures (a) and (c) Porous PDMS Acridine Orange (b)
PDMS
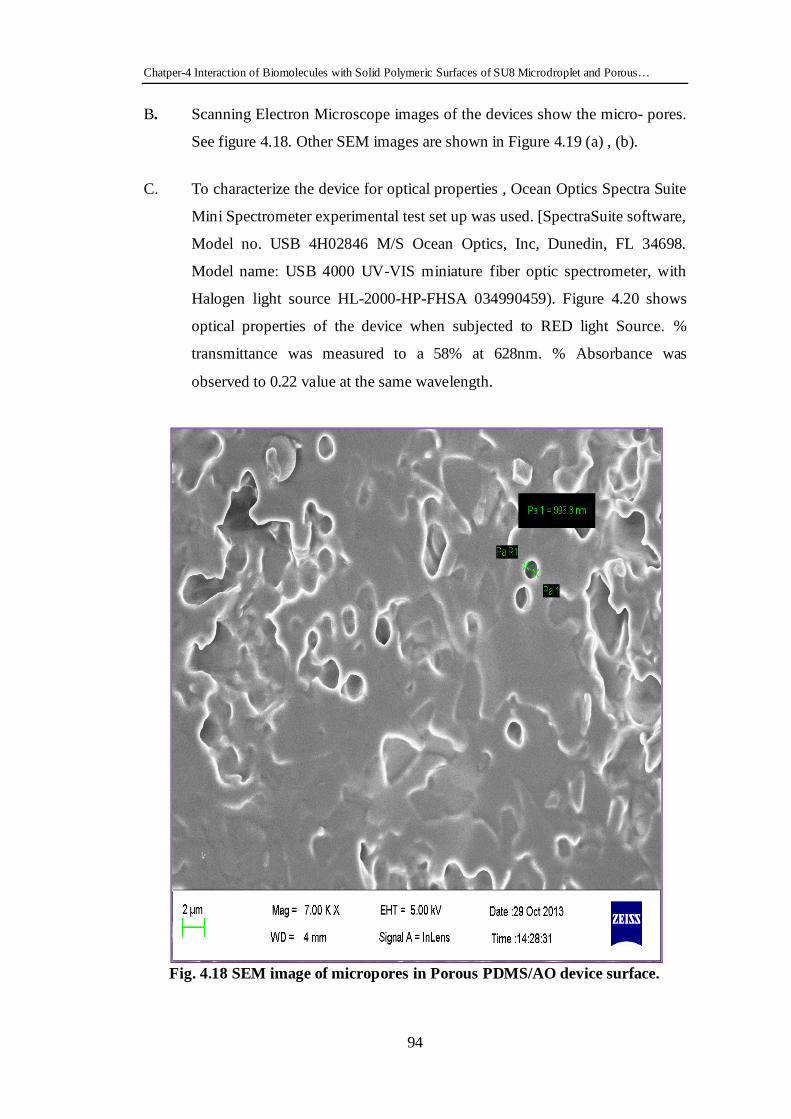
Chatper-4 Interaction of Biomolecules with Solid Polymeric Surfaces of SU8 Microdroplet and Porous…
94
B. Scanning Electron Microscope images of the devices show the micro- pores.
See figure 4.18. Other SEM images are shown in Figure 4.19 (a) , (b).
C. To characterize the device for optical properties , Ocean Optics Spectra Suite
Mini Spectrometer experimental test set up was used. [SpectraSuite software,
Model no. USB 4H02846 M/S Ocean Optics, Inc, Dunedin, FL 34698.
Model name: USB 4000 UV-VIS miniature fiber optic spectrometer, with
Halogen light source HL-2000-HP-FHSA 034990459). Figure 4.20 shows
optical properties of the device when subjected to RED light Source. %
transmittance was measured to a 58% at 628nm. % Absorbance was
observed to 0.22 value at the same wavelength.
Fig. 4.18 SEM image of micropores in Porous PDMS/AO device surface.

Chatper-4 Interaction of Biomolecules with Solid Polymeric Surfaces of SU8 Microdroplet and Porous…
95
Fig. 4.19 (a) and (b) SEM images of surfaces of PPA microstructures.
Fig. 4.20 Optical characteristics of PPA using [RED source] Spectra Suite
optics test setup.
D. UV-VIS Spectometer characterization: Figure 4.21 shows the UV-VIS
spectral response of the device. Peak absorbance was recorded as
0.509 at 500nm wavelength;
0.497 at 325nm
% peak Transmittance was:
38.86% at 392nm;
39 % at 634nm

Chatper-4 Interaction of Biomolecules with Solid Polymeric Surfaces of SU8 Microdroplet and Porous…
96
Fig. 4.21 UV-VIS spectrophotometer spectral characteristics of the PPA device
[TOP first].
E. NIKON fluorescence microscope (540nm source) with CCD camera was
used to record images of a PPA device subjected to DNA detection test.
Acridine orange dye tagged DNA solution was administered in the PDMS
well of the PPA device. The device was placed under the 540nm filtered
light source to observe fluorescence response. The image shown in figure
4.22 is recorded with a still camera [NIKON]. The device glowed under the
green optical source.
Fig. 4.22 Photo image of PPA device administered with AO tagged DNA
solution, taken with NIKON still camera.
Chatper-4 Interaction of Biomolecules with Solid Polymeric Surfaces of SU8 Microdroplet and Porous…
97
4.12 Conclusion
After extensive literature survey, on interaction of biomolecules on solid
polymeric surfaces; SU8 microdroplet surface immobilisation procedure was
explored with suitable, simpler and robust immobilization techniques. It was
observed that UV exposed SU8 microdroplet surfaces can be prepared for protein
immobilization.
In an era dominated by silica microspheres and optical fibers, polymer
optical fibers and optical devices are creating some space. An attempt was made in
fabricating a SU8 fiber coupler and biosensor. It is a biocompatible material and
with proper functionalization it becomes suitable for the selected and specific
immobilization of biological entities. Thus SU8 microdroplets with or without fiber
bonding were surface functionalized, BSA immobilized and tested for antifouling
property of BSA with GFP tagged E-Coli cell. Fluorimetry and SpectraSuite test
setup were used for characterization of these droplets. It was observed that there is a
possibility that E-Coli attaches to SU8 surface with a large density.
In B-part of the discussion, it was observed that, biomaterials are important
in our lives to produce a range of biomedical articles like implants, dressings, drug
delivery systems, sensors which are temporary, permanent or extracorporeal in their
applications and provide immense relief, quality to life. An all encompassing study
of these materials, their behaviour and properties, surface modification techniques
leads to original and application specific products. In this work a novel biomaterial
is produced using soft-lithography and by combining two biomaterials PDMS, AO.
Its appearance (porous, reddish in colour, spongy) and properties are different from
the base materials. The spongy structure had pore size of 998.8nm. Probable
applications of this material may be, as dressing material for wounds, adhesives,
filters, optical-biosensors, implants, detection of nanolevel locomotory motions of
organisms [88].
4.13 Future Scope
It was a plan to have SU8 microdroplet diameter sizes limited to a range of ~
80-100µm to get effective WGM inside the droplet. Also the contact angle of the
droplet must be nearing 90˚ to get a near spherical droplet. After this both labled and

Chatper-4 Interaction of Biomolecules with Solid Polymeric Surfaces of SU8 Microdroplet and Porous…
98
lable free techniques will be further used on Laser exposed and UV exposed
microdroplets.
A range of porous PDMS - AO materials of differing physical, chemical,
optical properties can be produced simply by varying concentrations of curing agent
and AO in PDMS gel. With individual analysis of such materials a wide range of
applications are possible. Future work involves experimenting, usage of the Porous
PDMS –AO material as wound dressing strip, opto-biosensor, filter or as an implant.
We wish to explore and want to change the image contrast by looking at the
fluorescent PDMS. Further with the fluorescent PDMS microstructures we want to
study nanolevel locomotory motions of the organisms. It is established that dye
doped PDMS has much lower stiffness and is much softer than normal PDMS.
Varying proportion, concentration in sensitive structures of PPA may lead to a live
torch effect.
Reference
1. Ratner, Buddy D., Allan S. Hoffman, Frederick J. Schoen, and Jack E.
Lemons, "An introduction to materials in medicine ", Biomaterials Science
484 (1996).
2. W. Norde, “Driving forces for protein adsorption at solid surfaces”,
Biopolymers at Interfaces, 75, p. 27–54 (1998).
3. W. Norde, “My voyage of discovery to proteins in flatland ...and beyond”,
Colloids Surf B 2008; 61:1.
4. W. Norde and C. E. Giacomelli, “BSA structural changes during
homomolecular exchange between the adsorbed and the dissolved states”, J.
Biotechnol. 79, 259-268 (2000).
5. J. D. Andrade, V. Hlady and A. P. Wei, “Adsorption of complex proteins at
interfaces”, Pure Appl. Chem. 64, 1777-1781 (1992).
6. J. D. Andrade and V. Hlady, “Plasma protein adsorption: The big twelve”,
Ann. NY Acad. Sci. 516, 158-172 (1987).

Chatper-4 Interaction of Biomolecules with Solid Polymeric Surfaces of SU8 Microdroplet and Porous…
99
7. S. Kalasin and Santore M. M. “Non-specific adhesion on biomaterial
surfaces driven by small amounts of protein adsorption”, Colloids Surf., B
73, 229-236 (2009).
8. U. M. Elofsson, M. A. Paulsson and T. Arnebrant, “Adsorption of β-
lactoglobulin A and B: Effects of ionic strength and phosphate ions”,
Colloids Surf., B 8,163-169 (1997).
9. M. Wahlgren, U. Elofsson,“ Simple models for adsorption kinetics and their
correlation to the adsorption of b-lactoglobulin A and B ”, J. Colloid
Interface Sci. 188, 21-129 (1997).
10. C. Janiak, “ In order to sustain the gaze: Removing protein from contact
lenses”, Chemie. in Unserer Zeit Volume: 35, 348-354 (2001).
11. H. Noh and E. A. Vogler, “Volumetric interpretation of protein adsorption:
mass and energy balance for albumin adsorption to particulate adsorbents
with incrementally increasing hydrophilicity”, Biomaterials 27, 5801–5812
(2006).
12. J. Israelachvili and H. Wennerstrom, “Role of hydration and water structure
in biological and colloidal interactions”, Nature 379, 219–225 (1996).
13. W. Norde, “Adsorption of proteins from solution at the solid-liquid
Interface”, Adv. Colloid Interface Sci. 25, 267-340 (1986).
14. C. A. Haynes and W. Norde, “Globular proteins at solid /liquid interfaces”,
Colloids Surf., B 2, 517-566 (1994).
15. J. D. Andrade, V. Hlady, “Protein adsorption and materials biocompatibility:
A tutorial review and suggested hypotheses”, Adv. Polymer Sci. 79, 1–63
(1986).
16. F. Rusmini, Y. Zhong and J. Feijen, “Protein Immobilization Strategies for
Protein Biochips”, Biomacromolecules 8, 1775–1789 (2007).
17. C. Mateo, O. Abian, G. Fernandez-Lorente, J. Pedroche, R. Fernandez-
Lafuente and J. M. Guisan, “Epoxy sepabeads: a novel epoxy support for
stabilization of industrial enzymes via very intense multipoint covalent
attachment ”, Biotechnol. Prog. 18, 629-634 (2002).

Chatper-4 Interaction of Biomolecules with Solid Polymeric Surfaces of SU8 Microdroplet and Porous…
100
18. S. P. Fodor, J. L. Read, M. C. Pirrung, L. Stryer, A. T. Lu and D. Solas,
Light-directed, spatially addressable parallel chemical synthesis. Science
251, 767–773(1991).
19. K. R. Bhushan, Light-directed maskless synthesis of peptide arrays using
photolabile amino acid monomers.Org. Biomol. Chem. 4, 1857–1859 (2006).
20. S. Bhattacharya, A. Datta, J. M. Berg and S. Gangopadhyay, Studies on
Surface Wettability of Poly(Dimethyl) Siloxane (PDMS) and Glass Under
Oxygen-Plasma Treatment and Correlation With Bond Strength Plasma-
modified Surfaces, J. Microelectromech. Sys. 14, 590-597 (2005).
21. H. Yasuda, “Plasma polymerization”, Academic Press, 432 (1985).
22. P. K. Chu, J. Y. Chen, L. P. Wang and N. Huang, “Plasma-surface
modification of biomaterials”, Mater. Sci. Eng., R 36, 143–206 (2002).
23. C. M. Chan, T. M. Ko and H. Hiraoka, “Polymer surface modification by
plasmas and photons”, Surf. Sci. Rep. 24, 1–54 (1996).
24. M. Loughran, S. W. Tsai, K. Yokoyama and I. Karube, “Simultaneous iso-
electric focusing of proteins in a microfabricated capillary coated with
hydrophobic and hydrophilic” , Curr. Appl. Phys. 3, 495–499 (2003).
25. Jiun-Jeng Chen, Kimberly N. Struk, and Anthony B. Brennan, “ Surface
Modification of Silicate Glass Using 3-(Mercaptopropyl)trimethoxysilane for
Thiol–Ene Polymerization ”, Langmuir, 2011, 27 (22), pp 13754–13761.
26. S. Keller, G. Blagoi, M. Lillemose, D. Haefliger, A. Boisen, “Processing of
thin SU-8 films”, J. Micromech. Microeng. 18 (2008) 125020 (10pp).
27. Z. Wang , M. Stangegaard, M. Dufva, J.P.Kutter , A. Wolff, “ A simple
hydrophilic treatment of SU8 surfaces for cell culturing and cell patterning ”,
Int. Conf. on Miniaturized Systems for Chemistry and Life Sciences 2005
USA.
28. M.Joshi, R. Pinto, V. R. Rao, S. Mukherji, “Silanization and antibody
immobilization on SU-8 ”, Applied Surface Science 253 (2007) 3127-3132.
Chatper-4 Interaction of Biomolecules with Solid Polymeric Surfaces of SU8 Microdroplet and Porous…
101
29. Y. Wang, J. Pai, H. Lai, C. E. Sims , M. Bachman , G. P. Li, N. L. Allbritton,
“Surface graft polymerization of SU-8 for bio-MEMS applications”, J.
Micromech Microeng. 17 (2007) 1371-1380.
30. H.Chen, L.Yuan, W. Song, Z. Wu, D. Li, “Biocompatible polymer materials:
Role of protein – surface interactions”, Progress in Polymer Science 33
(2008) 1059 – 1087.
31. G. Blagoi, S. Keller, A. Johansson, A. Boisen, M. Dufva, “Functionalization
of SU8 surfaces with IgG proteins”, Applied Surface Science 255 (2008)
2896-2902.
32. M. Holgado, C.A. Barrios, F.J. Ortega, F.J. Sanza, R. Casquel, M..F. Laguna,
M.J. Banuls, D. Lopez-Romero, R. Puchades, A. Maquiera, “ Label-free
biosensing by means of periodic lattices of high aspect ratio SU8 nanopillars
”, Biosensors and Bioelectronics 25 (2010) 2553-2558.
33. D. Kim, A. E. Herr, “Protein immobilization techniques for microfluidic
assays”, Biomicrofluidics 7, 041501( 2013).
34. X. Feng, Z. Lin, L.Yang, C. Wang, C. Bai, “ Investigation of the interaction
between acridine orange and bovine serum albumin ”, Talanta 47 (1998)
1223- 1229.
35. S.J.Park, H. Bae, J. Kim, B. Lim, J. Park, S. Park, “ Motility enhancement of
bacteria actuated microstructures using selective bacteria adhesion ”, Lab on
a Chip.
36. Mendel Friedman, “Applications of the Ninhydrin reaction for analysis of
amino acids , peptides and proteins to agricultural and Biological sciences ”,
J. Agric. Food chem., 2004, 52 ( 3), pp 385-406.
37. Book: M. Zourob, A. Elwary, A. Turner , “ Principles of Bacterial Detection
: Biosensors , Recognition Receptors and Microsystems ”, Springer 2008.
38. X. Fan, I.M. white, Review: “Optofluidic Microsystems for chemical and
biological analysis”, Nature Photonics, 2011.
39. C. Chou, H.Wu, C. Yu, Y. Chang, B. Hsieh , “ Fiber –optic biosensor for
antigen / antibody kinetic assays ”, SPIE Newsroom

Chatper-4 Interaction of Biomolecules with Solid Polymeric Surfaces of SU8 Microdroplet and Porous…
102
40. O. S. Wolfbeis,” Fiber –optic chemical sensors and biosensors”, Anal. Chem.
2004, 76, 3269 – 3284.
41. S.C.HER, C-Y TSAI, “Strain measurement of fiber optic sensor surface
bonding on host material”, Trans. Nonferrous Met. Soc. China 19(2009)
s143-s149.
42. Bryant, Lange, “Fusion splice”.
43. M.L.Chabinyc, D.T.Chiu, J.C.McDonald, A. D.Stroock, J.F. Christian , A.M.
karger, G. M. Whitesides, “ An integrated fluorescence detection system in
Poly(dimethylsiloxane) for microfluidic applications”, Anal. Chem. 2001,
73,4491-4498.
44. http://www.nrl.navy.mil/accomplishments/materials/fiber-optic-sensors.
45. K.T.V. Grattan, Dr. T. Sun,” Fiber optic sensor technology: an overview”,
Sensors and Actuators 82 (2000) 40-61.
46. B. Lee,” Review of the present status of optical fiber sensors”, Optical Fiber
Technology 9 (2003) 57-79.
47. M. Mahdkhani, Z.Bayati, “Application and development of fiber optic
sensors in civil engineering”, WCEE, 2008, China.
48. L.C. Shriver-Lake, A. W. Kusterbeck, F.S. Ligler, “Ch.5: Environmental
Immunosensing at the naval research laoratory”.
49. S. Ko, S. A. Grant, “A novel FRET –based optical fiber biosensor for rapid
detection of Salmonella typhirium”, Biosensors and Bioelectronics 21
(2006)1283-1290.
50. M.E. Bosch, A.J. R. Sanchez, F.S. Rojas, C.B. Ojeda ,Review “ Recent
development in optical fiber biosensors”, Sensors 2007, 7, 797-859.
51. A. Leung, P.M. Shankar, R. Mutharasan, “A review of fiber optic
biosensors”, Sensors and Actuators B 125 (2007) 688-703.
52. X. Fan, I.M. White, S. I. Shopova, H. Zhu, J.D. Suter, Y. Sun , “ Sensitive
optical biosensors for unlabeled targets : a review ”, ANALYTICA
CHIMICA ACTA 620 (2008)8-26.

Chatper-4 Interaction of Biomolecules with Solid Polymeric Surfaces of SU8 Microdroplet and Porous…
103
53. T. Liu, Y. Zhao, Z. Zhang, P. Zhang, J. Li, R.Yang, C.Yang, L. Zhou , “ A
fiber optic biosensor for specific identification of dead Escherichia coli
O157:H7”, Sensors and Actuators B 196 (2014) 161-167.
54. F. Vollmer, S. Arnold, “Whispering –gallery – mode biosensing: label-free
detection down to single molecules” , Nature methods 5, 7, 591-596, (2008).
55. S. Chemburu, K. Fenton, G.P.Lopez, R.Zeinldin, Review,” Biomimetic silica
microspheres in biosensing”, Molecules 2010, 15, 1932-1957.
56. X. Fan, I.M. White, S. I. Shopova, H. Zhu, J.D. Suter, Y. Sun , “ Sensitive
optical biosensors for unlabeled targets : a review ”, ANALYTICA
CHIMICA ACTA 620 (2008)8-26.
57. J.P. Laine, B.E. Little, D. Lim, H.A. Haus, “Novel techniques for
whispering- gallery-mode excitation in silica microspheres”, OSA (1999).
58. M.Cai, K. Vahala, “Highly efficient optical power transfer to whispering –
gallery modes by use of a symmetrical dual coupling configuration”,
OPTICS LETTERS, OSA, 25, 4, (2000).
59. A.N. Oravsky, Review: “Whispering –gallery waves”, Quantum electronics
32 (5) 377-400 (2002).
60. N. M. Hanumegowda, I.M.White, C. J. Stica, B. C. Patel, H. Oveys , X. Fan ,
“ Development of label-free microsphere optical resonator bio/ chemical
sensors ”, Proc. Of SPI 6004, 600401 (2005).
61. N. M. Hanumegowda, C. J. Stica, B.C. Patel , I. White, X. Fan ,“
Refractometric sensors based on microsphere resonators ”, APPLIED
PHYSICS LETTERS 87, 201107 (2005).
62. I.M. White, N.M. Hanumegowda, H. Oveys, X. Fan , “ Tuning whispering
gallery modes in optical microspheres with chemical etching ” ,OSA,
OPTICS EXPRESS 13, 26, 10754-59 (2005).
63. M.Noto, D. Keng, I. Teraoka, S. Arnold, “ Detection of protein orientation
on the silica microsphere surface using transverse electric/ transverse
magnetic whispering gallery modes ”, Biophysical Journal 92, 4466-4472
(2007).
Chatper-4 Interaction of Biomolecules with Solid Polymeric Surfaces of SU8 Microdroplet and Porous…
104
64. I. M. White, X. Fan, “On the performance quantification of resonant
refractive index sensors”, OSA, OPTICS EXPRESS 16,2 , 1020-28 (2008).
65. S. Arnold, D. Keng, S.I. Shopova, S. Holler, W. Zurawsky, F. Vollmer, “
Whispering gallery mode carousel – a photonic mechanism for enhanced
nanoparticle detection in biosensing ”, OPTICS EXPRESS , OSA, 17,8,
(2009).
66. M.I. Cheema, A.G. Kirk, “Implementation of the perfectly matched layer to
determine the quality factor of axisymmetric resonators in COMSOL”,
COMSOL conference, Boston, (2010).
67. J.Zehnpfennig, G. Bahl, M. Tomes, T. Carmon, “Surface optomechanics:
calculating optically excited acoustical whispering gallery modes in
microspheres”, OPTICS EXPRESS, OSA , 19, 15 (2011).
68. M. Ornigotti, A. Aiello, “Analytical approximations of whispering gallery
modes in anisotropic ellipsoidal resonators”, OSA, (2011).
69. L.Huang, Z. Guo, “Biosensing in a microelecrofluidic system using optical
whispering –gallery mode spectroscopy”, AIP, Biomicrofluidics 5, 034114
(2011).
70. Seema Yardi, D. Boolchandani, Shantanu Bhattacharya, “Polymer
waveguide and optical fiber coupling using whispering gallery modes in an
elliptical micro-sleeve ”, Optics in the Life Sciences Congress Technical
Digest © 2013 The Optical Society of America (OSA)
71. J. Ward, O. Benson, “WGM microresonators: sensing, lasing and
fundamental optics with microspheres”, Laser photonics 5, 4, 553-570
(2011).
72. A. B. Matsko, V. S. Ilchenko, “Optical resonators with whispering gallery
modes – Part I: Basics”, IEEE Journal of selected topics in Quantum
Electronics, 12, 1 (2006).
73. V.R. Dantham , S. Holler, V. Kolchenko, Z. Wan , S. Arnold, “ Taking
whispering gallery –mode single virus detection and sizing to the limit ”,
Applied Physics letters 101, 043704 (2012).

Chatper-4 Interaction of Biomolecules with Solid Polymeric Surfaces of SU8 Microdroplet and Porous…
105
74. D. Farnesi, A. Barucci , G.C. Righini , S. Berneschi, S. Soria , G. N. Conti, “
Optical frequency conversion in silica-whispering gallery mode
microspherical resonators ”, PRL 112, 093901 (2014).
75. J.R. Schwesyg, T. Beckmann, A,S. Zimmermann, K. Buse , D. Haertle, “
Fabrication and characterization of whispering –gallery –mode resonators
made of polymers ”, OSA, OPTICS EXPRESS 17 , 4, 2573-2578 (2009) .
76. M.Joshi, R. Pinto, V. R. Rao, S. Mukherji, “Silanization and antibody
immobilization on SU-8 ”, Applied Surface Science 253 (2007) 3127-3132.
77. Y. Wang, J. Pai, H. Lai, C. E. Sims , M. Bachman , G. P. Li, N. L. Allbritton,
“Surface graft polymerization of SU-8 for bio-MEMS applications”,
J. Micromech Microeng. 17 (2007) 1371-1380.
78. H.Chen, L.Yuan, W. Song, Z. Wu, D. Li, “Biocompatible polymer materials:
Role of protein – surface interactions”, Progress in Polymer Science 33
(2008) 1059 – 1087.
79. G. Blagoi, S. Keller, A. Johansson, A. Boisen, M. Dufva, “Functionalization
of SU8 surfaces with IgG proteins”, Applied Surface Science 255 (2008)
2896-2902.
80. V.S. Goudar, S. Suran, M.M. Varma, “Photoresist functionalisation method
for high-density protein microarrays using photolithography”, Micro & Nano
Letters (2012) 7, 6, 549-553.
81. D. Kim, A. E. Herr, “Protein immobilization techniques for microfluidic
assays”, Biomicrofluidics 7, 041501(2013).
82. X.Feng, Z. Lin, L.Yang, C. Wang, C. Bai, “ Investigation of the interaction
between acridine orange and bovine serum albumin ”, Talanta 47 (1998)
1223- 1229.
83. H. Mansur, R. Orefice, M. Pereira , Z. Lobato, W. Vasconcelos, L. Machado,
“FTIR and UV-vis study of chemically engineered biomaterial surfaces for
protein immobilization ”, Spectroscopy 16 (2002) 351-360.

Chatper-4 Interaction of Biomolecules with Solid Polymeric Surfaces of SU8 Microdroplet and Porous…
106
84. N.M. Hanumegowda, I.M. White, H. Oveys, X. Fan ,“Label-free protease
sensors based on optical microsphere resonators”, Sansor Letter 3, 1-5
(2005) .
85. M. Holgado, C. A. Barrios, F. J. Ortega, F. J. Sanza, R. Casquel, M.F.
Laguna, M.J. Baňuls, D. Lopez-Romero, R. Puchades, A. Maquieira, Review
“ Label-free biosensing by means of periodic lattices of high aspect ratio SU-
8 nano-pillars ”, Biosensors and Bioelectronics 25 (2010) 2553-2558.
86. S.J. Park, H. Bae, J. Kim , B. Lim, J. Park , S. park , “ Motility enhancement
of bacteria actuated microstructures using selective bacteria adhesion ”, Lab
Chip (2010) 10 1706-1711.
87. S. Stefansson, D. Adams, C. Tang, “Sample preparation using buoyant silica
microsphere”, 6 th EDRN workshop, MD (2009).
88. S.M. Khare, A. Awasthi, V. Venkatraman, S.P.Koushika, “Colored
polydimethylsiloxane micropllar arrays for high throughput measurements of
forces applied by genetic model organisms”, Biomicrofluidics
9(1):014111.February 2015 DOI: 10.1063/1.4906905.
89. eng Feng, Z. Lin –Jin Yang , C. Wang , C.-Li Bai, “ Investigation of the
interaction between acridine orange and bovine serum albumin ”, Talanta 47
(1998) 1223-1229.
90. V.S. Sukumaran, a. Ramalingam, “Spectral characteristics and non-linear
studies of acridine orange dye”, Physics Letters A 34(2005) 454-458.
91. A.Mata, A.J. Fleischman, S.Roy, “Characterization of Polymethylsiloxane
(PDMS) properties for biomedical micro-nanosystems”, Biomedical
Microdevices 7:4 (2005) 281-293.
92. H.Chen, L.Yuan, W.Song, Z.Wub, D. Li,” Biocompatible polymer materials:
Role of protein –surface interactions”, Progress in Polymer Science 33
(2008) 1059-1087.
93. M.R.Fernandez, M.G. Casabona, V.N.Anupama, B. Krishnakumar, G.A.
Curutchet, D.L. Bernik, “ PDMS based porous particles as support beds for
cell immobilization : Bacterial biofilm formation as a function of porosity

Chatper-4 Interaction of Biomolecules with Solid Polymeric Surfaces of SU8 Microdroplet and Porous…
107
and polymer composition ”, Colloids and Surfaces B: Biointerfaces, 81,1
(2010), 289-296.
94. N. Saha, A. Saarai, N.Roy, T.Kitano, P. Saha,“Polymeric biomaterial based
hydrogels for biomedical applications”, Journal of Biomaterials and
Nanobiotechnology (2011) 2, 85-90.
95. X. Huang , H. D. Halicka, F. Traganos, T. Tanaka , A. Kurose, Z.
Darzynkiewicz, “Cytometric assessment of DNA damage in relation to cell
cycle phase and apoptosis ”, NIH PA 2005 38(4).
96. Abbasi F, Mirzadeh H, Simjoo M , “ Hydrophilic interpenetrating polymer
networks of polydimethyl siloxane (PDMS ) as biomaterial for cochlear
implants ”,J Biomater Sci Polym Ed 2006 ; 17(3) ; 341-55.
97. Van Dyke M E, Clarson S J , Arshady R, “ Introduction to polymeric
biomaterials ”, Silicone biomaterials, PBM series, 2003 : (1) ; 109- 135.
98. Ratner B D , Hoffman A S, Schoen F J , Lemons J E , “ An introduction to
materials in medicine ”, Editors. Biomaterials Science, 2nd Ed. London:
Elsevier Academic Press; 2004.
99. Biomaterial Tutorial: Felix Simonvsky, “Polymethylsiloxanes (PDMS)”,
University of Washington Biomaterial Engineering.
100. Book : Stuart L. Cooper , C H Bamford , Teiji Tsuruta , T Suruta, “ Polymer
Biomaterials in Solution, as interfaces and as Solids”, Journal of Biomaterial
Science Polymer Edition.
J Caix, G Janvier , B Legault, L Bordenave , F Rouais, B Basse-Cathalinat, C
Baquey “ A canine ex vivo shunt for isotopic hemocompatibility evaluation
of a NHLBI DTB primary reference material and of a IUPAC reference
material ”.
101. G Bartelena, Y Loosli, T Zambelli, J G Snedeker, “Biomaterial surface
modifications can dominate cell-substrate mechanics : the impact of PDMS
plasma treatment on a quantitative assay of cell stiffness ”, Royal Society of
Chemistry , 2012, 8, 673-681.

Chatper-4 Interaction of Biomolecules with Solid Polymeric Surfaces of SU8 Microdroplet and Porous…
108
102. S Bhat, Ashok Kumar, “Biomaterials and Bioengineering tomorrow’s
healthcare”, Landes Bioscience special review, Biomatter 3:3, e24717, 2013.
103. C Hassler, T Boretius, T Stieglitz , “Polymers for Neural implants”, Journal
of Polymer Science : Part B : Polymer Physics 2011,49,18-33.
List of Publications
[A] Published international Journal Papers:
(1) Seema D.Yardi, Ankur Gupta, Poonam Saundriyal, Geeta Bhatt, Rishi Kant,
D. Boolchandani, Shantanu Bhattacharya, “High efficiency coupling of
optical fibres with SU8 micro-droplet using laser welding process ”, Laser in
Manufacturing and materials Processing, DOI:10.1007/s40516-016-0027-
6, 2016.
[B] Refereed International Conference Proceedings:
[1] Seema Yardi, D. Boolchandani, Shantanu Bhattacharya, “Polymer
Waveguide and Optical Fiber Coupling Using Whispering Gallery Modes in
an Elliptical Micro- Sleeve”, Optics in Lifesciences, Optical Society of
America, Hawaii, USA, 2013 [JT2A.12].
[C] International Conference Paper
[1] Seema Yardi, D. Boolchandani, Shantanu Bhattacharya, “Porous
Polydimethyl Siloxane (PDMS)- Acridine Orange (AO) as a biomaterial in
opto-biosensing”, International Symposium for Research Scholars (ISRS) –
(11th -13th December) 2014, IC & SR Auditorium, IIT, Madras, India .
Bio-Data
Seema D. Yardi has nearly 30 years of teaching experience. She is working as
Lecturer in Electronics, Department of Technical Education, Maharashtra State,
since September 1992 with current posting at Government Polytechnic, Aurangabad.
She obtained Bachelor’s degree in Electronics and Telecommunications [E & T/C]
from Government College of Engineering, Pune, M.S. [COEP], Master’s degree in
Electronics Engineering from Government College of Engineering, Aurangabad,
M.S., India. She is currently pursuing Ph.D. at Malaviya National Institute of
Technology, Jaipur, India, in the field of Optical signal Coupling & Bio-Sensing
under the AICTE QIP (Poly) scheme of Government of Maharashtra. Besides
teaching, she has carried out all the administrative responsibilities entrusted on her
by the department. She is currently member of IEEE, USA, life member of IETE
India, IMAPS India, ISTE India, OSA USA.

APPENDIX:
Data on Design of Experiments [DOE]:
ANOVA mathematical model
RSM: Response Surface methodology
Factors and final equations of Laser heat transfer bonding / fabrication:
Factors: Lasing speed, Lasing power
Objective: Single: Transmitance
Final Equation in terms of coded factors:
Sqrt (Transmission) =
+0.046
+0.27 * A
-0.085 * B
-0.017 * A * B
+0.21 * A2
+0.24 * B2
Final Equation in terms of Actual Factors:
t (Transmission) =
+11.12031
-0.48362 * Power
-0.90516 * Speed
-2.83637E-003 * Power * Speed
-5.80923E-003 * Power2
-0.23772 * Speed2
-------------------------------------------------------------------------------------------------------------------------
Related Documents