The International Journal of Multimedia & Its Applications (IJMA) Vol.4, No.2, April 2012 DOI : 10.5121/ijma.2012.4206 69 A NOVEL STATISTICAL FUSION RULE FOR IMAGE FUSION AND ITS COMPARISON IN NON SUBSAMPLED CONTOURLET TRANSFORM DOMAIN AND WAVELET DOMAIN Manu V T 1 and Philomina Simon 2 1 Department of Computer Science, University of Kerala, Kariavattom Campus, Thiruvananthapuram, 695 581, Kerala, India [email protected] 2 Department of Computer Science, University of Kerala, Kariavattom Campus, Thiruvananthapuram, 695 581, Kerala, India [email protected] ABSTRACT Image fusion produces a single fused image from a set of input images. A new method for image fusion is proposed based on Weighted Average Merging Method (WAMM) in the Non Subsampled Contourlet Transform (NSCT) domain. A performance analysis on various statistical fusion rules are also analysed both in NSCT and Wavelet domain. Analysis has been made on medical images, remote sensing images and multi focus images. Experimental results shows that the proposed method, WAMM obtained better results in NSCT domain than the wavelet domain as it preserves more edges and keeps the visual quality intact in the fused image. KEYWORDS Non Subsampled Contourlet Transform , Weighted Average Merging Method, Statistical Fusion Rule, Wavelet, Piella Metric 1. INTRODUCTION Image fusion provides an efficient way to merge the visual information from different images. The fused image contains complete information for better human or machine perception and computer-processing tasks, such as segmentation, feature extraction, and object recognition. Image fusion can be done in pixel level, signal level and feature based. The traditional image fusion schemes performed the fusion right on the source images, which often have serious side effects such as reducing the contrast. Later researchers realized the necessity to perform the fusion in the transform domain as mathematical transformations provides further information from the signal that is not readily available in the raw signal. With the advent of wavelet theory, the concept of wavelet multi-scale decomposition is used in image fusion [9]. The wavelet transform has been used in many image processing applications such as restoration, noise removal, image edge enhancement and feature extraction; wavelets are not very efficient in capturing the two-dimensional data found in images[5]. Several transform have been proposed for image signals that have incorporated directionality and multiresolution and hence, those methods could not efficiently capture edges in natural images. Do and Vetterli

Welcome message from author
This document is posted to help you gain knowledge. Please leave a comment to let me know what you think about it! Share it to your friends and learn new things together.
Transcript

The International Journal of Multimedia & Its Applications (IJMA) Vol.4, No.2, April 2012
DOI : 10.5121/ijma.2012.4206 69
A NOVEL STATISTICAL FUSION RULE FOR IMAGE
FUSION AND ITS COMPARISON IN NON
SUBSAMPLED CONTOURLET TRANSFORM DOMAIN
AND WAVELET DOMAIN
Manu V T
1 and Philomina Simon
2
1Department of Computer Science, University of Kerala, Kariavattom Campus,
Thiruvananthapuram, 695 581, Kerala, India [email protected]
2Department of Computer Science, University of Kerala, Kariavattom Campus,
Thiruvananthapuram, 695 581, Kerala, India [email protected]
ABSTRACT
Image fusion produces a single fused image from a set of input images. A new method for image fusion is
proposed based on Weighted Average Merging Method (WAMM) in the Non Subsampled Contourlet
Transform (NSCT) domain. A performance analysis on various statistical fusion rules are also analysed
both in NSCT and Wavelet domain. Analysis has been made on medical images, remote sensing images and
multi focus images. Experimental results shows that the proposed method, WAMM obtained better results
in NSCT domain than the wavelet domain as it preserves more edges and keeps the visual quality intact in
the fused image.
KEYWORDS
Non Subsampled Contourlet Transform , Weighted Average Merging Method, Statistical Fusion Rule,
Wavelet, Piella Metric
1. INTRODUCTION
Image fusion provides an efficient way to merge the visual information from different images.
The fused image contains complete information for better human or machine perception and
computer-processing tasks, such as segmentation, feature extraction, and object recognition.
Image fusion can be done in pixel level, signal level and feature based. The traditional image
fusion schemes performed the fusion right on the source images, which often have serious side
effects such as reducing the contrast. Later researchers realized the necessity to perform the
fusion in the transform domain as mathematical transformations provides further information
from the signal that is not readily available in the raw signal.
With the advent of wavelet theory, the concept of wavelet multi-scale decomposition is used in
image fusion [9]. The wavelet transform has been used in many image processing applications
such as restoration, noise removal, image edge enhancement and feature extraction; wavelets are
not very efficient in capturing the two-dimensional data found in images[5]. Several transform
have been proposed for image signals that have incorporated directionality and multiresolution
and hence, those methods could not efficiently capture edges in natural images. Do and Vetterli
The International Journal of Multimedia & Its Applications (IJMA) Vol.4, No.2, April 2012
70
proposed contourlet transform[8], an efficient directional multi resolution image representation.
The contourlet transform achieves better results than discrete wavelet transform in image
processing in geometric transformations. The contourlet transform is shift-variant based on
sampling. However, shift invariance is a necessary condition in image processing applications.
The NSCT is a fully shift-invariant, multiscale and multidirection expansion that has a fast
implementation[1]. It achieves a similar sub band decomposition as that of contourlets, but
without downsamplers and upsamplers in it, thus overcoming the problem of shift variance[2].
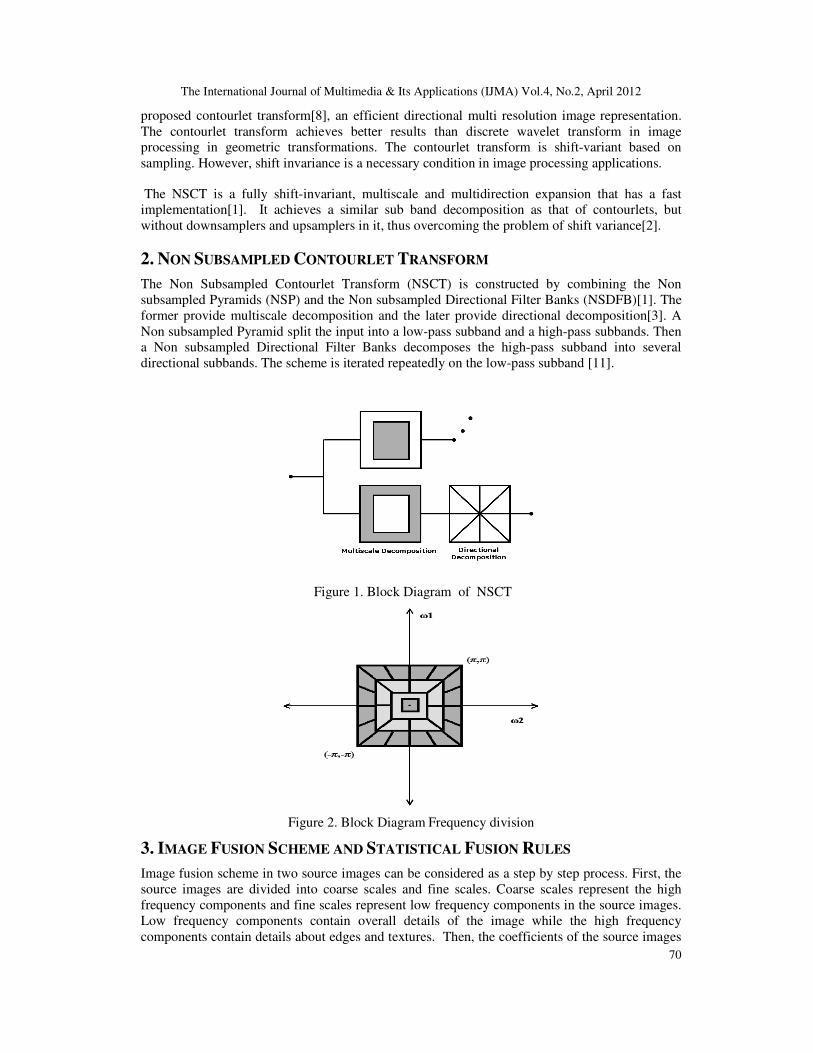
2. NON SUBSAMPLED CONTOURLET TRANSFORM
The Non Subsampled Contourlet Transform (NSCT) is constructed by combining the Non
subsampled Pyramids (NSP) and the Non subsampled Directional Filter Banks (NSDFB)[1]. The
former provide multiscale decomposition and the later provide directional decomposition[3]. A
Non subsampled Pyramid split the input into a low-pass subband and a high-pass subbands. Then
a Non subsampled Directional Filter Banks decomposes the high-pass subband into several
directional subbands. The scheme is iterated repeatedly on the low-pass subband [11].
Figure 1. Block Diagram of NSCT
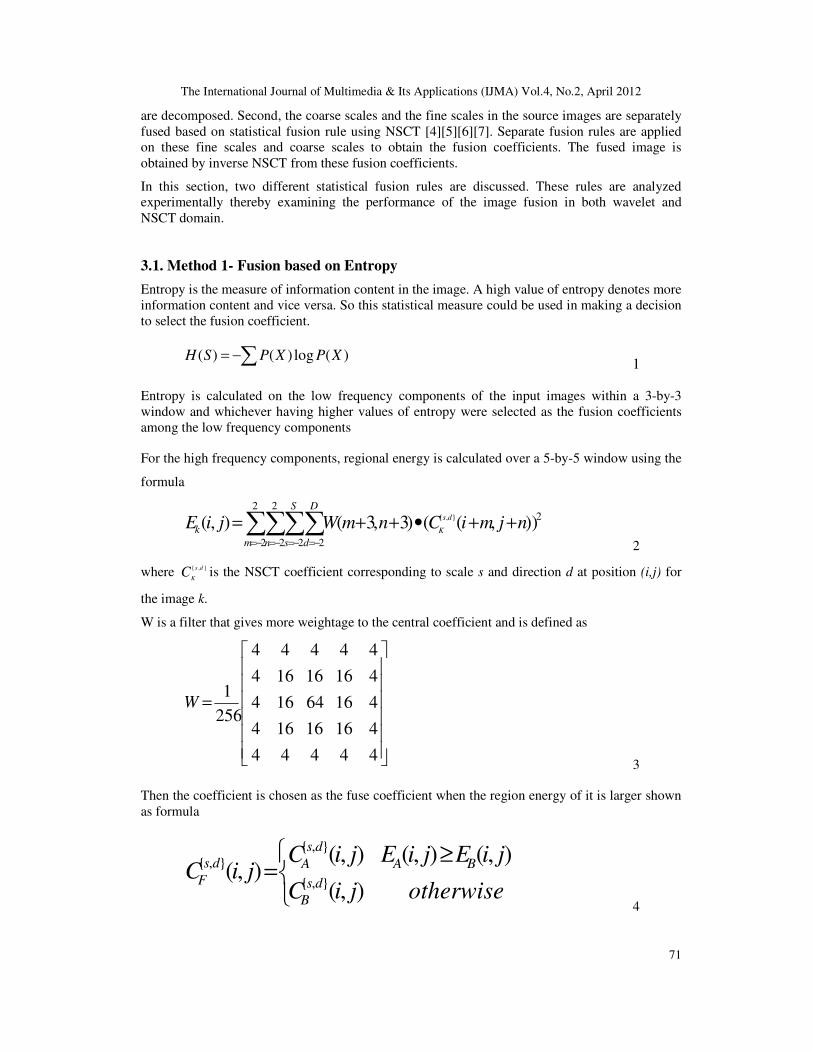
Figure 2. Block Diagram Frequency division
3. IMAGE FUSION SCHEME AND STATISTICAL FUSION RULES
Image fusion scheme in two source images can be considered as a step by step process. First, the
source images are divided into coarse scales and fine scales. Coarse scales represent the high
frequency components and fine scales represent low frequency components in the source images.
Low frequency components contain overall details of the image while the high frequency
components contain details about edges and textures. Then, the coefficients of the source images
The International Journal of Multimedia & Its Applications (IJMA) Vol.4, No.2, April 2012
71
are decomposed. Second, the coarse scales and the fine scales in the source images are separately
fused based on statistical fusion rule using NSCT [4][5][6][7]. Separate fusion rules are applied
on these fine scales and coarse scales to obtain the fusion coefficients. The fused image is
obtained by inverse NSCT from these fusion coefficients.
In this section, two different statistical fusion rules are discussed. These rules are analyzed
experimentally thereby examining the performance of the image fusion in both wavelet and
NSCT domain.
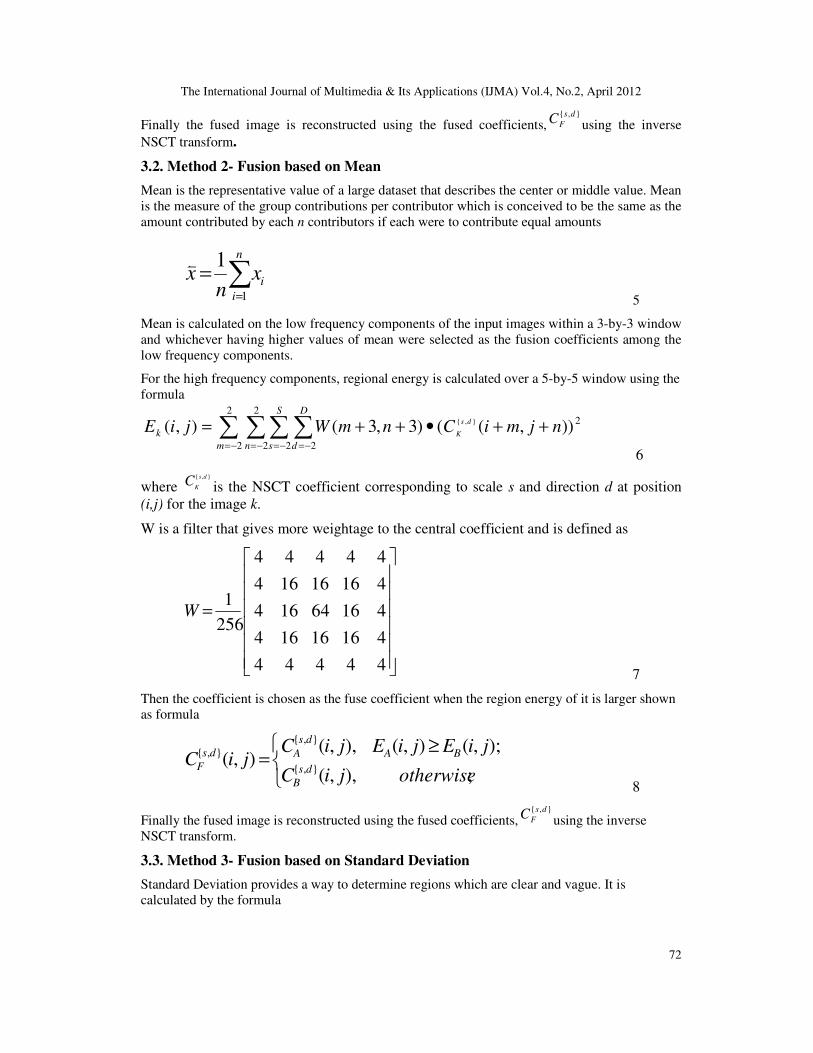
3.1. Method 1- Fusion based on Entropy
Entropy is the measure of information content in the image. A high value of entropy denotes more
information content and vice versa. So this statistical measure could be used in making a decision
to select the fusion coefficient.
∑−= )(log)()( XPXPSH 1
Entropy is calculated on the low frequency components of the input images within a 3-by-3
window and whichever having higher values of entropy were selected as the fusion coefficients
among the low frequency components
For the high frequency components, regional energy is calculated over a 5-by-5 window using the
formula
∑∑∑∑−= −= −= −=
++•++=2
2
2
2 2 2
2)),(()3,3(),( },{
m n
S
s
D
d
k njmiCnmWjiEds
K
2
where },{ ds
KC is the NSCT coefficient corresponding to scale s and direction d at position (i,j) for
the image k.
W is a filter that gives more weightage to the central coefficient and is defined as
=
44444
41616164
41664164
41616164
44444
256
1W
3
Then the coefficient is chosen as the fuse coefficient when the region energy of it is larger shown
as formula
≥
=otherwisejiC
jiEjiEjiCjiC
ds
B
BA
ds
Ads
F),(
),(),(),(),(
},{
},{
},{
4
The International Journal of Multimedia & Its Applications (IJMA) Vol.4, No.2, April 2012
72
Finally the fused image is reconstructed using the fused coefficients,},{ ds
FC using the inverse
NSCT transform.
3.2. Method 2- Fusion based on Mean
Mean is the representative value of a large dataset that describes the center or middle value. Mean
is the measure of the group contributions per contributor which is conceived to be the same as the
amount contributed by each n contributors if each were to contribute equal amounts
∑=
=n
i
ixn
x1
1w
5
Mean is calculated on the low frequency components of the input images within a 3-by-3 window
and whichever having higher values of mean were selected as the fusion coefficients among the
low frequency components.
For the high frequency components, regional energy is calculated over a 5-by-5 window using the
formula
∑ ∑∑∑−= −= −= −=
++•++=2
2
2
2 2 2
2)),(()3,3(),( },{
m n
S
s
D
d
k njmiCnmWjiE ds
K
6
where },{ ds
KC is the NSCT coefficient corresponding to scale s and direction d at position
(i,j) for the image k.
W is a filter that gives more weightage to the central coefficient and is defined as
=
44444
41616164
41664164
41616164
44444
256
1W
7
Then the coefficient is chosen as the fuse coefficient when the region energy of it is larger shown
as formula
≥
=;),,(
);,(),(),,(),(
},{
},{
},{
otherwisejiC
jiEjiEjiCjiC
ds
B
BA
ds
Ads
F
8
Finally the fused image is reconstructed using the fused coefficients,},{ ds
FC using the inverse
NSCT transform.
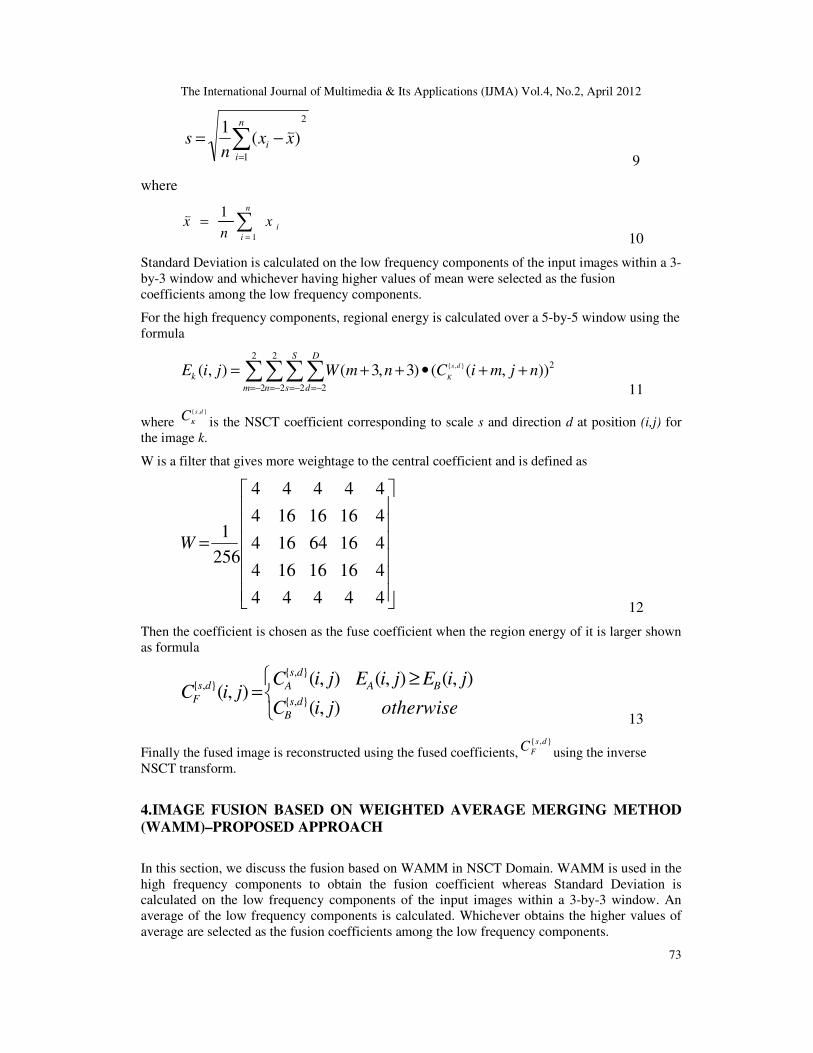
3.3. Method 3- Fusion based on Standard Deviation
Standard Deviation provides a way to determine regions which are clear and vague. It is
calculated by the formula
The International Journal of Multimedia & Its Applications (IJMA) Vol.4, No.2, April 2012
73
2
1
)(1∑
=
−=n
i
i xxn
sw
9
where
∑=
=n
i
ixn
x1
1w
10
Standard Deviation is calculated on the low frequency components of the input images within a 3-
by-3 window and whichever having higher values of mean were selected as the fusion
coefficients among the low frequency components.
For the high frequency components, regional energy is calculated over a 5-by-5 window using the
formula
∑∑∑∑−= −= −= −=
++•++=2
2
2
2 2 2
2)),(()3,3(),( },{
m n
S
s
D
d
k njmiCnmWjiEds
K
11
where },{ ds
KC is the NSCT coefficient corresponding to scale s and direction d at position (i,j) for
the image k.
W is a filter that gives more weightage to the central coefficient and is defined as
=
44444
41616164
41664164
41616164
44444
256
1W
12
Then the coefficient is chosen as the fuse coefficient when the region energy of it is larger shown
as formula
≥
=otherwisejiC
jiEjiEjiCjiC
ds
B
BA
ds
Ads
F),(
),(),(),(),(
},{
},{
},{
13
Finally the fused image is reconstructed using the fused coefficients,},{ ds
FC using the inverse
NSCT transform.
4.IMAGE FUSION BASED ON WEIGHTED AVERAGE MERGING METHOD
(WAMM)–PROPOSED APPROACH
In this section, we discuss the fusion based on WAMM in NSCT Domain. WAMM is used in the
high frequency components to obtain the fusion coefficient whereas Standard Deviation is
calculated on the low frequency components of the input images within a 3-by-3 window. An
average of the low frequency components is calculated. Whichever obtains the higher values of
average are selected as the fusion coefficients among the low frequency components.

The International Journal of Multimedia & Its Applications (IJMA) Vol.4, No.2, April 2012
74
The main features of this new method are that it preserves the image quality and the edge details
of the fused image. The visual quality of the fused image is better in NSCT domain.
The Weighted Average Merging Method (WAMM) is formulated as
<+=
≥+=
);,(),(),,(),(),(
);,(),(),,(),(),(},{
max
},{
min
},{
},{
min
},{
max
},{
jiEjiEjiCwjiCwjiC
jiEjiEjiCwjiCwjiC
BA
ds
B
ds
A
ds
F
BA
ds
B
ds
A
ds
F
14
The weights are estimated as:
−=
−
−−=
<==
otherWWT
MW
TpMWW
AB
AB
,1,1
1
2
1
2
1
;)(,1,0
minmaxmin
maxmin
15
Where T denote the threshold and T∈ (0,0.5).
When the weight is zero, this means the substitution of an image by another.
)( pM AB is called the match measure which is defined as
)()(
),(),(),(2
)(,
},{},{
pEpE
tnsmCtnsmCtsw
pMBA
TtSs
AB
ds
B
ds
A
+
++++
=
∑∈∈
16
Figure 3: Schematic Diagram of WAMM

The International Journal of Multimedia & Its Applications (IJMA) Vol.4, No.2, April 2012
75
4.1 Fusion Based on Proposed Method in NSCT Domain
Standard Deviation is calculated on the low frequency components of the input images within a 3-
by-3 window and whichever has the higher values of Mean are selected as the fusion coefficients
among the low frequency components.
While WAMM is used in the high frequency components to obtain the fusion coefficient . The
high frequency component has the crucial information within the images like the texture,
brightness and contrast. The WAMM takes care of preserving these details much more better than
the fusion schemes that we discussed before.
Figure 4: Schematic Diagram of Proposed Method
The use of standard deviation enhances the fusion scheme by preserving the edges in the images,
while WAMM help to preserve the texture and other detailed information in the images by
providing a way to combine the values without much bias, ie, a low value is compensated by
giving a proper weight to provide a considerable contribution with respect to a high value.
5. PERFORMANCE MEASURES
The issue in the performance evaluation of an image fusion algorithm is that the unavailability of
reference images. In addition, relevant research shows that a single measurement cannot be
effectively evaluate the performance of different fusion algorithms or always cannot be consistent
with human visual perception.
(1) Qualitative approaches: involves visual comparison of the input images and the output image.
(2) Quantitative approaches: involves a set of pre-defined quality indicators for measuring the
spectral and spatial similarities between the fused image and the original images.

The International Journal of Multimedia & Its Applications (IJMA) Vol.4, No.2, April 2012
76
Because qualitative approaches and visual evaluations may contain subjective factor and may be
influenced by personal preference, quantitative approaches are often required to prove the
correctness of the visual evaluation.
For quantitative evaluation, a variety of fusion quality assessment methods have been introduced
by different authors. The quality indexes/indicators introduced include, for example, Standard
Deviation (SD), Mean Absolute Error (MAE), Root Mean Square Error (RMSE), Sum Squared
Error (SSE) based Index, Agreement Coefficient based on Sum Squared Error (SSE), Mean
Square Error (MSE) and Root Mean Square Error, Information Entropy, Spatial Distortion Index,
Mean Bias Error (MBE), Bias Index, Correlation Coefficient (CC), Warping Degree (WD),Piella
Metric (P), Spectral Distortion Index (SDI), Image Fusion Quality Index (IFQI), Spectral Angle
Mapper (SAM), Relative Dimensionless Global Error (ERGAS),etc. However, it is also not easy
for a quantitative method to provide convincing measurements.
In our work, objective analysis of the proposed method is done using the performance metrics.
Even though these metrics do not provide a foolproof estimate of the performance of the method,
they can be used in comparative analysis as a performance indicator. Following are the metrics
used for performance evaluation in this research work.
5.1. Entropy
Entropy is a measure of information content of an image. It helps to know the information content
of the source images and the output fused image. An increased value of entropy of the fused
image implies a better fusion scheme.
∑−= )(log)()( XPXPSH 17
5.2. Similarity Measure
The magnitude of gradient G ( m, n) at a point (m, n) of image F is obtained by
}),1(),()1,1(),({2
1=n) m, (G nmFnmFnmFnmF +−+++−
18
where G1, G2 are the gradient images of input images. Then G1, G2 are combined into ''
G by
taking the maximum gradient value at each position.''
G can be seen as the gradient image of the
ideal fusion image. The gradients of the actual fusion image G are also calculated. The similarity
S between the ideal fusion image and the actual fused image is calculated by formula
∑∑∑
′+
′−−=′
22
2
)),(()),((
)),(),((1),(
nmGnmG
nmGnmGGGS
19
A higher value of S would indicate a better fusion scheme.
5.3. Piella Metric
Let x={xi|i=1,2,…,N} and y={yi|i=1,2,…,N} be the original and the test image signals,
respectively. The Universal Image Quality index proposed by Zhou Wang [13] is defined as

The International Journal of Multimedia & Its Applications (IJMA) Vol.4, No.2, April 2012
77
,])())[((
42222
yx
yxQ
yx
xy
++=
σσ
σ
20
∑=
=n
i
ixN
x1
1w
21
∑=
=n
i
ixN
y1
1
22
23
24
25
This quality index models any distortion as a combination of three different factors: Loss of
Correlation, Luminance Distortion, and Contrast Distortion. In order to understand this, the
definition of Q can be rewritten as a product of three components:
26
The first component is the correlation coefficient between x and y, which measures the degree of
linear correlation between x and y, and its dynamic range is [-1,1]. The best value 1 is obtained
when yi = axi+b for all i=1,2,…,N, where a and b are constants and a>0. Even if x and y are
linearly related, there still might be relative distortions between them, which are evaluated in
second and third components. The second component, with a value range of [0,1], measures how
close the mean luminance is between x and y. It equals 1 if and only if yx = xσ and yσ
can be
viewed as estimate of the contrast of x and y, so the third component measures how similar the
contrasts of the images are. Its range of values is also [0,1],where the best value 1 is achieved if
and only if xσ= yσ
.
Piella Metric[13] is a quality measure which is derived from the above mentioned metric and
offers much more focus on the locality of reference of the images. It takes into account region-
based measurements to estimate how well the important information in the source images is
represented by the fused image. The evaluation of Piella Metric of the fused image f of the input
images a and b is defined as
The International Journal of Multimedia & Its Applications (IJMA) Vol.4, No.2, April 2012
78
α),,(),,(),,( fbaQfbaQfbaQ WWE′′′⋅=
27
where fba ′′′ ,, are the edge images of a, b and f respectively. Canny operator is selected to
detect the edge information, which detects the edges by searching the local maximum of image
gradient. Canny operator detects the strong edges and weak edges with two thresholds,
respectively, where the thresholds are system automatic selection. The Canny operator is not
sensitive to noise and can detect the true weak edges.
In order to measure the metric, a sliding window is employed: starting from the top-left corner of
the two images, a sliding window of a fixed size traverses over the entire image until the bottom-
right corner is reached. For each window the local quality index is computed. Finally, the overall
image quality index is computed by averaging all local quality indices.
),,( fbaQW is the weighted fusion quality index and is defined as
( )∑∈
−+=Ww
W wfbQwwfaQwwcfbaQ ),())(1(),()()(),,( 00 λλ 28
where )(wλ is a local weight given by
)()(
)()(
wbswas
wasw
+=λ
29
where )( was
is some saliency of image a in window w. The energy is selected as the salient
feature and the size of the window is 3 by 3 and it is moved starting from the top-left corner of the
two images until the bottom-right corner is reached
The overall saliency of a window is defined as
( ))(),(max)( wbswaswC = 30
′
=
∑∈′ ww
wC
wCwc
/
)(
)()(
31
The Keywords section begins with the word, “Keywords” in 13 pt. Times New Roman, bold
italics, “Small Caps” font with a 6pt. spacing following. There may be up to five keywords (or
short phrases) separated by commas and six spaces, in 10 pt. Times New Roman italics. An 18
pt. line spacing follows.
6. RESULT ANALYSIS
Image Fusion techniques requires the registered images for testing. Image Registration [4] is the
determination of a geometrical transformation that aligns points in one view of an object with
corresponding points in another view of that object or another object. The experiments are carried
out with the registered images.
The various statistical rules have been analyzed and the proposed statistical fusion rule (WAMM)
is tested in both wavelet domain and NSCT domain on Medical images, Remote Sensing images
and Multi Focus images.
The International Journal of Multimedia & Its Applications (IJMA) Vol.4, No.2, April 2012
79
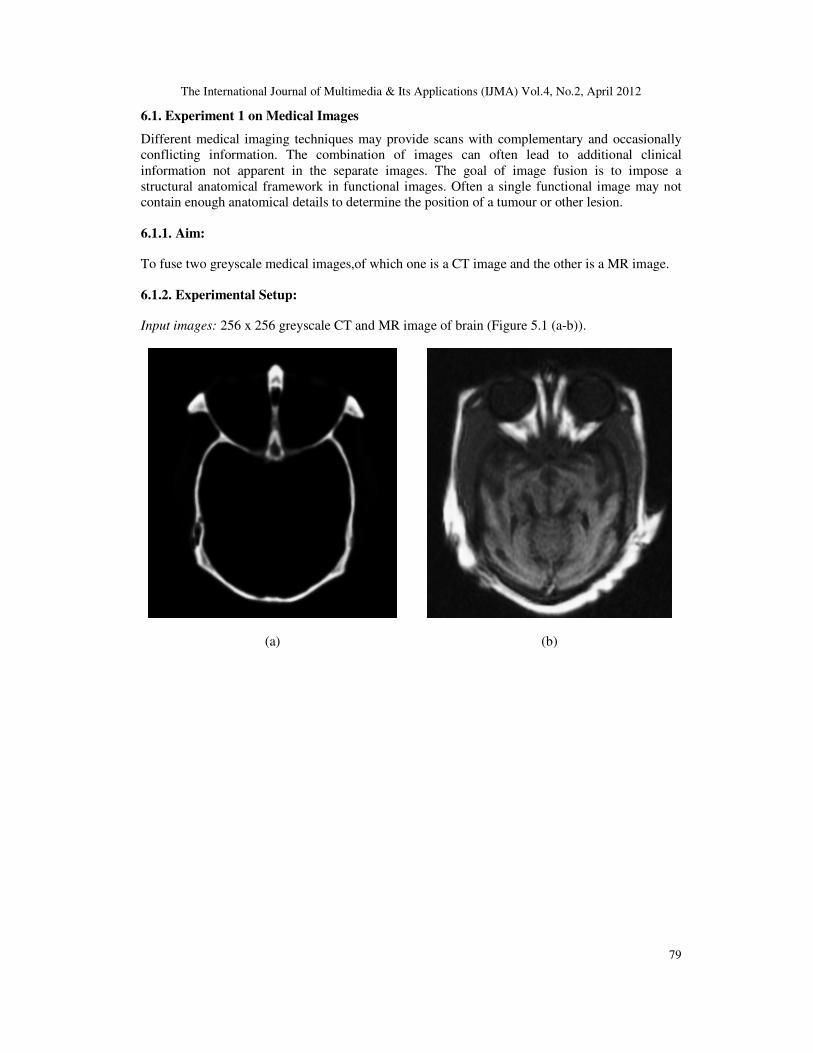
6.1. Experiment 1 on Medical Images
Different medical imaging techniques may provide scans with complementary and occasionally
conflicting information. The combination of images can often lead to additional clinical
information not apparent in the separate images. The goal of image fusion is to impose a
structural anatomical framework in functional images. Often a single functional image may not
contain enough anatomical details to determine the position of a tumour or other lesion.
6.1.1. Aim:
To fuse two greyscale medical images,of which one is a CT image and the other is a MR image.
6.1.2. Experimental Setup:
Input images: 256 x 256 greyscale CT and MR image of brain (Figure 5.1 (a-b)).
(a)
(b)

The International Journal of Multimedia & Its Applications (IJMA) Vol.4, No.2, April 2012
80
(c)
(d)
Figure 5:(a)CT image (b)MR image (c)Wavelet fused image using Entropy
(d) NSCT fused image using Entropy
(e)
(f)

The International Journal of Multimedia & Its Applications (IJMA) Vol.4, No.2, April 2012
81
(g)
(h)
Figure 5:(e) Wavelet fused image using Mean(f) NSCT fused image using Mean
(g) Wavelet fused image using SD (h) NSCT fused image using SD
(i)
(j)
Figure 5:(i) Wavelet fused image using WAMM (j)NSCT fused image using WAMM
The International Journal of Multimedia & Its Applications (IJMA) Vol.4, No.2, April 2012
82
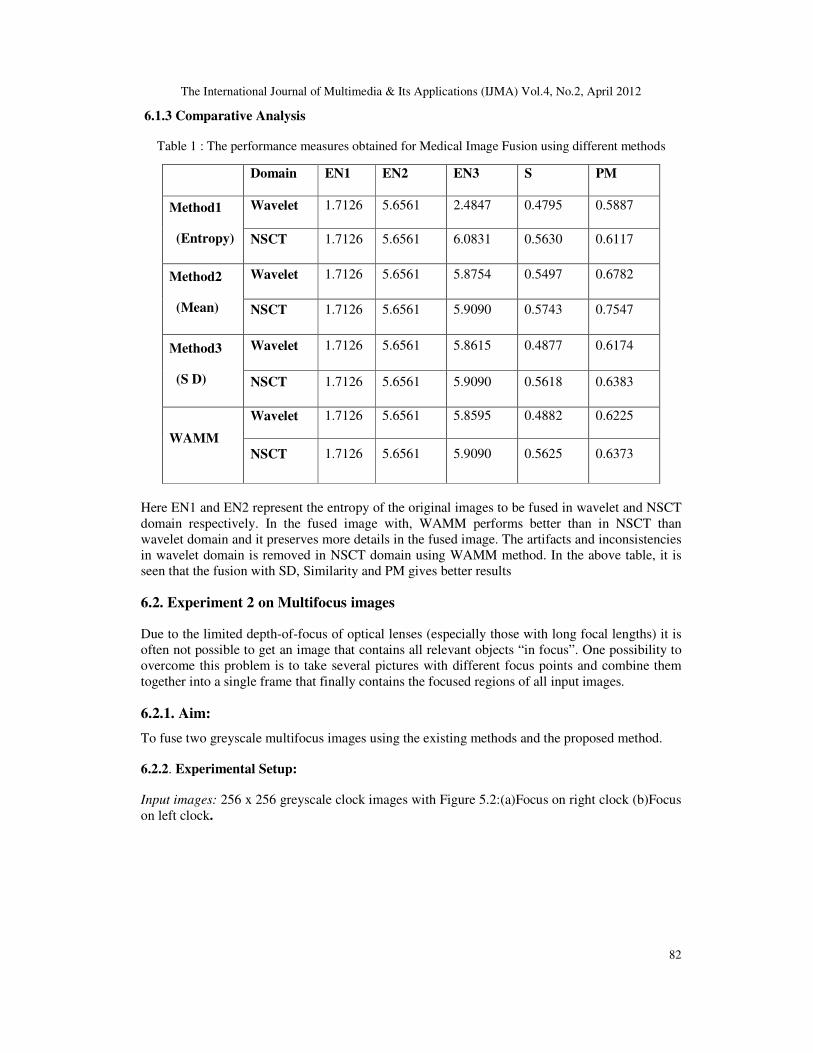
6.1.3 Comparative Analysis
Table 1 : The performance measures obtained for Medical Image Fusion using different methods
Here EN1 and EN2 represent the entropy of the original images to be fused in wavelet and NSCT
domain respectively. In the fused image with, WAMM performs better than in NSCT than
wavelet domain and it preserves more details in the fused image. The artifacts and inconsistencies
in wavelet domain is removed in NSCT domain using WAMM method. In the above table, it is
seen that the fusion with SD, Similarity and PM gives better results
6.2. Experiment 2 on Multifocus images
Due to the limited depth-of-focus of optical lenses (especially those with long focal lengths) it is
often not possible to get an image that contains all relevant objects “in focus”. One possibility to
overcome this problem is to take several pictures with different focus points and combine them
together into a single frame that finally contains the focused regions of all input images.
6.2.1. Aim:
To fuse two greyscale multifocus images using the existing methods and the proposed method.
6.2.2. Experimental Setup:
Input images: 256 x 256 greyscale clock images with Figure 5.2:(a)Focus on right clock (b)Focus
on left clock.
Domain EN1 EN2 EN3 S PM
Method1
(Entropy)
Wavelet 1.7126 5.6561 2.4847 0.4795 0.5887
NSCT 1.7126 5.6561 6.0831 0.5630 0.6117
Method2
(Mean)
Wavelet 1.7126 5.6561 5.8754 0.5497 0.6782
NSCT 1.7126 5.6561 5.9090 0.5743 0.7547
Method3
(S D)
Wavelet 1.7126 5.6561 5.8615 0.4877 0.6174
NSCT 1.7126 5.6561 5.9090 0.5618 0.6383
WAMM
Wavelet 1.7126 5.6561 5.8595 0.4882 0.6225
NSCT 1.7126 5.6561 5.9090 0.5625 0.6373

The International Journal of Multimedia & Its Applications (IJMA) Vol.4, No.2, April 2012
83
6.2.3. Results:
(a)
(b)
(c)
(d)
Figure 6:(a)Focus on right clock (b)Focus on left clock (c)Wavelet fused image using Entropy
(d) NSCT fused image using Entropy

The International Journal of Multimedia & Its Applications (IJMA) Vol.4, No.2, April 2012
84
(e)
(f)
(g)
(h)
Fig 6 (e) Wavelet fused image using Mean(f) NSCT fused image using Mean(g) Wavelet fused
image using SD(h) NSCT fused image using SD
The International Journal of Multimedia & Its Applications (IJMA) Vol.4, No.2, April 2012
85
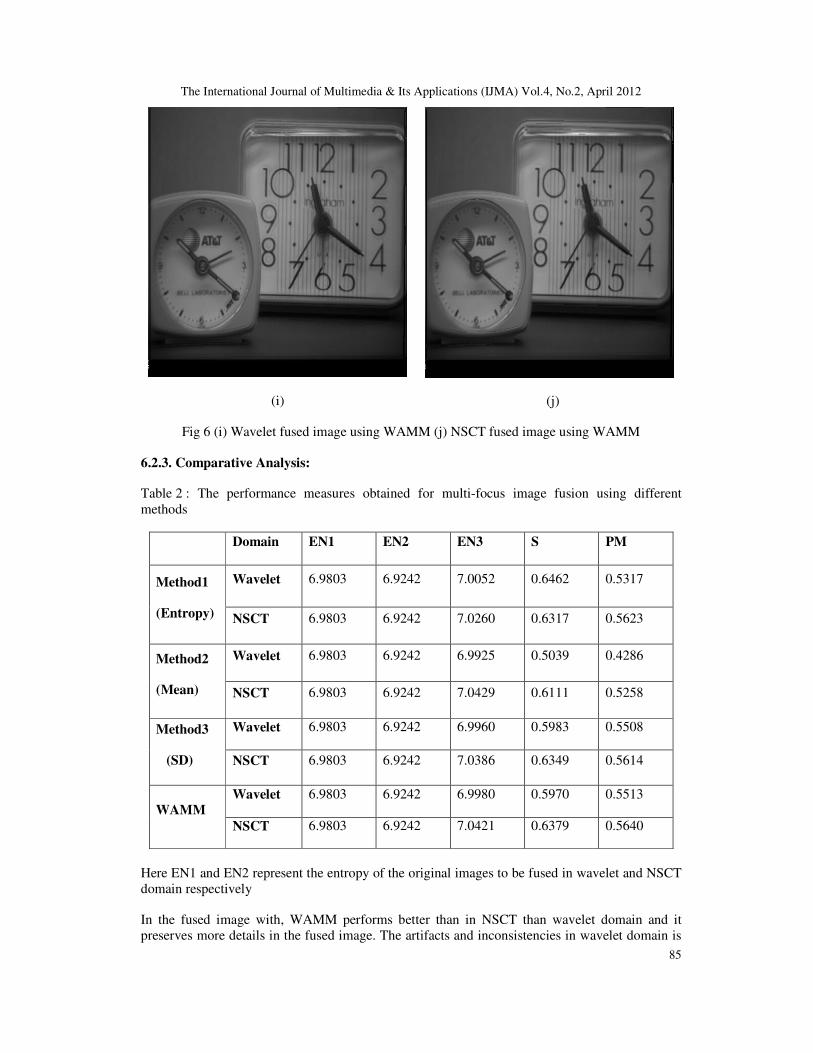
(i)
(j)
Fig 6 (i) Wavelet fused image using WAMM (j) NSCT fused image using WAMM
6.2.3. Comparative Analysis:
Table 2 : The performance measures obtained for multi-focus image fusion using different
methods
Domain EN1 EN2 EN3 S PM
Method1
(Entropy)
Wavelet 6.9803 6.9242 7.0052 0.6462 0.5317
NSCT 6.9803 6.9242 7.0260 0.6317 0.5623
Method2
(Mean)
Wavelet 6.9803 6.9242 6.9925 0.5039 0.4286
NSCT 6.9803 6.9242 7.0429 0.6111 0.5258
Method3
(SD)
Wavelet 6.9803 6.9242 6.9960 0.5983 0.5508
NSCT 6.9803 6.9242 7.0386 0.6349 0.5614
WAMM
Wavelet 6.9803 6.9242 6.9980 0.5970 0.5513
NSCT 6.9803 6.9242 7.0421 0.6379 0.5640
Here EN1 and EN2 represent the entropy of the original images to be fused in wavelet and NSCT
domain respectively
In the fused image with, WAMM performs better than in NSCT than wavelet domain and it
preserves more details in the fused image. The artifacts and inconsistencies in wavelet domain is

The International Journal of Multimedia & Its Applications (IJMA) Vol.4, No.2, April 2012
86
removed in NSCT domain using WAMM method. In the above table, it is seen that the fusion
with SD, Similarity and PM gives better results.
7. CONCLUSIONS
In this work, a new statistical fusion rule, Weighted Average Merging Method (WAMM) is
proposed in NSCT domain. A review of the different statistical fusion rules such as Entropy ,
Mean ,Standard Deviation and Weighted Arithmetic Merging Method is discussed. In the method,
fusion rule using Standard Deviation, the edge information is preserved successfully within the
image, but image lacked visual quality that we expected. So in order to overcome the limitations
of the existing statistical fusion rules, the combination of Standard Deviation in the coarse scales
and Weighted Arithmetic Merging Method (WAMM) in the fine scales is proposed.
A new statistical fusion rule, WAMM is proposed in NSCT domain. Experimental results shows
that WAMM method for image fusion obtained better results in NSCT domain when tested with
performance measures, SD, Similarity and Piella Metric. It preserves the edge details and the
visual quality of the fused image. The analysis obtained shows that the proposed WAMM yields
better results in NSCT domain. This proposed scheme is tested both in NSCT and in wavelet
domain and the results were compared and obtained better results. As a future work, an Adaptive
Weighted Average Merging Method can be suggested.
ACKNOWLEDGEMENTS
All authors would like to thank Dr. Oliver Rockinger and the TNO Human Factors Research
Institute for providing the source IR and visible images that are publicly available online at
http://www.imagefusion.org.
REFERENCES
[1] A. L. Cunha, J. Zhou and M. N. Do, “The Nonsubsampled Contourlet Transform: Theory, Design and
Applications", IEEE Trans. Image Processing ,vol.15, no. 10, pp. 3089-3101, Oct. 2006
[2] J. Zhou, A. L. da Cunha, and M. N. Do , “Nonsubsampled contourlet transform: Construction and
Application in Enhancement", Proc. of IEEE International Conference on Image Processing , Sep.
2005.
[3] J. Zhou, A. L. da Cunha, and M. N. Do , “Nonsubsampled contourlet transform: Filter design and
application in image denoising ", Proc. of IEEE International Conference on Image Processing , Sep.
2005.
[4] Bin Yang ,Shutao Li and Fengmei Sun . Image Fusion Using Nonsubsampled Contourlet Transform ",
IEEE International Conference on Image and Graphics , 2007.
[5] Heng Ma, Chuanying Jia, and Shuang Liu. “Multisource Image Fusion Based on Wavelet Transform",
International Journal of Information Technology, Vol. 11, No. 7, 2005.
[6] Lei Tang , Feng Zhao, Zong-Gui Zhao . “The Nonsubsampled contourlet transform for image fusion"
,Proc. of the International Conference on Wavelet Analysis and Pattern Recognition ,Nov. 2007.
[7] Qiang Fu, Fenghua Ren, Legeng Chen. Multi-focus Image “Fusion Algorithm Based on
Nonsubsampled Contourlet Transform" Proc. of IEEE International Conference on Image Processing,
2010.
[8] Do M N, Vetterli M. “The contourlet transform: an efficient directional amultiresolution image
representation" ,IEEE Transactions on Image Processing, 2005
The International Journal of Multimedia & Its Applications (IJMA) Vol.4, No.2, April 2012
87
[9] M. J. Shensa. “The discrete wavelet transform: Wedding the trous and Mallat algorithms",IEEE
Trans. Signal Process.,vol. 40, no. 10, pp.24642482, Oct. 1992.
[10] R. Gonzalez and R. Woods. Digital Image Processing, 3rd Edition. Prentice Hall, 2009.
[11] R. H. Bamberger and M. J. T. Smith. “A Filter bank for the directional decomposition of images:
Theory and design",IEEE Trans. Signal Process., vol. 40, no. 4, pp. 882893, Apr. 1992.
[12] G. Piella and H. Heijmans, “A new quality metric for image fusion” In Proc. Int. Conf. Image
Processing, Barcelona, Spain, pp. 173-6, 2003.World Academy of Science, Engineering and
Technology 7 2005.
[13] Z. Wang and A. C. Bovik. “A universal image quality index” IEEE Signal Processing Letters, Vol.
9, No. 3, pp. 81–84, 2002.
[14] Barbara Zitova´, Jan Flusser, ” Image registration methods: a survey “.Image and Vision Computing
21 (2003) 977–1000
Authors
Manu.V.T. was born in Kerala, India on June 19,
1985. He graduated in Computer
Science & Engineering from National
Institute of Technology, Calicut, India
in 2007. He did his masters at
University of Kerala with specialization
in Digital Image Computing. His area of
interest are image processing and
operating systems .
PhilominaSimon did her B.Tech(Govt Engg
College, Thiruvananthapuram), and
M.Tech CSE from Pondicherry
University. Her area of interest are
artificial intelligence,computer
networks and image processing
Related Documents