Citation: Romero, M.; Marrero-Ponce, Y.; Rodríguez, H.; Agüero-Chapin, G.; Antunes, A.; Aguilera-Mendoza, L.; Martinez-Rios, F. A Novel Network Science and Similarity-Searching-Based Approach for Discovering Potential Tumor-Homing Peptides from Antimicrobials. Antibiotics 2022, 11, 401. https://doi.org/10.3390/ antibiotics11030401 Academic Editor: Mire Zloh Received: 1 February 2022 Accepted: 15 March 2022 Published: 17 March 2022 Publisher’s Note: MDPI stays neutral with regard to jurisdictional claims in published maps and institutional affil- iations. Copyright: © 2022 by the authors. Licensee MDPI, Basel, Switzerland. This article is an open access article distributed under the terms and conditions of the Creative Commons Attribution (CC BY) license (https:// creativecommons.org/licenses/by/ 4.0/). antibiotics Article A Novel Network Science and Similarity-Searching-Based Approach for Discovering Potential Tumor-Homing Peptides from Antimicrobials Maylin Romero 1 , Yovani Marrero-Ponce 2, * , Hortensia Rodríguez 1 , Guillermin Agüero-Chapin 3,4 , Agostinho Antunes 3,4 , Longendri Aguilera-Mendoza 5 and Felix Martinez-Rios 6 1 School of Chemical Sciences and Engineering, Yachay Tech University, Hda. San Jose s/n y Proyecto Yachay, Urcuqui 100119, Ecuador; [email protected] (M.R.); [email protected] (H.R.) 2 Universidad San Francisco de Quito (USFQ), Grupo de Medicina Molecular y Traslacional (MeM&T), Colegio de Ciencias de la Salud (COCSA), Escuela de Medicina, Edificio de Especialidades Médicas, Diego de Robles y vía Interoceánica, Pichincha, Quito 170157, Ecuador 3 CIIMAR/CIMAR, Centro Interdisciplinar de Investigação Marinha e Ambiental, Universidade do Porto, Terminal de Cruzeiros do Porto de Leixões, Av. General Norton de Matos, s/n, 4450-208 Porto, Portugal; [email protected] (G.A.-C.); [email protected] (A.A.) 4 Departamento de Biologia, Faculdade de Ciências, Universidade do Porto, Rua do Campo Alegre, 4169-007 Porto, Portugal 5 Departamento de Ciencias de la Computación, Centro de Investigación Científica y de Educación Superior de Ensenada (CICESE), Ensenada 22860, Baja California, Mexico; [email protected] 6 Facultad de Ingeniería, Universidad Panamericana, Augusto Rodin No. 498, Insurgentes Mixcoac, Benito Juárez, Ciudad de México 03920, Mexico; [email protected] * Correspondence: [email protected] or [email protected]; Tel.: +593-2-297-1700 (ext. 4021) Abstract: Peptide-based drugs are promising anticancer candidates due to their biocompatibility and low toxicity. In particular, tumor-homing peptides (THPs) have the ability to bind specifically to cancer cell receptors and tumor vasculature. Despite their potential to develop antitumor drugs, there are few available prediction tools to assist the discovery of new THPs. Two webservers based on machine learning models are currently active, the TumorHPD and the THPep, and more recently the SCMTHP. Herein, a novel method based on network science and similarity searching implemented in the starPep toolbox is presented for THP discovery. The approach leverages from exploring the structural space of THPs with Chemical Space Networks (CSNs) and from applying centrality measures to identify the most relevant and non-redundant THP sequences within the CSN. Such THPs were considered as queries (Qs) for multi-query similarity searches that apply a group fusion (MAX- SIM rule) model. The resulting multi-query similarity searching models (SSMs) were validated with three benchmarking datasets of THPs/non-THPs. The predictions achieved accuracies that ranged from 92.64 to 99.18% and Matthews Correlation Coefficients between 0.894–0.98, outperforming state- of-the-art predictors. The best model was applied to repurpose AMPs from the starPep database as THPs, which were subsequently optimized for the TH activity. Finally, 54 promising THP leads were discovered, and their sequences were analyzed to encounter novel motifs. These results demonstrate the potential of CSNs and multi-query similarity searching for the rapid and accurate identification of THPs. Keywords: cancer; tumor-homing peptide; in silico drug discovery; complex network; chemical space network; centrality measure; similarity searching; group fusion; motif discovery; starPep toolbox software 1. Introduction Cancer is a group of diseases developed in different cell and tissue types, and cor- responds to the second leading cause of death globally [1]. It is based on the abnormal growth of cells due to an inherited genetic mutation or induced by the environment [2]. Antibiotics 2022, 11, 401. https://doi.org/10.3390/antibiotics11030401 https://www.mdpi.com/journal/antibiotics

Welcome message from author
This document is posted to help you gain knowledge. Please leave a comment to let me know what you think about it! Share it to your friends and learn new things together.
Transcript
�����������������
Citation: Romero, M.;
Marrero-Ponce, Y.; Rodríguez, H.;
Agüero-Chapin, G.; Antunes, A.;
Aguilera-Mendoza, L.; Martinez-Rios,
F. A Novel Network Science and
Similarity-Searching-Based Approach
for Discovering Potential
Tumor-Homing Peptides from
Antimicrobials. Antibiotics 2022, 11,
401. https://doi.org/10.3390/
antibiotics11030401
Academic Editor: Mire Zloh
Received: 1 February 2022
Accepted: 15 March 2022
Published: 17 March 2022
Publisher’s Note: MDPI stays neutral
with regard to jurisdictional claims in
published maps and institutional affil-
iations.
Copyright: © 2022 by the authors.
Licensee MDPI, Basel, Switzerland.
This article is an open access article
distributed under the terms and
conditions of the Creative Commons
Attribution (CC BY) license (https://
creativecommons.org/licenses/by/
4.0/).
antibiotics
Article
A Novel Network Science and Similarity-Searching-BasedApproach for Discovering Potential Tumor-Homing Peptidesfrom AntimicrobialsMaylin Romero 1 , Yovani Marrero-Ponce 2,* , Hortensia Rodríguez 1 , Guillermin Agüero-Chapin 3,4 ,Agostinho Antunes 3,4 , Longendri Aguilera-Mendoza 5 and Felix Martinez-Rios 6
1 School of Chemical Sciences and Engineering, Yachay Tech University, Hda. San Jose s/n y Proyecto Yachay,Urcuqui 100119, Ecuador; [email protected] (M.R.); [email protected] (H.R.)
2 Universidad San Francisco de Quito (USFQ), Grupo de Medicina Molecular y Traslacional (MeM&T),Colegio de Ciencias de la Salud (COCSA), Escuela de Medicina, Edificio de Especialidades Médicas,Diego de Robles y vía Interoceánica, Pichincha, Quito 170157, Ecuador
3 CIIMAR/CIMAR, Centro Interdisciplinar de Investigação Marinha e Ambiental, Universidade do Porto,Terminal de Cruzeiros do Porto de Leixões, Av. General Norton de Matos, s/n, 4450-208 Porto, Portugal;[email protected] (G.A.-C.); [email protected] (A.A.)
4 Departamento de Biologia, Faculdade de Ciências, Universidade do Porto, Rua do Campo Alegre,4169-007 Porto, Portugal
5 Departamento de Ciencias de la Computación, Centro de Investigación Científica y de Educación Superior deEnsenada (CICESE), Ensenada 22860, Baja California, Mexico; [email protected]
6 Facultad de Ingeniería, Universidad Panamericana, Augusto Rodin No. 498, Insurgentes Mixcoac,Benito Juárez, Ciudad de México 03920, Mexico; [email protected]
* Correspondence: [email protected] or [email protected]; Tel.: +593-2-297-1700 (ext. 4021)
Abstract: Peptide-based drugs are promising anticancer candidates due to their biocompatibility andlow toxicity. In particular, tumor-homing peptides (THPs) have the ability to bind specifically tocancer cell receptors and tumor vasculature. Despite their potential to develop antitumor drugs, thereare few available prediction tools to assist the discovery of new THPs. Two webservers based onmachine learning models are currently active, the TumorHPD and the THPep, and more recently theSCMTHP. Herein, a novel method based on network science and similarity searching implementedin the starPep toolbox is presented for THP discovery. The approach leverages from exploringthe structural space of THPs with Chemical Space Networks (CSNs) and from applying centralitymeasures to identify the most relevant and non-redundant THP sequences within the CSN. Such THPswere considered as queries (Qs) for multi-query similarity searches that apply a group fusion (MAX-SIM rule) model. The resulting multi-query similarity searching models (SSMs) were validated withthree benchmarking datasets of THPs/non-THPs. The predictions achieved accuracies that rangedfrom 92.64 to 99.18% and Matthews Correlation Coefficients between 0.894–0.98, outperforming state-of-the-art predictors. The best model was applied to repurpose AMPs from the starPep database asTHPs, which were subsequently optimized for the TH activity. Finally, 54 promising THP leads werediscovered, and their sequences were analyzed to encounter novel motifs. These results demonstratethe potential of CSNs and multi-query similarity searching for the rapid and accurate identificationof THPs.
Keywords: cancer; tumor-homing peptide; in silico drug discovery; complex network; chemicalspace network; centrality measure; similarity searching; group fusion; motif discovery; starPeptoolbox software
1. Introduction
Cancer is a group of diseases developed in different cell and tissue types, and cor-responds to the second leading cause of death globally [1]. It is based on the abnormalgrowth of cells due to an inherited genetic mutation or induced by the environment [2].
Antibiotics 2022, 11, 401. https://doi.org/10.3390/antibiotics11030401 https://www.mdpi.com/journal/antibiotics
Antibiotics 2022, 11, 401 2 of 22
Despite novel therapy development for cancer treatment, improving chemotherapeuticdrugs’ specificity towards cancer cells remains a challenge [2,3]. Additionally, cancer cellsare generating multi-drug resistance (MDR) [4]. Consequently, in the pharmaceutical in-dustry, there is a need to develop new anticancer agents with a different mode of action totackle the current drug resistance of cancer cells without being cytotoxic to healthy ones [2].To fill this gap, peptides have emerged as a potential therapeutic alternative against cancer.From 2015 to 2019, 15 peptides or peptide-containing molecules were approved by the FDAas drugs, demonstrating the growing interest of the scientific community [5].
Peptides have different biochemical and therapeutic properties than small moleculesand proteins, making them attractive to the pharmaceutical and biotechnological indus-try [6,7]. Being smaller than proteins allows peptides to penetrate tissues more easily,have low cost, more accessible synthesis, and do not require folding to be biologicallyactive [8]. In contrast to small molecules, they have a higher specificity and efficacy due torepresenting the smallest functional part of a protein [9]. Moreover, they are not supposedto interact with the immune system, are biocompatible, have tunable bioactivity, and havelow cytotoxicity due to their degradation products being amino acids [10–14]. Hence,peptide-based drugs open a new door to an improved cancer diagnosis and treatment.
Tumor blood and lymphatic vasculature differ molecularly and morphologically fromnormal lymphatic and blood vessels [15]. Tumor-homing peptides (THPs) take advantageof this peculiarity. Thus, they are widely investigated as drug carriers and for imagingpurposes on oncology treatments and diagnosis [16]. The first-generation of THPs haveRGD (Arg-Gly-Asp) and NGR (Asn-Gly-Arg) motifs. RGD peptides have the characteristicof selectively binding to α integrins expressed in vascular endothelial cells of the tumor andmetastatic tumor cells, and NGR to aminopeptidase N (APN) receptors [17,18]. Although,there are neither non-RGD nor NGR peptides that home tumor blood vasculature andcancer cells by interactions with other receptors, such as the endothelial growth factorreceptor (EGFR) [19–23].
THPs are discovered by using in vitro and ex vivo/in vivo phage display technology,which is time-consuming, expensive, and may not translate to humans due to differencesbetween the animal models and humans [24–26]. For these reasons, bioinformatics toolssuch as databases and webservers are being employed for the accurate prediction of novelTHPs [26–28]. In this way, short sets of the most promising THPs become the candidatesfor posterior experimental verification.
To date, the databases available for experimentally validated THPs are TumorHoPe(includes 744 THPs) [27] and starPepDB (includes 659 THPs) [29], and the available TH ac-tivity predictors are TumorHPD (https://webs.iiitd.edu.in/raghava/tumorhpd) (accessedon 1 May 2021) [26], THPep (http://codes.bio/thpep) (accessed on 1 May 2021) [28], andSCMTHP (SCMTHP (pmlabstack.pythonanywhere.com) (accessed on 5 January 2022) [30].TumorHPD uses the supervised ML method Support Vector Machine (SVM) as a classifierwith three features: amino acid composition, dipeptide composition, and binary profilepatterns, achieving 86.56% as the highest accuracy [26]. The second ML method, THPep,has a Random Forest (RF) classifier with three features: amino acid composition, dipeptidecomposition, and pseudo amino acid composition, resulting in 90.13% of maximum overallaccuracy [28]. However, the datasets used for training and testing both ML models containpeptides with highly similar sequences. On the other hand, SCMTHP is the most recentlyreported method based on the scoring card method (SCM) [30]. It determines the propen-sity scores for the amino acids’ and dipeptides’ composition accounting for THP sequencesand applies a threshold value to discriminate between THP and non-THPs. Nonetheless,the performance of SCMTHP is similar to ML-based predictors, achieving a maximumaccuracy of 82.7%.
Recently, Marrero-Ponce et al. published a new software named starPep toolbox(http://mobiosd-hub.com/starpep/) (accessed on 2 February 2021), which is aimed toperform network analyses on the integrated graph database called starPepDB, whichinclude the most comprehensive and non-redundant database of antimicrobial peptides
Antibiotics 2022, 11, 401 3 of 22
(AMPs) [29,31]. Here, we propose an alternative methodology to identify potential THPsby combining network science with multi-query similarity searching against the AMPs ofstarPepDB. We used the starPep toolbox software as the main bioinformatics tool and theChemical Space Network (CSN) to represent the chemical space of peptides as a coordinate-free system. To the best of our knowledge, there are no reported studies where data miningand screening is supported by network science to discover peptides for pharmaceuticalpurposes [29]. Firstly, we built models of representative and non-redundant THPs usingcentrality analysis and supervised retrospective similarity searching to perform the THactivity prediction. The outstanding model, named THP1, predicted the TH activity of threebenchmarking datasets of THPs/non-THPs achieving accuracies between 92.64–99.18% andMatthews Correlation Coefficient (MCC) between 0.894–0.98, demonstrating the feasibilityof this new methodology. Then, we performed a hierarchical screening for drug repurposingusing network-based algorithms implemented in the starPep toolbox, the best model THP1,local alignments, and webservers to predict relevant activities related to the TH. TheirTH activity was optimized by generating random libraries, where the peptide undergoesamino acid’s stochastic substitutions at different positions. Finally, a set of 54 potentialTHPs from AMPs was proposed, where common motifs were identified.
2. Materials and Methods
The overall workflow of this report, shown in Figure 1, was based on two steps:(i) generation/selection of the model of representative THPs from starPepDB in starPeptoolbox, and (ii) prediction of potential new THPs from AMPs. In the first step, some modelsof representative THPs from starPepDB were built using different centrality measures torank the nodes and extract the representative and less similar sequences by applying localalignment. Then, the best multi-query similarity searching model (SSM) was selected bythe classification performance and its ability to correctly retrieve THPs from benchmarkTHPs databases by using group fusion (MAX-SIM rule) similarity searching.
Antibiotics 2022, 14, x FOR PEER REVIEW 3 of 24
Recently, Marrero-Ponce et al. published a new software named starPep toolbox
(http://mobiosd-hub.com/starpep/) (accessed on 2 February 2021), which is aimed to per-
form network analyses on the integrated graph database called starPepDB, which include
the most comprehensive and non-redundant database of antimicrobial peptides (AMPs)
[29,31]. Here, we propose an alternative methodology to identify potential THPs by com-
bining network science with multi-query similarity searching against the AMPs of
starPepDB. We used the starPep toolbox software as the main bioinformatics tool and the
Chemical Space Network (CSN) to represent the chemical space of peptides as a coordi-
nate-free system. To the best of our knowledge, there are no reported studies where data
mining and screening is supported by network science to discover peptides for pharma-
ceutical purposes [29]. Firstly, we built models of representative and non-redundant THPs
using centrality analysis and supervised retrospective similarity searching to perform the
TH activity prediction. The outstanding model, named THP1, predicted the TH activity
of three benchmarking datasets of THPs/non-THPs achieving accuracies between 92.64–
99.18% and Matthews Correlation Coefficient (MCC) between 0.894–0.98, demonstrating
the feasibility of this new methodology. Then, we performed a hierarchical screening for
drug repurposing using network-based algorithms implemented in the starPep toolbox,
the best model THP1, local alignments, and webservers to predict relevant activities re-
lated to the TH. Their TH activity was optimized by generating random libraries, where
the peptide undergoes amino acid’s stochastic substitutions at different positions. Finally,
a set of 54 potential THPs from AMPs was proposed, where common motifs were identi-
fied.
2. Materials and Methods
The overall workflow of this report, shown in Figure 1, was based on two steps: (i)
generation/selection of the model of representative THPs from starPepDB in starPep
toolbox, and (ii) prediction of potential new THPs from AMPs. In the first step, some mod-
els of representative THPs from starPepDB were built using different centrality measures
to rank the nodes and extract the representative and less similar sequences by applying
local alignment. Then, the best multi-query similarity searching model (SSM) was selected
by the classification performance and its ability to correctly retrieve THPs from bench-
mark THPs databases by using group fusion (MAX-SIM rule) similarity searching.
Figure 1. General overview of the experimental procedure.
In the second step, the model was used to perform similarity searching to repurpose
AMPs as THPs from starPepDB, and their TH activity was optimized using the Tu-
morHPD server. Additionally, sequence motifs were found from the set of potential THPs
Figure 1. General overview of the experimental procedure.
In the second step, the model was used to perform similarity searching to repurposeAMPs as THPs from starPepDB, and their TH activity was optimized using the TumorHPDserver. Additionally, sequence motifs were found from the set of potential THPs usingmultiple sequence alignments [32–35], alignment-free methods [36], and PROSITE server(https://www.genome.jp/tools/motif) (accessed on 15 July 2021).
2.1. StarPep Toolbox Software
The starPep toolbox uses FASTA files as inputs and includes the starPepDB. Peptidesare represented as nodes connected by an edge if they have any relationship. It can performquerying, filtering, visualization of networks, scaffold extractions, single or multiple queriessimilarity searching, and analysis of peptides by graph networks [29,31].
Antibiotics 2022, 11, 401 4 of 22
Networks can be built based on the metadata of peptides or based on the pairwisesimilarity measures calculated for their respective sequence. In metadata networks, nodesare connected by a specific parameter in common, such as origin; the target against whichthey are assessed; functionality; the database where they come from; the cross-reference; N-terminus; C-terminus; or amino acid composition. In similarity networks, peptides are cod-ified by descriptors, such as length, net charge, isoelectric point, molecular weight, Bomanindex, indices based on aggregation operators, hydrophobic moment, average hydrophilic-ity, hydrophobic periodicity, aliphatic index, and instability index [29,31,37]. Moreover,networks are visualized using different layouts, such as Fruchterman–Reingold [38].
Networks can be clustered, and communities are optimized using the Louvain method [39].Moreover, the centrality of each node can be particularly measured by harmonic, com-munity hub-bridge, betweenness, and weighted degree. Centrality is crucial to performscaffold extractions because peptides are ranked according to their centrality score, and thenredundant sequences are removed, prioritizing the most central. Thus, scaffold extractionsdepend on the type of centrality applied.
On the other hand, similarity searching, which is the basis of this study, is performedusing a set of queries against a target dataset, where different percentages of identity (orsimilarity thresholds) can be applied. An identity score is a number between 0–1, and itis calculated using the Smith–Waterman local alignment with BLOSUM 62 substitutionmatrix [40]. Multiple queries similarity searching works using the group fusion modelexplained in the following section.
2.2. Model Selection
The dataset of reported THPs was extracted from starPepDB in the starPep toolbox.All 45120 peptides contained in starPepDB were filtered by the “Tumor Homing” query inthe metadata function, where 659 entries were obtained (SI1-A).
2.2.1. Network AnalysisSimilarity Threshold Analysis
Network analysis of peptides was performed by building the CSN of 659 THPs inthe starPep toolbox. To choose the appropriate similarity threshold to build the networkof THPs, CSNs were built by varying in 0.05 the cut-off value from 0.10 to 0.90 (17 CSNsin total). Some metrics were retrieved from each CSN using the starPep toolbox, such asdensity, number of communities, modularity, and number of singletons.
By default, when CSN was built, nodes with higher than 98% of similarity wereremoved using the local alignment Smith–Waterman algorithm. The similarity metricused to establish the pairwise similarity relationships between nodes was the min–maxnormalized Euclidean distance. Then, a centrality was calculated and those nodes with0 as vertex degree were identified as outliers and then removed, leaving the giant (orconnected) components of the CSN, i.e., subgraph where all nodes are connected. In thiscase, community hub-bridge centrality was calculated. However, any centrality measurecould have been calculated since singletons always have zero centrality. After that, thenetwork was clustered and the modularity optimized using the modularity optimizationalgorithm based on the Louvain method [39].
The network was saved as a Graph ML file to be opened in Gephi [41] for subsequentcalculation of ACC. Finally, density, modularity, and ACC as a function of similaritythreshold were graphed in Origin to decide what similarity threshold is the best.
Network Characterization
CSN of the giant components derived from the application of the best similaritythreshold was characterized by the number of nodes, edges, outliers, density, number ofcommunities, and modularity. These parameters were obtained from starPep toolbox whileACC, diameter (larger shortest path), average path length, and a total of triangles were
Antibiotics 2022, 11, 401 5 of 22
drawn from Gephi. These parameters allow knowing the topology and structural patternsof the CSN.
For network visualization, Force Atlas 2 was used as a layout algorithm where colorsrepresent different clusters, and node size means how central the node is according to thecommunity hub-bridge centrality. Network visualization aims to obtain an aestheticallypleasing and understandable graph where nodes are not overlapped.
On the other hand, CSN of outliers was built with a cut-off of 0.30 to procure anappropriate density; then, it was clustered. Moreover, a subsequent scaffold extraction wasapplied based on hub-bridge centrality, and on 30% identity from local alignment.
The network of outliers was characterized according to the number of nodes, edges,communities, density, modularity, average degree, ACC, diameter obtained before scaffoldextraction, and the number of nodes and edges obtained after scaffold extraction. Fornetwork visualization, Fruchterman–Reingold was used as a layout algorithm; colorsrepresent different clusters while node size displays how central it is according to hub-bridge measure.
2.2.2. Centrality Analysis
The most influential nodes were used to find the new potential THPs, and centralityis the crucial parameter that provides this information. Thus, the four available centralitytypes in the starPep toolbox (weighted degree, community hub-bridge, betweenness, andharmonic) were calculated and normalized using the min–max method. Then, redundantpeptides were removed by applying the scaffold extraction procedure that is describedas follows: peptides were ranked based on the scores obtained after centrality calculationand we used 30% similarity cut-off of local identity from the Smith–Waterman algorithmto retrieve sets of sequences with a maximum of 30% similarity [40]. Subsequently, nodeswith 10% lower centrality than the most central node were removed in each metric. Thesets obtained after applying this process were named as 30 + 10%.
On the other hand, harmonic and weighted degree were calculated and normalized,and redundant peptides were removed by applying the scaffold extraction procedure usingfour different similarity cut-offs of local identity: 30, 40, 50, and 60%.
2.2.3. Similarity Searching Model for THPs Prediction
This study’s proposed method for discovering potential THPs was based on similaritysearching. For that reason, multiple query similarity searching models (SSMs) composed ofseveral queries representing the most important and less redundant nodes of CSN and asimilarity threshold were tested against datasets that contain well-known THPs/non-THPsthrough similarity searching. The recoveries from the similarity searching were statisticallyevaluated to select the best model for identifying potential THPs within the AMPs.
Query Datasets (Reference Sequences)
The retrieved sets after applying scaffold extractions at each centrality measure; thetwo sets of outliers; combinations of outliers with sets obtained from centrality-basedscaffold extractions; and combinations between sets obtained from scaffold extractionsperformed using different centrality metrics were used as queries (Qs). In total, we tested22 sets of Qs, where twelve sets resulted from the application of the scaffold extractionprocedures as well as two sets of outliers, and eight sets resulted from the combinationbetween sets.
Target Databases
Three training datasets that consider well-known THPs and randomly generatednon-THPs [42] were used as the target or calibration for the recovery. THPep, TumorHPD,and SCMTHP employed these datasets for training their methods [26,30,42].
• Main dataset: 651 experimentally validated THPs and 651 random non-THPs (SI1-B).They were collected from TumorHoPe [27] and the literature [26].
Antibiotics 2022, 11, 401 6 of 22
• Small dataset: 469 experimentally validated THPs and 469 random non-THPs (SI1-C).They are peptides derived from the Main dataset with 4 to 10 aa residues.
• Main90 dataset: 176 THPs and 443 non-THPs (SI1-D). They are peptides from the Maindataset with equal or lower than 90% of sequence similarity.
• Main and Small datasets were retrieved from Ref. [26], while Main90 from Ref. [27].
Group fusion
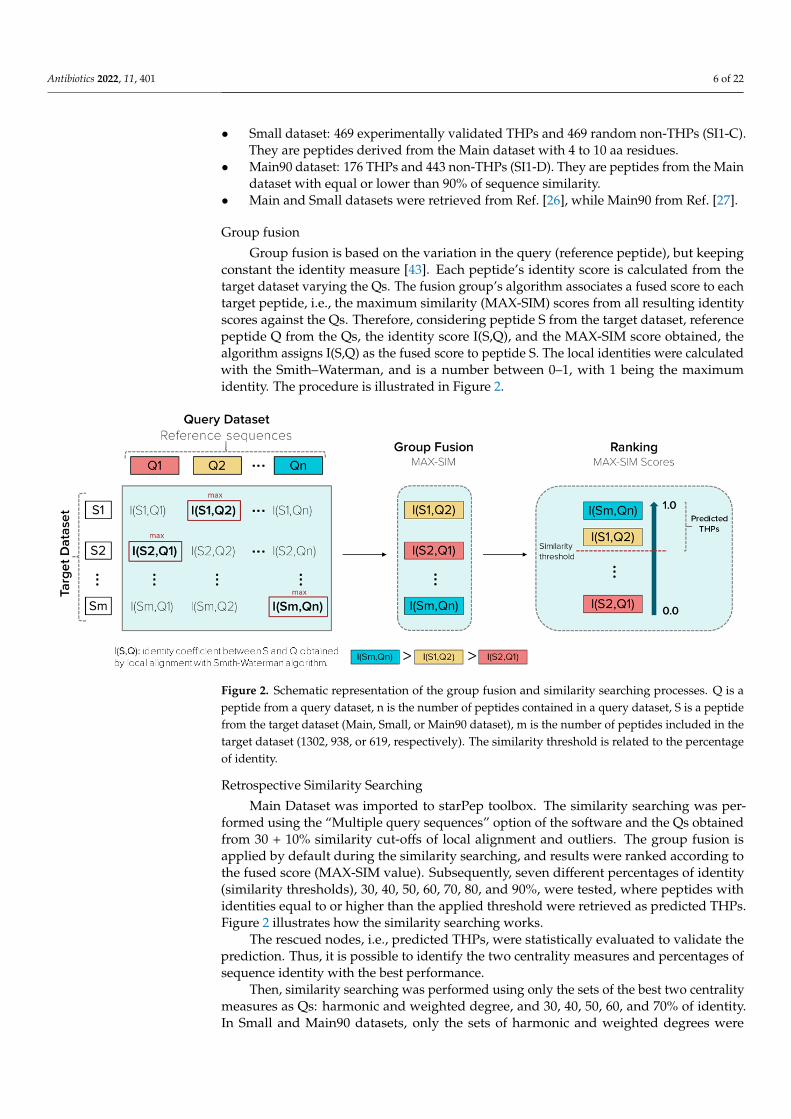
Group fusion is based on the variation in the query (reference peptide), but keepingconstant the identity measure [43]. Each peptide’s identity score is calculated from thetarget dataset varying the Qs. The fusion group’s algorithm associates a fused score to eachtarget peptide, i.e., the maximum similarity (MAX-SIM) scores from all resulting identityscores against the Qs. Therefore, considering peptide S from the target dataset, referencepeptide Q from the Qs, the identity score I(S,Q), and the MAX-SIM score obtained, thealgorithm assigns I(S,Q) as the fused score to peptide S. The local identities were calculatedwith the Smith–Waterman, and is a number between 0–1, with 1 being the maximumidentity. The procedure is illustrated in Figure 2.
Antibiotics 2022, 14, x FOR PEER REVIEW 6 of 24
fold extractions; and combinations between sets obtained from scaffold extractions per-
formed using different centrality metrics were used as queries (Qs). In total, we tested 22
sets of Qs, where twelve sets resulted from the application of the scaffold extraction pro-
cedures as well as two sets of outliers, and eight sets resulted from the combination be-
tween sets.
Target Databases
Three training datasets that consider well-known THPs and randomly generated
non-THPs [42] were used as the target or calibration for the recovery. THPep, TumorHPD,
and SCMTHP employed these datasets for training their methods [26,30,42].
• Main dataset: 651 experimentally validated THPs and 651 random non-THPs (SI1-B).
They were collected from TumorHoPe [27] and the literature [26].
• Small dataset: 469 experimentally validated THPs and 469 random non-THPs (SI1-
C). They are peptides derived from the Main dataset with 4 to 10 aa residues.
• Main90 dataset: 176 THPs and 443 non-THPs (SI1-D). They are peptides from the
Main dataset with equal or lower than 90% of sequence similarity.
• Main and Small datasets were retrieved from Ref. [26], while Main90 from Ref. [27].
Group fusion
Group fusion is based on the variation in the query (reference peptide), but keeping
constant the identity measure [43]. Each peptide’s identity score is calculated from the
target dataset varying the Qs. The fusion group’s algorithm associates a fused score to
each target peptide, i.e., the maximum similarity (MAX-SIM) scores from all resulting
identity scores against the Qs. Therefore, considering peptide S from the target dataset,
reference peptide Q from the Qs, the identity score I(S,Q), and the MAX-SIM score ob-
tained, the algorithm assigns I(S,Q) as the fused score to peptide S. The local identities
were calculated with the Smith–Waterman, and is a number between 0–1, with 1 being
the maximum identity. The procedure is illustrated in Figure 2.
Figure 2. Schematic representation of the group fusion and similarity searching processes. Q is a
peptide from a query dataset, n is the number of peptides contained in a query dataset, S is a pep-
tide from the target dataset (Main, Small, or Main90 dataset), m is the number of peptides in-
cluded in the target dataset (1302, 938, or 619, respectively). The similarity threshold is related to
the percentage of identity.
Retrospective Similarity Searching.
Figure 2. Schematic representation of the group fusion and similarity searching processes. Q is apeptide from a query dataset, n is the number of peptides contained in a query dataset, S is a peptidefrom the target dataset (Main, Small, or Main90 dataset), m is the number of peptides included in thetarget dataset (1302, 938, or 619, respectively). The similarity threshold is related to the percentageof identity.
Retrospective Similarity Searching
Main Dataset was imported to starPep toolbox. The similarity searching was per-formed using the “Multiple query sequences” option of the software and the Qs obtainedfrom 30 + 10% similarity cut-offs of local alignment and outliers. The group fusion isapplied by default during the similarity searching, and results were ranked according tothe fused score (MAX-SIM value). Subsequently, seven different percentages of identity(similarity thresholds), 30, 40, 50, 60, 70, 80, and 90%, were tested, where peptides withidentities equal to or higher than the applied threshold were retrieved as predicted THPs.Figure 2 illustrates how the similarity searching works.
The rescued nodes, i.e., predicted THPs, were statistically evaluated to validate theprediction. Thus, it is possible to identify the two centrality measures and percentages ofsequence identity with the best performance.
Then, similarity searching was performed using only the sets of the best two centralitymeasures as Qs: harmonic and weighted degree, and 30, 40, 50, 60, and 70% of identity.In Small and Main90 datasets, only the sets of harmonic and weighted degrees were
Antibiotics 2022, 11, 401 7 of 22
used as Qs, applying 40, 50, and 60% of identity for recovery. In total, 98 different SSMswere evaluated.
2.2.4. Statistical Analysis
The ability of the SSMs to predict THPs was validated by the measurement of theiraccuracy (Ac), kappa (κ), sensitivity (Sn), specificity (Sp), the precision of positives andnegatives (Ppos and Pneg, respectively), MCC, and false accept rate (FAR%) using thefollowing formulas.
Ac =TP + TN
TP + TN + FP + FN, (1)
κ =Po − Pc1 − Pc
, (2)
Sn =TP
TP + FN, (3)
Sp =TN
TN + FP, (4)
Ppos =TP
TP + FP, (5)
Pneg =TN
TN + FN, (6)
MCC =TP × TN − FP × FN√
(TP + FP)× (TP + FN)× (TN + FP)× (TN + FN), (7)
FAR% =FP
FP + TN× 100 , (8)
where, TP is the number of true positives, TN is the number of true negatives, FP is thenumber of false positives, FN is the number of false negatives, Po is the relative observedagreement between the observers equal to the Ac, and Pc is the expected chance agreementcalculated by the formula Pc = (TP+FP)×(TP+FN)+(FN+TN)×(FP+TN)
(TP+TN+FP+FN)2 .
Finally, the best 9 SSMs were compared and ranked using the Friedman test-basedanalysis performed in KEEL [44]. The Friedman test identified the best model based on thestatistical metrics previously shown [45]. Moreover, it allowed us to compare the modelsand determine if their difference was statistically significant and not due to chance. Theconfusion or classification matrix of the best model was constructed. The best models werecompared with reported ML models used for THP prediction, TumorHPD, and THPep,using the same three calibration datasets.
2.3. Identification of Potential THPs2.3.1. Hierarchical Screening
Drug repurposing is an alternative methodology widely applied to discover drugsbecause it reduces approval time for their clinical use [46,47]. Thus, firstly, we repurposedAMPs from starPepDB as THPs.
1. Pipeline Prospective Screening. First, AMPs without reported TH activity and toxicitywith a sequence length between 3 and 25 residues were filtered from the chemicalspace of starPepDB. Secondly, the “Scaffold extraction” option removed AMPs withhigher than 95% sequence similarity by local alignment. Thirdly, multiple querysimilarity searching was performed using the best SSM (THP1), obtained in theprevious section, to explore the chemical space of non-THPs, non-toxic, and non-redundant peptides with a length of 3–25 aa, using 60% as similarity threshold. In therecovered set, peptides with a similarity score of 1 were removed.
2. Activity Prediction. Peptides with reported tumor-homing activity in the literaturewere removed since the main objective of this study was to identify novel THPs. Then,
Antibiotics 2022, 11, 401 8 of 22
theoretical activities of virtual hits were predicted using webservers TumorHPD [26],THPep [28], AntiCP [48], CellPPD [49], ToxinPred [50], and HemoPI [51], to corrobo-rate their potential as THPs and prioritize those that do not harm healthy cells. Theactivities of interest were tumor homing, anticancer, cell-penetrating, toxicity, andhemolysis. The SVM thresholds used were 0.30 in servers TumorHPD, AntiCP, andCellPPD, and 0 in server ToxinPred.
3. Redundancy Reduction by Network Analysis. CSN of hits was built, clustered, and themodularity was optimized using the Louvain method in the starPep toolbox. Then,harmonic and weighted degree centralities were calculated to perform a scaffoldextraction using a 60% identity as the threshold.
4. Visual Mining. The neighborhood of well-known THPs of each potential THP wasvisualized using the starPep toolbox. CSN of 659 THPs in starPepDB was builtusing 0.60 as cut-off, clustered, and optimized modularity. Hits obtained in theprevious step after scaffold extraction were embedded into the CSN of 659 THPsto study the neighborhood of each peptide. Hence, the 3 nearest neighbors from659 THPs directly attached to each hit were visualized. If 2 peptides shared the same2 or 3-nearest neighbors, one of them was prioritized, choosing the one with betterpredicted activities.
2.3.2. Tumor-Homing Activity Optimization
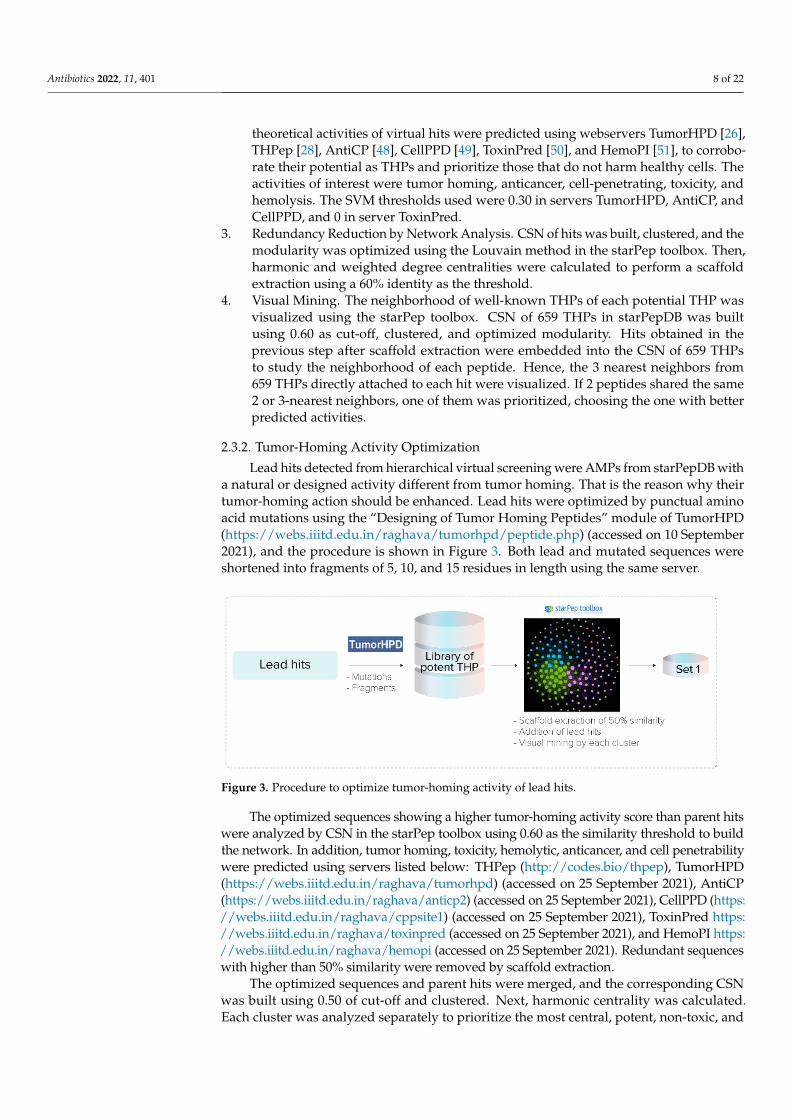
Lead hits detected from hierarchical virtual screening were AMPs from starPepDB witha natural or designed activity different from tumor homing. That is the reason why theirtumor-homing action should be enhanced. Lead hits were optimized by punctual aminoacid mutations using the “Designing of Tumor Homing Peptides” module of TumorHPD(https://webs.iiitd.edu.in/raghava/tumorhpd/peptide.php) (accessed on 10 September2021), and the procedure is shown in Figure 3. Both lead and mutated sequences wereshortened into fragments of 5, 10, and 15 residues in length using the same server.
Antibiotics 2022, 14, x FOR PEER REVIEW 8 of 24
2.3.1. Hierarchical Screening
Drug repurposing is an alternative methodology widely applied to discover drugs
because it reduces approval time for their clinical use [46,47]. Thus, firstly, we repurposed
AMPs from starPepDB as THPs.
1. Pipeline Prospective Screening. First, AMPs without reported TH activity and tox-
icity with a sequence length between 3 and 25 residues were filtered from the chem-
ical space of starPepDB. Secondly, the “Scaffold extraction” option removed AMPs
with higher than 95% sequence similarity by local alignment. Thirdly, multiple query
similarity searching was performed using the best SSM (THP1), obtained in the pre-
vious section, to explore the chemical space of non-THPs, non-toxic, and non-redun-
dant peptides with a length of 3–25 aa, using 60% as similarity threshold. In the re-
covered set, peptides with a similarity score of 1 were removed.
2. Activity Prediction. Peptides with reported tumor-homing activity in the literature
were removed since the main objective of this study was to identify novel THPs.
Then, theoretical activities of virtual hits were predicted using webservers Tu-
morHPD [26], THPep [28], AntiCP [48], CellPPD [49], ToxinPred [50], and HemoPI
[51], to corroborate their potential as THPs and prioritize those that do not harm
healthy cells. The activities of interest were tumor homing, anticancer, cell-penetrat-
ing, toxicity, and hemolysis. The SVM thresholds used were 0.30 in servers Tu-
morHPD, AntiCP, and CellPPD, and 0 in server ToxinPred.
3. Redundancy Reduction by Network Analysis. CSN of hits was built, clustered, and
the modularity was optimized using the Louvain method in the starPep toolbox.
Then, harmonic and weighted degree centralities were calculated to perform a scaf-
fold extraction using a 60% identity as the threshold.
4. Visual Mining. The neighborhood of well-known THPs of each potential THP was
visualized using the starPep toolbox. CSN of 659 THPs in starPepDB was built using
0.60 as cut-off, clustered, and optimized modularity. Hits obtained in the previous
step after scaffold extraction were embedded into the CSN of 659 THPs to study the
neighborhood of each peptide. Hence, the 3 nearest neighbors from 659 THPs directly
attached to each hit were visualized. If 2 peptides shared the same 2 or 3-nearest
neighbors, one of them was prioritized, choosing the one with better predicted activ-
ities.
2.3.2. Tumor-Homing Activity Optimization
Lead hits detected from hierarchical virtual screening were AMPs from starPepDB
with a natural or designed activity different from tumor homing. That is the reason why
their tumor-homing action should be enhanced. Lead hits were optimized by punctual
amino acid mutations using the “Designing of Tumor Homing Peptides” module of Tu-
morHPD (https://webs.iiitd.edu.in/raghava/tumorhpd/peptide.php) (accessed on 10 Sep-
tember 2021), and the procedure is shown in Figure 3. Both lead and mutated sequences
were shortened into fragments of 5, 10, and 15 residues in length using the same server.
Figure 3. Procedure to optimize tumor-homing activity of lead hits.
The optimized sequences showing a higher tumor-homing activity score than parent hitswere analyzed by CSN in the starPep toolbox using 0.60 as the similarity threshold to buildthe network. In addition, tumor homing, toxicity, hemolytic, anticancer, and cell penetrabilitywere predicted using servers listed below: THPep (http://codes.bio/thpep), TumorHPD(https://webs.iiitd.edu.in/raghava/tumorhpd) (accessed on 25 September 2021), AntiCP(https://webs.iiitd.edu.in/raghava/anticp2) (accessed on 25 September 2021), CellPPD (https://webs.iiitd.edu.in/raghava/cppsite1) (accessed on 25 September 2021), ToxinPred https://webs.iiitd.edu.in/raghava/toxinpred (accessed on 25 September 2021), and HemoPI https://webs.iiitd.edu.in/raghava/hemopi (accessed on 25 September 2021). Redundant sequenceswith higher than 50% similarity were removed by scaffold extraction.
The optimized sequences and parent hits were merged, and the corresponding CSNwas built using 0.50 of cut-off and clustered. Next, harmonic centrality was calculated.Each cluster was analyzed separately to prioritize the most central, potent, non-toxic, and
Antibiotics 2022, 11, 401 9 of 22
non-hemolytic lead THPs. Finally, the heat map and histogram of pairwise sequenceidentity of lead compounds were constructed to explore their structural diversity.
2.3.3. Motif DiscoveryMultiple Sequence Alignments
As the resulting potential THPs were hard-to-align sequences because of their shortlength and variability, they were grouped into seven clusters according to the neighbor-hood in the CSN. Given that two peptides underrepresented clusters 1 and 5, they werefused in a cluster labeled 1–5. Thus, peptide clusters (2–4, 1–5, and singletons) werealigned independently using multiple sequence alignments (MSA), publicly available athttps://www.ebi.ac.uk/Tools/msa/ (accessed on 28 September 2021). Four different MSAalgorithms were applied with their default parameters to determine consensus motifswithin each cluster: (1) Clustal-Omega v 1.2.4 [32], (2) MAFFT (Multiple Alignment us-ing Fast Fourier Transform) v7.487 with the iterative refinement FFT-NS-i option [33],(3) MUSCLE (Multiple Sequence Comparison by Log-Expectation) v3.8 [34], and T-Coffee(Tree-based Consistency Objective Function for Alignment Evaluation) v1.83 [35].
The resulting MSAs were employed to extract the conserved motifs by considering theconsensus sequences estimation from the programs Jalview v2.11.1.4 [52], EMBOSS Consv6.6.0 (https://www.ebi.ac.uk/Tools/msa/emboss_cons/) (accessed on 28 September2021), and Seq2Logov2.1 (http://www.cbs.dtu.dk/biotools/Seq2Logo/) (accessed on 28September 2021) [53].
Alignment-Free Method
Peptides were analyzed in STREME [36] (Sensitive, Thorough, Rapid, Enriched MotifElicitation) to discover fixed-length patterns (ungapped motifs) that were enriched withrespect to a control set generated by shuffling input peptides [52]. The analyses wereperformed via its webserver (https://meme-suite.org/meme/tools/streme) (accessed on28 September 2021), by considering both total peptides and by each cluster. The motifwidth was set between 3–5 amino acids length. STREME applies a statistical test at p-valuethreshold = 0.05 to determine the enrichment of motifs in the input peptides compared tothe control set.
Motif Search in PROSITE
Peptides were queried by the Motif Search tool (https://www.genome.jp/tools/motif/) (accessed on 28 September 2021) and integrated into the GenomeNet Suite (https://www.genome.jp/) (accessed on 28 September 2021). PROSITE Pattern and PROSITEProfile libraries were only considered for the motif search.
3. Results and Discussion3.1. Model Selection3.1.1. Network AnalysisSimilarity Threshold Analysis
Out of the set of 659 THPs retrieved from starPepDB, 627 peptides (SI1-A-I) were fil-tered with lower than 98% similarity by local alignment. The adequate similarity thresholdwas chosen before building CSN with the 627 peptides. This step is non-trivial since itis the parameter that defines the topology and network features [54]. Hence, the appro-priate cut-off for building the CSN was determined based on the variability of networkparameters such as density, modularity, ACC, and singletons at different cut-off similarityvalues. Graphml files corresponding to the 17 CSNs are available at SI2. Table S1 shows theobtained parameters at each cut-off.
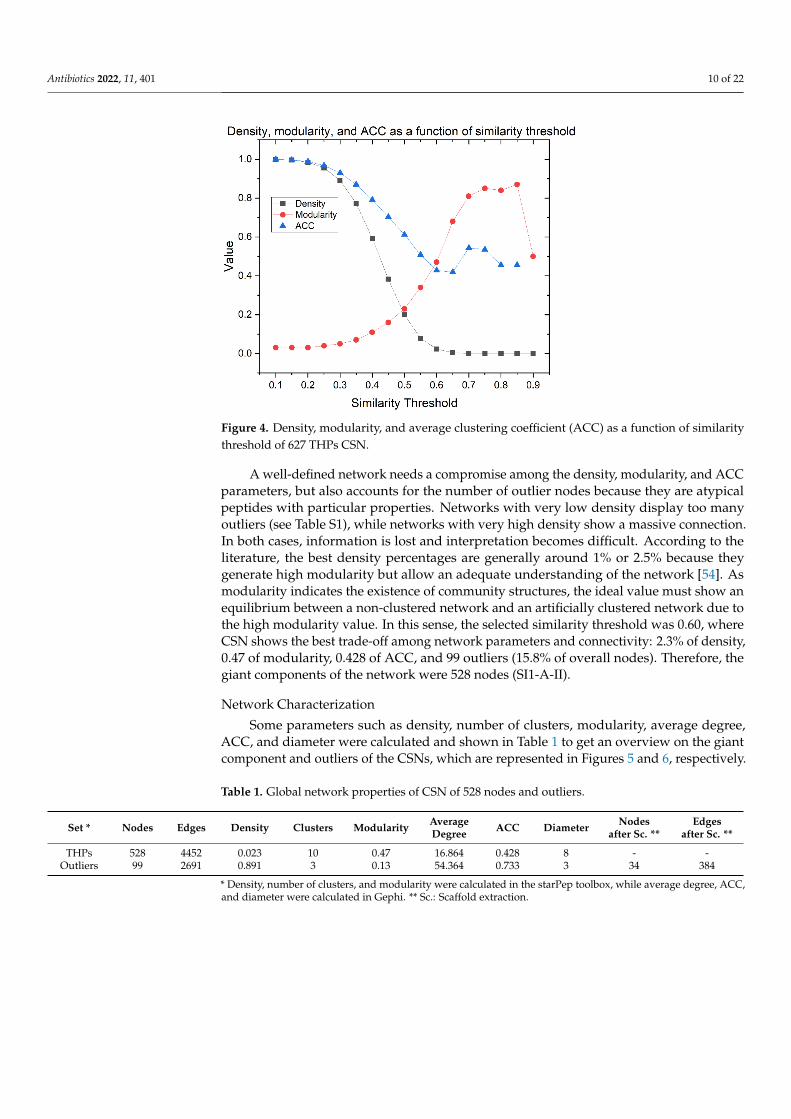
The graph of density, modularity, and ACC as a function of the similarity threshold isshown in Figure 4. The density is lower at a higher similarity threshold. ACC follows thesame pattern until the 0.65 similarity threshold. By contrast, modularity increases as thesimilarity threshold increases, while the clustering is optimized.
Antibiotics 2022, 11, 401 10 of 22
Antibiotics 2022, 14, x FOR PEER REVIEW 10 of 24
3. Results and Discussion
3.1. Model Selection
3.1.1. Network Analysis
Similarity Threshold Analysis
Out of the set of 659 THPs retrieved from starPepDB, 627 peptides (SI1-A-I) were
filtered with lower than 98% similarity by local alignment. The adequate similarity thresh-
old was chosen before building CSN with the 627 peptides. This step is non-trivial since
it is the parameter that defines the topology and network features [54]. Hence, the appro-
priate cut-off for building the CSN was determined based on the variability of network
parameters such as density, modularity, ACC, and singletons at different cut-off similarity
values. Graphml files corresponding to the 17 CSNs are available at SI2. Table S1 shows
the obtained parameters at each cut-off.
The graph of density, modularity, and ACC as a function of the similarity threshold
is shown in Figure 4. The density is lower at a higher similarity threshold. ACC follows
the same pattern until the 0.65 similarity threshold. By contrast, modularity increases as
the similarity threshold increases, while the clustering is optimized.
Figure 4. Density, modularity, and average clustering coefficient (ACC) as a function of similarity
threshold of 627 THPs CSN.
A well-defined network needs a compromise among the density, modularity, and
ACC parameters, but also accounts for the number of outlier nodes because they are atyp-
ical peptides with particular properties. Networks with very low density display too
many outliers (see Table S1), while networks with very high density show a massive con-
nection. In both cases, information is lost and interpretation becomes difficult. According
to the literature, the best density percentages are generally around 1% or 2.5% because
they generate high modularity but allow an adequate understanding of the network [54].
As modularity indicates the existence of community structures, the ideal value must show
an equilibrium between a non-clustered network and an artificially clustered network due
to the high modularity value. In this sense, the selected similarity threshold was 0.60,
where CSN shows the best trade-off among network parameters and connectivity: 2.3%
of density, 0.47 of modularity, 0.428 of ACC, and 99 outliers (15.8% of overall nodes).
Therefore, the giant components of the network were 528 nodes (SI1-A-II).
Figure 4. Density, modularity, and average clustering coefficient (ACC) as a function of similaritythreshold of 627 THPs CSN.
A well-defined network needs a compromise among the density, modularity, and ACCparameters, but also accounts for the number of outlier nodes because they are atypicalpeptides with particular properties. Networks with very low density display too manyoutliers (see Table S1), while networks with very high density show a massive connection.In both cases, information is lost and interpretation becomes difficult. According to theliterature, the best density percentages are generally around 1% or 2.5% because theygenerate high modularity but allow an adequate understanding of the network [54]. Asmodularity indicates the existence of community structures, the ideal value must show anequilibrium between a non-clustered network and an artificially clustered network due tothe high modularity value. In this sense, the selected similarity threshold was 0.60, whereCSN shows the best trade-off among network parameters and connectivity: 2.3% of density,0.47 of modularity, 0.428 of ACC, and 99 outliers (15.8% of overall nodes). Therefore, thegiant components of the network were 528 nodes (SI1-A-II).
Network Characterization
Some parameters such as density, number of clusters, modularity, average degree,ACC, and diameter were calculated and shown in Table 1 to get an overview on the giantcomponent and outliers of the CSNs, which are represented in Figures 5 and 6, respectively.
Table 1. Global network properties of CSN of 528 nodes and outliers.
Set * Nodes Edges Density Clusters Modularity AverageDegree ACC Diameter Nodes
after Sc. **Edges
after Sc. **
THPs 528 4452 0.023 10 0.47 16.864 0.428 8 - -Outliers 99 2691 0.891 3 0.13 54.364 0.733 3 34 384
* Density, number of clusters, and modularity were calculated in the starPep toolbox, while average degree, ACC,and diameter were calculated in Gephi. ** Sc.: Scaffold extraction.
Antibiotics 2022, 11, 401 11 of 22
Antibiotics 2022, 14, x FOR PEER REVIEW 11 of 24
Network Characterization
Some parameters such as density, number of clusters, modularity, average degree,
ACC, and diameter were calculated and shown in Table 1 to get an overview on the giant
component and outliers of the CSNs, which are represented in Figure 5 and Figure 6, re-
spectively.
Table 1. Global network properties of CSN of 528 nodes and outliers.
Set * Nodes Edges Density Clusters Modularity Average Degree ACC Diameter
Nodes
after Sc.
**
Edges
after Sc.
**
THPs 528 4452 0.023 10 0.47 16.864 0.428 8 - -
Outliers 99 2691 0.891 3 0.13 54.364 0.733 3 34 384
* Density, number of clusters, and modularity were calculated in the starPep toolbox, while aver-
age degree, ACC, and diameter were calculated in Gephi. ** Sc.: Scaffold extraction.
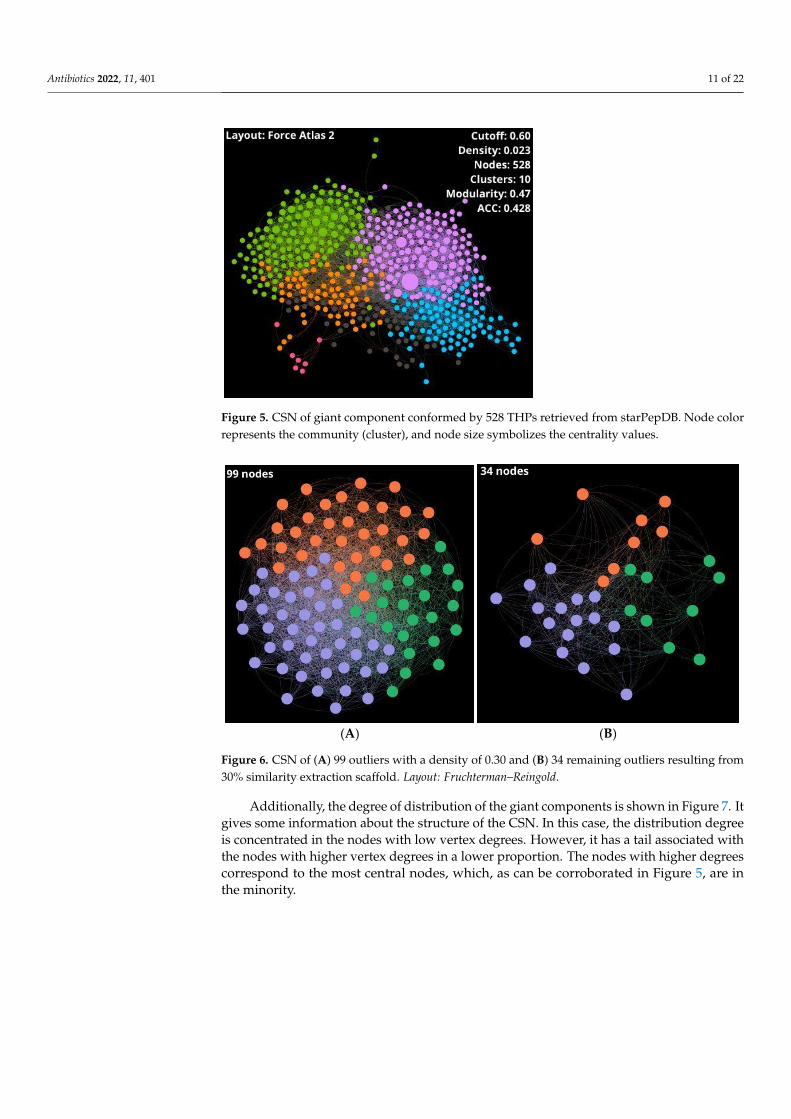
Figure 5. CSN of giant component conformed by 528 THPs retrieved from starPepDB. Node color
represents the community (cluster), and node size symbolizes the centrality values.
(A) (B)
Figure 6. CSN of (A) 99 outliers with a density of 0.30 and (B) 34 remaining outliers resulting from
30% similarity extraction scaffold. Layout: Fruchterman–Reingold.
Figure 5. CSN of giant component conformed by 528 THPs retrieved from starPepDB. Node colorrepresents the community (cluster), and node size symbolizes the centrality values.
Antibiotics 2022, 14, x FOR PEER REVIEW 11 of 24
Network Characterization
Some parameters such as density, number of clusters, modularity, average degree,
ACC, and diameter were calculated and shown in Table 1 to get an overview on the giant
component and outliers of the CSNs, which are represented in Figure 5 and Figure 6, re-
spectively.
Table 1. Global network properties of CSN of 528 nodes and outliers.
Set * Nodes Edges Density Clusters Modularity Average Degree ACC Diameter
Nodes
after Sc.
**
Edges
after Sc.
**
THPs 528 4452 0.023 10 0.47 16.864 0.428 8 - -
Outliers 99 2691 0.891 3 0.13 54.364 0.733 3 34 384
* Density, number of clusters, and modularity were calculated in the starPep toolbox, while aver-
age degree, ACC, and diameter were calculated in Gephi. ** Sc.: Scaffold extraction.
Figure 5. CSN of giant component conformed by 528 THPs retrieved from starPepDB. Node color
represents the community (cluster), and node size symbolizes the centrality values.
(A) (B)
Figure 6. CSN of (A) 99 outliers with a density of 0.30 and (B) 34 remaining outliers resulting from
30% similarity extraction scaffold. Layout: Fruchterman–Reingold. Figure 6. CSN of (A) 99 outliers with a density of 0.30 and (B) 34 remaining outliers resulting from30% similarity extraction scaffold. Layout: Fruchterman–Reingold.
Additionally, the degree of distribution of the giant components is shown in Figure 7. Itgives some information about the structure of the CSN. In this case, the distribution degreeis concentrated in the nodes with low vertex degrees. However, it has a tail associated withthe nodes with higher vertex degrees in a lower proportion. The nodes with higher degreescorrespond to the most central nodes, which, as can be corroborated in Figure 5, are inthe minority.
Antibiotics 2022, 11, 401 12 of 22
Antibiotics 2022, 14, x FOR PEER REVIEW 12 of 24
Additionally, the degree of distribution of the giant components is shown in Figure
7. It gives some information about the structure of the CSN. In this case, the distribution
degree is concentrated in the nodes with low vertex degrees. However, it has a tail asso-
ciated with the nodes with higher vertex degrees in a lower proportion. The nodes with
higher degrees correspond to the most central nodes, which, as can be corroborated in
Figure 5, are in the minority.
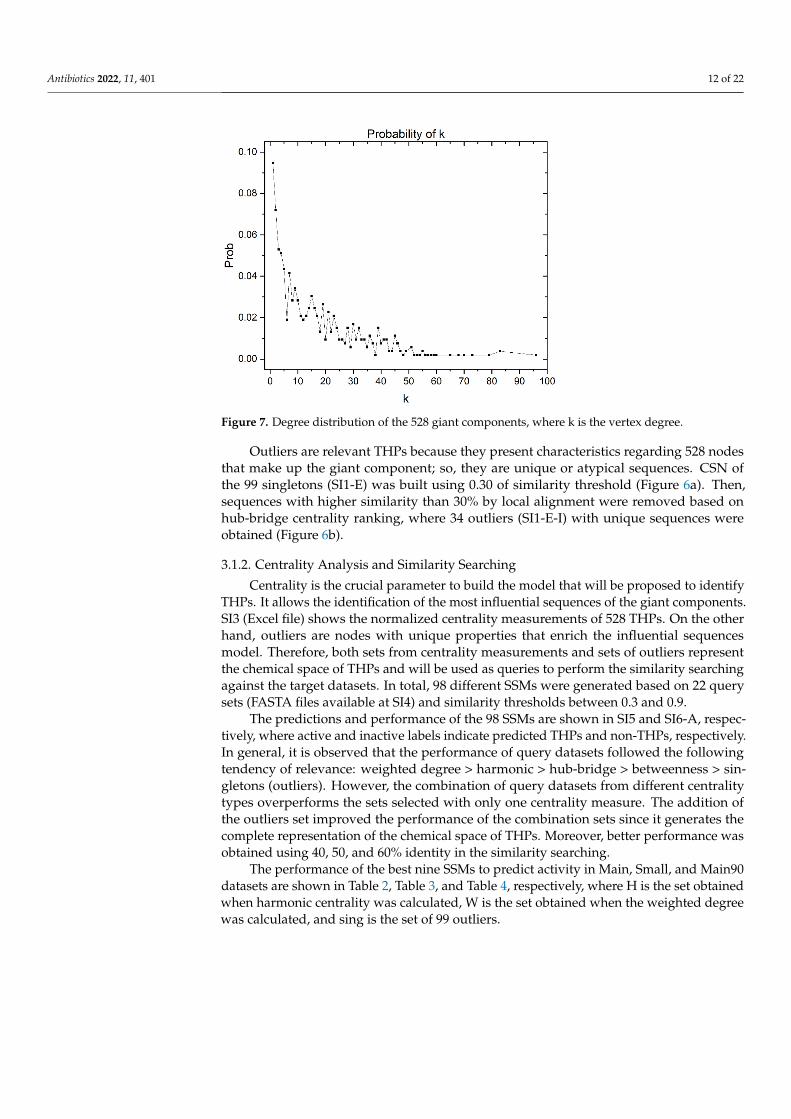
Figure 7. Degree distribution of the 528 giant components, where k is the vertex degree.
Outliers are relevant THPs because they present characteristics regarding 528 nodes
that make up the giant component; so, they are unique or atypical sequences. CSN of the
99 singletons (SI1-E) was built using 0.30 of similarity threshold (Figure 6a). Then, se-
quences with higher similarity than 30% by local alignment were removed based on hub-
bridge centrality ranking, where 34 outliers (SI1-E-I) with unique sequences were ob-
tained (Figure 6b).
3.1.2. Centrality Analysis and Similarity Searching
Centrality is the crucial parameter to build the model that will be proposed to iden-
tify THPs. It allows the identification of the most influential sequences of the giant com-
ponents. SI3 (Excel file) shows the normalized centrality measurements of 528 THPs. On
the other hand, outliers are nodes with unique properties that enrich the influential se-
quences model. Therefore, both sets from centrality measurements and sets of outliers
represent the chemical space of THPs and will be used as queries to perform the similarity
searching against the target datasets. In total, 98 different SSMs were generated based on
22 query sets (FASTA files available at SI4) and similarity thresholds between 0.3 and 0.9.
The predictions and performance of the 98 SSMs are shown in SI5 and SI6-A, respec-
tively, where active and inactive labels indicate predicted THPs and non-THPs, respec-
tively. In general, it is observed that the performance of query datasets followed the fol-
lowing tendency of relevance: weighted degree > harmonic > hub-bridge > betweenness >
singletons (outliers). However, the combination of query datasets from different centrality
types overperforms the sets selected with only one centrality measure. The addition of the
outliers set improved the performance of the combination sets since it generates the com-
plete representation of the chemical space of THPs. Moreover, better performance was
obtained using 40, 50, and 60% identity in the similarity searching.
Figure 7. Degree distribution of the 528 giant components, where k is the vertex degree.
Outliers are relevant THPs because they present characteristics regarding 528 nodesthat make up the giant component; so, they are unique or atypical sequences. CSN ofthe 99 singletons (SI1-E) was built using 0.30 of similarity threshold (Figure 6a). Then,sequences with higher similarity than 30% by local alignment were removed based onhub-bridge centrality ranking, where 34 outliers (SI1-E-I) with unique sequences wereobtained (Figure 6b).
3.1.2. Centrality Analysis and Similarity Searching
Centrality is the crucial parameter to build the model that will be proposed to identifyTHPs. It allows the identification of the most influential sequences of the giant components.SI3 (Excel file) shows the normalized centrality measurements of 528 THPs. On the otherhand, outliers are nodes with unique properties that enrich the influential sequencesmodel. Therefore, both sets from centrality measurements and sets of outliers representthe chemical space of THPs and will be used as queries to perform the similarity searchingagainst the target datasets. In total, 98 different SSMs were generated based on 22 querysets (FASTA files available at SI4) and similarity thresholds between 0.3 and 0.9.
The predictions and performance of the 98 SSMs are shown in SI5 and SI6-A, respec-tively, where active and inactive labels indicate predicted THPs and non-THPs, respectively.In general, it is observed that the performance of query datasets followed the followingtendency of relevance: weighted degree > harmonic > hub-bridge > betweenness > sin-gletons (outliers). However, the combination of query datasets from different centralitytypes overperforms the sets selected with only one centrality measure. The addition ofthe outliers set improved the performance of the combination sets since it generates thecomplete representation of the chemical space of THPs. Moreover, better performance wasobtained using 40, 50, and 60% identity in the similarity searching.
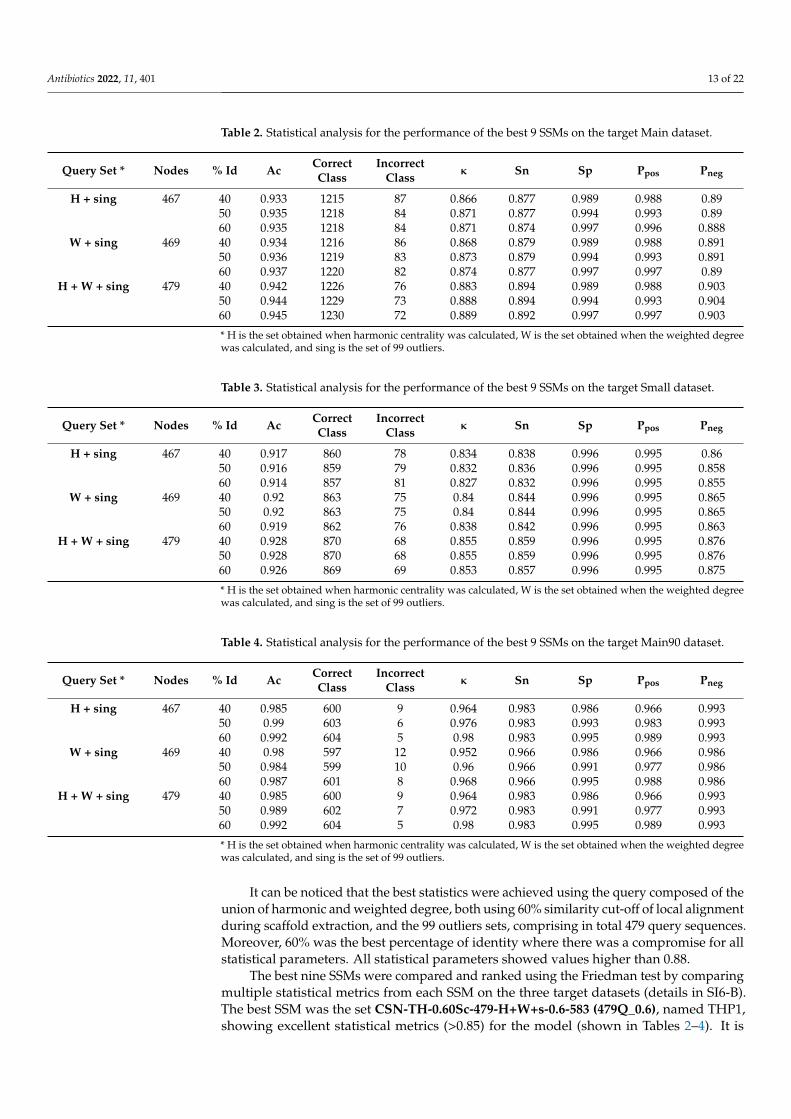
The performance of the best nine SSMs to predict activity in Main, Small, and Main90datasets are shown in Table 2, Table 3, and Table 4, respectively, where H is the set obtainedwhen harmonic centrality was calculated, W is the set obtained when the weighted degreewas calculated, and sing is the set of 99 outliers.
Antibiotics 2022, 11, 401 13 of 22
Table 2. Statistical analysis for the performance of the best 9 SSMs on the target Main dataset.
Query Set * Nodes % Id Ac CorrectClass
IncorrectClass κ Sn Sp Ppos Pneg
H + sing 467 40 0.933 1215 87 0.866 0.877 0.989 0.988 0.8950 0.935 1218 84 0.871 0.877 0.994 0.993 0.8960 0.935 1218 84 0.871 0.874 0.997 0.996 0.888
W + sing 469 40 0.934 1216 86 0.868 0.879 0.989 0.988 0.89150 0.936 1219 83 0.873 0.879 0.994 0.993 0.89160 0.937 1220 82 0.874 0.877 0.997 0.997 0.89
H + W + sing 479 40 0.942 1226 76 0.883 0.894 0.989 0.988 0.90350 0.944 1229 73 0.888 0.894 0.994 0.993 0.90460 0.945 1230 72 0.889 0.892 0.997 0.997 0.903
* H is the set obtained when harmonic centrality was calculated, W is the set obtained when the weighted degreewas calculated, and sing is the set of 99 outliers.
Table 3. Statistical analysis for the performance of the best 9 SSMs on the target Small dataset.
Query Set * Nodes % Id Ac CorrectClass
IncorrectClass κ Sn Sp Ppos Pneg
H + sing 467 40 0.917 860 78 0.834 0.838 0.996 0.995 0.8650 0.916 859 79 0.832 0.836 0.996 0.995 0.85860 0.914 857 81 0.827 0.832 0.996 0.995 0.855
W + sing 469 40 0.92 863 75 0.84 0.844 0.996 0.995 0.86550 0.92 863 75 0.84 0.844 0.996 0.995 0.86560 0.919 862 76 0.838 0.842 0.996 0.995 0.863
H + W + sing 479 40 0.928 870 68 0.855 0.859 0.996 0.995 0.87650 0.928 870 68 0.855 0.859 0.996 0.995 0.87660 0.926 869 69 0.853 0.857 0.996 0.995 0.875
* H is the set obtained when harmonic centrality was calculated, W is the set obtained when the weighted degreewas calculated, and sing is the set of 99 outliers.
Table 4. Statistical analysis for the performance of the best 9 SSMs on the target Main90 dataset.
Query Set * Nodes % Id Ac CorrectClass
IncorrectClass κ Sn Sp Ppos Pneg
H + sing 467 40 0.985 600 9 0.964 0.983 0.986 0.966 0.99350 0.99 603 6 0.976 0.983 0.993 0.983 0.99360 0.992 604 5 0.98 0.983 0.995 0.989 0.993
W + sing 469 40 0.98 597 12 0.952 0.966 0.986 0.966 0.98650 0.984 599 10 0.96 0.966 0.991 0.977 0.98660 0.987 601 8 0.968 0.966 0.995 0.988 0.986
H + W + sing 479 40 0.985 600 9 0.964 0.983 0.986 0.966 0.99350 0.989 602 7 0.972 0.983 0.991 0.977 0.99360 0.992 604 5 0.98 0.983 0.995 0.989 0.993
* H is the set obtained when harmonic centrality was calculated, W is the set obtained when the weighted degreewas calculated, and sing is the set of 99 outliers.
It can be noticed that the best statistics were achieved using the query composed of theunion of harmonic and weighted degree, both using 60% similarity cut-off of local alignmentduring scaffold extraction, and the 99 outliers sets, comprising in total 479 query sequences.Moreover, 60% was the best percentage of identity where there was a compromise for allstatistical parameters. All statistical parameters showed values higher than 0.88.
The best nine SSMs were compared and ranked using the Friedman test by comparingmultiple statistical metrics from each SSM on the three target datasets (details in SI6-B).The best SSM was the set CSN-TH-0.60Sc-479-H+W+s-0.6-583 (479Q_0.6), named THP1,showing excellent statistical metrics (>0.85) for the model (shown in Tables 2–4). It is
Antibiotics 2022, 11, 401 14 of 22
composed of the union of nodes with an identity lower than 60% from the global centralityharmonic with those obtained from applying weighted degree and the set of 99 outliers(479 nodes). The best percentage of identity used to search similarity was 60%. Theconfusion matrices of THP1 are shown in SI6-C. It can be seen that the prediction of themodel was not at random as the MCC was much greater than zero [55].
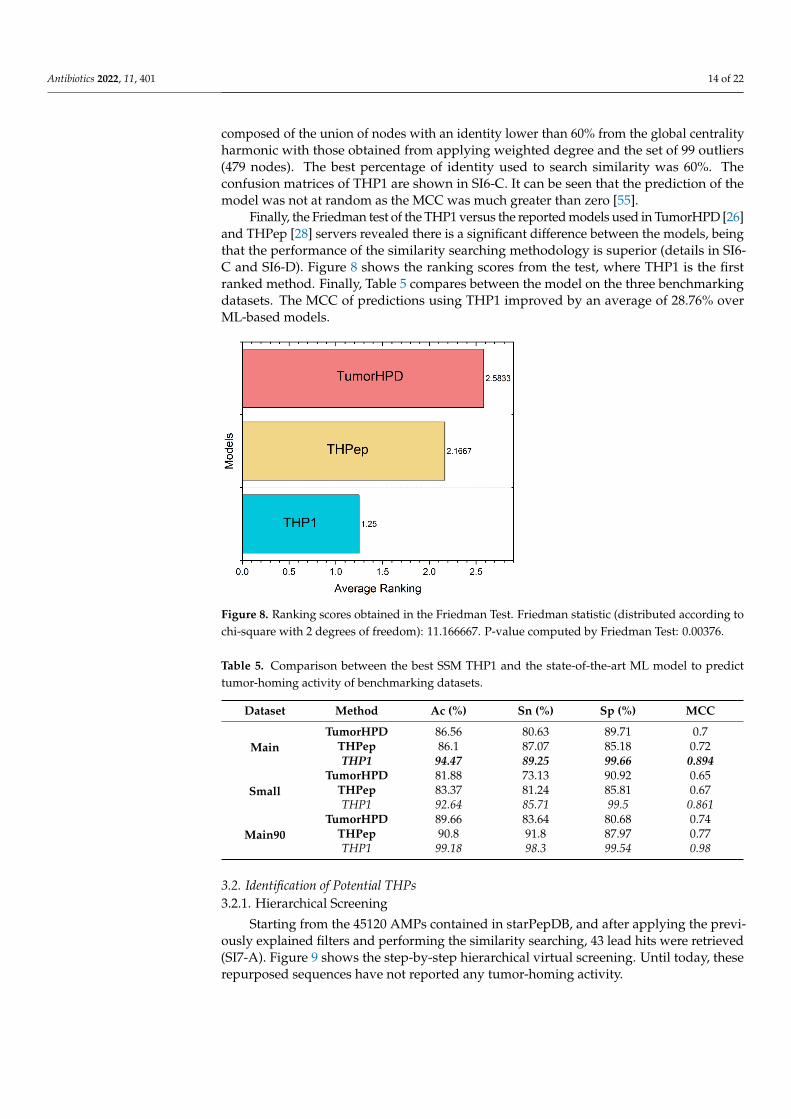
Finally, the Friedman test of the THP1 versus the reported models used in TumorHPD [26]and THPep [28] servers revealed there is a significant difference between the models, beingthat the performance of the similarity searching methodology is superior (details in SI6-C and SI6-D). Figure 8 shows the ranking scores from the test, where THP1 is the firstranked method. Finally, Table 5 compares between the model on the three benchmarkingdatasets. The MCC of predictions using THP1 improved by an average of 28.76% overML-based models.
Antibiotics 2022, 14, x FOR PEER REVIEW 14 of 24
* H is the set obtained when harmonic centrality was calculated, W is the set obtained when the
weighted degree was calculated, and sing is the set of 99 outliers.
It can be noticed that the best statistics were achieved using the query composed of
the union of harmonic and weighted degree, both using 60% similarity cut-off of local
alignment during scaffold extraction, and the 99 outliers sets, comprising in total 479
query sequences. Moreover, 60% was the best percentage of identity where there was a
compromise for all statistical parameters. All statistical parameters showed values higher
than 0.88.
The best nine SSMs were compared and ranked using the Friedman test by compar-
ing multiple statistical metrics from each SSM on the three target datasets (details in SI6-
B). The best SSM was the set CSN-TH-0.60Sc-479-H+W+s-0.6-583 (479Q_0.6), named
THP1, showing excellent statistical metrics (>0.85) for the model (shown in Table 2, Table
3 and Table 4). It is composed of the union of nodes with an identity lower than 60% from
the global centrality harmonic with those obtained from applying weighted degree and
the set of 99 outliers (479 nodes). The best percentage of identity used to search similarity
was 60%. The confusion matrices of THP1 are shown in SI6-C. It can be seen that the pre-
diction of the model was not at random as the MCC was much greater than zero [55].
Finally, the Friedman test of the THP1 versus the reported models used in Tu-
morHPD [26] and THPep [28] servers revealed there is a significant difference between
the models, being that the performance of the similarity searching methodology is supe-
rior (details in SI6-C and SI6-D). Figure 8 shows the ranking scores from the test, where
THP1 is the first ranked method. Finally, Table 5 compares between the model on the
three benchmarking datasets. The MCC of predictions using THP1 improved by an aver-
age of 28.76% over ML-based models.
Figure 8. Ranking scores obtained in the Friedman Test. Friedman statistic (distributed according
to chi-square with 2 degrees of freedom): 11.166667. P-value computed by Friedman Test: 0.00376.
Table 5. Comparison between the best SSM THP1 and the state-of-the-art ML model to predict
tumor-homing activity of benchmarking datasets.
Dataset Method Ac (%) Sn (%) Sp (%) MCC
Main
TumorHPD 86.56 80.63 89.71 0.7
THPep 86.1 87.07 85.18 0.72
THP1 94.47 89.25 99.66 0.894
Small TumorHPD 81.88 73.13 90.92 0.65
THPep 83.37 81.24 85.81 0.67
Figure 8. Ranking scores obtained in the Friedman Test. Friedman statistic (distributed according tochi-square with 2 degrees of freedom): 11.166667. P-value computed by Friedman Test: 0.00376.
Table 5. Comparison between the best SSM THP1 and the state-of-the-art ML model to predicttumor-homing activity of benchmarking datasets.
Dataset Method Ac (%) Sn (%) Sp (%) MCC
MainTumorHPD 86.56 80.63 89.71 0.7
THPep 86.1 87.07 85.18 0.72THP1 94.47 89.25 99.66 0.894
SmallTumorHPD 81.88 73.13 90.92 0.65
THPep 83.37 81.24 85.81 0.67THP1 92.64 85.71 99.5 0.861
Main90TumorHPD 89.66 83.64 80.68 0.74
THPep 90.8 91.8 87.97 0.77THP1 99.18 98.3 99.54 0.98
3.2. Identification of Potential THPs3.2.1. Hierarchical Screening
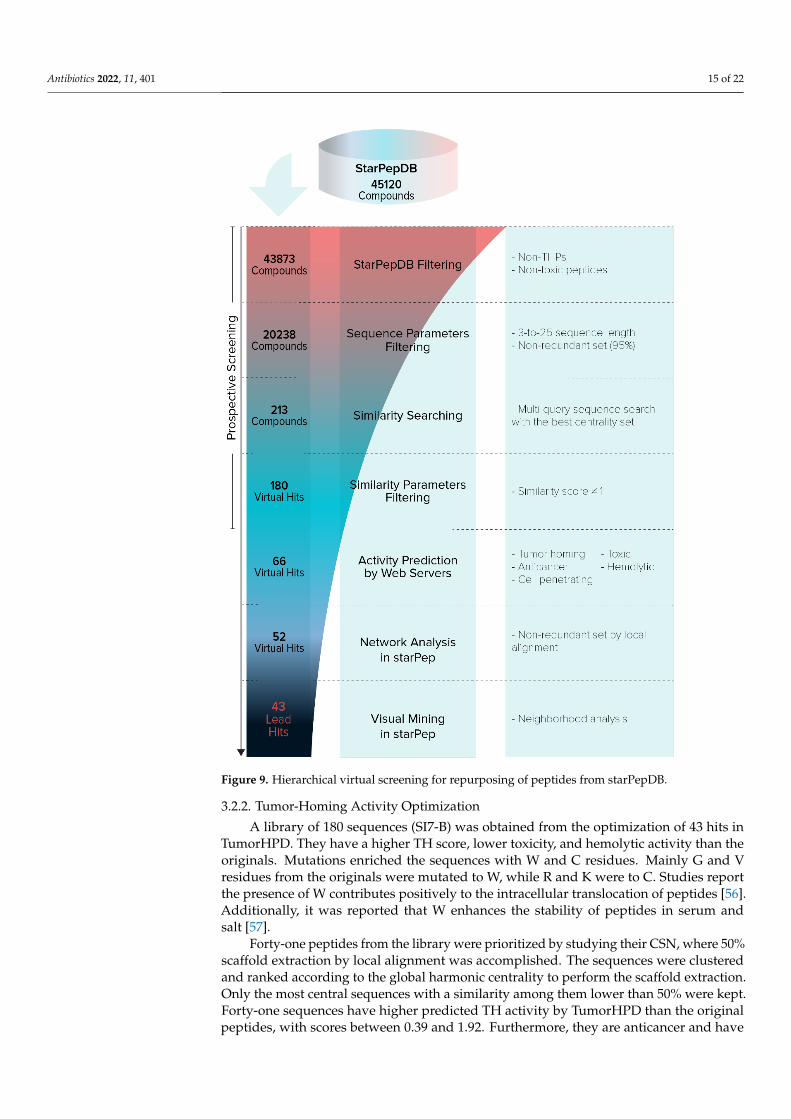
Starting from the 45120 AMPs contained in starPepDB, and after applying the previ-ously explained filters and performing the similarity searching, 43 lead hits were retrieved(SI7-A). Figure 9 shows the step-by-step hierarchical virtual screening. Until today, theserepurposed sequences have not reported any tumor-homing activity.
Antibiotics 2022, 11, 401 15 of 22Antibiotics 2022, 14, x FOR PEER REVIEW 16 of 24
Figure 9. Hierarchical virtual screening for repurposing of peptides from starPepDB.
3.2.2. Tumor-Homing Activity Optimization
A library of 180 sequences (SI7-B) was obtained from the optimization of 43 hits in
TumorHPD. They have a higher TH score, lower toxicity, and hemolytic activity than the
originals. Mutations enriched the sequences with W and C residues. Mainly G and V res-
idues from the originals were mutated to W, while R and K were to C. Studies report the
presence of W contributes positively to the intracellular translocation of peptides [56]. Ad-
ditionally, it was reported that W enhances the stability of peptides in serum and salt [57].
Figure 9. Hierarchical virtual screening for repurposing of peptides from starPepDB.
3.2.2. Tumor-Homing Activity Optimization
A library of 180 sequences (SI7-B) was obtained from the optimization of 43 hits inTumorHPD. They have a higher TH score, lower toxicity, and hemolytic activity than theoriginals. Mutations enriched the sequences with W and C residues. Mainly G and Vresidues from the originals were mutated to W, while R and K were to C. Studies reportthe presence of W contributes positively to the intracellular translocation of peptides [56].Additionally, it was reported that W enhances the stability of peptides in serum andsalt [57].
Forty-one peptides from the library were prioritized by studying their CSN, where 50%scaffold extraction by local alignment was accomplished. The sequences were clusteredand ranked according to the global harmonic centrality to perform the scaffold extraction.Only the most central sequences with a similarity among them lower than 50% were kept.Forty-one sequences have higher predicted TH activity by TumorHPD than the originalpeptides, with scores between 0.39 and 1.92. Furthermore, they are anticancer and have
Antibiotics 2022, 11, 401 16 of 22
less toxicity and hemolytic activity. 12 out of 41 sequences come from fragments of originalsequences of 5, 10, and 15 lengths; 15 resulted from four punctual mutations from theoriginals; and 14 from fragments of mutated sequences of 5, 10, and 15 lengths. Two out offorty-one peptides, CNGRCGGKLA and WCAMS, are part of reported THPs, validatingthe novel methodology to discover potential THPs. CNGRCGGKLA is the N-end of theCNGRCGGKLAKLAKKLAKLAK peptide containing the NGR TH motif and a disulfidebridge that gives stability. CNGRCGGKLAKLAKKLAKLAK binds to CD13 of tumor cellsacting as ACP and THP [58]. At the same time, WCAMS is the C-end of the KLWCAMSpeptide that homes mouse B16B15b melanoma [59].
We selected the most promising 13 sequences from the 43 lead hits and these werecombined with the 41 optimized hits. In total, we proposed 54 peptides (SET 1, FASTAfile in SI7-C) with a diverse molecular structure, low toxicity, and hemolytic activity, withmost of them also showing potential anticancer activity (SI7-D). Among the 54 lead hits,only one sequence has the well-known NGR motif. Therefore, SET 1 is composed of newstructural entities within the known structural space of the THPs.
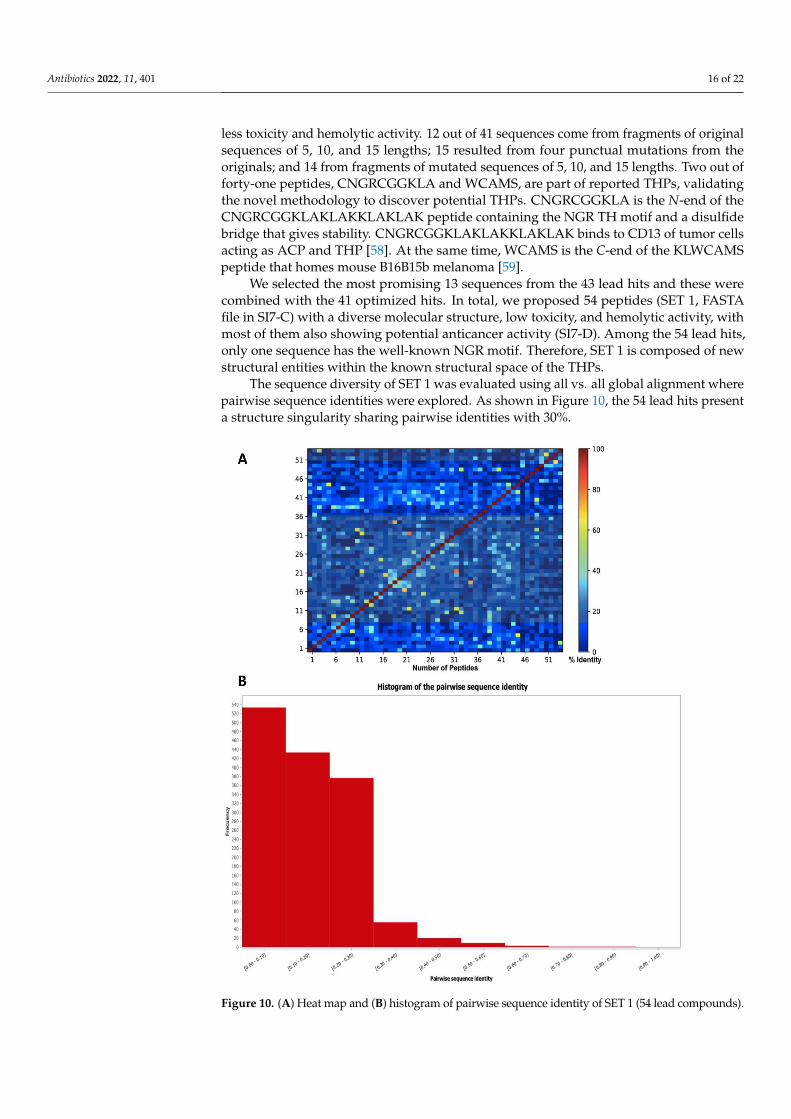
The sequence diversity of SET 1 was evaluated using all vs. all global alignment wherepairwise sequence identities were explored. As shown in Figure 10, the 54 lead hits presenta structure singularity sharing pairwise identities with 30%.
Antibiotics 2022, 14, x FOR PEER REVIEW 18 of 24
Figure 10. (A) Heat map and (B) histogram of pairwise sequence identity of SET 1 (54 lead com-
pounds).
3.2.3. Motif Discovery
As a consequence of the structural diversity of SET 1, the discovery of motifs account-
ing for the TH activity is not a straightforward task. In this sense, sensitive multiple se-
quence alignment (MSA) tools and alignment-free (AF) approaches (e.g., STREME) were
applied to unravel new TH motifs.
The resulting 54 lead THPs were mapped onto CSN space to identify putative com-
munities and make possible the application of MSA algorithms for motif identification.
These networks communities were considered clusters containing related peptides. Fi-
nally, six clusters were conformed with 14, 10, 8, 4, 10, and 8 members, respectively (SI7-
E). The last cluster grouped the singletons (peptides identified as atypical in the CSN).
Clustal-Omega [32], MAFFT [33], MUSCLE [34], and T-Coffee [35], which are MSA
algorithms developed after the classical ClustalW, were applied, so that they can deal with
hard-to-align sequences shown in each cluster, and thus to detect any conserved signature
or motif. Since each MSA has implemented a different algorithm to improve alignment
quality, their consideration for the estimation of consensus regions helped us identify TH
motifs by using the Jalview, EMBOSS Cons and Seq2Logo programs (SI8). As the EMBOSS
Cons, gives a more legible output, only displaying high scored amino acids/positions
Figure 10. (A) Heat map and (B) histogram of pairwise sequence identity of SET 1 (54 lead compounds).
Antibiotics 2022, 11, 401 17 of 22
3.2.3. Motif Discovery
As a consequence of the structural diversity of SET 1, the discovery of motifs ac-counting for the TH activity is not a straightforward task. In this sense, sensitive multiplesequence alignment (MSA) tools and alignment-free (AF) approaches (e.g., STREME) wereapplied to unravel new TH motifs.
The resulting 54 lead THPs were mapped onto CSN space to identify putative commu-nities and make possible the application of MSA algorithms for motif identification. Thesenetworks communities were considered clusters containing related peptides. Finally, sixclusters were conformed with 14, 10, 8, 4, 10, and 8 members, respectively (SI7-E). The lastcluster grouped the singletons (peptides identified as atypical in the CSN).
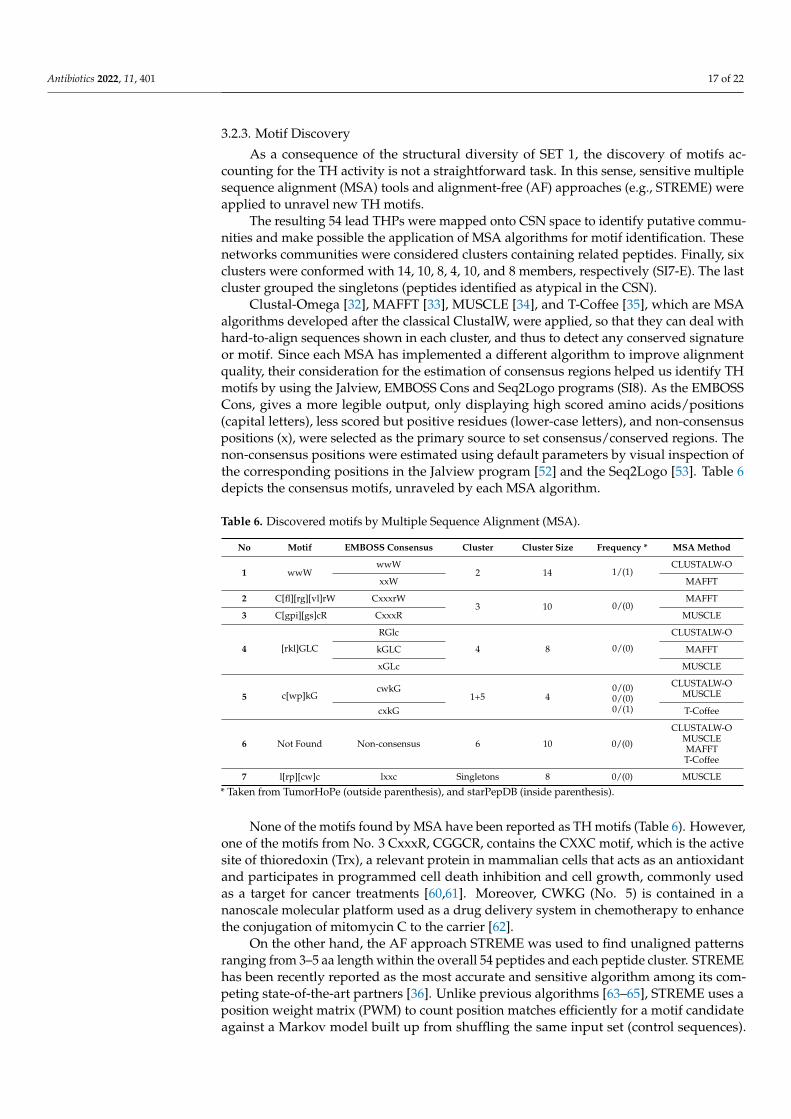
Clustal-Omega [32], MAFFT [33], MUSCLE [34], and T-Coffee [35], which are MSAalgorithms developed after the classical ClustalW, were applied, so that they can deal withhard-to-align sequences shown in each cluster, and thus to detect any conserved signatureor motif. Since each MSA has implemented a different algorithm to improve alignmentquality, their consideration for the estimation of consensus regions helped us identify THmotifs by using the Jalview, EMBOSS Cons and Seq2Logo programs (SI8). As the EMBOSSCons, gives a more legible output, only displaying high scored amino acids/positions(capital letters), less scored but positive residues (lower-case letters), and non-consensuspositions (x), were selected as the primary source to set consensus/conserved regions. Thenon-consensus positions were estimated using default parameters by visual inspection ofthe corresponding positions in the Jalview program [52] and the Seq2Logo [53]. Table 6depicts the consensus motifs, unraveled by each MSA algorithm.
Table 6. Discovered motifs by Multiple Sequence Alignment (MSA).
No Motif EMBOSS Consensus Cluster Cluster Size Frequency * MSA Method
1 wwWwwW
2 14 1/(1)CLUSTALW-O
xxW MAFFT
2 C[fl][rg][vl]rW CxxxrW3 10 0/(0)
MAFFT
3 C[gpi][gs]cR CxxxR MUSCLE
4 [rkl]GLC
RGlc
4 8 0/(0)
CLUSTALW-O
kGLC MAFFT
xGLc MUSCLE
5 c[wp]kGcwkG
1+5 40/(0)0/(0)0/(1)
CLUSTALW-OMUSCLE
cxkG T-Coffee
6 Not Found Non-consensus 6 10 0/(0)
CLUSTALW-OMUSCLEMAFFTT-Coffee
7 l[rp][cw]c lxxc Singletons 8 0/(0) MUSCLE
* Taken from TumorHoPe (outside parenthesis), and starPepDB (inside parenthesis).
None of the motifs found by MSA have been reported as TH motifs (Table 6). However,one of the motifs from No. 3 CxxxR, CGGCR, contains the CXXC motif, which is the activesite of thioredoxin (Trx), a relevant protein in mammalian cells that acts as an antioxidantand participates in programmed cell death inhibition and cell growth, commonly usedas a target for cancer treatments [60,61]. Moreover, CWKG (No. 5) is contained in ananoscale molecular platform used as a drug delivery system in chemotherapy to enhancethe conjugation of mitomycin C to the carrier [62].
On the other hand, the AF approach STREME was used to find unaligned patternsranging from 3–5 aa length within the overall 54 peptides and each peptide cluster. STREMEhas been recently reported as the most accurate and sensitive algorithm among its com-peting state-of-the-art partners [36]. Unlike previous algorithms [63–65], STREME uses aposition weight matrix (PWM) to count position matches efficiently for a motif candidateagainst a Markov model built up from shuffling the same input set (control sequences).
Antibiotics 2022, 11, 401 18 of 22
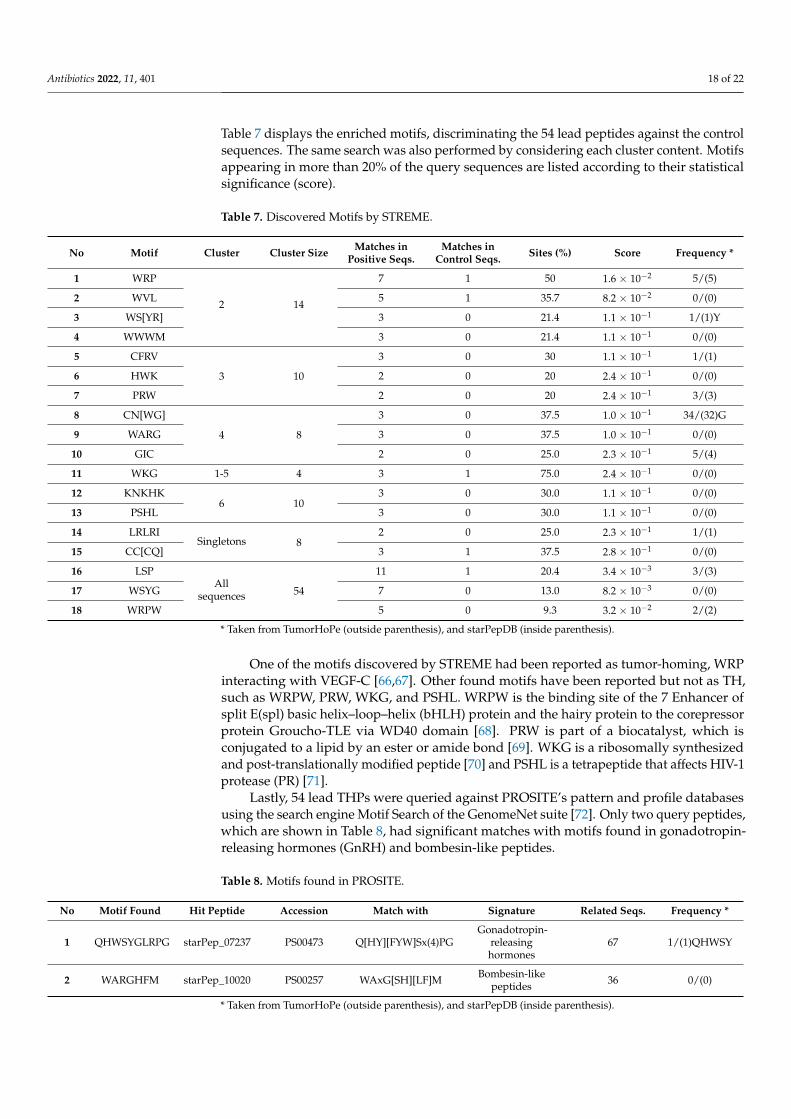
Table 7 displays the enriched motifs, discriminating the 54 lead peptides against the controlsequences. The same search was also performed by considering each cluster content. Motifsappearing in more than 20% of the query sequences are listed according to their statisticalsignificance (score).
Table 7. Discovered Motifs by STREME.
No Motif Cluster Cluster Size Matches inPositive Seqs.
Matches inControl Seqs. Sites (%) Score Frequency *
1 WRP
2 14
7 1 50 1.6 × 10⁻² 5/(5)
2 WVL 5 1 35.7 8.2 × 10⁻² 0/(0)
3 WS[YR] 3 0 21.4 1.1 × 10⁻¹ 1/(1)Y
4 WWWM 3 0 21.4 1.1 × 10⁻¹ 0/(0)
5 CFRV
3 10
3 0 30 1.1 × 10⁻¹ 1/(1)
6 HWK 2 0 20 2.4 × 10⁻¹ 0/(0)
7 PRW 2 0 20 2.4 × 10⁻¹ 3/(3)
8 CN[WG]
4 8
3 0 37.5 1.0 × 10⁻¹ 34/(32)G
9 WARG 3 0 37.5 1.0 × 10⁻¹ 0/(0)
10 GIC 2 0 25.0 2.3 × 10⁻¹ 5/(4)
11 WKG 1-5 4 3 1 75.0 2.4 × 10⁻¹ 0/(0)
12 KNKHK6 10
3 0 30.0 1.1 × 10⁻¹ 0/(0)
13 PSHL 3 0 30.0 1.1 × 10⁻¹ 0/(0)
14 LRLRISingletons 8
2 0 25.0 2.3 × 10⁻¹ 1/(1)
15 CC[CQ] 3 1 37.5 2.8 × 10⁻¹ 0/(0)
16 LSPAll
sequences 54
11 1 20.4 3.4 × 10⁻³ 3/(3)
17 WSYG 7 0 13.0 8.2 × 10⁻³ 0/(0)
18 WRPW 5 0 9.3 3.2 × 10⁻² 2/(2)
* Taken from TumorHoPe (outside parenthesis), and starPepDB (inside parenthesis).
One of the motifs discovered by STREME had been reported as tumor-homing, WRPinteracting with VEGF-C [66,67]. Other found motifs have been reported but not as TH,such as WRPW, PRW, WKG, and PSHL. WRPW is the binding site of the 7 Enhancer ofsplit E(spl) basic helix–loop–helix (bHLH) protein and the hairy protein to the corepressorprotein Groucho-TLE via WD40 domain [68]. PRW is part of a biocatalyst, which isconjugated to a lipid by an ester or amide bond [69]. WKG is a ribosomally synthesizedand post-translationally modified peptide [70] and PSHL is a tetrapeptide that affects HIV-1protease (PR) [71].
Lastly, 54 lead THPs were queried against PROSITE’s pattern and profile databasesusing the search engine Motif Search of the GenomeNet suite [72]. Only two query peptides,which are shown in Table 8, had significant matches with motifs found in gonadotropin-releasing hormones (GnRH) and bombesin-like peptides.
Table 8. Motifs found in PROSITE.
No Motif Found Hit Peptide Accession Match with Signature Related Seqs. Frequency *
1 QHWSYGLRPG starPep_07237 PS00473 Q[HY][FYW]Sx(4)PGGonadotropin-
releasinghormones
67 1/(1)QHWSY
2 WARGHFM starPep_10020 PS00257 WAxG[SH][LF]M Bombesin-likepeptides 36 0/(0)
* Taken from TumorHoPe (outside parenthesis), and starPepDB (inside parenthesis).
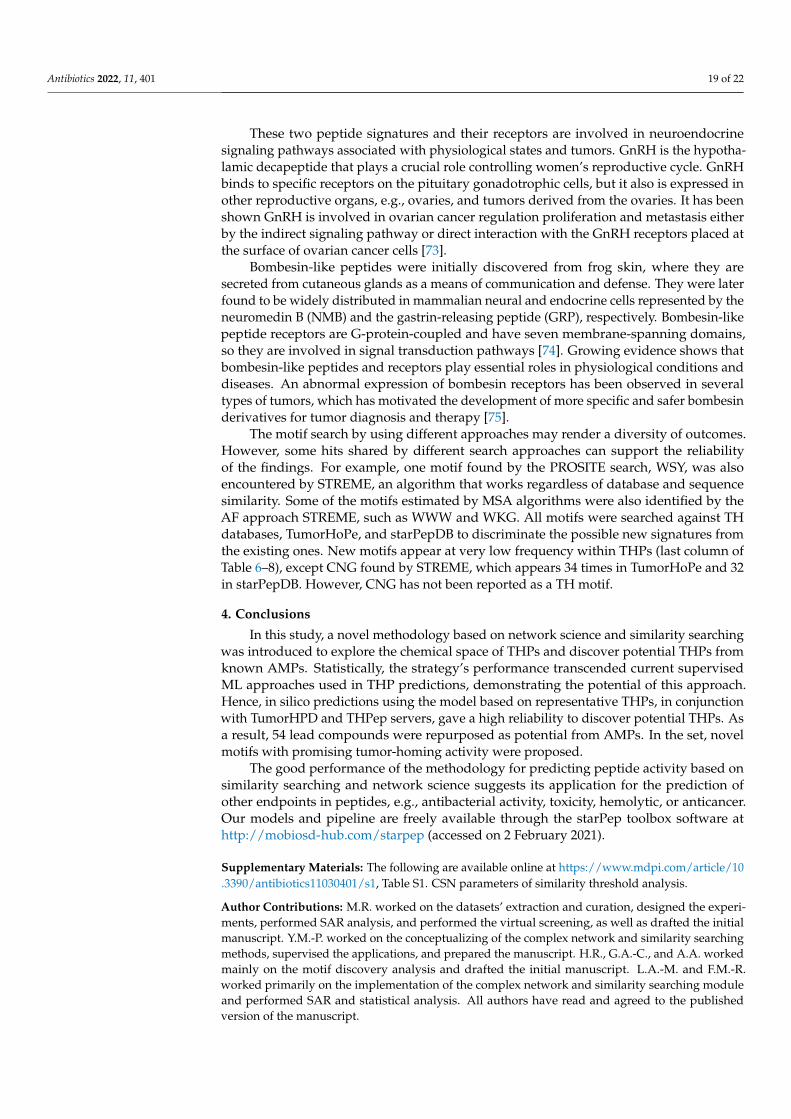
Antibiotics 2022, 11, 401 19 of 22
These two peptide signatures and their receptors are involved in neuroendocrinesignaling pathways associated with physiological states and tumors. GnRH is the hypotha-lamic decapeptide that plays a crucial role controlling women’s reproductive cycle. GnRHbinds to specific receptors on the pituitary gonadotrophic cells, but it also is expressed inother reproductive organs, e.g., ovaries, and tumors derived from the ovaries. It has beenshown GnRH is involved in ovarian cancer regulation proliferation and metastasis eitherby the indirect signaling pathway or direct interaction with the GnRH receptors placed atthe surface of ovarian cancer cells [73].
Bombesin-like peptides were initially discovered from frog skin, where they aresecreted from cutaneous glands as a means of communication and defense. They were laterfound to be widely distributed in mammalian neural and endocrine cells represented by theneuromedin B (NMB) and the gastrin-releasing peptide (GRP), respectively. Bombesin-likepeptide receptors are G-protein-coupled and have seven membrane-spanning domains,so they are involved in signal transduction pathways [74]. Growing evidence shows thatbombesin-like peptides and receptors play essential roles in physiological conditions anddiseases. An abnormal expression of bombesin receptors has been observed in severaltypes of tumors, which has motivated the development of more specific and safer bombesinderivatives for tumor diagnosis and therapy [75].
The motif search by using different approaches may render a diversity of outcomes.However, some hits shared by different search approaches can support the reliabilityof the findings. For example, one motif found by the PROSITE search, WSY, was alsoencountered by STREME, an algorithm that works regardless of database and sequencesimilarity. Some of the motifs estimated by MSA algorithms were also identified by theAF approach STREME, such as WWW and WKG. All motifs were searched against THdatabases, TumorHoPe, and starPepDB to discriminate the possible new signatures fromthe existing ones. New motifs appear at very low frequency within THPs (last column ofTable 6–8), except CNG found by STREME, which appears 34 times in TumorHoPe and 32in starPepDB. However, CNG has not been reported as a TH motif.
4. Conclusions
In this study, a novel methodology based on network science and similarity searchingwas introduced to explore the chemical space of THPs and discover potential THPs fromknown AMPs. Statistically, the strategy’s performance transcended current supervisedML approaches used in THP predictions, demonstrating the potential of this approach.Hence, in silico predictions using the model based on representative THPs, in conjunctionwith TumorHPD and THPep servers, gave a high reliability to discover potential THPs. Asa result, 54 lead compounds were repurposed as potential from AMPs. In the set, novelmotifs with promising tumor-homing activity were proposed.
The good performance of the methodology for predicting peptide activity based onsimilarity searching and network science suggests its application for the prediction ofother endpoints in peptides, e.g., antibacterial activity, toxicity, hemolytic, or anticancer.Our models and pipeline are freely available through the starPep toolbox software athttp://mobiosd-hub.com/starpep (accessed on 2 February 2021).
Supplementary Materials: The following are available online at https://www.mdpi.com/article/10.3390/antibiotics11030401/s1, Table S1. CSN parameters of similarity threshold analysis.
Author Contributions: M.R. worked on the datasets’ extraction and curation, designed the experi-ments, performed SAR analysis, and performed the virtual screening, as well as drafted the initialmanuscript. Y.M.-P. worked on the conceptualizing of the complex network and similarity searchingmethods, supervised the applications, and prepared the manuscript. H.R., G.A.-C., and A.A. workedmainly on the motif discovery analysis and drafted the initial manuscript. L.A.-M. and F.M.-R.worked primarily on the implementation of the complex network and similarity searching moduleand performed SAR and statistical analysis. All authors have read and agreed to the publishedversion of the manuscript.
Antibiotics 2022, 11, 401 20 of 22
Funding: This research was funded by USFQ’s Collaboration Grant 2019–2020 (Project ID16885),Yachay Tech grant number REG-INV-18-03244 and the APC was funded by Deanship of Researchat USFQ.
Institutional Review Board Statement: Not applicable.
Informed Consent Statement: Not applicable.
Data Availability Statement: The starPep toolbox software and the respective user manual, as well asSSMs, are freely available online at http://mobiosd-hub.com/starpep (accessed on 2 February 2021).
Acknowledgments: Yovani Marrero-Ponce (Y.M.-P.) thanks the program Profesor coinvitado for a post-doctoral fellowship to work at Valencia University in 2020-21. Y.M.-P. acknowledges the support fromCollaboration Grant 2019–2020 (Project ID16885). G.A.-C. and A.A. were supported by national fundsthrough FCT—Foundation for Science and Technology—within the scope of UIDB/04423/2020 andUIDP/04423/2020. Hortensia Rodríguez (H.R.) and Maylin Romero (M.R.) acknowledge the supportof Yachay Tech internal project “Therapeutic Peptides with biological activity” (REG-INV-18-03244).
Conflicts of Interest: The authors declare no conflict of interest.
References1. World Health Organization. Cancer. Available online: https://www.who.int/health-topics/cancer#tab=tab_1 (accessed on 1
October 2021).2. Hoskin, D.W.; Ramamoorthy, A. Studies on anticancer activities of antimicrobial peptides. Biochim. Biophys. Acta Biomembr. 2008,
1778, 357–375. [CrossRef]3. Miller, K.D.; Nogueira, L.; Mariotto, A.B.; Rowland, J.H.; Yabroff, K.R.; Alfano, C.M.; Jemal, A.; Kramer, J.L.; Siegel, R.L. Cancer
treatment and survivorship statistics, 2019. CA Cancer J. Clin. 2019, 69, 363–385. [CrossRef]4. Gatti, L.; Zunino, F. Overview of Tumor Cell Chemoresistance Mechanisms. In Chemosensitivity; Humana Press: Clifton, NJ, USA,
2005; Volume 111, pp. 127–148.5. de la Torre, B.G.; Albericio, F. Peptide therapeutics 2.0. Molecules 2020, 25, 2019–2021. [CrossRef]6. Lau, J.L.; Dunn, M.K. Therapeutic peptides: Historical perspectives, current development trends, and future directions. Bioorg.
Med. Chem. 2018, 26, 2700–2707. [CrossRef]7. Albericio, F.; Kruger, H.G. Therapeutic peptides. Future Med. Chem. 2012, 4, 1527–1531. [CrossRef]8. Ladner, R.C.; Sato, A.K.; Gorzelany, J.; De Souza, M. Phage display-derived peptides as therapeutic alternatives to antibodies.
Drug Discov. Today 2004, 9, 525–529. [CrossRef]9. Vlieghe, P.; Lisowski, V.; Martinez, J.; Khrestchatisky, M. Synthetic therapeutic peptides: Science and market. Drug Discov. Today
2010, 15, 40–56. [CrossRef]10. Loffet, A. Peptides as drugs: Is there a market? J. Pept. Sci. 2002, 8, 1–7. [CrossRef]11. Segura-Campos, M.; Chel-Guerrero, L.; Betancur-Ancona, D.; Hernandez-Escalante, V.M. Bioavailability of bioactive peptides.
Food Rev. Int. 2011, 27, 213–226. [CrossRef]12. Wu, D.; Gao, Y.; Qi, Y.; Chen, L.; Ma, Y.; Li, Y. Peptide-based cancer therapy: Opportunity and challenge. Cancer Lett. 2014, 351,
13–22. [CrossRef]13. Wei, G.; Wang, Y.; Huang, X.; Hou, H.; Zhou, S. Peptide-Based Nanocarriers for Cancer Therapy. Small Methods 2018, 2, 1–16.
[CrossRef]14. Tesauro, D.; Accardo, A.; Diaferia, C.; Milano, V.; Guillon, J.; Ronga, L.; Rossi, F. Peptide-Based Drug-Delivery Systems in
Biotechnological Applications: Recent Advances and Perspectives. Molecules 2019, 24, 351. [CrossRef] [PubMed]15. Ruoslahti, E. Tumor penetrating peptides for improved drug delivery. Adv. Drug Deliv. Rev. 2017, 110–111, 3–12. [CrossRef]
[PubMed]16. Khandia, R.; Sachan, S.; Munjal, A.K.; Tiwari, R.; Dhama, K. Tumor Homing Peptides: Promising Futuristic Hope for Cancer
Therapy. In Topics in Anti-Cancer Research; Bentham Science Publishers: Sharjah, United Arab Emirates, 2016; pp. 43–86.17. Laakkonen, P.; Vuorinen, K. Homing peptides as targeted delivery vehicles. Integr. Biol. 2010, 2, 326–337. [CrossRef]18. Elsabahy, M.; Shrestha, R.; Clark, C.; Taylor, S.; Leonard, J.; Wooley, K.L. Multifunctional hierarchically assembled nanostructures
as complex stage-wise dual-delivery systems for coincidental yet differential trafficking of siRNA and paclitaxel. Nano Lett. 2013,13, 2172–2181. [CrossRef]
19. Kolonin, M.G.; Bover, L.; Sun, J.; Zurita, A.J.; Do, K.A.; Lahdenranta, J.; Cardó-Vila, M.; Giordano, R.J.; Jaalouk, D.E.; Ozawa,M.G.; et al. Ligand-directed surface profiling of human cancer cells with combinatorial peptide libraries. Cancer Res. 2006, 66,34–40. [CrossRef] [PubMed]
20. Peletskaya, E.N.; Glinsky, V.V.; Glinsky, G.V.; Deutscher, S.L.; Quinn, T.P. Characterization of peptides that bind the tumor-associated Thomsen-Friedenreich antigen selected from bacteriophage display libraries. J. Mol. Biol. 1997, 270, 374–384. [CrossRef]
21. Wang, F.; Li, Y.; Shen, Y.; Wang, A.; Wang, S.; Xie, T. The functions and applications of RGD in tumor therapy and tissueengineering. Int. J. Mol. Sci. 2013, 14, 13447–13462. [CrossRef]
Antibiotics 2022, 11, 401 21 of 22
22. He, X.; Na, M.; Kim, J.-S.; Lee, G.-Y.; Park, J.Y.; Hoffman, A.S.; Nam, J.; Han, S.; Sim, G.Y.; Oh, Y.; et al. A Novel Peptide Probe forImaging and Targeted Delivery of Liposomal Doxorubicin to Lung Tumor. Mol. Pharm. 2011, 8, 430–438. [CrossRef]
23. Nazemian, M.; Hojati, V.; Zavareh, S.; Madanchi, H.; Hashemi-Moghaddam, H. Immobilized Peptide on the Surface of Polyl-DOPA/Silica for Targeted Delivery of 5-Fluorouracil to Breast Tumor. Int. J. Pept. Res. Ther. 2020, 26, 259–269. [CrossRef]
24. Wu, C.-H.; Liu, I.-J.; Lu, R.-M.; Wu, H.-C. Advancement and applications of peptide phage display technology in biomedicalscience. J. Biomed. Sci. 2016, 23, 8. [CrossRef]
25. Cui, W.; Aouidate, A.; Wang, S.; Yu, Q.; Li, Y.; Yuan, S. Discovering Anti-Cancer Drugs via Computational Methods. Front.Pharmacol. 2020, 11, 1–14. [CrossRef]
26. Sharma, A.; Kapoor, P.; Gautam, A.; Chaudhary, K.; Kumar, R.; Chauhan, J.S.; Tyagi, A.; Raghava, G.P.S. Computational approachfor designing tumor homing peptides. Sci. Rep. 2013, 3, 1607. [CrossRef]
27. Kapoor, P.; Singh, H.; Gautam, A.; Chaudhary, K.; Kumar, R.; Raghava, G.P.S. TumorHoPe: A Database of Tumor HomingPeptides. PLoS ONE 2012, 7, e35187. [CrossRef]
28. Shoombuatong, W.; Schaduangrat, N.; Pratiwi, R.; Nantasenamat, C. THPep: A machine learning-based approach for predictingtumor homing peptides. Comput. Biol. Chem. 2019, 80, 441–451. [CrossRef] [PubMed]
29. Aguilera-Mendoza, L.; Marrero-Ponce, Y.; Beltran, J.A.; Tellez Ibarra, R.; Guillen-Ramirez, H.A.; Brizuela, C.A. Graph-based dataintegration from bioactive peptide databases of pharmaceutical interest: Toward an organized collection enabling visual networkanalysis. Bioinformatics 2019, 35, 4739–4747. [CrossRef]
30. Charoenkwan, P.; Chiangjong, W.; Nantasenamat, C.; Moni, M.A.; Lio’, P.; Manavalan, B.; Shoombuatong, W. SCMTHP: A NewApproach for Identifying and Characterizing of Tumor-Homing Peptides Using Estimated Propensity Scores of Amino Acids.Pharmaceutics 2022, 14, 122. [CrossRef] [PubMed]
31. Aguilera-Mendoza, L.; Marrero-Ponce, Y.; García-Jacas, C.R.; Chavez, E.; Beltran, J.A.; Guillen-Ramirez, H.A.; Brizuela, C.A.Automatic construction of molecular similarity networks for visual graph mining in chemical space of bioactive peptides: Anunsupervised learning approach. Sci. Rep. 2020, 10, 18074. [CrossRef]
32. Sievers, F.; Wilm, A.; Dineen, D.; Gibson, T.J.; Karplus, K.; Li, W.; Lopez, R.; McWilliam, H.; Remmert, M.; Söding, J.; et al. Fast,scalable generation of high-quality protein multiple sequence alignments using Clustal Omega. Mol. Syst. Biol. 2011, 7, 539.[CrossRef]
33. Katoh, K.; Misawa, K.; Kuma, K.I.; Miyata, T. MAFFT: A novel method for rapid multiple sequence alignment based on fastFourier transform. Nucleic Acids Res. 2002, 30, 3059–3066. [CrossRef]
34. Edgar, R.C. MUSCLE: Multiple sequence alignment with high accuracy and high throughput. Nucleic Acids Res. 2004, 32,1792–1797. [CrossRef]
35. Notredame, C.; Higgins, D.G.; Heringa, J. T-coffee: A novel method for fast and accurate multiple sequence alignment. J. Mol.Biol. 2000, 302, 205–217. [CrossRef]
36. Bailey, T.L. STREME: Accurate and versatile sequence motif discovery. Bioinformatics 2021, 37, 2834–2840. [CrossRef]37. Contreras-Torres, E.; Marrero-Ponce, Y.; Terán, J.E.; R. García-Jacas, C.; Brizuela, C.A.; Carlos Sánchez-Rodríguez, J. MuLiMs-
MCoMPAs: A Novel Multiplatform Framework to Compute Tensor Algebra-Based Three-Dimensional Protein Descriptors. J.Chem. Inf. Model. 2020, 60, 1042–1059. [CrossRef]
38. Fruchterman, T.M.J.; Reingold, E.M. Graph Drawing by Force-Directed Placement. Softw. Pract. Exp. 1991, 21, 1129–1164.[CrossRef]
39. Blondel, V.D.; Guillaume, J.-L.; Lambiotte, R.; Lefebvre, E. Fast unfolding of communities in large networks. J. Stat. Mech. TheoryExp. 2008, 2008, P10008. [CrossRef]
40. Reigosa, M.J.; Gonzalez, L.; Sanches-Moreiras, A.; Duran, B.; Puime, D.; Fernadez, D.A.; Bolano, J.C. Comparison of physiologicaleffects of allelochemicals and commercial herbicides. Allelopath. J. 2001, 8, 211–220.
41. Bastian, M.; Heymann, S.; Jacomy, M. Gephi: An open source software for exploring and manipulating networks. In Proceedings ofthe Third International Conference on Weblogs and Social Media, ICWSM 2009, San Jose, CA, USA, 17–20 May 2009; pp. 361–362.
42. Shoombuatong, W.; Schaduangrat, N.; Nantasenamat, C. Unraveling the bioactivity of anticancer peptides as deduced frommachine learning. EXCLI J. 2018, 17, 734–752. [CrossRef] [PubMed]
43. Willett, P. Similarity-based virtual screening using 2D fingerprints. Drug Discov. Today 2006, 11, 1046–1053. [CrossRef] [PubMed]44. Triguero, I.; González, S.; Moyano, J.M.; García, S.; Alcalá-Fdez, J.; Luengo, J.; Fernández, A.; del Jesús, M.J.; Sánchez, L.; Herrera,
F. KEEL 3.0: An Open Source Software for Multi-Stage Analysis in Data Mining. Int. J. Comput. Intell. Syst. 2017, 10, 1238–1249.[CrossRef]
45. Iman, R.L.; Davenport, J.M. Approximations of the critical region of the Friedman statistic. Commun. Stat. Theory Methods 1980, 9,571–595. [CrossRef]
46. Lee, W.H.; Loo, C.Y.; Ghadiri, M.; Leong, C.R.; Young, P.M.; Traini, D. The potential to treat lung cancer via inhalation ofrepurposed drugs. Adv. Drug Deliv. Rev. 2018, 133, 107–130. [CrossRef] [PubMed]
47. Pushpakom, S.; Iorio, F.; Eyers, P.A.; Escott, K.J.; Hopper, S.; Wells, A.; Doig, A.; Guilliams, T.; Latimer, J.; McNamee, C.; et al.Drug repurposing: Progress, challenges and recommendations. Nat. Rev. Drug Discov. 2019, 18, 41–58. [CrossRef] [PubMed]
48. Tyagi, A.; Kapoor, P.; Kumar, R.; Chaudhary, K.; Gautam, A.; Raghava, G.P.S. In silico models for designing and discovering novelanticancer peptides. Sci. Rep. 2013, 3, 2984. [CrossRef] [PubMed]
Antibiotics 2022, 11, 401 22 of 22
49. Gautam, A.; Chaudhary, K.; Kumar, R.; Sharma, A.; Kapoor, P.; Tyagi, A.; Raghava, G.P.S. In silico approaches for designinghighly effective cell penetrating peptides. J. Transl. Med. 2013, 11, 74. [CrossRef]
50. Gupta, S.; Kapoor, P.; Chaudhary, K.; Gautam, A.; Kumar, R.; Raghava, G.P.S. In Silico Approach for Predicting Toxicity ofPeptides and Proteins. PLoS ONE 2013, 8, e73957. [CrossRef]
51. Chaudhary, K.; Kumar, R.; Singh, S.; Tuknait, A.; Gautam, A.; Mathur, D.; Anand, P.; Varshney, G.C.; Raghava, G.P.S. A WebServer and Mobile App for Computing Hemolytic Potency of Peptides. Sci. Rep. 2016, 6, 22843. [CrossRef]
52. Xu, J.; Li, F.; Leier, A.; Xiang, D.; Shen, H.-H.; Marquez Lago, T.T.; Li, J.; Yu, D.-J.; Song, J. Comprehensive assessment of machinelearning-based methods for predicting antimicrobial peptides. Brief. Bioinform. 2021, 22, bbab083. [CrossRef]
53. Thomsen, M.C.F.; Nielsen, M. Seq2Logo: A method for construction and visualization of amino acid binding motifs and sequenceprofiles including sequence weighting, pseudo counts and two-sided representation of amino acid enrichment and depletion.Nucleic Acids Res. 2012, 40, 281–287. [CrossRef]
54. Zahoránszky-Kohalmi, G.; Bologa, C.G.; Oprea, T.I. Impact of similarity threshold on the topology of molecular similaritynetworks and clustering outcomes. J. Cheminform. 2016, 8, 16. [CrossRef]
55. Chicco, D.; Tötsch, N.; Jurman, G. The Matthews correlation coefficient (MCC) is more reliable than balanced accuracy, bookmakerinformedness, and markedness in two-class confusion matrix evaluation. BioData Min. 2021, 14, 13. [CrossRef] [PubMed]
56. Jobin, M.-L.; Blanchet, M.; Henry, S.; Chaignepain, S.; Manigand, C.; Castano, S.; Lecomte, S.; Burlina, F.; Sagan, S.; Alves, I.D. Therole of tryptophans on the cellular uptake and membrane interaction of arginine-rich cell penetrating peptides. Biochim. Biophys.Acta Biomembr. 2015, 1848, 593–602. [CrossRef] [PubMed]
57. Chu, H.L.; Yip, B.S.; Chen, K.H.; Yu, H.Y.; Chih, Y.H.; Cheng, H.T.; Chou, Y.T.; Cheng, J.W. Novel antimicrobial peptides with highanticancer activity and selectivity. PLoS ONE 2015, 10, e0126390. [CrossRef] [PubMed]
58. Ellerby, H.M.; Arap, W.; Ellerby, L.M.; Kain, R.; Andrusiak, R.; Rio, G. Del; Krajewski, S.; Lombardo, C.R.; Rao, R.; Ruoslahti, E.;et al. Anti-cancer activity of targeted pro-apoptotic peptides. Nat. Med. 1999, 5, 1032–1038. [CrossRef] [PubMed]
59. Ruoslahti, E.; Pasqualini, R. Tumor Homing Molecules, Conjugates Derived Therefrom, and Methods of Using Same. Int. Pat.Appl. WO 1998/010795, 19 March 1998.
60. Bayse, C.A.; Pollard, D.B. Conformation dynamics of cyclic disulfides and selenosulfides in CXXC(U) (X = Gly, Ala) tetrapeptideredox motifs. J. Pept. Sci. 2019, 25, 16–22. [CrossRef] [PubMed]
61. Lee, S.; Kim, S.M.; Lee, R.T. Thioredoxin and thioredoxin target proteins: From molecular mechanisms to functional significance.Antioxid. Redox Signal. 2013, 18, 1165–1207. [CrossRef]
62. Ohta, T.; Hashida, Y.; Yamashita, F.; Hashida, M. Sustained Release of Mitomycin C from Its Conjugate with Single-Walled CarbonNanotubes Associated by Pegylated Peptide. Biol. Pharm. Bull. 2016, 39, 1687–1693. [CrossRef]
63. Bailey, T.L. DREME: Motif discovery in transcription factor ChIP-seq data. Bioinformatics 2011, 27, 1653–1659. [CrossRef] [PubMed]64. Heinz, S.; Benner, C.; Spann, N.; Bertolino, E.; Lin, Y.C.; Laslo, P.; Cheng, J.X.; Murre, C.; Singh, H.; Glass, C.K. Simple
Combinations of Lineage-Determining Transcription Factors Prime cis-Regulatory Elements Required for Macrophage and B CellIdentities. Mol. Cell 2010, 38, 576–589. [CrossRef]
65. Bailey, T.L.; Boden, M.; Buske, F.A.; Frith, M.; Grant, C.E.; Clementi, L.; Ren, J.; Li, W.W.; Noble, W.S. MEME Suite: Tools for motifdiscovery and searching. Nucleic Acids Res. 2009, 37, 202–208. [CrossRef]
66. Asai, T.; Nagatsuka, M.; Kuromi, K.; Yamakawa, S.; Kurohane, K.; Ogino, K.; Tanaka, M.; Taki, T.; Oku, N. Suppression of tumorgrowth by novel peptides homing to tumor-derived new blood vessels. FEBS Lett. 2002, 510, 206–210. [CrossRef]
67. Oku, N.; Asai, T.; Watanabe, K.; Kuromi, K.; Nagatsuka, M.; Kurohane, K.; Kikkawa, H.; Ogino, K.; Tanaka, M.; Ishikawa, D.; et al.Anti-neovascular therapy using novel peptides homing to angiogenic vessels. Oncogene 2002, 21, 2662–2669. [CrossRef] [PubMed]
68. Jennings, B.H.; Pickles, L.M.; Wainwright, S.M.; Roe, S.M.; Pearl, L.H.; Ish-Horowicz, D. Molecular Recognition of TranscriptionalRepressor Motifs by the WD Domain of the Groucho/TLE Corepressor. Mol. Cell 2006, 22, 645–655. [CrossRef] [PubMed]
69. Castelletto, V.; Edwards-Gayle, C.J.C.; Hamley, I.W.; Pelin, J.N.B.D.; Alves, W.A.; Aguilar, A.M.; Seitsonen, J.; Ruokolainen, J.Self-assembly of a catalytically active lipopeptide and its incorporation into cubosomes. ACS Appl. Bio Mater. 2019, 2, 3639–3647.[CrossRef] [PubMed]
70. Benjdia, A.; Berteau, O. Radical SAM Enzymes and Ribosomally-Synthesized and Post-translationally Modified Peptides: AGrowing Importance in the Microbiomes. Front. Chem. 2021, 9, 678068. [CrossRef] [PubMed]
71. Yu, F.-H.; Huang, K.-J.; Wang, C.-T. C-Terminal HIV-1 Transframe p6* Tetrapeptide Blocks Enhanced Gag Cleavage Incurred byLeucine Zipper Replacement of a Deleted p6* Domain. J. Virol. 2017, 91, e00103-17. [CrossRef] [PubMed]
72. Kanehisa, M.; Goto, S.; Kawashima, S.; Nakaya, A. Thed KEGG databases at GenomeNet. Nucleic Acids Res. 2002, 30, 42–46.[CrossRef]
73. Ohlsson, B. Gonadotropin-releasing hormone and its role in the enteric nervous system. Front. Endocrinol. 2017, 8, 110. [CrossRef][PubMed]
74. Spindel, E.R. Chapter 46—Bombesin Peptides. In Handbook of Biologically Active Peptides; Kastin, A.J., Ed.; Academic Press:Cambridge, MA, USA, 2013; pp. 326–330.
75. Guo, M.; Qu, X.; Qin, X.Q. Bombesin-like peptides and their receptors: Recent findings in pharmacology and physiology. Curr.Opin. Endocrinol. Diabetes Obes. 2015, 22, 3–8. [CrossRef]
Related Documents