A novel method of quantitative risk assessment based on grid difference of pipeline sections Lei Ma a,⇑ , Yongshu Li b , Lei Liang b , Manchun Li a , Liang Cheng a,1 a Jiangsu Provincial Key Laboratory of Geographic Information Science and Technology, Nanjing University, Nanjing, China, b GIS Engineering Center, Southwest Jiaotong University, Chengdu, China article info Article history: Received 22 July 2012 Revised 17 March 2013 Accepted date 28 April 2013 Available online 26 May 2013 Keywords: Network model Grid difference of pipeline sections (GDPSs) Pipeline fatal length Quantitative risk assessment Risk contour line abstract The growing demand of the urban natural gas pipeline makes the security problem of in-use pipelines attract more and more concern. Risk assessment and management for urban natural gas pipeline network is the effective way to guarantee its safety running. This paper focuses on a method for quantitative risk assessment for urban natural gas pipeline network based on grid difference of pipeline sections (GDPSs), introduces the city gas pipeline network model, defines the pipeline fatal length and analyzes gas net- work accident probability and accident consequence of unconfined vapor cloud explosion (UVCE), fire ball combustion, jet flame. The outcome of the quantitative method is the risk contour line and then can get corresponding protective area according to risk acceptable criteria. Finally, the proposed method is applied to an urban pipe network. It is proved that is suitable for the urban natural gas pipeline net- work and can provide decision support for risk management of urban natural gas pipeline network. Ó 2013 Elsevier Ltd. All rights reserved. 1. Introduction Natural gas pipeline network is an important part of a city’s infrastructure for energy transmission. With the development of modern cities, natural gas has currently become one of the most widely used sources of energy. At present, the consumption of nat- ural gas is more than 20% for the total energy in the European Un- ion (Montiel et al., 1996). In China, there are 246 prefecture cities having gas pipeline facilities and the length of natural gas pipeline has reached 6.35 10 4 km by the year of 2004. However, with the gas pipeline network becoming vaster and more complex, accident caused by the leak of gas pipeline network occur. Accident conse- quences caused by gas pipeline rupture are often fire and explo- sion, directly threatening the safety of persons and property (Mercedes et al., 2008). In 2006, ten people were killed and injured due to the explosion caused by gas pipeline rupture in Sichuan province; In Paraguay, a conflagration resulted in more than 250 deaths in 2004, caused by gas leakage. In Moscow, an explosion caused by gas leakage induced the greatest conflagration in 2009 ever since the Second World War (Han and Weng, 2011). On March 15, 2010, a natural gas explosion resulting from the road construc- tion of the Huangpu Road in Wuhan damaged the main natural gas pipelines, set nearby residents’ houses on fire, and interrupted nat- ural gas supply to 4000 households. On June 8, 2010, a natural gas pipeline explosion in Lipscomb County, a small town in Northern Texas on the border with Oklahoma, caused two deaths and three heavy injuries. Thus, it is clear that the risk assessment of natural gas pipeline network is very important. Generally, risk is defined as a mathematical function of the probability of a pipeline failure occurring and the magnitude of death. Risk management control the probability of risk, casualties, property loss, economic loss and environment damage at accept- able level according to the reference data of gas pipeline network. Recently, the quantitative risk assessment has become one of the important approaches for risk management of gas pipeline net- work (Han and Weng, 2010). Generally, the outcomes of quantita- tive method are individual risk and social risk (Jonkman et al., 2003), which is the main work in this paper. Generally, the numer- ical simulation method is used for assessing the risk, including a quantitative calculation of possibilities and consequences of differ- ent accidents, which is based on the physical and chemical models as well as the physiological dose–effect relationship of human (Mark et al., 1998; Jonkman et al., 2003). As for gas pipeline quantitative risk assessment, numerous researchers have been done by academics from home and abroad (Arnaldos et al., 1998; Joel and Duncan, 2003; Muhlbauer, 2004; Metropolo and Brown, 2004; Jo and Ahn, 2005; Sklavounos and Ri- gas, 2006; Xu et al., 2008; Jo and Crowl, 2008; Liu and Liu, 2009; Jaffee et al., 2009). However, many researches mainly used the quantitative risk assessment method of long-distance transmission pipeline to analyze the urban gas pipeline network. The located environment between the long-distance transmission pipeline 0925-7535/$ - see front matter Ó 2013 Elsevier Ltd. All rights reserved. http://dx.doi.org/10.1016/j.ssci.2013.04.012 ⇑ Corresponding author. Tel.: +86 18251952382. E-mail addresses: [email protected] (L. Ma), [email protected] (L. Cheng). 1 Co-corresponding author. Tel.: +86 25 83594929. Safety Science 59 (2013) 219–226 Contents lists available at SciVerse ScienceDirect Safety Science journal homepage: www.elsevier.com/locate/ssci

Welcome message from author
This document is posted to help you gain knowledge. Please leave a comment to let me know what you think about it! Share it to your friends and learn new things together.
Transcript
Safety Science 59 (2013) 219–226
Contents lists available at SciVerse ScienceDirect
Safety Science
journal homepage: www.elsevier .com/locate /ssc i
A novel method of quantitative risk assessment based on grid differenceof pipeline sections
0925-7535/$ - see front matter � 2013 Elsevier Ltd. All rights reserved.http://dx.doi.org/10.1016/j.ssci.2013.04.012
⇑ Corresponding author. Tel.: +86 18251952382.E-mail addresses: [email protected] (L. Ma), [email protected] (L. Cheng).
1 Co-corresponding author. Tel.: +86 25 83594929.
Lei Ma a,⇑, Yongshu Li b, Lei Liang b, Manchun Li a, Liang Cheng a,1
a Jiangsu Provincial Key Laboratory of Geographic Information Science and Technology, Nanjing University, Nanjing, China,b GIS Engineering Center, Southwest Jiaotong University, Chengdu, China
a r t i c l e i n f o
Article history:Received 22 July 2012Revised 17 March 2013Accepted date 28 April 2013Available online 26 May 2013
Keywords:Network modelGrid difference of pipeline sections (GDPSs)Pipeline fatal lengthQuantitative risk assessmentRisk contour line
a b s t r a c t
The growing demand of the urban natural gas pipeline makes the security problem of in-use pipelinesattract more and more concern. Risk assessment and management for urban natural gas pipeline networkis the effective way to guarantee its safety running. This paper focuses on a method for quantitative riskassessment for urban natural gas pipeline network based on grid difference of pipeline sections (GDPSs),introduces the city gas pipeline network model, defines the pipeline fatal length and analyzes gas net-work accident probability and accident consequence of unconfined vapor cloud explosion (UVCE), fireball combustion, jet flame. The outcome of the quantitative method is the risk contour line and thencan get corresponding protective area according to risk acceptable criteria. Finally, the proposed methodis applied to an urban pipe network. It is proved that is suitable for the urban natural gas pipeline net-work and can provide decision support for risk management of urban natural gas pipeline network.
� 2013 Elsevier Ltd. All rights reserved.
1. Introduction
Natural gas pipeline network is an important part of a city’sinfrastructure for energy transmission. With the development ofmodern cities, natural gas has currently become one of the mostwidely used sources of energy. At present, the consumption of nat-ural gas is more than 20% for the total energy in the European Un-ion (Montiel et al., 1996). In China, there are 246 prefecture citieshaving gas pipeline facilities and the length of natural gas pipelinehas reached 6.35 � 104 km by the year of 2004. However, with thegas pipeline network becoming vaster and more complex, accidentcaused by the leak of gas pipeline network occur. Accident conse-quences caused by gas pipeline rupture are often fire and explo-sion, directly threatening the safety of persons and property(Mercedes et al., 2008). In 2006, ten people were killed and injureddue to the explosion caused by gas pipeline rupture in Sichuanprovince; In Paraguay, a conflagration resulted in more than 250deaths in 2004, caused by gas leakage. In Moscow, an explosioncaused by gas leakage induced the greatest conflagration in 2009ever since the Second World War (Han and Weng, 2011). On March15, 2010, a natural gas explosion resulting from the road construc-tion of the Huangpu Road in Wuhan damaged the main natural gaspipelines, set nearby residents’ houses on fire, and interrupted nat-ural gas supply to 4000 households. On June 8, 2010, a natural gas
pipeline explosion in Lipscomb County, a small town in NorthernTexas on the border with Oklahoma, caused two deaths and threeheavy injuries. Thus, it is clear that the risk assessment of naturalgas pipeline network is very important.
Generally, risk is defined as a mathematical function of theprobability of a pipeline failure occurring and the magnitude ofdeath. Risk management control the probability of risk, casualties,property loss, economic loss and environment damage at accept-able level according to the reference data of gas pipeline network.Recently, the quantitative risk assessment has become one of theimportant approaches for risk management of gas pipeline net-work (Han and Weng, 2010). Generally, the outcomes of quantita-tive method are individual risk and social risk (Jonkman et al.,2003), which is the main work in this paper. Generally, the numer-ical simulation method is used for assessing the risk, including aquantitative calculation of possibilities and consequences of differ-ent accidents, which is based on the physical and chemical modelsas well as the physiological dose–effect relationship of human(Mark et al., 1998; Jonkman et al., 2003).
As for gas pipeline quantitative risk assessment, numerousresearchers have been done by academics from home and abroad(Arnaldos et al., 1998; Joel and Duncan, 2003; Muhlbauer, 2004;Metropolo and Brown, 2004; Jo and Ahn, 2005; Sklavounos and Ri-gas, 2006; Xu et al., 2008; Jo and Crowl, 2008; Liu and Liu, 2009;Jaffee et al., 2009). However, many researches mainly used thequantitative risk assessment method of long-distance transmissionpipeline to analyze the urban gas pipeline network. The locatedenvironment between the long-distance transmission pipeline
220 L. Ma et al. / Safety Science 59 (2013) 219–226
and urban gas pipeline is quite different. Moreover, urban gas pipe-line network is more complex than long-distance transmissionpipeline, which is comprised of dendritic pipeline network andlooped pipeline network. Consequently, a limitation can be ob-served regarding the existing method for the quantitative riskassessment of urban gas pipeline network (Han and Weng,2011). In addition, basic data, corrosion monitoring and inspectiondata have been paid more attention for assessing the risk value byquantitative method, and the location and multi-segments impactsfactors are ignored (Xing et al., 2009; Jing et al., 2009; Xiang et al.,2011; Zhang et al., 2011). However, the location and multi-seg-ments impacts factors should be brought to the forefront, due tocomplexity and very high density of the urban pipelines. Consider-ing the pipeline fatal length, gas network accident probability andaccident consequence, an integrated approach for dynamic safetyassessment and prognosis needed to be improved (Hu et al., 2010).
In this paper, a novel method of quantitative risk assessmentbased on grid difference of pipeline sections (GDPSs) is proposedfor urban natural gas pipeline network, to assess the risk of gaspipeline network. Combining gas pipeline failure probability withthe consequences of various accident impacts, this method can cal-culate risk value for specific position (x, y) under the influence ofpipeline sections, to simulate the risk distribution. In the secondsection of this paper, urban gas pipeline network model is pre-sented. The quantitative method is presented in Section 3. In Sec-tion 4, a sample urban gas pipeline network is applied todemonstrate the method. Conclusions are given in the last section.
2. Methodology
Risk can be expressed in different ways: individual risk, socialrisk, maximum individual risk, average individual risk of totalpopulation, average rate of death. Generally, individual risk (IR)and social risk (SR) are used to describe risk (Liu and Liu,2009). The former usually uses risk contour line to show riskwhile the latter is presented with frequency–number (F–N) curve(TNO, 1999). Individual risk can be evaluated by synthesizingpossibility assessment and consequence analysis and mainly in-volves casualty, which is defined as the probability of death atany particular position without protection. Social risk is definedas the relationship between the frequency of an incident andthe number of casualties (John et al., 2001). In the following sec-tion, individual risk and social risk for urban gas pipeline will beanalyzed in detail.
2.1. Urban gas pipeline network model
From the standpoint of the map projection, the structure of ur-ban gas pipeline network characteristically has the features ofpoint and line. To traverse pipeline sections which have an influ-ence on the risk of special position (x, y), it is reasonable to usethe graph theory method to analyze the risk impact (Ying andZhang, 2006). Gas pipeline network can be defined as the networkin graph theory, and Gas pipelines can be defined as edges in net-work, and pressure-regulator boxes and values can be defined asjunctions in network. From the standpoint of data structure, gaspipeline is abstractly comprised of nodes and arcs. After the topol-
Table 1The relations of nodes-edge.
Vertex AdjArc
V1 L1,L2,L4� � � � � �Vn Li, Lj, Lk
ogy is created, the relationship between nodes and arcs, nodes andnodes, arcs and arcs can be got, to generate the geometric networkfor gas pipelines network. Relationship between nodes and arcscan be conveyed by adjacency list (see Table 1).
Relationship between nodes and arcs, nodes and nodes, arcs andarcs for gas pipeline network model is represented as follows:
Storage structure in adjacency list as follows:
Struct ArcNode{
int AdjVertex; // Edge point to the vertex positionsArc ArcInfo; //Information of the edgeArcNode ⁄NextArc;} //Point to Next edge
Struct VNode{Vertex VertexInfo; //Information of the nodeArcNode ⁄FirstArc; //Point to first attached edge
}Storage structure of pipeline information as follows:
Struct PipelineEdge{
int nId; //Pipeline IDint nNode1;
int nNode2; //Ends of pipeline IDdouble nLength;//Length of pipeline
}Facilities information (values, pressure-regulator boxes,
Source, Sink, etc.) as follows:Struct PipelineNode{int nId; // Facilities nodes IDstring nType; // Facilities nodes styleIpoint xy; //Geographic coordinates}
2.2. Quantitative risk assessment model
Individual risk is calculated by multiplying the probability ofpipeline failure occurring by the magnitude of death at any partic-ular position (x, y). As for urban gas pipeline network, failure posi-tion is unknown and failure rate may vary along the pipeline.Moreover, risk is influenced by more than one sections of pipelinedue to the complexity of the urban gas pipeline network. It can beestimated by integrating the probability of pipeline failure multi-plied by the magnitude of death at any particular position from dif-ferent accident scenarios. It can be expressed as the followingequation (Jo and Ahn, 2005):
IRðx; yÞ ¼X
i
XConsequence
Z lþ
l�/iPiðx; yÞdL ð1Þ
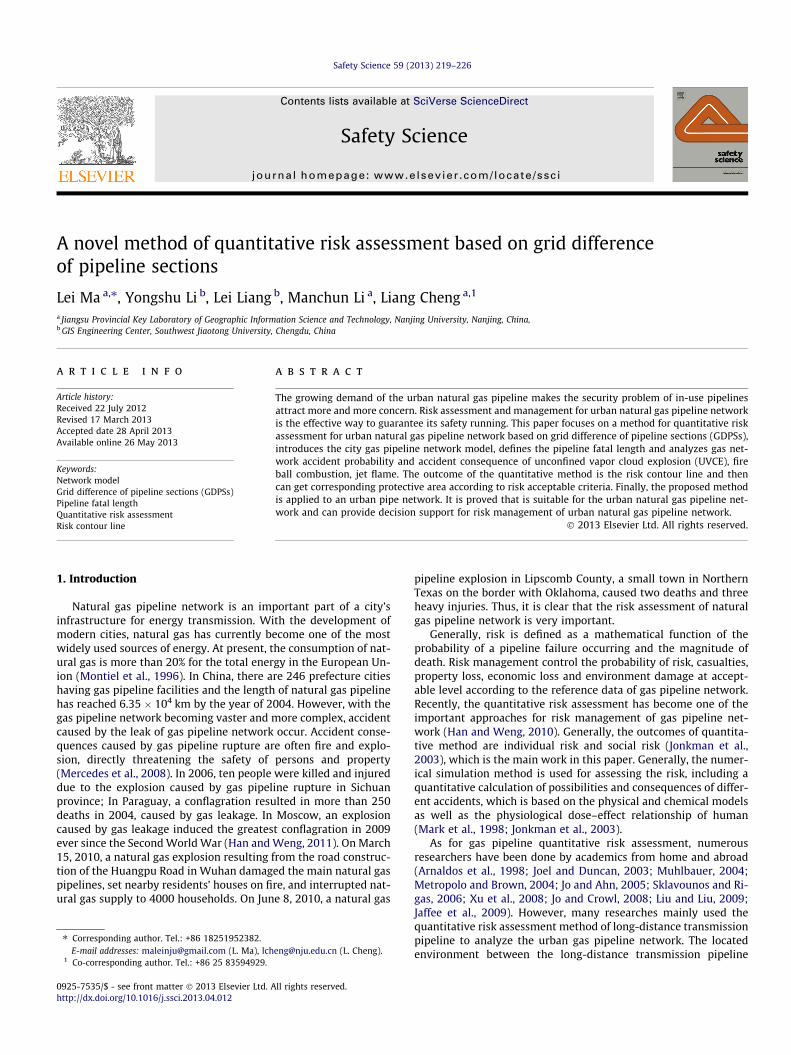
where the subscript i denotes the accident scenarios, (x, y) the spec-ified location of individual risk value, /i the failure rate per unitlength of the pipeline associated with the accident scenario i, Lthe pipeline length, Pi the lethality associated with the accident sce-nario i and l± represents the ends of the interacting section of thepipeline in which an accident pose hazard to the specified location(see Fig. 1).
By assuming a constant failure rate to simplify calculation ofindividual risk, the individual risk can be written as the followingequation:
IRðx; yÞ ¼X
i
/i
XConsequence
Z lþ
l�
Piðx; yÞdL ð2Þ
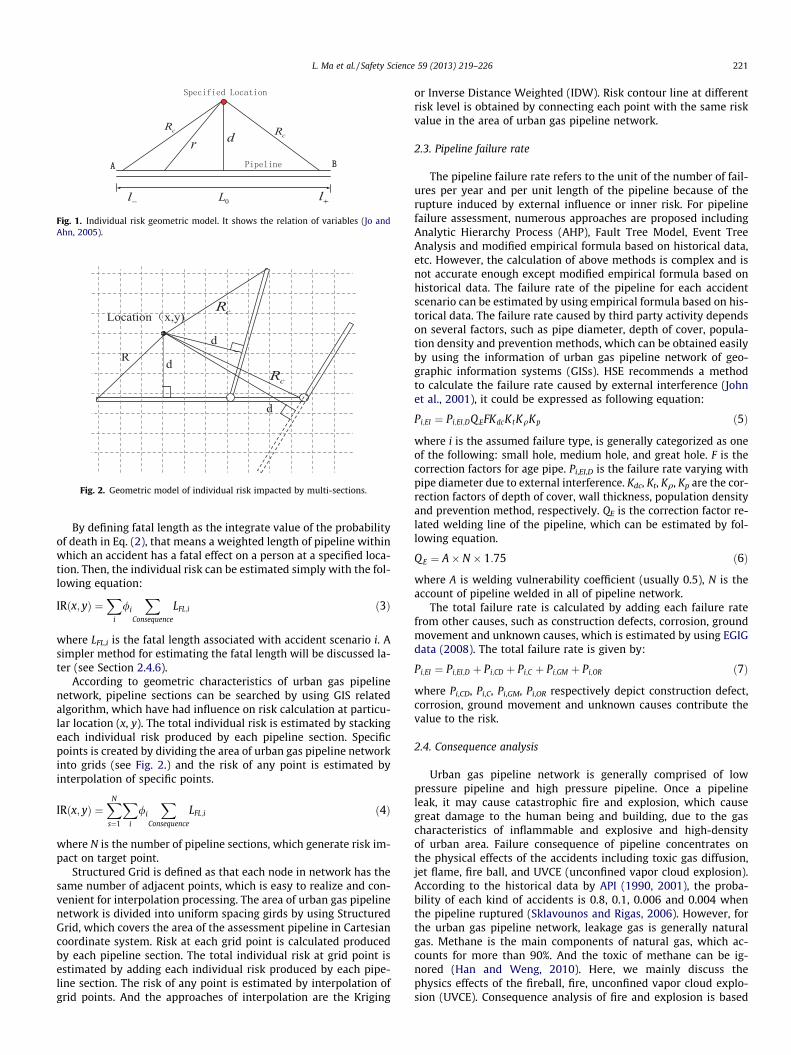
Fig. 1. Individual risk geometric model. It shows the relation of variables (Jo andAhn, 2005).
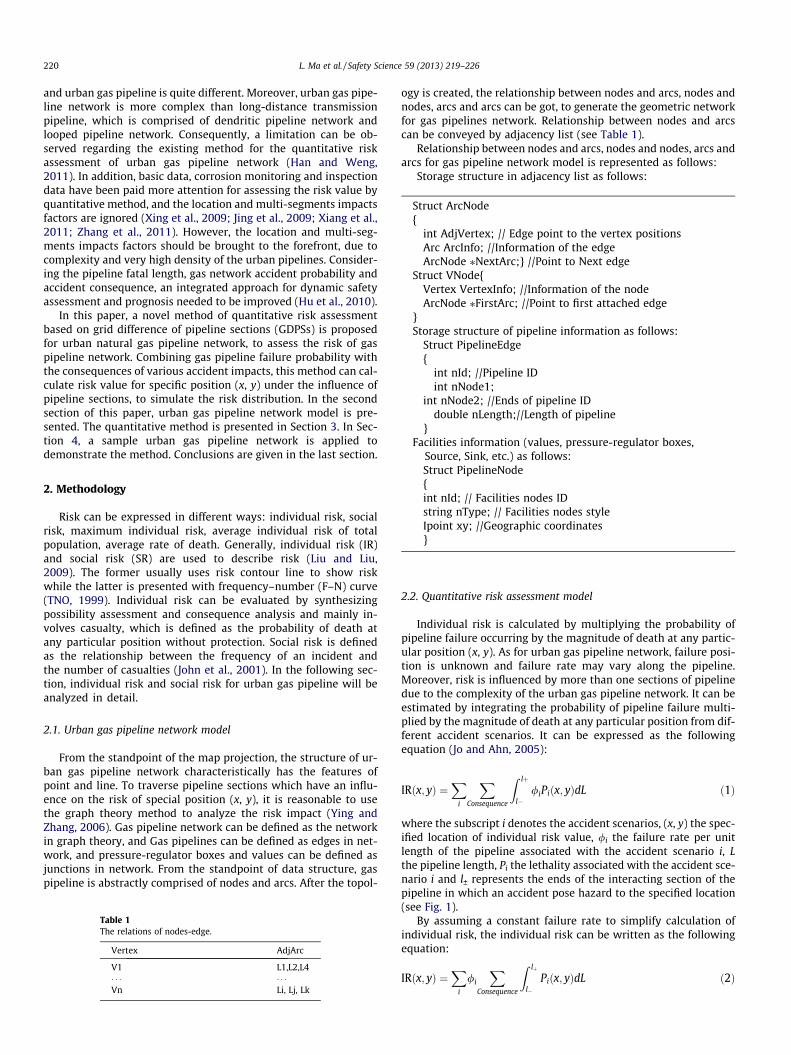
Fig. 2. Geometric model of individual risk impacted by multi-sections.
L. Ma et al. / Safety Science 59 (2013) 219–226 221
By defining fatal length as the integrate value of the probabilityof death in Eq. (2), that means a weighted length of pipeline withinwhich an accident has a fatal effect on a person at a specified loca-tion. Then, the individual risk can be estimated simply with the fol-lowing equation:
IRðx; yÞ ¼X
i
/i
XConsequence
LFL;i ð3Þ
where LFL,i is the fatal length associated with accident scenario i. Asimpler method for estimating the fatal length will be discussed la-ter (see Section 2.4.6).
According to geometric characteristics of urban gas pipelinenetwork, pipeline sections can be searched by using GIS relatedalgorithm, which have had influence on risk calculation at particu-lar location (x, y). The total individual risk is estimated by stackingeach individual risk produced by each pipeline section. Specificpoints is created by dividing the area of urban gas pipeline networkinto grids (see Fig. 2.) and the risk of any point is estimated byinterpolation of specific points.
IRðx; yÞ ¼XN
s¼1
Xi
/i
XConsequence
LFL;i ð4Þ
where N is the number of pipeline sections, which generate risk im-pact on target point.
Structured Grid is defined as that each node in network has thesame number of adjacent points, which is easy to realize and con-venient for interpolation processing. The area of urban gas pipelinenetwork is divided into uniform spacing girds by using StructuredGrid, which covers the area of the assessment pipeline in Cartesiancoordinate system. Risk at each grid point is calculated producedby each pipeline section. The total individual risk at grid point isestimated by adding each individual risk produced by each pipe-line section. The risk of any point is estimated by interpolation ofgrid points. And the approaches of interpolation are the Kriging
or Inverse Distance Weighted (IDW). Risk contour line at differentrisk level is obtained by connecting each point with the same riskvalue in the area of urban gas pipeline network.
2.3. Pipeline failure rate
The pipeline failure rate refers to the unit of the number of fail-ures per year and per unit length of the pipeline because of therupture induced by external influence or inner risk. For pipelinefailure assessment, numerous approaches are proposed includingAnalytic Hierarchy Process (AHP), Fault Tree Model, Event TreeAnalysis and modified empirical formula based on historical data,etc. However, the calculation of above methods is complex and isnot accurate enough except modified empirical formula based onhistorical data. The failure rate of the pipeline for each accidentscenario can be estimated by using empirical formula based on his-torical data. The failure rate caused by third party activity dependson several factors, such as pipe diameter, depth of cover, popula-tion density and prevention methods, which can be obtained easilyby using the information of urban gas pipeline network of geo-graphic information systems (GISs). HSE recommends a methodto calculate the failure rate caused by external interference (Johnet al., 2001), it could be expressed as following equation:
Pi;EI ¼ Pi;EI;DQ EFKdcKtKqKp ð5Þ
where i is the assumed failure type, is generally categorized as oneof the following: small hole, medium hole, and great hole. F is thecorrection factors for age pipe. Pi,EI,D is the failure rate varying withpipe diameter due to external interference. Kdc, Kt, Kq, Kp are the cor-rection factors of depth of cover, wall thickness, population densityand prevention method, respectively. QE is the correction factor re-lated welding line of the pipeline, which can be estimated by fol-lowing equation.
QE ¼ A� N � 1:75 ð6Þ
where A is welding vulnerability coefficient (usually 0.5), N is theaccount of pipeline welded in all of pipeline network.
The total failure rate is calculated by adding each failure ratefrom other causes, such as construction defects, corrosion, groundmovement and unknown causes, which is estimated by using EGIGdata (2008). The total failure rate is given by:
Pi;EI ¼ Pi;EI;D þ Pi;CD þ Pi;C þ Pi;GM þ Pi;OR ð7Þ
where Pi,CD, Pi,C, Pi,GM, Pi,OR respectively depict construction defect,corrosion, ground movement and unknown causes contribute thevalue to the risk.
2.4. Consequence analysis
Urban gas pipeline network is generally comprised of lowpressure pipeline and high pressure pipeline. Once a pipelineleak, it may cause catastrophic fire and explosion, which causegreat damage to the human being and building, due to the gascharacteristics of inflammable and explosive and high-densityof urban area. Failure consequence of pipeline concentrates onthe physical effects of the accidents including toxic gas diffusion,jet flame, fire ball, and UVCE (unconfined vapor cloud explosion).According to the historical data by API (1990, 2001), the proba-bility of each kind of accidents is 0.8, 0.1, 0.006 and 0.004 whenthe pipeline ruptured (Sklavounos and Rigas, 2006). However, forthe urban gas pipeline network, leakage gas is generally naturalgas. Methane is the main components of natural gas, which ac-counts for more than 90%. And the toxic of methane can be ig-nored (Han and Weng, 2010). Here, we mainly discuss thephysics effects of the fireball, fire, unconfined vapor cloud explo-sion (UVCE). Consequence analysis of fire and explosion is based
Fig. 3. The relationship between volume mass of pipeline leak and leak massvelocity (Dong et al., 2003).
222 L. Ma et al. / Safety Science 59 (2013) 219–226
on the release rate and mass of the leakage. Combined with thelower burning limit of natural gas, diffusion area can be esti-mated by using Gauss diffusion model. And fuel mass can be ob-tained, which is contribute to the explosion and fire.
2.4.1. Gas release rateThe process of leakage is a isentropic adiabatic expansion pro-
cess and the release rate can be calculated by leakage model fordifferent failure style, including small hole model, pipe modeland approximate fitting algorithm, etc. For risk assessment, thesmall hole model have been widely used as an engineering calcu-lation method to fit the need of pipeline quantitative risk analysis,and it is discussed in the paper to compute to gas release rate. Thevalue of the release rate at the orifice depends on whether gas flowis sonic or subsonic. This will be decided by relationship between P0
P1
and 2kþ1
� � kk�1 (Dong et al., 2003).
When P0P16
2kþ1
� � kk�1, gas flows sonically in the pipeline. There-
fore, according to the continuity equation of gas flow, gas releaserate can be calculated by:
Q ¼ C0AP1
ffiffiffiffiffiffiffiffiffiffiffiffiffiffiffiffiffiffiffiffiffiffiffiffiffiffiffiffiffiffiffikMRT
2kþ 1
� �kþ1k�1
sð8Þ
When P0P1> 2
kþ1
� � kk�1, gas flows subsonic in the pipeline. There-
fore, according to the continuity equation of gas flow, gas releaserate can be calculated by:
Q ¼ C0AP1
ffiffiffiffiffiffiffiffiffiffiffiffiffiffiffiffiffiffiffiffiffiffiffiffiffiffiffiffiffiffiffiffiffiffiffiffiffiffiffiffiffiffiffiffiffiffiffiffiffiffiffiffiffiffiffiffiffiffiffiffiffiffiffiffiffiffiffiffi2MRT
kk� 1
� �P0
P1
� �2k
� P0
P1
� �kþ1k
" #vuut ð9Þ
where Q is the gas release rate in kg/s, A is the area of the leakageopening in m2, M is the molecular weight of gas in kg/mol (usually0.016 kg/mol), R is the gas constant (8.314 J/mol K), T is the temper-ature of the gas inside the pipeline in K, k is the adiabatic index orthe ratio of the isobaric specific heat capacity to the isovolumetricspecific heat capacity (1.28 for natural gas), P0 is the environmentalpressure in Pa, and P1 is the pressure inside the gas pipeline in Pa.
The gas release rate from a hole of the pipeline varies with time.In order to engineering calculation the effective gas release ratecan be estimated by using decay factor, which is refers to is the ra-tio of the effective gas release rate and peak gas release rate. Thedecay factor k varies from 0.2 to 0.5 and a conservative value of0.3 is adopted here for calculation. The effective gas release rateis given for the risk analysis by (Stephen, 2000; Jo and Ahn, 2005):
Q effect ¼ 2kQPeak ð10Þ
where k is the decay factor. Qeffect is effective rate of gas release from ahole in kg/s. QPeak peak initial rate of gas release from a hole in kg/s.
2.4.2. Leakage massThe concentration of the hazardous material for diffusion section
is gauss distribution in homogeneous turbulence. And the disper-sion for hazardous materials can be describe by Gauss Dispersionmodel, which is simple, established early and widely used in the re-search of atmospheric pollution. With the release for the natural gaspipeline taken into account, the height of the dispersion source canbe estimated as 0. So according to Gauss Dispersion model, wherecoordinates origin is assumed as the leak source, X axis is assumedas the downwind direction of the average wind speed and Y axis isassumed as the crosswind direction, the dispersion concentrationcan be calculated by the following equation:
Cðx; y; zÞ ¼ Qplryrz
exp �12
y2
r2yþ z2
r2z
!" #ð11Þ
where C(x, y, z) is the density in kg/m3; Q is the mass flow rate ofleakage in kg/s; l is the average wind speed in m/s; and rx, ry,and rz are the diffusivities of the tailwind, crosswind, and verticalwind respectively in m and are calculated according to the levelof atmospheric stability.
As the natural gas is flammable, the shape of the LEL (lowerexplosive limit) contour can is calculated, which will act as the sizeof the burning cloud and the explosive mass by computer program-ming. The explosive mass is then transferred to the explosion mod-el to calculate the overpressures (see Fig. 3).
2.4.3. Thermal radiation of jet fireA Jet fire is formed by the immediate ignition of a high-veloc-
ity release of a gas in the case of pipeline rupture and poses athreat to the people near the leakage. For risk analysis, a jetflame is generally composed of a series of point source alongthe flame. The risk of the jet flame can be judged by the measureof the thermal radiation. Therefore, the heat flux at a certain dis-tance forming the leakage source can be calculated as the follow-ing equation:
I ¼ gDHcQs4pR2 ð12Þ
where I is the thermal radiation flux in W/m2 at the specific posi-tion, g is the ratio of radiation heat to the heat released by the fire(0.2 for methane), s is the atmospheric transmissivity (value = 1)(Han and Weng, 2009), DHc is the combustion heat of natural gasin J/kg, and R is the distance between the target and the center ofthe flame zone.
2.4.4. Thermal radiation of fire ballA fireball would result from immediate ignition of a release
resulting from the gas leak accident. A fire ball occurs in caseof delayed ignition of releases of natural gas when the leakageof gas forms a persistent vapor but is not intensive with air.The diameter of the fire ball can be estimated as the followingequation:
Rf ¼ 2:665M0:327 ð13Þ
where Rf is maximum radius of fire ball, M is inflammable goodsmass. The relationship between the time and fuel mass can be de-scribed by the following equation:
tf ¼ 1:089M0:327 ð14Þ
where M is inflammable goods mass. The equation to calculatethermal radiation flux at a specific position is as follows: The heat
L. Ma et al. / Safety Science 59 (2013) 219–226 223
radiation with distance from the fireball can be calculated as thefollowing equation (Stephens, 2000):
I ¼ FrDHcms4pR2tf
ð15Þ
where I is the thermal radiation flux in W/m2 at the specific posi-tion, Fr indicates the percentage of radiation for flammable gas (nor-mally 90%), s is the atmospheric transmissivity (value = 1), DHc isthe combustion heat of natural gas in J/kg, m is the mass of thegas combustible gas cloud in kg, and R is the distance betweenthe target and the center of the flame zone.
2.4.5. Explosion overpressureIn case of a confined flammable vapor cloud intensively mix-
ing with air, upon ignition a vapor cloud explosion may occur.Overpressures caused by the explosion can be calculated withthe vapor cloud explosion model (multi energy method), basedon the explosive mass in the flammable vapor cloud calculatedwith the dispersion model. For convenience of calculation, TNTequivalent weight method is adopted to calculate the explosionoverpressure, which compares the explosion of TNT with thatof gas vapor cloud. TNT absorptivity is defined as gas cloud vol-ume percentage participating in explosion. Generally, there is nomore than 10% of the vapor cloud occurring explosion. And TNTabsorptivity is assumed as 10%. Therefore, 10% of the vapor cloudis addressed to analyze the consequence for risk assessment. Theexplosion energy of flammable vapor cloud can be expressed asthe following equation:
EEX ¼ 1:8aTNT mdDHd ð16Þ
where EEX is total energy of explosion, aTNT is equivalent coefficientof combustible gas vapor (usually 4%), md is the mass of the gas in-volved in the explosion in kg, and DHd is the explosion heat of thegas in J/kg (usually 5.002 � 107 J/kg). The overpressure at certaindistance is given as below (Xu et al., 2008):
DP¼ P0 0:137 RP0
Eex
� �13
!�3
þ3:99 RP0
Eex
� �13
!�2
þ12:6 RP0
Eex
� �13
!�10@
1Að17Þ
where DP is incident overpressure of the explosive wave in Pa, R isthe distance between some point in the explosion field and thesource of the explosion in m, and P0 is the environmental pressurein Pa.
2.4.6. Lethality calculationThe dose–effect of the consequences for people can be ex-
pressed by the probability unit. A probit (probability unit) functionrelates the doses of such harmful load as pressure, heat or toxicityto the proportion of affected people.
Pr ¼ aþ b ln D ð18Þ
where a and b are empirical constants that reflect the hazard specif-ics of a harmful load studied and the susceptibility of recipients tothe load, and D is the dose of the load for a given exposure time.
For the exposure to heat radiation, the vulnerability model (pro-bit function) is given by (TNO, 1989):
Pr ¼ �14:9þ 2:56 lntI
43
104
!ð19Þ
where I is the thermal radiation flux, and t is the time of the targetexposed to the thermal radiation. Generally, the exposure time inurban is assumed to be maximum 30 s.
As for probit function of jet fire radiation, replacing I by Eqs.(12) and (19) is converted to (Han and Weng, 2010):
Pr ¼ 16:61þ 3:4 lnQ
R2
� �ð20Þ
where Q is the mass flow rate of leakage in kg/s, R is the distancebetween the target and the center of the flame zone in m.
For the probit function of fire ball radiation, the expression offire ball probit function can be obtained by substituting Eqs. (14),(15) into (19).
Pr ¼ 12:74þ 2:56 ln m1:224 � R83
� �ð21Þ
where m is the mass of the gas combustible gas cloud, and R is thedistance between the target and the center of the flame zone.
For the exposure to explosion in the case of a vapor cloud explo-sion, the vulnerability model (probit function) is given as follows(Cui et al., 2008):
Pr ¼ �77:1þ 6:9 ln P ð22Þ
where P is the overpressure of explosive shock wave in Pa.The probit value Pr varies between 2 and 9 (HSE, 2010). To con-
vert the probit value to a percentage of mortality, the equation be-low is used:
P ¼ 1ffiffiffiffiffiffiffi2pp
Z Pr�5
�1e�
s22 ds ð23Þ
For the consequence calculations, 100% lethality, 50% lethalityand 1% lethality are assumed within the explosion overpressureand heat radiation dose. The pipeline fatal length is defined asthe pipeline length weighted by the corresponding average valueof lethality in the zones, 1–50%, 50–99%, 99–100% lethal. The ra-dius of fatality 99%, 50% and 1% for pipeline failure consequenceare calculated simply from Eqs. (20)–(22), by using the probabilityunit, 7.33, 5 and 2.67.
Therefore, the radius for jet fire can be estimated as the follow-ing equation:
rjet;99 ¼ 3:891ffiffiffiffiQ
p; rjet;50 ¼ 5:498
ffiffiffiffiQ
p; rjet;1 ¼ 7:767
ffiffiffiffiQ
pð24Þ
where Q is the mass flow rate of leakage in kg/s.The radius for fireball can be estimated as the following equation:
ðrFireball;99Þ43
m1:106 ¼ 2:855;ðrFireball;50Þ
43
m1:106 ¼ 4:518;ðrFireball;1Þ
43
m1:106
¼ 7:149 ð25Þ
where is the mass of the gas combustible gas cloud in kg.The radiusfor explosion can be estimated as the following equation:
rexp osion;99ffiffiffiffiffiffiffiffiffiffiffimTNT
3p ¼ 2:718;
rexp osion;50ffiffiffiffiffiffiffiffiffiffiffimTNT
3p ¼ 2:861;
rexp osion;1ffiffiffiffiffiffiffiffiffiffiffimTNT
3p ¼ 3:017 ð26Þ
where mTNT ¼ mdDHdQTNT
is the TNT equivalent in kg.The length in eachzone can be estimated by using individual risk geometric model.
li;100�99 ¼ 2ffiffiffiffiffiffiffiffiffiffiffiffiffiffiffiffiffiffiffiffiffiffiffiffiffiðri;99Þ2 � h2
q; li;99�50 ¼ 2
ffiffiffiffiffiffiffiffiffiffiffiffiffiffiffiffiffiffiffiffiffiffiffiffiffiðri;50Þ2 � h2
q; li;50�1
¼ 2ffiffiffiffiffiffiffiffiffiffiffiffiffiffiffiffiffiffiffiffiffiffiffiðri;1Þ2 � h2
qð27Þ
where the subscript i denotes the small, medium and great hole onthe pipeline.
The average fatalities of those three zones for all consequencesare given, respectively.R 3:891
0 PdrR 3:8910 dr
¼ 1;R 5:498
3:891 PdrR 5:4983:891 dr
¼ 0:805;R 7:767
5:498 PdrR 7:7675:498 dr
¼ 0:172 ð28Þ
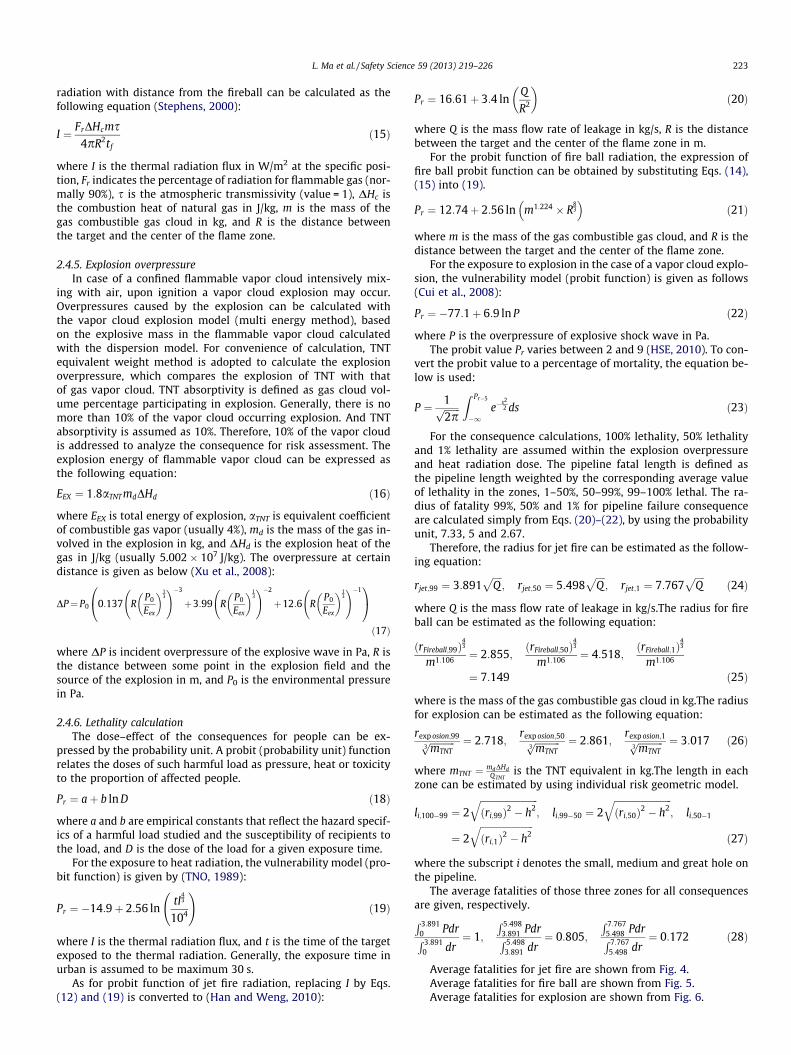
Average fatalities for jet fire are shown from Fig. 4.Average fatalities for fire ball are shown from Fig. 5.Average fatalities for explosion are shown from Fig. 6.
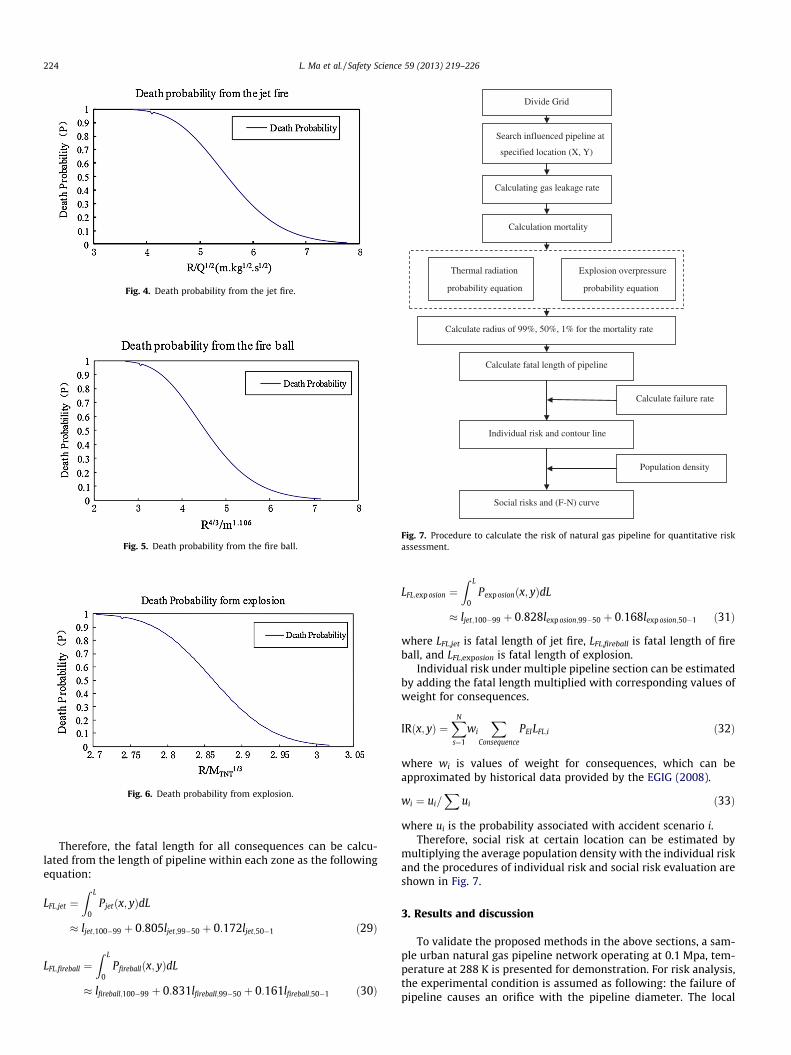
Fig. 4. Death probability from the jet fire.
Fig. 5. Death probability from the fire ball.
Fig. 6. Death probability from explosion.
Divide Grid
Search influenced pipeline at
specified location (X, Y)
Calculating gas leakage rate
Calculation mortality
Thermal radiation
probability equation
Explosion overpressure
probability equation
Calculate radius of 99%, 50%, 1% for the mortality rate
Calculate fatal length of pipeline
Calculate failure rate
Individual risk and contour line
Social risks and (F-N) curve
Population density
Fig. 7. Procedure to calculate the risk of natural gas pipeline for quantitative riskassessment.
224 L. Ma et al. / Safety Science 59 (2013) 219–226
Therefore, the fatal length for all consequences can be calcu-lated from the length of pipeline within each zone as the followingequation:
LFL;jet ¼Z L
0Pjetðx; yÞdL
� ljet;100�99 þ 0:805ljet;99�50 þ 0:172ljet;50�1 ð29Þ
LFL;fireball ¼Z L
0Pfireballðx; yÞdL
� lfireball;100�99 þ 0:831lfireball;99�50 þ 0:161lfireball;50�1 ð30Þ
LFL;exp osion ¼Z L
0Pexp osionðx; yÞdL
� ljet;100�99 þ 0:828lexp osion;99�50 þ 0:168lexp osion;50�1 ð31Þ
where LFL,jet is fatal length of jet fire, LFL,fireball is fatal length of fireball, and LFL,exposion is fatal length of explosion.
Individual risk under multiple pipeline section can be estimatedby adding the fatal length multiplied with corresponding values ofweight for consequences.
IRðx; yÞ ¼XN
s¼1
wi
XConsequence
PEILFL;i ð32Þ
where wi is values of weight for consequences, which can beapproximated by historical data provided by the EGIG (2008).
wi ¼ ui=X
ui ð33Þ
where ui is the probability associated with accident scenario i.Therefore, social risk at certain location can be estimated by
multiplying the average population density with the individual riskand the procedures of individual risk and social risk evaluation areshown in Fig. 7.
3. Results and discussion
To validate the proposed methods in the above sections, a sam-ple urban natural gas pipeline network operating at 0.1 Mpa, tem-perature at 288 K is presented for demonstration. For risk analysis,the experimental condition is assumed as following: the failure ofpipeline causes an orifice with the pipeline diameter. The local
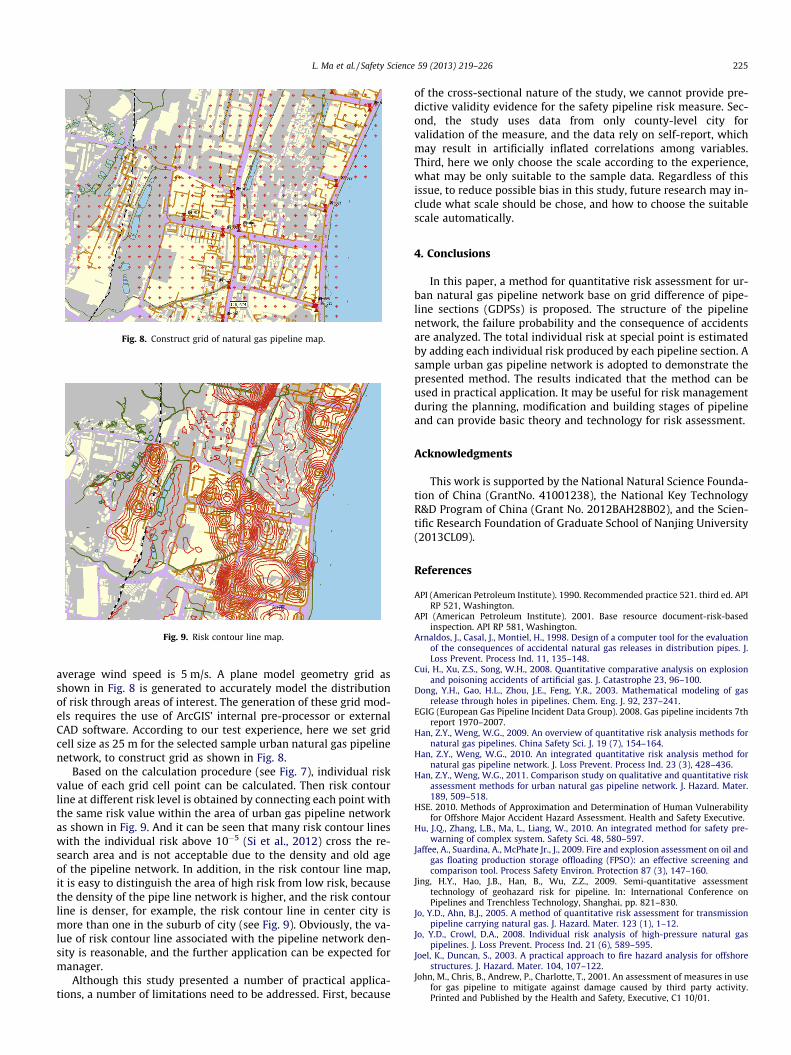
Fig. 8. Construct grid of natural gas pipeline map.
Fig. 9. Risk contour line map.
L. Ma et al. / Safety Science 59 (2013) 219–226 225
average wind speed is 5 m/s. A plane model geometry grid asshown in Fig. 8 is generated to accurately model the distributionof risk through areas of interest. The generation of these grid mod-els requires the use of ArcGIS’ internal pre-processor or externalCAD software. According to our test experience, here we set gridcell size as 25 m for the selected sample urban natural gas pipelinenetwork, to construct grid as shown in Fig. 8.
Based on the calculation procedure (see Fig. 7), individual riskvalue of each grid cell point can be calculated. Then risk contourline at different risk level is obtained by connecting each point withthe same risk value within the area of urban gas pipeline networkas shown in Fig. 9. And it can be seen that many risk contour lineswith the individual risk above 10�5 (Si et al., 2012) cross the re-search area and is not acceptable due to the density and old ageof the pipeline network. In addition, in the risk contour line map,it is easy to distinguish the area of high risk from low risk, becausethe density of the pipe line network is higher, and the risk contourline is denser, for example, the risk contour line in center city ismore than one in the suburb of city (see Fig. 9). Obviously, the va-lue of risk contour line associated with the pipeline network den-sity is reasonable, and the further application can be expected formanager.
Although this study presented a number of practical applica-tions, a number of limitations need to be addressed. First, because
of the cross-sectional nature of the study, we cannot provide pre-dictive validity evidence for the safety pipeline risk measure. Sec-ond, the study uses data from only county-level city forvalidation of the measure, and the data rely on self-report, whichmay result in artificially inflated correlations among variables.Third, here we only choose the scale according to the experience,what may be only suitable to the sample data. Regardless of thisissue, to reduce possible bias in this study, future research may in-clude what scale should be chose, and how to choose the suitablescale automatically.
4. Conclusions
In this paper, a method for quantitative risk assessment for ur-ban natural gas pipeline network base on grid difference of pipe-line sections (GDPSs) is proposed. The structure of the pipelinenetwork, the failure probability and the consequence of accidentsare analyzed. The total individual risk at special point is estimatedby adding each individual risk produced by each pipeline section. Asample urban gas pipeline network is adopted to demonstrate thepresented method. The results indicated that the method can beused in practical application. It may be useful for risk managementduring the planning, modification and building stages of pipelineand can provide basic theory and technology for risk assessment.
Acknowledgments
This work is supported by the National Natural Science Founda-tion of China (GrantNo. 41001238), the National Key TechnologyR&D Program of China (Grant No. 2012BAH28B02), and the Scien-tific Research Foundation of Graduate School of Nanjing University(2013CL09).
References
API (American Petroleum Institute). 1990. Recommended practice 521. third ed. APIRP 521, Washington.
API (American Petroleum Institute). 2001. Base resource document-risk-basedinspection. API RP 581, Washington.
Arnaldos, J., Casal, J., Montiel, H., 1998. Design of a computer tool for the evaluationof the consequences of accidental natural gas releases in distribution pipes. J.Loss Prevent. Process Ind. 11, 135–148.
Cui, H., Xu, Z.S., Song, W.H., 2008. Quantitative comparative analysis on explosionand poisoning accidents of artificial gas. J. Catastrophe 23, 96–100.
Dong, Y.H., Gao, H.L., Zhou, J.E., Feng, Y.R., 2003. Mathematical modeling of gasrelease through holes in pipelines. Chem. Eng. J. 92, 237–241.
EGIG (European Gas Pipeline Incident Data Group). 2008. Gas pipeline incidents 7threport 1970–2007.
Han, Z.Y., Weng, W.G., 2009. An overview of quantitative risk analysis methods fornatural gas pipelines. China Safety Sci. J. 19 (7), 154–164.
Han, Z.Y., Weng, W.G., 2010. An integrated quantitative risk analysis method fornatural gas pipeline network. J. Loss Prevent. Process Ind. 23 (3), 428–436.
Han, Z.Y., Weng, W.G., 2011. Comparison study on qualitative and quantitative riskassessment methods for urban natural gas pipeline network. J. Hazard. Mater.189, 509–518.
HSE. 2010. Methods of Approximation and Determination of Human Vulnerabilityfor Offshore Major Accident Hazard Assessment. Health and Safety Executive.
Hu, J.Q., Zhang, L.B., Ma, L., Liang, W., 2010. An integrated method for safety pre-warning of complex system. Safety Sci. 48, 580–597.
Jaffee, A., Suardina, A., McPhate Jr., J., 2009. Fire and explosion assessment on oil andgas floating production storage offloading (FPSO): an effective screening andcomparison tool. Process Safety Environ. Protection 87 (3), 147–160.
Jing, H.Y., Hao, J.B., Han, B., Wu, Z.Z., 2009. Semi-quantitative assessmenttechnology of geohazard risk for pipeline. In: International Conference onPipelines and Trenchless Technology, Shanghai, pp. 821–830.
Jo, Y.D., Ahn, B.J., 2005. A method of quantitative risk assessment for transmissionpipeline carrying natural gas. J. Hazard. Mater. 123 (1), 1–12.
Jo, Y.D., Crowl, D.A., 2008. Individual risk analysis of high-pressure natural gaspipelines. J. Loss Prevent. Process Ind. 21 (6), 589–595.
Joel, K., Duncan, S., 2003. A practical approach to fire hazard analysis for offshorestructures. J. Hazard. Mater. 104, 107–122.
John, M., Chris, B., Andrew, P., Charlotte, T., 2001. An assessment of measures in usefor gas pipeline to mitigate against damage caused by third party activity.Printed and Published by the Health and Safety, Executive, C1 10/01.

226 L. Ma et al. / Safety Science 59 (2013) 219–226
Jonkman, S.N., Gelder, P.H.A.J.M., Vrijling, J.K., 2003. An overview of quantitative riskmeasures for loss of life and economic damage. J. Hazard. Mater. 99 (1), 1–30.
Liu, M., Liu, F., 2009. Risk assessment of urban gas pipeline. J. Nat. Disasters 18 (4),84–86.
Mark, O., Wennberg, C., Wennberg, T.V., Rabbi, F., Albinsson, B., 1998. Risk analyses forsewer systems based on numerical modelling and GIS. Safety Sci. 30 (1), 99–106.
Mercedes, G.M., Luis, Z., Joaquim, C., 2008. Jet fires and the domino effect. Fire SafetyJ. 43, 583–588.
Metropolo, P.L., Brown, A.E.P., 2004. Natural gas pipeline accident consequenceanalysis. In: 3rd International Conference on Computer Simulation in RiskAnalysis & Hazard Mitigation, Sintra, Portugal.
Montiel, H., Vilchez, J.A., Amaldos, J., 1996. Historical analysis of accidents in thetransportation of natural gas. J. Hazard. Mater. 51, 77–92.
Muhlbauer, W.K., 2004. Pipeline risk management manual. third ed. Gulf PublishingCompany, Burlington, ISBN 0-7506-7579-9.
Si, H., Ji, H., Zeng, X.J., 2012. Quantitative risk assessment model of hazardouschemicals leakage and application. Safety Sci. 50 (7), 1452–1461.
Sklavounos, S., Rigas, F., 2006. Estimation of safety distances in the vicinity of fuelgas. J. Loss Prevent. Process Ind. 19, 24–31.
Stephens, M.J., 2000. A model for sizing high consequence areas associated withnatural gas pipelines. In: Proceedings of IPC 02 ‘4th International PipelinesConference, Calgary.
TNO. 1989. Methods for the Determination of Possible Damage. TNO Green Book,Netherlands.
TNO, 1999. Guideline for Quantitative Risk Assessment Committee for thePrevention of Disasters. TNO Purple Book, Netherlands.
Xiang, X.Q., Dai, L.H., Cao, T., Zhang, H.B., 2011. Improved risk assessment of pipelinebased on fault tree quantitative analysis. In: International Conference onPipelines and Trenchless Technology, Beijing, pp. 1705–1711.
Xing, Z.X., Ren, F., Liu, W., 2009. A quantitative method of risk assessment of naturalgas pipeline. In: International Conference on Pipelines and TrenchlessTechnology, Shanghai, pp. 821–830.
Xu, Y.B., Qian, X.M., Liu, Z.Y., 2008. Quantitative risk analysis on the leakage ofcompressed natural gas pipeline. China Safety Science Journal 18 (1), 146–148.
Ying, K.M., Zhang, Z.G., 2006. Design and Build for Gas Pipeline Map andInformation Management System based on GIS Technology. Shanghai JiaotongUniversity, Shanghai.
Zhang, H.X., Ren, C.Y., Liao, K.X., 2011. Oil & Gas pipeline quantitative riskassessment System development with the intermediate database technology.In: International Conference on Pipelines and Trenchless Technology, Beijing,pp. 569–577.
Related Documents


![Pipeline Construction Sequence 5-31-19 [8.5x11] › wp-content › uploads › 2019 › 06 › Pi… · Crews re-stake the final route of the pipeline and lay out or "string" sections](https://static.cupdf.com/doc/110x72/5f15e17e28d84f7d4645ac01/pipeline-construction-sequence-5-31-19-85x11-a-wp-content-a-uploads-a-2019.jpg)
