A Novel Electronic Data Collection System for Large- Scale Surveys of Neglected Tropical Diseases Jonathan D. King 1,2,3 *, Joy Buolamwini 4 , Elizabeth A. Cromwell 1 , Andrew Panfel 4 , Tesfaye Teferi 5 , Mulat Zerihun 5 , Berhanu Melak 5 , Jessica Watson 4 , Zerihun Tadesse 5 , Danielle Vienneau 2,3 , Jeremiah Ngondi 6 , Ju ¨ rg Utzinger 2,3 , Peter Odermatt 2,3 , Paul M. Emerson 1 1 The Carter Center, Atlanta, Georgia, United States of America, 2 Department of Epidemiology and Public Health, Swiss Tropical and Public Health Institute, Basel, Switzerland, 3 University of Basel, Basel, Switzerland, 4 Department of Computer Science, Georgia Institute of Technology, Atlanta, United States of America, 5 The Carter Center, Addis Ababa, Ethiopia, 6 Department of Public Health and Primary Care, Institute of Public Health, University of Cambridge, Cambridge, United Kingdom Abstract Background: Large cross-sectional household surveys are common for measuring indicators of neglected tropical disease control programs. As an alternative to standard paper-based data collection, we utilized novel paperless technology to collect data electronically from over 12,000 households in Ethiopia. Methodology: We conducted a needs assessment to design an Android-based electronic data collection and management system. We then evaluated the system by reporting results of a pilot trial and from comparisons of two, large-scale surveys; one with traditional paper questionnaires and the other with tablet computers, including accuracy, person-time days, and costs incurred. Principle Findings: The electronic data collection system met core functions in household surveys and overcame constraints identified in the needs assessment. Pilot data recorders took 264 (standard deviation (SD) 152 sec) and 260 sec (SD 122 sec) per person registered to complete household surveys using paper and tablets, respectively (P = 0.77). Data recorders felt a lack of connection with the interviewee during the first days using electronic devices, but preferred to collect data electronically in future surveys. Electronic data collection saved time by giving results immediately, obviating the need for double data entry and cross-correcting. The proportion of identified data entry errors in disease classification did not differ between the two data collection methods. Geographic coordinates collected using the tablets were more accurate than coordinates transcribed on a paper form. Costs of the equipment required for electronic data collection was approximately the same cost incurred for data entry of questionnaires, whereas repeated use of the electronic equipment may increase cost savings. Conclusions/Significance: Conducting a needs assessment and pilot testing allowed the design to specifically match the functionality required for surveys. Electronic data collection using an Android-based technology was suitable for a large- scale health survey, saved time, provided more accurate geo-coordinates, and was preferred by recorders over standard paper-based questionnaires. Citation: King JD, Buolamwini J, Cromwell EA, Panfel A, Teferi T, et al. (2013) A Novel Electronic Data Collection System for Large-Scale Surveys of Neglected Tropical Diseases. PLoS ONE 8(9): e74570. doi:10.1371/journal.pone.0074570 Editor: Abdisalan Mohamed Noor, Kenya Medical Research Institute - Wellcome Trust Research Programme, Kenya Received January 15, 2013; Accepted August 5, 2013; Published September 16, 2013 Copyright: ß 2013 King et al. This is an open-access article distributed under the terms of the Creative Commons Attribution License, which permits unrestricted use, distribution, and reproduction in any medium, provided the original author and source are credited. Funding: Funding was provided through Lions Club International Foundation and The Carter Center Sight First Initiative. Staff from The Carter Center were involved in the study design,data collection, analysis, decision to publish, and preparation of the manuscript. Competing Interests: The authors have declared that no competing interests exist. * E-mail: [email protected] Introduction Large-scale national and sub-national surveys are needed to map the distribution of a health condition, establish baseline prevalence and incidence data for planning, and monitoring the impact of neglected tropical disease control interventions [1–5]. These surveys often involve collection of a combination of geospatial and disease prevalence data from multiple households within multiple communities across many different regions of a country. Sample sizes vary according to program-specific meth- odologies, but typically thousands of individual, household, school, and community records are obtained on paper forms [6–11]. Paper forms must be printed, transported to the field, distributed, filled in, collected, organized, collated, and kept secure prior to data entry. Once data have been collected, forms must then be entered manually into computer databases. To ensure quality of stored data, the forms should be entered twice by separate data entry clerks and then compared to remedy discordant entries against the original hard copy forms. Finally, in good practice, the paper forms must be stored securely for a minimum time period (no less than 2 or 5 years after publication) according to national and international regulations [12,13]. As neglected tropical disease control and elimination programs seek to assess impact of interventions, large sample sizes are required to have the power to determine low levels of disease [14]. PLOS ONE | www.plosone.org 1 September 2013 | Volume 8 | Issue 9 | e74570

Welcome message from author
This document is posted to help you gain knowledge. Please leave a comment to let me know what you think about it! Share it to your friends and learn new things together.
Transcript

A Novel Electronic Data Collection System for Large-Scale Surveys of Neglected Tropical DiseasesJonathan D. King1,2,3*, Joy Buolamwini4, Elizabeth A. Cromwell1, Andrew Panfel4, Tesfaye Teferi5,
Mulat Zerihun5, Berhanu Melak5, Jessica Watson4, Zerihun Tadesse5, Danielle Vienneau2,3,
Jeremiah Ngondi6, Jurg Utzinger2,3, Peter Odermatt2,3, Paul M. Emerson1
1 The Carter Center, Atlanta, Georgia, United States of America, 2 Department of Epidemiology and Public Health, Swiss Tropical and Public Health Institute, Basel,
Switzerland, 3 University of Basel, Basel, Switzerland, 4 Department of Computer Science, Georgia Institute of Technology, Atlanta, United States of America, 5 The Carter
Center, Addis Ababa, Ethiopia, 6 Department of Public Health and Primary Care, Institute of Public Health, University of Cambridge, Cambridge, United Kingdom
Abstract
Background: Large cross-sectional household surveys are common for measuring indicators of neglected tropical diseasecontrol programs. As an alternative to standard paper-based data collection, we utilized novel paperless technology tocollect data electronically from over 12,000 households in Ethiopia.
Methodology: We conducted a needs assessment to design an Android-based electronic data collection and managementsystem. We then evaluated the system by reporting results of a pilot trial and from comparisons of two, large-scale surveys;one with traditional paper questionnaires and the other with tablet computers, including accuracy, person-time days, andcosts incurred.
Principle Findings: The electronic data collection system met core functions in household surveys and overcameconstraints identified in the needs assessment. Pilot data recorders took 264 (standard deviation (SD) 152 sec) and 260 sec(SD 122 sec) per person registered to complete household surveys using paper and tablets, respectively (P = 0.77). Datarecorders felt a lack of connection with the interviewee during the first days using electronic devices, but preferred tocollect data electronically in future surveys. Electronic data collection saved time by giving results immediately, obviatingthe need for double data entry and cross-correcting. The proportion of identified data entry errors in disease classificationdid not differ between the two data collection methods. Geographic coordinates collected using the tablets were moreaccurate than coordinates transcribed on a paper form. Costs of the equipment required for electronic data collection wasapproximately the same cost incurred for data entry of questionnaires, whereas repeated use of the electronic equipmentmay increase cost savings.
Conclusions/Significance: Conducting a needs assessment and pilot testing allowed the design to specifically match thefunctionality required for surveys. Electronic data collection using an Android-based technology was suitable for a large-scale health survey, saved time, provided more accurate geo-coordinates, and was preferred by recorders over standardpaper-based questionnaires.
Citation: King JD, Buolamwini J, Cromwell EA, Panfel A, Teferi T, et al. (2013) A Novel Electronic Data Collection System for Large-Scale Surveys of NeglectedTropical Diseases. PLoS ONE 8(9): e74570. doi:10.1371/journal.pone.0074570
Editor: Abdisalan Mohamed Noor, Kenya Medical Research Institute - Wellcome Trust Research Programme, Kenya
Received January 15, 2013; Accepted August 5, 2013; Published September 16, 2013
Copyright: � 2013 King et al. This is an open-access article distributed under the terms of the Creative Commons Attribution License, which permitsunrestricted use, distribution, and reproduction in any medium, provided the original author and source are credited.
Funding: Funding was provided through Lions Club International Foundation and The Carter Center Sight First Initiative. Staff from The Carter Center wereinvolved in the study design,data collection, analysis, decision to publish, and preparation of the manuscript.
Competing Interests: The authors have declared that no competing interests exist.
* E-mail: [email protected]
Introduction
Large-scale national and sub-national surveys are needed to
map the distribution of a health condition, establish baseline
prevalence and incidence data for planning, and monitoring the
impact of neglected tropical disease control interventions [1–5].
These surveys often involve collection of a combination of
geospatial and disease prevalence data from multiple households
within multiple communities across many different regions of a
country. Sample sizes vary according to program-specific meth-
odologies, but typically thousands of individual, household, school,
and community records are obtained on paper forms [6–11].
Paper forms must be printed, transported to the field, distributed,
filled in, collected, organized, collated, and kept secure prior to
data entry. Once data have been collected, forms must then be
entered manually into computer databases. To ensure quality of
stored data, the forms should be entered twice by separate data
entry clerks and then compared to remedy discordant entries
against the original hard copy forms. Finally, in good practice, the
paper forms must be stored securely for a minimum time period
(no less than 2 or 5 years after publication) according to national
and international regulations [12,13].
As neglected tropical disease control and elimination programs
seek to assess impact of interventions, large sample sizes are
required to have the power to determine low levels of disease [14].
PLOS ONE | www.plosone.org 1 September 2013 | Volume 8 | Issue 9 | e74570

For example, while 10 communities may be acceptable for
estimating the need to initiate control interventions to over a
million population in a ‘‘super district’’ suspected hyperendemic
for trachoma, 10 or more clusters per 50,000 population in a sub-
district are required to document low-level disease before stopping
interventions [15]. Applying sub-district-level surveys in only two
zones (population of 3.8 million) of the Amhara National Regional
state in Ethiopia required collecting data from over 21,000
households in 714 communities [16]. A 4-page paper survey tool
was employed and administered to each household. Needless to
say that paper-based surveys at this magnitude require significant
time, financial and human resources, and physical storage space.
Electronic data collection has been proposed as a solution to the
challenges posed by paper-based surveys and several advantages
have been discussed [17]. Devices such as mobile phones, using
short message service (SMS), have been effectively used to manage
drug-stock in rural health facilities, push health communication
messages to target populations and for disease surveillance [18–
20]. However, the amount and complexity of the data collected
and sent with SMS is limited [21]. Personal data assistants (PDAs)
allow the capture of more complex data and efficient use of PDAs
has been documented in disease surveillance and clinical research,
as well as national surveys [22–25]. With the development of the
Android (Google Inc.) platform, applications such as Open Data
Kit (ODK; www.opendatakit.org) and EpiCollect (www.epicollect.
net) have broadened the options in mobile data collection in public
health to so-called ‘smart’ devices (primarily touch-screen mobile
devices, such as smart phones and tablet computers) [26,27].
Many of these devices offer the additional advantage of having
built-in global positioning systems (GPS) to automatically capture
geographic coordinates from external GPS devices, as opposed to
transcribing coordinates to paper-surveys from external GPS
devices, thus minimizing transcription errors in the field.
The purpose of this study was to evaluate the use of a novel
electronic data collection system for use on tablet computers
operating on the Android platform, and to determine whether this
system was feasible and as effective as standard paper-based forms
in collecting data in large-scale household surveys in a remote area
of Ethiopia with poor infrastructure. Additionally, an effort was
made to estimate person-time days and cost incurred by the two
approaches of data collection.
Materials and Methods
Ethics StatementThe pilot study reported here was integrated into a training
exercise for the trachoma impact assessment surveys approved
under Institutional Review Board protocol 079–2006 of Emory
University and by the Amhara National Regional Health Bureau
ethical review committee. Data obtained from these surveys and
used for the current comparison are the property of the Amhara
National Regional State Health Bureau and The Federal Ministry
of Health of Ethiopia and made accessible to The Carter Center
under a memorandum of understanding, but are not publically
available. Details of the ethical consideration for these surveys and
training have been explained elsewhere [16]. Participants involved
in needs assessment discussions were aware of the intent to publish
from the outset of the discussion, are authors on the present paper,
and have consented to the contents of this paper.
Study PreparationWe consulted freelance volunteers (senior computer science
undergraduates) with experience, expertise, and interest in seeking
to apply their technical skills in a philanthropic project. In a first
step, we conducted a needs assessment prior to proposing an
electronic data collection system aimed at improving efficiency in
large-scale household surveys. This involved group discussions
with the volunteer computer scientists, epidemiologists, and public
health program officers with extensive experience in cross-
sectional household surveys to identify core, functional needs of
both hardware and software when implementing a survey, and
identifying potential constraints of electronic data collection under
typical field conditions in resource-constrained settings. Next, we
piloted a proposed, novel electronic data collection system in a
setting where such a system would be deployed to further refine
the design and provide developers first-hand experience of real
constraints faced in the field. This pilot involved the following
activities: training data recorders experienced in paper-based
surveys to use an Android device and electronic questionnaire;
recording the time required for data collection using the same
household questionnaire by either paper and pencil, or electron-
ically on a tablet computer; and finally, documenting the
perceptions of the data recorders about using the electronic data
collection system. The hardware and software used for electronic
data collection in the study activities are described in Table S1.
Training and Study ImplementationThe pilot survey team consisted of eight members who had
previously been deployed in a large-scale trachoma survey in
Ethiopia. The same survey tool (paper questionnaire, see
Document S1) that was used by the teams in the large-scale
survey was designed electronically and loaded onto tablet
computers.
The data recorders were trained for one day in a classroom on
how to operate the tablet computer and collect data using the
Android application, including capture of geographic coordinates.
This was followed by one day of practice in a nearby community
whereby the eight members were split into two teams of four (two
data recorders and two trachoma examiners) and adhered to the
same protocol as of previous surveys. At each household, one data
recorder administered the questionnaire and collected data using
the tablet, while the other recorded data on the paper
questionnaire. The recorders took turns using the tablet and
alternating lead interview roles at each household for a total of 20
households. The next two days the same process was repeated in
two separate communities. Without the data recorders’ knowl-
edge, the team supervisors recorded the time required for the data
recorder to implement the survey at each house and whether it
was administered by paper or tablet. On each day of applied
training, the participants’ perceptions on using either paper-
questionnaires or electronic questionnaires were documented
through focus group discussions (FGDs). Using a grounded theory
approach, these discussions were semi-structured around a core set
of questions (Document S ) and new themes identified in one
FGD were explored in subsequent FGDs until saturation of
themes was reached [28]. Additionally, the participants were given
the same questions on individual questionnaires and were asked to
share any comments they felt were not adequately discussed or did
not want to openly share in the discussion. Two observers entered
separately the responses and any additional comments provided by
the participants which were compared for consistency. The
discussion notes were reviewed by the coauthors and emerging
common themes extracted as has been done in other programs
[29]. The findings from the FGDs were used to revise the survey
instrument and functionality of the data collection program, and
were re-tested among the study participants.
Electronic Data Collection for Large-Scale Surveys
PLOS ONE | www.plosone.org 2 September 2013 | Volume 8 | Issue 9 | e74570
2
Data ComparisonThe electronic data collection system was further refined and
then implemented in a large-scale trachoma prevalence survey
using the same sampling methodology (i.e., population-based,
multi-stage probability sampling) and questionnaire as implement-
ed 7 months prior in a neighboring zone of the same region of
Ethiopia. The sampling methodology and results of these surveys
are described in detail elsewhere [16]. Of note, the cluster size was
increased in the survey using electronic data collection by
randomly selecting one segment of 40 rather than 30 households
as done in the previous survey in order to meet the target sample
size for estimating prevalence of trachoma among children aged
1–9 years.
The first survey collected data on standard paper-based
questionnaires and the other utilized the modified electronic data
collection system both using survey tool (Document S1). The
survey tool consisted of one interview per household to obtain
household characteristics, head of household demographics,
knowledge of trachoma, knowledge of prevention measures,
reported behavior of face washing and household indicators of
water, sanitation, and hygiene. Nested within the household
interview, data was collected from all individual household
residents including demographics, reported school attendance
among children and participation in antibiotic mass distribution,
and clinical examination for trachoma, hence creating the
hierarchical structure of parent (household) to child (individual
resident). An additional questionnaire was employed for one
randomly selected school-aged child per household by branching
to a separate electronic form linked to the parent and child data
with a unique identification number. This additional questionnaire
was not used in the survey employing paper questionnaires and
thus is not compared in the analysis.
AnalysisWe assessed the raw data sets from the two large-scale trachoma
impact assessment surveys conducted 7 months apart. We
compared the difference in frequencies of survey refusals and
identified data entry errors using a X2 test and t-test corrected for
the survey design where appropriate. We focused on data entry
errors that could have the most impact on disease prevalence
estimates: number of blank fields (i.e., missing data where data
should have been recorded according to protocol); age and sex of
participants; availability for examination; incorrect unique iden-
tifying number; a blank field in the classification of trachoma
clinical signs; or an impossible combination of clinical signs (e.g.,
no signs and clinical signs recorded for the same eye).
Geographic coordinates as recorded by the GPS were collected
for every household, in each community cluster, for both surveys.
Using the recorded household coordinates, we calculated the
median location for each community surveyed to serve as the
cluster centroid. We then computed the distance between the
coordinates for each household to the cluster centroid, and
compared the two surveys with a t-test. The Euclidian distance was
calculated using the Haversine formula [30], and cross-checked in
ArcGIS version10 (ESRI; Redlands, CA, United States of
America) by re-projecting the latitude and longitude (in decimal
degree) into Northing and Eastings (in meters, UTM Zone 37). We
also compared the frequency of obvious outlying household
coordinates, defined as $4 km away from the cluster centroid.
Finally, we mapped all households linked to their cluster centroid
to visually assess the differences in accuracy of each data collection
method. Statistical tests were conducted in STATA version 12.0
(Stata Corp.; College Station, TX, United States of America).
To estimate costs associated with paper-based data collection,
we used 10.9% of a median cost per cluster of US$ 311 (inter-
quartile range [IQR]: US$ 119–393) estimated from a previous
study of trachoma prevalence surveys in 165 districts across eight
countries [31]. This was the overall proportion of total costs due to
data entry of paper questionnaires. An additional 1.5% of total
cluster cost was assumed to cover the cost of the paper and
printing for questionnaires. For a conservative estimate of the cost
of electronic data collection, we simply took the sum of equipment
costs for the tablet computer and accessories, assuming a one-time
use.
Results
Design of Electronic Data Collection SystemThe summary of the findings of the needs assessment and
developed solutions are listed in Table 1. In brief, the proposed
electronic data collection system incorporated a desktop user-
friendly interface, which readily allowed survey planners to design,
modify, and update electronic questionnaires, without the need for
Internet connection, in an intuitive drag-and-drop form builder.
Additionally, the Android application to collect data was able to
capture recurring data from individuals within a data record
collected from the household. Unique identification numbers were
generated based on survey preferences set on the tablet in the
home screen of the application and from minimal input of the data
recorder. Data fields for each individual enumerated in a
household record were arranged alongside the list of enumerated
individuals, which allowed flexibility of alternating between
individuals as a survey team encountered each one for examina-
tion (Figure 1). From this same display, the random selection
functions were accessible, allowing random selection of an eligible
individual enumerated in the household record for additional
assessment (e.g., submission of stool sample for the diagnosis of
intestinal parasites). Eligibility was defined as set by the user in
survey preferences accessed from the home screen. To manage the
survey, the user interface allowed the distribution of created forms,
uploading, and appending collected data through USB connection
without Internet connection.
With regards to hardware (Box 1), during the pilot testing, we
used a tablet computer with a 7-inch resistive touch screen display
with exchangeable batteries. The resistive screen was tough, but
not sensitive to normal touch and the external batteries proved
problematic to exchange on-the-go and keep charged. Hence, for
the full deployment, we used a tablet with 7-inch capacitive touch
display enabling softer touches to the screen and a more responsive
user experience. The deployed tablet had an internal battery
providing 6–8 hours of use, which could then be recharged
through a USB connection to AC/DC or external battery pack
charging units. An internal GPS allowed the direct capture of
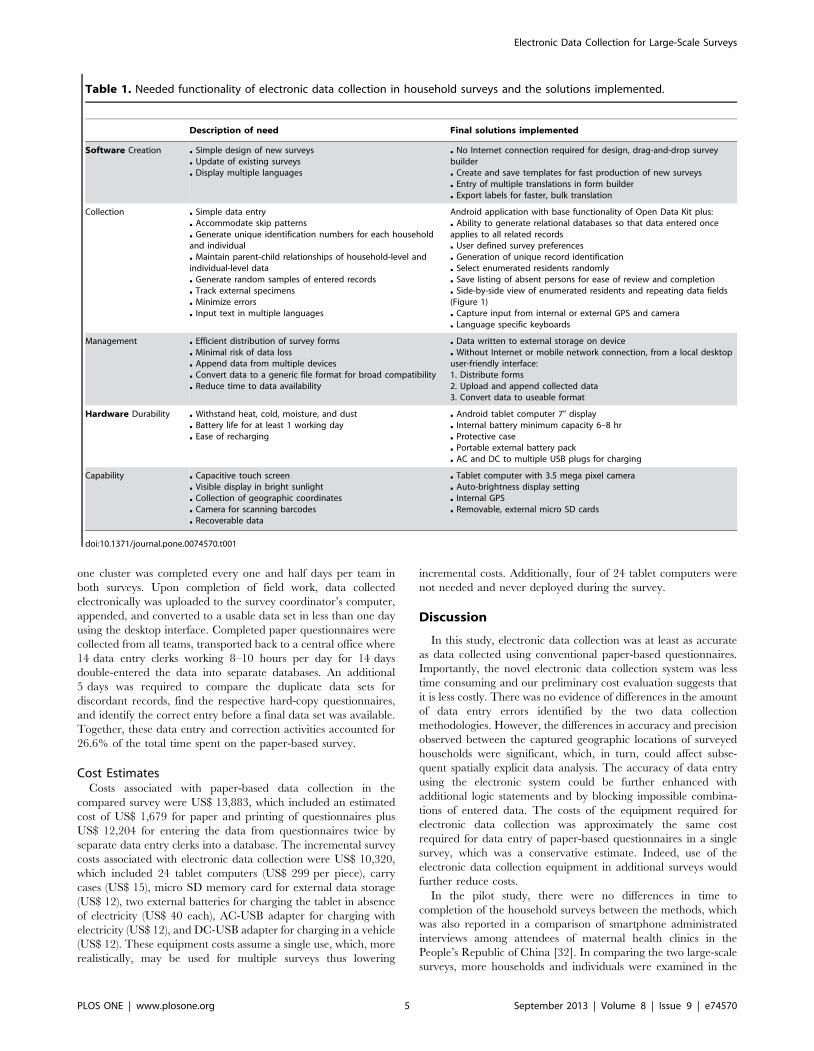
geographic coordinates. To minimize errors in linking results to
household and individual records and maintain privacy of survey
volunteers, a camera with autofocus allowed use of an application
(Barcode Scanner 4.3.1; see http://code.google.com/p/zxing) to
capture of random identification numbers from 0.25060.250 QR
codes on 1.180x0.50labels used to uniquely link external specimens
(in this case, stool specimens; see Figure 2). Data were stored on an
external micro SD card to reduce risk of data loss.
Results from Pilot InvestigationA total of 40 households were surveyed over two days in two
separate communities during pilot testing. There was no difference
in the time required to collect data between the paper-based and
electronic method over the 2-day observation period (Table 2).
Electronic Data Collection for Large-Scale Surveys
PLOS ONE | www.plosone.org 3 September 2013 | Volume 8 | Issue 9 | e74570

The time taken to enter data when the survey was administered
with tablets was 48 sec per person more on the first observed day
(day 2) and 54 sec per person less on the second observed day (day
3) compared to paper surveys. These differences, however, were
not statistically significant (P = 0.20 and P = 0.50, respectively).
After the field work, recorders shared their perceptions
concerning electronic data collection with key findings summa-
rized in Table 3. Recorders felt the paper survey took less time to
complete, but they enjoyed learning the new technology and
preferred to collect data electronically in future surveys. Recorders
expressed a lack of connection to the respondent when first
learning to use the data collection device due to less eye-to-eye
contact while administering the questionnaire. The training
curriculum was modified to address attentiveness and connection
to the respondents in future surveys. The greatest concern about
using electronic data collection was the ability to keep the
electronic device charged under field conditions. We also included
modules in future survey trainings to address power management
and common data collection mistakes or difficulties as reported by
the pilot data recorders (Table 3).
Data loss with paper surveys was perceived less risky than with
electronic data collection since the paper questionnaires were
tangible, enabling the immediate review, identification, and
correction of mistakes. Paper surveys were also perceived to be
easier to manipulate, to add or change data, including an absent
household member who was later encountered by the survey team.
To address these concerns the Android application was modified
to allow identification of absent persons in a household, and
aggregate these people in an absent list that facilitates finding the
correct household record and completing the necessary fields of
the presenting absent person.
Results from Large-Scale SurveysOutcomes from the paper-based and electronic data collection
in separate, large-scale surveys utilizing the same sampling
methodology and questionnaire are presented in Table 4. The
surveys were equivalent in scope and scale. Refusals to participate
were rare, but significantly more common among household
residents when using the electronic device (0.8%, 95% confidence
interval (CI), 0.7–1.0%) compared to paper-based surveys (0.3%,
95% CI 0.2–0.4%) (P,0.01). The number of empty entries for the
fields age, sex, and availability of enumerated household residents
was fewer with electronic data collection than paper-based
collection by 0.2% (P = 0.01). There were fewer errors identified
in the unique identifying numbers of each household in the
electronically collected data set (1.8%) than the paper-based data
set (2.3%) (P = 0.09). There was no difference in the amount of
errors made when recording the trachoma clinical diagnosis
between the two data collection approaches (0.2% vs. 0.2%,
P = 0.26).
When comparing the capture of geographic coordinates, 0.5%
more empty fields were observed in the data collected with tablets
than in the paper-based data (P,0.01). Outliers, defined as
household coordinates $4 km from the median geographic
coordinate in the surveyed cluster or more than 1,000 m elevation
from median elevation in the cluster, were more common in
paper-based collection than electronic collection (1.4% vs. 0.6%,
P,0.01). The mean distance from a household in a cluster to the
cluster centroid was 400 m greater in the survey where
coordinates were transcribed to paper questionnaires compared
to electronic survey application (P,0.01). Variability of this
distance is seen in Figure 3, where each point represents a
household and each solid circle represents the cluster centroid.
Each household is connected by a line to its cluster centroid circle.
The displayed size of the circle is proportional to the maximum
distance between a household and the centroid in that cluster.
The total time taken to prepare, implement, and process the
data was 511 and 790 person-days for electronic and paper-based
data collection, respectively. The proportion of time taken to
complete activities involved with data collection is presented in
Figure 4 for both surveys. The two survey methods required
approximately the same amount of time to develop the question-
naire, obtain translations and edit. An additional person day was
required to convert the paper-questionnaire to an electronic
platform. For either method, the length of training was approx-
imately one full week. The paper-based questionnaires (over 9,000
in total) took 18 person-days of preparation to print, collate, staple,
and distribute prior to deploying teams for actual fieldwork.
Preparing the electronic survey and loading to 20 electronic
collection devices took less than one person-day. Collecting data in
the field in South Wollo (paper-based survey) took 21 survey teams
26 days to complete, while in South Gondar (electronic survey) it
took 13 teams 38 days; the latter, 52 person-days fewer. Including
the time required for survey teams to access the selected clusters,
Figure 1. Example screen shot: looping fields for membersgrouped within a household record. As seen in a novel Androidapplication for collecting data in household surveys.doi:10.1371/journal.pone.0074570.g001
Electronic Data Collection for Large-Scale Surveys
PLOS ONE | www.plosone.org 4 September 2013 | Volume 8 | Issue 9 | e74570
one cluster was completed every one and half days per team in
both surveys. Upon completion of field work, data collected
electronically was uploaded to the survey coordinator’s computer,
appended, and converted to a usable data set in less than one day
using the desktop interface. Completed paper questionnaires were
collected from all teams, transported back to a central office where
14 data entry clerks working 8–10 hours per day for 14 days
double-entered the data into separate databases. An additional
5 days was required to compare the duplicate data sets for
discordant records, find the respective hard-copy questionnaires,
and identify the correct entry before a final data set was available.
Together, these data entry and correction activities accounted for
26.6% of the total time spent on the paper-based survey.
Cost EstimatesCosts associated with paper-based data collection in the
compared survey were US$ 13,883, which included an estimated
cost of US$ 1,679 for paper and printing of questionnaires plus
US$ 12,204 for entering the data from questionnaires twice by
separate data entry clerks into a database. The incremental survey
costs associated with electronic data collection were US$ 10,320,
which included 24 tablet computers (US$ 299 per piece), carry
cases (US$ 15), micro SD memory card for external data storage
(US$ 12), two external batteries for charging the tablet in absence
of electricity (US$ 40 each), AC-USB adapter for charging with
electricity (US$ 12), and DC-USB adapter for charging in a vehicle
(US$ 12). These equipment costs assume a single use, which, more
realistically, may be used for multiple surveys thus lowering
incremental costs. Additionally, four of 24 tablet computers were
not needed and never deployed during the survey.
Discussion
In this study, electronic data collection was at least as accurate
as data collected using conventional paper-based questionnaires.
Importantly, the novel electronic data collection system was less
time consuming and our preliminary cost evaluation suggests that
it is less costly. There was no evidence of differences in the amount
of data entry errors identified by the two data collection
methodologies. However, the differences in accuracy and precision
observed between the captured geographic locations of surveyed
households were significant, which, in turn, could affect subse-
quent spatially explicit data analysis. The accuracy of data entry
using the electronic system could be further enhanced with
additional logic statements and by blocking impossible combina-
tions of entered data. The costs of the equipment required for
electronic data collection was approximately the same cost
required for data entry of paper-based questionnaires in a single
survey, which was a conservative estimate. Indeed, use of the
electronic data collection equipment in additional surveys would
further reduce costs.
In the pilot study, there were no differences in time to
completion of the household surveys between the methods, which
was also reported in a comparison of smartphone administrated
interviews among attendees of maternal health clinics in the
People’s Republic of China [32]. In comparing the two large-scale
surveys, more households and individuals were examined in the
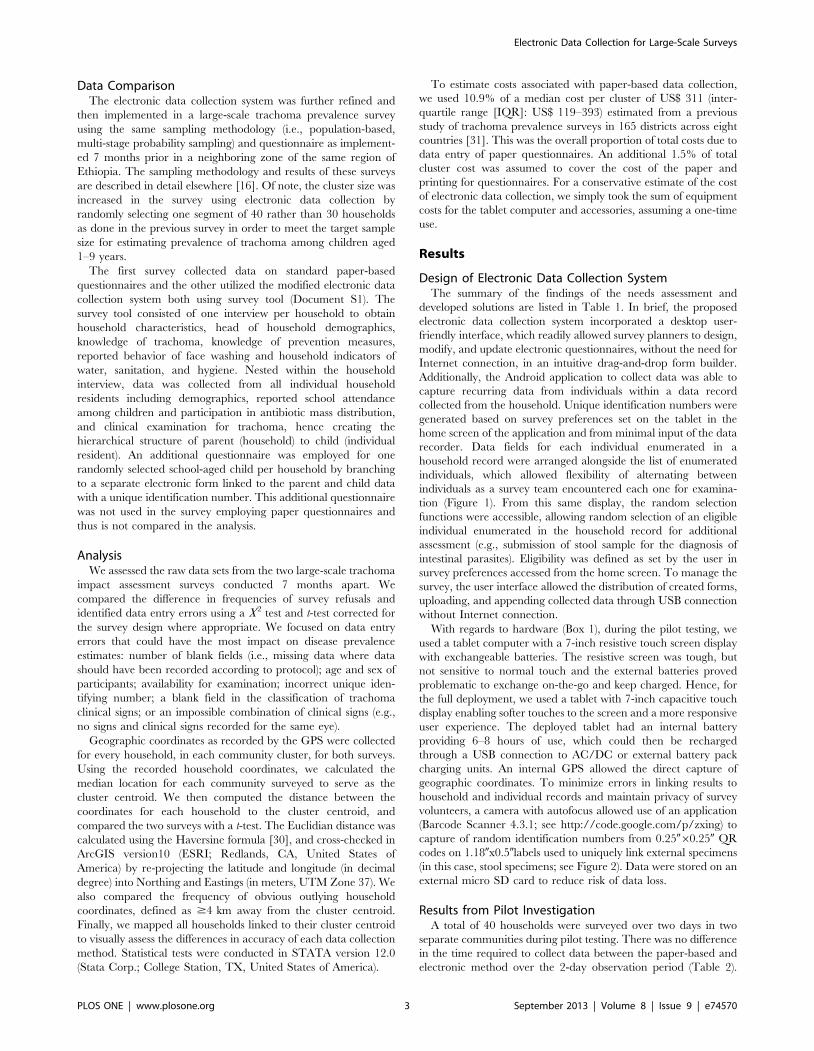
Table 1. Needed functionality of electronic data collection in household surveys and the solutions implemented.
Description of need Final solutions implemented
Software Creation & Simple design of new surveys& Update of existing surveys& Display multiple languages
& No Internet connection required for design, drag-and-drop surveybuilder& Create and save templates for fast production of new surveys& Entry of multiple translations in form builder& Export labels for faster, bulk translation
Collection & Simple data entry& Accommodate skip patterns& Generate unique identification numbers for each householdand individual& Maintain parent-child relationships of household-level andindividual-level data& Generate random samples of entered records& Track external specimens& Minimize errors& Input text in multiple languages
Android application with base functionality of Open Data Kit plus:& Ability to generate relational databases so that data entered onceapplies to all related records& User defined survey preferences& Generation of unique record identification& Select enumerated residents randomly& Save listing of absent persons for ease of review and completion& Side-by-side view of enumerated residents and repeating data fields(Figure 1)& Capture input from internal or external GPS and camera& Language specific keyboards
Management & Efficient distribution of survey forms& Minimal risk of data loss& Append data from multiple devices& Convert data to a generic file format for broad compatibility& Reduce time to data availability
& Data written to external storage on device& Without Internet or mobile network connection, from a local desktopuser-friendly interface:1. Distribute forms2. Upload and append collected data3. Convert data to useable format
Hardware Durability & Withstand heat, cold, moisture, and dust& Battery life for at least 1 working day& Ease of recharging
& Android tablet computer 70 display& Internal battery minimum capacity 6–8 hr& Protective case& Portable external battery pack& AC and DC to multiple USB plugs for charging
Capability & Capacitive touch screen& Visible display in bright sunlight& Collection of geographic coordinates& Camera for scanning barcodes& Recoverable data
& Tablet computer with 3.5 mega pixel camera& Auto-brightness display setting& Internal GPS& Removable, external micro SD cards
doi:10.1371/journal.pone.0074570.t001
Electronic Data Collection for Large-Scale Surveys
PLOS ONE | www.plosone.org 5 September 2013 | Volume 8 | Issue 9 | e74570
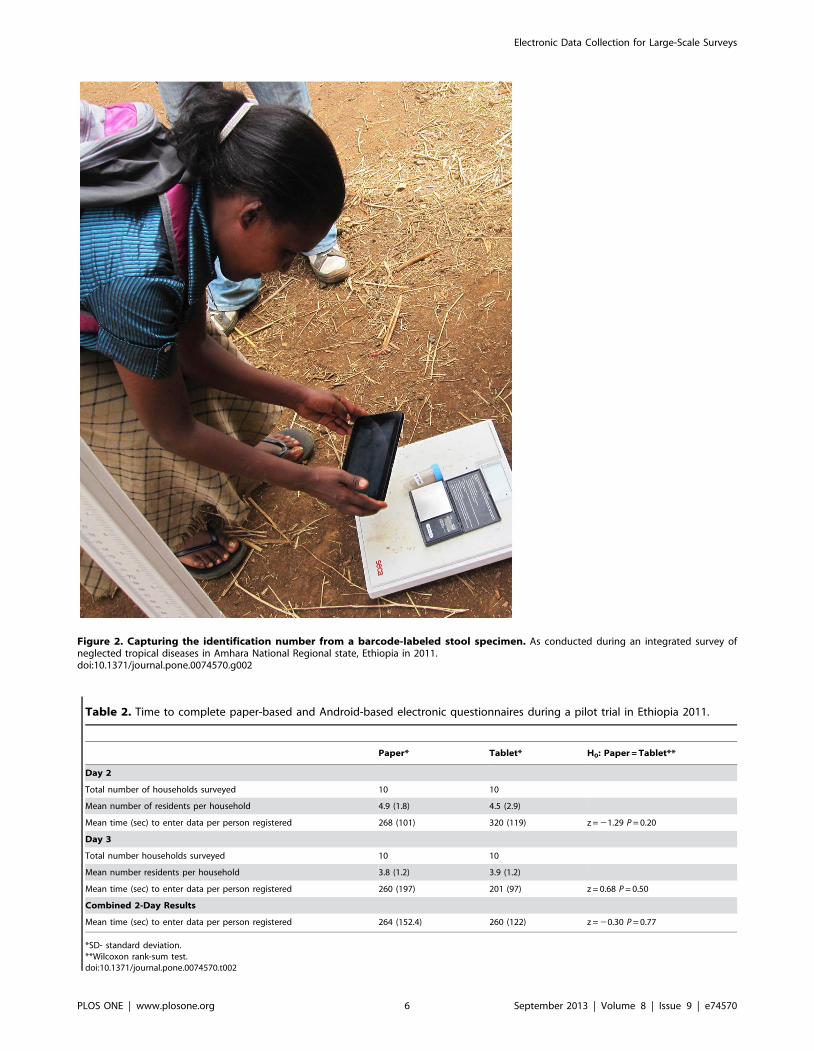
Figure 2. Capturing the identification number from a barcode-labeled stool specimen. As conducted during an integrated survey ofneglected tropical diseases in Amhara National Regional state, Ethiopia in 2011.doi:10.1371/journal.pone.0074570.g002
Table 2. Time to complete paper-based and Android-based electronic questionnaires during a pilot trial in Ethiopia 2011.
Paper* Tablet* H0: Paper = Tablet**
Day 2
Total number of households surveyed 10 10
Mean number of residents per household 4.9 (1.8) 4.5 (2.9)
Mean time (sec) to enter data per person registered 268 (101) 320 (119) z = 21.29 P = 0.20
Day 3
Total number households surveyed 10 10
Mean number residents per household 3.8 (1.2) 3.9 (1.2)
Mean time (sec) to enter data per person registered 260 (197) 201 (97) z = 0.68 P = 0.50
Combined 2-Day Results
Mean time (sec) to enter data per person registered 264 (152.4) 260 (122) z = 20.30 P = 0.77
*SD- standard deviation.**Wilcoxon rank-sum test.doi:10.1371/journal.pone.0074570.t002
Electronic Data Collection for Large-Scale Surveys
PLOS ONE | www.plosone.org 6 September 2013 | Volume 8 | Issue 9 | e74570

electronic survey because of a modification in protocol to select
more households per cluster. Yet, even with the increased work
load, teams collected more data in less time, as expressed in
person-days to collect data using electronic capture. A total of 265
person-days were gained when using the electronic data collection
system. The majority of time saved came from obviating the need
for post-field collection data entry and translated into having the
final data set available for analysis nearly one month sooner. Time
saved is invaluable in program settings, as it allows for immediate
reporting of results to decision makers within the health system
and creates lead time for preparation of needed interventions or
importation of commodities such as donated drugs. Because
Table 3. Data recorders’ perceptions of electronic data collection post 3-day pilot trial in Ethiopia.
Aspect explored Summarized perceptions
Time & Paper questionnaire took less time to complete than the electronic questionnaire
Preparation & No printing, sorting, stapling, and labeling with unique numbers is required with electronic data collection
Transporting & Tablet computers were portable, lighter, and less bulky than paper
Communication with respondents & Less eye-to-eye contact with respondent, but was less of a problem once familiar with the tablet computer
Recording data & Transcribing GPS coordinates onto paper forms was a difficult task and the direct capture of GPS coordinates via the tabletwas preferred& Writing district, village, and community names on a paper form for every household was tedious& No writing necessary for electronic data collection& Recorders must be attentive to skip patterns on a paper form, but the skip patterns were automatic on the electronic form& Entering text, moving the cursor, and editing text fields were most challenging tasks using the tablet computers& Accidental selections on single select (i.e., yes or no) questions when the question did not apply could not be de-selectedonly switched to either option& Mistakes on paper forms can be erased and corrected& More difficult to return to a completed electronic form and add information than a paper form (i.e., an absent personpresents for examination after the survey team has moved to a new household)
Data management & Risk of losing the data was greater for tablets than for paper forms because paper is tangible& Paper forms are difficult to keep clean, dry, and in order
Training & Ability to use tablets may be enhanced by experience in using computers& Data recorders should become familiar with questionnaires first before using tablets& Power management must be covered
General concerns & Keeping device charged where there is no access to electricity
General preferences & Enjoyed learning new technology& Questions on the electronic form and entry of data in Amharic (native language) are preferred& Use electronic data collection rather than paper questionnaires in future trachoma surveys
doi:10.1371/journal.pone.0074570.t003
Table 4. Data comparison of paper-based and electronic data collection from two large-scale, cluster surveys in Ethiopia.
Indicator compared Paper-based data collection Electronic data collection x2 or t-test (p-value)
Sample
Clusters 360 354 NA
Households surveyed 9,263 12,064 NA
Individuals enumerated 38,851 50,858 NA
Individuals examined 33,800 38,652 NA
Refusals
Individual-level 0.3% (N = 38,852) 0.8% (N = 50,884) 27.96 (P,0.01)
Identified data entry errors
% Individuals enumerated with at least 1 blank field incensus record (age, sex, availability)
1.7% (N = 38,851) 1.5% (N = 50,858) 6.61 (p = 0.01)
% households with incorrect unique identifying number 2.3% (N = 9,433) 1.8% (N = 12,112) 6.83 (P = 0.01)
Disease classification 0.2% (N = 33,800) 0.2% (N = 38,652) 1.28 (P = 0.26)
Geographic coordinates
Blank entries 0.6%(N = 9,263) 1.1% (N = 12,064) 12.14 (P,0.01)
Outlying entries` 1.4% 0.6% 38.92 (P,0.01)
Mean household distance in meters to cluster centroid (SE) 687 (81) 288 (7) t = 25.53 (P,0.01)
`Defined as recorded households with coordinates more than 4 km from cluster centroid, or more than 1,000 m elevation from median elevation of the cluster.NA, not applicable.doi:10.1371/journal.pone.0074570.t004
Electronic Data Collection for Large-Scale Surveys
PLOS ONE | www.plosone.org 7 September 2013 | Volume 8 | Issue 9 | e74570

impact surveys where data is collected electronically requires less
time than conventional paper-based methods, the flexibility of
when the survey is conducted within the program schedule is
increased. This is a critical advantage in neglected tropical disease
control programs due to the tight and often complex calendar of
planning annual mass drug administration campaigns and other
community-based interventions [33–36].
Pilot testing was crucial and identified additional flexibility
needed in the electronic data collection system and further insight
into the type of hardware required. It also introduced us to the
perspectives of the experienced data recorders from previous
paper-based data collection, which raised important issues that
were addressed in the final system and provided insight to the
training curriculum used in the large-scale deployment. We
tailored the selected Android device to fit the needs of the survey
and field conditions, which required extended battery life, internal
GPS, touch screen, no stylus or external keyboard, and automatic
adjustment of display brightness.
We applied a novel electronic data collection system in this
study that did not require short-cuts or redesigning the survey
forms to absolute minimum requirements due to limited function-
ality, as observed in use of PDA and SMS-based systems [37,38].
The software was designed to fit the need, rather than the survey
designed to fit the capabilities of the electronic system. The
Android application for collecting data was designed to mimic the
protocol of the survey team and offer sufficient flexibility to match
the dynamics of interactions with household residents, which may
have been contributing factors to explain why experienced, paper-
based data recorders wished to use electronic data collection in the
future. For example, household information needed entry only
once for each individual in a household. Each household resident
could be registered regardless of availability and data collection
could occur for each resident in any order simply by selecting the
person in the side-by-side view and entering the individual’s
trachoma signs (or other information). This system also provides
the flexibility to have multiple translations and input data in
multiple languages, like Amharic, which was a cited preference of
the pilot data collectors.
The desktop user interface allowed a multi-level survey
prepared first on paper, to be transferred to an electronic form
and applied in an application on any Android device within a day,
without requiring mobile phone or Internet connections. Forms
can be uploaded to survey devices for deployment within minutes
while simultaneously downloading collected data held on the
device. Data are protected securely on the device using a log-in
code or pattern, stored on an external disc housed within the
collection device minimizing risk of data loss. We were not able to
compare the frequency and type of lost data between the paper-
based and electronic surveys, and therefore cannot address the
perceptions from data recorders of the greater risk of data loss with
electronic collection. We had three out of 24 devices temporarily
power-off and fail to reboot, though data was recovered by
removing and downloading data stored on the external SD card.
The devices were set aside, but most importantly, all three
rebooted after a 48-hour re-charge and remained functional even
though not needed for the rest of the survey. Data were
downloaded to the password-protected laptops of supervisors at
least every second day, which further minimized risk of data loss
Figure 3. Distance between the recorded location of a surveyed household and the cluster centroid. Households surveyed in trachomaimpact assessments in South Wollo (paper-based questionnaire 2010) and South Gondar (electronic data collection 2011), Ethiopia.doi:10.1371/journal.pone.0074570.g003
Electronic Data Collection for Large-Scale Surveys
PLOS ONE | www.plosone.org 8 September 2013 | Volume 8 | Issue 9 | e74570

should the device be stolen or lost, or the SD card not be
retrievable at the end of the survey. In the future, encrypting the
data on the SD card would enhance data security, whereas storing
data both on internal and external memory would further
minimize risk of data loss. At completion of the survey, records
were downloaded to local computers, staying in country without
having to be transmitted over mobile phone networks or the
Internet to a foreign server, maintaining sovereignty and physical
possession of the data set by the host country.
There are alternatives to data storage, such as uploading to a
cloud server via telecommunications networks or the Internet, or
downloading from an internal disk on the device to a local
computer. Each alternative has strengths and limitations. Methods
for data collection must be designed to function within the limits of
the local infrastructure and adherence to local guidelines on data
management and security is mandatory. At the time our survey
was conducted, the Internet connectivity infrastructure in Ethiopia
has been given a score of 1 (thin) on a scale of 0 (non-existent) to 4
(immense) [39]. The software we used had the capability of web-
based form design, deployment and data transfer, but our
experience with connectivity during the pilot activities motivated
us to pursue an off-line solution.
There were limitations in our study and these are offered for
discussion. First, the comparisons made between data entry errors
identified were from two different surveys implemented in different
zones at different times of the year. Second, inherent to electronic
data collection, there is little opportunity to confirm collected data
by field teams simply by reviewing the data set as we did to identify
errors. Yet, this same limitation applies to paper-based question-
naires; we assume that the recorded data were the actual response.
Third, time to administer the survey as recorded in the pilot might
be affected by factors other than the recorder’s ability to use the
Figure 4. Proportion of total time (person days) required to complete survey activities by collection method. Time as implementedusing paper-based questionnaire and Android-based electronic form in two large-scale (360 clusters each) trachoma impact assessments in Ethiopia2010 and 2011.doi:10.1371/journal.pone.0074570.g004
Electronic Data Collection for Large-Scale Surveys
PLOS ONE | www.plosone.org 9 September 2013 | Volume 8 | Issue 9 | e74570
data collection tool, i.e., survey is interrupted by a neighbor or the
respondent goes out to collect his/her children. We assumed that
these external factors were, on average, the same for the two
methods during the 2 days of observation, and hence do not affect
the overall results. Fourth, the differences in mean distance to the
cluster centroid should be interpreted with caution. Either
households in South Wollo were simply more dispersed within
community settlements than in South Gondar or the household
distances from the cluster centroid were inflated due to systematic
inaccuracies in transcribing household coordinates to paper in
several clusters. The plots on Figure 3 and greater proportion of
outlying households recorded in South Wollo suggest the latter.
Finally, in estimating cost, we did not include the value of the time
volunteered by the computer scientists (approximately 4 months of
part-time work) to design and refine the system. Our reasoning
was that free electronic data collection systems have now become
available, although with less specific functionality, but could be
deployed for survey use with only the added equipment costs and
possibly training of survey coordinators on designing electronic
forms and managing collected data. We also did not include the
long-term value of the electronic equipment, which has continued
to serve four other large-scale surveys in multiple countries at the
time this manuscript was prepared for submission. Additional costs
not considered were potential import duties levied on data
collection devices and accessories as the regulations and amounts
are setting specific, but should not be ignored when budgeting.
In summary, use of a novel system for electronic survey design,
collection on an Android platform, and local management was
feasible in a large-scale trachoma impact assessment survey.
Electronic data collection saved time, was less costly, was at least as
accurate as standard paper-based questionnaires, and was
preferred by experienced paper-based data recorders. These
advantages were similar as those advertised in recent applications
of Android-based data collection applied to animal health and
surveillance of zoonotic diseases [40,41]. Such systems could be
readily applied to other large-scale neglected tropical disease
control surveys as well as national initiatives, such as the malaria
indicator surveys (MIS), the demographic and health surveys
(DHS), the UNICEF multiple indicator cluster survey (MICS), or
the regular household surveys done by the health demographic
surveillance systems (HDSS) of the INDEPTH network [42–44].
Supporting Information
Table S1 Description of hardware and software utilizedfor electronic data collection during the study activities.
(DOCX)
Document S1 Paper-based questionnaire as implement-ed in a large-scale trachoma survey in Ethiopia.
(PDF)
Document S2 Core questions for focus group discus-sions with data recorders from the pilot study team.
(DOC)
Acknowledgments
We gratefully acknowledge the residents of selected communities who gave
freely of their time to participate in the pilot and actual surveys. We thank
the pilot survey team that provided useful feedback for refining the
electronic data collection system. We appreciate the time, effort, and
attitude of all field teams, supervisors, drivers, trainers, and coordinators of
the surveys. We appreciate Adam Wolkon from US Centers for Disease
Control and Prevention for sharing his experience regarding currently
available technology and accessories. We thank Darin Evans, Greg
Noland, Lisa Dickman, Aryc Mosher, Amy Patterson, and Aisha Stewart
from The Carter Center Health Programs for applying the system in other
surveys and providing ideas on further development.
Author Contributions
Conceived and designed the experiments: JDK JB EAC AP JW ZT JN JU
PO PME. Performed the experiments: JDK JB EAC AP TT MZ BM.
Analyzed the data: JDK DV JU PO PME. Contributed reagents/
materials/analysis tools: JB AP JW DV JU. Wrote the paper: JDK JB EAC
AP TT MZ BM JW ZT DV JN JU PO PME.
References
1. Emerson PM, Ngondi J, Biru E, Graves PM, Ejigsemahu Y, et al. (2008)
Integrating an NTD with one of ‘‘The big three’’: combined malaria and
trachoma survey in Amhara Region of Ethiopia. PLoS Negl Trop Dis 2: e197.
2. Brooker S, Kabatereine NB, Gyapong JO, Stothard JR, Utzinger J (2009) Rapid
mapping of schistosomiasis and other neglected tropical diseases in the context of
integrated control programmes in Africa. Parasitology 136: 1707–1718.
3. Baker MC, Mathieu E, Fleming FM, Deming M, King JD, et al. (2010)
Mapping, monitoring, and surveillance of neglected tropical diseases: towards a
policy framework. Lancet 375: 231–238.
4. Dorkenoo AM, Bronzan RN, Ayena KD, Anthony G, Agbo YM, et al. (2012)
Nationwide integrated mapping of three neglected tropical diseases in Togo:
countrywide implementation of a novel approach. Trop Med Int Health 17:
896–903.
5. King JD, Eigege A, Umaru J, Jip N, Miri E, et al. (2012) Evidence for stopping
mass drug administration for lymphatic filariasis in some, but not all local
government areas of Plateau and Nasarawa states, Nigeria. Am J Trop Med Hyg
87: 272–280.
6. Sturrock HJW, Picon D, Sabasio A, Oguttu D, Robinson E, et al. (2009)
Integrated mapping of neglected tropical diseases: epidemiological findings and
control implications for northern Bahr-el-Ghazal state, Southern Sudan. PLoS
Negl Trop Dis 3: e537.
7. Bamani S, King JD, Dembele M, Coulibaly F, Sankara D, et al. (2010) Where
do we go from here? Prevalence of trachoma three years after stopping mass
distribution of antibiotics in the regions of Kayes and Koulikoro, Mali. PLoS
Negl Trop Dis 4: e734.
8. King JD, Jip N, Jugu YS, Othman A, Rodgers AF, et al. (2010) Mapping
trachoma in Nasarawa and Plateau states, central Nigeria. Br J Ophthalmol 94:
14–19.
9. Kabatereine NB, Standley CJ, Sousa-Figueiredo JC, Fleming FM, Stothard JR,
et al. (2011) Integrated prevalence mapping of schistosomiasis, soil-transmitted
helminthiasis and malaria in lakeside and island communities in Lake Victoria,
Uganda. Parasit Vectors 4: 232.
10. Forrer A, Sayasone S, Vounatsou P, Vonghachack Y, Bouakhasith D, et al.
(2012) Spatial distribution of, and risk factors for, Opisthorchis viverrini infection in
southern Lao PDR. PLoS Negl Trop Dis 6: e1481.
11. Gosoniu L, Msengwa A, Lengeler C, Vounatsou P (2012) Spatially explicit
burden estimates of malaria in Tanzania: Bayesian geostatistical modeling of the
malaria indicator survey data. PLoS One 7: e23966.
12. WHO (2002) Handbook for good clinical research practice: guidance for
implementation. Geneva: World Health Organization.
13. IEA (2007) Good epidemiological practice: IEA guidelines for proper conduct of
epidemiological research. International Epidemiology Association online article.
Available: http://ieaweb.org/2010/04/good-epidemiological-practice-gep/.
Accessed: 2013 April 3.
14. WHO (2011) Monitoring and epidemiological assessment of mass drug
administration in the global programme to eliminate lymphatic filariasis: a
manual for national elimination programmes. Geneva: World Health Organi-
zation.
15. WHO (2011) Report from the 3rd global scientific meeting on trachoma.
Baltimore, Maryland, 19–20 July 2010. Geneva: World Health Organization.
16. King JD, Teferi T, Cromwell EA, Zerihun M, Ngondi JM, et al. (2013)
Prevalence of trachoma at sub-district level in Ethiopia: determining when to
stop mass azithromycin distribution. PLoS Negl Trop Dis (at review).
17. Lane SJ, Heddle NM, Arnold E, Walker I (2006) A review of randomized
controlled trials comparing the effectiveness of hand-held computers with paper
methods for data collection. BMC Med Inform Decis Mak 6: 23.
18. Barrington J, Wereko-Brobby O, Ward P, Mwafongo W, Kungulwe S (2010)
SMS for life: a pilot project to improve anti-malarial drug supply management in
rural Tanzania using standard technology. Malar J 9: 298.
19. Jian WS, Hsu MH, Sukati H, Syed-Abdul S, Scholl J, et al. (2012) LabPush: a
pilot study of providing remote clinics with laboratory results via short message
service (SMS) in Swaziland, Africa. PLoS One 7: e44462.
Electronic Data Collection for Large-Scale Surveys
PLOS ONE | www.plosone.org 10 September 2013 | Volume 8 | Issue 9 | e74570
20. Deglise C, Suggs LS, Odermatt P (2012) SMS for disease control in developing
countries: a systematic review of mobile health applications. J Telemed Telecare
18: 273–281.
21. Hillebrand F (2010) Short message service (SMS): the creation of personal global
text messaging. Chichester: John Wiley & Sons.
22. Dale O, Hagen KB (2007) Despite technical problems personal digital assistants
outperform pen and paper when collecting patient diary data. J Clin Epidemiol
60: 8–17.
23. Blaya JA, Gomez W, Rodriguez P, Fraser H (2008) Cost and implementation
analysis of a personal digital assistant system for laboratory data collection.
Int J Tuberc Lung Dis 12: 921–927.
24. Yu P, Courten M, Pan E, Glea G, Pryor J (2009) The development and
evaluation of a PDA-based method for public health surveillance data collection
in developing countries. Int J Med Inform 78: 532–542.
25. Jima D, Getachew A, Bilak H, Steketee RW, Emerson PM, et al. (2010) Malaria
indicator survey 2007, Ethiopia: coverage and use of major malaria prevention
and control interventions. Malar J 9: 58.
26. Open Data Kit. Available: http://opendatakit.org/. Accessed: 2013 July 20.
27. Aanensen DM, Huntley DM, Feil EJ, al-Own F, Spratt BG (2009) EpiCollect:
linking smartphones to web applications for epidemiology, ecology and
community data collection. PLoS One 4: e6968.
28. Glaser BG, Strauss AL (1967) Discovery of grounded theory: strategies for
qualitative research. Chicago: Aldine.
29. King JD, Zielinski-Gutierrez E, Pa’au M, Lammie P (2011) Improving
community participation to eliminate lymphatic filariasis in American Samoa.
Acta Trop 120: S48–54.
30. Sinnott CS (1984) Virtues of the Haversine. Sky Telescope 68: 159.
31. Chen C, Cromwell EA, King JD, Mosher A, Harding-Esch EM, et al. (2011)
Incremental cost of conducting population-based prevalence surveys for a
neglected tropical disease: the example of trachoma in 8 national programs.
PLoS Negl Trop Dis 5: e979.
32. Zhang S, Wu Q, Van Velthoven MH, Chen L, Car J, et al. (2012) Smartphone
versus pen-and-paper data collection of infant feeding practices in rural China.
J Med Internet Res 14, e119.
33. Rotondo LA, Seligson R (2011) The zithromax donation for trachoma
elimination – how to apply for and manage the drug. Community EyeHealth J 24: 22–23.
34. WHO (2012) Guide for preparing a master plan for national neglected tropical
diseases programmes in the African region. Brazzaville: Regional Office forAfrica, World Health Organization.
35. Hanson C, Weaver A, Zoerhoff KL, Kabore A, Linehan M, et al. (2012)Integrated implementation of programs targeting neglected tropical diseases
through preventive chemotherapy: identifying best practices to roll out programs
at a national scale. Am J Trop Med Hyg 86: 508–513.36. Knopp S, Mohammed KA, Ali SM, Khamis IS, Ame SM, et al. (2012) Study
implementation of urogenital schistosomiasis elimination in Zanzibar (Ungujaand Pemba islands) using an integrated multidisciplinary approach. BMC Public
Health 12: 930.37. Carroll AE, Saluja s, Tarczy-Hornoch P (2002) The implementation of a
personal digital assistant (PDA) based patient record and charting system: lessons
learned. Proc AMIA Symp 2002: 111–115.38. Kuntsche E, Robert B (2009) Short message service (SMS) technology in alcohol
research – a feasibility study. Alcohol Alcohol 44: 423–428.39. ITU (2002) Internet from the horn of Africa: Ethiopia case study. Geneva:
International Telecommunication Union. Available: https://www.itu.int/osg/
spu/casestudies/ETH_CS1.pdf. Accessed 2013 July 16.40. Madder M, Walker JG, Van Rooyen J, Knobel D, Vandamme E, et al. (2012) e-
Surveillance in animal health: use and evaluation of mobile tools. Parasitology139: 1831–1842.
41. Karimuribo ED, Sayalel K, Beda E, Short N, Wambura P, et al. (2012) Towardsone health disease surveillance: The Southern African Centre for Infectious
Disease Surveillance approach. Onderstepoort J Vet Res 79: E1–7.
42. USAID (2012) Demographic and health surveys toolkit. Washington DC:United States Agency for International Development.
43. UNICEF (2006) Multiple indictor cluster survey manual 2005. New York: TheUnited Nations Children’s Fund.
44. The International Network for the Demographic Evaluation of Populations and
Their Health (INDEPTH). Available: http://www.indepth-network.org/. Ac-cessed 2013 July 20.
Electronic Data Collection for Large-Scale Surveys
PLOS ONE | www.plosone.org 11 September 2013 | Volume 8 | Issue 9 | e74570
Related Documents


