A novel cognitive-neurophysiological state biomarker in premanifest Huntington’s disease validated on longitudinal data Christian Beste 1 , Ann-Kathrin Stock 1 , Vanessa Ness 1 , Rainer Hoffmann 2 , Carsten Lukas 3 & Carsten Saft 2 1 Institute for Cognitive Neuroscience, Biopsychology, Ruhr-University Bochum, Germany, 2 Department of Neurology, Huntington Centre NRW, St. Josef Hospital, Ruhr-University Bochum, Germany, 3 Department of Radiology, St. Josef Hospital, Ruhr-University Bochum, Germany. In several neurodegenerative diseases, like Huntington’s disease (HD), treatments are still lacking. To determine whether a treatment is effective, sensitive disease progression biomarkers are especially needed for the premanifest phase, since this allows the evaluation of neuroprotective treatments preventing, or delaying disease manifestation. On the basis of a longitudinal study we present a biomarker that was derived by integrating behavioural and neurophysiological data reflecting cognitive processes of action control. The measure identified is sensitive enough to track disease progression over a period of only 6 month. Changes tracked were predictive for a number of clinically relevant parameters and the sensitivity of the measure was higher than that of currently used parameters to track prodromal disease progression. The study provides a biomarker, which could change practice of progression diagnostics in a major basal ganglia disease and which may help to evaluate potential neuroprotective treatments in future clinical trials. H untington’s disease (HD) is an autosomal dominant neurodegenerative disorder caused by an extension of a CAG repeat at exon 1 of chromosome 4. The CAG repeat expansion is an established marker (trait biomarker) for the presence of HD. Currently, there is no cure for HD 1 . To determine whether a potential treatment is effective, we need definitive, quantitative, objective biomarkers for tracking disease progression 2 . Reliable disease state biomarkers that are sensitive enough to monitor the state and subtle progression of HD are lacking for the premanifest stage. During this stage, motor symptoms have not yet developed. To search for such a marker, several large-scale longitudinal studies, such as TRACK-HD 3 , PREDICT 4 , and REGISTRY 5 , have exam- ined disease progression in the premanifest and/or the manifest stages of HD. These studies used neuropsy- chological tests, motor tests, biochemical parameters, and MRI neuroimaging techniques, the results of which were discussed as potential endpoints for clinical trials 6 . However, a single biomarker may not reflect the myriad aspects of the disease 7 . It has therefore been suggested that use and integration of multiple biomarkers might be more effective for tracking HD progression 2 . Cross-sectional studies that integrate neuropsychological tests with electrophysiological (electroencephalo- graphic, EEG) data show that these measures differ between controls and HD patients according to disease stage 8,9 and reliably correlate with the estimated age of onset (eAO) and CAG repeat expansion 10 . Currently, no multi- center studies are using this approach, although use of a combination of electrophysiological measures seems promising as a way to evaluate progression 2 . By definition, a cognitive disease progression biomarker should vary according to disease progression in affected subjects but should not vary across longitudinal time points in control subjects 2,11 . Here we present data from a longitudinal single centre study in premanifest HD gene mutation carriers (pre-HD subjects) that investigated the use of cognitive-neurophysiological measures as a biomarker of disease progression. To investigate whether these measures were sensitive to subtle changes that occurred over short time periods, the study employed two non-equidistant longitudinal endpoints after baseline measurement, 15 and 21 months (15-month and 6-month intervals). Hence, three time points were subjected to the analysis (i.e., baseline, 15-month, 21-month). SUBJECT AREAS: MOVEMENT DISORDERS COGNITIVE CONTROL PREDICTIVE MARKERS BIOMARKER RESEARCH Received 12 March 2013 Accepted 19 April 2013 Published 8 May 2013 Correspondence and requests for materials should be addressed to C.B. (christian.beste@ rub.de) SCIENTIFIC REPORTS | 3 : 1797 | DOI: 10.1038/srep01797 1

Welcome message from author
This document is posted to help you gain knowledge. Please leave a comment to let me know what you think about it! Share it to your friends and learn new things together.
Transcript
A novel cognitive-neurophysiologicalstate biomarker in premanifestHuntington’s disease validated onlongitudinal dataChristian Beste1, Ann-Kathrin Stock1, Vanessa Ness1, Rainer Hoffmann2, Carsten Lukas3 & Carsten Saft2
1Institute for Cognitive Neuroscience, Biopsychology, Ruhr-University Bochum, Germany, 2Department of Neurology, HuntingtonCentre NRW, St. Josef Hospital, Ruhr-University Bochum, Germany, 3Department of Radiology, St. Josef Hospital, Ruhr-UniversityBochum, Germany.
In several neurodegenerative diseases, like Huntington’s disease (HD), treatments are still lacking. Todetermine whether a treatment is effective, sensitive disease progression biomarkers are especially neededfor the premanifest phase, since this allows the evaluation of neuroprotective treatments preventing, ordelaying disease manifestation. On the basis of a longitudinal study we present a biomarker that was derivedby integrating behavioural and neurophysiological data reflecting cognitive processes of action control. Themeasure identified is sensitive enough to track disease progression over a period of only 6 month. Changestracked were predictive for a number of clinically relevant parameters and the sensitivity of the measure washigher than that of currently used parameters to track prodromal disease progression. The study provides abiomarker, which could change practice of progression diagnostics in a major basal ganglia disease andwhich may help to evaluate potential neuroprotective treatments in future clinical trials.
Huntington’s disease (HD) is an autosomal dominant neurodegenerative disorder caused by an extension ofa CAG repeat at exon 1 of chromosome 4. The CAG repeat expansion is an established marker (traitbiomarker) for the presence of HD. Currently, there is no cure for HD1. To determine whether a potential
treatment is effective, we need definitive, quantitative, objective biomarkers for tracking disease progression2.Reliable disease state biomarkers that are sensitive enough to monitor the state and subtle progression of HD arelacking for the premanifest stage. During this stage, motor symptoms have not yet developed. To search for such amarker, several large-scale longitudinal studies, such as TRACK-HD3, PREDICT4, and REGISTRY5, have exam-ined disease progression in the premanifest and/or the manifest stages of HD. These studies used neuropsy-chological tests, motor tests, biochemical parameters, and MRI neuroimaging techniques, the results of whichwere discussed as potential endpoints for clinical trials6. However, a single biomarker may not reflect the myriadaspects of the disease7. It has therefore been suggested that use and integration of multiple biomarkers might bemore effective for tracking HD progression2.
Cross-sectional studies that integrate neuropsychological tests with electrophysiological (electroencephalo-graphic, EEG) data show that these measures differ between controls and HD patients according to disease stage8,9
and reliably correlate with the estimated age of onset (eAO) and CAG repeat expansion10. Currently, no multi-center studies are using this approach, although use of a combination of electrophysiological measures seemspromising as a way to evaluate progression2. By definition, a cognitive disease progression biomarker should varyaccording to disease progression in affected subjects but should not vary across longitudinal time points in controlsubjects2,11.
Here we present data from a longitudinal single centre study in premanifest HD gene mutation carriers(pre-HD subjects) that investigated the use of cognitive-neurophysiological measures as a biomarker of diseaseprogression. To investigate whether these measures were sensitive to subtle changes that occurred over short timeperiods, the study employed two non-equidistant longitudinal endpoints after baseline measurement, 15 and 21months (15-month and 6-month intervals). Hence, three time points were subjected to the analysis (i.e., baseline,15-month, 21-month).
SUBJECT AREAS:MOVEMENT DISORDERS
COGNITIVE CONTROL
PREDICTIVE MARKERS
BIOMARKER RESEARCH
Received12 March 2013
Accepted19 April 2013
Published8 May 2013
Correspondence andrequests for materials
should be addressed toC.B. (christian.beste@
rub.de)
SCIENTIFIC REPORTS | 3 : 1797 | DOI: 10.1038/srep01797 1
We examined processes related to action selection and control in atask that was a combination of a ‘‘Stroop Task’’ and a ‘‘Set-shiftingTask.’’ Both tasks depend on fronto-striatal networks12,13, which playan important role in action selection14. These processes depend uponthe integrity of striatal medium spiny neurons (MSNs)15, the gen-etically determined degeneration of which is a hallmark of HD16,17.The task used here requires that conflict monitoring18 and the flexibleadaptation of actions13 be performed in parallel. Notably, this taskcan detect early deficits in premanifest HD compared to controls atthe behavioural and neurophysiological level using event-relatedpotentials (ERPs)19. Since changes in the fronto-striatal networksreflect disease progression6, it is possible that the parallel executionof conflict monitoring and flexible behavioural adaptation may besensitive enough to detect even subtle changes in premanifest diseaseprogression and may be used as a cognitive disease progression bio-marker in premanifest HD.
ResultsBehavioural data. Reaction times (RTs) and error rates weremeasured in each of the experimental condition (i.e., compatibleswitch, compatible non-switch, incompatible switch, incompatiblenon-switch). The RT data (means and SDs) in each of theseconditions are given in Table 1 for the pre-HD group. For RT data,the highest interaction containing the factors ‘‘time point’’ and‘‘group’’ was the interaction for ‘‘compatibility 3 switch/non-switch 3 time point 3 group’’ (F(2,110) 5 49.83; P 5 0.0001; g2
5 0.475). Subsequent analyses showed that there was an interactionfor the pre-HD group for ‘‘compatibility 3 switch/non-switch 3
time point’’ (F(2,52) 5 83.33; P 5 3 3 1026; g2 5 0.675), showingthat task performance varied across the longitudinal time points inpre-HD subjects but not in controls. Further ANOVA analysis ofdata from the pre-HD subjects was performed separately for thecompatible and incompatible trials and revealed that only forthe incompatible trials, there was an interaction for ‘‘switch/non-switch 3 time point’’ (F(2,52) 5 77.47; P 5 1 3 1026; g2 5
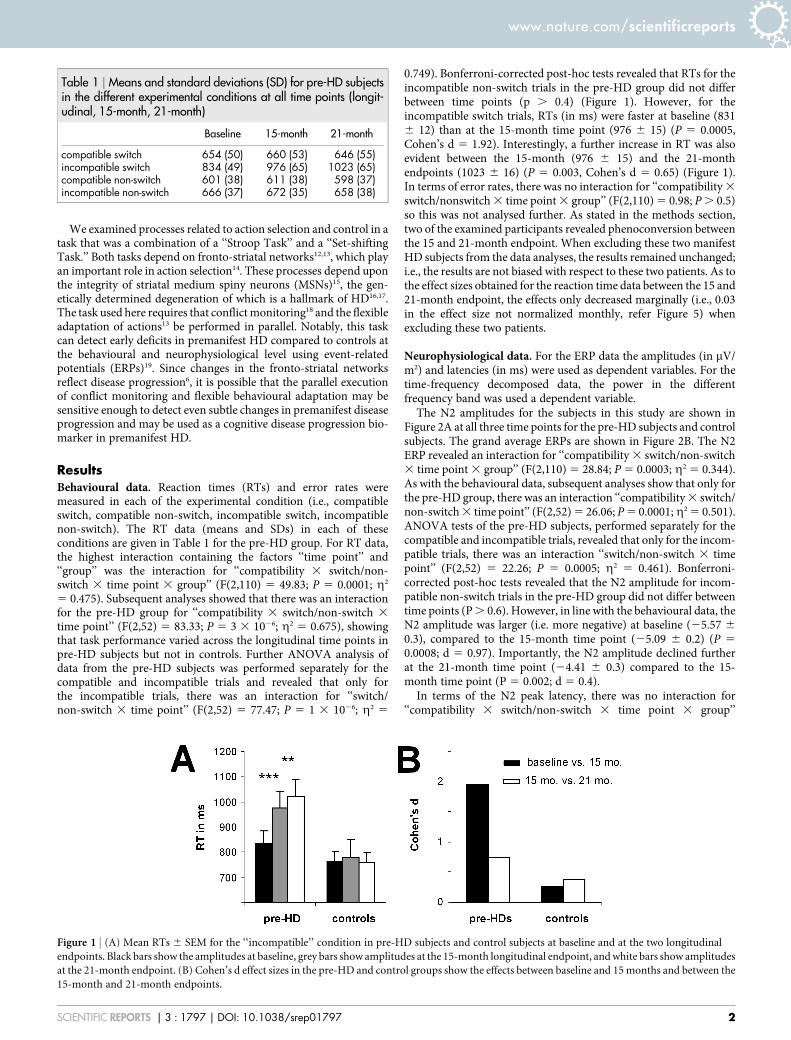
0.749). Bonferroni-corrected post-hoc tests revealed that RTs for theincompatible non-switch trials in the pre-HD group did not differbetween time points (p . 0.4) (Figure 1). However, for theincompatible switch trials, RTs (in ms) were faster at baseline (8316 12) than at the 15-month time point (976 6 15) (P 5 0.0005,Cohen’s d 5 1.92). Interestingly, a further increase in RT was alsoevident between the 15-month (976 6 15) and the 21-monthendpoints (1023 6 16) (P 5 0.003, Cohen’s d 5 0.65) (Figure 1).In terms of error rates, there was no interaction for ‘‘compatibility 3
switch/nonswitch 3 time point 3 group’’ (F(2,110) 5 0.98; P . 0.5)so this was not analysed further. As stated in the methods section,two of the examined participants revealed phenoconversion betweenthe 15 and 21-month endpoint. When excluding these two manifestHD subjects from the data analyses, the results remained unchanged;i.e., the results are not biased with respect to these two patients. As tothe effect sizes obtained for the reaction time data between the 15 and21-month endpoint, the effects only decreased marginally (i.e., 0.03in the effect size not normalized monthly, refer Figure 5) whenexcluding these two patients.
Neurophysiological data. For the ERP data the amplitudes (in mV/m2) and latencies (in ms) were used as dependent variables. For thetime-frequency decomposed data, the power in the differentfrequency band was used a dependent variable.
The N2 amplitudes for the subjects in this study are shown inFigure 2A at all three time points for the pre-HD subjects and controlsubjects. The grand average ERPs are shown in Figure 2B. The N2ERP revealed an interaction for ‘‘compatibility 3 switch/non-switch3 time point 3 group’’ (F(2,110) 5 28.84; P 5 0.0003; g2 5 0.344).As with the behavioural data, subsequent analyses show that only forthe pre-HD group, there was an interaction ‘‘compatibility 3 switch/non-switch 3 time point’’ (F(2,52) 5 26.06; P 5 0.0001;g2 5 0.501).ANOVA tests of the pre-HD subjects, performed separately for thecompatible and incompatible trials, revealed that only for the incom-patible trials, there was an interaction ‘‘switch/non-switch 3 timepoint’’ (F(2,52) 5 22.26; P 5 0.0005; g2 5 0.461). Bonferroni-corrected post-hoc tests revealed that the N2 amplitude for incom-patible non-switch trials in the pre-HD group did not differ betweentime points (P . 0.6). However, in line with the behavioural data, theN2 amplitude was larger (i.e. more negative) at baseline (25.57 6
0.3), compared to the 15-month time point (25.09 6 0.2) (P 5
0.0008; d 5 0.97). Importantly, the N2 amplitude declined furtherat the 21-month time point (24.41 6 0.3) compared to the 15-month time point (P 5 0.002; d 5 0.4).
In terms of the N2 peak latency, there was no interaction for‘‘compatibility 3 switch/non-switch 3 time point 3 group’’
Table 1 | Means and standard deviations (SD) for pre-HD subjectsin the different experimental conditions at all time points (longit-udinal, 15-month, 21-month)
Baseline 15-month 21-month
compatible switch 654 (50) 660 (53) 646 (55)incompatible switch 834 (49) 976 (65) 1023 (65)compatible non-switch 601 (38) 611 (38) 598 (37)incompatible non-switch 666 (37) 672 (35) 658 (38)
Figure 1 | (A) Mean RTs 6 SEM for the ‘‘incompatible’’ condition in pre-HD subjects and control subjects at baseline and at the two longitudinal
endpoints. Black bars show the amplitudes at baseline, grey bars show amplitudes at the 15-month longitudinal endpoint, and white bars show amplitudes
at the 21-month endpoint. (B) Cohen’s d effect sizes in the pre-HD and control groups show the effects between baseline and 15 months and between the
15-month and 21-month endpoints.
www.nature.com/scientificreports
SCIENTIFIC REPORTS | 3 : 1797 | DOI: 10.1038/srep01797 2
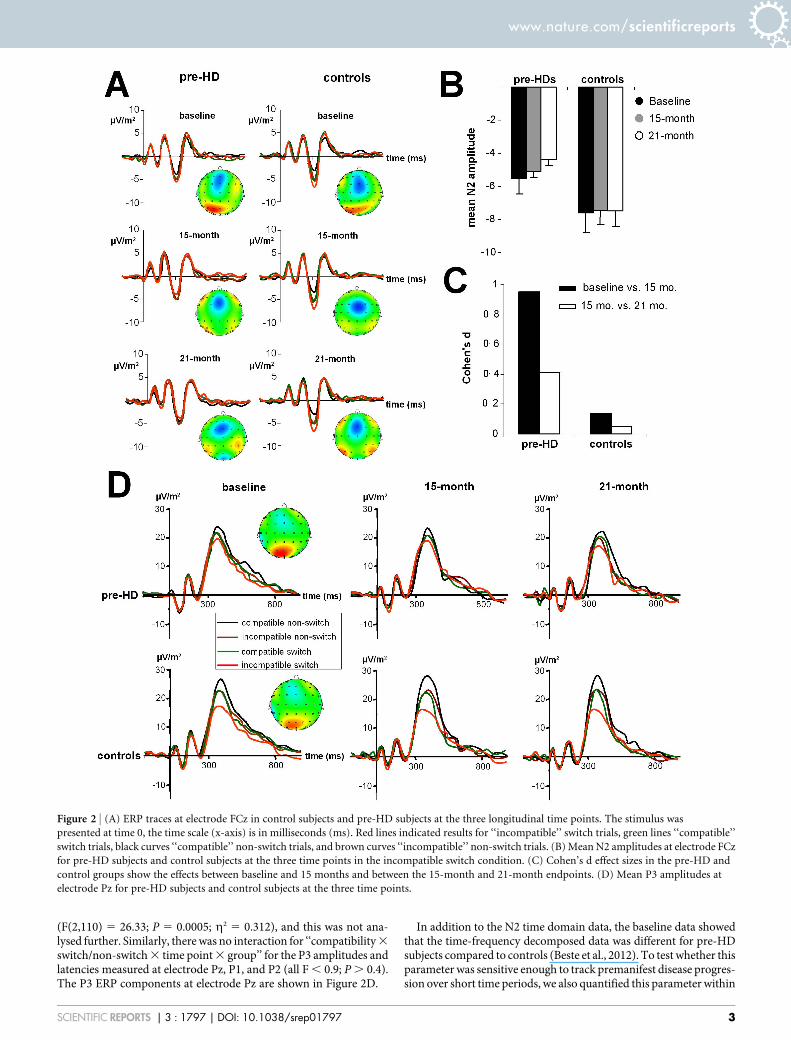
(F(2,110) 5 26.33; P 5 0.0005; g2 5 0.312), and this was not ana-lysed further. Similarly, there was no interaction for ‘‘compatibility 3
switch/non-switch 3 time point 3 group’’ for the P3 amplitudes andlatencies measured at electrode Pz, P1, and P2 (all F , 0.9; P . 0.4).The P3 ERP components at electrode Pz are shown in Figure 2D.
In addition to the N2 time domain data, the baseline data showedthat the time-frequency decomposed data was different for pre-HDsubjects compared to controls (Beste et al., 2012). To test whether thisparameter was sensitive enough to track premanifest disease progres-sion over short time periods, we also quantified this parameter within
Figure 2 | (A) ERP traces at electrode FCz in control subjects and pre-HD subjects at the three longitudinal time points. The stimulus was
presented at time 0, the time scale (x-axis) is in milliseconds (ms). Red lines indicated results for ‘‘incompatible’’ switch trials, green lines ‘‘compatible’’
switch trials, black curves ‘‘compatible’’ non-switch trials, and brown curves ‘‘incompatible’’ non-switch trials. (B) Mean N2 amplitudes at electrode FCz
for pre-HD subjects and control subjects at the three time points in the incompatible switch condition. (C) Cohen’s d effect sizes in the pre-HD and
control groups show the effects between baseline and 15 months and between the 15-month and 21-month endpoints. (D) Mean P3 amplitudes at
electrode Pz for pre-HD subjects and control subjects at the three time points.
www.nature.com/scientificreports
SCIENTIFIC REPORTS | 3 : 1797 | DOI: 10.1038/srep01797 3
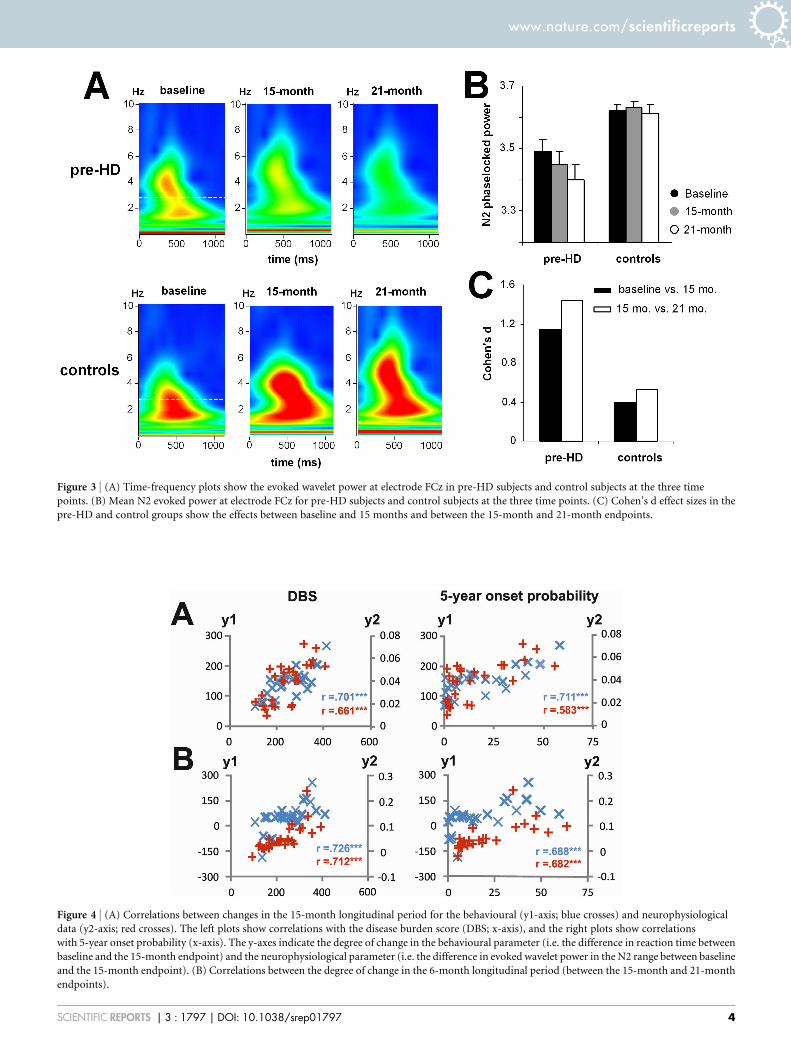
Figure 3 | (A) Time-frequency plots show the evoked wavelet power at electrode FCz in pre-HD subjects and control subjects at the three time
points. (B) Mean N2 evoked power at electrode FCz for pre-HD subjects and control subjects at the three time points. (C) Cohen’s d effect sizes in the
pre-HD and control groups show the effects between baseline and 15 months and between the 15-month and 21-month endpoints.
Figure 4 | (A) Correlations between changes in the 15-month longitudinal period for the behavioural (y1-axis; blue crosses) and neurophysiological
data (y2-axis; red crosses). The left plots show correlations with the disease burden score (DBS; x-axis), and the right plots show correlations
with 5-year onset probability (x-axis). The y-axes indicate the degree of change in the behavioural parameter (i.e. the difference in reaction time between
baseline and the 15-month endpoint) and the neurophysiological parameter (i.e. the difference in evoked wavelet power in the N2 range between baseline
and the 15-month endpoint). (B) Correlations between the degree of change in the 6-month longitudinal period (between the 15-month and 21-month
endpoints).
www.nature.com/scientificreports
SCIENTIFIC REPORTS | 3 : 1797 | DOI: 10.1038/srep01797 4
the N2 time range (Figure 3A). The time-frequency plots of N2 forthe pre-HD group and controls at all time points are shown inFigure 3B.
For the N2 evoked wavelet power the interaction of ‘‘compatibility3 switch/non-switch 3 time point 3 group’’ was significant(F(2,110) 5 37.24; P 5 0.00009; g2 5 0.404). SubsequentANOVAs revealed that the interaction of ‘‘compatibility 3 switch/non-switch 3 time point’’ (F(2,52) 5 98.84; P 5 1 3 1026; g2 5
0.641) was only significant for the pre-HD group. Further ANOVAtests of data from pre-HD subjects, which were performed separatelyfor the compatible and incompatible trials, revealed that there was aninteraction of ‘‘switch/non-switch 3 time point’’ (F(2,52) 5 21.06; P5 0.0004; g2 5 0.447) only for the incompatible trials. Bonferroni-corrected post-hoc tests revealed that the evoked wavelet power washighest at baseline (3.48 6 0.01) and had declined at the 15-monthendpoint (3.44 6 0.03) (P 5 0.0003; d 5 1.17). The evoked waveletpower was even lower at the 21-month endpoint (3.40 6 0.02) thanat the 15-month endpoint (P 5 0.0001; d 5 1.42) (Figure 3B). To
underline the validity of the results obtained we performed non-parametric test using Monte-Carlo simulations (5000 permutations,95% confidence interval). The Friedman test revealed differencesbetween the longitudinal endpoints (x2 5 48.22; df 5 2; lower boundp 5 .00001; upper bound p 5 .001). A Wilcoxon test (5000 permuta-tions, 95% confidence interval) revealed differences between baselineand the 15-month endpoint (Z 5 24.51; lower bound p 5 .00001;upper bound p 5 .001), as well as between the 15-month and 21-monthendpoint (Z 5 24.22; lower bound p 5 .00001; upper bound p 5 .001).
As the P3 data did not reveal an interaction for the factors ‘‘com-patibility 3 switch/non-switch 3 time point 3 group’’ in the timedomain data, the time-frequency decomposed data was not analysed.When excluding these two manifest HD subjects from the data ana-lyses, the results remained unchanged; i.e., the results are not biasedwith respect to these two patients. As to the effect sizes obtained forthe reaction time data between the 15 and 21-month endpoint, theeffects only decreased marginally (i.e., 0.08 in the effect size notnormalized monthly) when excluding these two patients.
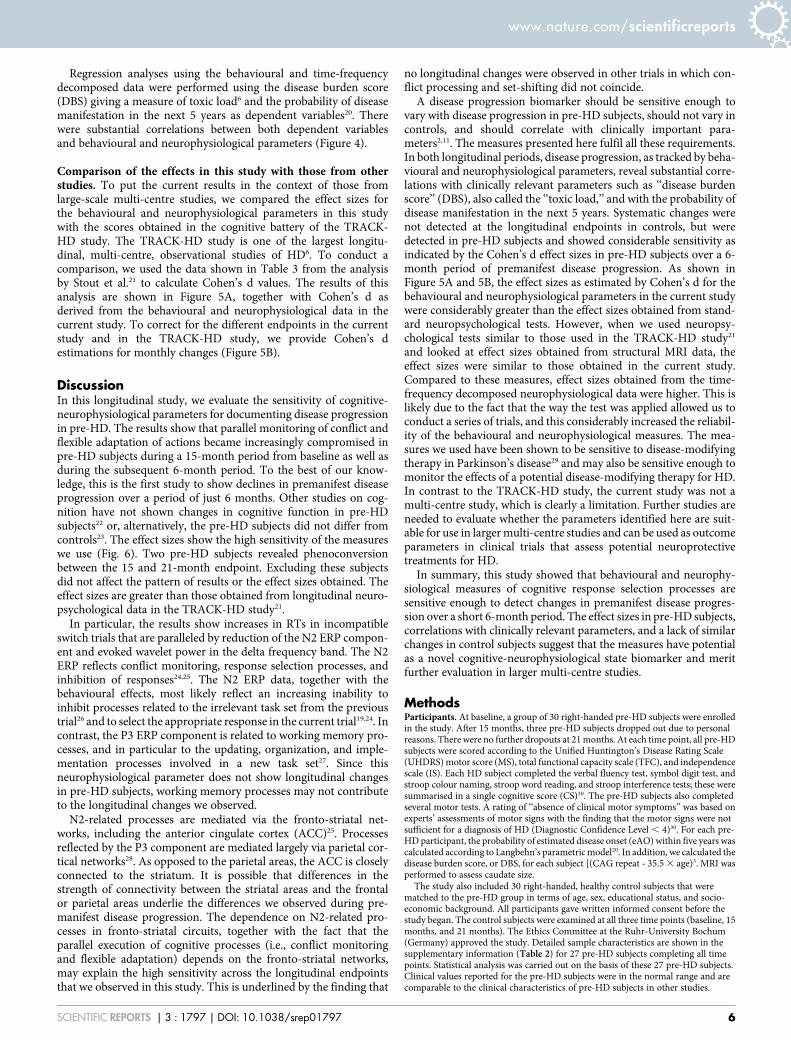
Figure 6 | Schematical overview of the experimental paradigm to assess parallel execution of response selection and conflict monitoring.
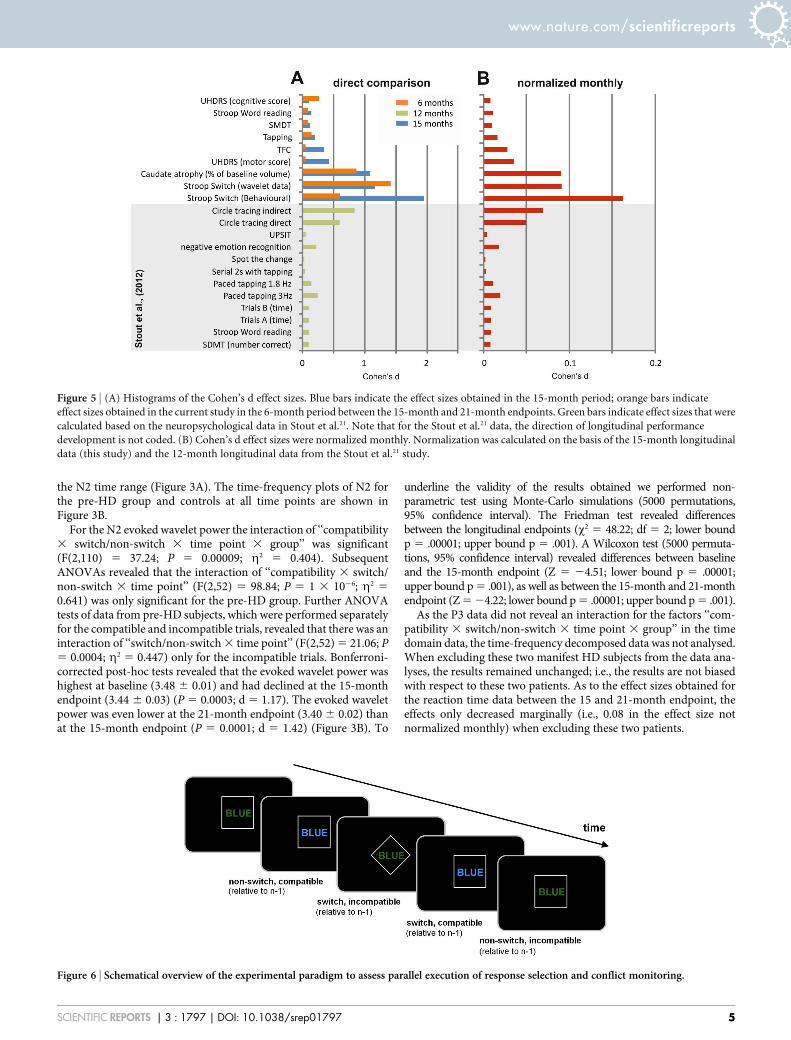
Figure 5 | (A) Histograms of the Cohen’s d effect sizes. Blue bars indicate the effect sizes obtained in the 15-month period; orange bars indicate
effect sizes obtained in the current study in the 6-month period between the 15-month and 21-month endpoints. Green bars indicate effect sizes that were
calculated based on the neuropsychological data in Stout et al.21. Note that for the Stout et al.21 data, the direction of longitudinal performance
development is not coded. (B) Cohen’s d effect sizes were normalized monthly. Normalization was calculated on the basis of the 15-month longitudinal
data (this study) and the 12-month longitudinal data from the Stout et al.21 study.
www.nature.com/scientificreports
SCIENTIFIC REPORTS | 3 : 1797 | DOI: 10.1038/srep01797 5
Regression analyses using the behavioural and time-frequencydecomposed data were performed using the disease burden score(DBS) giving a measure of toxic load6 and the probability of diseasemanifestation in the next 5 years as dependent variables20. Therewere substantial correlations between both dependent variablesand behavioural and neurophysiological parameters (Figure 4).
Comparison of the effects in this study with those from otherstudies. To put the current results in the context of those fromlarge-scale multi-centre studies, we compared the effect sizes forthe behavioural and neurophysiological parameters in this studywith the scores obtained in the cognitive battery of the TRACK-HD study. The TRACK-HD study is one of the largest longitu-dinal, multi-centre, observational studies of HD6. To conduct acomparison, we used the data shown in Table 3 from the analysisby Stout et al.21 to calculate Cohen’s d values. The results of thisanalysis are shown in Figure 5A, together with Cohen’s d asderived from the behavioural and neurophysiological data in thecurrent study. To correct for the different endpoints in the currentstudy and in the TRACK-HD study, we provide Cohen’s destimations for monthly changes (Figure 5B).
DiscussionIn this longitudinal study, we evaluate the sensitivity of cognitive-neurophysiological parameters for documenting disease progressionin pre-HD. The results show that parallel monitoring of conflict andflexible adaptation of actions became increasingly compromised inpre-HD subjects during a 15-month period from baseline as well asduring the subsequent 6-month period. To the best of our know-ledge, this is the first study to show declines in premanifest diseaseprogression over a period of just 6 months. Other studies on cog-nition have not shown changes in cognitive function in pre-HDsubjects22 or, alternatively, the pre-HD subjects did not differ fromcontrols23. The effect sizes show the high sensitivity of the measureswe use (Fig. 6). Two pre-HD subjects revealed phenoconversionbetween the 15 and 21-month endpoint. Excluding these subjectsdid not affect the pattern of results or the effect sizes obtained. Theeffect sizes are greater than those obtained from longitudinal neuro-psychological data in the TRACK-HD study21.
In particular, the results show increases in RTs in incompatibleswitch trials that are paralleled by reduction of the N2 ERP compon-ent and evoked wavelet power in the delta frequency band. The N2ERP reflects conflict monitoring, response selection processes, andinhibition of responses24,25. The N2 ERP data, together with thebehavioural effects, most likely reflect an increasing inability toinhibit processes related to the irrelevant task set from the previoustrial26 and to select the appropriate response in the current trial19,24. Incontrast, the P3 ERP component is related to working memory pro-cesses, and in particular to the updating, organization, and imple-mentation processes involved in a new task set27. Since thisneurophysiological parameter does not show longitudinal changesin pre-HD subjects, working memory processes may not contributeto the longitudinal changes we observed.
N2-related processes are mediated via the fronto-striatal net-works, including the anterior cingulate cortex (ACC)25. Processesreflected by the P3 component are mediated largely via parietal cor-tical networks28. As opposed to the parietal areas, the ACC is closelyconnected to the striatum. It is possible that differences in thestrength of connectivity between the striatal areas and the frontalor parietal areas underlie the differences we observed during pre-manifest disease progression. The dependence on N2-related pro-cesses in fronto-striatal circuits, together with the fact that theparallel execution of cognitive processes (i.e., conflict monitoringand flexible adaptation) depends on the fronto-striatal networks,may explain the high sensitivity across the longitudinal endpointsthat we observed in this study. This is underlined by the finding that
no longitudinal changes were observed in other trials in which con-flict processing and set-shifting did not coincide.
A disease progression biomarker should be sensitive enough tovary with disease progression in pre-HD subjects, should not vary incontrols, and should correlate with clinically important para-meters2,11. The measures presented here fulfil all these requirements.In both longitudinal periods, disease progression, as tracked by beha-vioural and neurophysiological parameters, reveal substantial corre-lations with clinically relevant parameters such as ‘‘disease burdenscore’’ (DBS), also called the ‘‘toxic load,’’ and with the probability ofdisease manifestation in the next 5 years. Systematic changes werenot detected at the longitudinal endpoints in controls, but weredetected in pre-HD subjects and showed considerable sensitivity asindicated by the Cohen’s d effect sizes in pre-HD subjects over a 6-month period of premanifest disease progression. As shown inFigure 5A and 5B, the effect sizes as estimated by Cohen’s d for thebehavioural and neurophysiological parameters in the current studywere considerably greater than the effect sizes obtained from stand-ard neuropsychological tests. However, when we used neuropsy-chological tests similar to those used in the TRACK-HD study21
and looked at effect sizes obtained from structural MRI data, theeffect sizes were similar to those obtained in the current study.Compared to these measures, effect sizes obtained from the time-frequency decomposed neurophysiological data were higher. This islikely due to the fact that the way the test was applied allowed us toconduct a series of trials, and this considerably increased the reliabil-ity of the behavioural and neurophysiological measures. The mea-sures we used have been shown to be sensitive to disease-modifyingtherapy in Parkinson’s disease29 and may also be sensitive enough tomonitor the effects of a potential disease-modifying therapy for HD.In contrast to the TRACK-HD study, the current study was not amulti-centre study, which is clearly a limitation. Further studies areneeded to evaluate whether the parameters identified here are suit-able for use in larger multi-centre studies and can be used as outcomeparameters in clinical trials that assess potential neuroprotectivetreatments for HD.
In summary, this study showed that behavioural and neurophy-siological measures of cognitive response selection processes aresensitive enough to detect changes in premanifest disease progres-sion over a short 6-month period. The effect sizes in pre-HD subjects,correlations with clinically relevant parameters, and a lack of similarchanges in control subjects suggest that the measures have potentialas a novel cognitive-neurophysiological state biomarker and meritfurther evaluation in larger multi-centre studies.
MethodsParticipants. At baseline, a group of 30 right-handed pre-HD subjects were enrolledin the study. After 15 months, three pre-HD subjects dropped out due to personalreasons. There were no further dropouts at 21 months. At each time point, all pre-HDsubjects were scored according to the Unified Huntington’s Disease Rating Scale(UHDRS) motor score (MS), total functional capacity scale (TFC), and independencescale (IS). Each HD subject completed the verbal fluency test, symbol digit test, andstroop colour naming, stroop word reading, and stroop interference tests; these weresummarised in a single cognitive score (CS)30. The pre-HD subjects also completedseveral motor tests. A rating of ‘‘absence of clinical motor symptoms’’ was based onexperts’ assessments of motor signs with the finding that the motor signs were notsufficient for a diagnosis of HD (Diagnostic Confidence Level , 4)30. For each pre-HD participant, the probability of estimated disease onset (eAO) within five years wascalculated according to Langbehn’s parametric model20. In addition, we calculated thedisease burden score, or DBS, for each subject [(CAG repeat - 35.5 3 age)3. MRI wasperformed to assess caudate size.
The study also included 30 right-handed, healthy control subjects that werematched to the pre-HD group in terms of age, sex, educational status, and socio-economic background. All participants gave written informed consent before thestudy began. The control subjects were examined at all three time points (baseline, 15months, and 21 months). The Ethics Committee at the Ruhr-University Bochum(Germany) approved the study. Detailed sample characteristics are shown in thesupplementary information (Table 2) for 27 pre-HD subjects completing all timepoints. Statistical analysis was carried out on the basis of these 27 pre-HD subjects.Clinical values reported for the pre-HD subjects were in the normal range and arecomparable to the clinical characteristics of pre-HD subjects in other studies.
www.nature.com/scientificreports
SCIENTIFIC REPORTS | 3 : 1797 | DOI: 10.1038/srep01797 6
Task. The task is identical to the task described in Beste et al.19 presenting the baselinedata. The outline of the paradigm is depicted below (Figure 6).
Briefly, the task combines a stroop paradigm with a switching paradigm. Thestimuli were four colour words (i.e., RED, BLUE, YELLOW and GREEN) presented atthe centre of the screen. These colour words are presented either in a rhomb or in asquare. These shapes serve as cue stimuli denoting the task rule. Cue and targetstimulus are separated by a short delay of 150 ms. When a rhomb is presented,subjects are instructed to respond according to the ‘colour rule’; when a square ispresented the subjects respond according to the ‘word rule’. The subjects respondusing their index fingers to BLUE (left key press) and YELLOW (right key press). Themiddle fingers are used to respond to the RED (left middle finger) and GREEN colour(right middle finger). For the ‘colour rule’ the subjects respond according to the print-colour of the word and ignore the meaning of the word (e.g. BLUE printed in green,subjects respond with the left index finger). For the ‘word rule’ subjects respondaccording to the meaning of the word and ignore the print-colour of the word. In thefollowing sections, colour rule trials and word rule trials are referred to as ‘incom-patible’ and ‘compatible’ trials respectively. The paradigm contains four different trialtypes: (i) non-switch, compatible [i.e., on two consecutive trials the font colour of theword corresponds to its meaning]; (ii) switch, compatible [i.e., on two consecutivetrials the rule changes, with the font colour of the word corresponding to its meaning];(iii) non-switch, incompatible trials [i.e., on two consecutive the font colour of theword does not correspond to its meaning]; and (iv) switch, incompatible trials [i.e., ontwo consecutive trials the rule changes and the font colour of the word does notcorrespond to its meaning]. The latter condition is the most difficult condition, sinceconflict monitoring and switching processes are required in parallel.
EEG recording and analysis. In both experiments conducted, the EEG was recordedfrom 65 Ag–AgCl electrodes at standard scalp positions against a reference electrodelocated at Cz. The sampling rate was 500 Hz. All electrode impedances were keptbelow 5 kV. Data processing involved a manual inspection of the data to removetechnical artefacts. After manual inspection, a band-pass filter ranging from 0.5 to20 Hz (48 db/oct) was applied. After filtering, the raw data were inspected a secondtime. To correct for periodically recurring artefacts (pulse artefacts, horizontal andvertical eye movements) an independent component analysis (ICA; Infomaxalgorithm) was applied to the un-epoched data set. Afterwards, the EEG data wassegmented according to the four different conditions. Segmentation was applied withrespect to the occurrence of the stimuli (i.e., stimulus-locked). Automated artefactrejection procedures were applied after epoching: rejection criteria included amaximum voltage step of more than 50 mV/ms, a maximal value difference of 200 mVin a 200 ms interval or activity below 0.1 mV. Then the data was CSD-transformed(current source density transformation31) in order to eliminate the reference potentialfrom the data. Moreoever, the CSD-transformation serves as a spatial filter32. As aconsequence activity is confined to only a few electrodes, and analysis of amplitudesand latencies can be confined to these electrodes. After the CSD-transformation, datawere corrected relative to a baseline extending from 200 ms before stimuluspresentation until stimulus onset and averaged. The data pre-processing is identical
to the study by Beste et al.19. The N2 at electrode FCz and the P3 at electrode Pz werequantified in the longitudinal data, since these electrodes revealed strongest effects inthe baseline data19. The scalp topography plots for the other longitudinal endpointssuggest that these electrode positions were still the most relevant ones. Baselinecorrection was performed in the time interval between 2200 ms until stimuluspresentation. The N2 was quantified relative to the pre-stimulus baseline and definedas the most negative peak occurring within the time interval of 250 till 320 ms. The P3was defined as the most positive peak within a time range from 350 to 500 ms. Bothcomponents were quantified in amplitude and latency on single subject level. Thewhole procedure is comparable to the analysis of the baseline data19.
Time-frequency decomposition (TF-decomposition). Time-frequency (TF)analysis of stimulus-related potentials was performed by means of a continuouswavelet transform (CWT), applying Morlet wavelets (w) in the time domain todifferent frequencies (f):
w(t, f )~A exp ({t2=2s2t ) exp (2ipft),
t is time, A~(stffiffiffi
pp
){1=2, st is the wavelet duration, and i~ffiffiffiffiffiffiffiffi
{1p
. For analysis andTF-plots, a ratio of f0/sf 5 5.5 was used, where f0 is the central frequency and sf is thewidth of the Gaussian shape in the frequency domain. The analysis was performed inthe frequency range 0.5–20 Hz with a central frequency at 0.5 Hz intervals. The‘evoked wavelet power’ was calculated, which refers to event-related changes in EEGpower that are phase-locked with respect to the event onset across trials33. Thesegments used for the wavelet analysis were 4000 ms long; starting 2000 ms beforestimulus onset and ending 2000 ms after stimulus onset. This epoch length waschosen to allow a reliable estimation of the evoked power of low frequentoscillations34,35. Maximal TF power and corresponding peak power latencies weremeasured in time intervals used for ERP quantification and was quantified in the deltaand theta frequency band. Their central frequencies were 3 and 5 Hz. We used thesea-priori defined frequencies in the analyses of the longitudinal time points to have thesame data compared between pre-HD and controls, as for the baseline data alreadypresented19. The delta and the theta frequency band were analyzed in separateANOVAs. Evoked power was quantified at the same electrode positions, as the ERPdata. A time window from 600 to 800 ms prior to the response was used to estimatebackground noise. Wavelet power in the time range of interest was measurednormalized to wavelet power at this baseline. Data quantification was performed onsingle subject level. TF power was log10-transformed to normalize the distributionsfor statistical analyses. The whole procedure is comparable to the analysis of thebaseline data19.
MRI scanning and analyses. At each time point (baseline, 15 months, 21 months)structural MRI scanning was conducted to assess caudate head volume. Scanning datawas available for N 5 25 of the 27 pre-HD participants completing all three visits (2pre-HDs had to be excluded due to claustrophobia). MR-imaging was performed on a1.5 T scanner (Magnetom SymphonyTM, Siemens, Erlangen, Germany) using a
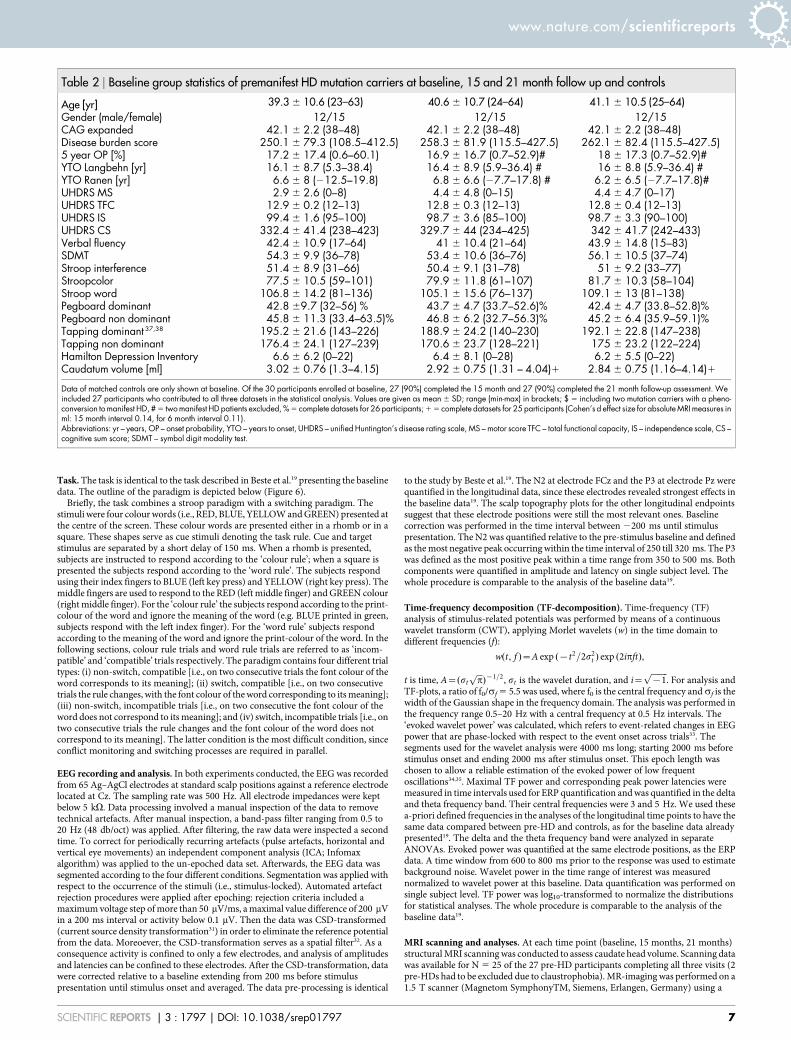
Table 2 | Baseline group statistics of premanifest HD mutation carriers at baseline, 15 and 21 month follow up and controls
Age [yr] 39.3 6 10.6 (23–63) 40.6 6 10.7 (24–64) 41.1 6 10.5 (25–64)
Gender (male/female) 12/15 12/15 12/15CAG expanded 42.1 6 2.2 (38–48) 42.1 6 2.2 (38–48) 42.1 6 2.2 (38–48)Disease burden score 250.1 6 79.3 (108.5–412.5) 258.3 6 81.9 (115.5–427.5) 262.1 6 82.4 (115.5–427.5)5 year OP [%] 17.2 6 17.4 (0.6–60.1) 16.9 6 16.7 (0.7–52.9)# 18 6 17.3 (0.7–52.9)#YTO Langbehn [yr] 16.1 6 8.7 (5.3–38.4) 16.4 6 8.9 (5.9–36.4) # 16 6 8.8 (5.9–36.4) #YTO Ranen [yr] 6.6 6 8 (212.5–19.8) 6.8 6 6.6 (27.7–17.8) # 6.2 6 6.5 (27.7–17.8)#UHDRS MS 2.9 6 2.6 (0–8) 4.4 6 4.8 (0–15) 4.4 6 4.7 (0–17)UHDRS TFC 12.9 6 0.2 (12–13) 12.8 6 0.3 (12–13) 12.8 6 0.4 (12–13)UHDRS IS 99.4 6 1.6 (95–100) 98.7 6 3.6 (85–100) 98.7 6 3.3 (90–100)UHDRS CS 332.4 6 41.4 (238–423) 329.7 6 44 (234–425) 342 6 41.7 (242–433)Verbal fluency 42.4 6 10.9 (17–64) 41 6 10.4 (21–64) 43.9 6 14.8 (15–83)SDMT 54.3 6 9.9 (36–78) 53.4 6 10.6 (36–76) 56.1 6 10.5 (37–74)Stroop interference 51.4 6 8.9 (31–66) 50.4 6 9.1 (31–78) 51 6 9.2 (33–77)Stroopcolor 77.5 6 10.5 (59–101) 79.9 6 11.8 (61–107) 81.7 6 10.3 (58–104)Stroop word 106.8 6 14.2 (81–136) 105.1 6 15.6 (76–137) 109.1 6 13 (81–138)Pegboard dominant 42.8 69.7 (32–56) % 43.7 6 4.7 (33.7–52.6)% 42.4 6 4.7 (33.8–52.8)%Pegboard non dominant 45.8 6 11.3 (33.4–63.5)% 46.8 6 6.2 (32.7–56.3)% 45.2 6 6.4 (35.9–59.1)%Tapping dominant 37,38 195.2 6 21.6 (143–226) 188.9 6 24.2 (140–230) 192.1 6 22.8 (147–238)Tapping non dominant 176.4 6 24.1 (127–239) 170.6 6 23.7 (128–221) 175 6 23.2 (122–224)Hamilton Depression Inventory 6.6 6 6.2 (0–22) 6.4 6 8.1 (0–28) 6.2 6 5.5 (0–22)Caudatum volume [ml] 3.02 6 0.76 (1.3–4.15) 2.92 6 0.75 (1.31 – 4.04)1 2.84 6 0.75 (1.16–4.14)1
Data of matched controls are only shown at baseline. Of the 30 participants enrolled at baseline, 27 (90%) completed the 15 month and 27 (90%) completed the 21 month follow-up assessment. Weincluded 27 participants who contributed to all three datasets in the statistical analysis. Values are given as mean 6 SD; range (min-max) in brackets; $ 5 including two mutation carriers with a pheno-conversion to manifest HD, # 5 two manifest HD patients excluded, % 5 complete datasets for 26 participants; 1 5 complete datasets for 25 participants (Cohen’s d effect size for absolute MRI measures inml: 15 month interval 0.14, for 6 month interval 0.11).Abbreviations: yr – years, OP – onset probability, YTO – years to onset, UHDRS – unified Huntington’s disease rating scale, MS – motor score TFC – total functional capacity, IS – independence scale, CS –cognitive sum score; SDMT – symbol digit modality test.
www.nature.com/scientificreports
SCIENTIFIC REPORTS | 3 : 1797 | DOI: 10.1038/srep01797 7
standard head coil and a Turbo FLASH 3D sequence with the following parameters:TE (echo time): 3.93 ms, TR (repetition time): 1900 ms, TI (inversion time):1100 ms, FA: 15u, NA: 1, resolution: 1 mm 3 1 mm, 128 sagittal slices, voxel-size inslice selected direction 1.0 mm. Subjects were positioned within the head coil using astandard procedure according to outer anatomical markers. Caudate volume wascalculated using the manual tracing method described by Aylward et al.36. The wholeprocedure is comparable to the analysis of the baseline data19.
Statistics. The data were analysed by univariate or mixed ANOVA. The mixedmeasures ANOVA tests contained the factors ‘‘trial type’’ (switch vs. non-switch),‘‘context’’ (compatible vs. incompatible), and "time point" (baseline, 15 months, and21 months) as the within-subject factors. The factor ‘‘group’’ (pre-HD vs. controls)was used as the between-subject factor. The degrees of freedom were adjusted usingthe Greenhouse-Geisser correction for all ANOVAs and for all experiments. All post-hoc tests were adjusted using the Bonferroni correction as necessary. The standarderror of the mean (SEM) is reported as a measure of variability. Data were normallydistributed in all of the tests in this study and at all time points as indicated by theresults of the Kolmogorov-Smirnov Tests (all z , 0.5; P . 0.4; one-tailed).
1. Ross, C. A. & Tabrizi, S. J. Huntington’s disease: from molecular pathogenesis toclinical treatment. Lancet Neurol. 10, 83–88 (2011).
2. Weir, D. W., Sturrock, A. & Leavitt, B. R., Development of biomarkers forHuntington’s disease. Lancet Neurol. 10, 573–590 (2011).
3. Tabrizi, S. J. et al. Biological and clinical manifestations of Huntington’s disease inthe longitudinal TRACK-HD study: cross-sectional analysis of baseline data.Lancet Neurol. 8, 791–801 (2009).
4. Paulsen, J. S. et al. Detection of Huntington’s disease decades before diagnosis: thePredict-HD study. J. Neurol. Neurosurg. Psychiatry 79, 874–880 (2008).
5. Orth, M. et al. Observing Huntington’s disease: the European Huntington’sdisease Networks REGISTRY. J. Neurol. Neurosurg. Psychiatry 82, 1409–1412(2011).
6. Tabrizi, S. J. et al. Potential endpoints for clinical trails in premanifest and earlyHuntington’s disease in the TRACK-HD study: analysis of 24 monthobservational data. Lancet Neurol. 11, 42–53 (2012).
7. O’Keefe, G. C., Michell, A. W. & Marker, R. A. Biomarkers in Huntington’s andParkinson’s disease. Ann. N. Y. Acad. Sci. 1180, 97–110 (2009).
8. Beste, C. et al. Levels of error processing in Huntington’ disease: a combined studyusing event-related potentials and voxel-based morphometry. Hum. Brain Mapp.29, 121–130 (2008).
9. Beste, C. et al. Functional compensation or pathology in cortico-subcorticalinteractions in preclinical Huntington’s disease. Neuropsychologia 45, 2922–2930(2007).
10. Nguyen, L., Bradshaw, J. L., Stout, J. C., Croft, R. J. & Georgiou-Karistianis, N.Electrophysiological measures as potential biomarkers in Huntington’s disease:review and future directions. Brain. Res. Rev. 64, 177–194 (2010).
11. Henley, S. M., Bates, G. P. & Tabrizi, S. J. Biomarkers for neurodegenerativediseases. Curr. Opin. Neurol. 18, 698–705 (2005).
12. Aron, A. R. et al. Taskset switching deficits in early-stage Huntington’s disease:implications for basal ganglia function. J. Cogn. Neurosci. 15, 629–642 (2003).
13. Kehagia, A. A., Cools, R., Barker, R. & Robbins, T. W. Switching between abstractrules reflects disease severity but not dopaminergic status in Parkinson’s disease.Neuropsychologia 47, 1117–1127 (2009).
14. Redgrave, P. et al. Goal-directed and habitual control in the basal ganglia:implications for Parkinson’s disease. Nat. Rev. Neurosci. 11, 760–772 (2010).
15. Plenz, D. When inhibition goes incognito: feedback interaction between spinyprojection neurons in striatal function. Trends Neurosci. 26, 436–443 (2003).
16. Thomas, E. A. et al. In vivo cell-autonomous transcriptional abnormalitiesrevealed in mice expressing mutant huntingtin in striatal but not cortical neurons.Hum. Mol. Genet. 20, 1049–1060 (2011).
17. Cepeda, C., Wu, N., Andre, V. M., Cummings, D. M. & Levine, M. S. Thecorticostriatal pathway in Huntington’s disease. Prog. Neurobiol. 81, 253–271(2007).
18. Botvinick, M. M., Cohen, J. D. & Carter, C. S. Conflict monitoring and anteriorcingulate cortex: an update. Trends Cogn. Sci. 8, 539–546 (2004).
19. Beste, C. et al. Mechanisms mediating parallel action monitoring in fronto-striatalcircuits. Neuroimage 62, 137–146 (2012).
20. Langbehn, D. R., Brinkman, R. R., Falush, D., Paulsen, J. S. & Hayden, M. R.International Huntington’s disease collaborative group. A new model forprediction of the age of onset and penetrance for Huntington’s disease based onCAG length. Clin. Genet. 65, 267–277.
21. Stout, J. C. et al. Evaluation of longitudinal 12 and 24 month cognitive outcomes inpremanifest and early Huntington’s disease. J. Neurol. Neurosurg. Psychiatry. 83,687–694 (2012).
22. Campodonico, J. R., Codori, A. M. & Brandt, J. Neuropsychological stability overtwo years in asymptomatic carriers of the Huntington’s disease mutation.J. Neurol. Neurosurg. Psychiatry 61, 621–624 (1996).
23. Witjes-Ane, M. N. et al. Longitudinal evaluation of presymptomatic carriers ofHuntington’s disease. J. Neuropsychiatry Clin. Neurosci. 19, 310–317 (2007).
24. Gajewski, P. D., Kleinsorge, T. & Falkenstein, M. Electrophysiological correlates ofresidual switch costs. Cortex 46, 1138–1148 (2010).
25. Folstein, J. R. & Van Petten, C. Influence of cognitive control and mismatch on theN2 component of the ERP: a review. Psychophysiology 45, 152–170 (2008).
26. Mayr, U. Age differences in the selection of mental sets: the role of inhibition,stimulus ambiguity, and response-set overlap. Psychol. Aging 16, 96–109 (2000).
27. Karayanidis, F., Coltheart, M., Michie, P. T. & Murphy, K. Electrophysiologicalcorrelates of anticipatory and poststimulus components of task switching.Psychophysiology 40, 329–348 (2003).
28. Polich, J. Updating P300: an integrative theory of P3a and P3b. Clin Neurophysiol118, 2128–2148 (2007).
29. Willemssen, R., Falkenstein, M., Schwarz, M., Muller, T. & Beste, C. Effects ofaging, Parkinson’s disease, and dopaminergic medication on response selectionand control. Neurobiol. Aging 32, 327–335 (2011).
30. Huntington Study Group. Unified Huntington’s disease rating scale: reliabilityand consistency. Mov. Disord. 11, 136–142 (1996).
31. Perrin, F., Pernier, J., Bertrand, O. & Echallier, J. F. Spherical splines for scalppotential and current density mapping. Electroencephalogr. Clin. Neurophysiol.72, 184–187 (1989).
32. Nunez, P. L. & Pilgreen, K. L. The spline-laplacian in clinical neurophysiology: amethod to improve EEG spatial resolution. J. Clin. Neurophysiol. 8, 397–413.
33. Roach, B. J. & Mathalon, D. H. Event-related EEG time-frequency analysis: anoverview of measures and an analysis of early gamma band phase locking inschizophrenia. Schizophr. Bull. 34, 907–926 (2008).
34. Ocklenburg, S., Gunturkun, O. & Beste, C. Lateralized neural mechanismsunderlying the modulation of response inhibition processes. Neuroimage 55,1771–1778 (2011).
35. Beste, C. et al. Functional 5-HT1a receptor polymorphism selectively modulateserror-specific subprocesses of performance monitoring. Hum. Brain Mapp. 31,621–630 (2010).
36. Aylward, E. H. et al. Onset and rate of striatal atrophy in preclinical Huntingtondisease. Neurology 63, 66–72 (2004).
37. Saft, C., Andrich, J., Meisel, N. M., Przuntek, H. & Muller, T. Congruentdeterioration of complex and simple movements in patients with Huntington’sdisease. J. Neural. Transm. Suppl. 68, 97–104 (2004).
38. Andrich, J., Saft, C., Ostholt, N. & Muller, T. Assessment of simple movementsand progression of Huntington’s disease. J. Neurol. Neurosurg. Psychiatry. 78,405–407 (2007).
AcknowledgmentsThis work was supported by Grant from the Deutsche Forschungsgemeinschaft BE4045/10-1 and a Grant by the CHDI Foundation to C.B.
Author contributionsC.B. and C.S. conceived and designed the study. A.K.S., V.S., R.H., C.L. performed datacollection, C.B. performed data analysis, C.B. and C.S. wrote the manuscript and compiledthe figures.
Additional informationSupplementary information accompanies this paper at http://www.nature.com/scientificreports
Competing financial interests: The authors declare no competing financial interests.
License: This work is licensed under a Creative CommonsAttribution-NonCommercial-NoDerivs 3.0 Unported License. To view a copy of thislicense, visit http://creativecommons.org/licenses/by-nc-nd/3.0/
How to cite this article: Beste, C. et al. A novel cognitive-neurophysiological statebiomarker in premanifest Huntington’s disease validated on longitudinal data. Sci. Rep. 3,1797; DOI:10.1038/srep01797 (2013).
www.nature.com/scientificreports
SCIENTIFIC REPORTS | 3 : 1797 | DOI: 10.1038/srep01797 8
Related Documents