A New Wavelet-Based Mode Decomposition for Oscillating Signals and Comparison with the Empirical Mode Decomposition Adrien DELIÈGE University of Liège, Belgium ITNG 2016 - 13th International Conference on Information Technology: New Generations Las Vegas, Nevada – April 2016 Joint work with S. NICOLAY [email protected]

Welcome message from author
This document is posted to help you gain knowledge. Please leave a comment to let me know what you think about it! Share it to your friends and learn new things together.
Transcript
A New Wavelet-Based Mode Decomposition forOscillating Signals and Comparison with the
Empirical Mode Decomposition
Adrien DELIÈGE
University of Liège, Belgium
ITNG 2016 - 13th International Conference on Information Technology: New GenerationsLas Vegas, Nevada – April 2016
Joint work with S. NICOLAY
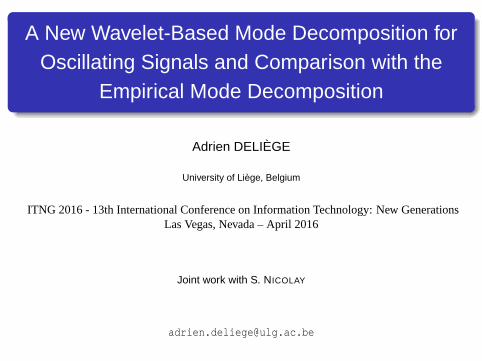
Introduction
Decomposing time series into several modes has become more and morepopular and useful in signal analysis.
Methods such as EMD or SSA (among others) have been successfullyapplied in medicine, finance, climatology, ...
Old but gold: Fourier transform allows to decompose a signal as
f (t)≈K
∑k=1
ck cos(ωk t +φk).
Problem: often too many components in the decomposition.
Idea: Considering the amplitudes and frequencies as functions of t todecrease the number of terms.
Development of an empirical wavelet mode decomposition (EWMD)method which can be used in numerous ways.
Edit: EWMD becomes WIME (wavelet-induced mode extraction).Adrien DELIÈGE (University of Liège, Belgium) EWMD - WIME Las Vegas, April 2016
Table of contents
1 Methods: EMD and WIME
2 Reconstruction skills
3 Period detection skills
4 Real-life data
5 Recent improvements
6 Conclusion
Adrien DELIÈGE (University of Liège, Belgium) EWMD - WIME Las Vegas, April 2016
Methods: EMD and WIME
Table of contents
1 Methods: EMD and WIME
2 Reconstruction skills
3 Period detection skills
4 Real-life data
5 Recent improvements
6 Conclusion
Adrien DELIÈGE (University of Liège, Belgium) EWMD - WIME Las Vegas, April 2016
Methods: EMD and WIME
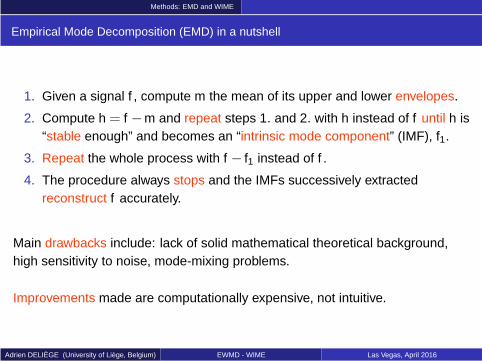
Empirical Mode Decomposition (EMD) in a nutshell
1. Given a signal f , compute m the mean of its upper and lower envelopes.
2. Compute h = f −m and repeat steps 1. and 2. with h instead of f until h is“stable enough” and becomes an “intrinsic mode component” (IMF), f1.
3. Repeat the whole process with f − f1 instead of f .
4. The procedure always stops and the IMFs successively extractedreconstruct f accurately.
Main drawbacks include: lack of solid mathematical theoretical background,high sensitivity to noise, mode-mixing problems.
Improvements made are computationally expensive, not intuitive.
Adrien DELIÈGE (University of Liège, Belgium) EWMD - WIME Las Vegas, April 2016
Methods: EMD and WIME
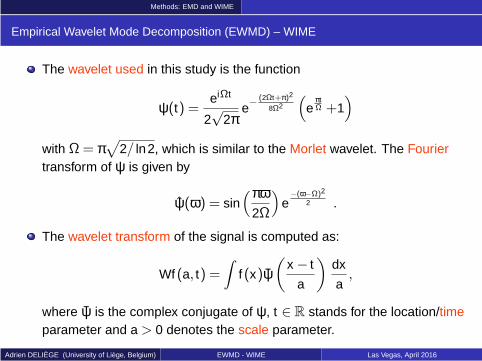
Empirical Wavelet Mode Decomposition (EWMD) – WIME
The wavelet used in this study is the function
ψ(t) =eiΩt
2√
2πe−
(2Ωt+π)2
8Ω2
(
eπtΩ +1
)
with Ω= π√
2/ ln2, which is similar to the Morlet wavelet. The Fouriertransform of ψ is given by
ψ(ω) = sin(πω
2Ω
)
e−(ω−Ω)2
2 .
The wavelet transform of the signal is computed as:
Wf (a, t) =∫
f (x)ψ(
x − t
a
)
dx
a,
where ψ is the complex conjugate of ψ, t ∈ R stands for the location/timeparameter and a > 0 denotes the scale parameter.
Adrien DELIÈGE (University of Liège, Belgium) EWMD - WIME Las Vegas, April 2016
Methods: EMD and WIME
Empirical Wavelet Mode Decomposition (EWMD) – WIME
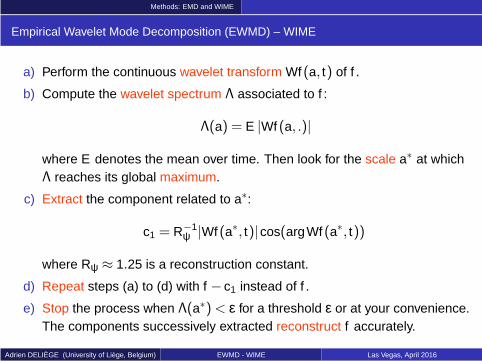
a) Perform the continuous wavelet transform Wf (a, t) of f .
b) Compute the wavelet spectrum Λ associated to f :
Λ(a) = E |Wf (a, .)|
where E denotes the mean over time. Then look for the scale a∗ at whichΛ reaches its global maximum.
c) Extract the component related to a∗:
c1 = R−1ψ |Wf (a∗, t)|cos(argWf (a∗, t))
where Rψ ≈ 1.25 is a reconstruction constant.
d) Repeat steps (a) to (d) with f − c1 instead of f .
e) Stop the process when Λ(a∗)< ε for a threshold ε or at your convenience.The components successively extracted reconstruct f accurately.
Adrien DELIÈGE (University of Liège, Belgium) EWMD - WIME Las Vegas, April 2016

Reconstruction skills
Table of contents
1 Methods: EMD and WIME
2 Reconstruction skills
3 Period detection skills
4 Real-life data
5 Recent improvements
6 Conclusion
Adrien DELIÈGE (University of Liège, Belgium) EWMD - WIME Las Vegas, April 2016
Reconstruction skills
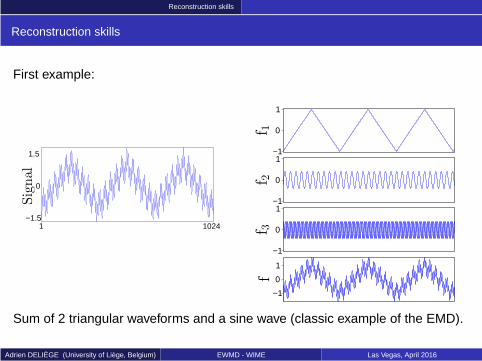
Reconstruction skills
First example:
1 1024−1.5
0
1.5 −1
0
1
−1
0
1
−1
0
1
−1
0
1
Sum of 2 triangular waveforms and a sine wave (classic example of the EMD).
Adrien DELIÈGE (University of Liège, Belgium) EWMD - WIME Las Vegas, April 2016
Reconstruction skills
Reconstruction skills
time
freq
uenc
y
spectrum
freq
uenc
y
−1
0
1
time
c1
time
freq
uenc
y
spectrum
freq
uenc
y
−1
0
1
time
c2
time
freq
uenc
y
spectrum
freq
uenc
y
−1
0
1
time
c3
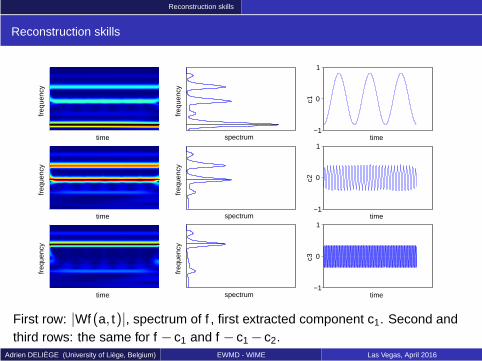
First row: |Wf (a, t)|, spectrum of f , first extracted component c1. Second andthird rows: the same for f − c1 and f − c1 − c2.
Adrien DELIÈGE (University of Liège, Belgium) EWMD - WIME Las Vegas, April 2016

Reconstruction skills
Reconstruction skills
WIME Expected EMD
−1
0
1
−1
0
1
−1
0
1
−1
0
1
−1
0
1
−1
0
1
−1
0
1
−1
0
1
−1
0
1
−1
0
1
−1
0
1
−1
0
1
First column: components extracted with WIME. Second column: the real(expected) components. Third column: the IMFs extracted with the EMD. Thereconstruction c1 + c2 + c3 has a correlation of 0.992 with the original signaland a RMSE of 0.085.
Adrien DELIÈGE (University of Liège, Belgium) EWMD - WIME Las Vegas, April 2016
Period detection skills
Table of contents
1 Methods: EMD and WIME
2 Reconstruction skills
3 Period detection skills
4 Real-life data
5 Recent improvements
6 Conclusion
Adrien DELIÈGE (University of Liège, Belgium) EWMD - WIME Las Vegas, April 2016
Period detection skills
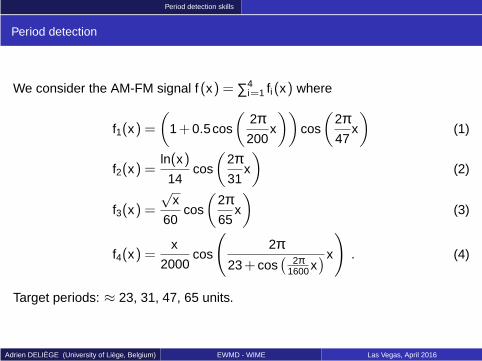
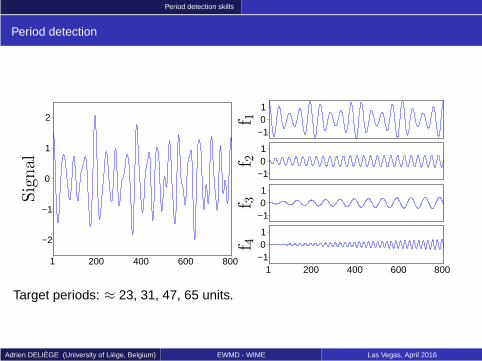
Period detection
We consider the AM-FM signal f (x) = ∑4i=1 fi(x) where
f1(x) =
(
1+0.5cos
(
2π200
x
))
cos
(
2π47
x
)
(1)
f2(x) =ln(x)
14cos
(
2π31
x
)
(2)
f3(x) =
√x
60cos
(
2π65
x
)
(3)
f4(x) =x
2000cos
(
2π23+ cos
(
2π1600 x
)x
)
. (4)
Target periods: ≈ 23, 31, 47, 65 units.
Adrien DELIÈGE (University of Liège, Belgium) EWMD - WIME Las Vegas, April 2016
Period detection skills
Period detection
1 200 400 600 800
−2
−1
0
1
2
−101
−101
−101
1 200 400 600 800−101
Target periods: ≈ 23, 31, 47, 65 units.
Adrien DELIÈGE (University of Liège, Belgium) EWMD - WIME Las Vegas, April 2016
Period detection skills
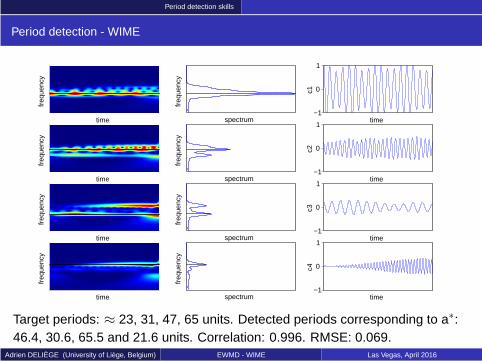
Period detection - WIME
time
freq
uenc
y
spectrum
freq
uenc
y
−1
0
1
time
c1
time
freq
uenc
y
spectrumfr
eque
ncy
−1
0
1
time
c2
time
freq
uenc
y
spectrum
freq
uenc
y
−1
0
1
time
c3
time
freq
uenc
y
spectrum
freq
uenc
y
−1
0
1
time
c4
Target periods: ≈ 23, 31, 47, 65 units. Detected periods corresponding to a∗:46.4, 30.6, 65.5 and 21.6 units. Correlation: 0.996. RMSE: 0.069.
Adrien DELIÈGE (University of Liège, Belgium) EWMD - WIME Las Vegas, April 2016
Period detection skills
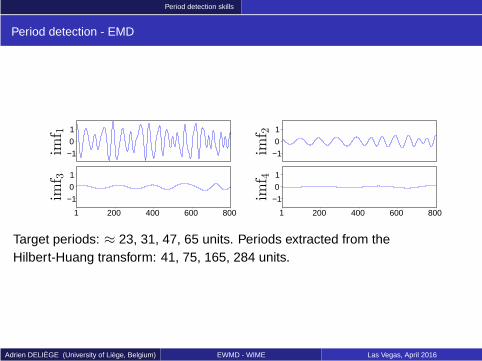
Period detection - EMD
−1
0
1
−1
0
1
1 200 400 600 800
−1
0
1
1 200 400 600 800
−1
0
1
Target periods: ≈ 23, 31, 47, 65 units. Periods extracted from theHilbert-Huang transform: 41, 75, 165, 284 units.
Adrien DELIÈGE (University of Liège, Belgium) EWMD - WIME Las Vegas, April 2016
Real-life data
Table of contents
1 Methods: EMD and WIME
2 Reconstruction skills
3 Period detection skills
4 Real-life data
5 Recent improvements
6 Conclusion
Adrien DELIÈGE (University of Liège, Belgium) EWMD - WIME Las Vegas, April 2016
Real-life data
ENSO index
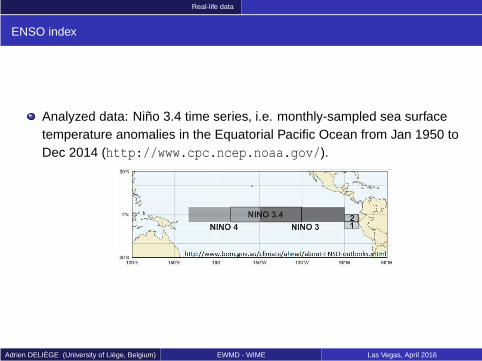
Analyzed data: Niño 3.4 time series, i.e. monthly-sampled sea surfacetemperature anomalies in the Equatorial Pacific Ocean from Jan 1950 toDec 2014 (http://www.cpc.ncep.noaa.gov/).
Adrien DELIÈGE (University of Liège, Belgium) EWMD - WIME Las Vegas, April 2016
Real-life data
ENSO index
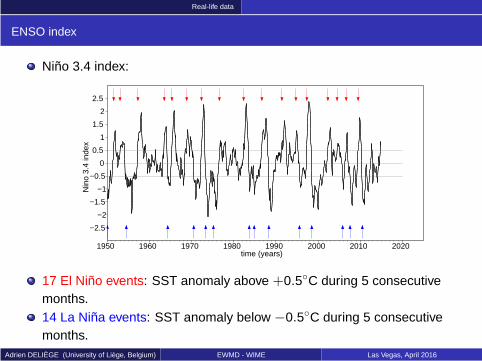
Niño 3.4 index:
1950 1960 1970 1980 1990 2000 2010 2020
−2.5
−2
−1.5
−1
−0.5
0
0.5
1
1.5
2
2.5
time (years)
Nin
o 3.
4 in
dex
17 El Niño events: SST anomaly above +0.5C during 5 consecutivemonths.14 La Niña events: SST anomaly below −0.5C during 5 consecutivemonths.
Adrien DELIÈGE (University of Liège, Belgium) EWMD - WIME Las Vegas, April 2016
Real-life data
ENSO index
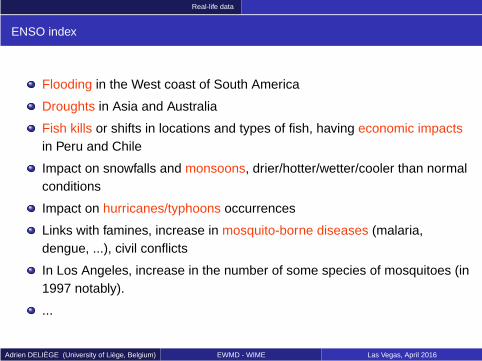
Flooding in the West coast of South America
Droughts in Asia and Australia
Fish kills or shifts in locations and types of fish, having economic impactsin Peru and Chile
Impact on snowfalls and monsoons, drier/hotter/wetter/cooler than normalconditions
Impact on hurricanes/typhoons occurrences
Links with famines, increase in mosquito-borne diseases (malaria,dengue, ...), civil conflicts
In Los Angeles, increase in the number of some species of mosquitoes (in1997 notably).
...
Adrien DELIÈGE (University of Liège, Belgium) EWMD - WIME Las Vegas, April 2016

Real-life data
ENSO index
time
freq
uenc
y
spectrum
freq
uenc
y
−1
0
1
time
c1
time
freq
uenc
y
spectrumfr
eque
ncy
−1
0
1
time
c2
time
freq
uenc
y
spectrum
freq
uenc
y
−1
0
1
time
c3
time
freq
uenc
y
spectrum
freq
uenc
y
−1
0
1
time
c4time
freq
uenc
y
spectrum
freq
uenc
y
−1
0
1
timec5
Adrien DELIÈGE (University of Liège, Belgium) EWMD - WIME Las Vegas, April 2016
Real-life data
ENSO index
−1
0
1
−1
0
1
−1
0
1
−1
0
1
−1
0
1
−101
−101
−101
−101
−101
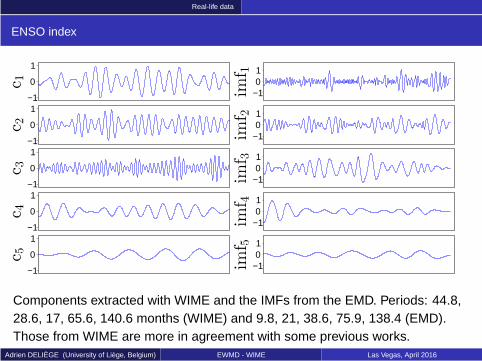
Components extracted with WIME and the IMFs from the EMD. Periods: 44.8,28.6, 17, 65.6, 140.6 months (WIME) and 9.8, 21, 38.6, 75.9, 138.4 (EMD).Those from WIME are more in agreement with some previous works.
Adrien DELIÈGE (University of Liège, Belgium) EWMD - WIME Las Vegas, April 2016

Recent improvements
Table of contents
1 Methods: EMD and WIME
2 Reconstruction skills
3 Period detection skills
4 Real-life data
5 Recent improvements
6 Conclusion
Adrien DELIÈGE (University of Liège, Belgium) EWMD - WIME Las Vegas, April 2016
Recent improvements
Recent improvements
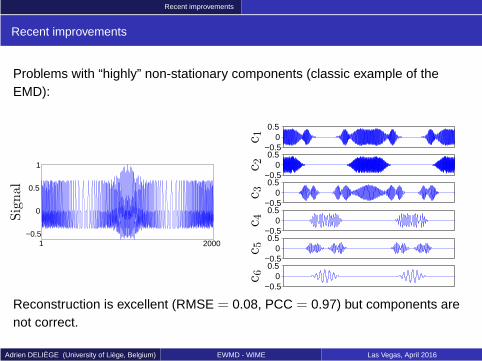
Problems with “highly” non-stationary components (classic example of theEMD):
1 2000−0.5
0
0.5
1
−0.50
0.5
−0.50
0.5
−0.50
0.5
−0.50
0.5
−0.50
0.5
−0.50
0.5
Reconstruction is excellent (RMSE = 0.08, PCC = 0.97) but components arenot correct.
Adrien DELIÈGE (University of Liège, Belgium) EWMD - WIME Las Vegas, April 2016

Recent improvements
Recent improvements
Solution: add flexibility, follow ridges of maxima.
0 0.5 1
204080
160320640
time
freq
uenc
y
0 0.2 0.41 0.62
204080
160320640
spectrum
freq
uenc
y
0 0.5 1
−1
0
1
time
c1
0 0.5 1
−1
0
1
time
f1
0 0.5 1
204080
160320640
time
freq
uenc
y
0 0.2 0.41 0.62
204080
160320640
spectrum
freq
uenc
y
0 0.5 1
−1
0
1
timec2
0 0.5 1
−1
0
1
time
f2
0 0.5 1
204080
160320640
time
freq
uenc
y
0 0.2 0.41 0.62
204080
160320640
spectrum
freq
uenc
y
0 0.5 1
−1
0
1
time
c3
0 0.5 1
−1
0
1
time
f3Adrien DELIÈGE (University of Liège, Belgium) EWMD - WIME Las Vegas, April 2016
Recent improvements
Recent improvements
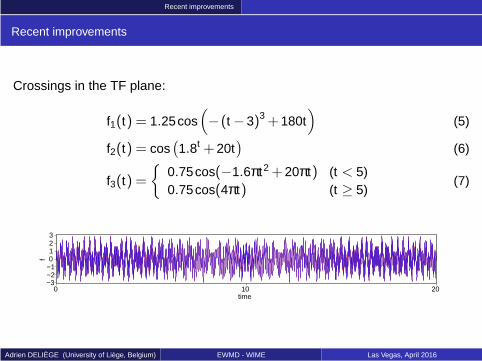
Crossings in the TF plane:
f1(t) = 1.25cos(
−(t −3)3 +180t)
(5)
f2(t) = cos(
1.8t +20t)
(6)
f3(t) =
0.75cos(−1.6πt2 +20πt) (t < 5)0.75cos(4πt) (t ≥ 5)
(7)
0 10 20−3−2−10123
time
f
Adrien DELIÈGE (University of Liège, Belgium) EWMD - WIME Las Vegas, April 2016
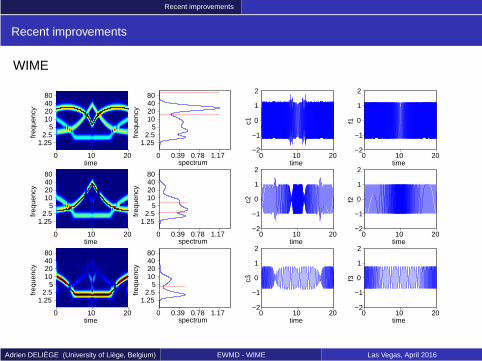
Recent improvements
Recent improvements
WIME
0 10 20
1.252.5
510204080
time
freq
uenc
y
0 0.39 0.78 1.17
1.252.5
510204080
spectrum
freq
uenc
y
0 10 20−2
−1
0
1
2
time
c1
0 10 20−2
−1
0
1
2
time
f1
0 10 20
1.252.5
510204080
time
freq
uenc
y
0 0.39 0.78 1.17
1.252.5
510204080
spectrum
freq
uenc
y
0 10 20−2
−1
0
1
2
timec2
0 10 20−2
−1
0
1
2
time
f2
0 10 20
1.252.5
510204080
time
freq
uenc
y
0 0.39 0.78 1.17
1.252.5
510204080
spectrum
freq
uenc
y
0 10 20−2
−1
0
1
2
time
c3
0 10 20−2
−1
0
1
2
time
f3Adrien DELIÈGE (University of Liège, Belgium) EWMD - WIME Las Vegas, April 2016
Recent improvements
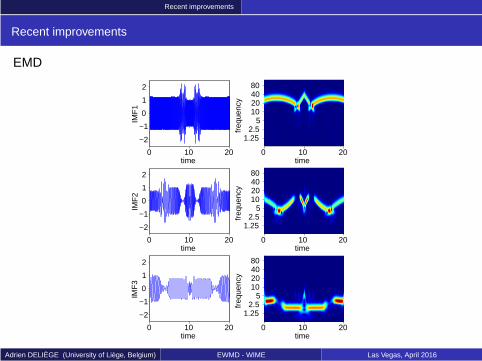
Recent improvements
EMD
0 10 20
1.252.5
510204080
time
freq
uenc
y
0 10 20
−2
−1
0
1
2
time
IMF
1
0 10 20
1.252.5
510204080
timefr
eque
ncy
0 10 20
−2
−1
0
1
2
time
IMF
2
0 10 20
1.252.5
510204080
time
freq
uenc
y
0 10 20
−2
−1
0
1
2
time
IMF
3
Adrien DELIÈGE (University of Liège, Belgium) EWMD - WIME Las Vegas, April 2016

Conclusion
Table of contents
1 Methods: EMD and WIME
2 Reconstruction skills
3 Period detection skills
4 Real-life data
5 Recent improvements
6 Conclusion
Adrien DELIÈGE (University of Liège, Belgium) EWMD - WIME Las Vegas, April 2016
Conclusion
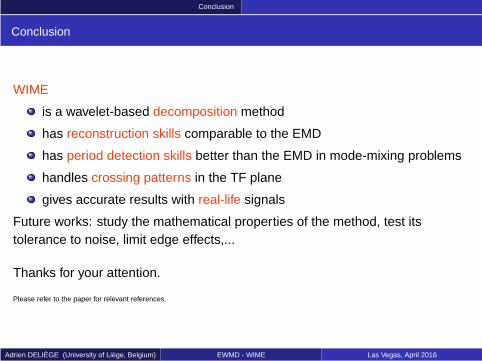
Conclusion
WIME
is a wavelet-based decomposition method
has reconstruction skills comparable to the EMD
has period detection skills better than the EMD in mode-mixing problems
handles crossing patterns in the TF plane
gives accurate results with real-life signals
Future works: study the mathematical properties of the method, test itstolerance to noise, limit edge effects,...
Thanks for your attention.
Please refer to the paper for relevant references.
Adrien DELIÈGE (University of Liège, Belgium) EWMD - WIME Las Vegas, April 2016
Related Documents