Agriculture, Ecosystems and Environment 142 (2011) 352–364 Contents lists available at ScienceDirect Agriculture, Ecosystems and Environment journa l h o me pa ge: www.elsevier.com/locate/agee A new Nitrogen Index to evaluate nitrogen losses in intensive forage systems in Mexico Uriel Figueroa-Viramontes a , Jorge A. Delgado b,∗ , Jose A. Cueto-Wong c , Gregorio Nú˜ nez-Hernández a , David G. Reta-Sánchez a , Kenneth A. Barbarick d a INIFAP, Campo Experimental La Laguna, Blvd. José Santos Valdés 1200 Pte., Col. Centro, 27440 Matamoros, Coah., Mexico b USDA, ARS, 2150 Centre Avenue, Building D, Fort Collins, CO 80526, United States c INIFAP, Centro Nacional de Investigación Disciplinaria en Relación Agua-Suelo-Planta-Atmosfera, Margen derecha Canal Sacramento km. 6.5, 35150 Gómez Palacio, Dgo., Mexico d Colorado State University, Fort Collins, CO 80526, United States a r t i c l e i n f o Article history: Received 19 October 2010 Received in revised form 5 June 2011 Accepted 8 June 2011 Available online 2 July 2011 Keywords: Dairy production systems Environmental impacts Forage systems Nitrate leaching Nitrogen Index a b s t r a c t Although nitrogen inputs to agricultural fields are necessary for global food sustainability, they present a major nutrient management challenge, because nitrogen inputs can increase nitrogen losses to the environment, which can negatively impact water quality across key surface and groundwater resources. The need to evaluate the potential risk of nitrogen losses for a given forage type, management scenario, and field quickly and easily can be met with new tools that assist in environmental risk assessment. An example is the Mexico Nitrogen Index: this new tool aims to help its users quickly evaluate the risk of nitrogen loss for a given field under a given set of management practices. The objective of this study was to evaluate the accuracy of the Mexico Nitrogen Index in ranking the risk of nitrogen loss for a given field under a given set of management practices. To perform this evaluation, data for several different management scenarios were collected and entered into the Mexico Nitrogen Index. The capability of the Index to assess the fate and transport of nitrogen and to rank the risk of nitrogen loss was evaluated by comparing predicted soil residual nitrate and forage nitrogen uptake with observed values. Nitrogen fate and transport were accurately predicted under many different scenarios (P < 0.001); for example, the Index was successful in accurately predicting higher potential risk for nitrogen loss for scenarios with excessive nitrogen applications. It was concluded that the Mexico Nitrogen Index can accurately per- form these risk assessments and that it has the potential to facilitate communication between scientists, extension personnel and farmers about the effects different management practices may have on nitrogen losses. Published by Elsevier B.V. 1. Introduction Although nitrogen inputs to agricultural fields are necessary for global food sustainability, they present a major nutrient man- agement challenge, because nitrogen inputs can increase nitrogen losses to the environment, which can negatively impact water qual- ity across key surface and groundwater resources (Cowling et al., 2002; Galloway et al., 2003; Delgado and Follett, 2010) in locations such as the Northern China Plain (Li et al., 2007) and a Mediter- ranean region in Spain (De Paz et al., 2009). Impacts to surface ∗ Corresponding author. Tel.: +1 970 492 7260; fax: +1 970 492 7213. E-mail addresses: fi[email protected] (U. Figueroa-Viramontes), [email protected] (J.A. Delgado), [email protected] (J.A. Cueto-Wong), [email protected] (K.A. Barbarick). water have been reported in North America, such as nitrate leach- ing from the tile system in the Midwest and flowing to the Gulf of Mexico (Matson et al., 1997; Vitousek et al., 1997; Bricker et al., 2007; Mitsch and Day, 2006; Goolsby et al., 2001). Another area that has been heavily impacted by nitrogen inputs is the Laguna Comar- quera of Mexico; the nitrogen inputs in this area come mainly from intensive manure management (Martínez et al., 2006; Cueto et al., 2005a). The U.S. Environmental Protection Agency has stated that water with a nitrate-nitrogen content higher than 10 ppm is unsafe for use as a drinking water source (USEPA), which suggests that there is a need to reduce nitrogen losses to the environment. Addi- tionally, a detailed discussion on the potential impacts of reactive nitrogen on human health was recently written by Follett et al. (2010). These potential threats to human health provide the ratio- nale for developing, evaluating and improving tools that can help us quickly assess whether a given set of management practices under a given set of conditions (including factors such as weather, irri- gation, and soil type) can reduce the risk of nitrogen losses to the environment. 0167-8809/$ – see front matter. Published by Elsevier B.V. doi:10.1016/j.agee.2011.06.004

Welcome message from author
This document is posted to help you gain knowledge. Please leave a comment to let me know what you think about it! Share it to your friends and learn new things together.
Transcript
As
UDa
b
c
d
a
ARRAA
KDEFNN
1
fali2sr
j(
0d
Agriculture, Ecosystems and Environment 142 (2011) 352– 364
Contents lists available at ScienceDirect
Agriculture, Ecosystems and Environment
journa l h o me pa ge: www.elsev ier .com/ locate /agee
new Nitrogen Index to evaluate nitrogen losses in intensive forageystems in Mexico
riel Figueroa-Viramontesa , Jorge A. Delgadob,∗ , Jose A. Cueto-Wongc , Gregorio Núnez-Hernándeza ,avid G. Reta-Sáncheza, Kenneth A. Barbarickd
INIFAP, Campo Experimental La Laguna, Blvd. José Santos Valdés 1200 Pte., Col. Centro, 27440 Matamoros, Coah., MexicoUSDA, ARS, 2150 Centre Avenue, Building D, Fort Collins, CO 80526, United StatesINIFAP, Centro Nacional de Investigación Disciplinaria en Relación Agua-Suelo-Planta-Atmosfera, Margen derecha Canal Sacramento km. 6.5, 35150 Gómez Palacio, Dgo., MexicoColorado State University, Fort Collins, CO 80526, United States
r t i c l e i n f o
rticle history:eceived 19 October 2010eceived in revised form 5 June 2011ccepted 8 June 2011vailable online 2 July 2011
eywords:airy production systemsnvironmental impactsorage systemsitrate leachingitrogen Index
a b s t r a c t
Although nitrogen inputs to agricultural fields are necessary for global food sustainability, they presenta major nutrient management challenge, because nitrogen inputs can increase nitrogen losses to theenvironment, which can negatively impact water quality across key surface and groundwater resources.The need to evaluate the potential risk of nitrogen losses for a given forage type, management scenario,and field quickly and easily can be met with new tools that assist in environmental risk assessment. Anexample is the Mexico Nitrogen Index: this new tool aims to help its users quickly evaluate the risk ofnitrogen loss for a given field under a given set of management practices. The objective of this study wasto evaluate the accuracy of the Mexico Nitrogen Index in ranking the risk of nitrogen loss for a givenfield under a given set of management practices. To perform this evaluation, data for several differentmanagement scenarios were collected and entered into the Mexico Nitrogen Index. The capability of theIndex to assess the fate and transport of nitrogen and to rank the risk of nitrogen loss was evaluatedby comparing predicted soil residual nitrate and forage nitrogen uptake with observed values. Nitrogen
fate and transport were accurately predicted under many different scenarios (P < 0.001); for example, theIndex was successful in accurately predicting higher potential risk for nitrogen loss for scenarios withexcessive nitrogen applications. It was concluded that the Mexico Nitrogen Index can accurately per-form these risk assessments and that it has the potential to facilitate communication between scientists,extension personnel and farmers about the effects different management practices may have on nitrogen losses.. Introduction
Although nitrogen inputs to agricultural fields are necessaryor global food sustainability, they present a major nutrient man-gement challenge, because nitrogen inputs can increase nitrogenosses to the environment, which can negatively impact water qual-
ty across key surface and groundwater resources (Cowling et al.,002; Galloway et al., 2003; Delgado and Follett, 2010) in locationsuch as the Northern China Plain (Li et al., 2007) and a Mediter-anean region in Spain (De Paz et al., 2009). Impacts to surface∗ Corresponding author. Tel.: +1 970 492 7260; fax: +1 970 492 7213.E-mail addresses: [email protected] (U. Figueroa-Viramontes),
[email protected] (J.A. Delgado), [email protected]. Cueto-Wong), [email protected] (K.A. Barbarick).
167-8809/$ – see front matter. Published by Elsevier B.V.oi:10.1016/j.agee.2011.06.004
Published by Elsevier B.V.
water have been reported in North America, such as nitrate leach-ing from the tile system in the Midwest and flowing to the Gulfof Mexico (Matson et al., 1997; Vitousek et al., 1997; Bricker et al.,2007; Mitsch and Day, 2006; Goolsby et al., 2001). Another area thathas been heavily impacted by nitrogen inputs is the Laguna Comar-quera of Mexico; the nitrogen inputs in this area come mainly fromintensive manure management (Martínez et al., 2006; Cueto et al.,2005a). The U.S. Environmental Protection Agency has stated thatwater with a nitrate-nitrogen content higher than 10 ppm is unsafefor use as a drinking water source (USEPA), which suggests thatthere is a need to reduce nitrogen losses to the environment. Addi-tionally, a detailed discussion on the potential impacts of reactivenitrogen on human health was recently written by Follett et al.(2010). These potential threats to human health provide the ratio-nale for developing, evaluating and improving tools that can help us
quickly assess whether a given set of management practices undera given set of conditions (including factors such as weather, irri-gation, and soil type) can reduce the risk of nitrogen losses to theenvironment.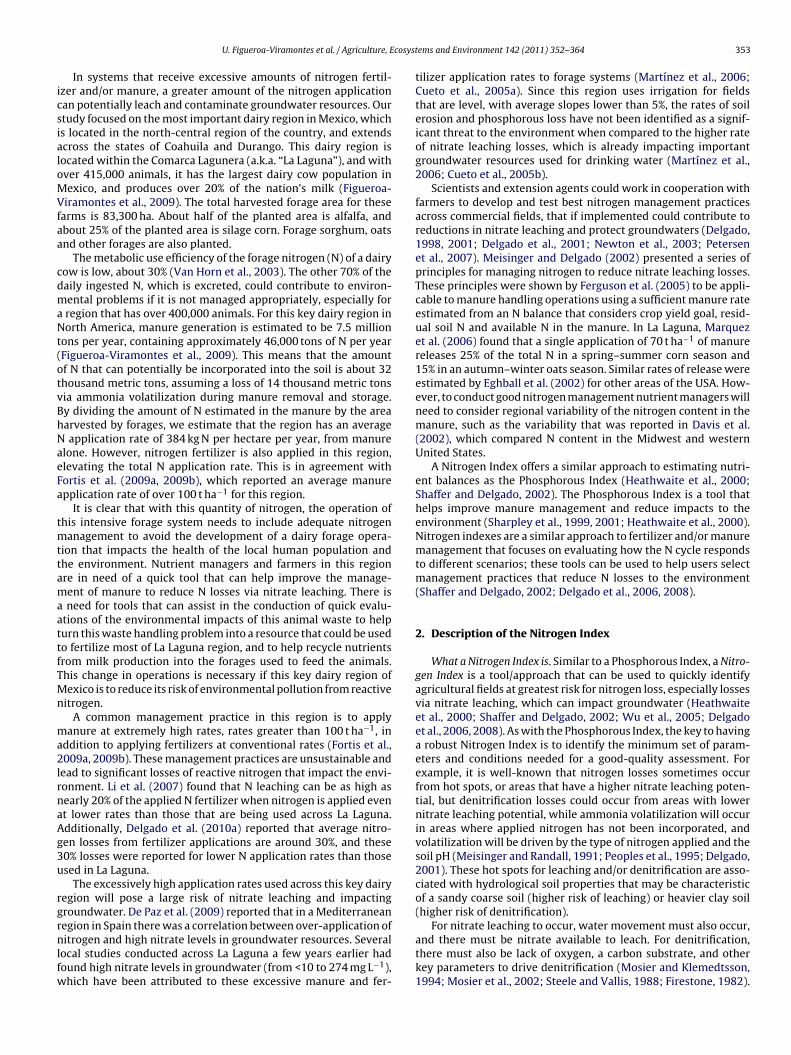
cosyst
icsialoMVfaa
cdmaNt(otvBhNaeFa
tmttamaattfTMn
ma2lrnaAg3u
rgrnlfw
U. Figueroa-Viramontes et al. / Agriculture, E
In systems that receive excessive amounts of nitrogen fertil-zer and/or manure, a greater amount of the nitrogen applicationan potentially leach and contaminate groundwater resources. Ourtudy focused on the most important dairy region in Mexico, whichs located in the north-central region of the country, and extendscross the states of Coahuila and Durango. This dairy region isocated within the Comarca Lagunera (a.k.a. “La Laguna”), and withver 415,000 animals, it has the largest dairy cow population inexico, and produces over 20% of the nation’s milk (Figueroa-
iramontes et al., 2009). The total harvested forage area for thesearms is 83,300 ha. About half of the planted area is alfalfa, andbout 25% of the planted area is silage corn. Forage sorghum, oatsnd other forages are also planted.
The metabolic use efficiency of the forage nitrogen (N) of a dairyow is low, about 30% (Van Horn et al., 2003). The other 70% of theaily ingested N, which is excreted, could contribute to environ-ental problems if it is not managed appropriately, especially for
region that has over 400,000 animals. For this key dairy region inorth America, manure generation is estimated to be 7.5 million
ons per year, containing approximately 46,000 tons of N per yearFigueroa-Viramontes et al., 2009). This means that the amountf N that can potentially be incorporated into the soil is about 32housand metric tons, assuming a loss of 14 thousand metric tonsia ammonia volatilization during manure removal and storage.y dividing the amount of N estimated in the manure by the areaarvested by forages, we estimate that the region has an average
application rate of 384 kg N per hectare per year, from manurelone. However, nitrogen fertilizer is also applied in this region,levating the total N application rate. This is in agreement withortis et al. (2009a, 2009b), which reported an average manurepplication rate of over 100 t ha−1 for this region.
It is clear that with this quantity of nitrogen, the operation ofhis intensive forage system needs to include adequate nitrogen
anagement to avoid the development of a dairy forage opera-ion that impacts the health of the local human population andhe environment. Nutrient managers and farmers in this regionre in need of a quick tool that can help improve the manage-ent of manure to reduce N losses via nitrate leaching. There is
need for tools that can assist in the conduction of quick evalu-tions of the environmental impacts of this animal waste to helpurn this waste handling problem into a resource that could be usedo fertilize most of La Laguna region, and to help recycle nutrientsrom milk production into the forages used to feed the animals.his change in operations is necessary if this key dairy region ofexico is to reduce its risk of environmental pollution from reactive
itrogen.A common management practice in this region is to apply
anure at extremely high rates, rates greater than 100 t ha−1, inddition to applying fertilizers at conventional rates (Fortis et al.,009a, 2009b). These management practices are unsustainable and
ead to significant losses of reactive nitrogen that impact the envi-onment. Li et al. (2007) found that N leaching can be as high asearly 20% of the applied N fertilizer when nitrogen is applied event lower rates than those that are being used across La Laguna.dditionally, Delgado et al. (2010a) reported that average nitro-en losses from fertilizer applications are around 30%, and these0% losses were reported for lower N application rates than thosesed in La Laguna.
The excessively high application rates used across this key dairyegion will pose a large risk of nitrate leaching and impactingroundwater. De Paz et al. (2009) reported that in a Mediterraneanegion in Spain there was a correlation between over-application of
itrogen and high nitrate levels in groundwater resources. Severalocal studies conducted across La Laguna a few years earlier hadound high nitrate levels in groundwater (from <10 to 274 mg L−1),hich have been attributed to these excessive manure and fer-
ems and Environment 142 (2011) 352– 364 353
tilizer application rates to forage systems (Martínez et al., 2006;Cueto et al., 2005a). Since this region uses irrigation for fieldsthat are level, with average slopes lower than 5%, the rates of soilerosion and phosphorous loss have not been identified as a signif-icant threat to the environment when compared to the higher rateof nitrate leaching losses, which is already impacting importantgroundwater resources used for drinking water (Martínez et al.,2006; Cueto et al., 2005b).
Scientists and extension agents could work in cooperation withfarmers to develop and test best nitrogen management practicesacross commercial fields, that if implemented could contribute toreductions in nitrate leaching and protect groundwaters (Delgado,1998, 2001; Delgado et al., 2001; Newton et al., 2003; Petersenet al., 2007). Meisinger and Delgado (2002) presented a series ofprinciples for managing nitrogen to reduce nitrate leaching losses.These principles were shown by Ferguson et al. (2005) to be appli-cable to manure handling operations using a sufficient manure rateestimated from an N balance that considers crop yield goal, resid-ual soil N and available N in the manure. In La Laguna, Marquezet al. (2006) found that a single application of 70 t ha−1 of manurereleases 25% of the total N in a spring–summer corn season and15% in an autumn–winter oats season. Similar rates of release wereestimated by Eghball et al. (2002) for other areas of the USA. How-ever, to conduct good nitrogen management nutrient managers willneed to consider regional variability of the nitrogen content in themanure, such as the variability that was reported in Davis et al.(2002), which compared N content in the Midwest and westernUnited States.
A Nitrogen Index offers a similar approach to estimating nutri-ent balances as the Phosphorous Index (Heathwaite et al., 2000;Shaffer and Delgado, 2002). The Phosphorous Index is a tool thathelps improve manure management and reduce impacts to theenvironment (Sharpley et al., 1999, 2001; Heathwaite et al., 2000).Nitrogen indexes are a similar approach to fertilizer and/or manuremanagement that focuses on evaluating how the N cycle respondsto different scenarios; these tools can be used to help users selectmanagement practices that reduce N losses to the environment(Shaffer and Delgado, 2002; Delgado et al., 2006, 2008).
2. Description of the Nitrogen Index
What a Nitrogen Index is. Similar to a Phosphorous Index, a Nitro-gen Index is a tool/approach that can be used to quickly identifyagricultural fields at greatest risk for nitrogen loss, especially lossesvia nitrate leaching, which can impact groundwater (Heathwaiteet al., 2000; Shaffer and Delgado, 2002; Wu et al., 2005; Delgadoet al., 2006, 2008). As with the Phosphorous Index, the key to havinga robust Nitrogen Index is to identify the minimum set of param-eters and conditions needed for a good-quality assessment. Forexample, it is well-known that nitrogen losses sometimes occurfrom hot spots, or areas that have a higher nitrate leaching poten-tial, but denitrification losses could occur from areas with lowernitrate leaching potential, while ammonia volatilization will occurin areas where applied nitrogen has not been incorporated, andvolatilization will be driven by the type of nitrogen applied and thesoil pH (Meisinger and Randall, 1991; Peoples et al., 1995; Delgado,2001). These hot spots for leaching and/or denitrification are asso-ciated with hydrological soil properties that may be characteristicof a sandy coarse soil (higher risk of leaching) or heavier clay soil(higher risk of denitrification).
For nitrate leaching to occur, water movement must also occur,
and there must be nitrate available to leach. For denitrification,there must also be lack of oxygen, a carbon substrate, and otherkey parameters to drive denitrification (Mosier and Klemedtsson,1994; Mosier et al., 2002; Steele and Vallis, 1988; Firestone, 1982).
354 U. Figueroa-Viramontes et al. / Agriculture, Ecosys
Table 1Selected inputs of soil, crop (forage), manure and other parameters entered into theNitrogen Index.a
Nitrogen Index screen Input datab
Soilinformation
1. Soil depth2. Percent organic matter3. Nitrate and ammonium concentrations4. Bulk density5. Soil pH
Crop (forage) 1. Current crop type(s) and previous crop type(s)c
2. Rooting depth3. Yield4. Amount of incorporated residue from previous
crop
Fertilizer 1. Fertilizer type/method of applicationc
2. Nitrogen rate
Manure 1. Manure or compost typec
2. Amount of manure (rate)3. Method of applicationd
Irrigation 1. Irrigation typec
2. Pre-plant irrigation3. Post-plant irrigation4. Concentration of nitrates and any organics
Hydrology The hydrology screen mostly consists of dropdownselections about weather, soil hydrology type,and soil drainage characteristics. Users can enter:
1. Precipitation while forage crop growing2. Precipitation with no growing forage crop
Off-sitefactors
The Off-Site Factors screen consists mostly ofdropdown selections that describecharacteristics of the aquifer. Users can enter:
1. Annual atmospheric wet and dry deposition ratefor N
Qualitative factors The qualitative factors screen consists entirely ofdropdown selections that describe themanagement—field characteristicsc
a Some data have to be entered in English units, but the N-index program includesa unit converter to metric units. A future version of the Nitrogen Index is beingplanned that will allow all data to be entered in metric units.
b There are several default input values that can be changed by the user (seeDelgado et al., 2010b). The Mexico Nitrogen Index used all the general constants thatwere used for the California Nitrogen Index (Delgado et al., 2008), with a few excep-tions. First, the mineralization of organic matter per every one percent of organicmatter was set to 22 kg N ha−1 year−1. Second, all the mineralization of N for all of thedairy manure was set at 40 and 10% for the first and second year, respectively, whilethe N mineralization rate for compost was set at 20 and 5% for the first and secondy
lcfp
dODIecett
pe
ear, respectively. Third, the atmospheric N deposition was set at 5 kg N ha−1 year−1.c Dropdown menu.d Radio button.
In addition to being a tool for estimating potential nitrogenosses for a site-specific scenario, a Nitrogen Index is also an edu-ational tool. A Nitrogen Index can facilitate discussions betweenarmers, managers, and scientists about the effects managementractices could have on nitrogen losses.
How a Nitrogen Index works. How a Nitrogen Index works willepend on the type of Nitrogen Index (tool/approach) being used.ur Nitrogen Index is written in the programming language JAVA.1
elgado et al. (2006, 2008) used Microsoft Excel® software. Thendex approach from De Paz et al. (2009) used GIS software. Delgadot al. (2006, 2008) tested the performance of their index for selectropping systems in the USA, Argentina, and China, while De Paz
t al. (2009) tested the performance of their index for cropping sys-ems of a Mediterranean region in Spain. Other groups have alsoested other versions of the Nitrogen Index for Canada (OMAFRA,1 Mention of trade names or commercial products in this report is solely for theurpose of providing specific information and does not imply recommendation orndorsement by the U.S. Department of Agriculture.
tems and Environment 142 (2011) 352– 364
2003, 2005), California (Wu et al., 2005), and the northeasternUnited States (Van Es et al., 2002). Shaffer and Delgado (2002) andBuczko et al. (2010) conducted a review of the capabilities andlimitations of several Nitrogen Indexes.
This paper focuses on the Mexico Nitrogen Index, and from thispoint forward in the text, when the term ‘Nitrogen Index’ is used,it will refer exclusively to the Mexico Nitrogen Index. The NitrogenIndex quickly ranks the risk of nitrogen loss in three categories:leaching, surface transport, and air transport. In the Nitrogen Index,the user navigates through a series of screens, with most screenscorresponding to a different type of input. Inputs are categorized as:(1) soil layer information; (2) manure; (3) fertilizer; (4) irrigation;(5) crop; (6) off-site factors; (7) water management/hydrology; and(8) qualitative factors.
The Nitrogen Index is very user friendly, and both the tool andaccompanying manual are available for download at the USDA–ARSwebsite: http://www.ars.usda.gov/npa/spnr/nitrogentools. Wehave a prototype of a full Spanish version and of a metric version,both of which will be available for download very soon.
The Nitrogen Index works by using basic nitrogen man-agement principles that have been published in the literature.The user manual for the Nitrogen Index describes how theseprinciples are applied, and also contains a detailed expla-nation on how to use the index. It can be downloaded at:http://www.ars.usda.gov/SP2UserFiles/ad hoc/54020700NitrogenTools/NitrogenIndex4.3.2UserManual.pdf.
The index uses quantitative and qualitative information todescribe the risk of nitrate leaching, atmospheric losses and sur-face nitrogen losses (Delgado et al., 2006, 2008). For the nitrateavailable to leach and the predicted nitrate leached, the Nitro-gen Index works similarly to the index by Pierce et al. (1991)(Delgado et al., 2006, 2008). We claim that the Mexico NitrogenIndex is new because it has: (1) expanded and combined infor-mation about forage systems in Mexico, and it is the first time ithas been used to test the effects of management on forage systems(manure management–application); (2) full Spanish and Englishsettings to expand its use across Latin-America and; (3) ease of usein English or metric system units. This is the first study to test theNitrogen Index’s performance in evaluating the effects of manage-ment practices on nitrogen losses in intensive forage systems.
3. Accounting for the nitrogen balance
Our Mexico Nitrogen Index is based on annual quantitative Nand water balances, requires little input data compared to othermodels (Cannavo et al., 2008), includes qualitative rankings, canbe adapted and calibrated to specific Mexico regions, and is verysimple to use. This tool can be used to quickly generate a nitro-gen budget for manure systems, as recommended by Ferguson etal. (2005), and assess the potential risk of nitrogen losses to theenvironment (Delgado et al., 2006, 2008).
Although the new Delgado et al. (2006, 2008) Nitrogen Indexgenerates qualitative rankings as far as the risk of leaching, atmo-spheric and surface nitrogen losses, it is also based on quantitativeN balances, similar to the annual Nitrogen Index of Pierce et al.(1991) that was included in an earlier version of the Nitrogen Leach-ing and Economic Analysis Package, or NLEAP (Shaffer et al., 1991;Delgado et al., 1998). This earlier version of NLEAP, which workedwith DOS, has since been modified and improved, and a new namehas been assigned to the program (though the acronym remains
the same): Nitrogen Losses and Environmental Assessment Pack-age (Shaffer et al., 2010; Delgado et al., 2010b). The Nitrogen Indexaccounts for the positive effects of rotations with deeper-rootedsystems (Delgado et al., 1998, 2001; Delgado, 1998; Shaffer and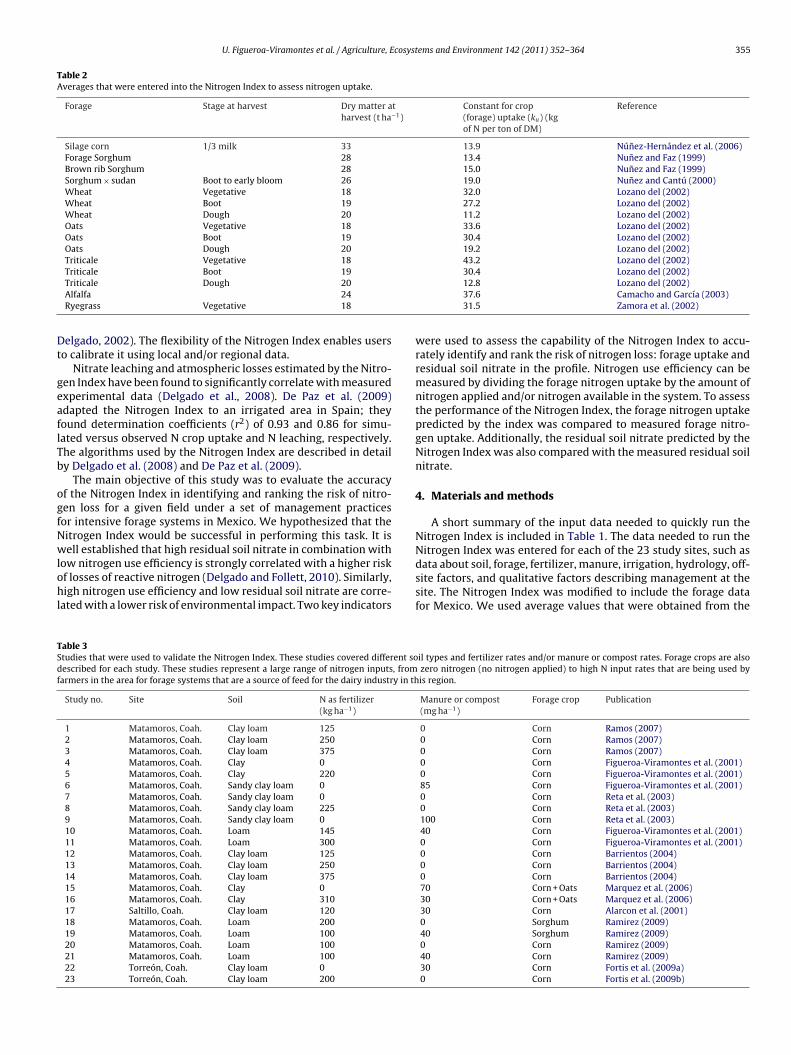
U. Figueroa-Viramontes et al. / Agriculture, Ecosystems and Environment 142 (2011) 352– 364 355
Table 2Averages that were entered into the Nitrogen Index to assess nitrogen uptake.
Forage Stage at harvest Dry matter atharvest (t ha−1)
Constant for crop(forage) uptake (ku) (kgof N per ton of DM)
Reference
Silage corn 1/3 milk 33 13.9 Núnez-Hernández et al. (2006)Forage Sorghum 28 13.4 Nunez and Faz (1999)Brown rib Sorghum 28 15.0 Nunez and Faz (1999)Sorghum × sudan Boot to early bloom 26 19.0 Nunez and Cantú (2000)Wheat Vegetative 18 32.0 Lozano del (2002)Wheat Boot 19 27.2 Lozano del (2002)Wheat Dough 20 11.2 Lozano del (2002)Oats Vegetative 18 33.6 Lozano del (2002)Oats Boot 19 30.4 Lozano del (2002)Oats Dough 20 19.2 Lozano del (2002)Triticale Vegetative 18 43.2 Lozano del (2002)Triticale Boot 19 30.4 Lozano del (2002)
Dt
geaflTb
ogfNwlohl
TSdf
Triticale Dough 20
Alfalfa 24
Ryegrass Vegetative 18
elgado, 2002). The flexibility of the Nitrogen Index enables userso calibrate it using local and/or regional data.
Nitrate leaching and atmospheric losses estimated by the Nitro-en Index have been found to significantly correlate with measuredxperimental data (Delgado et al., 2008). De Paz et al. (2009)dapted the Nitrogen Index to an irrigated area in Spain; theyound determination coefficients (r2) of 0.93 and 0.86 for simu-ated versus observed N crop uptake and N leaching, respectively.he algorithms used by the Nitrogen Index are described in detaily Delgado et al. (2008) and De Paz et al. (2009).
The main objective of this study was to evaluate the accuracyf the Nitrogen Index in identifying and ranking the risk of nitro-en loss for a given field under a set of management practicesor intensive forage systems in Mexico. We hypothesized that theitrogen Index would be successful in performing this task. It isell established that high residual soil nitrate in combination with
ow nitrogen use efficiency is strongly correlated with a higher riskf losses of reactive nitrogen (Delgado and Follett, 2010). Similarly,igh nitrogen use efficiency and low residual soil nitrate are corre-
ated with a lower risk of environmental impact. Two key indicators
able 3tudies that were used to validate the Nitrogen Index. These studies covered different soescribed for each study. These studies represent a large range of nitrogen inputs, fromarmers in the area for forage systems that are a source of feed for the dairy industry in th
Study no. Site Soil N as fertilizer(kg ha−1)
1 Matamoros, Coah. Clay loam 125
2 Matamoros, Coah. Clay loam 250
3 Matamoros, Coah. Clay loam 375
4 Matamoros, Coah. Clay 0
5 Matamoros, Coah. Clay 220
6 Matamoros, Coah. Sandy clay loam 0
7 Matamoros, Coah. Sandy clay loam 0
8 Matamoros, Coah. Sandy clay loam 225
9 Matamoros, Coah. Sandy clay loam 0
10 Matamoros, Coah. Loam 145
11 Matamoros, Coah. Loam 300
12 Matamoros, Coah. Clay loam 125
13 Matamoros, Coah. Clay loam 250
14 Matamoros, Coah. Clay loam 375
15 Matamoros, Coah. Clay 0
16 Matamoros, Coah. Clay 310
17 Saltillo, Coah. Clay loam 120
18 Matamoros, Coah. Loam 200
19 Matamoros, Coah. Loam 100
20 Matamoros, Coah. Loam 100
21 Matamoros, Coah. Loam 100
22 Torreón, Coah. Clay loam 0
23 Torreón, Coah. Clay loam 200
12.8 Lozano del (2002)37.6 Camacho and García (2003)31.5 Zamora et al. (2002)
were used to assess the capability of the Nitrogen Index to accu-rately identify and rank the risk of nitrogen loss: forage uptake andresidual soil nitrate in the profile. Nitrogen use efficiency can bemeasured by dividing the forage nitrogen uptake by the amount ofnitrogen applied and/or nitrogen available in the system. To assessthe performance of the Nitrogen Index, the forage nitrogen uptakepredicted by the index was compared to measured forage nitro-gen uptake. Additionally, the residual soil nitrate predicted by theNitrogen Index was also compared with the measured residual soilnitrate.
4. Materials and methods
A short summary of the input data needed to quickly run theNitrogen Index is included in Table 1. The data needed to run theNitrogen Index was entered for each of the 23 study sites, such as
data about soil, forage, fertilizer, manure, irrigation, hydrology, off-site factors, and qualitative factors describing management at thesite. The Nitrogen Index was modified to include the forage datafor Mexico. We used average values that were obtained from theil types and fertilizer rates and/or manure or compost rates. Forage crops are also zero nitrogen (no nitrogen applied) to high N input rates that are being used byis region.
Manure or compost(mg ha−1)
Forage crop Publication
0 Corn Ramos (2007)0 Corn Ramos (2007)0 Corn Ramos (2007)0 Corn Figueroa-Viramontes et al. (2001)0 Corn Figueroa-Viramontes et al. (2001)85 Corn Figueroa-Viramontes et al. (2001)0 Corn Reta et al. (2003)0 Corn Reta et al. (2003)100 Corn Reta et al. (2003)40 Corn Figueroa-Viramontes et al. (2001)0 Corn Figueroa-Viramontes et al. (2001)0 Corn Barrientos (2004)0 Corn Barrientos (2004)0 Corn Barrientos (2004)70 Corn + Oats Marquez et al. (2006)30 Corn + Oats Marquez et al. (2006)30 Corn Alarcon et al. (2001)0 Sorghum Ramirez (2009)40 Sorghum Ramirez (2009)0 Corn Ramirez (2009)40 Corn Ramirez (2009)30 Corn Fortis et al. (2009a)0 Corn Fortis et al. (2009b)
356U
. Figueroa-V
iramontes
et al.
/ A
griculture, Ecosystem
s and
Environment
142 (2011) 352– 364
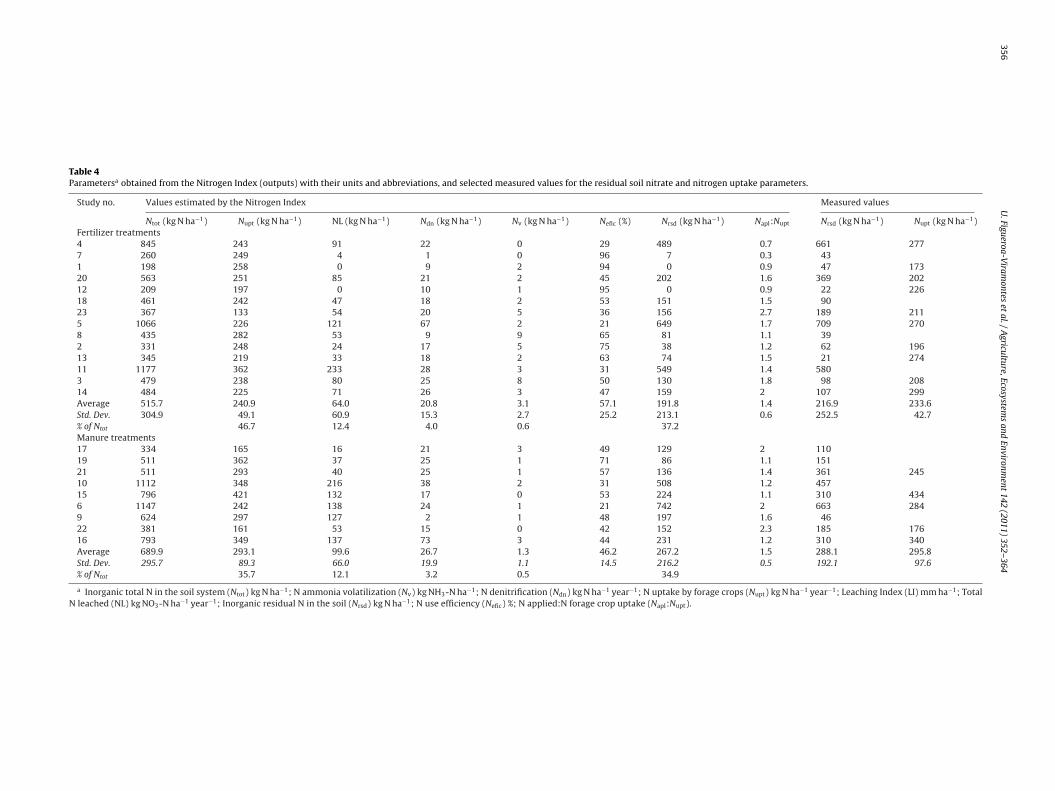
Table 4Parametersa obtained from the Nitrogen Index (outputs) with their units and abbreviations, and selected measured values for the residual soil nitrate and nitrogen uptake parameters.
Study no. Values estimated by the Nitrogen Index Measured values
Ntot (kg N ha−1) Nupt (kg N ha−1) NL (kg N ha−1) Ndn (kg N ha−1) Nv (kg N ha−1) Nefic (%) Nrsd (kg N ha−1) Napl:Nupt Nrsd (kg N ha−1) Nupt (kg N ha−1)Fertilizer treatments4 845 243 91 22 0 29 489 0.7 661 2777 260 249 4 1 0 96 7 0.3 431 198 258 0 9 2 94 0 0.9 47 17320 563 251 85 21 2 45 202 1.6 369 20212 209 197 0 10 1 95 0 0.9 22 22618 461 242 47 18 2 53 151 1.5 9023 367 133 54 20 5 36 156 2.7 189 2115 1066 226 121 67 2 21 649 1.7 709 2708 435 282 53 9 9 65 81 1.1 392 331 248 24 17 5 75 38 1.2 62 19613 345 219 33 18 2 63 74 1.5 21 27411 1177 362 233 28 3 31 549 1.4 5803 479 238 80 25 8 50 130 1.8 98 20814 484 225 71 26 3 47 159 2 107 299Average 515.7 240.9 64.0 20.8 3.1 57.1 191.8 1.4 216.9 233.6Std. Dev. 304.9 49.1 60.9 15.3 2.7 25.2 213.1 0.6 252.5 42.7% of Ntot 46.7 12.4 4.0 0.6 37.2Manure treatments17 334 165 16 21 3 49 129 2 11019 511 362 37 25 1 71 86 1.1 15121 511 293 40 25 1 57 136 1.4 361 24510 1112 348 216 38 2 31 508 1.2 45715 796 421 132 17 0 53 224 1.1 310 4346 1147 242 138 24 1 21 742 2 663 2849 624 297 127 2 1 48 197 1.6 4622 381 161 53 15 0 42 152 2.3 185 17616 793 349 137 73 3 44 231 1.2 310 340Average 689.9 293.1 99.6 26.7 1.3 46.2 267.2 1.5 288.1 295.8Std. Dev. 295.7 89.3 66.0 19.9 1.1 14.5 216.2 0.5 192.1 97.6% of Ntot 35.7 12.1 3.2 0.5 34.9
a Inorganic total N in the soil system (Ntot) kg N ha−1; N ammonia volatilization (Nv) kg NH3-N ha−1; N denitrification (Ndn) kg N ha−1 year−1; N uptake by forage crops (Nupt) kg N ha−1 year−1; Leaching Index (LI) mm ha−1; TotalN leached (NL) kg NO3-N ha−1 year−1; Inorganic residual N in the soil (Nrsd) kg N ha−1; N use efficiency (Nefic) %; N applied:N forage crop uptake (Napl:Nupt).
U. Figueroa-Viramontes et al. / Agriculture, Ecosystems and Environment 142 (2011) 352– 364 357
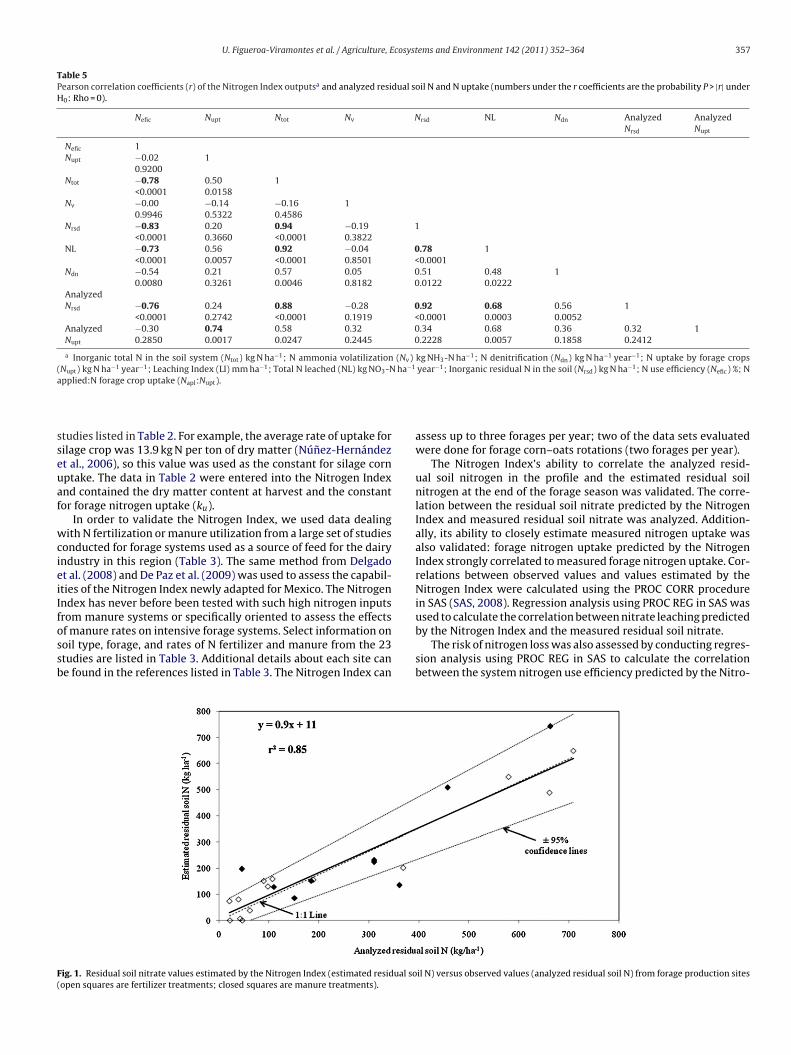
Table 5Pearson correlation coefficients (r) of the Nitrogen Index outputsa and analyzed residual soil N and N uptake (numbers under the r coefficients are the probability P > |r| underH0: Rho = 0).
Nefic Nupt Ntot Nv Nrsd NL Ndn AnalyzedNrsd
AnalyzedNupt
Nefic 1Nupt −0.02
0.92001
Ntot −0.78<0.0001
0.500.0158
1
Nv −0.000.9946
−0.140.5322
−0.160.4586
1
Nrsd −0.83<0.0001
0.200.3660
0.94<0.0001
−0.190.3822
1
NL −0.73<0.0001
0.560.0057
0.92<0.0001
−0.040.8501
0.78<0.0001
1
Ndn −0.540.0080
0.210.3261
0.570.0046
0.050.8182
0.510.0122
0.480.0222
1
AnalyzedNrsd −0.76
<0.00010.240.2742
0.88<0.0001
−0.280.1919
0.92<0.0001
0.680.0003
0.560.0052
1
AnalyzedNupt
−0.300.2850
0.740.0017
0.580.0247
0.320.2445
0.340.2228
0.680.0057
0.360.1858
0.320.2412
1
a Inorganic total N in the soil system (Ntot) kg N ha−1; N ammonia volatilization (Nv) kg NH3-N ha−1; N denitrification (Ndn) kg N ha−1 year−1; N uptake by forage crops(Nupt) kg N ha−1 year−1; Leaching Index (LI) mm ha−1; Total N leached (NL) kg NO3-N ha−1 year−1; Inorganic residual N in the soil (Nrsd) kg N ha−1; N use efficiency (Nefic) %; Na
sseuaf
wcieiIfossb
F(
pplied:N forage crop uptake (Napl:Nupt).
tudies listed in Table 2. For example, the average rate of uptake forilage crop was 13.9 kg N per ton of dry matter (Núnez-Hernándezt al., 2006), so this value was used as the constant for silage cornptake. The data in Table 2 were entered into the Nitrogen Indexnd contained the dry matter content at harvest and the constantor forage nitrogen uptake (ku).
In order to validate the Nitrogen Index, we used data dealingith N fertilization or manure utilization from a large set of studies
onducted for forage systems used as a source of feed for the dairyndustry in this region (Table 3). The same method from Delgadot al. (2008) and De Paz et al. (2009) was used to assess the capabil-ties of the Nitrogen Index newly adapted for Mexico. The Nitrogenndex has never before been tested with such high nitrogen inputsrom manure systems or specifically oriented to assess the effects
f manure rates on intensive forage systems. Select information onoil type, forage, and rates of N fertilizer and manure from the 23tudies are listed in Table 3. Additional details about each site cane found in the references listed in Table 3. The Nitrogen Index canig. 1. Residual soil nitrate values estimated by the Nitrogen Index (estimated residual soopen squares are fertilizer treatments; closed squares are manure treatments).
assess up to three forages per year; two of the data sets evaluatedwere done for forage corn–oats rotations (two forages per year).
The Nitrogen Index’s ability to correlate the analyzed resid-ual soil nitrogen in the profile and the estimated residual soilnitrogen at the end of the forage season was validated. The corre-lation between the residual soil nitrate predicted by the NitrogenIndex and measured residual soil nitrate was analyzed. Addition-ally, its ability to closely estimate measured nitrogen uptake wasalso validated: forage nitrogen uptake predicted by the NitrogenIndex strongly correlated to measured forage nitrogen uptake. Cor-relations between observed values and values estimated by theNitrogen Index were calculated using the PROC CORR procedurein SAS (SAS, 2008). Regression analysis using PROC REG in SAS wasused to calculate the correlation between nitrate leaching predicted
by the Nitrogen Index and the measured residual soil nitrate.The risk of nitrogen loss was also assessed by conducting regres-sion analysis using PROC REG in SAS to calculate the correlationbetween the system nitrogen use efficiency predicted by the Nitro-
il N) versus observed values (analyzed residual soil N) from forage production sites
358 U. Figueroa-Viramontes et al. / Agriculture, Ecosystems and Environment 142 (2011) 352– 364
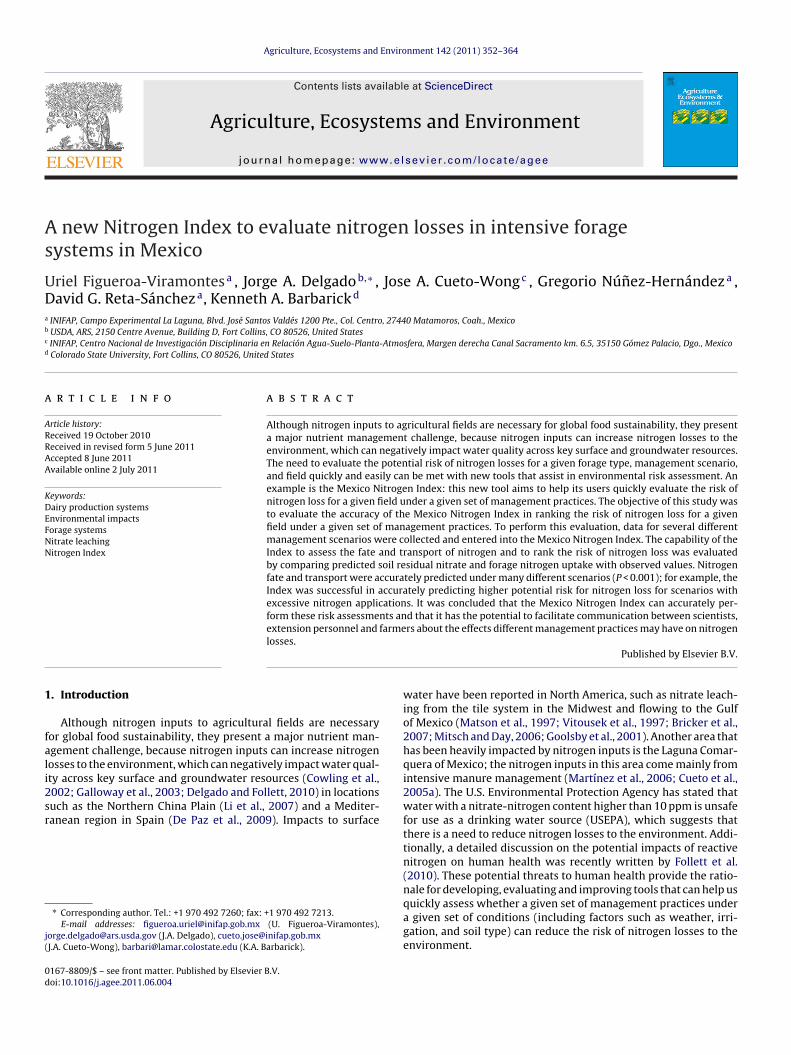
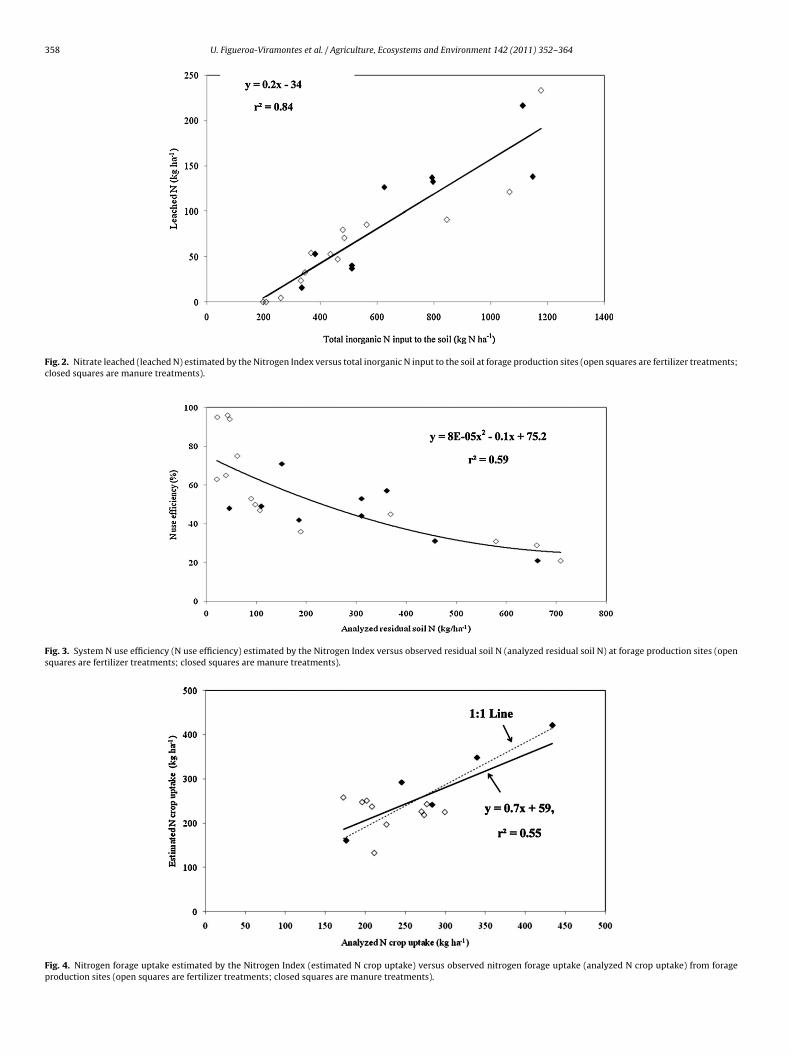
Fig. 2. Nitrate leached (leached N) estimated by the Nitrogen Index versus total inorganic N input to the soil at forage production sites (open squares are fertilizer treatments;closed squares are manure treatments).
Fig. 3. System N use efficiency (N use efficiency) estimated by the Nitrogen Index versus observed residual soil N (analyzed residual soil N) at forage production sites (opensquares are fertilizer treatments; closed squares are manure treatments).
Fig. 4. Nitrogen forage uptake estimated by the Nitrogen Index (estimated N crop uptake) versus observed nitrogen forage uptake (analyzed N crop uptake) from forageproduction sites (open squares are fertilizer treatments; closed squares are manure treatments).
U. Figueroa-Viramontes et al. / Agriculture, Ecosystems and Environment 142 (2011) 352– 364 359
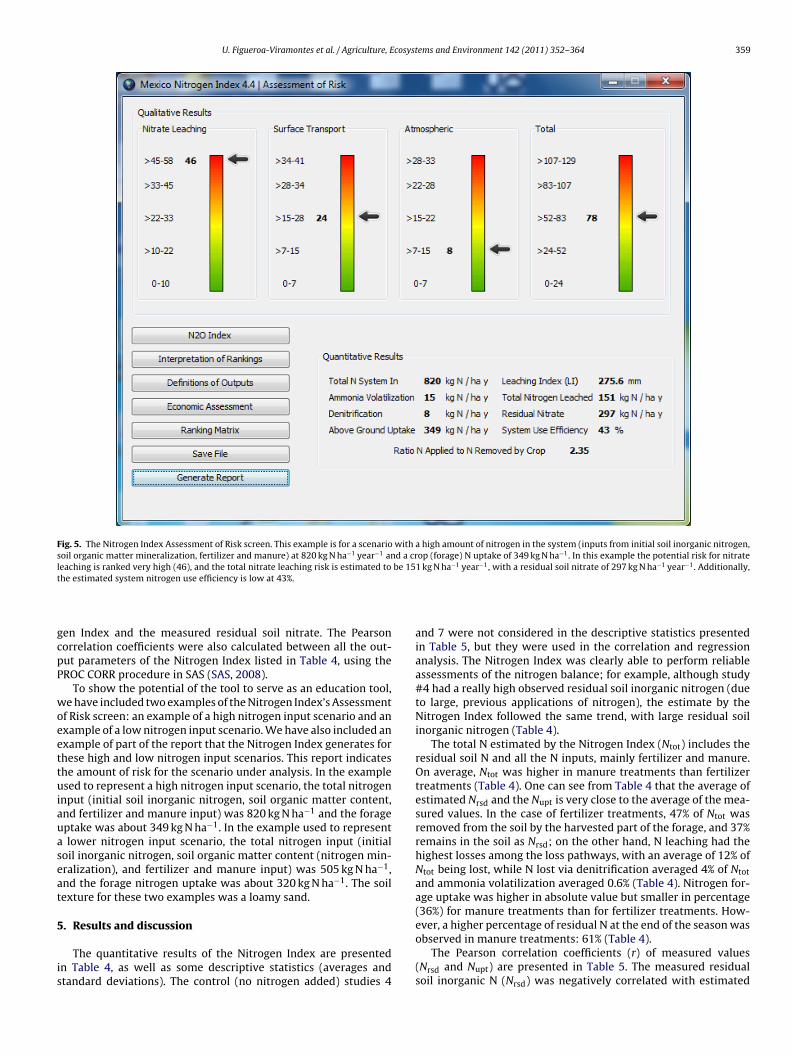
Fig. 5. The Nitrogen Index Assessment of Risk screen. This example is for a scenario with a high amount of nitrogen in the system (inputs from initial soil inorganic nitrogen,soil organic matter mineralization, fertilizer and manure) at 820 kg N ha−1 year−1 and a crop (forage) N uptake of 349 kg N ha−1. In this example the potential risk for nitrateleaching is ranked very high (46), and the total nitrate leaching risk is estimated to be 151 kg N ha−1 year−1, with a residual soil nitrate of 297 kg N ha−1 year−1. Additionally,t
gcpP
woeettuiauaseat
5
is
he estimated system nitrogen use efficiency is low at 43%.
en Index and the measured residual soil nitrate. The Pearsonorrelation coefficients were also calculated between all the out-ut parameters of the Nitrogen Index listed in Table 4, using theROC CORR procedure in SAS (SAS, 2008).
To show the potential of the tool to serve as an education tool,e have included two examples of the Nitrogen Index’s Assessment
f Risk screen: an example of a high nitrogen input scenario and anxample of a low nitrogen input scenario. We have also included anxample of part of the report that the Nitrogen Index generates forhese high and low nitrogen input scenarios. This report indicateshe amount of risk for the scenario under analysis. In the examplesed to represent a high nitrogen input scenario, the total nitrogen
nput (initial soil inorganic nitrogen, soil organic matter content,nd fertilizer and manure input) was 820 kg N ha−1 and the forageptake was about 349 kg N ha−1. In the example used to represent
lower nitrogen input scenario, the total nitrogen input (initialoil inorganic nitrogen, soil organic matter content (nitrogen min-ralization), and fertilizer and manure input) was 505 kg N ha−1,nd the forage nitrogen uptake was about 320 kg N ha−1. The soilexture for these two examples was a loamy sand.
. Results and discussion
The quantitative results of the Nitrogen Index are presentedn Table 4, as well as some descriptive statistics (averages andtandard deviations). The control (no nitrogen added) studies 4
and 7 were not considered in the descriptive statistics presentedin Table 5, but they were used in the correlation and regressionanalysis. The Nitrogen Index was clearly able to perform reliableassessments of the nitrogen balance; for example, although study#4 had a really high observed residual soil inorganic nitrogen (dueto large, previous applications of nitrogen), the estimate by theNitrogen Index followed the same trend, with large residual soilinorganic nitrogen (Table 4).
The total N estimated by the Nitrogen Index (Ntot) includes theresidual soil N and all the N inputs, mainly fertilizer and manure.On average, Ntot was higher in manure treatments than fertilizertreatments (Table 4). One can see from Table 4 that the average ofestimated Nrsd and the Nupt is very close to the average of the mea-sured values. In the case of fertilizer treatments, 47% of Ntot wasremoved from the soil by the harvested part of the forage, and 37%remains in the soil as Nrsd; on the other hand, N leaching had thehighest losses among the loss pathways, with an average of 12% ofNtot being lost, while N lost via denitrification averaged 4% of Ntot
and ammonia volatilization averaged 0.6% (Table 4). Nitrogen for-age uptake was higher in absolute value but smaller in percentage(36%) for manure treatments than for fertilizer treatments. How-ever, a higher percentage of residual N at the end of the season was
observed in manure treatments: 61% (Table 4).The Pearson correlation coefficients (r) of measured values(Nrsd and Nupt) are presented in Table 5. The measured residualsoil inorganic N (Nrsd) was negatively correlated with estimated

360 U. Figueroa-Viramontes et al. / Agriculture, Ecosystems and Environment 142 (2011) 352– 364
Fig. 6. Excerpt from an example report generated by the Nitrogen Index summarizing the information from the example Assessment of Risk screen presented in Fig. 5. Thisexample is for a scenario with a high risk of nitrogen losses to the environment. The report also provides an estimate of the monetary cost (in U.S. dollars) of the total Ns
Nnr0tutsiNg(
((gbnIpt
ncMoi
ystem (nitrate) leaching losses ($59.37) or residual soil nitrate ($116.49).
efic (−0.78), and positively correlated with the estimated systemitrogen Ntot (0.88), and the Nitrogen Index accurately estimatedesidual soil inorganic nitrogen (0.92) and nitrate leaching (NL;.68). The higher the residual soil inorganic nitrogen after harvest,he lower the nitrogen use efficiency of the intensive forage systemssed for dairy and the higher the potential to leach nitrogen intohe environment. The measured Nupt, although it did not show astrong of a correlation to the Nitrogen-Index-estimated Nupt (0.74),t still showed significant correlation (P < 0.01; Table 5). Overall, theitrogen Index performed well in assessing the measured nitro-en uptake and residual inorganic nitrogen across all of the studiesP < 0.01; Table 5).
Among the Nitrogen Index estimated values, the system total NNtot) was negatively correlated with the nitrogen use efficiencyNefic), nitrate leaching (NL) and residual soil inorganic nitro-en (Nrsd) (Table 5). In agreement with the observed correlationetween measured high residual soil inorganic nitrogen and lowitrogen use efficiencies (and high nitrogen losses), the Nitrogen
ndex estimated that there will be low use efficiency and highotential for N losses if the intensive forage system receives higherhan needed manure applications.
The Nitrogen Index was able to closely estimate the inorganicitrogen available to leach. Its predicted residual soil nitrate was
orrelated with the available soil inorganic nitrogen (NO3 + NH4).ost of the measured residual inorganic nitrogen was in the formf nitrates (90%), although is some cases up to 20% of the residualnorganic nitrogen may consist of the NH4-N form. The residual
inorganic nitrate available to leach was significantly correlatedwith the residual inorganic nitrogen (Fig. 1). The regression anal-ysis of the Nitrogen Index Nrsd had a r2 = 0.85 (P > 0.0001) and wasvery close to the 1:1 line (Fig. 1). As shown in Fig. 1, the manuretreatments had, on average, higher residual inorganic nitrogen.
Fig. 2 shows the correlation between the estimated nitrogeninputs (Ntot) and the nitrate leaching (NL) simulated by the Nitro-gen Index. It is clear that when manure and/or fertilizer nitrogenare applied at excessive rates, the risk for nitrate leaching increasessignificantly (Fig. 2). Users of the Nitrogen Index could use thiskey relationship to identify the high potential risk for off-sitenitrate leaching, and contact a nutrient management expert and/orcrop (forage) advisor who could help identify viable alternativesthat could reduce the excessive nitrogen inputs and lead to moresustainable dairy forage systems with minimal impacts on the envi-ronment.
Fig. 2 also shows that although manure systems had, on aver-age, higher nitrate leaching losses, the leaching losses are a functionof the nitrogen available to leach in the soil and the water beingleached out in these irrigation systems (an estimate of the leachedwater is also available in the Nitrogen Index, but not shown). This isin agreement with Kirchmann and Bergstrom (2001), who reportedthat nitrogen losses to the environment are dependent on the rate
of nitrogen inputs independent of the source (i.e., inorganic ororganic). This is also shown in Fig. 3 where, although on averagethe highest system use efficiencies were for the fertilizer studies, atexcessive nitrogen inputs (regardless of the source), these systems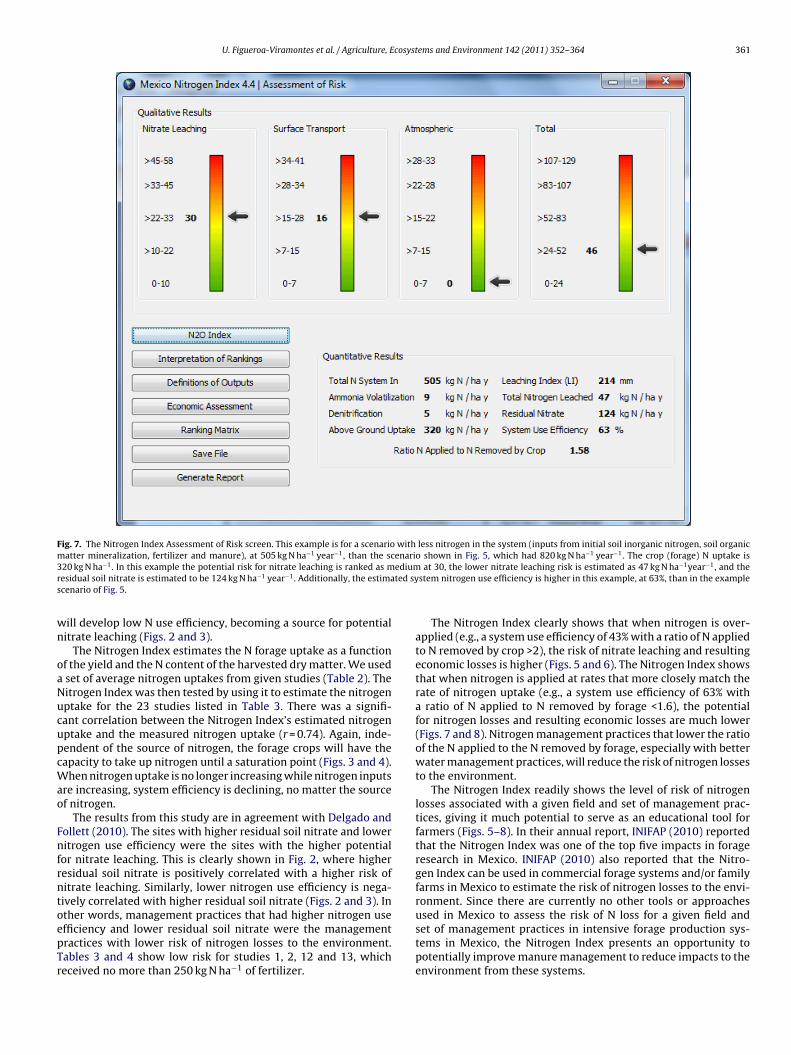
U. Figueroa-Viramontes et al. / Agriculture, Ecosystems and Environment 142 (2011) 352– 364 361
Fig. 7. The Nitrogen Index Assessment of Risk screen. This example is for a scenario with less nitrogen in the system (inputs from initial soil inorganic nitrogen, soil organicmatter mineralization, fertilizer and manure), at 505 kg N ha−1 year−1, than the scenario shown in Fig. 5, which had 820 kg N ha−1 year−1. The crop (forage) N uptake is3 −1 edium −1 −1
r ted sys
wn
oaNucupcWao
FnfrntoepTr
20 kg N ha . In this example the potential risk for nitrate leaching is ranked as mesidual soil nitrate is estimated to be 124 kg N ha−1 year−1. Additionally, the estimacenario of Fig. 5.
ill develop low N use efficiency, becoming a source for potentialitrate leaching (Figs. 2 and 3).
The Nitrogen Index estimates the N forage uptake as a functionf the yield and the N content of the harvested dry matter. We used
set of average nitrogen uptakes from given studies (Table 2). Theitrogen Index was then tested by using it to estimate the nitrogenptake for the 23 studies listed in Table 3. There was a signifi-ant correlation between the Nitrogen Index’s estimated nitrogenptake and the measured nitrogen uptake (r = 0.74). Again, inde-endent of the source of nitrogen, the forage crops will have theapacity to take up nitrogen until a saturation point (Figs. 3 and 4).
hen nitrogen uptake is no longer increasing while nitrogen inputsre increasing, system efficiency is declining, no matter the sourcef nitrogen.
The results from this study are in agreement with Delgado andollett (2010). The sites with higher residual soil nitrate and loweritrogen use efficiency were the sites with the higher potential
or nitrate leaching. This is clearly shown in Fig. 2, where higheresidual soil nitrate is positively correlated with a higher risk ofitrate leaching. Similarly, lower nitrogen use efficiency is nega-ively correlated with higher residual soil nitrate (Figs. 2 and 3). Inther words, management practices that had higher nitrogen usefficiency and lower residual soil nitrate were the management
ractices with lower risk of nitrogen losses to the environment.ables 3 and 4 show low risk for studies 1, 2, 12 and 13, whicheceived no more than 250 kg N ha−1 of fertilizer.at 30, the lower nitrate leaching risk is estimated as 47 kg N ha year , and thestem nitrogen use efficiency is higher in this example, at 63%, than in the example
The Nitrogen Index clearly shows that when nitrogen is over-applied (e.g., a system use efficiency of 43% with a ratio of N appliedto N removed by crop >2), the risk of nitrate leaching and resultingeconomic losses is higher (Figs. 5 and 6). The Nitrogen Index showsthat when nitrogen is applied at rates that more closely match therate of nitrogen uptake (e.g., a system use efficiency of 63% witha ratio of N applied to N removed by forage <1.6), the potentialfor nitrogen losses and resulting economic losses are much lower(Figs. 7 and 8). Nitrogen management practices that lower the ratioof the N applied to the N removed by forage, especially with betterwater management practices, will reduce the risk of nitrogen lossesto the environment.
The Nitrogen Index readily shows the level of risk of nitrogenlosses associated with a given field and set of management prac-tices, giving it much potential to serve as an educational tool forfarmers (Figs. 5–8). In their annual report, INIFAP (2010) reportedthat the Nitrogen Index was one of the top five impacts in forageresearch in Mexico. INIFAP (2010) also reported that the Nitro-gen Index can be used in commercial forage systems and/or familyfarms in Mexico to estimate the risk of nitrogen losses to the envi-ronment. Since there are currently no other tools or approachesused in Mexico to assess the risk of N loss for a given field andset of management practices in intensive forage production sys-
tems in Mexico, the Nitrogen Index presents an opportunity topotentially improve manure management to reduce impacts to theenvironment from these systems.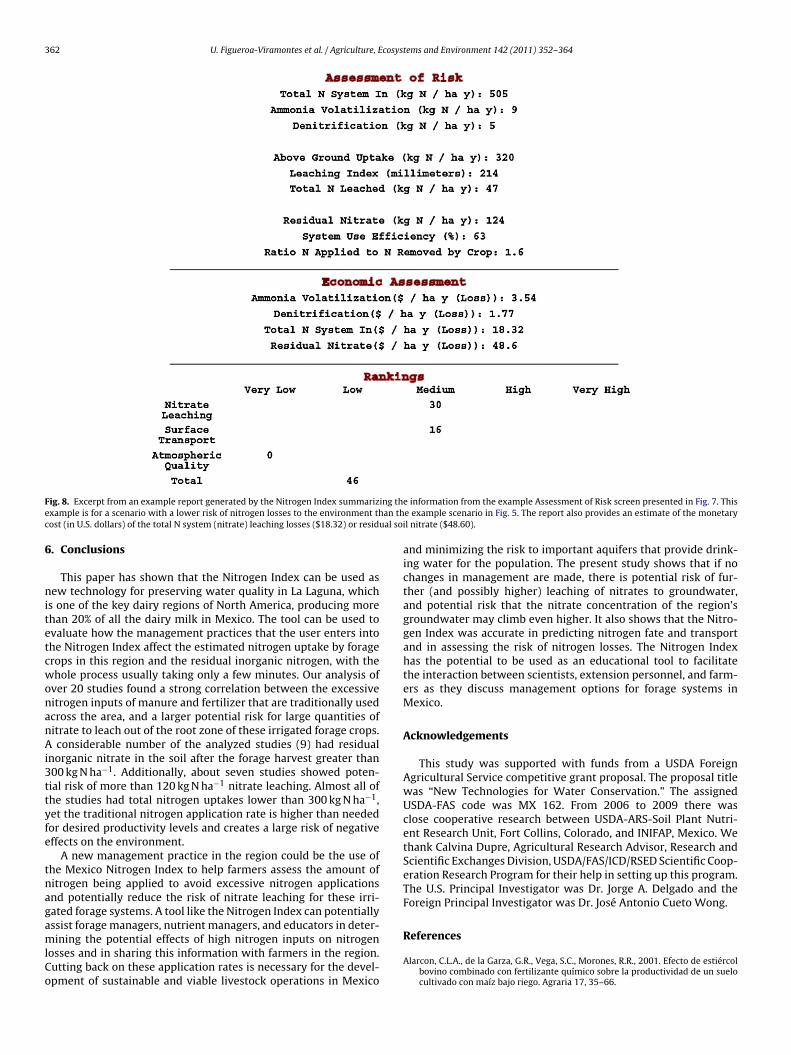
362 U. Figueroa-Viramontes et al. / Agriculture, Ecosystems and Environment 142 (2011) 352– 364
F ing the an thc ual soi
6
nitetcwonanAi3ttyfe
tnagamlCo
ig. 8. Excerpt from an example report generated by the Nitrogen Index summarizxample is for a scenario with a lower risk of nitrogen losses to the environment thost (in U.S. dollars) of the total N system (nitrate) leaching losses ($18.32) or resid
. Conclusions
This paper has shown that the Nitrogen Index can be used asew technology for preserving water quality in La Laguna, which
s one of the key dairy regions of North America, producing morehan 20% of all the dairy milk in Mexico. The tool can be used tovaluate how the management practices that the user enters intohe Nitrogen Index affect the estimated nitrogen uptake by foragerops in this region and the residual inorganic nitrogen, with thehole process usually taking only a few minutes. Our analysis of
ver 20 studies found a strong correlation between the excessiveitrogen inputs of manure and fertilizer that are traditionally usedcross the area, and a larger potential risk for large quantities ofitrate to leach out of the root zone of these irrigated forage crops.
considerable number of the analyzed studies (9) had residualnorganic nitrate in the soil after the forage harvest greater than00 kg N ha−1. Additionally, about seven studies showed poten-ial risk of more than 120 kg N ha−1 nitrate leaching. Almost all ofhe studies had total nitrogen uptakes lower than 300 kg N ha−1,et the traditional nitrogen application rate is higher than neededor desired productivity levels and creates a large risk of negativeffects on the environment.
A new management practice in the region could be the use ofhe Mexico Nitrogen Index to help farmers assess the amount ofitrogen being applied to avoid excessive nitrogen applicationsnd potentially reduce the risk of nitrate leaching for these irri-ated forage systems. A tool like the Nitrogen Index can potentiallyssist forage managers, nutrient managers, and educators in deter-
ining the potential effects of high nitrogen inputs on nitrogenosses and in sharing this information with farmers in the region.utting back on these application rates is necessary for the devel-pment of sustainable and viable livestock operations in Mexico
e information from the example Assessment of Risk screen presented in Fig. 7. Thise example scenario in Fig. 5. The report also provides an estimate of the monetaryl nitrate ($48.60).
and minimizing the risk to important aquifers that provide drink-ing water for the population. The present study shows that if nochanges in management are made, there is potential risk of fur-ther (and possibly higher) leaching of nitrates to groundwater,and potential risk that the nitrate concentration of the region’sgroundwater may climb even higher. It also shows that the Nitro-gen Index was accurate in predicting nitrogen fate and transportand in assessing the risk of nitrogen losses. The Nitrogen Indexhas the potential to be used as an educational tool to facilitatethe interaction between scientists, extension personnel, and farm-ers as they discuss management options for forage systems inMexico.
Acknowledgements
This study was supported with funds from a USDA ForeignAgricultural Service competitive grant proposal. The proposal titlewas “New Technologies for Water Conservation.” The assignedUSDA-FAS code was MX 162. From 2006 to 2009 there wasclose cooperative research between USDA-ARS-Soil Plant Nutri-ent Research Unit, Fort Collins, Colorado, and INIFAP, Mexico. Wethank Calvina Dupre, Agricultural Research Advisor, Research andScientific Exchanges Division, USDA/FAS/ICD/RSED Scientific Coop-eration Research Program for their help in setting up this program.The U.S. Principal Investigator was Dr. Jorge A. Delgado and theForeign Principal Investigator was Dr. José Antonio Cueto Wong.
References
Alarcon, C.L.A., de la Garza, G.R., Vega, S.C., Morones, R.R., 2001. Efecto de estiércolbovino combinado con fertilizante químico sobre la productividad de un suelocultivado con maíz bajo riego. Agraria 17, 35–66.
cosyst
B
B
B
C
C
C
C
C
D
D
D
D
D
D
D
D
D
D
D
E
F
F
F
F
F
F
U. Figueroa-Viramontes et al. / Agriculture, E
arrientos, R.J.L., 2004. Producción y calidad de maíz forrajero (Zea mays L.) enrespuesta a diferentes densidades de población y dosis de fertilización nitro-genada. Tesis de Maestría en Ciencias (Master in Science Thesis). UniversidadJuarez del Estado de Durango, Facultad de Agricultura y Zootecnia, 115 pp.
ricker, S., Longstaff, B., Dennison, W., Jones, A., Boicourt, K., Wicks, C., Woerner,J., 2007. Effects of Nutrient Enrichment in the Nation’s Estuaries: A Decade ofChange. National Centers for Coastal Ocean Science, Silver Spring, MD (NOAACoastal Ocean Program Decision Analysis Series No. 26).
uczko, U., Kuchenbuch, R.O., Lennartz, B., 2010. Assessment of the predictive qualityof simple indicator approaches for nitrate leaching from agricultural fields. J.Environ. Manage. 91, 1305–1315.
amacho, G.J.L., García, M.J.G., 2003. Dry matter yield and nutritive value of fouralfalfa varieties associated with White clover, perennial ryegrass, tall fescue andorchard grass. Vet. Mexico 34, 149–177.
annavo, P., Recous, S., Parnaudeau, V., Reau, R., 2008. Modeling N dynamics to assessenvironmental impacts of cropped soils. Adv. Agron. 97, 131–174.
owling F E., Galloway J., Furiness C., Erisman J.W., 2002. Optimizingnitrogen management and energy production and environmentalprotection: Report from the Second International Nitrogen Con-ference Bolger Center, Potomac, Maryland, 14–18 October 2002,http://www.initrogen.org/fileadmin/user upload/Second N Conf Report.pdf.(Verified 16 November 2010).
ueto, W.J.A., Castellanos, J.Z., Figueroa, U., Cortés, J.M., Reta, D.G., Valenzuela, C.,2005a. Uso Sustentable de Desechos Orgánicos en Sistemas de Producción Agrí-cola. Folleto Técnico, INIFAP-CENID-RASPA.
ueto, W.J.A., Reta, S.D.G., Gonzalez, C.G., Orona, C.I., Estrada, A.J., 2005b. Caracteris-ticas químicas de aguas de pozos profundos del acuífero de Villa Juarez, Durango.AGROFAZ 5, 869–874.
avis, J.G., Iversonand, K.V., Vigil, M.F., 2002. Nutrient variability in manures: impli-cations for sampling and regional databases creation. J. Soil Water Conserv. 57,479–484.
e Paz, J.M., Delgado, J.A., Ramos, C., Shaffer, M.J., Barbarick, K.K., 2009. Use of anew Nitrogen Index—GIS assessment for evaluation of nitrate leaching across aMediterranean region. J. Hydrol. 365, 183–194.
elgado, J.A., Follett, R.F. (Eds.), 2010. Advances in Nitrogen Management for WaterQuality. Soil and Water Conservation Society, Ankeny, IA.
elgado, J.A., Del Grosso, S.J., Ogle, S.M., 2010a. 15N Isotopic crop residue cyclingstudies suggest that IPCC methodologies to assess N2O-N emissions should bereevaluated. Nutr. Cycling Agroecosyst. 86, 383–390.
elgado, J.A., Shaffer, M.J., Brodahl, M.K., 1998. New NLEAP for shallow and deeprooted rotations. J. Soil Water Conserv. 53, 338–340.
elgado, J.A., 1998. Sequential NLEAP simulations to examine effect of early andlate planted winter cover crops on nitrogen dynamics. J. Soil Water Conserv. 53,241–244.
elgado, J.A., 2001. Use of simulations for evaluation of best management practiceson irrigated cropping systems. In: Shaffer, M.J., Ma, L., Hansen, S. (Eds.), ModelingCarbon and Nitrogen Dynamics for Soil Management. Lewis Publishers, BocaRaton, FL, pp. 355–381.
elgado, J.A., Gagliardi, P., Shaffer, M.J., Cover, H., Hesketh, E., Ascough, J.C., Daniel,B.M., 2010b. New tools to assess nitrogen management for conservation of ourbiosphere. In: Delgado, J.A., Follett, R.F. (Eds.), Advances in Nitrogen Manage-ment for Water Quality. SWCS, Ankeny, Iowa.
elgado, J.A., Shaffer, M., Hu, C., Lavado, R.S., Cueto-Wong, J., Joosse, P., Li, X., Rimski-Korsakov, H., Follett, R., Colon, W., Sotomayor, D., 2006. A decade of change innutrient management: a new nitrogen index. J. Soil Water Conserv. 61, 66A–75A.
elgado, J.A., Shaffer, M., Hu, C., Lavado, R., Cueto-Wong, J., Joosse, P., Sotomayor,D., Colon, W., Follett, R., DelGrosso, S., Li, X., Rimski-Korsakov, H., 2008. Anindex approach to assess nitrogen losses to the environment. Ecol. Eng. 32,108–120.
elgado, J.A., Riggenbach, R.R., Sparks, R.T., Dillon, M.A., Kawanabe, L.M., Ristau, R.J.,2001. Evaluation of nitrate-nitrogen transport in a potato–barley rotation. SoilSci. Soc. Am. J. 65, 878–883.
ghball, B., Wienhold, B.J., Gilley, J.E., Eigenberg, R.A., 2002. Mineralization of manurenutrients. J. Soil Water Conserv. 57, 470–472.
erguson, R.B., Nienaber, J.A., Eigenberg, R.A., Woodbury, B.L., 2005. Long term effectsof sustained beef feedlot manure applications on soil nutrients, corn silage yield,and nutrient uptake. J. Environ. Qual. 34, 1672–1681.
igueroa-Viramontes U., Faz R., Quiroga H.M., Cueto-Wong J.A., 2001. Optimizacióndel uso de estiércol bovino en cultivos forrajeros y riesgos de contaminaciónpor nitratos. INIFAP, Campo Experimental La Laguna. Informe de Investigación(Internal Research Report). 4 pp.
igueroa-Viramontes, U., Nunez-Hernández, G., Delgado, J.A., Cueto-Wong, J.A.,Flores-Margez, J.P., 2009. Estimación de la producción de estiércol y de la excre-ción de nitrógeno, fósforo y potasio por bovino lechero en la Comarca Lagunera.In: Orona, I., Salazar, S.M., Fortis, H. (Eds.), Agricultura orgánica. , 2a ed. SMCS,Gómez Palacio, Dgo, pp. 128–151 (FAZ-UJED).
irestone, M.K., 1982. Biological denitrification. In: Stevenson, F.J. (Ed.), Nitrogenin Agricultural Soils. ASA-CSSA-SSSA, Madison, WI, pp. 289–326 (AgronomyMonograph No. 22).
ollett, J.R., Follett, R.F., Herz, W.C., 2010. Environmental and human impacts ofreactive nitrogen. In: Delgado, J.A., Follett, R.F. (Eds.), Advances in Nitrogen
Management for Water Quality. SWCS, Ankeny, IA, pp. 1–37.ortis, H.M., Leos, R.J.A., Preciado, R.P., Orona, C.I., García, S.J.A., García, H.J.L., Orozco,V.J.A., 2009a. Aplicación de abonos orgánicos en la producción de maíz forrajerocon riego por goteo. Terra Latinoamericana 27, 329–336.
ems and Environment 142 (2011) 352– 364 363
Fortis, M.H., Leos, Rodriguez, J.A., Orona, Castillo, I., García, Hernández, J.L., SalazarSosa, E., Preciado Rangel, P., Arnaldo, O.V.J., Segura, C.M.A., 2009b. Uso de Estiér-col Bovino en la Comarca Lagunera. In: Orona, I.C., Salazar, E.S., Fortis, M.H. (Eds.),Agricultura orgánica, 2a ed. SMCS, Gómez Palacio, Dgo, p. 104 (FAZ-UJED).
Galloway, J.N., Aber, J.D., Erisman, J.W., Seitzinger, S.P., Howarth, R.W., Cowling, E.B.,Cosby, B.J., 2003. The Nitrogen Cascade. Bioscience 53 (4), 341–356.
Goolsby, D.A., Battaglin, W.A., Aulenbach, B.T., Hooper, R.P., 2001. Nitrogen input tothe Gulf of Mexico. J. Environ. Qual. 30, 329–336.
Heathwaite, L., Sharpley, A., Gburek, W., 2000. A conceptual approach for integratingphosphorous and nitrogen management at watershed scales. J. Environ. Qual. 29,158–166.
Inistituto National de Investigaciones Forestales Agricolas, Pecuaris, (INIFAP)., 2010.Mexico 2010. Reporte Anual 2009 Ciencia y Tecnología para el Campo MexicanoInstituto Nacional de Investigaciones Forestales. Agrícolas y Pecuarias. ReporteAnual 2009. D.F. Publicación, México, Especial Núm. 5 ISBN 978-607-425-316-0,p. 31.
Kirchmann, H., Bergstrom, L., 2001. Do organic farming practices reduce nitrateleaching? Commun. Soil Sci. Plant Anal. 32, 997–1028.
Li, X., Hu, C., Delgado, J.A., Zhang, Y., Ouyang, Z., 2007. Increased nitrogen use effi-ciencies as a key mitigation alternative to reduce nitrate leaching in North Chinaplain. Agric. Water Manage. 89, 137–147.
Lozano del, R.A.J., 2002. Triticales forrajeros para la región lagunera. RevistaAgropecuaria Laguna. Sociedad Cooperativa Agropecuaria de la ComarcaLagunera, No. 29, nov-dic 2002. p. 4.
Marquez, R.J.L., Figueroa-Viramontes, U., Cueto-Wong, J.A., Palomo, G.A., 2006. Efi-ciencia de recuperación de nitrógeno de estiércol bovino y fertilizante en unarotación sorgo–trigo para forraje. AGROFAZ 6, 145–151.
Martínez, R.J.G., Castellanos, R.J.Z., Rivera, G.M., Núnez, H.G., Faz, C.R., 2006. Contam-inación por nitratos en acuíferos del norte de México y del Estado de Guanajuato.AGROFAZ 6, 379–387.
Matson, P.A., Parton, W.J., Power, A.G., Swift, M.J., 1997. Agricultural intensificationand ecosystem properties. Science 277, 504–509.
Meisinger, J.J., Delgado, J.A., 2002. Principles for managing nitrogen leaching. J. SoilWater Conserv. 57, 485–498.
Meisinger, J.J., Randall, G.W., 1991. Estimating nitrogen budgets for soil–crop sys-tems. In: Follett, et al. (Eds.), Managing Nitrogen for Groundwater Quality andFarm Profitability. SSSA, Madison, WI, pp. 85–124.
Mitsch, W.J., Day, J.W., 2006. Restoration of wetlands in theMississippi–Ohio–Missouri (MOM) river basin: experience and neededresearch. Ecol. Eng. 26, 55–69.
Mosier, A.R., Klemedtsson, L., 1994. Measuring denitrification in the field. In: Weaver,R.W., Angle, S., Bottomley, P., Bezdicek, Smith, S., Tabatabai, A., Wollum, A. (Eds.),Methods of Soil Analysis. Part 2. Microbiological and Biochemical Properties. SoilScience Society of America, Madison, WI, pp. 1047–1065.
Mosier, A.R., Doran, J.W., Freney, J.R., 2002. Managing soil denitrification. J. Soil WaterConserv. 57, 505–513.
Newton, G.L., Bernard, J.K., Hubbard, R.K., Allison, J.R., Lowrance, R.R., Gascho, G.J.,Gates, R.N., Vellidis, G., 2003. Managing manure nutrients through multi-cropforage production. J. Dairy Sci. 86, 2243–2252.
Nunez, H.G., Cantú, B.J.E., 2000. Produccion, composición química y digestibilidaddel forraje de sorgo x sudan de nervadura café en la Region Norte de Mexico.Tecnica Pecuaria en Mexico 38, 177–187.
Nunez H.G., Faz C.R., 1999. Respuesta multivariada de variedades de sorgo forrajero,grano y nervadura café para forraje a características agronómicas y nutricionales.Informe de Investigación (Internal Research Report). 22 pp.
Núnez-Hernández, G., Pena-Ramos, A., González-Castaneda, F., Faz-Contreras, R.,2006. Características de híbridos de maíz de alto rendimiento y calidad nutri-cional de forraje. In: Maíz forrajero de alto rendimiento y calidad nutricional.INIFAP, Libro Científico No. 3. Matamoros, Coah. México, Campo ExperimentalLa Laguna, pp. 45–97.
Ontario Ministry of Agriculture, Rural Affairs (OMAFRA), 2005. Fundamentals ofNutrient Management Training Course. Queen’s Printer, Ontario (Course mate-rials).
Ontario Ministry of Agriculture Rural Affairs (OMAFRA), 2003. NMAN software,www.omafra.gov.on.ca/english/nm/nman/default.htm Created 10 Dec 2003.Accessed 7 September 2010.
Peoples, M.B., Freney, J.R., Mosier, A.R., 1995. Minimizing gaseous losses of nitrogen.In: Bacon, P.E. (Ed.), Nitrogen Fertilization in the Environment. Marcel Dekker,Inc., New York, pp. 565–601.
Petersen, S.O., Sommer, S.G., Beline, F., Burton, C., Dach, J., Dourmad, J.Y., Leip,A., Misselbrook, T., Nicholson, F., Poulsen, H.D., Provolo, G., Sorensen, P., Vin-neras, B., Weiske, A., Bernal, M.P., Boehm, R., Juhasz, C., Mihelic, R., 2007.Recycling of livestock manure in a whole-farm perspective. Livest. Sci. 112,180–191.
Pierce, F.J., Shaffer, M.J., Halvorson, A.D., 1991. Screening procedure for estimat-ing potentially leachable nitrate-nitrogen below the root zone. In: Follett, et al.(Eds.), Managing Nitrogen for Groundwater Quality and Farm Profitability. SSSA,Madison, WI, pp. 259–283.
Ramirez, I.J.A., 2009. Evaluación de métodos de labranza primaria del suelo y apli-cación de estiércol en la producción de maíz forrajero, Tesis de Licenciatura(Bachelor degree thesis). Universidad Autónoma Agraria Antonio Narro. p. 46.
Ramos, R.A., 2007. Uso de nitrógeno en un sistema intensivo de producción de maíz(Zea mays L.) para forraje o grano, Tesis de Doctorado en Ciencias (Ph.D. Dis-sertation). Universidad Juarez del Estado de Durango, Facultad de Agricultura yZootecnia. p. 172.
3 cosys
R
S
S
S
S
S
S
64 U. Figueroa-Viramontes et al. / Agriculture, E
eta S.D.G., Figueroa-Viramontes U., Cueto-Wong J.A. 2003. Respuesta del maíz for-rajero a la aplicación de abonos orgánicos y fertilizantes químicos nitrogenados.Informe de Investigación (Internal Research Report). 5 pp.
.A.S. (Statistical Analyses System) Inst., 2008. SAS/STAT Users Guide. SAS Inst., Cary,NC, p. 4.
haffer, M.J., Delgado, J.A., 2002. Essentials of a national nitrate leaching index assess-ment tool. J. Soil Water Conserv. 57, 327–335.
haffer, M.J., Halvorson, A.D., Pierce, F.J., 1991. Nitrate leaching and economic analy-sis package (NLEAP): Model description and application. In: Follett, et al. (Eds.),Managing Nitrogen for Groundwater Quality and Farm Profitability. SSSA, Madi-son, WI, pp. 285–322.
haffer, M.J., Delgado, J.A., Gross, C., Follett, R.F., 2010. Simulation processes for theNitrogen Loss and Environmental Assessment Package. In: Delgado, J.A., Follett,R.F. (Eds.), Advances in Nitrogen Management for Water Quality. SWCS, Ankeny,IA.
harpley, A.N., Kleinman, P., McDowell, R., 2001. Innovative management of agricul-tural phosphorous to protect soil and water resources. Commun. Soil Sci. PlantAnal. 7/8 (32), 1071–1100.
harpley, A.N., Daniel, T., Sims, T., Lemunyon, J., Stevens, R., Parry, R., 1999. Agricul-tural Phosphorus and Eutrophication. USDA-ARS, ARS-149, 37 pp.
tems and Environment 142 (2011) 352– 364
Steele, K.W., Vallis, I., 1988. The nitrogen cycle in pastures. In: Wilson, J.R. (Ed.),Advances in Nitrogen Cycling in Agricultural Ecosystems. C.A.B. International,Wallingford, UK, pp. 274–291.
Van Es, H.M., Czymmek, K.J., Ketterings, Q.M., 2002. Management effects on nitrogenleaching and guidelines for a nitrogen leaching index in New York. J. Soil WaterConserv. 57, 499–504.
Van Horn, H.H., Newton, G.L., Nordstedt, R.A., French, E.C., Kidder, G., Graetz, D.A.,Chombliss, C.F., 2003. Dairy Manure Management: Strategies for RecyclingNutrients to Recover Fertilizer Value and Avoid Environment Pollution, Availableonline at: http://edu.ifas.ubl.edu/DS096. Accessed 7 September 2010.
Vitousek, P.M., Aber, J.D., Howarth, R.W., Likens, G.E., Matson, P.A., Schindler, D.W.,Schlesinger, W.H., Tilman, D.G., 1997. Human alteration of the global nitrogencycle: sources and consequences. Ecol. Appl. 73 (3), 737–750.
Wu, L., Letey, J., French, C., Wood, Y., Bikie, D., 2005. Nitrate leaching haz-ard index developed for irrigated agriculture. J. Soil Water Conserv. 60,
90A–95A.Zamora, V.V.M., Lozano, R.A.J., Lopez, B.A., Reyes, V.M.H., Diaz, S.H., Martinez, R.J.M.,Fuentes, R.J.M., 2002. Classification of forage triticales in accordance with drymatter yield and nutritional quality in two locations in Coahuila. Tec. Pecu. Mex.40, 229–242.
Related Documents