27 A NEW NATIONAL INDEX OF CONSUMER PRICES AND 10 YEARS OF THE HICP A new national index of consumer prices and 10 years of the HICP D. Cornille * Introduction This article discusses recent developments in regard to measures of inflation, both in Europe in general and in Belgium in particular. The introduction of a new national index of consumer prices (NICP) in Belgium at the start of 2006 and almost 10 years of application of the harmon- ised index of consumer prices (HICP) at European level constitute an opportune moment to look back over recent methodological developments, in order to highlight the progress made and underline the challenges still to be tackled. Although methodology lies at the heart of this subject, it is equally relevant from an economic perspec- tive because of the key roles played by both the HICP and NICP. The article starts by explaining some basic principles and describing the two inflation measures simultaneously used in Belgium, namely the NICP and HICP, before discussing a number of aspects of the recent reform of the NICP. 1. Coexistence of the national index of consumer prices and the harmonised index In Belgium, the NICP has a long history dating back to 1920, the year in which the first index (base 1914 = 100) was published. Of course, the methodology has under- gone many changes, as has the way in which the index is used. At present the NICP and, since 1994, its variant known as the “health index”, forms the point of refer- ence for everything related to the indexation of wages and salaries, social security benefits, rents, and so on, with a view to protecting households’ purchasing power. For this reason, the drawing up and calculation of the NICP are based on consultation between the social part- ners within the Index Committee and the National Labour Council. This consultation is a uniquely Belgian phenom- enon, which has existed in various forms since the incep- tion of the index. In practice, the NICP is calculated each month by the FPS Economy, SMEs, Self-employed and Energy, accord- ing to the methodology approved by the Minister for the Economy on the advice of the Index Committee. The index is only published once it has been approved by the Index Committee. In the event of disagreement at Committee level, it is the Minister for the Economy who must make the final decision. Like Belgium, the other European countries have con- sumer price indices with their own specific features and there are sometimes significant methodological differ- ences between countries. These disparities were even more pronounced some ten years ago, creating a need to harmonise the national indices within the EU. So the HICP was born (1) . This index has been published since 1997, and retropolated data have been available since 199 (and for some countries from as early as 1990). The HICP was initially used in connection with the convergence criteria set out in the Maastricht Treaty (2) , and still plays a role in this regard for the new members * The author wishes to thank M. Collin and L. Aucremanne for their contribution to this article. (1) In accordance with Council Regulation (EC) no.2494 / 9, implemented in January 1997. (2) The Treaty dates back to 1992, prior to the introduction of the HICP, but already referred to inflation being calculated using the index of consumer prices on a comparable basis.

Welcome message from author
This document is posted to help you gain knowledge. Please leave a comment to let me know what you think about it! Share it to your friends and learn new things together.
Transcript

27
A NEw NATiONAl iNdEx Of CONsumEr priCEs ANd 10 yEArs Of ThE hiCp
A new national index of consumer prices and 10 years of the HICP
d. cornille *
Introduction
This article discusses recent developments in regard to measures of inflation, both in Europe in general and in Belgium in particular. The introduction of a new national index of consumer prices (NICP) in Belgium at the start of 2006 and almost 10 years of application of the harmon-ised index of consumer prices (HICP) at European level constitute an opportune moment to look back over recent methodological developments, in order to highlight the progress made and underline the challenges still to be tackled. Although methodology lies at the heart of this subject, it is equally relevant from an economic perspec-tive because of the key roles played by both the HICP and NICP.
The article starts by explaining some basic principles and describing the two inflation measures simultaneously used in Belgium, namely the NICP and HICP, before discussing a number of aspects of the recent reform of the NICP.
1. Coexistence of the national index of consumer prices and the harmonised index
In Belgium, the NICP has a long history dating back to 1920, the year in which the first index (base 1914 = 100) was published. Of course, the methodology has under-gone many changes, as has the way in which the index is used. At present the NICP and, since 1994, its variant known as the “health index”, forms the point of refer-ence for everything related to the indexation of wages and salaries, social security benefits, rents, and so on, with a view to protecting households’ purchasing power.
For this reason, the drawing up and calculation of the NICP are based on consultation between the social part-ners within the Index Committee and the National Labour Council. This consultation is a uniquely Belgian phenom-enon, which has existed in various forms since the incep-tion of the index.
In practice, the NICP is calculated each month by the FPS Economy, SMEs, Self-employed and Energy, accord-ing to the methodology approved by the Minister for the Economy on the advice of the Index Committee. The index is only published once it has been approved by the Index Committee. In the event of disagreement at Committee level, it is the Minister for the Economy who must make the final decision.
Like Belgium, the other European countries have con-sumer price indices with their own specific features and there are sometimes significant methodological differ-ences between countries. These disparities were even more pronounced some ten years ago, creating a need to harmonise the national indices within the EU.
So the HICP was born (1). This index has been published since 1997, and retropolated data have been available since 199� (and for some countries from as early as 1990). The HICP was initially used in connection with the convergence criteria set out in the Maastricht Treaty (2), and still plays a role in this regard for the new members
* The author wishes to thank M. Collin and L. Aucremanne for their contribution to this article.
(1) In accordance with Council Regulation (EC) no.2494 / 9�, implemented in January 1997.
(2) The Treaty dates back to 1992, prior to the introduction of the HICP, but already referred to inflation being calculated using the index of consumer prices on a comparable basis.
28
of the EU wishing to join the euro area (1). Since the start of phase 3 of European Monetary Union, this index has been directly applied in the quantitative definition of price stability in the euro area, which is a central element of the monetary policy strategy of the Eurosystem. In fact, the ECB’s Governing Council defined price stability as a situation in which the year-on-year rise in the HICP for the euro area is maintained, over the medium term, below, but close to, 2 p.c.
The HICP of the EU Member States are calculated at national level, but using methodologies harmonised by Eurostat and in accordance with specific European legisla-tion. Eurostat also calculates the aggregates for the EU or the euro area. In Belgium, as with the NICP, it is the FPS Economy, SMEs, Self-employed and Energy which calculates the index. The Index Committee is not involved at any stage in compiling or publishing the HICP.
The Belgian HICP is published by Eurostat, at the same time as the HICP for the other EU countries and the HICP for the euro area as a whole, of which the Belgian HICP is a component. Uniquely for the euro area, although it compiles the statistics, the FPS Economy, SMEs, Self-employed and Energy does not publish the index. This situation is regrettable, because a key variable such as the HICP certainly deserves to be better promoted by its producer.
The coexistence of two indices is not unique to Belgium, but occurs in most other countries of the EU-1�. However, there is no truly compelling argument for using two dif-ferent measures of inflation at the same time. Both from the point of view of safeguarding purchasing power – the aim of the national index – and for monetary policy purposes, inflation must be measured as accurately as possible, based on high quality standards. In fact, the two objectives are in no way contradictory – quite the opposite. The very essence of a monetary policy geared towards price stability is precisely to prevent any monetary erosion of purchasing power. In practice, however, there are considerable methodological differences between the two indices which, in certain circumstances, may result in substantial discrepancies in the measured inflation trend, which is liable to cause some confusion among the general public.
2. The main methodological principles of the two indices (2)
2.1 The concept of household final monetary consumption expenditure
The concept used for the coverage of the HICP is that of “Household Final Monetary Consumption Expendi-ture” (HFMCE). The same principle has been applied for the Belgian NICP since 1998. HFMCE is “expendi-ture incurred on goods and services that are used for the direct satisfaction of individual needs or wants of households” (Council Regulation (EC) no. 1687 / 98). In HFMCE, the reference to the notion of “monetary” means a payment must take place. The requirement for a monetary transaction to take place in order for a product to be included in the HICP reflects the idea that inflation is a monetary phenomenon, in the long term at least.
As practices differed among Member States, initially products for which the consumer does not pay the full price were not included in the HICP, although they were already being incorporated in the NICP. It was subse-quently agreed that, in accordance with the monetary concept, the prices included in the HICP should reflect the amounts actually paid by households, less refunds (e.g. the patient’s contribution). This net price concept is also applied for the NICP.
At the present time, the costs of owner occupied hous-ing are not included in the HICP (cf. Box 1) ; only rents actually paid are included and so the coverage of the HICP differs markedly from that of private consump-tion according to the national accounts, which includes imputed rents. This significant difference is due mainly to the fact that imputed rents are incompatible with the concept used for the coverage of the HICP, because they are non-monetary. The costs of owner occupied housing are not included in the NICP either.
(1) Article 1 of the Protocol on the convergence criteria of the Treaty (art. 121) stipulates : “The criterion on price stability (...) shall mean that a Member State has a price performance that is sustainable and an average rate of inflation, observed over a period of one year before the examination, that does not exceed by more than 1.� p.c. that of, at most, the three best performing Member States in terms of price stability”.
(2) See also the article by M. Druant, The Belgian HIPC: a big step towards an accurate measure of inflation, the Bank’s Economic Review, November 2001
29
A NEw NATiONAl iNdEx Of CONsumEr priCEs ANd 10 yEArs Of ThE hiCp
Box 1 – The costs of owner occupied housing
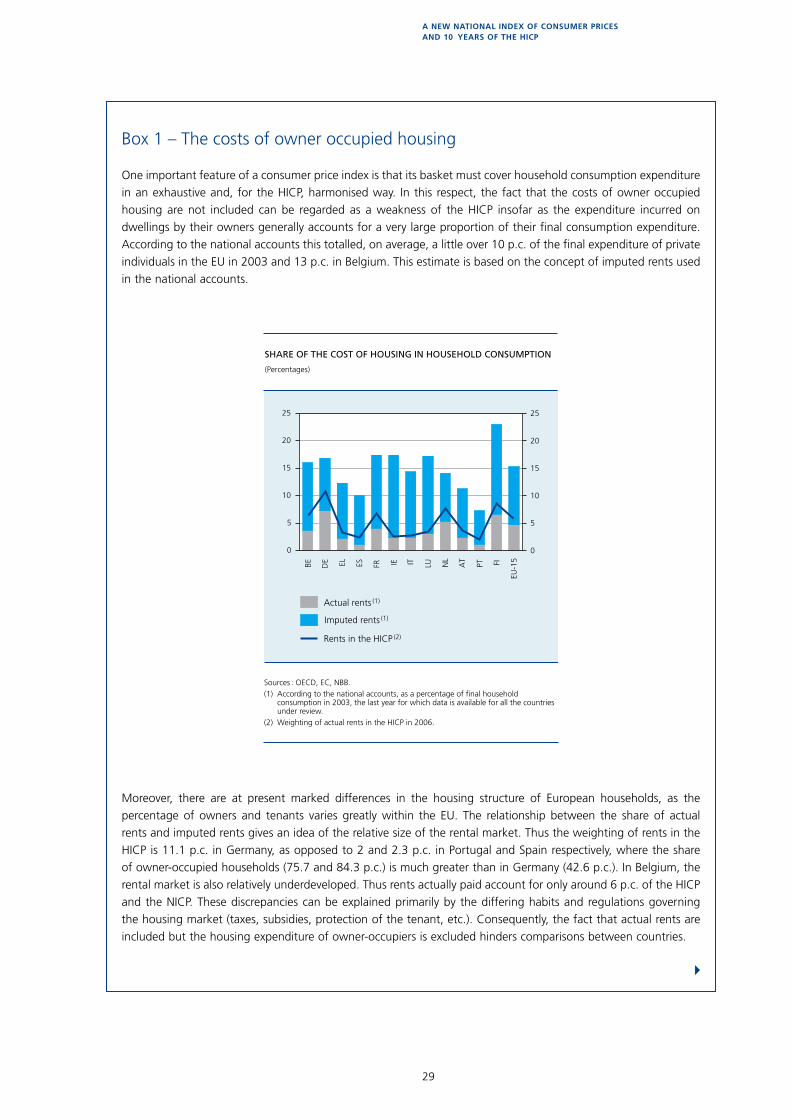
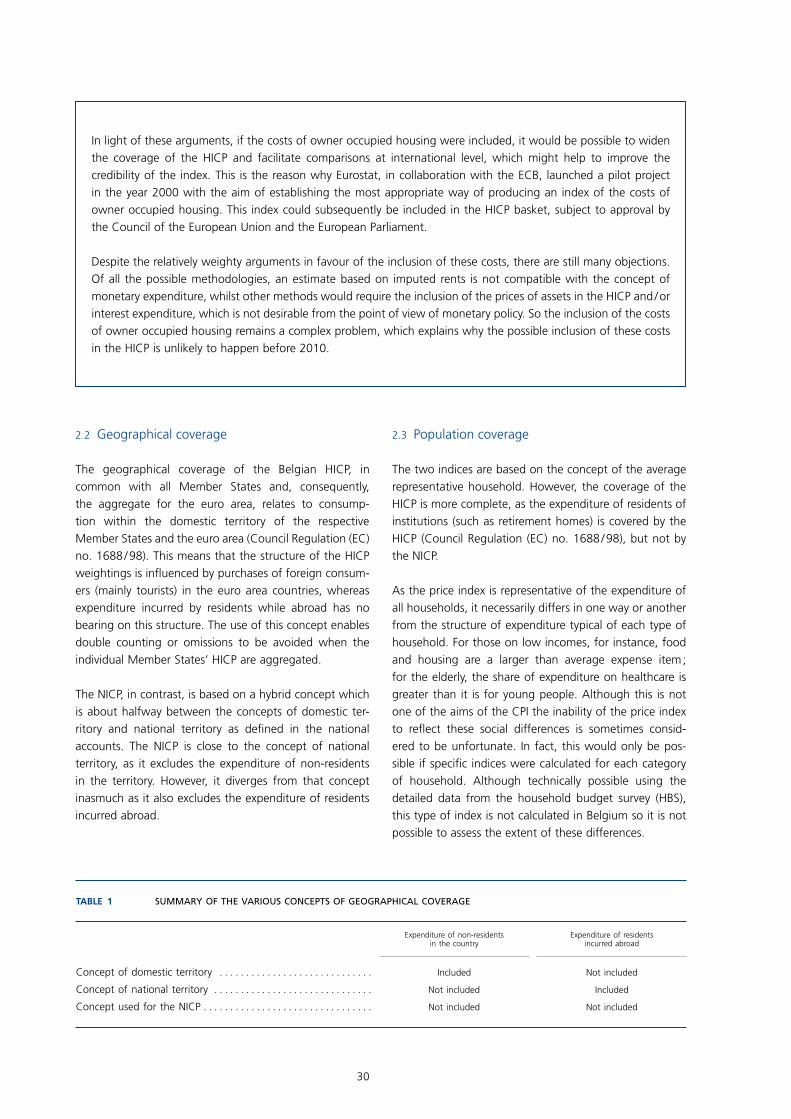
One important feature of a consumer price index is that its basket must cover household consumption expenditure in an exhaustive and, for the HICP, harmonised way. In this respect, the fact that the costs of owner occupied housing are not included can be regarded as a weakness of the HICP insofar as the expenditure incurred on dwellings by their owners generally accounts for a very large proportion of their final consumption expenditure. According to the national accounts this totalled, on average, a little over 10 p.c. of the final expenditure of private individuals in the EU in 2003 and 13 p.c. in Belgium. This estimate is based on the concept of imputed rents used in the national accounts.
Moreover, there are at present marked differences in the housing structure of European households, as the percentage of owners and tenants varies greatly within the EU. The relationship between the share of actual rents and imputed rents gives an idea of the relative size of the rental market. Thus the weighting of rents in the HICP is 11.1 p.c. in Germany, as opposed to 2 and 2.3 p.c. in Portugal and Spain respectively, where the share of owner-occupied households (7�.7 and 84.3 p.c.) is much greater than in Germany (42.6 p.c.). In Belgium, the rental market is also relatively underdeveloped. Thus rents actually paid account for only around 6 p.c. of the HICP and the NICP. These discrepancies can be explained primarily by the differing habits and regulations governing the housing market (taxes, subsidies, protection of the tenant, etc.). Consequently, the fact that actual rents are included but the housing expenditure of owner-occupiers is excluded hinders comparisons between countries.
0
5
10
15
20
25
0
5
10
15
20
25
SHARE OF THE COST OF HOUSING IN HOUSEHOLD CONSUMPTION
(Percentages)
Sources : OECD, EC, NBB.(1) According to the national accounts, as a percentage of final household
consumption in 2003, the last year for which data is available for all the countries under review.
(2) Weighting of actual rents in the HICP in 2006.
Actual rents (1)
Rents in the HICP (2)
BE DE EL ES FR IE IT LU NL
AT
PT FI
EU-1
5
Imputed rents (1)
4
30
In light of these arguments, if the costs of owner occupied housing were included, it would be possible to widen the coverage of the HICP and facilitate comparisons at international level, which might help to improve the credibility of the index. This is the reason why Eurostat, in collaboration with the ECB, launched a pilot project in the year 2000 with the aim of establishing the most appropriate way of producing an index of the costs of owner occupied housing. This index could subsequently be included in the HICP basket, subject to approval by the Council of the European Union and the European Parliament.
Despite the relatively weighty arguments in favour of the inclusion of these costs, there are still many objections. Of all the possible methodologies, an estimate based on imputed rents is not compatible with the concept of monetary expenditure, whilst other methods would require the inclusion of the prices of assets in the HICP and / or interest expenditure, which is not desirable from the point of view of monetary policy. So the inclusion of the costs of owner occupied housing remains a complex problem, which explains why the possible inclusion of these costs in the HICP is unlikely to happen before 2010.
2.2 Geographical coverage
The geographical coverage of the Belgian HICP, in common with all Member States and, consequently, the aggregate for the euro area, relates to consump-tion within the domestic territory of the respective Member States and the euro area (Council Regulation (EC) no. 1688 / 98). This means that the structure of the HICP weightings is influenced by purchases of foreign consum-ers (mainly tourists) in the euro area countries, whereas expenditure incurred by residents while abroad has no bearing on this structure. The use of this concept enables double counting or omissions to be avoided when the individual Member States’ HICP are aggregated.
The NICP, in contrast, is based on a hybrid concept which is about halfway between the concepts of domestic ter-ritory and national territory as defined in the national accounts. The NICP is close to the concept of national territory, as it excludes the expenditure of non-residents in the territory. However, it diverges from that concept inasmuch as it also excludes the expenditure of residents incurred abroad.
2.3 Population coverage
The two indices are based on the concept of the average representative household. However, the coverage of the HICP is more complete, as the expenditure of residents of institutions (such as retirement homes) is covered by the HICP (Council Regulation (EC) no. 1688 / 98), but not by the NICP.
As the price index is representative of the expenditure of all households, it necessarily differs in one way or another from the structure of expenditure typical of each type of household. For those on low incomes, for instance, food and housing are a larger than average expense item ; for the elderly, the share of expenditure on healthcare is greater than it is for young people. Although this is not one of the aims of the CPI the inability of the price index to reflect these social differences is sometimes consid-ered to be unfortunate. In fact, this would only be pos-sible if specific indices were calculated for each category of household. Although technically possible using the detailed data from the household budget survey (HBS), this type of index is not calculated in Belgium so it is not possible to assess the extent of these differences.
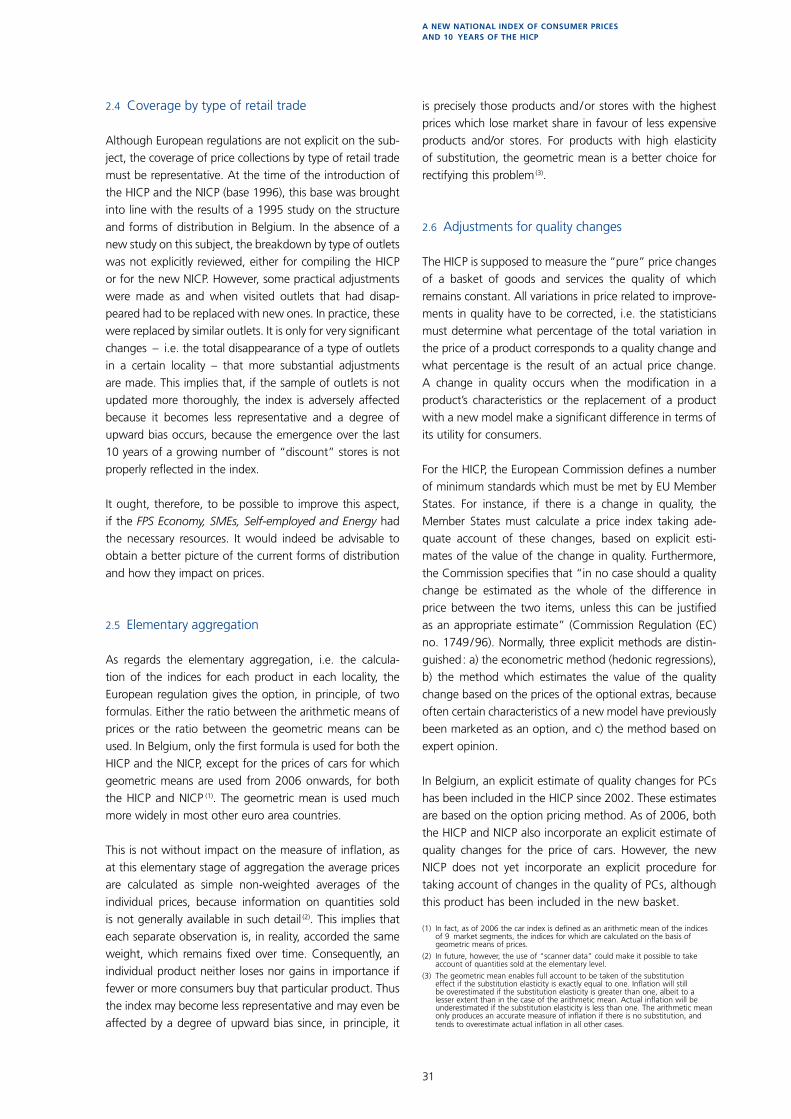
Table 1 Summary of the variouS conceptS of geographical coverage
Expenditure of non-residents in the country
Expenditure of residents incurred abroad
Concept of domestic territory . . . . . . . . . . . . . . . . . . . . . . . . . . . . . Included Not included
Concept of national territory . . . . . . . . . . . . . . . . . . . . . . . . . . . . . . Not included Included
Concept used for the NICP . . . . . . . . . . . . . . . . . . . . . . . . . . . . . . . . Not included Not included
31
A NEw NATiONAl iNdEx Of CONsumEr priCEs ANd 10 yEArs Of ThE hiCp
2.4 Coverage by type of retail trade
Although European regulations are not explicit on the sub-ject, the coverage of price collections by type of retail trade must be representative. At the time of the introduction of the HICP and the NICP (base 1996), this base was brought into line with the results of a 199� study on the structure and forms of distribution in Belgium. In the absence of a new study on this subject, the breakdown by type of outlets was not explicitly reviewed, either for compiling the HICP or for the new NICP. However, some practical adjustments were made as and when visited outlets that had disap-peared had to be replaced with new ones. In practice, these were replaced by similar outlets. It is only for very significant changes – i.e. the total disappearance of a type of outlets in a certain locality – that more substantial adjustments are made. This implies that, if the sample of outlets is not updated more thoroughly, the index is adversely affected because it becomes less representative and a degree of upward bias occurs, because the emergence over the last 10 years of a growing number of “discount” stores is not properly reflected in the index.
It ought, therefore, to be possible to improve this aspect, if the FPS Economy, SMEs, Self-employed and Energy had the necessary resources. It would indeed be advisable to obtain a better picture of the current forms of distribution and how they impact on prices.
2.� Elementary aggregation
As regards the elementary aggregation, i.e. the calcula-tion of the indices for each product in each locality, the European regulation gives the option, in principle, of two formulas. Either the ratio between the arithmetic means of prices or the ratio between the geometric means can be used. In Belgium, only the first formula is used for both the HICP and the NICP, except for the prices of cars for which geometric means are used from 2006 onwards, for both the HICP and NICP (1). The geometric mean is used much more widely in most other euro area countries.
This is not without impact on the measure of inflation, as at this elementary stage of aggregation the average prices are calculated as simple non-weighted averages of the individual prices, because information on quantities sold is not generally available in such detail (2). This implies that each separate observation is, in reality, accorded the same weight, which remains fixed over time. Consequently, an individual product neither loses nor gains in importance if fewer or more consumers buy that particular product. Thus the index may become less representative and may even be affected by a degree of upward bias since, in principle, it
is precisely those products and / or stores with the highest prices which lose market share in favour of less expensive products and/or stores. For products with high elasticity of substitution, the geometric mean is a better choice for rectifying this problem (3).
2.6 Adjustments for quality changes
The HICP is supposed to measure the “pure” price changes of a basket of goods and services the quality of which remains constant. All variations in price related to improve-ments in quality have to be corrected, i.e. the statisticians must determine what percentage of the total variation in the price of a product corresponds to a quality change and what percentage is the result of an actual price change. A change in quality occurs when the modification in a product’s characteristics or the replacement of a product with a new model make a significant difference in terms of its utility for consumers.
For the HICP, the European Commission defines a number of minimum standards which must be met by EU Member States. For instance, if there is a change in quality, the Member States must calculate a price index taking ade-quate account of these changes, based on explicit esti-mates of the value of the change in quality. Furthermore, the Commission specifies that “in no case should a quality change be estimated as the whole of the difference in price between the two items, unless this can be justified as an appropriate estimate” (Commission Regulation (EC) no. 1749 / 96). Normally, three explicit methods are distin-guished : a) the econometric method (hedonic regressions), b) the method which estimates the value of the quality change based on the prices of the optional extras, because often certain characteristics of a new model have previously been marketed as an option, and c) the method based on expert opinion.
In Belgium, an explicit estimate of quality changes for PCs has been included in the HICP since 2002. These estimates are based on the option pricing method. As of 2006, both the HICP and NICP also incorporate an explicit estimate of quality changes for the price of cars. However, the new NICP does not yet incorporate an explicit procedure for taking account of changes in the quality of PCs, although this product has been included in the new basket.
(1) In fact, as of 2006 the car index is defined as an arithmetic mean of the indices of 9 market segments, the indices for which are calculated on the basis of geometric means of prices.
(2) In future, however, the use of “scanner data” could make it possible to take account of quantities sold at the elementary level.
(3) The geometric mean enables full account to be taken of the substitution effect if the substitution elasticity is exactly equal to one. Inflation will still be overestimated if the substitution elasticity is greater than one, albeit to a lesser extent than in the case of the arithmetic mean. Actual inflation will be underestimated if the substitution elasticity is less than one. The arithmetic mean only produces an accurate measure of inflation if there is no substitution, and tends to overestimate actual inflation in all other cases.
32
Box 2 – Adjustments for quality changes in the euro area
Adjustments for quality changes pose a major challenge to statisticians. The minimum standards set by Eurostat remain relatively vague and allow the different national statistical institutes a great deal of flexibility as regards the choice of method and the choice of products requiring a correction. Given that the methods for quality adjustments applied in practice differ greatly from one EU Member State to the next, this problem remains to this day one of the main causes of incomparability of the HICP.
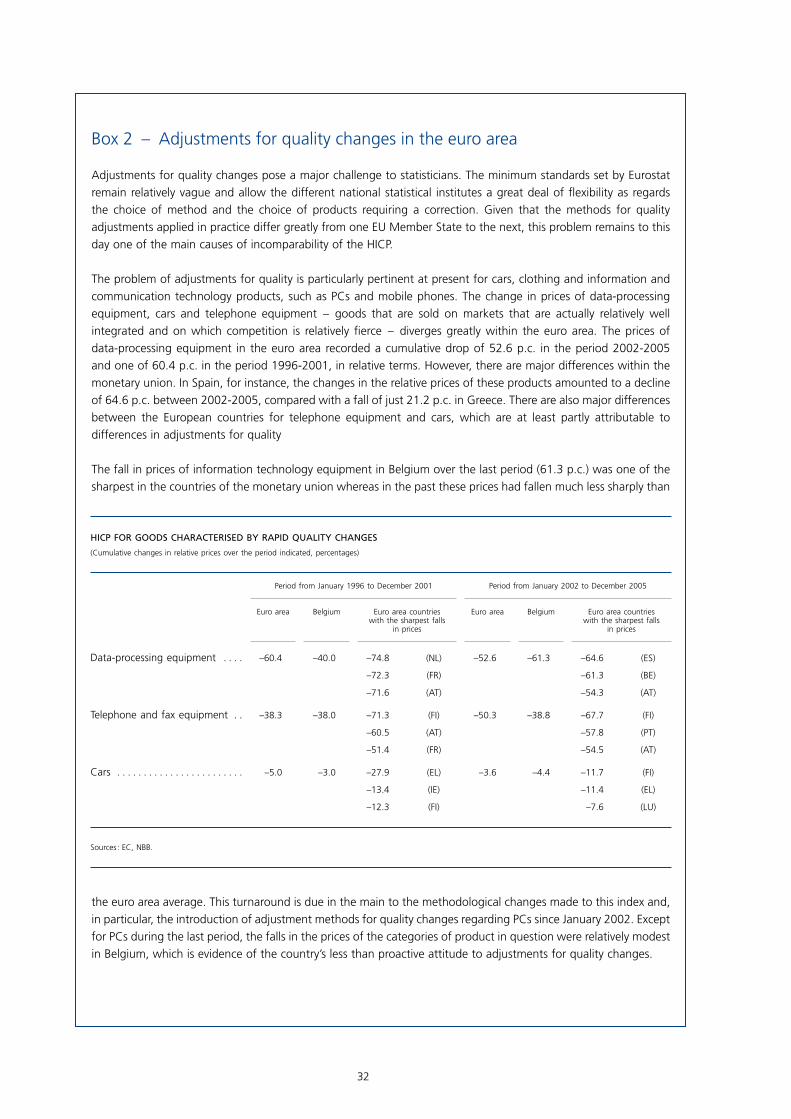
The problem of adjustments for quality is particularly pertinent at present for cars, clothing and information and communication technology products, such as PCs and mobile phones. The change in prices of data-processing equipment, cars and telephone equipment – goods that are sold on markets that are actually relatively well integrated and on which competition is relatively fierce – diverges greatly within the euro area. The prices of data-processing equipment in the euro area recorded a cumulative drop of �2.6 p.c. in the period 2002-200� and one of 60.4 p.c. in the period 1996-2001, in relative terms. However, there are major differences within the monetary union. In Spain, for instance, the changes in the relative prices of these products amounted to a decline of 64.6 p.c. between 2002-200�, compared with a fall of just 21.2 p.c. in Greece. There are also major differences between the European countries for telephone equipment and cars, which are at least partly attributable to differences in adjustments for quality
The fall in prices of information technology equipment in Belgium over the last period (61.3 p.c.) was one of the sharpest in the countries of the monetary union whereas in the past these prices had fallen much less sharply than
the euro area average. This turnaround is due in the main to the methodological changes made to this index and, in particular, the introduction of adjustment methods for quality changes regarding PCs since January 2002. Except for PCs during the last period, the falls in the prices of the categories of product in question were relatively modest in Belgium, which is evidence of the country’s less than proactive attitude to adjustments for quality changes.
HICP for goods CHaraCterIsed by raPId qualIty CHanges
(Cumulative changes in relative prices over the period indicated, percentages)
Period from January 1996 to December 2001 Period from January 2002 to December 2005
Euro area Belgium Euro area countries with the sharpest falls
in prices
Euro area Belgium Euro area countries with the sharpest falls
in prices
Data-processing equipment . . . . –60.4 –40.0 –74.8 (NL) –52.6 –61.3 –64.6 (ES)
–72.3 (FR) –61.3 (BE)
–71.6 (AT) –54.3 (AT)
Telephone and fax equipment . . –38.3 –38.0 –71.3 (FI) –50.3 –38.8 –67.7 (FI)
–60.5 (AT) –57.8 (PT)
–51.4 (FR) –54.5 (AT)
Cars . . . . . . . . . . . . . . . . . . . . . . . . –5.0 –3.0 –27.9 (EL) –3.6 –4.4 –11.7 (FI)
–13.4 (IE) –11.4 (EL)
–12.3 (FI) –7.6 (LU)
Sources : EC, NBB.
33
A NEw NATiONAl iNdEx Of CONsumEr priCEs ANd 10 yEArs Of ThE hiCp
2.7 Updating of the index
The main aim of the index of consumer prices is to measure the change over time in the prices of a basket of goods and services bought by households and which are representative of their consumption expenditure. As the structure of expenditure changes over time, it is very important that the basket monitored remains representa-tive. This requires regular updates, both regarding the products monitored and the weight accorded to them.
thE grAduAl AdjustmEnt of thE BElgiAn
hicp – pEriod 1996-2006
The HICP can be updated annually if desired, both as regards the products covered and the weightings of the different products. However, updating is obligatory for new products representing at least one-thousandth of final expenditure. The same applies to the weightings inasmuch as it is strictly forbidden to use weightings that are more than seven years old, or if a possible change would affect inflation by more than 0.1 percentage point in absolute value terms.
Since 2000, Belgium has been reviewing the HICP weight-ings on a regular basis (although not systematically each year) based on the results of the latest household budget survey. The average deviation in the weighting structure
vis-à-vis its reference period was thus reduced to 2.� years and the maximum deviation to four years, which is signifi-cantly less than the abovementioned seven-year limit.
Besides adjusting the weightings, Belgium also regularly adjusts the basket of products so that “new” products can be introduced. These are products which recently became significant in consumer expenditure terms, such as PCs (in 1999), airline tickets (in 1999), mobile phones (handsets and calls, in 2001), disposable contact lenses (in 2001), camcorders (in 2002), Internet subscriptions (in 2004), scanners, DVDs and digital cameras (in 200�).
Moreover, the HICP has also undergone other improve-ments, such as the extension of coverage to medical services and products, as well as education and social protection (in 2000). The HICP, the coverage of which was initially (in 1996) more limited than that of the NICP, has thus become more representative than the latter. In addition, in 2000 the concept of domestic territory was introduced in the Belgian HICP, and more specifically the expenditure of foreign visitors was taken into account (1). In 2001, the prices discounted in sales were also included
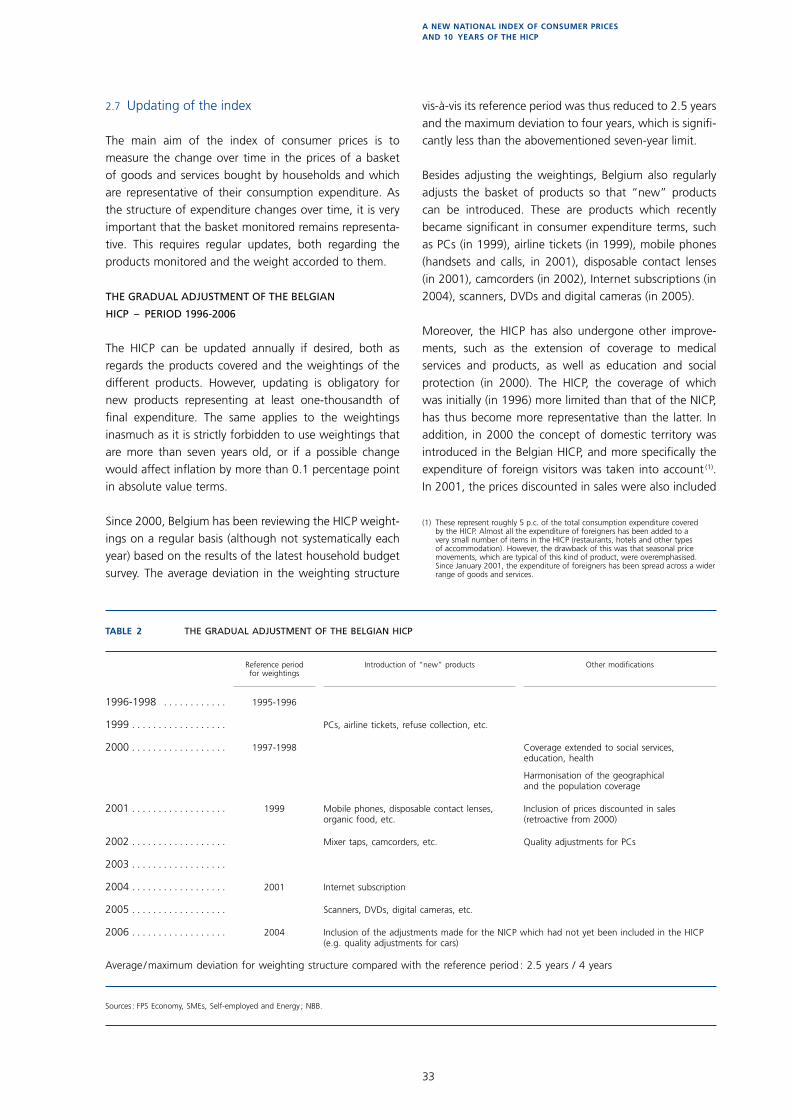
Table 2 The gradual adjusTmenT ofThe BelgianhiCP
Reference periodfor weightings
Introduction of “new” products Other modifications
1996-1998 . . . . . . . . . . . . 1995-1996
1999 . . . . . . . . . . . . . . . . . . PCs, airline tickets, refuse collection, etc.
2000 . . . . . . . . . . . . . . . . . . 1997-1998 Coverage extended to social services,education, health
Harmonisation of the geographicaland the population coverage
2001 . . . . . . . . . . . . . . . . . . 1999 Mobile phones, disposable contact lenses,organic food, etc.
Inclusion of prices discounted in sales(retroactive from 2000)
2002 . . . . . . . . . . . . . . . . . . Mixer taps, camcorders, etc. Quality adjustments for PCs
2003 . . . . . . . . . . . . . . . . . .
2004 . . . . . . . . . . . . . . . . . . 2001 Internet subscription
2005 . . . . . . . . . . . . . . . . . . Scanners, DVDs, digital cameras, etc.
2006 . . . . . . . . . . . . . . . . . . 2004 Inclusion of the adjustments made for the NICP which had not yet been included in the HICP(e.g. quality adjustments for cars)
Average /maximum deviation for weighting structure compared with the reference period : 2.5 years / 4 years
Sources : FPS Economy, SMEs, Self-employed and Energy ; NBB.
(1) These represent roughly � p.c. of the total consumption expenditure covered by the HICP. Almost all the expenditure of foreigners has been added to a very small number of items in the HICP (restaurants, hotels and other types of accommodation). However, the drawback of this was that seasonal price movements, which are typical of this kind of product, were overemphasised. Since January 2001, the expenditure of foreigners has been spread across a wider range of goods and services.
34
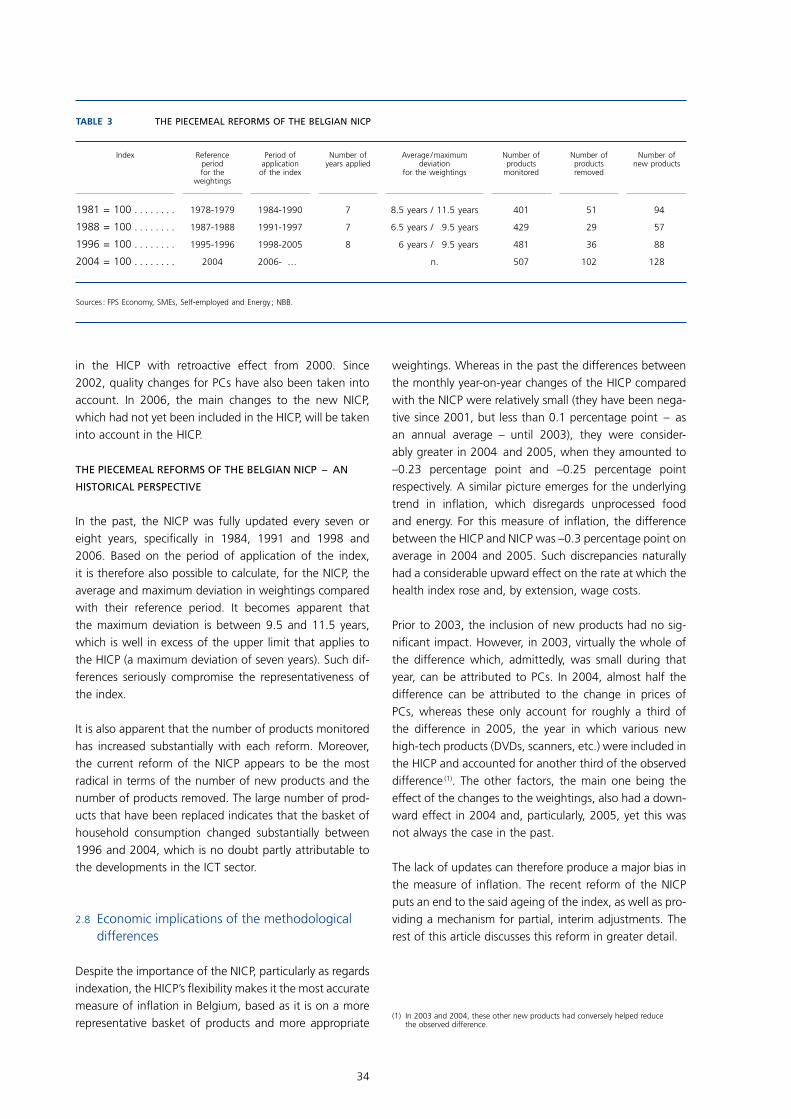
Table 3 The piecemeal reforms ofThe Belgiannicp
Index Referenceperiodfor the
weightings
Period ofapplication
of the index
Number ofyears applied
Average /maximumdeviation
for the weightings
Number ofproducts
monitored
Number ofproductsremoved
Number ofnew products
1981 = 100 . . . . . . . . 1978-1979 1984-1990 7 8.5 years / 11.5 years 401 51 94
1988 = 100 . . . . . . . . 1987-1988 1991-1997 7 6.5 years / 9.5 years 429 29 57
1996 = 100 . . . . . . . . 1995-1996 1998-2005 8 6 years / 9.5 years 481 36 88
2004 = 100 . . . . . . . . 2004 2006- … n. 507 102 128
Sources : FPS Economy, SMEs, Self-employed and Energy ; NBB.
in the HICP with retroactive effect from 2000. Since 2002, quality changes for PCs have also been taken into account. In 2006, the main changes to the new NICP, which had not yet been included in the HICP, will be taken into account in the HICP.
thE piEcEmEAl rEforms of thE BElgiAn nicp – An
historicAl pErspEctivE
In the past, the NICP was fully updated every seven or eight years, specifically in 1984, 1991 and 1998 and 2006. Based on the period of application of the index, it is therefore also possible to calculate, for the NICP, the average and maximum deviation in weightings compared with their reference period. It becomes apparent that the maximum deviation is between 9.� and 11.� years, which is well in excess of the upper limit that applies to the HICP (a maximum deviation of seven years). Such dif-ferences seriously compromise the representativeness of the index.
It is also apparent that the number of products monitored has increased substantially with each reform. Moreover, the current reform of the NICP appears to be the most radical in terms of the number of new products and the number of products removed. The large number of prod-ucts that have been replaced indicates that the basket of household consumption changed substantially between 1996 and 2004, which is no doubt partly attributable to the developments in the ICT sector.
2.8 Economic implications of the methodological differences
Despite the importance of the NICP, particularly as regards indexation, the HICP’s flexibility makes it the most accurate measure of inflation in Belgium, based as it is on a more representative basket of products and more appropriate
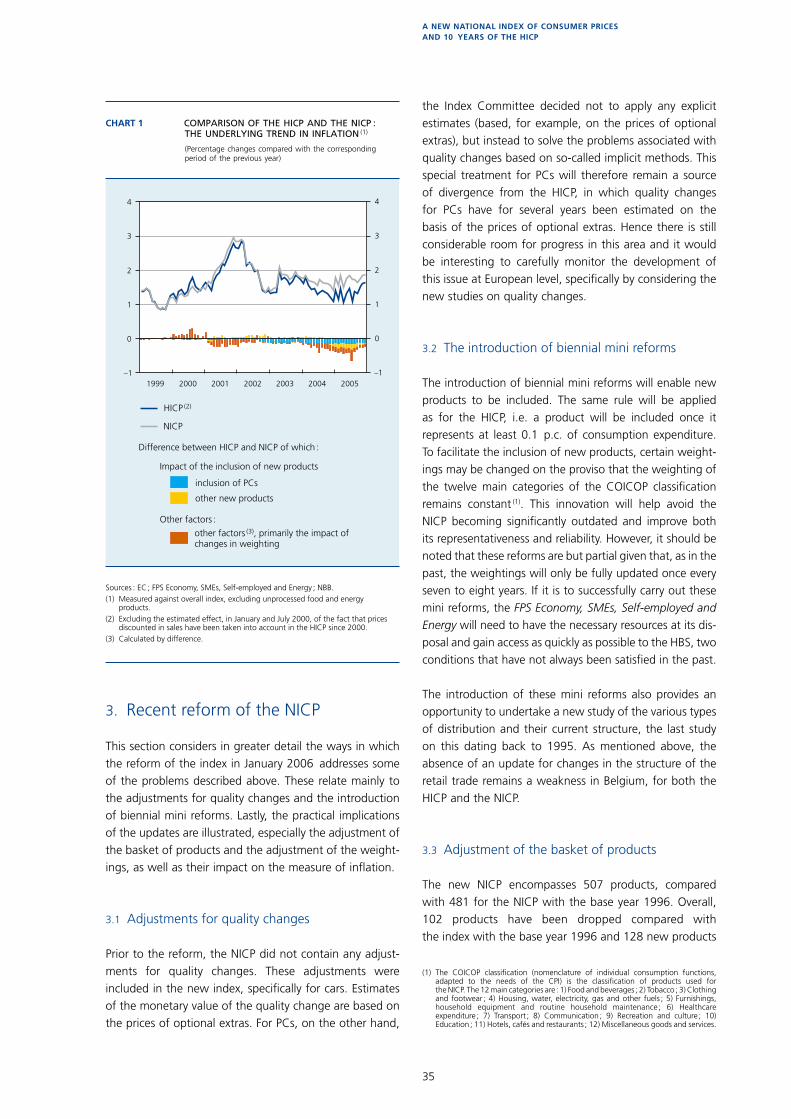
weightings. Whereas in the past the differences between the monthly year-on-year changes of the HICP compared with the NICP were relatively small (they have been nega-tive since 2001, but less than 0.1 percentage point – as an annual average – until 2003), they were consider-ably greater in 2004 and 200�, when they amounted to –0.23 percentage point and –0.2� percentage point respectively. A similar picture emerges for the underlying trend in inflation, which disregards unprocessed food and energy. For this measure of inflation, the difference between the HICP and NICP was –0.3 percentage point on average in 2004 and 200�. Such discrepancies naturally had a considerable upward effect on the rate at which the health index rose and, by extension, wage costs.
Prior to 2003, the inclusion of new products had no sig-nificant impact. However, in 2003, virtually the whole of the difference which, admittedly, was small during that year, can be attributed to PCs. In 2004, almost half the difference can be attributed to the change in prices of PCs, whereas these only account for roughly a third of the difference in 200�, the year in which various new high-tech products (DVDs, scanners, etc.) were included in the HICP and accounted for another third of the observed difference (1). The other factors, the main one being the effect of the changes to the weightings, also had a down-ward effect in 2004 and, particularly, 200�, yet this was not always the case in the past.
The lack of updates can therefore produce a major bias in the measure of inflation. The recent reform of the NICP puts an end to the said ageing of the index, as well as pro-viding a mechanism for partial, interim adjustments. The rest of this article discusses this reform in greater detail.
(1) In 2003 and 2004, these other new products had conversely helped reduce the observed difference.
3�
A NEw NATiONAl iNdEx Of CONsumEr priCEs ANd 10 yEArs Of ThE hiCp
3. Recent reform of the NICP
This section considers in greater detail the ways in which the reform of the index in January 2006 addresses some of the problems described above. These relate mainly to the adjustments for quality changes and the introduction of biennial mini reforms. Lastly, the practical implications of the updates are illustrated, especially the adjustment of the basket of products and the adjustment of the weight-ings, as well as their impact on the measure of inflation.
3.1 Adjustments for quality changes
Prior to the reform, the NICP did not contain any adjust-ments for quality changes. These adjustments were included in the new index, specifically for cars. Estimates of the monetary value of the quality change are based on the prices of optional extras. For PCs, on the other hand,
the Index Committee decided not to apply any explicit estimates (based, for example, on the prices of optional extras), but instead to solve the problems associated with quality changes based on so-called implicit methods. This special treatment for PCs will therefore remain a source of divergence from the HICP, in which quality changes for PCs have for several years been estimated on the basis of the prices of optional extras. Hence there is still considerable room for progress in this area and it would be interesting to carefully monitor the development of this issue at European level, specifically by considering the new studies on quality changes.
3.2 The introduction of biennial mini reforms
The introduction of biennial mini reforms will enable new products to be included. The same rule will be applied as for the HICP, i.e. a product will be included once it represents at least 0.1 p.c. of consumption expenditure. To facilitate the inclusion of new products, certain weight-ings may be changed on the proviso that the weighting of the twelve main categories of the COICOP classification remains constant (1). This innovation will help avoid the NICP becoming significantly outdated and improve both its representativeness and reliability. However, it should be noted that these reforms are but partial given that, as in the past, the weightings will only be fully updated once every seven to eight years. If it is to successfully carry out these mini reforms, the FPS Economy, SMEs, Self-employed and Energy will need to have the necessary resources at its dis-posal and gain access as quickly as possible to the HBS, two conditions that have not always been satisfied in the past.
The introduction of these mini reforms also provides an opportunity to undertake a new study of the various types of distribution and their current structure, the last study on this dating back to 199�. As mentioned above, the absence of an update for changes in the structure of the retail trade remains a weakness in Belgium, for both the HICP and the NICP.
3.3 Adjustment of the basket of products
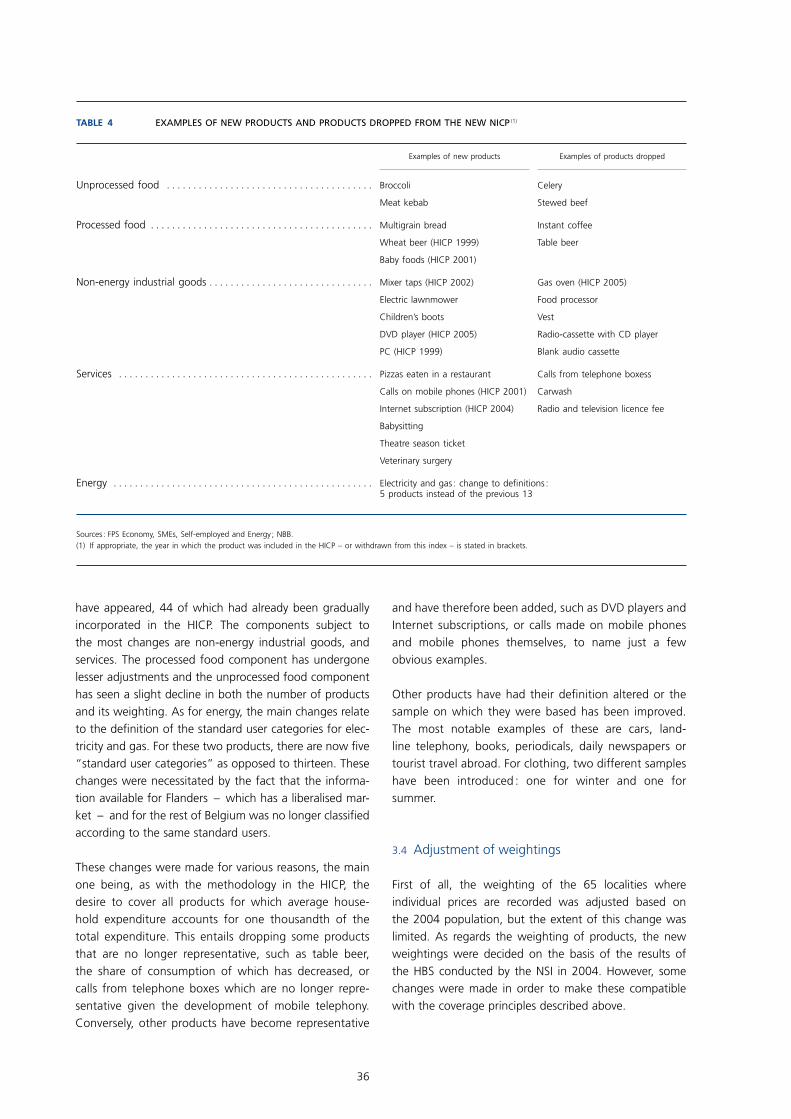
The new NICP encompasses �07 products, compared with 481 for the NICP with the base year 1996. Overall, 102 products have been dropped compared with the index with the base year 1996 and 128 new products
–1
0
1
2
3
4
1999 2000 2001 2002 2003 2004 2005–1
0
1
2
3
4
CHART 1 COMPARISON OF THE HICP AND THE NICP : THE UNDERLYING TREND IN INFLATION
(1)
(Percentage changes compared with the corresponding period of the previous year)
Sources : EC ; FPS Economy, SMEs, Self-employed and Energy ; NBB.(1) Measured against overall index, excluding unprocessed food and energy
products. (2) Excluding the estimated effect, in January and July 2000, of the fact that prices
discounted in sales have been taken into account in the HICP since 2000.(3) Calculated by difference.
HICP (2)
NICP
inclusion of PCs
other new products
Difference between HICP and NICP of which :
Impact of the inclusion of new products
Other factors :
other factors (3), primarily the impact of
changes in weighting
(1) The COICOP classification (nomenclature of individual consumption functions, adapted to the needs of the CPI) is the classification of products used for the NICP. The 12 main categories are : 1) Food and beverages ; 2) Tobacco ; 3) Clothing and footwear ; 4) Housing, water, electricity, gas and other fuels ; �) Furnishings, household equipment and routine household maintenance ; 6) Healthcare expenditure ; 7) Transport ; 8) Communication ; 9) Recreation and culture ; 10) Education ; 11) Hotels, cafés and restaurants ; 12) Miscellaneous goods and services.
36
Table 4 ExamplEs of nEw products and products droppEd from thE nEwnIcp (1)
Examples of new products Examples of products dropped
Unprocessed food . . . . . . . . . . . . . . . . . . . . . . . . . . . . . . . . . . . . . . . Broccoli Celery
Meat kebab Stewed beef
Processed food . . . . . . . . . . . . . . . . . . . . . . . . . . . . . . . . . . . . . . . . . . Multigrain bread Instant coffee
Wheat beer (HICP 1999) Table beer
Baby foods (HICP 2001)
Non-energy industrial goods . . . . . . . . . . . . . . . . . . . . . . . . . . . . . . . Mixer taps (HICP 2002) Gas oven (HICP 2005)
Electric lawnmower Food processor
Children’s boots Vest
DVD player (HICP 2005) Radio-cassette with CD player
PC (HICP 1999) Blank audio cassette
Services . . . . . . . . . . . . . . . . . . . . . . . . . . . . . . . . . . . . . . . . . . . . . . . . Pizzas eaten in a restaurant Calls from telephone boxess
Calls on mobile phones (HICP 2001) Carwash
Internet subscription (HICP 2004) Radio and television licence fee
Babysitting
Theatre season ticket
Veterinary surgery
Energy . . . . . . . . . . . . . . . . . . . . . . . . . . . . . . . . . . . . . . . . . . . . . . . . . Electricity and gas : change to definitions :5 products instead of the previous 13
Sources : FPS Economy, SMEs, Self-employed and Energy ; NBB.(1) If appropriate, the year in which the product was included in the HICP – or withdrawn from this index – is stated in brackets.
have appeared, 44 of which had already been gradually incorporated in the HICP. The components subject to the most changes are non-energy industrial goods, and services. The processed food component has undergone lesser adjustments and the unprocessed food component has seen a slight decline in both the number of products and its weighting. As for energy, the main changes relate to the definition of the standard user categories for elec-tricity and gas. For these two products, there are now five “standard user categories” as opposed to thirteen. These changes were necessitated by the fact that the informa-tion available for Flanders – which has a liberalised mar-ket – and for the rest of Belgium was no longer classified according to the same standard users.
These changes were made for various reasons, the main one being, as with the methodology in the HICP, the desire to cover all products for which average house-hold expenditure accounts for one thousandth of the total expenditure. This entails dropping some products that are no longer representative, such as table beer, the share of consumption of which has decreased, or calls from telephone boxes which are no longer repre-sentative given the development of mobile telephony. Conversely, other products have become representative
and have therefore been added, such as DVD players and Internet subscriptions, or calls made on mobile phones and mobile phones themselves, to name just a few obvious examples.
Other products have had their definition altered or the sample on which they were based has been improved. The most notable examples of these are cars, land-line telephony, books, periodicals, daily newspapers or tourist travel abroad. For clothing, two different samples have been introduced : one for winter and one for summer.
3.4 Adjustment of weightings
First of all, the weighting of the 6� localities where individual prices are recorded was adjusted based on the 2004 population, but the extent of this change was limited. As regards the weighting of products, the new weightings were decided on the basis of the results of the HBS conducted by the NSI in 2004. However, some changes were made in order to make these compatible with the coverage principles described above.
37
A NEw NATiONAl iNdEx Of CONsumEr priCEs ANd 10 yEArs Of ThE hiCp
A degree of caution is required when comparing the new weighting structure with the structure for the old index, in order to correctly interpret the real changes between the two indices. The 1996 weightings in fact present an inaccurate picture of the actual contribution to total infla-tion of the changes in price for a given product in 200�. Depending on the changes in the relative prices, this con-tribution has become either greater or smaller than the contribution prevailing in the base period. For products whose prices developed more rapidly than total inflation between 1996 and 2004, the implicit 2004 weighting coefficient will be higher than the original coefficient (1). This is true of the components energy, food and services, which thus implicitly (i.e. without the weightings being explicitly updated) increased in importance in the old index. The opposite is true of non-energy industrial goods, as the change in the prices of these goods has been more restrained than total inflation.
To assess the true impact of the introduction of new weightings on inflation, they must therefore be compared with the implicit weightings of the old index at 2004 prices. Such a comparison shows that the contribution of both unprocessed and processed food to inflation is decreasing. Together, these products represent roughly 20 p.c. of the basket for the new index. This is not surprising,
as it is well known that the importance of this type of product declines as standards of living rise. This develop-ment is part of a long-term movement which was also observed during the previous reforms. On the contrary, compared with the situation in the old index in 2004, it is apparent that the contribution of non-energy industrial goods and of services is increasing in the new index. These developments, and more especially that observed for ser-vices, also reflect structural shifts. Non-energy industrial goods make up roughly 34 p.c. of the new basket, while the share of services is 36 p.c. It is, among others, the goods and services relating to culture and recreation, tele-communications, expenditure on healthcare and transport (including the purchase of vehicles) which tend to gain in importance, whilst expenditure on clothing and furniture in particular follows the reverse trend.
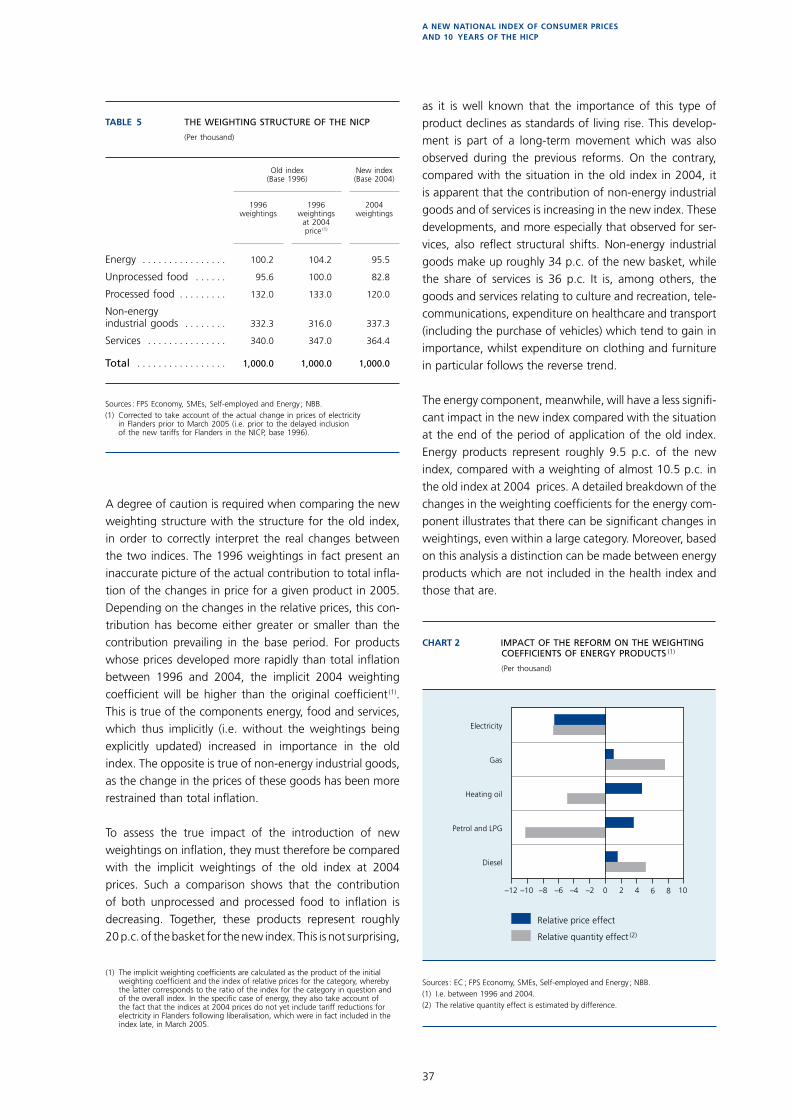
The energy component, meanwhile, will have a less signifi-cant impact in the new index compared with the situation at the end of the period of application of the old index. Energy products represent roughly 9.� p.c. of the new index, compared with a weighting of almost 10.� p.c. in the old index at 2004 prices. A detailed breakdown of the changes in the weighting coefficients for the energy com-ponent illustrates that there can be significant changes in weightings, even within a large category. Moreover, based on this analysis a distinction can be made between energy products which are not included in the health index and those that are.
(1) The implicit weighting coefficients are calculated as the product of the initial weighting coefficient and the index of relative prices for the category, whereby the latter corresponds to the ratio of the index for the category in question and of the overall index. In the specific case of energy, they also take account of the fact that the indices at 2004 prices do not yet include tariff reductions for electricity in Flanders following liberalisation, which were in fact included in the index late, in March 200�.
–12 –10 –8 –6 –4 –2 0 2 4 86 10
CHART 2 IMPACT OF THE REFORM ON THE WEIGHTING COEFFICIENTS OF ENERGY PRODUCTS
(1)
(Per thousand)
Sources : EC ; FPS Economy, SMEs, Self-employed and Energy ; NBB.(1) I.e. between 1996 and 2004.(2) The relative quantity effect is estimated by difference.
Gas
Heating oil
Petrol and LPG
Diesel
Relative price effect
Relative quantity effect (2)
Electricity
Table 5 The weighTing sTrucTure ofThenicP
(Per thousand)
Old index (Base 1996)
New index (Base 2004)
1996weightings
1996weightings
at 2004 price (1)
2004weightings
Energy . . . . . . . . . . . . . . . . 100.2 104.2 95.5
Unprocessed food . . . . . . 95.6 100.0 82.8
Processed food . . . . . . . . . 132.0 133.0 120.0
Non-energyindustrial goods . . . . . . . . 332.3 316.0 337.3
Services . . . . . . . . . . . . . . . 340.0 347.0 364.4
Total . . . . . . . . . . . . . . . . . 1,000.0 1,000.0 1,000.0
Sources : FPS Economy, SMEs, Self-employed and Energy ; NBB.(1) Corrected to take account of the actual change in prices of electricity
in Flanders prior to March 2005 (i.e. prior to the delayed inclusion of the new tariffs for Flanders in the NICP, base 1996).
38
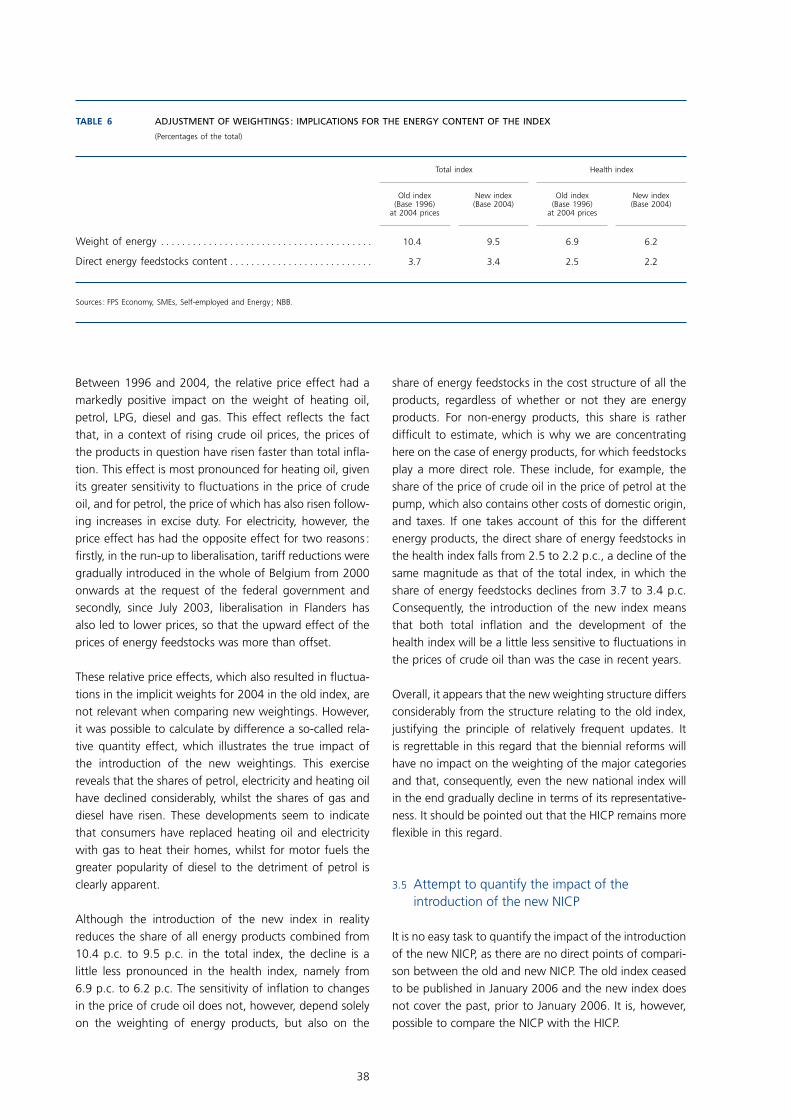
Table 6 Adjustment of weightings: implicAtions for the energy content of the index
(Percentages of the total)
Total index Health index
Old index (Base 1996)
at 2004 prices
New index (Base 2004)
Old index (Base 1996)
at 2004 prices
New index (Base 2004)
Weight of energy . . . . . . . . . . . . . . . . . . . . . . . . . . . . . . . . . . . . . . . . 10.4 9.5 6.9 6.2
Direct energy feedstocks content . . . . . . . . . . . . . . . . . . . . . . . . . . . 3.7 3.4 2.5 2.2
Sources : FPS Economy, SMEs, Self-employed and Energy ; NBB.
Between 1996 and 2004, the relative price effect had a markedly positive impact on the weight of heating oil, petrol, LPG, diesel and gas. This effect reflects the fact that, in a context of rising crude oil prices, the prices of the products in question have risen faster than total infla-tion. This effect is most pronounced for heating oil, given its greater sensitivity to fluctuations in the price of crude oil, and for petrol, the price of which has also risen follow-ing increases in excise duty. For electricity, however, the price effect has had the opposite effect for two reasons : firstly, in the run-up to liberalisation, tariff reductions were gradually introduced in the whole of Belgium from 2000 onwards at the request of the federal government and secondly, since July 2003, liberalisation in Flanders has also led to lower prices, so that the upward effect of the prices of energy feedstocks was more than offset.
These relative price effects, which also resulted in fluctua-tions in the implicit weights for 2004 in the old index, are not relevant when comparing new weightings. However, it was possible to calculate by difference a so-called rela-tive quantity effect, which illustrates the true impact of the introduction of the new weightings. This exercise reveals that the shares of petrol, electricity and heating oil have declined considerably, whilst the shares of gas and diesel have risen. These developments seem to indicate that consumers have replaced heating oil and electricity with gas to heat their homes, whilst for motor fuels the greater popularity of diesel to the detriment of petrol is clearly apparent.
Although the introduction of the new index in reality reduces the share of all energy products combined from 10.4 p.c. to 9.� p.c. in the total index, the decline is a little less pronounced in the health index, namely from 6.9 p.c. to 6.2 p.c. The sensitivity of inflation to changes in the price of crude oil does not, however, depend solely on the weighting of energy products, but also on the
share of energy feedstocks in the cost structure of all the products, regardless of whether or not they are energy products. For non-energy products, this share is rather difficult to estimate, which is why we are concentrating here on the case of energy products, for which feedstocks play a more direct role. These include, for example, the share of the price of crude oil in the price of petrol at the pump, which also contains other costs of domestic origin, and taxes. If one takes account of this for the different energy products, the direct share of energy feedstocks in the health index falls from 2.� to 2.2 p.c., a decline of the same magnitude as that of the total index, in which the share of energy feedstocks declines from 3.7 to 3.4 p.c. Consequently, the introduction of the new index means that both total inflation and the development of the health index will be a little less sensitive to fluctuations in the prices of crude oil than was the case in recent years.
Overall, it appears that the new weighting structure differs considerably from the structure relating to the old index, justifying the principle of relatively frequent updates. It is regrettable in this regard that the biennial reforms will have no impact on the weighting of the major categories and that, consequently, even the new national index will in the end gradually decline in terms of its representative-ness. It should be pointed out that the HICP remains more flexible in this regard.
3.� Attempt to quantify the impact of the introduction of the new NICP
It is no easy task to quantify the impact of the introduction of the new NICP, as there are no direct points of compari-son between the old and new NICP. The old index ceased to be published in January 2006 and the new index does not cover the past, prior to January 2006. It is, however, possible to compare the NICP with the HICP.

39
A NEw NATiONAl iNdEx Of CONsumEr priCEs ANd 10 yEArs Of ThE hiCp
As the composition of the new NICP bears many similari-ties with the structure of the HICP it is safe to assume that the reform should help eliminate the discrepancy observed between the two indices in recent years. The impact of the reform on NICP-measured inflation should therefore be between –0.2 and –0.3 percentage point per annum, and involves eliminating the positive bias which characterised the NICP in 2004 and 200�, caused by the deterioration in its representativeness. This effect will only be sustained if the new index does not deterio-rate over time, which is more likely now than in the past because of the introduction of the biennial mini reforms. However, the HICP is still more efficient as regards main-taining its representativeness and adjustments for quality changes.
Nevertheless, NICP-measured inflation will only be close to HICP-measured inflation from 2007 onwards. Indeed, 2006 is a transitional year during which inflation mea-sured by the NICP is still temporarily influenced by the old base, because inflation is measured by comparing the indices for 2006 (post reform) with the indices for the cor-responding month of 200� (pre reform, but converted in order to enable comparison).
In this regard, the way in which the transition between the new and the old index is handled from a statistical point of view is not neutral. In the case of the NICP, the method followed consists of placing side by side, in January 2006, the two indices expressed on a shared base of 2004 = 100, but without chaining them. In practice, this amounts to eliminating, in January 2006, the difference in level
90
95
100
105
1999 2000 2001 2002 2003 2004 2005 200690
95
100
105
90
95
100
105
1999 2000 2001 2002 2003 2004 2005 200690
95
100
105
0
1
2
3
4
1999 2000 2001 2002 2003 2004 2005 20060
1
2
3
4
0
1
2
3
4
1999 2000 2001 2002 2003 2004 2005 20060
1
2
3
4
CHART 3 IMPACT OF THE RECENT REFORM OF THE NICP ON THE DISCREPANCY BETWEEN THE NICP AND THE HICP
Sources : EC ; FPS Economy, SMEs, Self-employed and Energy ; NBB.(1) Excluding the estimated effect of prices discounted in sales since 2000.
Percentage changes compared with the corresponding period of the previous year
Percentage changes compared with the corresponding period of the previous year
HICP (1)
NICP
In indices expressed with the same base 2004 = 100 In indices expressed with the same base 2004 = 100
TOTAL UNDERLYING TREND IN INFLATION
40
between the two indices that has accumulated since 2004. For this reason, in 2006 inflation measured accord-ing to the NICP will be affected by a considerable, albeit temporary, downward effect. Overall, the impact of the introduction of the new index on inflation measured by the NICP should be of the order of –0.6 percentage point in 2006.
In other words, the surplus in the measure of inflation due to the obsolescence of the index in 2004 and 200� is counterbalanced in 2006 by the negative impact of the transition method used. The same assessment is valid for the health index, for which the conversion coefficient was fixed by the social partners within the National Labour Council, although the impact would be a little less (–0.� percentage point in 2006). It can therefore be said that the share of the indexations arising in 2004 and 200� which is attributable to the ageing of the index will be offset in 2006. In light of the loss of competitiveness in terms of wage costs, such a correction will undoubt-edly be welcome. Nevertheless, it should be stressed that offsetting in this way is merely a second-best solution, as, ideally, obsolescence of the index should be avoided alto-gether, so that no major corrections have subsequently to be made. From the point of view of competitiveness, pre-vention is after all better than cure, whilst the (somewhat counterintuitive) corrections may compromise the cred-ibility of the index of consumer prices in the eyes of the general public. This illustrates once again how important it is to keep constant watch over the quality and represen-tativeness of the measure of inflation.
4. Conclusions
The January 2006 introduction of the new NICP with base 2004, and the accompanying reform, puts an end to the significant ageing of the index. The loss of representa-tiveness of the index had become particularly evident in
2004-200�, and was not neutral in terms of inflation. Thanks to the reform, the discrepancy between the NICP and HICP should become considerably smaller from 2007 onwards. However, in 2006 the methods used for the introduction of the new NICP will produce a significant downward effect both in terms of NICP-measured infla-tion and of the trend in the health index.
Of the reform’s innovations, the introduction of biennial mini reforms represents significant progress in terms of improving the updating of the NICP and maintaining its representativeness. The greater flexibility of the HICP and the fact that it is more accurate in terms of adjustments for quality changes nonetheless continue to make this a more precise index.
Despite the improvements made, a number of chal-lenges remain both in terms of the HICP and the NICP. At European level, the major challenges are undoubtedly those relating to the treatment of the cost of housing incurred by owner-occupiers and the harmonisation and generalisation of the adjustments for quality changes. These challenges apply a fortiori both to the Belgian HICP and, even more so, to the NICP, where cars are the only product for which adjustments for quality changes are made.
Other major challenges, of concern more specifically to Belgium, are the updating of the data on the structure of the retail trade (the version currently being used dating back to 199�) and the widening of the elementary aggre-gation to include a greater number of products based on the geometric mean. In both cases, both the HICP and the NICP would better reflect the substitution effects between outlets and between products.
If further progress is to be made in this area, ade-quate resources must be made available for measuring inflation.
Related Documents