9.1 Risk Assessment 9.1.15 Oregon Risk Assessment: A New Model, Final Report

Welcome message from author
This document is posted to help you gain knowledge. Please leave a comment to let me know what you think about it! Share it to your friends and learn new things together.
Transcript

9.1 Risk Assessment
9.1.15 Oregon Risk Assessment: A New Model, Final Report
OREGON RISK ASSESSMENT:
A NEW MODEL
August, 2013
Final Report
Prepared for: Oregon Natural Hazard Mitigation Plan
Risk Assessment Sub-Committee
Prepared by: Oregon Partnership for Disaster Resilience
In partnership with:
University of Oregon Department of Geography and the InfoGraphics Lab


Oregon Risk Assessment: A New Model August, 2013 Page | i

Page | ii Oregon Partnership for Disaster Resilience
SPECIAL THANKS & ACKNOWLEDGEMENTS
Oregon’s 2010 Federal Emergency Management Agency Hazard Mitigation Grant Program Planning Grant (FEMA DR-1733.0010-P) provided valuable funding for this project. The Department of Land Conservation and Development provided additional support through the provision of in-kind matching funds.
Special thanks go to Ken Kato and Chris Bone of the University of Oregon Geography Department who made this project possible through their generous donation of time, energy, commitment and vision.
Project Steering Committee:
• Ken Kato – InfoGraphics Lab • Brook Eastman – InfoGraphics Lab • Eric Sproles – InfoGraphics Lab • Don Pettit – Department of Environmental Quality (DEQ) • Lisa Peffer – Department of Land Conservation and Development (DLCD) • Chris Shirley – Department of Land Conservation and Development (DLCD) • Steve Lucker – Department of Land Conservation and Development (DLCD) • Jeff Weber – Department of Land Conservation and Development (DLCD) • Rachel Smith – Department of Geology and Mineral Industries (DOGAMI) • Kristen Meyers – Federal Emergency Management Agency (FEMA) • Brett Holt – Federal Emergency Management Agency (FEMA) • Amanda Engstfeld – Federal Emergency Management Agency (FEMA) • Chris Bone – University of Oregon, Geography Department • Kiri Carini – Oregon Emergency Management (OEM) • Joseph Murray – Oregon Emergency Management (OEM) • Dennis Sigrist – Oregon Emergency Management (OEM) • Josh Bruce – Oregon Partnership for Disaster Resilience (OPDR) • Benjamin Protzman – Oregon Partnership for Disaster Resilience (OPDR)
Project Manager:
• Lisa Peffer, Natural Hazards Planner, Oregon Department of Land Conservation and Development
Community Service Center Staff:
• Josh Bruce, Interim Director, Oregon Partnership for Disaster Resilience • Ben Protzman, Research Associate, Community Service Center
University of Oregon Department of Geography Team:
• Ken Kato, Associate Director, UO InfoGraphics Lab • Chris Bone, Assistant Professor, UO Department of Geography

Oregon Risk Assessment: A New Model August, 2013 Page | iii
• Brook Eastman, GIS Specialist, UO InfoGraphics Lab • Eric Sproles, Adjunct Research Assistant, UO InfoGraphics Lab
About the Community Service Center
The Community Service Center (CSC), a research center affiliated with the Department of Planning, Public Policy, and Management at the University of Oregon, is an interdisciplinary organization that assists Oregon communities by providing planning and technical assistance to help solve local issues and improve the quality of life for Oregon residents. The role of the CSC is to link the skills, expertise, and innovation of higher education with the transportation, economic development, and environmental needs of communities and regions in the State of Oregon, thereby providing service to Oregon and learning opportunities to the students involved.
About the Oregon Partnership for Disaster Resilience
The Oregon Partnership for Disaster Resilience (OPDR) is a coalition of public, private, and professional organizations working collectively toward the mission of creating a disaster-resilient and sustainable state. Developed and coordinated by the Community Service Center at the University of Oregon, OPDR employs a service-learning model to increase community capacity and enhance disaster safety and resilience statewide.
About the Info Graphics Lab
The InfoGraphics Lab is housed within the University of Oregon’s Department of Geography. The Lab works on a variety of supported projects with faculty, campus offices, and government agencies. Integration of GIS and graphic design tools with cartographic design is a primary focus of the Lab's work. Core areas of expertise include: Cartography and Graphic Design, Geographic Information Science, and Teaching and Research Support.
About the Department of Land Conservation and Development
The Department of Land Conservation and Development (DLCD) administers Oregon’s statewide land use planning program. Through this program DLCD offers all Oregonians protection of farm and forest lands, conservation of natural resources, orderly and efficient development, coordination among local governments, and citizen involvement in the planning process.
About the Interagency Hazard Mitigation Team
The Interagency Hazard Mitigation Team (IHMT) was established as a permanent body by Governor Kitzhaber in 1997. The IHMT meets quarterly to understand losses arising from natural hazards, and coordinate recommended strategies to mitigate loss of life, property, and natural resources.

Page | iv Oregon Partnership for Disaster Resilience
About the IHMT Risk Assessment Sub-Committee
The IHMT Risk Assessment Sub-Committee (RAS-C) is a subgroup of the IHMT that convened from March through August 2012 to identify and develop a new risk assessment approach and methodology to be used in future updates of the Oregon Natural Hazard Mitigation Plan (OR NHMP).

Oregon Risk Assessment: A New Model August, 2013 Page | v
This page left intentionally blank.

Page | vi Oregon Partnership for Disaster Resilience
OREGON RISK ASSESSMENT: A NEW MODEL
Table of Contents
Introduction
Project Background .................................................................................................................... 1
RAS-C Meetings .......................................................................................................................... 2
Phase I: Literature Review
Academic Literature Review .................................................................................................... 6
SNHMP Risk Assessment Review. ........................................................................................ 10
Summary of Literature Review Findings .............................................................................. 12
Phase II: Risk Assessment Model Development
Primary Qualities ...................................................................................................................... 14
Secondary Qualities ................................................................................................................. 16
Vulnerability Inputs ................................................................................................................... 17
Hazard Inputs ............................................................................................................................. 18
Embracing Subjectivity ............................................................................................................. 18
Data Aggregation ...................................................................................................................... 19
Correlation ................................................................................................................................. 20
Model Outputs .......................................................................................................................... 18
Phase III: Model Testing
Approach .................................................................................................................................... 22
Limitations .................................................................................................................................. 23
Phase IV: Long-Term Work Program and Budget
Proposed Three-Year Work Program ................................................................................ 24
Risk Assessment Sub-Committee Actions ......................................................................... 24
Sample Budget ........................................................................................................................... 25
Funding Options ........................................................................................................................ 25
Section IV: Appendices
Appendix A: Literature Review Criteria Matrix................................................................ 25
Appendix B: Literature Review Summaries ........................................................................ 28
Appendix C: Meeting Minutes ............................................................................................... 46
Oregon Risk Assessment: A New Model August, 2013 Page | vii
This page left intentionally blank.


Oregon Risk Assessment: A New Model August, 2013 Page | 1
INTRODUCTION
The Stafford Act requires State Natural Hazard Mitigation Plans (SNHMP) to evaluate vulnerability to damage caused by natural hazard events. Vulnerability to natural hazards can be characterized in terms of exposure to and sensitivity of built, economic, and social environments to potential damage. At the present time, Oregon does not have a clear and common methodology to identify the most vulnerable populations across all hazards at the state and local levels.
Project Background
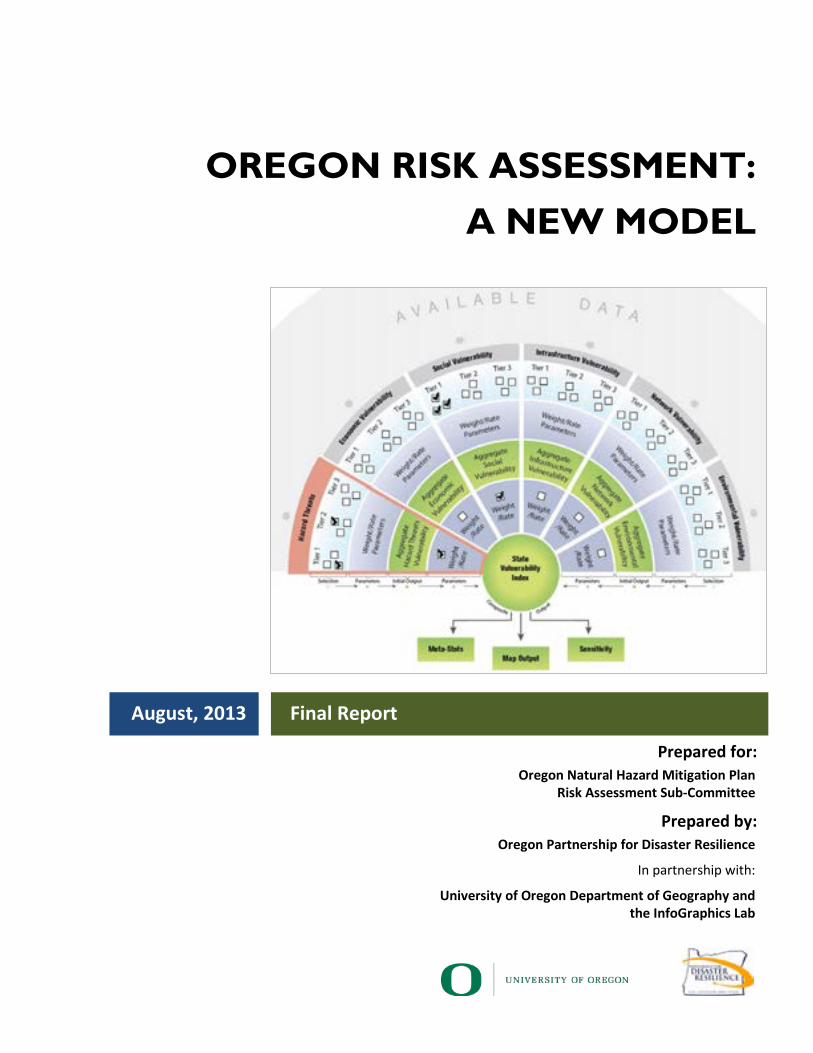
Oregon’s Interagency Hazard Mitigation Team (IHMT) Risk Assessment Sub-Committee (RAS-C), in partnership with faculty from the University of Oregon’s Department of Geography, InfoGraphics’s Lab and Oregon Partnership for Disaster Resilience (OPDR) have collaborated to develop a new risk assessment model concept. When developed and implemented, the model will provide a standardized way to assess vulnerability to natural hazards in Oregon thereby allowing the state to better identify where to strategically target mitigation resources. This initiative has been facilitated by the Department of Land Conservation and Development (DLCD) as part of the current update to the Oregon Natural Hazard Mitigation Plan (OR NHMP).
The RAS-C convened a total of five times from March to August to develop a risk assessment methodology that 1) meets federal requirements, 2) draws from the strengths of existing methods and 3) addresses Oregon’s unique priorities. The committee took a four-pronged approach to developing a new risk assessment model. Phase one involved the review of natural hazard risk assessment methodologies found in academic literature and in other SNHMPs. In Phase two, the UO team designed and developed a proposed risk assessment model concept drawing from the strongest elements of the literature review and other research. While this phase focused heavily on adapting Susan Cutter’s Social Vulnerability Index12, a key driver was the development of a framework tailored toward Oregon that could address key shortcomings identified in Cutter and other models. In addition, the model incorporates state priorities identified by the RAS-C. Phase three involved testing the feasibility of the proposed model. Finally, in phase four, the UO team developed a timeline, work plan and budget in an effort to identify the resources needed to fully develop the risk assessment model. The following subsection summarizes the RAS-C meetings.
1 Cutter, Susan L., Christopher T. Emrich, Jennifer J. Webb, and Daniel Morath. "Social Vulnerability to Climate Variability Hazards : A Review of the Literature." Oxfam America. Last modified June 17, 2009. http://adapt.oxfamamerica.org/resources/Literature_Review.pdf. 2 Cutter, Susan L., Bryan J. Boruff, and W. Lynn Shirley. "Social Vulnerability to Environmental Hazards." SOCIAL SCIENCE QUARTERLY 84, no. 2 (June 2003): 242-61. http://webra.cas.sc.edu/hvri/ pubs/2003_SocialVulnerabilitytoEnvironmentalHazards.pdf.
Page | 2 Oregon Partnership for Disaster Resilience
RAS-C Meetings
The model development process took place over six months between March and August of 2013. As noted above, the RAS-C met roughly one time per month for a total of five meetings over that period. This subsection summarizes those RAS-C meetings. See Appendix C for complete meeting notes.
Meeting One: March 20, 2013
DLCD initially convened the RAS-C in March to introduce the concept of developing a standardized risk assessment methodology for the 2015 OR NHMP update. The committee discussed the pros and cons of existing methodologies used in the current OR NHMP (2012) and those used by state agencies. The committee discussed the state’s priorities regarding utility, scalability, spatial resolution, objectives, and criteria of the risk assessment. OPDR, InfoGraphics and DLCD agreed to meet prior to the next RAS-C meeting to determine a realistic scope for the project and respective roles.
Meeting Two: April, 16th
The purpose of this meeting was to specify scope of the project under the current funding and timeline and to further define the key objectives for an Oregon-tailored model. Specifically, the group reviewed a work plan that would result in a concept model, long-term work plan and budget by August of 2013. The group approved moving forward with the work plan. In addition, the group agreed that the model should be able to meet several key objectives including:
• Having long term applicability;
• Being able to gauge the effectiveness of mitigation actions and funding;
• Helping the State create a systematic mitigation strategy;
• Measuring tradeoffs;
• Demonstrating change over time; and,
• Being flexible and adaptable to changes.
The California SNHMP risk assessment methodology was cited as one example that addresses many of the priorities identified during the first RAS-C meeting. Finally, two literature review criteria matrices were presented and refined at the meeting, to be used to evaluate risk assessments found in academic literature and in other SNHMPs.
Meeting Three: May, 15th
The focus of this meeting was to present and discuss findings from the literature review. Ultimately, the group leaned toward a methodology developed around the concepts proposed by Susan Cutter.
InfoGraphics also presented an early working framework diagram. The team used the diagram initiate conversation about key features of the model (see Figure 1.1).

Oregon Risk Assessment: A New Model August, 2013 Page | 3
Figure 1.1 – Early Model Framework Concept
Source: UO InfoGraphics Lab
Meeting Four: June, 24th
Meeting four focused on presenting the risk assessment model being developed by the InfoGraphics Lab (refer to Figure 1.2 below). The InfoGraphics Lab presented a draft risk assessment model concept based on prior meetings and discussions regarding state and federal priorities for the OR NHMP. The group also discussed the intricacies and functionality of the model.
Figure 1.2 – Draft Model Diagram
Source: UO InfoGraphics Lab
Committee representatives expressed concern about the level of user bias allowable, especially if the user can “turn dials” to weigh parameters. InfoGraphics suggested that state agencies should decide how data is tiered and what weighting parameters should be placed on respective data sets.

Page | 4 Oregon Partnership for Disaster Resilience
FEMA stated that what Oregon is proposing goes beyond federal requirements and that the scope of the project is a good long-term goal for both local jurisdictions and the state. FEMA accepts the proposed level of subjectivity as long as the methodology is transparent and the method can show mitigation tradeoffs, which the model strives to do.
Meeting Five: August, 5th
The InfoGraphics Lab used this meeting to provide a final update to the committee on the progress of the hazard risk assessment model development and testing. In summary, initial efforts to test the viability of the model were successful. InfoGraphics concluded the meetings with a presentation of a three-year timeline, work plan, and budget directed at developing and implementing the model during the next Oregon NHMP update cycle. Finally, the group discussed potential funding sources and strategies to continue tthe project after August, 2013 when the current funding runs out.
The meeting concluded with the RAS-C agreeing to meet in October to review the final report, work plan and budget proposed by InfoGraphics and OPDR. These should be available in late August/ mid-September. This was the last RAS-C meeting prior to the completion of this report.
Oregon Risk Assessment: A New Model August, 2013 Page | 5
This page left intentionally blank.

Page | 6 Oregon Partnership for Disaster Resilience
PHASE 1: LITERATURE REVIEW
The first step to identifying an Oregon-tailored risk assessment was to review risk assessment methodologies. This evaluation involved a comprehensive review of academic literature as well as methodologies contained in other SNHMPs throughout the U.S. This section describes the methods used to identify relevant methodologies identified in the literature and summarizes key findings.
Academic Literature Review
OPDR utilized a four step process to review and evaluate academic literature: 1) literature identification, 2) preliminary screening, 3) secondary screening, and 4) ranking.
In step one OPDR identified literature using a thematic approach to review domestic and international journal articles, industry reports and academic papers. The following keywords were used to limit the search to pertinent themes:
assessment; criteria; flexible; index; indicator; integrated; method; methodology; mitigation; multi-hazard; natural hazard; planning horizon; relativist; return rate; risk; quantitative; scale; spatial; vulnerability.
In step two, OPDR conducted an initial screening by answering the following questions created by the RAS-C. “Yes” answers received a score of 1. “No” answers received a score of 0.
• Is a hazard methodology mentioned? The most basic and overarching criterion for determining a source’s relevancy to this project is whether a methodology is being described or analyzed.
• If so, has the methodology been developed to assess hazard risk and vulnerability? The primary objective of this project is the assessment of risk. Literature should be excluded if risk assessment is not the primary intent of the source.
• Can the method assess multiple hazards or be modified to do so? The intent of this project is to create a methodology to assess all hazards that might affect the state of Oregon. Therefore, sample methods must have the capability of assessing multiple hazards.
• Can the method be applied in Oregon? The geographic focus for this project is the state of Oregon.
Oregon Risk Assessment: A New Model August, 2013 Page | 7
Methodologies must be replicable at the state level, as well as the jurisdictions contained therein.
• Can the method be used to examine different scenarios? Simulating different scenarios would be useful for understanding the adequacies of various mitigation or response strategies given the strength of the hazard (e.g. low flood vs. high flood).
• Can the method examine tradeoffs? Is it possible to vary input parameters to determine the financial and social tradeoffs between mitigation versus response, or one mitigation strategy versus another?
• Does the method possess temporal/dynamic capabilities? System dynamics are important to incorporate if we are to understand how decisions made today impact the changing landscape/
• Is the method able to estimate diverse measures of success? Successful hazard mitigation can be measured in various ways, such a declining insurance claims, declining people displaced, etc.
• Is the method able to account for and effectively communicate uncertainty? No risk model will be able to explain risk with 100% accuracy; therefore, methods for estimating and showing uncertainty in model outcomes are important.
• Is the model able to explain risk, not just show it? While a graphic representation of potential risk is valuable, it should not be the only determinant of vulnerability. A model should be able to explain why a community is at risk, including the factors contributing to a jurisdictions overall vulnerability.
In the third step, OPDR reviewed the literature that ranked highest during the preliminary screening and evaluated it a second time using a more refined set of criteria established by the RAS-C. These criteria included both FEMA requirements and additional RAS-C identified priorities. “Yes” answers received a score of 1. “No” answers received a score of 0.The criteria utilized in step 3 included:
• Probability Does the method asses the future likelihood of hazards?
• Relativist approach

Page | 8 Oregon Partnership for Disaster Resilience
Can the method be used to compare and rank the vulnerability of a geographic area?
• Scalable Can this method be used to assess impacts of hazards at the statewide, regional and sub-regional levels?
• Quantify loss Can the method estimate potential dollar loss es to identify vulnerable structures/ critical facilities/ potential population affected/ changes in population/ changes in land use?
• Mappable Is the output data mappable?
A complete criteria matrix for both the academic literature and SHMP risk assessment reviews can be found in Appendix A.
Literature Review Summaries
Risk assessments in the literature that scored 20 or higher during the evaluation were presented to the RAS-C in May. These included in depth review of Susan Cutter’s Social Vulnerability Index (SoVI) as well as discussion of four additional risk assessment methods culled from the academic literature. Each of these is briefly described below. Appendix B contains a comprehensive summary of each.
Susan Cutter’s Social Vulnerability Index (SoVI) (or Hazards of Place) Method
Cutter provides a well-defined methodology for assessing two elements of vulnerability: Biophysical and Social.3 These elements are comprised of interrelated components, such as topography, income, and transportation networks that, when combined, help to inform the overall vulnerability of an area. However, there is more to vulnerability than just data driven variables. For instance, biophysical vulnerability also consists of the source, impact, and frequency of a hazard. Social vulnerability includes a wide range of social factors including demographic characteristics, perceptions and experiences to risk, and a community’s capacity to respond to risk.
The InfoGraphics Lab utilized key concepts proposed by Cutter to inform a methodology that is unique to Oregon. Specifically, InfoGraphics identified the following strengths in Cutter’s method to bring forward:
• The ability to bring multiple measures of vulnerability into a single index;
• The ability to integrate measures of vulnerability and hazard; and,
3 Cutter, Susan L., Bryan J. Boruff, and W. Lynn Shirley. "Social Vulnerability to Environmental Hazards." SOCIAL SCIENCE QUARTERLY 84, no. 2 (June 2003): 242-61. http://webra.cas.sc.edu/hvri/ pubs/2003_SocialVulnerabilitytoEnvironmentalHazards.pdf.

Oregon Risk Assessment: A New Model August, 2013 Page | 9
• The ability to scale the assessment method to local and statewide levels.
Important elements to this project that were not addressed by Cutter or other methods reviewed by the team included:
• Clarification of an evident disconnect between model results and how those results translate into actionable risk reduction measures;
• The subjective weighting of vulnerability variables; and,
• The ability to indicate which measures drive vulnerability in specific locations.
Four additional journal articles and reports scored a rating above 20 to meet the minimum requirements for consideration as a possible source for Oregon’s hazard assessment methodology. Those four sources are:
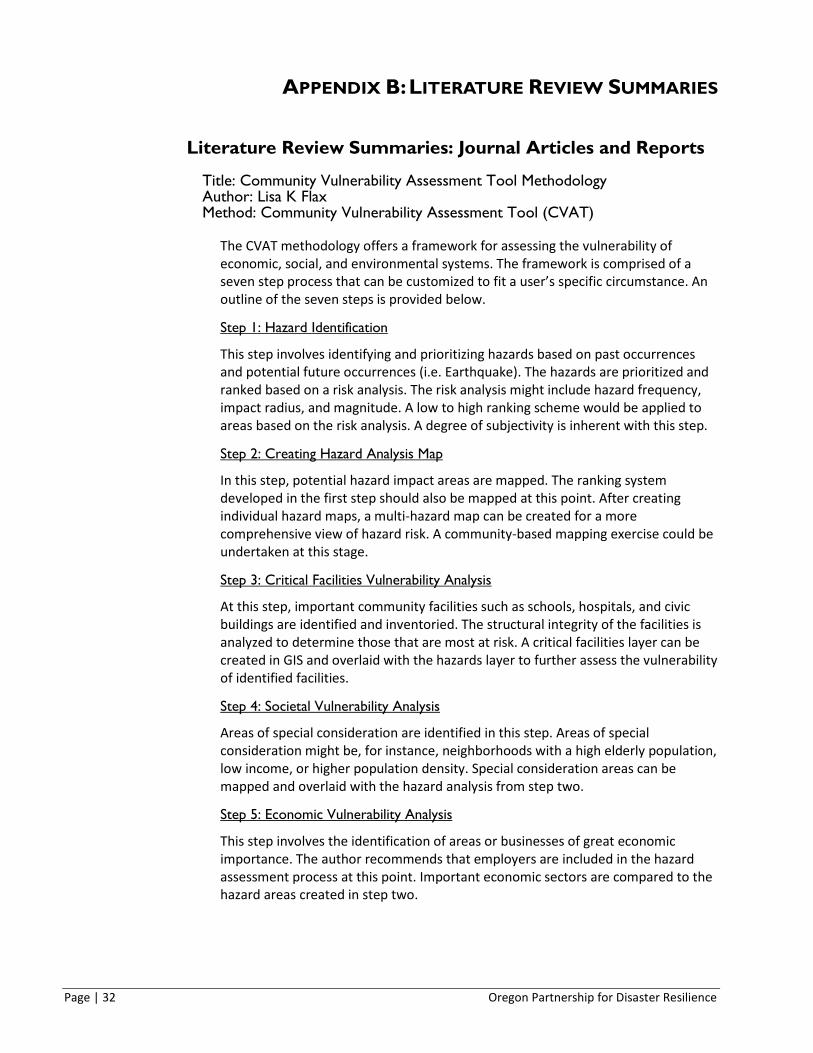
Community Vulnerability Assessment Tool Methodology4
Author: Lisa K Flax (2002)
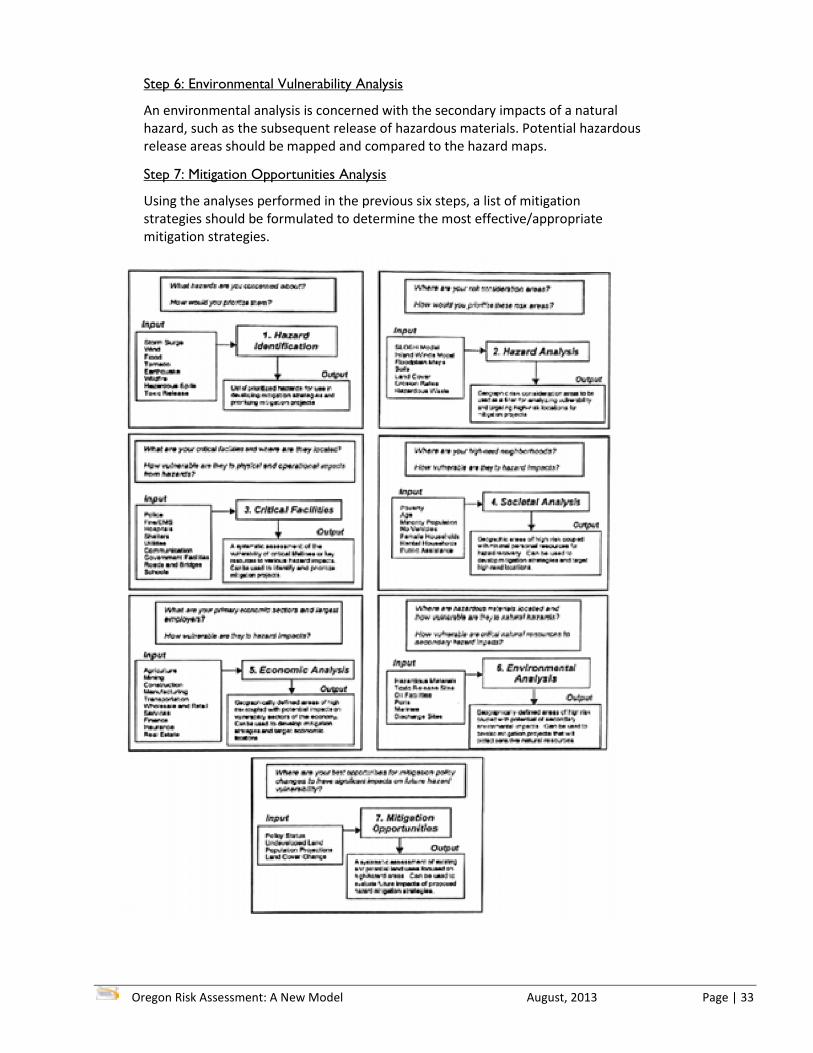
The CVAT methodology offers a framework for assessing the vulnerability of economic, social, and environmental systems. The framework is comprised of a seven step process that can be customized to fit a user’s specific circumstance. The seven step process includes: hazard identification; creating a hazard analysis map; performing a critical facilities vulnerability analysis; performing a societal vulnerability analysis; performing an economic vulnerability analysis; performing an environmental vulnerability analysis; and, performing a mitigation opportunities analysis.
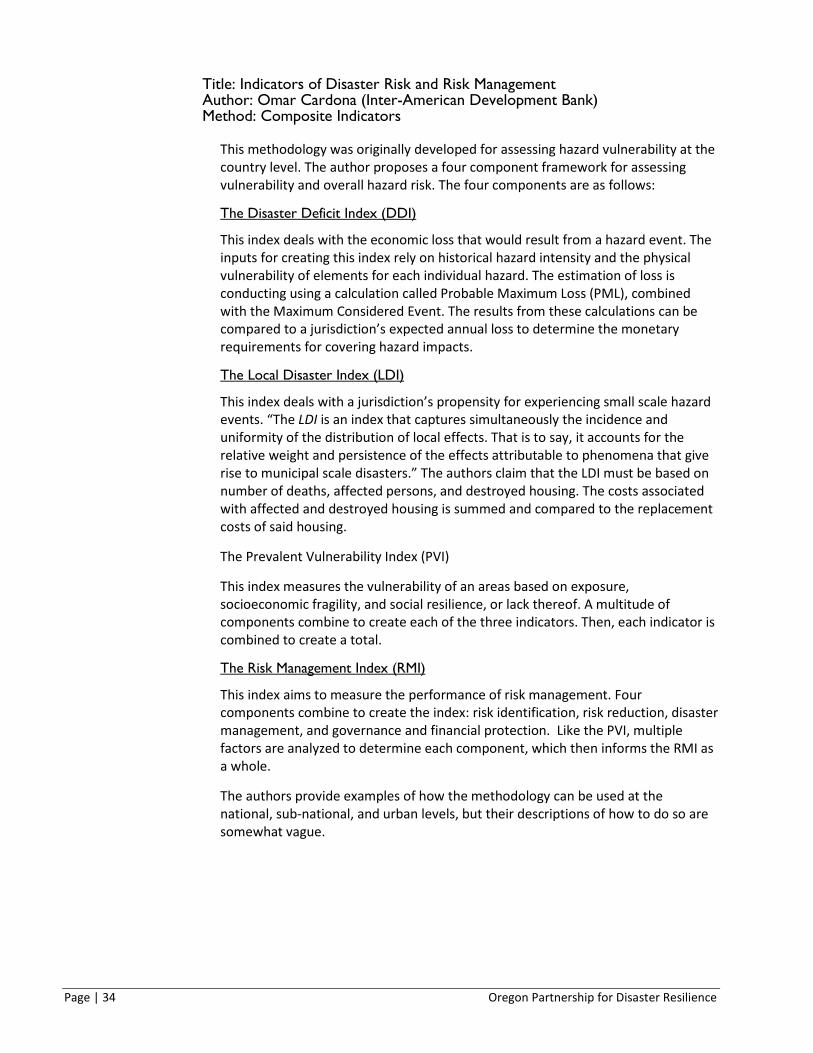
Indicators of Disaster Risk and Risk Management5
Author: Inter-American Development Bank (2005)
This methodology, developed by Cardona, was originally developed for assessing hazard vulnerability at the country level. The author proposes a four component framework for assessing vulnerability and overall hazard risk. The four components are as follows: a disaster deficit index (DDI); a local disaster index (LDI); A prevalent vulnerability index (PVI); and, a risk management index (RMI).
A Methodology for an Integrated Risk Assessment of Spatially Relevant Hazards6
Author(s): Stefan Greiving et. al. (2005)
This methodology was designed to assess risk at the regional level within the boundaries of the European Union. The methodology was created to assess the 4 Flax, Lisa K. "Community Vulnerability Assessment Tool Methodology." Natural hazards review 3, no. 4 (2002): 163-76. 5 Inter-American Development Bank. "Indicators of Disaster Risk and Risk Management." Inter-American Development Bank. Last modified January 2005. http://www.iadb.org/en/publications/publication-detail,7101.html?id=17378. 6 Greiving, Stefan, Mark Fleischhauer, and Johannes Lückenkötter. "A Methodology for an Integrated Risk Assessment of Spatially Relevant Hazards." Journal of Environmental Planning and Management 4, no. 1: 1-19. Accessed January 2006. http://www.tandfonline.com/doi/pdf/ 10.1080/09640560500372800.

Page | 10 Oregon Partnership for Disaster Resilience
total risk potential of a region using a multi-hazard analysis consisting of four components: creating hazard maps; combining hazard maps; performing a vulnerability assessment; and, creating a composite risk map.
Integrated Hazards Mapping Tool7
Author(s): Eric Tate et. al. (2011)
The Integrated Hazards Mapping Tool (IHAT) uses a web-based vulnerability mapping application for use by local and state officials. The method was developed to aid jurisdictions in meeting the requirements of the Disaster Mitigation Act of 2000. The web mapping aspects of IHAT make it highly accessible and easy to use. The IHAT methodology relies on the Hazards of Place framework developed by Susan Cutter. The Hazards of Place framework consists of assessing the biophysical and social vulnerabilities of an area to produce a Social Vulnerability Index, which can then be analyzed or mapped to determine the overall vulnerability of an area.
SNHMP Risk Assessment Review
In addition to the review of academic literature conducted by OPDR, DLCD reviewed risk assessment methods used in select SNHMPs. The SNHMPs chosen were either from 1) states within the FEMA Region 10 and at risk of similar hazards or 2) states identified as having a model risk assessment practice in the report State Hazard Mitigation Plan Evaluation and Model Practices, by The Center for Study of Natural Hazards and Disasters (2009). Based on these criteria, DLCD selected and reviewed SNHMPs from the following seven states: Washington, California, Idaho, Wisconsin, Florida, Louisiana and South Carolina. DLCD used the same two sets of criteria and scoring system developed to evaluate and rank methodologies found in academic literature to evaluate and rank the selected SNHMPs. As noted above, a complete criteria matrix for both the academic literature and SHMP risk assessment reviews can be found in Appendix A.
State Methodologies
Four state risk assessment methodologies scored a 20 or above when filtered through the criteria matrix. The four state methodologies are:
California Risk Assessment Method8
Author: California
California’s methodology uses a GIS-based integrated multi-hazard risk assessment that assesses risk exposure and social vulnerability to primary hazards at the county
7 Tate, Eric, Christopher G. Burton, Melissa Berry, Christopher T. Emrich, and Susan L. Cutter. "Integrated Hazards Mapping Tool." Transactions in GIS 15, no. 5 (October 2011): 689-706. http://onlinelibrary.wiley.com/doi/10.1111/j.1467-9671.2011.01284.x/abstract. 8 California Emergency Management Agency. 2010 State of California Multi-Hazard Mitigation Plan. 2010. http://hazardmitigation.calema.ca.gov/plan/state multihazard mitigation plan shmp.

Oregon Risk Assessment: A New Model August, 2013 Page | 11
and sub-county levels. Outputs are represented as patterns based on raster-based analyses. California developed its own social vulnerability index, called CAlSVI, based on a Susan Cutter-type algorithm. Notably, CAlSVI combines in a simpler manner a smaller sets of variables than Cutter’s SoVI.
Idaho Risk Assessment Method9
Author: Idaho
Idaho uses a multi-pronged approach to assessing risk that results in a highly comparative assessment. To begin, Idaho analyzes data from local natural hazard mitigation plans (LNHMP) in comparison to state data. Idaho also maps and charts the focus of mitigation actions in LNHMPs in comparison to that by region. In addition, HAZUS-MH-4 is used to analyze flood and earthquake losses in greater detail. Finally, Idaho provides a detailed consequence analysis of hypothetical events for the three hazard groups that have the most impact on Idaho: floods, earthquakes, and wildfires.
South Carolina Risk Assessment Method10
Author: South Carolina
South Carolina uses two methods to assess risk: 1) HAZUS-MH MR4, to estimate losses from hurricanes, wind, flood, and earthquakes, and 2) a statistical approach to determine actual hazard damage over time and the hazard’s probability of occurring. For those hazards outside the scope of HAZUS, a social vulnerability index, similar to the one developed by Susan Cutter, is used to assess vulnerability. Hazards are assessed at the state, county, and census tract levels.
Rhode Island Vulnerability Assessment Method11
Author: Rhode Island
Rhode Island uses a modified Community Vulnerability Assessment Tool (CVAT) to assess risk. Initially, CVAT was developed and funded through the National Oceanic and Atmospheric Administration (NOAA) Coastal Services Center (CSC) for cities and counties. NOAA CSC worked with Rohde Island to modify this approach in order to assess risk on a statewide basis. The RI NHMP risk assessment involves three types of risk and vulnerability scores: hazard scores, vulnerability scores, and combined scores (combining the risk and the vulnerability). Each of the three risk scores describes different aspects of the vulnerability (social, critical facilities, economic and environmental) for each natural hazard in a given region.
9 Idaho Bureau of Homeland Security. State of Idaho Hazard Mitigation Plan.. 2010. http://www.bhs.idaho.gov/Resources/PDF/SHMPFinalw-signatures.pdf. 10 South Carolina Emergency Management Division. South Carolina Hazard Mitigation Plan. 2010.http://www.scemd.org/index.php?option=com_content&view=article&id=51:mitigation&catid=19:plan-and-prepare&Itemid=200. 11 Rhode Island Emergency Management Agency. Rhode Island State Hazard Mitigation Plan. 2011.http://www.riema.ri.gov/preparedness/preparenow/prepare_docs/RI_State_HM_Plan%20Final.pdf.

Page | 12 Oregon Partnership for Disaster Resilience
Summary of Literature Review Findings
Themes from the literature review of particular interest to the RAS-C included:
• Taking a vulnerability-of-place based approach
• The importance of the scale of the data
• The ability to compare local and state assessment findings
• Creating an Oregon-tailored social vulnerability index
• Expanding on the social vulnerability index (SoVI) created by Susan Cutter
The one method that gained the most interest from the committee was Susan Cutter’s SoVI. SoVI,and SoVI-like elements, were found in both academic literature and in SNHMPs that scored highest during the literature review.

Oregon Risk Assessment: A New Model August, 2013 Page | 13
This page left intentionally blank.
Page | 14 Oregon Partnership for Disaster Resilience
PHASE 11: RISK ASSESSMENT MODEL DEVELOPMENT
This section presents an overview of the vulnerability assessment model including: primary and secondary qualities; vulnerability and hazard inputs; the role of subjectivity; the aggregation of data; and the form and function of outputs. Primary and secondary qualities reflect priorities identified by the RAS-C for the OR NHMP risk assessment. Vulnerability and hazard inputs are data sets grouped into vulnerability categories or individual hazards. Subjectivity is embraced in the model by allowing the user to weight the importance of each data set input. Data sets are pre-identified and defined by agency experts, therefore placing parameters on the level of allowable subjectivity. Vulnerability and hazard data are aggregated to compute a vulnerability index for each vulnerability category and also for all vulnerability categories combined; as well as the ability to compute a hazard index for each hazard and also for all hazards combined. Output data can be viewed in a variety of formats, making the data accessible to a wide range of user groups.
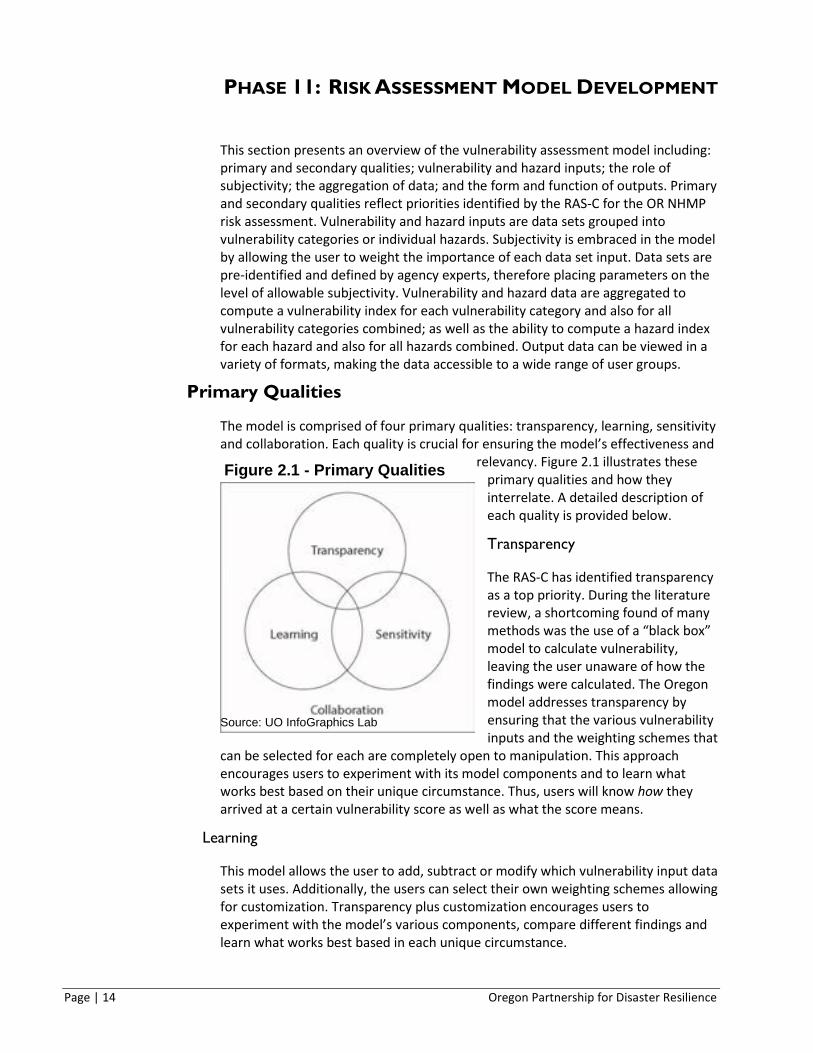
Primary Qualities
The model is comprised of four primary qualities: transparency, learning, sensitivity and collaboration. Each quality is crucial for ensuring the model’s effectiveness and
relevancy. Figure 2.1 illustrates these primary qualities and how they interrelate. A detailed description of each quality is provided below.
Transparency
The RAS-C has identified transparency as a top priority. During the literature review, a shortcoming found of many methods was the use of a “black box” model to calculate vulnerability, leaving the user unaware of how the findings were calculated. The Oregon model addresses transparency by ensuring that the various vulnerability inputs and the weighting schemes that
can be selected for each are completely open to manipulation. This approach encourages users to experiment with its model components and to learn what works best based on their unique circumstance. Thus, users will know how they arrived at a certain vulnerability score as well as what the score means.
Learning
This model allows the user to add, subtract or modify which vulnerability input data sets it uses. Additionally, the users can select their own weighting schemes allowing for customization. Transparency plus customization encourages users to experiment with the model’s various components, compare different findings and learn what works best based in each unique circumstance.
Figure 2.1 - Primary Qualities
Source: UO InfoGraphics Lab

Oregon Risk Assessment: A New Model August, 2013 Page | 15
Sensitivity
The vulnerability and risk assessment process is an iterative process, not something that can be tackled with a single run of a model. This model embraces the need to run multiple iterations to order to understand what is driving vulnerability. Each time the model is “run” the user selects which vulnerability and hazard data inputs and weighting schemes to use. For each “run” the model calculates the correlation, or statistical significance, between the vulnerability and hazard data. In this project, this is referred to as “sensitivity” between data sets. Figure 2.2 illustrates how sensitivity might affect different variables depending on how a user chooses to weigh them. The variables on the left are weighted using the dials in the middle, and the model provides the output on the right demonstrating those variables that have a strong influence on the model results (orange bars) versus those variables that have a weaker influence (blue bars).
Figure 2.2 – Variable Sensitivity
Source: UO InfoGraphics Lab
Collaboration
Collaboration is essential in any planning process, especially when a wide range of stakeholders can influence and/or be affected by the outcome. The opportunity to manipulate data set inputs and learn from outputs allows for three types of collaboration:
• Collaboration among agency experts to identify and define data sets based on best available data;
• Collaboration among state agencies to run the model and assess vulnerability statewide; and

Page | 16 Oregon Partnership for Disaster Resilience
• Collaboration between agency experts and local communities to assess vulnerability at the community level.
Secondary Qualities
Secondary qualities represent the most basic components that are required to ensure that any hazard assessment model can function effectively. A model must be accessible to the intended users. A model must remain relevant in light of geographic and analytical changes. Hazard assessment models should be scalable, allowing for analysis at different geographic levels. Lastly, outputs should be comparable so that users can see changes as inputs are manipulated.
Accessible
Many different user groups will need to be able to use the model with relative ease. The intention is to design a model that is easy to use and understand while being robust enough to produce relevant, accurate and meaningful results. The model is not specifically designed for modelers or GIS experts. Laypeople, planners, practitioners, students, and others should be able to utilize the model for assessing vulnerability. Ultimately, data for the model will be made available over the web so that users do not require data collection and preparation. The results will be intuitive in order for a range of people to utilize the model’s findings for use in practice.
Flexible
Due to the perpetual fluctuation inherent in vulnerable systems and hazard areas, vulnerability and hazard data sets are periodically updated to reflect new or changing information. Furthermore, the availability and accuracy of data often varies over time and geographic space. Taking this into consideration, the risk assessment model will be developed to allow for the alteration of vulnerability and hazard data set inputs. This flexibility allows the model to remain relevant in light of political, economic, social or environmental changes, to name a few.
Additionally, the RAS-C recognized that data sets vary with respect to quality, quantity and applicability. In response, a tiered system for selecting data sets has been created as a key component of the model. Users can select between three tiers, with tier one representing the highest quality data and tier three the lowest. An example of the tiered system as it applies to the model is depicted in Figure 2.3. As data changes in quality, the flexibility of the model allows these datasets to move between tiers.

Oregon Risk Assessment: A New Model August, 2013 Page | 17
Figure 2.3 – Data Tiers
Source: UO InfoGraphics Lab
Scalable
The state is required to assess vulnerability at both the statewide and jurisdictional scale. Therefore, the model needs to permit evaluation and assessment at various geographic scales. Scalability is accomplished by allowing inputs to be aggregated at different levels. All data inputs for the model are standardized into a raster format to allow for the systematic weighting of variables.
Comparable
The beauty of this model is its ability to allow the users to perform multiple “runs” of the model with different data set inputs, analyze multiple scenarios and perform cross-comparative analyses to determine the most vulnerable areas with the greatest sensitivity, or statistical significance. The result is the identification of most vulnerable areas as well as an understanding of what is driving the relationship between the vulnerability and the hazard.
Vulnerability Inputs
The hazards model takes into consideration five primary vulnerability categories: environmental, social, economic, infrastructure, and networks. Each category is comprised of individual vulnerability datasets which, when combined, determine the overall vulnerability for a particular location.
Environmental
The environmental category primarily includes natural systems that provide significant ecological services or value to community. Potentially susceptible
Page | 18 Oregon Partnership for Disaster Resilience
natural environment examples include resource extraction sources, air and water quality, flood storage, etc. Each of these might be influenced by topography, precipitation, hydrology, etc.
Social
This element describes the factors that affect the vulnerability of sensitive populations. These factors might include age, income, disability, and ethnicity, among many others.
Economic
This element includes factors that contribute to or support economic development and vitality. These factors include access to capital, employment, community affluence, business retention, etc.
Infrastructure
Infrastructure vulnerabilities include basic man-made support systems within a jurisdiction. These include essential facilities such as hospitals, schools, retirement homes, bridges, utilities, etc., as well as other more general forms of built infrastructure such as housing, businesses, industrial facilities, etc. Without stable and resilient infrastructure, a jurisdiction may not be able to adequately provide for the needs of its citizens.
Network
Network vulnerability refers to the interconnected web of supply chains that allow a jurisdiction to function effectively. Networks can include roads, bridges, electricity, communications, and other vital systems. Networks often connect smaller jurisdictions with regional distribution hubs, meaning that a disruption in a particular network can have far-reaching implications.
Hazard Inputs
Natural hazards are naturally occurring threats, such as flooding or earthquakes, which can have a potentially negative impact on an area. Oregon’s natural hazards include: climate change, coastal erosion, drought, dust storm, earthquake, wildfire, flood, landslide/debris flow, tsunami, volcano, windstorm and winter storm. Ultimately, data sets for each hazard will be available in this risk assessment model.
Each hazard has its own unique geographic extent. Therefore, when running the model at the jurisdictional level, only hazards relevant to that jurisdiction will be available to assess vulnerability.
Embracing Subjectivity
The model embraces subjectivity while placing bookends on the degree of subjectivity allowable. The ability for the user to choose which data set inputs and weighting schemes to use makes the model inherently subjective, but only to a point. Prior to the user’s use of the tool, agency experts will have pre-approved: 1) which data sets could be used in the model and 2) parameters for acceptable
Oregon Risk Assessment: A New Model August, 2013 Page | 19
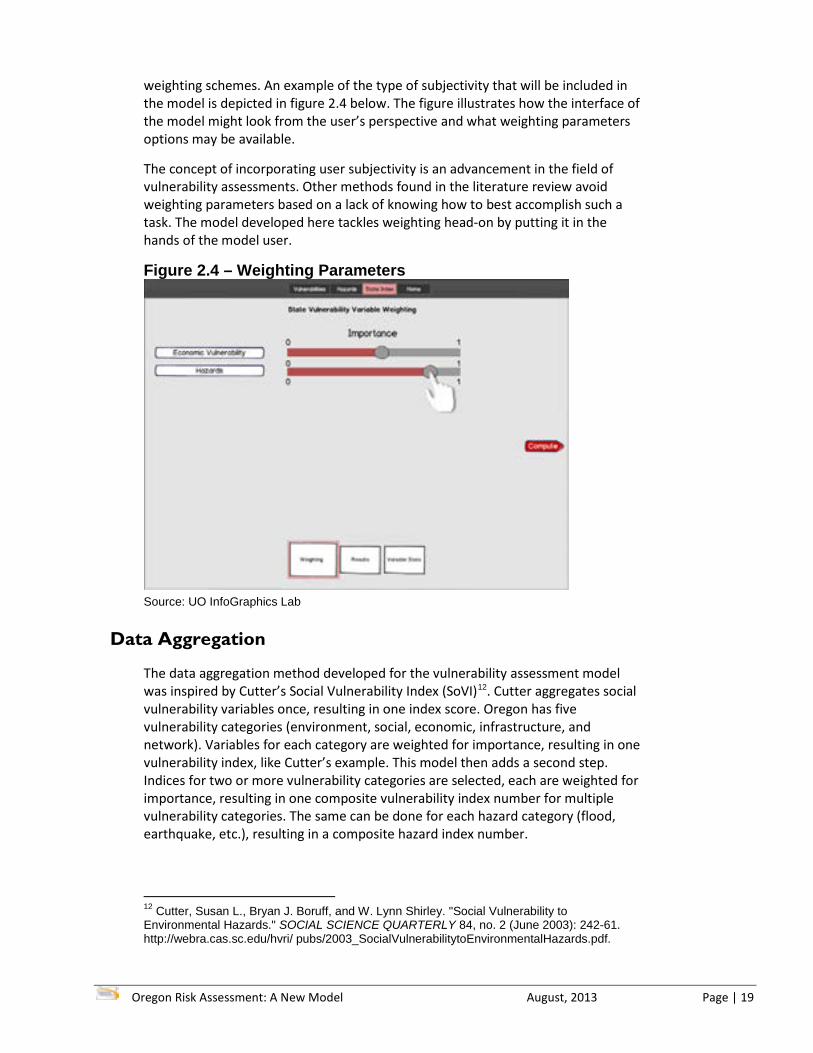
weighting schemes. An example of the type of subjectivity that will be included in the model is depicted in figure 2.4 below. The figure illustrates how the interface of the model might look from the user’s perspective and what weighting parameters options may be available.
The concept of incorporating user subjectivity is an advancement in the field of vulnerability assessments. Other methods found in the literature review avoid weighting parameters based on a lack of knowing how to best accomplish such a task. The model developed here tackles weighting head-on by putting it in the hands of the model user.
Figure 2.4 – Weighting Parameters
Source: UO InfoGraphics Lab
Data Aggregation
The data aggregation method developed for the vulnerability assessment model was inspired by Cutter’s Social Vulnerability Index (SoVI)12. Cutter aggregates social vulnerability variables once, resulting in one index score. Oregon has five vulnerability categories (environment, social, economic, infrastructure, and network). Variables for each category are weighted for importance, resulting in one vulnerability index, like Cutter’s example. This model then adds a second step. Indices for two or more vulnerability categories are selected, each are weighted for importance, resulting in one composite vulnerability index number for multiple vulnerability categories. The same can be done for each hazard category (flood, earthquake, etc.), resulting in a composite hazard index number.
12 Cutter, Susan L., Bryan J. Boruff, and W. Lynn Shirley. "Social Vulnerability to Environmental Hazards." SOCIAL SCIENCE QUARTERLY 84, no. 2 (June 2003): 242-61. http://webra.cas.sc.edu/hvri/ pubs/2003_SocialVulnerabilitytoEnvironmentalHazards.pdf.

Page | 20 Oregon Partnership for Disaster Resilience
Correlation
Another unique attribute of the model is the degree to which it assesses the correlation between particular variables (i.e. data sets) and the vulnerability index. This focus allows the user to better understand how sensitive the model is to a given variable as well as how correlated variables are to the index.
Figure 2.5 illustrates an interface in which three vulnerability variables (i.e. age, ethnicity, and income) are used to estimate a SoVI map. The variables are ranked (left side of figure) based on their correlation with the SoVI index. The correlation is calculated by the Pearson’s Correlation coefficient:
𝑟 =∑ (𝑋𝑖 − 𝑋�)(𝑌𝑖 − 𝑌�)𝑛𝑖=1
�∑ (𝑋𝑖 − 𝑋�)2𝑛𝑖=1 �∑ (𝑌𝑖 − 𝑌�)2𝑛
𝑖=1
Figure 2.5 – A correlation scatterplot indicating the relationship between an input variable (% of population over 65 years) and the SoVI output.
Source: UO InfoGraphics Lab
Next, we demonstrate how the subjectivity introduced by the user-defined weighting impacts these correlation results. Fig. 2.6 shows a prototype for this component, where each variable of vulnerability (on the left) is weighted by a single user (or potentially multiple experts) with regards to their importance as represented by the grey dials in the middle (the grey dials align along the yellow dotted line when all variables are weighted equally). Once weights have been selected, a SoVI model is calculated and the correlation analysis in Part 1 is applied. Next, we calculate the degree to which the weighting scheme influenced how variables correlate with the SoVI outputs (right side of Fig. 2). For example, median family income received a marginal increase in weight, but the length of the orange

Oregon Risk Assessment: A New Model August, 2013 Page | 21
bar on the right indicates a significantly large increase in the correlation between income and the SoVI output. This demonstrates that small changes in the importance of income have a large positive impact to the SoVI output. Conversely, a large increase in weighting of the age variable (i.e. 65 and older) has only a small positive influence, while small increases in the importance of ethnicity results in a negative change in correlation (a non-intuitive outcome, but plausible as demonstrated in our preliminary research). Addressing subjectivity is a transformative move forward in SoVI research as it provides important information regarding which variables have the greatest impact in reducing measures of vulnerability.
Figure 2.6. A prototype interface illustrating how changing the weight of an input variable (grey dials) either increases or decreases the influence of that variable on the final SoVI.
Source: UO InfoGraphics Lab
Model Outputs
The Oregon model presents outputs in numerous formats, including raw statistical information, graphs, and maps. Figure 2.6 shows how hazard threats and economic vulnerabilities may be depicted using a map format. The map shows relative economic vulnerability across the state in relation to one hazard. It also shows the correlation between economic variables and hazard, allowing users the ability to perform higher level analysis and subsequent learning opportunities that enhance the state’s ability to understand and mitigate risk.

Page | 22 Oregon Partnership for Disaster Resilience
Figure 2.6 – Weighting Output Groups
Source: UO InfoGraphics Lab

Oregon Risk Assessment: A New Model August, 2013 Page | 23
PHASE III: MODEL TESTING
During phase three, InfoGraphics tested the feasibility of the model.
Approach
Using statewide wildfire, flood and socioeconomic data the InfoGraphics Lab tested various weighting schemes and overlay options. A total of eight scenarios were produced based on altering the influence that different variables had on determining vulnerability. For instance, in one scenario the fire hazard variable was assigned a weight of 70% while the flood hazard variable was assigned a weight of 30%, meaning that in that specific scenario the fire hazard was more important for explaining vulnerability than the flood hazard. Figures 2.6A and B represent two of the outputs that resulted from testing the model. Figure 2.6A illustrates vulnerability ratings throughout the state based on an equal weighting scenario, while Figure 2.6B illustrates how vulnerability changes when the fire hazard is assigned greater weight.
Figure 2.6A – Equal Weighting Scenario
Source: UO InfoGraphics Lab
Equal Weighting

Page | 24 Oregon Partnership for Disaster Resilience
Figure 2.6B – Weighted for Fire
Source: UO InfoGraphics Lab
Limitations
Like all technologies, there is a learning curve in understanding how specific functions influence the outcomes of the model. To fully comprehend the functionality of the model, it will need to be extensively tested over the course of its development (approximately three years). One of the constraints to refining the model and increasing functionality is the data itself. For accurate outputs, all data sets have to be standardized before they can be used together in the model. Second, data set standardization, tiering data and establishing data weight parameters require state agency collaboration from agencies with limited resources. Buy-in from other agencies will be dependent on staff time, political will and funding.
Decreased Vulnerability
Increased Vulnerability
Weighted for Fire

Oregon Risk Assessment: A New Model August, 2013 Page | 25
PHASE IV: LONG-TERM WORK PLAN AND BUDGET
Proposed Three-Year Work Plan
The RAS-C proposes developing the full risk assessment model over a three-year time period in order to (1) match likely grant funding performance periods and (2) realistically reflect the amount of time it will take to convene state agency representatives during the process. Developing the model will involve three primary activities. First, the team will need to identify a full range of data sources. Once identified, data will be categorized, organized and normalized for use in the model. Next, the team will develop and program the model. This activity will include the creation of vulnerability indices, model output products, and higher level statistical analysis capabilities. Finally, the team will create a custom software interface that will allow users to manipulate the data and create multiple outputs.
Key phases of model development include (1) creating the model prototype and identifying data layers, (2) testing and refinement of a beta version and (3) full model production and output generation. Each phase is discussed in greater detail below:
Year 1: Prototype and Data
During year one, the InfoGraphics Lab will create a prototype of the model with a limited dataset consisting of hazard vulnerability and social vulnerability data. This phase will include development of the data ingestion method and data weighting heuristic method. The interface of the model will also be designed and prototyped during year one to prepare for group testing in year two.
Year 2: Beta and Refinement
During year two, economic and environmental data will be incorporated into the model, and the functionality of the model will be refined as needed. After initial refinements have been made, the model will be tested by a small group consisting of IHMT members.
Year 3: Production and Output
In year three, infrastructure and network vulnerability datasets will be added. The model will then be further refined by an expanded group of users. After the second round of testing has concluded, the model will be published and distributed as an application. Other minor and ongoing refinements to the model will occur as the model is being finalized.
Risk Assessment Subcommittee Activities
The RAS-C identified several activities that can take place without additional outside resources or funding. These include the gathering of additional input data; establishing criteria for data tiers and weighting parameters; and identifying other funding sources.

Page | 26 Oregon Partnership for Disaster Resilience
Sample Budget
To provide a rough estimate of the budget needed to develop and test the model and provide a usable software interface, InfoGraphics developed a sample three-year budget as a starting point for conversation. Table 4.1 outlines the expected labor costs by year.
Table 4.1: - Sample Budget
Source: UO InfoGraphics Lab
Funding Options
The current round of funding to support the development of the hazard assessment model is insufficient to sustain the project over the estimated three year period. Therefore, additional funding is required. The following sources represent potential funding opportunities:
FEMA Hazard Mitigation Grant Program13
“The Hazard Mitigation Grant Program (HMGP) provides grants to states and local governments to implement long-term hazard mitigation measures after a major disaster declaration. The purpose of the HMGP is to reduce the loss of life and property due to natural disasters and to enable mitigation measures to be implemented during the immediate recovery from a disaster. The HMGP is authorized under Section 404 of the Robert T. Stafford Disaster Relief and Emergency Assistance Act.”
National Institutes of Health Grant Program14
Small Grant Program (R03)
“The R03 grant mechanism will support small research projects that can be carried out in a short period of time with limited resources. The common characteristic of the small grant is the provision of limited funding for a short period of time.” The
13 FEMA. "Hazard Mitigation Grant Program." Federal Emergency Management Agency. Last modified August 13, 2013. http://www.fema.gov/hazard-mitigation-grant-program. 14 NIH. "NIH Small Grant Program (R03)." National Institutes of Health. http://grants.nih.gov/grants/funding/r03.htm.
Labor Year 1 Year 2 Year 3 TotalFaculty
Principle Investigator (0.20 FTE) 28,000$ 28,000$ 28,000$ 84,000$ Co-Principle Investigator (0.20 FTE) 28,000$ 28,000$ 28,000$ 84,000$
StaffResearch Associate (0.20 FTE) 20,000$ 20,000$ 20,000$ 60,000$ Research Assistant (0.20 FTE) 20,000$ 20,000$ 20,000$ 60,000$
StudentsGraduate Research Fellow 1 (0.49 FTE) 50,000$ 50,000$ 50,000$ 150,000$ Graduate Research Fellow 2 (0.49 FTE) 50,000$ 50,000$ 50,000$ 150,000$
Total 196,000$ 196,000$ 196,000$ 588,000$

Oregon Risk Assessment: A New Model August, 2013 Page | 27
timeframe of a project should not exceed two years. A maximum of $50,000 may be allotted to projects through the Small Grant Program.
National Science Foundation Grant Programs
Interdisciplinary Research in Hazards and Disasters (Hazards SEES)15
“Hazards SEES seeks research projects that will productively cross the boundaries of the atmospheric and geospace, earth, and ocean sciences; computer and information science; cyberinfrastructure; engineering; mathematics and statistics; and social, economic, and behavioral sciences. Successful proposals will integrate across these multiple disciplines to promote research that advances new paradigms that contribute to creating a society resilient to hazards. Hazards SEES intends to transform hazards and disaster research by fostering the development of interdisciplinary research that allows for appropriately targeted data collection, integration, and management; modeling (including predictive models for real-time decision making); visualization and simulation; data analytics and data-driven discovery; real-time sensing; cross-cutting knowledge development; and synthesis of applicable models and theory. Proposals must demonstrate the inclusion of the appropriate expertise to address the research questions, hypotheses, and problems being posed. Hazards SEES research projects should be designed around one or more locations, identifiable hazards, and/or themes. Furthermore, Hazards SEES research should train the next generation of scientists for interdisciplinary hazards and disaster research.”
Type 1 projects under this grant are funded up to $300,000 for up to 2 years duration.
Due dates for the current grant funding cycle were not mentioned on the website. However, the due date for the previous round of funding was February 4th, 2013.
Geography and Spatial Sciences (GSS)16
“The Geography and Spatial Sciences Program sponsors research on the geographic distributions and interactions of human, physical, and biotic systems on the Earth's surface. Investigations are encouraged into the nature, causes, and consequences of human activity and natural environmental processes across a range of scales. Projects on a variety of topics (both domestic and international) qualify for support if they offer promise of contributing to scholarship by enhancing geographical knowledge, concepts, theories, methods, and their application to societal problems and concerns. GSS encourages projects that explicitly integrate undergraduate and graduate education into the overall research agenda.”
Regular research awards supported by GSS generally range from between $40,000 to $400,000.
The due date for proposals is February 13, 2014.
15 NSF. "Interdisciplinary Research in Hazards and Disasters (Hazards SEES)." National Science Foundation. http://www.nsf.gov/pubs/2012/nsf12610/nsf12610.htm. 16 NSF. "Geography and Spatial Sciences Program (GSS)." National Science Foundation. https://www.nsf.gov/funding/pgm_summ.jsp?pims_id=503621.

Page | 28 Oregon Partnership for Disaster Resilience
This page left intentionally blank.

Oregon Risk Assessment: A New Model August, 2013 Page | 29
SECTION IV: APPENDICES
Appendix A: Literature Review Criteria Matrix
ORNHMP Risk Assessment Methodology Evaluation Criteria ChecklistRequirement Method
Name:
Brooks CVATVulnerability
Scoping Diagram/8 Steps
Scoring: 0 = No; 1 = Yes; Leave blank if unknownPRELIMINARY EVALUATION
Hazard Methodology 44 CFR 201.4(c)(2) Is a hazard methodology mentioned? 1 1 1Hazard risk and vulnerability
44 CFR 201.4(c)(2) Has the methodology been developed to assess hazard risk and vulnerability?
1 1 1
Multiple hazards 44 CFR 201.4(c)(2)(i) Can the method assess multiple hazards or be modified to do so?
1 1 1
Public domain not regulated Is the methodology in the public domain? 1 1 1Different scenarios not regulated Can the method be used to examine different
scenarios? (magnitudes)1 1 1
Tradeoffs not regulated Is it possible to vary input parameters to determine the financial and social tradeoffs among mitigation strategies?
1 1 1
Temporal/dynamic qualities not regulated Does the method possess temporal/dynamic capabilities? 1 1 1
Diverse measures of success
not regulated Is the method able to estimate diverse measures of success (social, economic, environmental)?
1 1 1
Totals: 8 8 8
SECONDARY EVALUATIONProbability 44CFR 201.4(c)(2)(i) Does the method assess the future likelihood of
hazard events ?- - -
Relativist approach 44 CFR 201.4(c)(2)(ii) Can the method be used to compare and rank the vulnerability of geographic areas?
1 1 1
Scalable 44 CFR 201.4(c)(2)(ii) Can this method be used to assess statewide impacts of hazards?
1 1 1
44 CFR 201.4(c)(2)(ii) Can this method be used to assess impacts of hazards at the regional level?
1 1 1
preferred, not required Can this method be used to assess impacts of hazards at the local level (e.g. county or city)?
1 1 1
Quantify loss 44 CFR 201.4(c)(2)(ii) & 44 CFR 201.4(c)(2)(iii)
Can the method estimate potential dollar losses to identified vulnerable structures?
0 0 0
44 CFR 201.4(c)(2)(ii) & 44 CFR 201.4(c)(2)(iii)
Can the method estimate potential dollar losses to identified critical facilities?
0 0 0
44 CFR 201.4(c)(2)(ii) & 44 CFR 201.4(c)(2)(iii)
Can the method estimate potential population affected?
1 0 0
Changes in development 44 CFR 201.4(d) Can the method indicate changes in population? 0 1 044 CFR 201.4(d) Can the method indicate changes in land use? 0 1 044 CFR 201.4(d) Can the method indicate changes in implemented
mitigation actions?0 1 0
Range of risk values not regulated Does the method use a range of 3-or-more values to assess probability? (e.g. High-Medium-Low.) 1 1 0
Transparent not regulated Is the methodology simple, clear and objective so it can be replicated by state agencies and jurisdictions?
1 1 1
Able to map 44 CFR 201.4(c)(2)(i) Is the output data mappable? 1 1 0Multi-hazard /integrated approach
not regulated Can risk to multiple hazards be illustrated in one integrated map using this method?
0 1 0
Data in usable format not regulated Can the method produce data in a format that could be made accessible to jurisdictions, regardless of their capacity?
1 1 1
Stakeholder input not regulated Is participatory mapping(or community-based mapping) included in the method?
0 1 1
Subjective values not regulated Does the methodology allow for the input of subjective values? (possibly only relevant at regional and local scales)
1 1 1
Totals: 10 14 8
TOTALS: 18 22 16
Criteria Description

Page | 30 Oregon Partnership for Disaster Resilience
8 Steps-5 Criteria
Disaster Index
Integrated Risk Assessment -- Multi-
Hazards
IADB/PVI Indices
Methodology Comparison (SUPP)
Delphi Technique
(SUPP)
Delphi Technique
(SUPP)
American HDI (SUPP)
Visual Risk Communication
(SUPP)
Fragility Curves
1 1 1 1 0 0 0 0 0 1
1 1 1 1 - - - - - 1
1 1 1 1 - - - - - 1
1 1 1 1 - - - - - 1
1 1 1 1 - - - - - 1
1 1 1 1 - - - - - 1
1 1 1 1 - - - - - 1
0 0 1 1 - - - - - 0
7 7 8 8 0 0 0 0 0 7
- 1 1 - - - - - - 0
1 1 1 1 - - - - - -
1 - 1 1 - - - - - -
1 - 1 1 - - - - - -
1 1 1 1 - - - - - -
0 1 - 1 - - - - - -
0 1 - 1 - - - - - -
0 0 1 1 - - - - - 1
1 0 1 1 - - - - - -1 1 1 1 - - - - - -
1 1 - 1 - - - - - -
0 1 1 1 - - - - - -
1 1 1 0 - - - - - 0
1 1 1 1 - - - - - -
0 0 1 1 - - - - - -
1 1 1 1 - - - - - -
1 0 1 0 - - - - - -
1 0 1 1 - - - - - 0
12 10 13 14 0 0 0 0 0 1
19 17 21 22 0 0 0 0 0 8

Oregon Risk Assessment: A New Model August, 2013 Page | 31
WA 2012 NHMP CA 2012 NHMP FL 2013 NHMP SC 2012 NHMP RI 2011 NHMP LA 2011 NHMP ID 2012 NHMPSpatial
Planning (SUPP)
Multi-Risk
Assessment
(MRA)
Nat. Hazard
Probability and
Risk Analysis (HOA)
Integrated Hazards Assessment Tool (IHAT)
Experts in
Uncertainty
(SUPP)
1 1 1 1 1 1 1 1 1 1 1 0
1 1 1 1 1 1 1 1 1 1 1 -
1 1 1 1 1 1 1 1 1 1 1 -
1 1 1 1 1 1 1 1 1 1 1 -
1 1 1 1 1 0 1 1 1 1 1 -
0 1 0 1 1 1 0 1 1 1 1 -
0 0 0 1 0 0 1 1 1 1 1 -
0 1 1 1 1 1 1 1 1 1 1 -
5 7 6 8 7 6 7 8 8 8 8 0
1 1 1 1 1 1 1 - 1 1 1 -
1 1 1 1 1 1 1 - 1 1 1 -
1 1 1 1 1 1 1 - - 1 1 -
1 1 0 1 1 1 1 - - 1 1 -
1 1 1 1 1 1 1 - 1 - 1 -
1 1 1 1 1 1 1 - - 0 1 -
1 1 1 1 1 1 1 - - 0 1 -
1 1 1 1 1 1 1 - 1 0 1 -
1 1 1 1 0 1 0 - 1 1 - -
0 0 1 0 1 1 1 - 1 - - -
0 0 0 0 1 0 0 - - - - -
1 1 1 1 1 1 1 - 1 0 1 -
0 1 0 1 1 1 1 - 0 - 1 -
1 1 1 1 1 1 1 - 1 1 1 -
0 1 0 1 1 0 0 - - 1 1 -
0 1 0 1 1 0 1 - 0 1 1 -
0 1 0 0 ? 0 0 - 0 - 1 -
1 0 1 1 1 0 1 - 1 0 - -
10 14 12 13 14 12 14 0 7 7 13 0
15 21 18 21 21 18 21 8 15 15 21 0
Page | 32 Oregon Partnership for Disaster Resilience
APPENDIX B: LITERATURE REVIEW SUMMARIES
Literature Review Summaries: Journal Articles and Reports
Title: Community Vulnerability Assessment Tool Methodology Author: Lisa K Flax Method: Community Vulnerability Assessment Tool (CVAT)
The CVAT methodology offers a framework for assessing the vulnerability of economic, social, and environmental systems. The framework is comprised of a seven step process that can be customized to fit a user’s specific circumstance. An outline of the seven steps is provided below.
Step 1: Hazard Identification
This step involves identifying and prioritizing hazards based on past occurrences and potential future occurrences (i.e. Earthquake). The hazards are prioritized and ranked based on a risk analysis. The risk analysis might include hazard frequency, impact radius, and magnitude. A low to high ranking scheme would be applied to areas based on the risk analysis. A degree of subjectivity is inherent with this step.
Step 2: Creating Hazard Analysis Map
In this step, potential hazard impact areas are mapped. The ranking system developed in the first step should also be mapped at this point. After creating individual hazard maps, a multi-hazard map can be created for a more comprehensive view of hazard risk. A community-based mapping exercise could be undertaken at this stage.
Step 3: Critical Facilities Vulnerability Analysis
At this step, important community facilities such as schools, hospitals, and civic buildings are identified and inventoried. The structural integrity of the facilities is analyzed to determine those that are most at risk. A critical facilities layer can be created in GIS and overlaid with the hazards layer to further assess the vulnerability of identified facilities.
Step 4: Societal Vulnerability Analysis
Areas of special consideration are identified in this step. Areas of special consideration might be, for instance, neighborhoods with a high elderly population, low income, or higher population density. Special consideration areas can be mapped and overlaid with the hazard analysis from step two.
Step 5: Economic Vulnerability Analysis
This step involves the identification of areas or businesses of great economic importance. The author recommends that employers are included in the hazard assessment process at this point. Important economic sectors are compared to the hazard areas created in step two.
Oregon Risk Assessment: A New Model August, 2013 Page | 33
Step 6: Environmental Vulnerability Analysis
An environmental analysis is concerned with the secondary impacts of a natural hazard, such as the subsequent release of hazardous materials. Potential hazardous release areas should be mapped and compared to the hazard maps.
Step 7: Mitigation Opportunities Analysis
Using the analyses performed in the previous six steps, a list of mitigation strategies should be formulated to determine the most effective/appropriate mitigation strategies.
Page | 34 Oregon Partnership for Disaster Resilience
Title: Indicators of Disaster Risk and Risk Management Author: Omar Cardona (Inter-American Development Bank) Method: Composite Indicators
This methodology was originally developed for assessing hazard vulnerability at the country level. The author proposes a four component framework for assessing vulnerability and overall hazard risk. The four components are as follows:
The Disaster Deficit Index (DDI)
This index deals with the economic loss that would result from a hazard event. The inputs for creating this index rely on historical hazard intensity and the physical vulnerability of elements for each individual hazard. The estimation of loss is conducting using a calculation called Probable Maximum Loss (PML), combined with the Maximum Considered Event. The results from these calculations can be compared to a jurisdiction’s expected annual loss to determine the monetary requirements for covering hazard impacts.
The Local Disaster Index (LDI)
This index deals with a jurisdiction’s propensity for experiencing small scale hazard events. “The LDI is an index that captures simultaneously the incidence and uniformity of the distribution of local effects. That is to say, it accounts for the relative weight and persistence of the effects attributable to phenomena that give rise to municipal scale disasters.” The authors claim that the LDI must be based on number of deaths, affected persons, and destroyed housing. The costs associated with affected and destroyed housing is summed and compared to the replacement costs of said housing.
The Prevalent Vulnerability Index (PVI)
This index measures the vulnerability of an areas based on exposure, socioeconomic fragility, and social resilience, or lack thereof. A multitude of components combine to create each of the three indicators. Then, each indicator is combined to create a total.
The Risk Management Index (RMI)
This index aims to measure the performance of risk management. Four components combine to create the index: risk identification, risk reduction, disaster management, and governance and financial protection. Like the PVI, multiple factors are analyzed to determine each component, which then informs the RMI as a whole.
The authors provide examples of how the methodology can be used at the national, sub-national, and urban levels, but their descriptions of how to do so are somewhat vague.

Oregon Risk Assessment: A New Model August, 2013 Page | 35
Title: A Methodology for an Integrated Risk Assessment of Spatially Relevant Hazards Author: Stefan Greiving et. al. Method: Integrated Risk Assessment of Multi-Hazards
This methodology was designed to assess risk at the regional level within the boundaries of the European Union. The methodology was created to assess the total risk potential of a region using a multi-hazard analysis. The method consists of four components:
Hazard Maps
Hazard maps are created for each individual hazard. The maps show the location of hazards as well as their intensity. Hazard intensity can be determined based on the frequency of historical hazard events and the magnitude of past events. A classification scale should be created using five relative hazard intensity classes.
Integrated Hazard Map
This step involves combining the individual hazard maps from step one and adding up their intensity scores. The authors recommend assigning weights to hazards to differentiate their importance. At the community level, they recommend using the Delphi process, which is subjective in nature. “The Delphi method is based on a structured process of collecting and synthesizing knowledge from a group of experts through iterative and anonymous investigation of opinions by means of questionnaires accompanied by controlled opinion feedback.”
Vulnerability Map
This step involves performing a vulnerability assessment based on infrastructure, facilities, population density, GDP, etc. According to the authors, a region’s coping capacity is an integral part of its overall vulnerability. Coping capacity is determined using population density and GDP. Again, as in the other steps, a weighting and classification scheme is applied to determine priority.
Integrated Risk Map
In this step, the integrated hazard map and scores are combined with the vulnerability map and scores to determine the regions most at risk. The authors recommend using a 5 x 5 matrix. In essence, a region’s hazard intensity and vulnerability are added up to create an integrated risk value.
Considerations
• This method does not necessarily consider changes in population or land use.
• Some components rely heavily on subjective data.
• The overall methodology is very simplistic and can likely be replicated with ease.

Page | 36 Oregon Partnership for Disaster Resilience

Oregon Risk Assessment: A New Model August, 2013 Page | 37
Title: Integrated Hazards Mapping Tool Author: Eric Tate et. al. Method: Integrated Hazards Assessment Tool (IHAT)
This methodology (IHAT) uses a “web-based multi-hazard vulnerability mapping application” for use by local and state officials. The method was developed to aid jurisdictions in meeting the requirements of the Disaster Mitigation Act of 2000. The web mapping aspects of IHAT make it highly accessible and easy to use.
The IHAT methodology relies on the Hazards of Place framework. The HOP framework “posits that the hazard potential of a place is filtered through its geographic setting and social context to produce biophysical and social vulnerability, which combine to produce the total vulnerability of a place.” Biophysical vulnerability is assessed by calculating the hazard frequency for each hazard, which can then be combined to create a multi-hazard frequency surface. Social vulnerability is assessed using the Social Vulnerability Index, which considers 30 socioeconomic variables, and can be used to create a surface similar to that of the multi-hazard frequency surface. “The multi-hazard frequency and social vulnerability surfaces are then combined to generate a representation of place vulnerability.”
The article that describes the IHAT only briefly outlines an actual hazard assessment methodology. Intuitive web-based mapping seems to be the overall objective of the tool. The tool is designed in such a way so as to allow users to select various inputs, such as the geographic area and hazard information, which would then be combined to create a digital map.
Considerations
• The authors only briefly described the hazard assessment method that they used.
• The web-based mapping tool creates an easy hazard assessment process for jurisdictions, but it may not be viable for comparing results between jurisdictions.
• The authors only tested the tool at the county level, but mention the ability to use it at different geographic scales.

Page | 38 Oregon Partnership for Disaster Resilience
Supplementary Academic Literature Reviews
Title: Urban sustainability in the presence of flood and geological hazards: The development of a GIS-based vulnerability and risk assessment methodology Author: Michael Fedeski and Julie Gwilliam Method: Disaster Index
This methodology was designed to estimate the potential economic loss from a hazard event or multiple hazard events. It was created to consider the impact to buildings and does not consider impacts to people or the environment. The method relies on the Damage Index which evaluates the potential for damage to different types of buildings and compares that to the cost of repairing or reconstructing the buildings. The Disaster Index also accounts for the probability and severity of a potential hazard event.
Title: The Delphi Method Author: Murray Turoff and Harold A Linstone Method: Delphi
In this article, the authors describe the Delphi Method in exhaustive detail and explain possible applications for its use. The Delphi Method relies on subjective communication of a group of people to reach a decision about a particular topic. The group can consist of experts on hazard assessment, stakeholders from a community, or a combination of both. The method has three basic steps:
1. Participants answer a questionnaire. 2. A facilitator reads the results of the questionnaire. 3. Participants revise their answers based on the answers from other
participants.
In theory, the range of possible answers will decrease after each round of questionnaires and the participants will eventually come to a consensus.
Title: Revealing the Vulnerability of People and Places: A Case Study of Georgetown County, South Carolina Author: Susan L. Cutter et. al. Method: Hazards of Place
This method combines biophysical vulnerability with social vulnerability to assess the hazard vulnerability of a specific place. Biophysical vulnerability consists of the source, impact, and frequency of a hazard. Social vulnerability includes a wide range of social factors including, demographic characteristics, perceptions and experiences to risk, and a places capacity to respond to risk.

Oregon Risk Assessment: A New Model August, 2013 Page | 39
Literature Review Summaries: State Methodologies
California Methodology
RA Components
California’s risk assessment includes:
• A GIS-based integrated multi-hazard risk assessment, that assesses risk exposure and social vulnerability to primary hazards by jurisdiction (counties), including sub-county
• Patterns based on new raster-based analyses
• Observations regarding local vulnerability and potential loss drawn from the review of
• FEMA-approved Local Hazard Mitigation Plans
• Discussions of mitigation progress since 2007
California undertook a vulnerability analysis for its three primary hazards only. They developed a raster-based GIS model that analyzes risk within counties using approximately one kilometer grid cells. Appendix N shows the GIS Risk Exposure Analysis Methodology in great detail, including assumptions, conceptual work flows and detailed work flow, including:
• Data Pre-Processing
• California Social Vulnerability Index (initial and final variable selection)
• Creation of statewide data sets
• Vector to raster conversion
• Data modeling
“The work flow for generating the multi-hazard map series is divided into two main sections. The first section involves developing a series of base maps. The base maps form the foundation data that are modeled in the GIS to generate the multi-hazard maps and vulnerable population maps. The second step uses the base maps for GIS modeling and human valuation of multiple criteria for model weighting to produce the final multi-hazard/population vulnerability maps.” (CANHMP, 2012)
Types of maps:
• Base maps for 3 basic hazards
• Population and vulnerable population map
• Integrated map of all hazards plus the population vulnerability map was also created.
Visual display
Standardized GIS maps displayed throughout Plan.

Page | 40 Oregon Partnership for Disaster Resilience
California Social Vulnerability Index (CalSVI)
For this plan update California “modeled social vulnerability at a sub-county resolution and used a simplified approach to modeling social vulnerability. CA followed the process outlined in Schmidtlein, et al (2008) to select an initial set of variables to model social vulnerability. Data from the 2000 Census (U.S. Census Bureau 2002) were used at the Census County Subdivision level in the 11 counties for which ACS data were unavailable.” (CANHMP, 2012)
These variables were used to create an index of social vulnerability following Cutter’s algorithm for the Social Vulnerability Index (SoVI) (Cutter, Boruff and Shirley 2003, Schmidtlein, et al. 2008). California sought to use a simpler method while maintaining the same representation. CalSVI uses a smaller set of variables combined in a simpler manner. (CANHMP, 2012)
Hazard prioritization
California identifies a hierarchical and functional classification based on hazard impact criteria. Hierarchy used: primary, secondary and additional hazards. For primary and secondary hazards, the RA includes information identifying (1) location within state; (2) previous occurrences within state; and (3) probability of future events. Hazard impact criteria include:
• Levels of loss (life, structures, property, environment)
• Geographic extent
• Frequency and return periods
• Mitigation potential
Web-based community mapping
California is in the process of developing a new website enabling access to community-scale hazards mapping for preparation of Local Hazard Mitigation Plans and general plan safety elements. The MyPlan website will provide one-stop access to hazards mapping currently available from various agencies on widely scattered websites. As newer, updated, more locally definitive base maps become available, they will replace original layers in this plan. (CANHMP, 2012)
Elements of interest
• Integrates multi hazard and population vulnerability into GIS maps.
• Does not use HAZUS.
• Transparent and detailed methodology in Appendix N.
• A tailored social vulnerability index.
• Community mapping via the web.
Other
CA gives special attention to Climate Change. CC is addressed in depth in Chapter 4: Risk Assessment Overview.

Oregon Risk Assessment: A New Model August, 2013 Page | 41

Page | 42 Oregon Partnership for Disaster Resilience
Idaho Methodology
RA Components
Idaho’s SNHMP uses a 5 part methodology to assess risk. Idaho’s plan is highly comparative. Data in local plans is compared to statewide fact-based data. The plan also analyzes and compares LNHMP content. For example, it maps and charts the focus of mitigation actions in LNHMPs in comparison to that by region. Idaho’s risk assessment components include:
• Analysis and roll-up of risk assessment information (damage/loss information, hazard
• prioritization) from 47 local mitigation plans (44 counties, three tribes)
• Inclusion of HAZUS-MH4 Level 1 analysis of floods and earthquakes including:
• HAZUS MH-4 flood runs and all standard reports for the 10-, 4-, 1-, and 0.2-percent events (corresponding to the 10-, 25-, 100-, and 500-year recurrence intervals, respectively)

Oregon Risk Assessment: A New Model August, 2013 Page | 43
• HAZUS-MH4 flood runs at Level 1 and Level 2 for two counties to compare loss estimate findings
• Scenario modeling of hypothetical events – two for floods and three for earthquakes
• Detailed consequence analysis of hypothetical events for the three hazards that have the most impact on Idaho: floods, earthquakes, and wildfires. Consequence scenarios considered short-term and long-term impacts of consequences of a particular scenario on various systems, including: the public; first responders, continuity of operations,property/facilities/infrastructure, economic conditions, public confidence in government, environment
• Development of a CDMS-compatible database shell for State facilities to be used in subsequent updates and preliminary risk assessment of State facilities/infrastructure for flood, earthquake, and wildfire (some preliminary data shown in SHMP, other data created as a dataset for future update and use)
Hazard prioritization
Idaho identifies three hazards as being most significant from a statewide perspective: flood, earthquake, and wildfire. Significance is based on recent major disaster declarations, historical disaster declarations, and the hazards identified as significant in local plans. The vulnerability analysis in the 2010 SHMP has additional risk assessment and vulnerability information for these three hazards.
Visual display
Maps are simple and standardized throughout the plan making for easy comparison. Charts overlaid on maps add to the level of detail in comparisons, yet remain simple enough that the findings are easy to digest.
Elements of interest
Particular elements of interest are Idaho’s unique approaches to assessing risk, through comparison and hypothetical consequence analysis.
• Idaho’s comparison approach tells a compelling story about local perception-based versus state fact-based data. One of Oregon’s goals is to make such comparisons. The Idaho SNHMP has the most comprehensive comparison analysis of all plans reviewed. For this reason, FEMA Region X recommended Oregon review Idaho’s Plan.
• Of all Plans reviewed, Idaho was the only State that assesses future short-term and long-term impacts through a series of hypothetical consequence analysis conducted by a Planning Executive Committee (similar to Oregon’s IHMT RA Team).
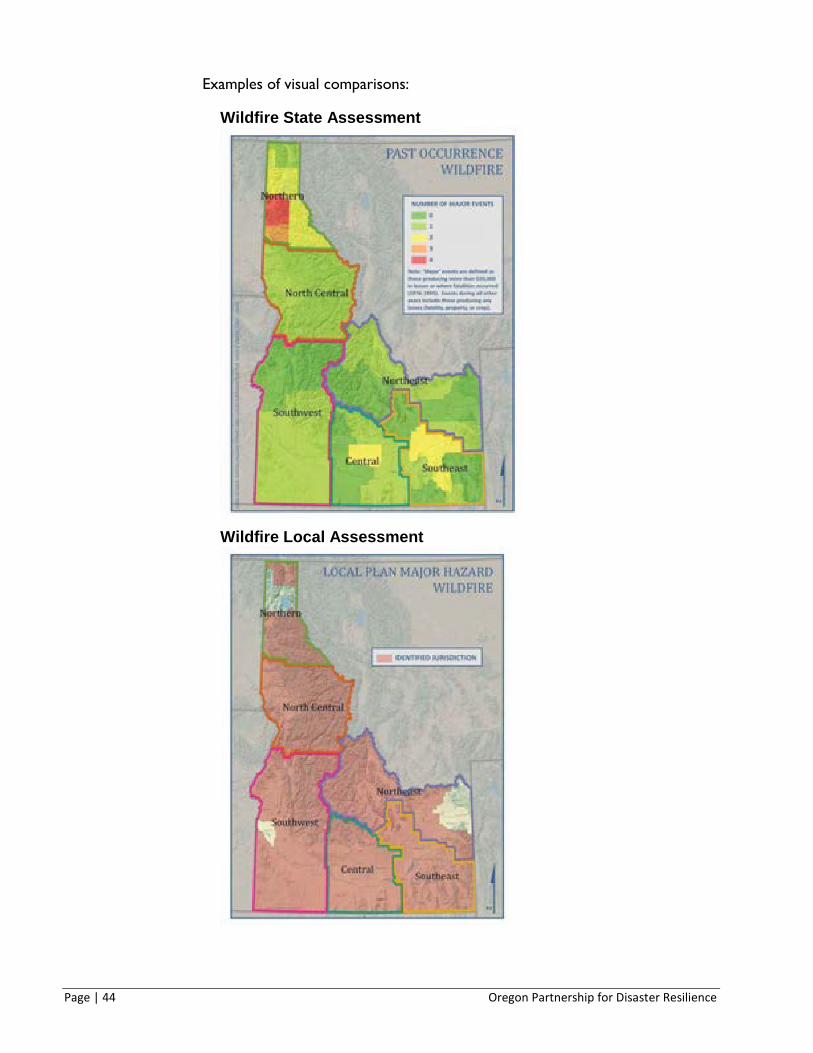
Page | 44 Oregon Partnership for Disaster Resilience
Examples of visual comparisons:
Wildfire State Assessment
Wildfire Local Assessment

Oregon Risk Assessment: A New Model August, 2013 Page | 45
Flood State, Local and Hazus Assessments
South Carolina Methodology
RA Components
South Carolina used two methods to assess risk, HAZUS-MH MR4 and a statistical approach. HAZUS was used to estimate losses from hurricanes, wind, flood and earthquakes. Actual damages sustained over time and probability of occurrence was used to determine risk for hazards outside the scope of HAZUS.
This plan illustrates each conceptual model in a chart diagram (see back). A detailed step-by-step description of the second method is provided.

Page | 46 Oregon Partnership for Disaster Resilience
SC assesses risk at the statewide, county and census tract level (when data was available). This Plan displays the following data in table format, using raw data:
• Overall number of hazards by county
• Future annual probability by hazard and by county
• Hazard frequencies % chance per year by hazard by county
• Annualized loss estimates by hazard by county
• Hazard score by county
A notable feature of this plan this plan is its Social Vulnerability Index created by the Hazard Research Lab, Dept. of Geography at USC in 2008. “Social vulnerability scores are derived from socio-economic characteristics for each jurisdiction (county), including age, gender, population, race, income, and # of manufactured homes.” (CA SNMP, 2012)
The University of South Carolina’s Hazards and Vulnerability Research Institute (HVRI) developed and maintains a Hazards Assessment for the State of South Carolina. This report, reviewed annually, contains information on potential exposure and county by county risk to people and property from hazards. (CA SNMP, 2012)
Data display
Findings are displayed using maps and tables, therefore useful to local communities regardless of capacity (GIS capable or not). Tables show raw numbers, making the information more usable to local jurisdictions than if the tables showed ordinal rankings only.
Notation
Highlighted as a model Plan for its detailed treatment of social vulnerability at the county level by a study undertaken by the Center for the Study of Natural Hazards and Disasters, the Dept. of Homeland Security and the Department of City and Regional Planning at UNC-Chapel Hill in a 2009 report entitled “State Hazard Mitigation Plan Evaluation and Model Practices”.
Other
Analysis of LHMPs status, content, and risk assessments are in a standalone Chapter called: Integration of LNHMPs.

Oregon Risk Assessment: A New Model August, 2013 Page | 47
Page | 48 Oregon Partnership for Disaster Resilience
Rhode Island Methodology
RA Components
Rhode Island used a modified Community Vulnerability Assessment Tool (CVAT) approach to assessing risk. Initially, CVAT was developed and funded through the NOAA Coastal Services Center for individual communities (cities and counties). NOAA CSC then modified their approach to assess risk on a statewide basis. This study marks the first time that local information was collected in order to establish a statewide database with aggregate data. (RI SNHP, 2011)
The approach used for the RI NHMP involves three types of risk and vulnerability scores: hazard scores, vulnerability scores, and combined scores (combining the risk and the vulnerability).
Each of the three risk scores describes different aspects of the vulnerability (social, critical facilities, economic and environmental) for each natural hazard in a given region.
Hazards are scored by: frequency score; area impact score; relative impact score; and absolute area impact score. The Plan explains each scoring method.
Rhode Island scores vulnerability for critical facilities, populations at risk, environmental resources and economic values. The plan lists the categories and scoring factors for each. Vulnerability scores measure the level of assets, populations, or resources within a given region, city or town. The vulnerability score is a function of the built environment, local economy, demographics, and environmental uses of a given region. Vulnerability scores can be combined within a sub-region or across multiple sub-regions to evaluate aggregate levels of vulnerability to a given hazard or hazards.
Data display
“In addition to GIS maps depicting relative location of hazard impacts, there is also data (as is available) for the number and locations of structures vulnerable to each hazard. Under each hazard section, an overall State map depicts the relative impact of the hazard statewide.” (RI NHMP, 2011)
Elements of interest
Maps are standardized throughout Plan, making for easy comparison. Tables showing scoring method make the scoring transparent. The Plan includes a road map of next hazards to be included in the CVAT in future SNHMP updates.
This Plan does not provide a diagram for the entire RA methodology. It does, however, walk the reader through a n in depth step-by-step process. Simple equations used are illustrated. It is important to note that the methodology, created by NOAA CSC, is available via CD for public consumption. The CD will likely provide a detailed description of the methodology. This method was also reviewed by the University of Oregon graduate student team as part of this literature review project. Thus, this method should be cross-referenced with findings from that review.

Oregon Risk Assessment: A New Model August, 2013 Page | 49

Page | 50 Oregon Partnership for Disaster Resilience
APPENDIX C: MEETING MINUTES
2015 OR NHMP Update Risk Assessment Meeting
Wednesday, March 20, 2013 10:30AM – 12:00 PM
DLCD Basement Room “D” Call-in #: 888-808-6929, Participant Code: 2623154
AGENDA
(15 min.)
1. Welcome/ Introductions Lisa Attendees:
a. DLCD: Chris Shirley, Steve Lucker, Lisa Peffer b. DOGAMI: Jed Roberts c. OEM: Joseph Murray d. OPDR/UofO: Josh Bruce e. InfoGraphics/ UofO: Ken, Brooke, Eric
2. Review agenda Lisa
3. Where we were; where we are now Josh
a. 2009 ORNHMP i. RA lived in regional analysis (HAZUS, InforGraphics did visual elements)
ii. Course risk and vulnerability information b. 2012 ORNHMP
i. State facilities inventory ii. Regional profiles
iii. Identified vulnerabilities iv. Don't have clear common methodology to ID most vulnerable areas
4. Roles of DLCD and OPDR Chris and
Josh
5. Defining this assessment Chris
a. Focus of this assessment
b. FEMA / 44 CFR Part 201.c. 4 (plan update guidelines handout)
c. DR1733 funding/timeline/work plan (work plan handout)
6. Presentation of DOGAMI’s RA methodology used to assess local and state hazard data for Mt Hood Jed
a. Comparison between approaches (Hazus and DOGAMI’s methods, ie: Lidar)

Oregon Risk Assessment: A New Model August, 2013 Page | 51
b. DOGAMI developed hazard layers i. Population data- needed work to be created
ii. Critical infrastructure and buildings ftprints) were available and precise c. Dasymetric mapping
i. Land cover data set; DOGAMI improved pop data to be at tax lot level Comments: (JB) Need to start at state scale (CS) This is scalable; is also resource intensive; maybe we can do it at regional scale (JR) HAZUS has value: to get loss ratios (JB) cannot use HAZUS across all hazards (CS) No HAZAUS for statewide view (JR) For exposure need absolute values (1 hr. 15 min.)
7. STEPS 1-5 in work plan (see back of Agenda) Lisa/Chris
8. Work plan adjustments? Lisa
9. Next meeting Lisa
a. JB will meet with InfoGraphic to discuss what they can do on their end b. CS/LP/SL meet with JB to discuss what OPDR/UofO (InforGraphics and other
grad students) can do 10. Next meeting: week of April 8th
a. LP send out Doodle b. (Joseph) offers that IHMT could have “special meeting” to address RA if
needed—NEED LEAD TIME TO COORDINATE c. (Joseph) suggests workshop with IHMT outside normal meeting—NEED LEAD
TIME TO COORDINATE d. CS asked is InfoGraphics could offer work space
i. Eric said they would talk about the possibility of there being a central/default workspace there
JB will talk with InfoGraphics team about what they can offer
2015 OR NHMP Update Risk Assessment Meeting
Tuesday, April 16, 2013 12:00-2:00 PM
OEM
Attendees: Kiri Carini OEM Joseph Murray OEM Chris Bone U of O; Dept. of Geography Brook Eastman U of O; InfoGraphics Steve Lucker DLCD Dennis Sigrist OEM

Page | 52 Oregon Partnership for Disaster Resilience
Chris Shirley DLCD Josh Bruce U of O; OPDR Ben Protzman U of O; OPDR Ken Kato U of O; InfoGraphics Rachel Smith DOGAMI Eric Sproles U of O; InfoGraphics Lisa Peffer DLCD CA SNHMP risk assessment example Lisa gave an overview from the March meeting; and showed how the CA SNHMP risk assessment has progressed in a similar fashion to what Oregon is discussing. CA was used as a “straw man” to ignite conversations about what direction Oregon would like to take over the long term. The CA example demonstrates how a raster-based GIS model has been used to assess risk at a statewide and regional scale. The CA example also illustrates how a new risk assessment method can be “phased-in” over the long term. Dennis said that Oregon “does (the) floods (hazard) very well”. This is a hazard for which we also have very good data. Flood would be a good hazard to assess first. Dennis also mentioned that wind causes considerable damage and should be considered. The group agreed that the definition of primary, secondary and other hazards can be addressed by the IHMT, in the future. Long-term goals Ken facilitated a discussion about the state’s long-term goals for the ORNHMP risk assessment. Who would need to run the model? Do we build a model around today’s best available data? Or do we want to think further ahead? The group brainstormed the question, “What type of model does the State want to create.” Responses included, “The state would like to create a model that could….”
• Be run over the years (Chris) • Allow the State to see if we are making progress (Chris) • Be a decision making tool that would show the State where to fund projects in a
way that is fair and objective(Chris) • Gauge effectiveness of mitigation actions and funding (Kiri) • Give the State data we could bring to the legislature to prove we simply don’t have
enough money to make a difference (Josh) • Help the State create a systematic mitigation strategy (Dennis) • Measure tradeoffs (Chris B.) • Demonstrate change over time (Chris B.) • Be flexible/ grow over time (Chris) • Be adjusted to illustrate population growth and inflation (Chris B.) • Predict; be temporal (Steve) • Help DLCD decide where to target policy, code, regulation (Josh)
Non-hazard data discussed:
• Population (census)

Oregon Risk Assessment: A New Model August, 2013 Page | 53
• Economic loss • Social
Outstanding questions:
• Does the state want a predictive analysis or a scenario-based analysis? o We have not been predicting where a hazard will be
Rachel asked what metric we were using. Chris responded that we would need to do some soul searching to answer that question. Ken drew the following diagram to help the group define terminology and begin to share a common vision.
Chris B. asked whether the state wanted to accomplish an approach-level recommendation by August (for this plan) or run a model based on today’s needs. He suggested that there may not be a one-size-fits-all model for all hazards at all scales. We may find by August that we need to gather more data before we can get to where we want to be. Eric stressed that InfoGraphics didn’t want to make false promises on a lock down deliverable. Over the next four months we may find that an approach may give us a greater return on our time and money in the long run. A long term approach could help prevent us from having to re-invent a new model every year/plan update. Ken stated we could be creating a tool to help us better understand vulnerability and help us target resources.

Page | 54 Oregon Partnership for Disaster Resilience
The group discussed that the August deliverables may be one, or more, recommended model(s) and a long-term work plan. Literature review Ben presented draft preliminary literature review evaluation criteria. Lisa presented the draft second (finer-detailed) evaluation criteria created during the March RA meeting. Lisa will email both drafts to the RA team for comments. The groups discussed additional criteria based on today’s meeting, including:
• Making note of the uniqueness/ interesting elements of methods and models found in the literature
• Community –based mapping/ participatory mapping • Adding keywords to lit review search: spatial- decision making support systems;
participatory mapping Next steps The group agreed that the next step is gathering an inventory of pertinent available data sets. Lisa asked if the group had specific questions to ask the IHMT on Thursday. These questions were agreed upon to ask of the IHMT, that Lisa will ask on Thursday:
• What data sets are available? • What other modeling exercises are IHMT agencies doing?
Lisa will email the group the lit review evaluation criteria for comments. Upon receipt of comments, Ben will begin the lit review. The findings will be presented at the May meeting. Steve will provide a list of Hazard and Prep FIT data sets for the IHMT meeting on Thursday. Other pertinent data sets may be available at Oregon University. Portland State University’s Population center will have population forecast data. Josh said OPDR can provide a (1-5-10 year) long-term work plan deliverable by August. Ken offered that InfoGraphics will setup a basecamp site for this project. The group agreed that FEMA should be invited to attend RA meetings going forward. The next meeting is TBD. Lisa will send a doodle request.
2015 OR NHMP Update Risk Assessment Meeting
Wednesday, May 15th, 2013 12:00 – 2:00 PM
@ OEM
Attendees: OEM: Kiri Carini, Joseph Murray, Althea Rizzo, Geoff Ostrove

Oregon Risk Assessment: A New Model August, 2013 Page | 55
DEQ: Don Pettit DLCD: Chris Shirley, Steve Lucker, Lisa Peffer, Jeff Weber FEMA: Brett Holt DOGAMI: Rachel Smith UO-OPDR: Josh Bruce, Ben Protzman UO- Geography Department: Chris Bone UO-InfoGraphics: Ken Kato, Brook Eastman
Notes:
Upon welcome and introductions, April meeting notes and today’s agenda were approved, without additions.
UO has set-up a Basecamp site for this project. Ken gave a Basecamp 101 tutorial. Basecamp will be the main project management tool for this project.
Lisa reviewed the work plan schedule. In March the IHMT RASC first convened and discussed RA priorities, objectives and evaluation criteria. A progress report was given to the IHMT in April. At today’s meeting, UO will present their findings from the literature review and DLCD will present findings for the SNHMPs RA review. Time permitting; DLCD will also give an update on RA data inventory. Based on RASC feedback from today’s presentation on the findings from the literature and SNHMP review, Infographics will begin to develop a concept, May through June. Infographics will present an update of the concept model development to the RASC in July. Also in July, the State will give a project update to the IHMT. Based on feedback from the RASC and IHMT in July, Infographics will tweak and test the model through August. The development of a new RA model and methodology is funded through August 22, 2013. At that time Infographics and OPDR will present to the State a final report and long-term work plan, including recommendations, timeline and budget. The RASC will review the final report and work plan and make recommendations to the IHMT in October.
Lisa presented her evaluation of seven SNHMP RA’s, including WA, CA, FL, SC, RI, LA, and ID. Some themes that emerged from the review include: standardization, hazard prioritization, scalable models, social and environmental vulnerability. Josh asked if economic vulnerability was also a theme. Lisa answered that it was, but that social and environmental vulnerability were emergent themes. However, RI is one example in which social, environmental and economic vulnerability are explicitly assessed, and will be discussed later during the meeting. SNHMP RA’s were scored and ranked based on FEMA’s CFR requirements and RASC evaluation criteria. Four RA’s ranked highest: CA, SC, RI and ID. Each of these RA’s was then discussed in depth. See power point for details. Final recommendations based on SNHMP RA’s are:
• Consider 2 models: • CA’s raster-based GIS model • RI’s CVAT
• Further review CA’s MyPlan website

Page | 56 Oregon Partnership for Disaster Resilience
• Prioritize hazards • Develop OR-tailored social vulnerability index • Include environmental inputs • Compare local and state data findings • Determine costs
Ben and Ken presented findings from the literature review of 18 journal article and industry reports. Using the same evaluation criteria as in the SNHMP RA evaluation, for RA models ranked highest. Ben gave detailed overviews of each of these models, and Ken discussed each model’s technical applicability, or lack thereof, in relation to Oregon. Detailed findings from this review can be found in the literature review handouts.
Ken then led a group discussion to better define the State’s objectives and long term goals of the SNHMP RA. The definition of a jurisdiction and the restrictiveness of confining data to a jurisdiction were discussed. Ken and Chris B. spoke of the benefit of a hazards-of-place based approach in which jurisdictional lines are placed on an area after the vulnerability of the place is determined. This sparked lively discussion among the group. Scale of the data remains to be an important question, and was brought up by both Rachel and Jeff. Other RASC members confirmed the importance of data scale and agreed to keep the question on the table until the model is further developed. General consensus was in favor of Oregon exploring how to integrate elements of CA’s RA, RI’s CVAT and Susan Cutter’s SOVI.
Time did not allow for DLCD to give an update on the data inventory.
RASC members expressed general approval of meeting at OEM. Next meeting date will be determined via doodle.
2015 OR NHMP Update Risk Assessment Meeting
Monday, June 24th 2013 2:00 – 4:00 PM
@ OEM
Attendees: OEM: Kiri Carini, Joseph Murray, Althea Rizzo, Darrell Neet DEQ: Don Pettit DLCD: Chris Shirley, Steve Lucker, Lisa Peffer, Jeff Weber FEMA: Kristen Meyers, Amanda Engstfeld DOGAMI: Rachel Smith UO-OPDR: Josh Bruce UO- Geography Department: Chris Bone UO-InfoGraphics: Ken Kato, Brook Eastman
Notes:
Oregon Risk Assessment: A New Model August, 2013 Page | 57
Ken and Chris B. presented a draft risk assessment (RA) model that InfoGraphics (IG) has been developing based on prior RA meetings and discussions regarding state and federal priorities for SNHMP risk assessments. This presentation is available on BaseCamp. The groups’ discussion about the model was as follows.
Chris S. said the state would need to agree on data parameters and on a snapshot view of the findings to use for the SNHMP. She asked if it would be possible to archive data runs; and Rachel further punctuated the importance of saving data runs. Ken said that archiving could probably be built into the model and that state experts should determine data parameters. All agreed that the state would need to come to agreement on which “snapshot view” to use in the SNHMP.
Chris S. asked if there is a mechanism to determine which data could be run at each scale. Ken said IG could create that mechanism, and state experts should decide data parameters.
Don raised concern about the level of user bias allowable if the user can “turn dials” to weigh parameters. If the user has full decision making power to decide which parameters are more important (by weighting), that may be too subjective. Rachel added that some data should remain as constant. Chris B. said that the sensitivity indicator shows if the user weighted something too much or too little. Don was still concerned about quality over the ability to drive the model. Ken added that data experts should decide which data is most valuable, and what parameters that should be placed on respective data sets. This would limit the amount of subjectivity. Data tiers can be designed to indicate a level of quality, i.e. Tier 1 is the highest quality data, Tier 2 less so, and Tier 3 has the least quality. Rachel said data in each tier should have these qualities, at a minimum: accuracy (read: precision), completion, gaps in data. Lisa said that definitions and criteria for each tier would need to be created. Althea said Tier 1 data should be the best data and should come from the most highly vetted sources, such as census data and American Community Survey data.
Jeff was also concerned about the level of subjectivity in this approach. He stated that the primary goal is not to be students, but to determine best use of mitigation resources. Jeff wants to know what is possible for implementation for the 2015 update. How does this approach get us to where we need to be during this plan update cycle? Is it possible to run the model for this plan update? Lisa said that other SNHMPs have taken a similar approach to developing a more comprehensive RA methodology and those states are taking several update cycles to fully implement. Then Lisa asked Kristen if introducing the framework and a roadmap during the 2015 update and implementing in phases over the course of future plan updates meets FEMA requirements. Kristen said that Oregon can use the same methodology as in 2012, as long we show that we are making improvements and a long-term work plan.
Jeff asked what level of observation (spatial extent) will be used? Ken said the group had discussed a raster based approach and he saw benefits in that. Jeff said census tracts would
Page | 58 Oregon Partnership for Disaster Resilience
be more valuable. Ken was not certain that census tracts would work as well when overlaying multiple data layers.
Don said this is really a hybrid approach to the weighting question: experts weighting data reduces subjectivity. The sensitivity analysis pre-loads variables and assess the value of data. Chris S. added that if the user can only slide a weight a certain distance then that further reduces the subjectivity allowable. Lisa added that if experts decide how far the weightings could slide, then credibility is given to those weights. Ken and Chris B. said this conversation is hitting on roadblocks IG was facing regarding levels of acceptable subjectivity. Jeff said the weighing would be based on many assumptions. Chris S. said all reports and plans have built-in assumptions-- we just have to be transparent about stating what ours are.
Lisa asked FEMA for feedback. Kristen thinks Oregon is taking an interesting approach for two reasons:
1) This approach enables different ways to look at vulnerability. This is not just a bi-nary approach (i.e.: is a jurisdiction vulnerable? Yes/No)
2) This method is transparent. Oregon is going beyond just computing a vulnerability number. There is added value in knowing the data and method behind that number.
Kristen added that what Oregon is proposing goes beyond federal requirements. Regarding scope, she thinks this is a good long term goal for both local jurisdictions and the state, and it by addressing how to target mitigation funding, a short term priority). All plans have huge levels of subjectivity, and FEMA is OK with subjectivity if the method can show mitigation tradeoffs —which this one does.
Chris S. sees one disadvantage being the complexity of the model. This may be a barrier to local jurisdictions. There is also an assumption that state agencies will work together to help reduce levels of subjective, and that may not be as easy as we hope. Lisa said that all agencies she and Steve have discussed the RA with have expressed de sire to be involved, which is a good sign that there is a high level of interest (at the very least).
Due to time, Lisa wrapped up the discussion by:
1) Thanking the UO team for developing a draft model that truly incorporates state and federal priorities and requirements;
2) Recapping that the main concerns stem from the levels of subjectivity in the model. The group addressed those concerns by agreeing there needs to be adjustments to:
• Tiers: definitions, criteria and a process need to be developed

Oregon Risk Assessment: A New Model August, 2013 Page | 59
• Weighting slider bars: need expert input to determine how far sliders should be able to move for each respective data set
3) Asking the UO group what more they need to move forward. IG has the following outstanding questions:
• Are the families they created the right families? • Is that list complete? • Do we want more? Fewer? • What would be the top 1-3 families?
• Does OR want to prioritization hazards? • Is this the direction OR wants to go (long term vision)? • What Tier criteria does the state want to use?
• Some of these question will be included in a poll that Lisa will create
and distribute to the RASC • Some of these questions may be posed to the IHMT, pending majority
findings from the poll There was brief discussion about the need for the state to decide if it wants to create a hazard hierarchy for the 2015 OR NHMP. Lisa passed out a handout regarding this and will include questions about hazard hierarchy in the poll (or survey) DLCD will create. Lisa will send IG and OPDR a draft of the poll to verify IG’s outstanding questions are accurately included. Poll format is TBD.
Based on findings from the poll, DLCD will decide what to present to the IHMT at the July meeting.
The meeting adjourned at 4:10 PM.
2015 OR NHMP Update Risk Assessment Meeting
Monday, August 5th, 2013 12:00 – 2:00 PM
@ OEM
Attendees: OEM: Kiri Carini, Joseph Murray, Althea Rizzo, Geoff Ostrove DEQ: Don Pettit DLCD: Chris Shirley, Steve Lucker, Lisa Peffer, Jeff Weber FEMA: Brett Holt DOGAMI: Rachel Smith UO-OPDR: Josh Bruce, Ben Protzman, Michael Howard UO- Geography Department: Chris Bone UO-InfoGraphics: Ken Kato

Page | 60 Oregon Partnership for Disaster Resilience
Notes:
After welcome and introductions, Lisa briefly revisited the project work plan schedule. Since our last meeting:
• DLCD gave an update to the IHMT in July • The RASC took a short questionnaire to gauge State interest in giving Infographics
the green light to further develop the RA model through August. The questionnaire resulted in unanimous approval of Infographics forging forward, and articulated specific outstanding questions and issues. All results are posted on Basecamp.
• Infographics has been testing the concept model. Infographics gave their final presentation on the RA model concept, testing results, recommendations and a skeletal long-term work plan. They retraced Cutter’s SOVI steps and were able to get the same values. FL, WF and EQ data was successfully converted into raster format.
Findings:
• A lot of data set clean-up will be needed if 2+ data sets are used. • Preset standards could be built into the model (i.e. the OHA SOVI). • Scenarios can help to prioritize hazards. • Scenarios can be saved in excel. (Can therefore compare different weighting
schemes and mitigation tradeoffs.) • Daltonizer is available for people with color blindness. • Correlation requires more work. (Correlation is the key ingredient in helping to
determine what is driving vulnerability to hazard risk.)
Ken showed a sketch of the recommended 3-year timeline and budget. Estimated annual budget needs are $200,000. See power point for detailed table of this 3-year work plan and budget line items. Ken stressed that they could potentially create a RA model for less, but it would not have all the elements discussed. The State needs to lead the discussion on how much or little they want and can fund.
General support of the model and very few questions emerged from the State or from FEMA. The conversation quickly evolved into an open discussion about funding options. Josh and Chris mentioned that the HMA 2013 application process is open with a very short window, but this new RA methodology is not eligible. Brett confirmed this.
Chris mentioned that the “Of Place” approach may be of interest to other agencies and departments with other funding streams.
Rachel asked how Infographics would address areas where there is a lack of data. Lack of data could skew the data, and therefore skew a vulnerability index. She echoed what Ken mentioned in the beginning of his presentation-- a lot of data work would need to be done

Oregon Risk Assessment: A New Model August, 2013 Page | 61
during the first year. Ken and Chris B. agreed. One option is to shift some of that work away from the State agencies by working with a graduate student who specializes in scale and spatial resolution, and could test model parameters.
Althea mentioned NIH and NSF grants. Chris B. added that NIH grants require significant investments, a.k.a. frontloaded work, to be recognized as a potential grantee.
Josh said Andre LeDuc has a contact in Hawaii who may be interested in turning a new RA methodology into a training opportunity.
Brett said the subjectivity of the RA model is OK. He encouraged Oregon to think about how LNHMP could use the model. That would allow the State to compare RA findings from local and state NHMPs, thus comparing apples to apples.
Chris asked if we could start with a pilot at the census tract scale, if funding is available for LNHMPs? Chris B. said UO could test it out if the State has hazard data at that scale.
Kiri suggested adding the RA model development project to the State’s Pre-Identified Disaster Worksheet. Laura McSweeney is the POC. Lisa will follow up with Laura.
Infographics was thanked for their work in realizing State priorities in the model concept. Though summer months are difficult to schedule, RASC members agreed to meet prior to the IHMT meeting in October to review the final report and work plan and to craft recommendations for the IHMT.
Prior to adjourning, the RASC congratulated Ben and Geoff on completion of their graduate programs. And a farewell thank you was given to Kiri, who will be moving to the east coast at the end of the month.
Related Documents


![New Holland T9.700 Scraper model Tier 4B (final) Tractor Service Repair Manual [ZFF403001- ]](https://static.cupdf.com/doc/110x72/64bc58766b77209b750c9f5b/new-holland-t9700-scraper-model-tier-4b-final-tractor-service-repair-manual-zff403001--1690065014.jpg)


![New Holland T9.645 Standard wheeled model Tier 4B (final) Tractor Service Repair Manual [ZFF403001 - ]](https://static.cupdf.com/doc/110x72/64bc5089a492e56de003c42d/new-holland-t9645-standard-wheeled-model-tier-4b-final-tractor-service-repair-manual-zff403001--1690062985.jpg)
![New Holland T9.530 Heavy duty wheeled model Tier 4B (final) Tractor Service Repair Manual [ZFF403001 - ]](https://static.cupdf.com/doc/110x72/64bc395f9eac9b59dd0a886b/new-holland-t9530-heavy-duty-wheeled-model-tier-4b-final-tractor-service-repair-manual-zff403001--1690057055.jpg)
![New Holland T9.600 Heavy duty wheeled model Tier 4B (final) Tractor Service Repair Manual [ZFF403001 - ]](https://static.cupdf.com/doc/110x72/64bc44f44451edd4f108632d/new-holland-t9600-heavy-duty-wheeled-model-tier-4b-final-tractor-service-repair-manual-zff403001--1690060020.jpg)
