A new framework for the integration, analysis and visualisation of urban trac data within geographic information systems C. Claramunt a, * , B. Jiang b , A. Bargiela a a Department of Computing, The Nottingham Trent University, Nottingham NG1 4BU, UK b Division of Geomatics, Institutionen f or Teknik, University of G avle, SE-801 76 G avle, Sweden Abstract Current geographical information systems (GIS) are not well adapted to the management of very dy- namic geographical phenomena. This is due to the lack of conceptual and physical interoperability with real-time computing facilities. The research described in this paper is oriented towards the identification and experimentation of a new methodological and applied framework for the real-time integration, ma- nipulation and visualisation of urban trac data. It is based on proactive interaction between the spatio- temporal database and visualisation levels, and between the visualisation and end-user levels. The proposed framework integrates dierent spatial and temporal levels of granularity during the analysis of urban trac data. Urban trac behaviours are analysed either by observation of the movements of several vehicles in space, or by changes in urban network properties (i.e., micro- versus macro-modelling). Visualisation and interaction tools together constitute a flexible interface environment for the visualisation of urban trac data within GIS. These concepts provide a relevant support for the visual analysis of urban trac patterns in the thematic, spatial and temporal dimensions. This integrated framework is illustrated by an experi- mental prototype developed in a large town in the UK. Ó 2000 Elsevier Science Ltd. All rights reserved. Keywords: GIS; Urban trac; Real-time; Visualisation 1. Introduction Recent developments in information technology are having a major eect on the way in which systems are designed and used in many application fields. Geographical information systems Transportation Research Part C 8 (2000) 167–184 www.elsevier.com/locate/trc * Corresponding author. E-mail addresses: [email protected] (C. Claramunt), [email protected] (B. Jiang), [email protected] (A. Bargiela). 0968-090X/00/$ - see front matter Ó 2000 Elsevier Science Ltd. All rights reserved. PII:S0968-090X(00)00009-7

Welcome message from author
This document is posted to help you gain knowledge. Please leave a comment to let me know what you think about it! Share it to your friends and learn new things together.
Transcript
A new framework for the integration, analysis andvisualisation of urban tra�c data within geographic
information systems
C. Claramunt a,*, B. Jiang b, A. Bargiela a
a Department of Computing, The Nottingham Trent University, Nottingham NG1 4BU, UKb Division of Geomatics, Institutionen f�or Teknik, University of G�avle, SE-801 76 G�avle, Sweden
Abstract
Current geographical information systems (GIS) are not well adapted to the management of very dy-namic geographical phenomena. This is due to the lack of conceptual and physical interoperability withreal-time computing facilities. The research described in this paper is oriented towards the identi®cationand experimentation of a new methodological and applied framework for the real-time integration, ma-nipulation and visualisation of urban tra�c data. It is based on proactive interaction between the spatio-temporal database and visualisation levels, and between the visualisation and end-user levels. The proposedframework integrates di�erent spatial and temporal levels of granularity during the analysis of urban tra�cdata. Urban tra�c behaviours are analysed either by observation of the movements of several vehicles inspace, or by changes in urban network properties (i.e., micro- versus macro-modelling). Visualisation andinteraction tools together constitute a ¯exible interface environment for the visualisation of urban tra�cdata within GIS. These concepts provide a relevant support for the visual analysis of urban tra�c patternsin the thematic, spatial and temporal dimensions. This integrated framework is illustrated by an experi-mental prototype developed in a large town in the UK. Ó 2000 Elsevier Science Ltd. All rights reserved.
Keywords: GIS; Urban tra�c; Real-time; Visualisation
1. Introduction
Recent developments in information technology are having a major e�ect on the way in whichsystems are designed and used in many application ®elds. Geographical information systems
Transportation Research Part C 8 (2000) 167±184www.elsevier.com/locate/trc
* Corresponding author.
E-mail addresses: [email protected] (C. Claramunt), [email protected] (B. Jiang), [email protected]
(A. Bargiela).
0968-090X/00/$ - see front matter Ó 2000 Elsevier Science Ltd. All rights reserved.
PII: S0968-090X(00)00009-7
(GIS) have been adopted as a successful solution by a wide range of disciplines such as envi-ronmental planning, business demographics, property management and urban studies to mentionsome examples. Currently, one of the most important challenges for GIS is to generate a cor-porate resource whose full potential will be achieved by making it accessible to a large set of end-users. In the urban domain, an important issue is the development of a co-operative tra�c GISthat integrates static urban data with dynamic tra�c ¯ows (Pursula, 1998). Such a system will beof great interest for many applications related to the monitoring and analysis of urban tra�c inwhich represented vehicles or network properties are changing in a fast and almost continuousmode. Recent advances in tra�c systems include the development of graphical interfaces as a newfunctional level of monitoring tasks (Peytchev et al., 1996; Kosonen et al., 1998; Barcielo et al.,1999) and real-time tra�c interfaces in the World Wide Web that display tra�c conditions on aregular basis (Dayley and Mayers, 1999; Feng et al., 1999). Nevertheless, the functions providedby these solutions are quite limited in terms of the analysis and visualisation of urban tra�c data.Furthermore, we believe that the full potential and bene®t of tra�c databases still need a closerintegration with GIS that will facilitate the integration of tra�c data as a component of urban andtransport planning and environmental and health studies. However, current GIS software andinterfaces do not provide the set of functions to make this technology compatible with tra�csystems used for monitoring and simulation purposes. First, the integration of GIS and tra�csystems is likely to be a challenging and worthwhile objective for user communities whose needsare not satis®ed by a loosely connected set of existing systems. This poor level of integration isoften the result of the di�erent paradigm used within GIS and modelling systems and the fact thatmany integrated solutions often imply the re-design of existing solutions (Abel et al., 1992).Secondly, despite recent progress in the development of temporal GISs (e.g., Langran, 1992;Peuquet, 1994; Claramunt and Th�eriault, 1995), current GISs are still not adapted to the man-agement of very dynamic geographical phenomena due to the lack of interoperability with real-time computing facilities. Moreover, the development of GIS applications, characterised by a highfrequency of changes, implies a reconsideration of the modelling, manipulation, analysis andvisualisation functions as GIS models and architectures have not been preliminarily designed tohandle the properties of very dynamic phenomena.
The research described in this paper is oriented to the identi®cation and experimentation of anew methodological framework for the real-time integration, manipulation, visualisation andanimation of urban tra�c data within GIS. We characterise a very dynamic GIS (VDGIS) as aGIS application which has a high frequency of change (e.g., real-time tra�c databases, simulatedtra�c databases). Changes include modi®cations to located properties (e.g., tra�c ¯ows within anurban network) and moving properties of one to several geographical objects (e.g., vehicle po-sitions within an urban network). A high frequency of change corresponds to a small temporalunit of change, which can be generally quanti®ed in seconds or minutes. The scope of VDGIS isrelatively large. It also includes, for example, real-time applications that monitor a large volumeof urban or environmental data, and simulation systems that attempt to predict the future statesof a real-world system. VDGIS objectives are multiple, from the control of the geographical lo-cations of one to several moving objects, to the support of analysis tasks oriented to the identi-®cation of complex spatial behaviours. For example, tra�c monitoring and simulationapplications integrate real-time locations of vehicles on a second, or less, temporal granularitybasis. The integration of GIS capabilities within these engineering systems is a promising
168 C. Claramunt et al. / Transportation Research Part C 8 (2000) 167±184
challenge to explore as it could expand the current data management and visualisation functionsof these systems, and further increase the potential bene®ts of the large information ¯ows gen-erated. Our research explores some experimental methods for the real-time integration (i.e., pre-processing), manipulation, visualisation and animation of dynamic phenomena within VDGIS.We analyse the representation of urban tra�c data by either an observation of the movements ofseveral vehicles in an urban network (microscopic level), or changes in the tra�c properties of anurban network (macroscopic level). Moreover, due to the nature of VDGIS, urban tra�c be-haviours are represented at di�erent levels of spatial and temporal granularities. We propose anintegrated framework based on the interaction between spatio-temporal data and visualisationtasks on the one hand, and visualisation and end-users on the other. This two-step approachsupports a ¯exible and interactive visualisation of urban network properties either for presenta-tion, analysis or for exploration purposes. As such, this framework constitutes a proactive en-vironment as de®ned in Butten®eld (1993). It supplies a dynamic component to GIS that allowsthe derivation of dynamic data from the successive states of a real or simulated urban tra�csystem. It also provides a multi-layered approach that combines thematic, spatial and temporalqueries and visualisations that together constitute a ¯exible and powerful communication re-source for the understanding and analysis of tra�c events and patterns within an urban network.
The remainder of this paper is organised as follows. Section 2 introduces a brief review of theintegration of the temporal dimension within GIS and cartography. Section 3 presents themethodological principles of a multi-layered approach that supports the visualisation of urbantra�c properties. Section 4 introduces the roles of the pre-processing, visualisation and interac-tion tools in the development of our framework. Section 5 presents an application of theseconcepts in the context of a tra�c GIS used in a large town in the UK. Finally, Section 6 drawssome conclusions and outlines for further work.
2. GIS, cartography and time
A de®nition of temporal map has been suggested as a representation or abstraction of changesthat support the understanding and analysis of dynamic phenomena (Kraak and MacEachren,1994). Within GIS, a map can be considered as a visualisation and interactive tool generallyoriented to the representation of a spatial con®guration at a speci®c instant in time, or a spatialcon®guration valid for an interval of time. Cartography has a long tradition of representingspatial information in time. An early example is the Minard map realised in 1869 to illustrateNapoleonÕs march to Moscow (Tufte, 1983, p. 176). Nowadays, with the availability of a largevolume of spatio-temporal data, both GIS and modern cartography face the challenge of ex-ploring new methods and techniques to analyse patterns and structures in space and time (But-ten®eld, 1993).
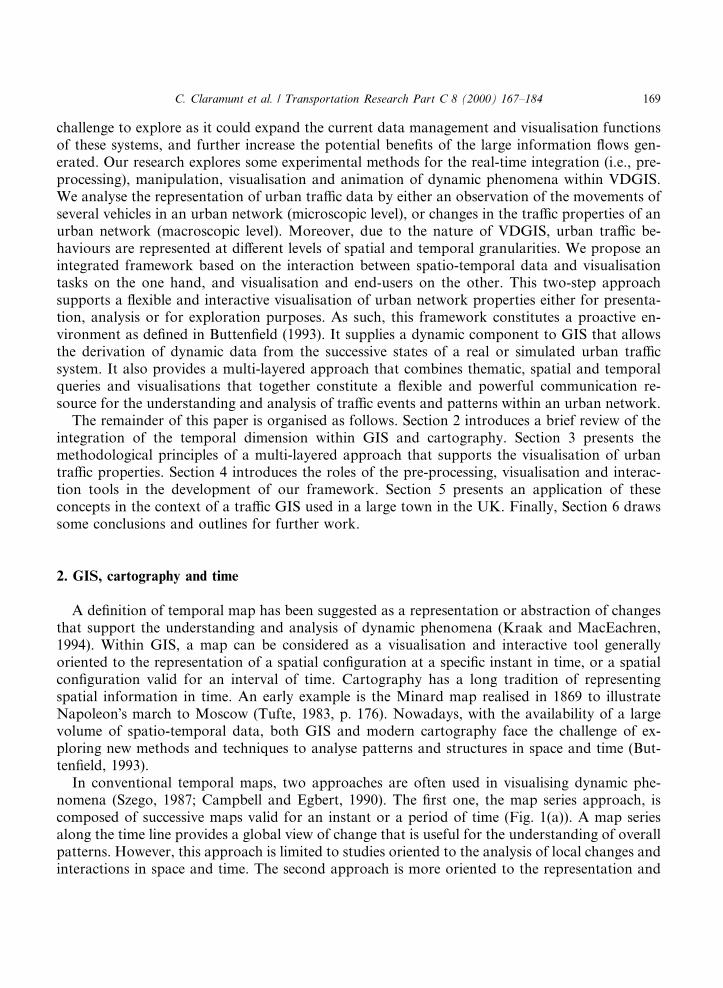
In conventional temporal maps, two approaches are often used in visualising dynamic phe-nomena (Szego, 1987; Campbell and Egbert, 1990). The ®rst one, the map series approach, iscomposed of successive maps valid for an instant or a period of time (Fig. 1(a)). A map seriesalong the time line provides a global view of change that is useful for the understanding of overallpatterns. However, this approach is limited to studies oriented to the analysis of local changes andinteractions in space and time. The second approach is more oriented to the representation and
C. Claramunt et al. / Transportation Research Part C 8 (2000) 167±184 169
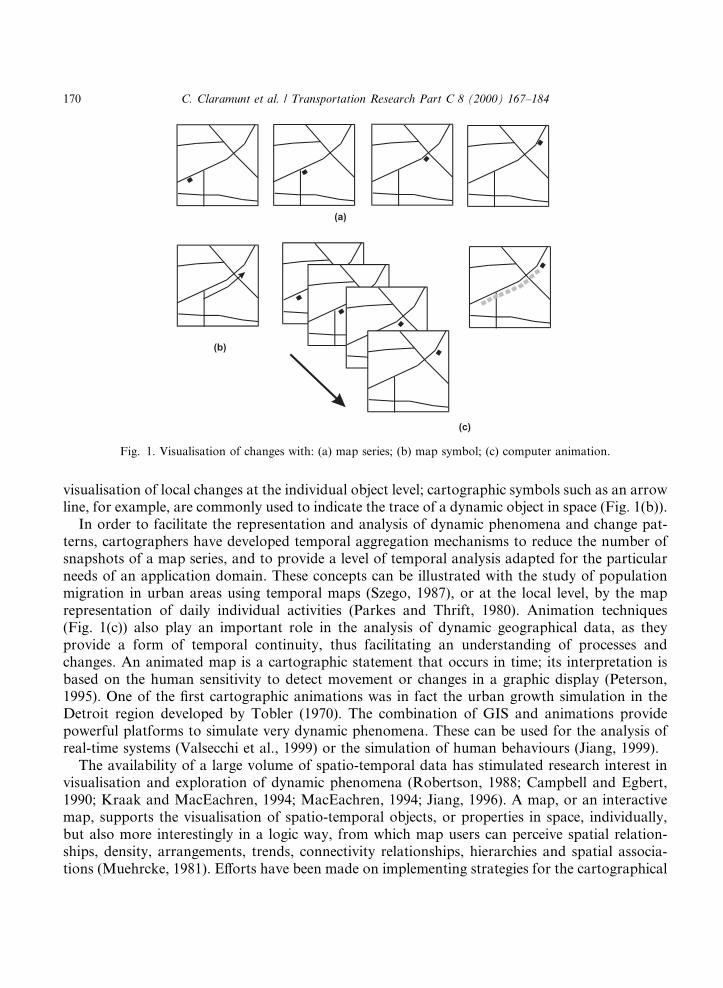
visualisation of local changes at the individual object level; cartographic symbols such as an arrowline, for example, are commonly used to indicate the trace of a dynamic object in space (Fig. 1(b)).
In order to facilitate the representation and analysis of dynamic phenomena and change pat-terns, cartographers have developed temporal aggregation mechanisms to reduce the number ofsnapshots of a map series, and to provide a level of temporal analysis adapted for the particularneeds of an application domain. These concepts can be illustrated with the study of populationmigration in urban areas using temporal maps (Szego, 1987), or at the local level, by the maprepresentation of daily individual activities (Parkes and Thrift, 1980). Animation techniques(Fig. 1(c)) also play an important role in the analysis of dynamic geographical data, as theyprovide a form of temporal continuity, thus facilitating an understanding of processes andchanges. An animated map is a cartographic statement that occurs in time; its interpretation isbased on the human sensitivity to detect movement or changes in a graphic display (Peterson,1995). One of the ®rst cartographic animations was in fact the urban growth simulation in theDetroit region developed by Tobler (1970). The combination of GIS and animations providepowerful platforms to simulate very dynamic phenomena. These can be used for the analysis ofreal-time systems (Valsecchi et al., 1999) or the simulation of human behaviours (Jiang, 1999).
The availability of a large volume of spatio-temporal data has stimulated research interest invisualisation and exploration of dynamic phenomena (Robertson, 1988; Campbell and Egbert,1990; Kraak and MacEachren, 1994; MacEachren, 1994; Jiang, 1996). A map, or an interactivemap, supports the visualisation of spatio-temporal objects, or properties in space, individually,but also more interestingly in a logic way, from which map users can perceive spatial relation-ships, density, arrangements, trends, connectivity relationships, hierarchies and spatial associa-tions (Muehrcke, 1981). E�orts have been made on implementing strategies for the cartographical
Fig. 1. Visualisation of changes with: (a) map series; (b) map symbol; (c) computer animation.
170 C. Claramunt et al. / Transportation Research Part C 8 (2000) 167±184
exploration of time-series data (Monmonier, 1990), proactive graphics (Butten®eld, 1993), and theidenti®cation of dynamic variables for the visualisation of changes (DiBiase et al., 1992; Mac-Eachren, 1994). Recent advances have explored time-series animation of urban growth (Buziek,1997), geological changes (Bishop et al., 1999), and socio-economical changes (Andrienko andAndrienko, 1998). MacEachren et al. (1999) have investigated the integration of geographic vi-sualisation and data mining for knowledge discovery in the context of spatio-temporal environ-mental data. Various new terms have been used to re¯ect this evolution of cartography such asÔanimated cartographyÕ (Peterson, 1995), and Ôexploratory cartographyÕ (Kraak, 1998). Tech-niques for visualising time and change in cartography and GIS also bene®t from related researchareas such as information visualisation, human±computer interaction and data mining (McCor-mick et al., 1987; Schneiderman, 1994; Card et al., 1999; Chen, 1999). In particular, visualisationtechniques used for the analysis of communication tra�c in large computing networks are ofinterest as they are based on comparable network models. Let us mention among others thedevelopment of ®ltering, interactive manipulation of visualisation parameters, and the interactiveuse of temporal (e.g., selection of appropriate temporal periods) and spatial operations (e.g.,zooming) for displaying telecommunication network tra�c (Eick, 1996).
3. Visualisation of very dynamic phenomena: a multi-layered approach
Due to the limitations of current solutions, temporal GISs are often oriented to a carto-graphical visualisation and analysis of real-world phenomena that have a relatively low frequencyof changes that cannot be considered as very dynamic according to our de®nition of VDGIS.Moreover, traditional maps show various limitations for the representation of very dynamicphenomena, due to the fact that traditional maps serve as both a visual representation and in-formation repository of a real-world system. Nowadays, with the development of GIS and vi-sualisation and animation techniques, maps are often considered as a proactive derivation of GISdata from the database level.
In the context of VDGIS, a visualisation can be considered as a result of several functionaltasks, which depend on the database and cognitive levels. Firstly, from a technical point of view,visualisation functions are dependent on the database model and query processing characteristics,i.e., visualisation as an interface to a database. The expressive power and the ¯exibility of a vi-sualisation are partly dependent on the database properties such as the expressiveness of theunderlying database model and the data manipulation language. Secondly, a visualisation issubject to the end-usersÕ perception, i.e., whether or not certain visualisation schemes are e�cientin conveying relevant information. Therefore, an analysis of the principles that support the vi-sualisation of geographical phenomena leads to our proposal of a multi-layered architecture thatmakes a distinction between: (1) the database and processing levels, (2) the visualisation inter-action level, and (3) the end-user interaction level. These three components are characterised asfollows.
Database level: The expressiveness of the database level is quali®ed by the database model used(e.g., relational, geo-relational, object-oriented), the query language implemented (e.g., SQL,geographical query languages), and additional analysis and statistical functions available. Verydynamic geographical data are characterised by an important volume of data generated (in the
C. Claramunt et al. / Transportation Research Part C 8 (2000) 167±184 171
spatial, thematic and temporal dimensions) which constrains manipulation and visualisationoperations.
Visualisation level: In the context of this research, the visualisation level represents derived anddisplayed geographical data presented through an interface that supports visual presentations ofvery dynamic phenomena. The visualisation level includes interaction tools, that is, the set oflogical and physical computer facilities that allow users to act on the visualisation level (e.g., usingmenus, messages, keyboard and mouse actions).
End-user level: End-user backgrounds vary from novice, intermediate and expert users. They allintend to use a visualisation as a facility to enhance the understanding and perception of verydynamic phenomena.
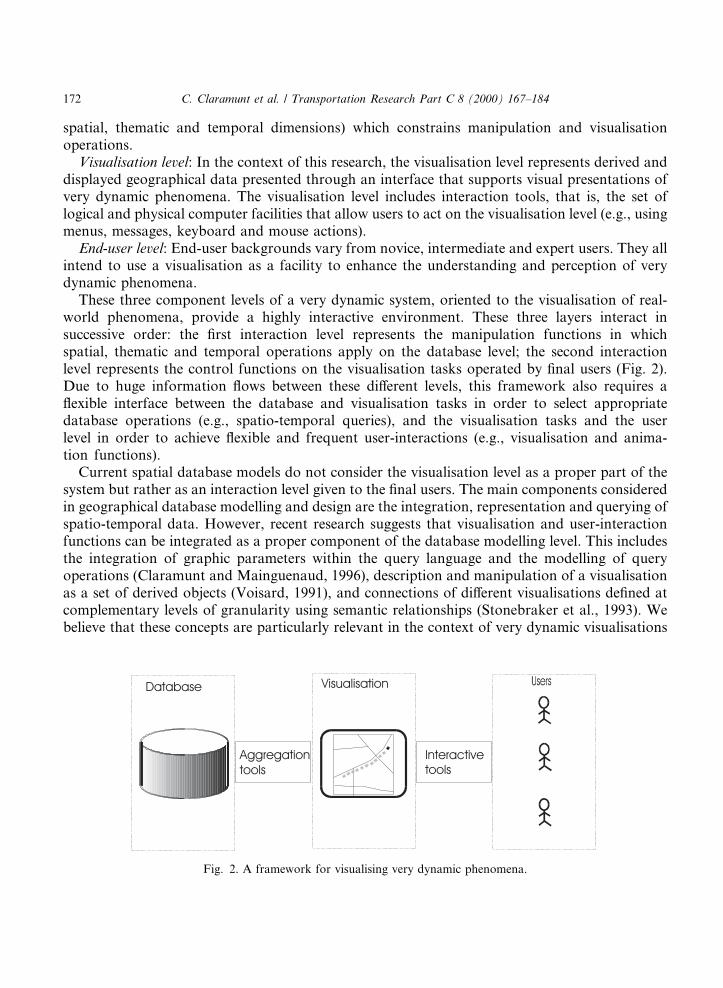
These three component levels of a very dynamic system, oriented to the visualisation of real-world phenomena, provide a highly interactive environment. These three layers interact insuccessive order: the ®rst interaction level represents the manipulation functions in whichspatial, thematic and temporal operations apply on the database level; the second interactionlevel represents the control functions on the visualisation tasks operated by ®nal users (Fig. 2).Due to huge information ¯ows between these di�erent levels, this framework also requires a¯exible interface between the database and visualisation tasks in order to select appropriatedatabase operations (e.g., spatio-temporal queries), and the visualisation tasks and the userlevel in order to achieve ¯exible and frequent user-interactions (e.g., visualisation and anima-tion functions).
Current spatial database models do not consider the visualisation level as a proper part of thesystem but rather as an interaction level given to the ®nal users. The main components consideredin geographical database modelling and design are the integration, representation and querying ofspatio-temporal data. However, recent research suggests that visualisation and user-interactionfunctions can be integrated as a proper component of the database modelling level. This includesthe integration of graphic parameters within the query language and the modelling of queryoperations (Claramunt and Mainguenaud, 1996), description and manipulation of a visualisationas a set of derived objects (Voisard, 1991), and connections of di�erent visualisations de®ned atcomplementary levels of granularity using semantic relationships (Stonebraker et al., 1993). Webelieve that these concepts are particularly relevant in the context of very dynamic visualisations
Fig. 2. A framework for visualising very dynamic phenomena.
172 C. Claramunt et al. / Transportation Research Part C 8 (2000) 167±184
in which the information ¯ows between the database, visualisation and user levels are particularlyintensive. Such concepts provide a solution to the derivation of spatio-temporal data, as a querylanguage that supports the expression of user-de®ned spatio-temporal queries on the one handand as an interaction language between users and the visualisation level on the other.
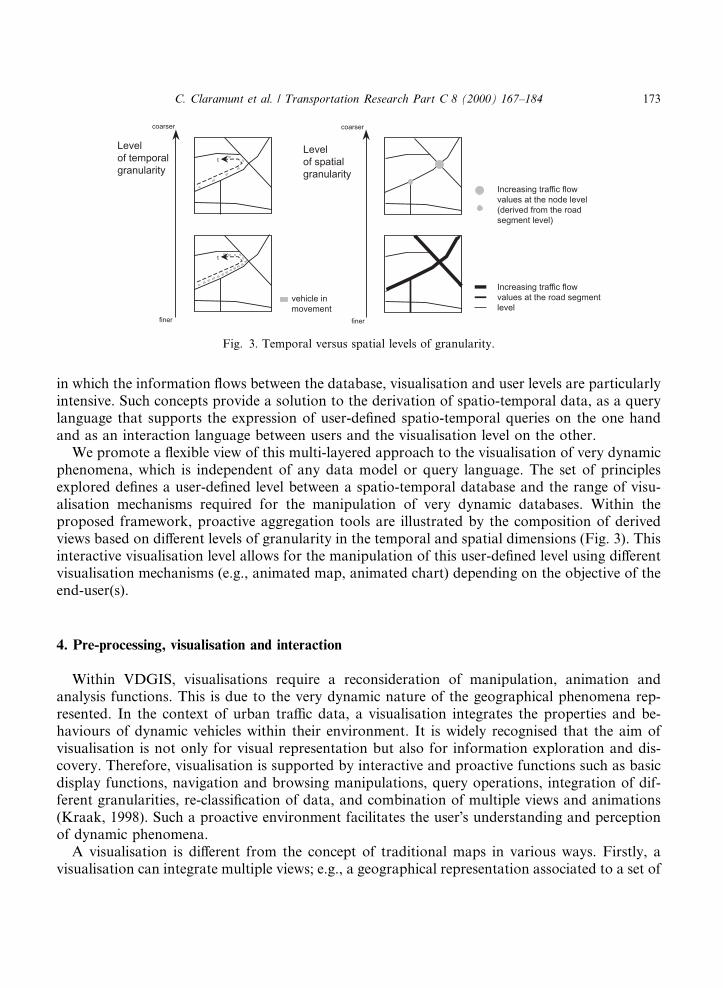
We promote a ¯exible view of this multi-layered approach to the visualisation of very dynamicphenomena, which is independent of any data model or query language. The set of principlesexplored de®nes a user-de®ned level between a spatio-temporal database and the range of visu-alisation mechanisms required for the manipulation of very dynamic databases. Within theproposed framework, proactive aggregation tools are illustrated by the composition of derivedviews based on di�erent levels of granularity in the temporal and spatial dimensions (Fig. 3). Thisinteractive visualisation level allows for the manipulation of this user-de®ned level using di�erentvisualisation mechanisms (e.g., animated map, animated chart) depending on the objective of theend-user(s).
4. Pre-processing, visualisation and interaction
Within VDGIS, visualisations require a reconsideration of manipulation, animation andanalysis functions. This is due to the very dynamic nature of the geographical phenomena rep-resented. In the context of urban tra�c data, a visualisation integrates the properties and be-haviours of dynamic vehicles within their environment. It is widely recognised that the aim ofvisualisation is not only for visual representation but also for information exploration and dis-covery. Therefore, visualisation is supported by interactive and proactive functions such as basicdisplay functions, navigation and browsing manipulations, query operations, integration of dif-ferent granularities, re-classi®cation of data, and combination of multiple views and animations(Kraak, 1998). Such a proactive environment facilitates the userÕs understanding and perceptionof dynamic phenomena.
A visualisation is di�erent from the concept of traditional maps in various ways. Firstly, avisualisation can integrate multiple views; e.g., a geographical representation associated to a set of
Fig. 3. Temporal versus spatial levels of granularity.
C. Claramunt et al. / Transportation Research Part C 8 (2000) 167±184 173
interconnected maps de®ned, for example, using di�erent scales, and additional data media(e.g., photographs). Secondly, a visualisation goes further by integrating animated scenes thatrepresent the temporal evolution of a region of interest and/or thematic property changes. Avisualisation is then more than a static map as it also integrates a dynamic component, which canbe user-controlled depending on the properties of the phenomenon represented. The structure of avisualisation is not a linear one but rather a complex one composed of di�erent levels of gran-ularity in both the spatial and temporal dimensions. Thirdly, a visualisation is completed byinteractive tasks for the manipulation of its visual components (e.g., pan and zooming functions).As such, a visualisation is supported by a set of interactive facilities o�ered to end-users, whichcan then manipulate di�erent visual components in order to develop a user-oriented perception ofreal-world phenomena.
In the context of VDGIS, visualisations combine geographical and thematic data along thetemporal line from di�erent media and sources using visual communication techniques. A visu-alisation integrates multiple components such as maps, charts and tables. Interactive functions,such as spatial operations or temporal brushes allow for the manipulation of visualisations, and infact of the underlying GIS database. Several complementary aspects need to be analysed for thedevelopment of VDGIS visualisations:· underlying properties of very dynamic geographical data;· pre-processing functions for ®ltering large volumes of data;· query and visualisation operations;· interactive functions for animation and interface manipulation.These considerations lead to the analysis of the nature of the dynamic data and changes to bedisplayed. Changes have been categorised by DiBiase et al. (1992) as changes in either: (a) spatiallocation; (b) spatial location and/or attributes; and (c) classi®cation of objects within the attributespace (e.g., re-classi®cation). Dynamic objects or spatial properties are di�cult to evaluate on anindividual basis. Therefore, the analysis and presentation of a set of dynamic objects often requirethe use of parsing, aggregation and/or statistical techniques (Kraak and MacEachren, 1994). Thisis illustrated, for example, by the pre-processing of the spatial, thematic and temporal propertiesof very dynamic objects. Often, passing from one spatial or temporal level of granularity to acoarser one provides a complementary insight for the analysis and understanding of spatialphenomena. Within the time dimension, temporal operators could be used for changing thetemporal granularity of the phenomena represented. As such, these operations allow phenomenavisualisation from a hierarchical point of view. Propagation of temporal constraints betweenspatio-temporal processes represented at complementary levels of granularity can be realisedusing constraint propagation algorithms (Claramunt and Bai, 1999). Reasoning and manipulationin temporal systems have been widely studied in temporal logic (Allen, 1984; Bestouge� andLigozat, 1992; Badaloni and Benati, 1994). Formal temporal languages and operators are ofparticular interest for the temporal aggregation of very dynamic data. Generally, compositionoperations, based on the manipulation of temporal intervals, allow the representation of phe-nomena at a coarser level of granularity using temporal operators that aggregate temporal periods(e.g., from an hour to a day frequency of change). Within the spatial and thematic dimensions,aggregational, statistical and relational operations can also be applied. These operations consti-tute a set of pre-processing functions that cover the di�erent dimensions of geographicalphenomena.
174 C. Claramunt et al. / Transportation Research Part C 8 (2000) 167±184
The information contained within a VDGIS visualisation includes dynamic objects and theirchanging properties on the one hand and the relatively static environment on the other. The latteracts as a visual background for presentation and animation purposes. For static data, a singlevisual representation is generally used, it is bounded in time by the temporal validity of thegeographical data visualised which is either a time instant or interval. The static component of avisualisation provides support for the interactive exploration of changes as it gives a geographicalreference to the dynamic phenomena analysed. The duration of a temporal visualisation scene(i.e., animation) can be proportional to the magnitude of the phenomenon represented. For ex-ample, the temporal progression of animation slows down as changes visualised are increasing inintensity. This type of animation technique is referred to as pacing (DiBiase et al., 1992). This alsorequires an analysis of the visual properties that support the presentation of dynamic objects
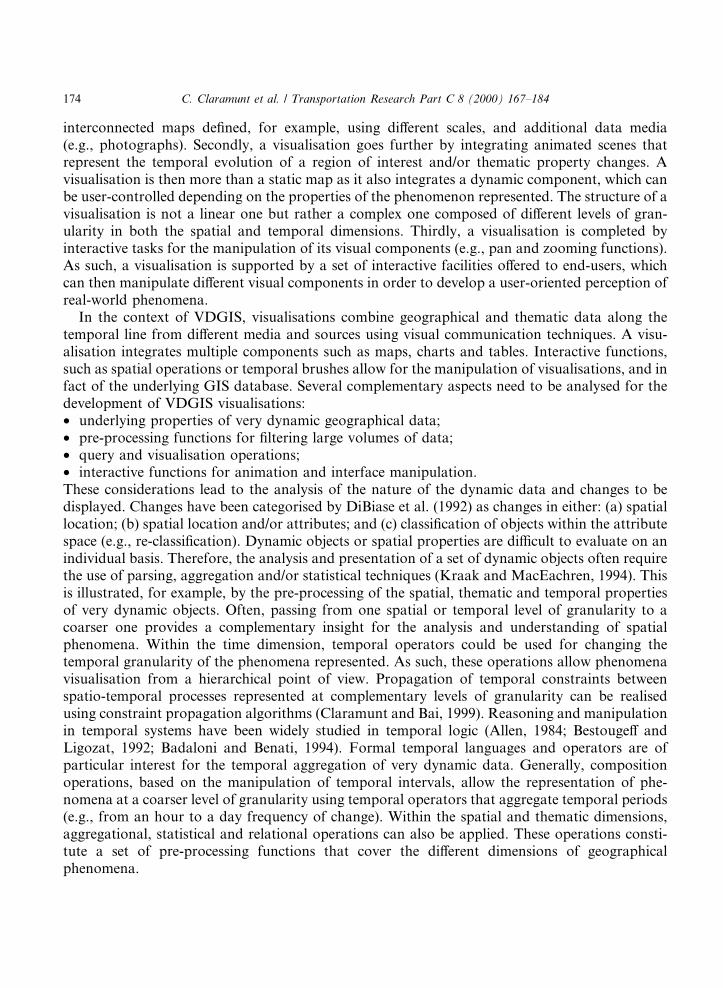
Fig. 4. Individual vehicle versus network property changes.
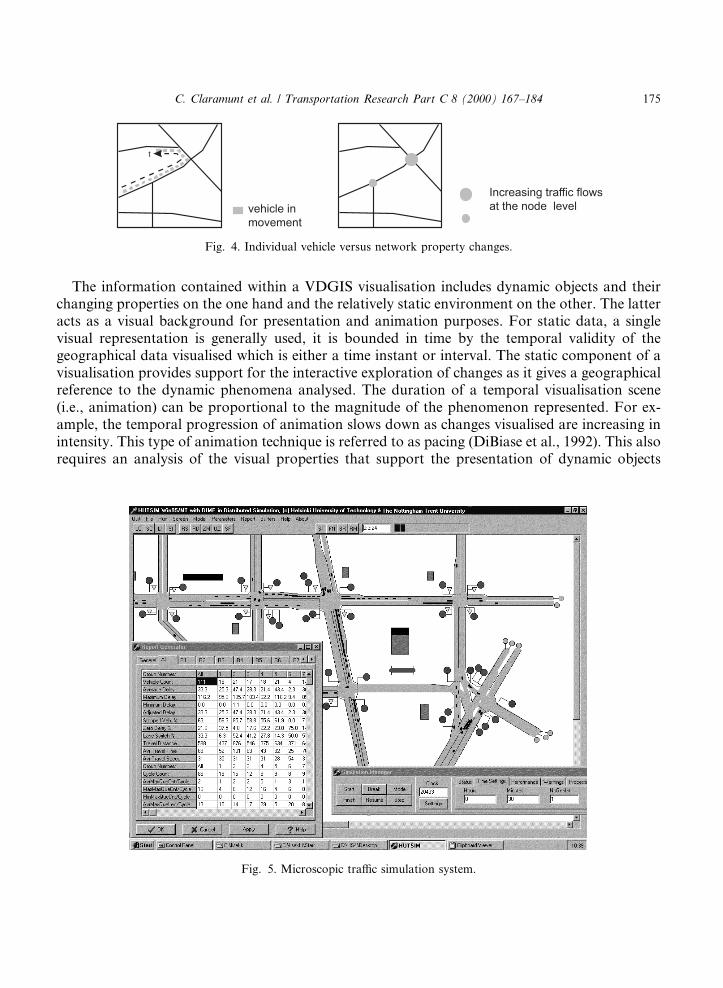
Fig. 5. Microscopic tra�c simulation system.
C. Claramunt et al. / Transportation Research Part C 8 (2000) 167±184 175
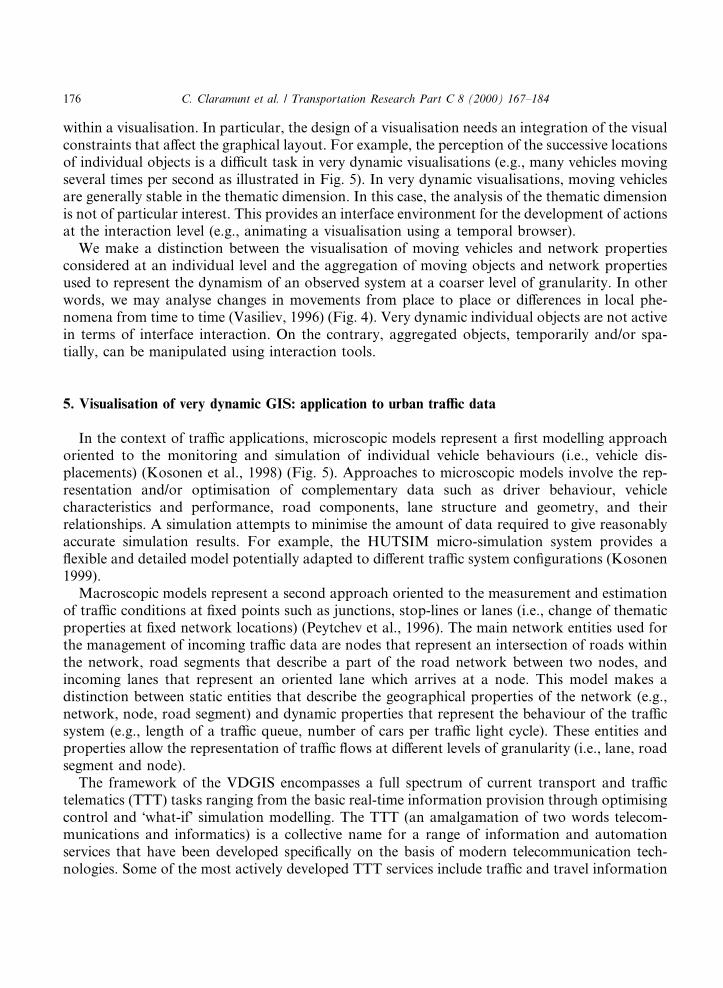
within a visualisation. In particular, the design of a visualisation needs an integration of the visualconstraints that a�ect the graphical layout. For example, the perception of the successive locationsof individual objects is a di�cult task in very dynamic visualisations (e.g., many vehicles movingseveral times per second as illustrated in Fig. 5). In very dynamic visualisations, moving vehiclesare generally stable in the thematic dimension. In this case, the analysis of the thematic dimensionis not of particular interest. This provides an interface environment for the development of actionsat the interaction level (e.g., animating a visualisation using a temporal browser).
We make a distinction between the visualisation of moving vehicles and network propertiesconsidered at an individual level and the aggregation of moving objects and network propertiesused to represent the dynamism of an observed system at a coarser level of granularity. In otherwords, we may analyse changes in movements from place to place or di�erences in local phe-nomena from time to time (Vasiliev, 1996) (Fig. 4). Very dynamic individual objects are not activein terms of interface interaction. On the contrary, aggregated objects, temporarily and/or spa-tially, can be manipulated using interaction tools.
5. Visualisation of very dynamic GIS: application to urban tra�c data
In the context of tra�c applications, microscopic models represent a ®rst modelling approachoriented to the monitoring and simulation of individual vehicle behaviours (i.e., vehicle dis-placements) (Kosonen et al., 1998) (Fig. 5). Approaches to microscopic models involve the rep-resentation and/or optimisation of complementary data such as driver behaviour, vehiclecharacteristics and performance, road components, lane structure and geometry, and theirrelationships. A simulation attempts to minimise the amount of data required to give reasonablyaccurate simulation results. For example, the HUTSIM micro-simulation system provides a¯exible and detailed model potentially adapted to di�erent tra�c system con®gurations (Kosonen1999).
Macroscopic models represent a second approach oriented to the measurement and estimationof tra�c conditions at ®xed points such as junctions, stop-lines or lanes (i.e., change of thematicproperties at ®xed network locations) (Peytchev et al., 1996). The main network entities used forthe management of incoming tra�c data are nodes that represent an intersection of roads withinthe network, road segments that describe a part of the road network between two nodes, andincoming lanes that represent an oriented lane which arrives at a node. This model makes adistinction between static entities that describe the geographical properties of the network (e.g.,network, node, road segment) and dynamic properties that represent the behaviour of the tra�csystem (e.g., length of a tra�c queue, number of cars per tra�c light cycle). These entities andproperties allow the representation of tra�c ¯ows at di�erent levels of granularity (i.e., lane, roadsegment and node).
The framework of the VDGIS encompasses a full spectrum of current transport and tra�ctelematics (TTT) tasks ranging from the basic real-time information provision through optimisingcontrol and Ôwhat-ifÕ simulation modelling. The TTT (an amalgamation of two words telecom-munications and informatics) is a collective name for a range of information and automationservices that have been developed speci®cally on the basis of modern telecommunication tech-nologies. Some of the most actively developed TTT services include tra�c and travel information
176 C. Claramunt et al. / Transportation Research Part C 8 (2000) 167±184
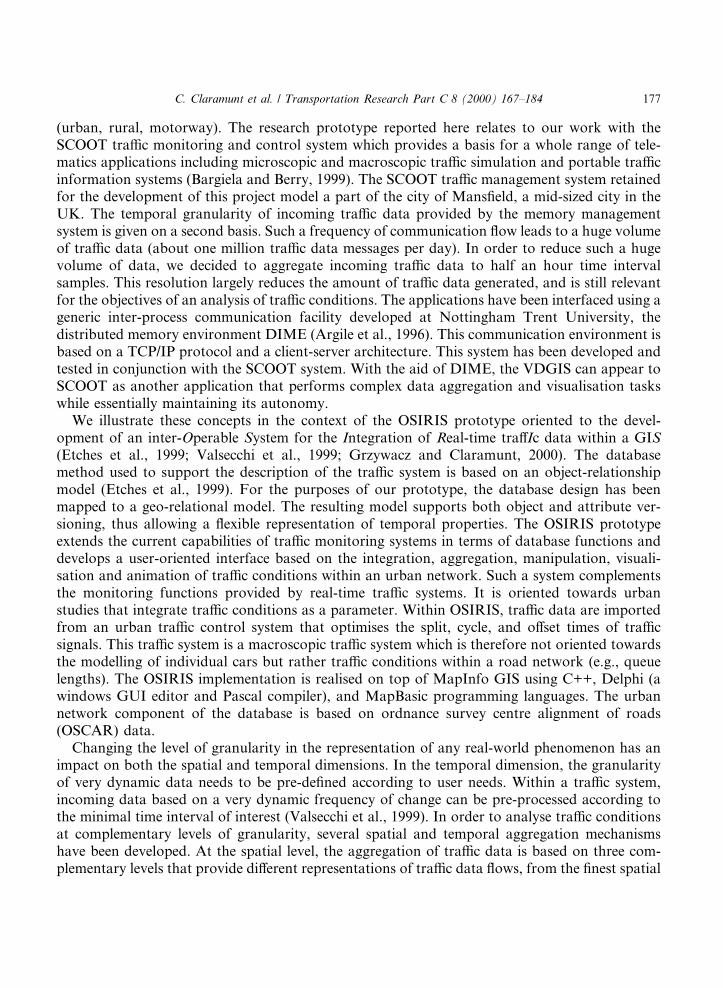
(urban, rural, motorway). The research prototype reported here relates to our work with theSCOOT tra�c monitoring and control system which provides a basis for a whole range of tele-matics applications including microscopic and macroscopic tra�c simulation and portable tra�cinformation systems (Bargiela and Berry, 1999). The SCOOT tra�c management system retainedfor the development of this project model a part of the city of Mans®eld, a mid-sized city in theUK. The temporal granularity of incoming tra�c data provided by the memory managementsystem is given on a second basis. Such a frequency of communication ¯ow leads to a huge volumeof tra�c data (about one million tra�c data messages per day). In order to reduce such a hugevolume of data, we decided to aggregate incoming tra�c data to half an hour time intervalsamples. This resolution largely reduces the amount of tra�c data generated, and is still relevantfor the objectives of an analysis of tra�c conditions. The applications have been interfaced using ageneric inter-process communication facility developed at Nottingham Trent University, thedistributed memory environment DIME (Argile et al., 1996). This communication environment isbased on a TCP/IP protocol and a client-server architecture. This system has been developed andtested in conjunction with the SCOOT system. With the aid of DIME, the VDGIS can appear toSCOOT as another application that performs complex data aggregation and visualisation taskswhile essentially maintaining its autonomy.
We illustrate these concepts in the context of the OSIRIS prototype oriented to the devel-opment of an inter-Operable System for the Integration of Real-time tra�Ic data within a GIS(Etches et al., 1999; Valsecchi et al., 1999; Grzywacz and Claramunt, 2000). The databasemethod used to support the description of the tra�c system is based on an object-relationshipmodel (Etches et al., 1999). For the purposes of our prototype, the database design has beenmapped to a geo-relational model. The resulting model supports both object and attribute ver-sioning, thus allowing a ¯exible representation of temporal properties. The OSIRIS prototypeextends the current capabilities of tra�c monitoring systems in terms of database functions anddevelops a user-oriented interface based on the integration, aggregation, manipulation, visuali-sation and animation of tra�c conditions within an urban network. Such a system complementsthe monitoring functions provided by real-time tra�c systems. It is oriented towards urbanstudies that integrate tra�c conditions as a parameter. Within OSIRIS, tra�c data are importedfrom an urban tra�c control system that optimises the split, cycle, and o�set times of tra�csignals. This tra�c system is a macroscopic tra�c system which is therefore not oriented towardsthe modelling of individual cars but rather tra�c conditions within a road network (e.g., queuelengths). The OSIRIS implementation is realised on top of MapInfo GIS using C++, Delphi (awindows GUI editor and Pascal compiler), and MapBasic programming languages. The urbannetwork component of the database is based on ordnance survey centre alignment of roads(OSCAR) data.
Changing the level of granularity in the representation of any real-world phenomenon has animpact on both the spatial and temporal dimensions. In the temporal dimension, the granularityof very dynamic data needs to be pre-de®ned according to user needs. Within a tra�c system,incoming data based on a very dynamic frequency of change can be pre-processed according tothe minimal time interval of interest (Valsecchi et al., 1999). In order to analyse tra�c conditionsat complementary levels of granularity, several spatial and temporal aggregation mechanismshave been developed. At the spatial level, the aggregation of tra�c data is based on three com-plementary levels that provide di�erent representations of tra�c data ¯ows, from the ®nest spatial
C. Claramunt et al. / Transportation Research Part C 8 (2000) 167±184 177
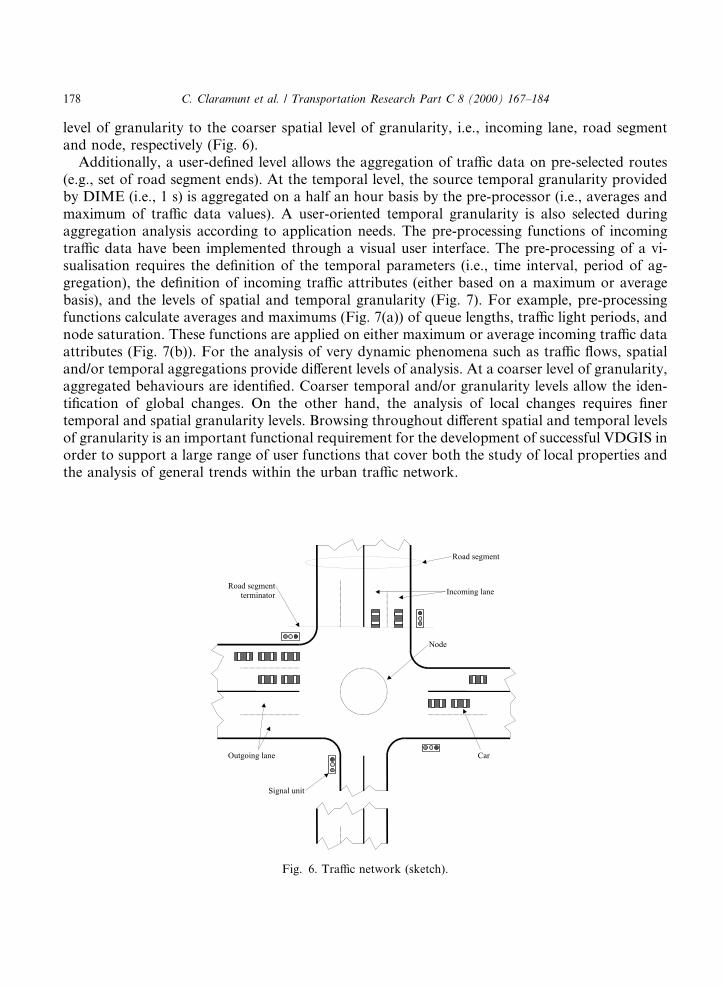
level of granularity to the coarser spatial level of granularity, i.e., incoming lane, road segmentand node, respectively (Fig. 6).
Additionally, a user-de®ned level allows the aggregation of tra�c data on pre-selected routes(e.g., set of road segment ends). At the temporal level, the source temporal granularity providedby DIME (i.e., 1 s) is aggregated on a half an hour basis by the pre-processor (i.e., averages andmaximum of tra�c data values). A user-oriented temporal granularity is also selected duringaggregation analysis according to application needs. The pre-processing functions of incomingtra�c data have been implemented through a visual user interface. The pre-processing of a vi-sualisation requires the de®nition of the temporal parameters (i.e., time interval, period of ag-gregation), the de®nition of incoming tra�c attributes (either based on a maximum or averagebasis), and the levels of spatial and temporal granularity (Fig. 7). For example, pre-processingfunctions calculate averages and maximums (Fig. 7(a)) of queue lengths, tra�c light periods, andnode saturation. These functions are applied on either maximum or average incoming tra�c dataattributes (Fig. 7(b)). For the analysis of very dynamic phenomena such as tra�c ¯ows, spatialand/or temporal aggregations provide di�erent levels of analysis. At a coarser level of granularity,aggregated behaviours are identi®ed. Coarser temporal and/or granularity levels allow the iden-ti®cation of global changes. On the other hand, the analysis of local changes requires ®nertemporal and spatial granularity levels. Browsing throughout di�erent spatial and temporal levelsof granularity is an important functional requirement for the development of successful VDGIS inorder to support a large range of user functions that cover both the study of local properties andthe analysis of general trends within the urban tra�c network.
Fig. 6. Tra�c network (sketch).
178 C. Claramunt et al. / Transportation Research Part C 8 (2000) 167±184
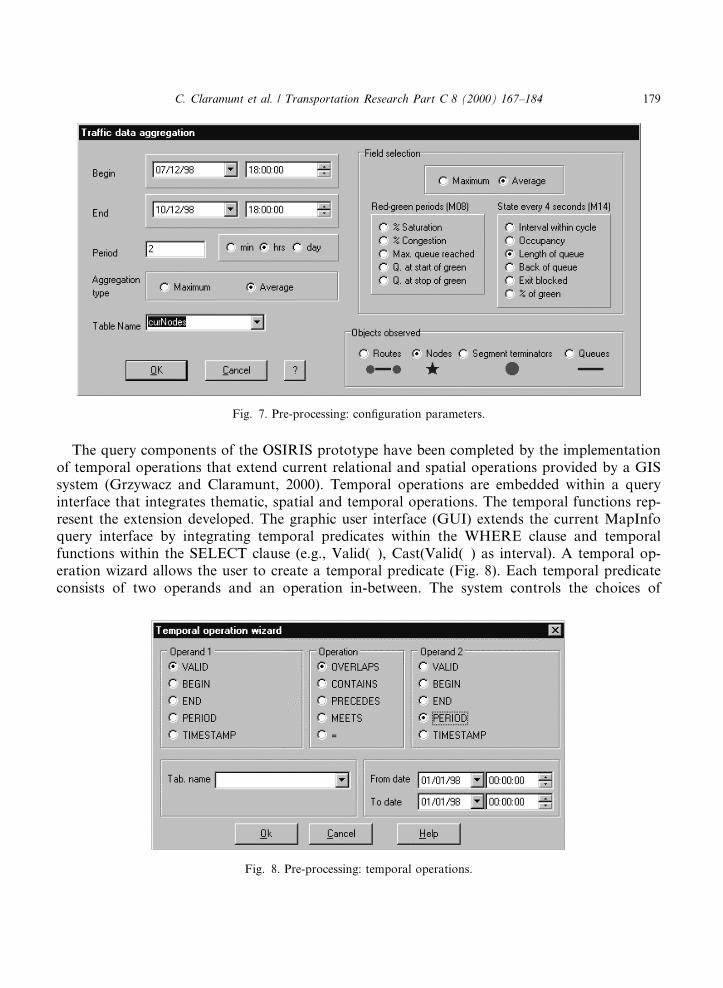
The query components of the OSIRIS prototype have been completed by the implementationof temporal operations that extend current relational and spatial operations provided by a GISsystem (Grzywacz and Claramunt, 2000). Temporal operations are embedded within a queryinterface that integrates thematic, spatial and temporal operations. The temporal functions rep-resent the extension developed. The graphic user interface (GUI) extends the current MapInfoquery interface by integrating temporal predicates within the WHERE clause and temporalfunctions within the SELECT clause (e.g., Valid( ), Cast(Valid( ) as interval). A temporal op-eration wizard allows the user to create a temporal predicate (Fig. 8). Each temporal predicateconsists of two operands and an operation in-between. The system controls the choices of
Fig. 8. Pre-processing: temporal operations.
Fig. 7. Pre-processing: con®guration parameters.
C. Claramunt et al. / Transportation Research Part C 8 (2000) 167±184 179
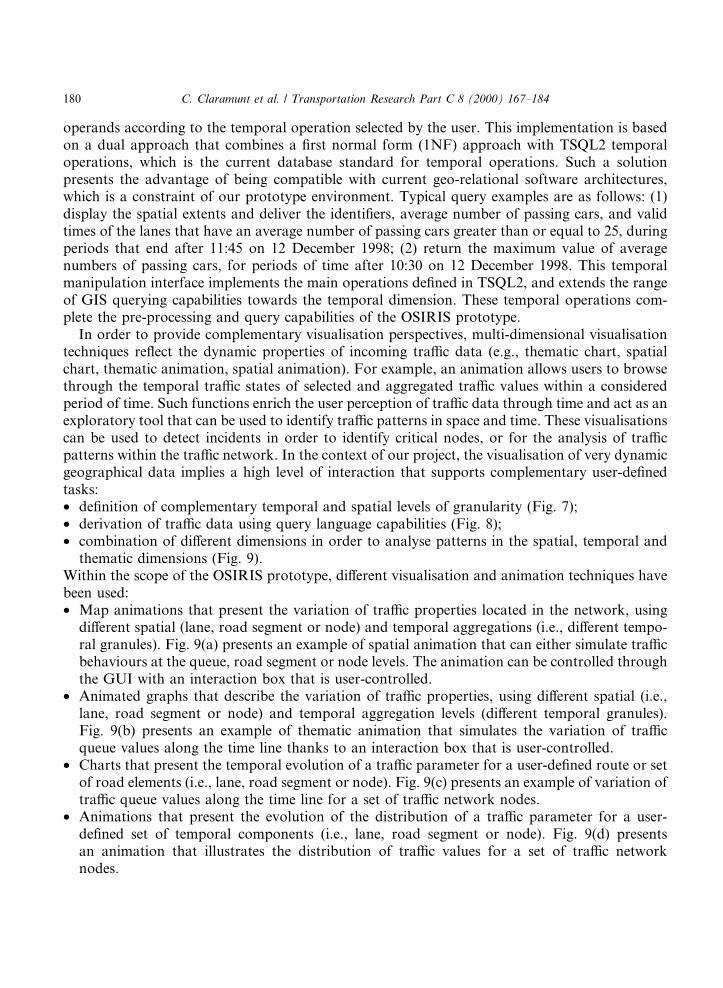
operands according to the temporal operation selected by the user. This implementation is basedon a dual approach that combines a ®rst normal form (1NF) approach with TSQL2 temporaloperations, which is the current database standard for temporal operations. Such a solutionpresents the advantage of being compatible with current geo-relational software architectures,which is a constraint of our prototype environment. Typical query examples are as follows: (1)display the spatial extents and deliver the identi®ers, average number of passing cars, and validtimes of the lanes that have an average number of passing cars greater than or equal to 25, duringperiods that end after 11:45 on 12 December 1998; (2) return the maximum value of averagenumbers of passing cars, for periods of time after 10:30 on 12 December 1998. This temporalmanipulation interface implements the main operations de®ned in TSQL2, and extends the rangeof GIS querying capabilities towards the temporal dimension. These temporal operations com-plete the pre-processing and query capabilities of the OSIRIS prototype.
In order to provide complementary visualisation perspectives, multi-dimensional visualisationtechniques re¯ect the dynamic properties of incoming tra�c data (e.g., thematic chart, spatialchart, thematic animation, spatial animation). For example, an animation allows users to browsethrough the temporal tra�c states of selected and aggregated tra�c values within a consideredperiod of time. Such functions enrich the user perception of tra�c data through time and act as anexploratory tool that can be used to identify tra�c patterns in space and time. These visualisationscan be used to detect incidents in order to identify critical nodes, or for the analysis of tra�cpatterns within the tra�c network. In the context of our project, the visualisation of very dynamicgeographical data implies a high level of interaction that supports complementary user-de®nedtasks:· de®nition of complementary temporal and spatial levels of granularity (Fig. 7);· derivation of tra�c data using query language capabilities (Fig. 8);· combination of di�erent dimensions in order to analyse patterns in the spatial, temporal and
thematic dimensions (Fig. 9).Within the scope of the OSIRIS prototype, di�erent visualisation and animation techniques havebeen used:· Map animations that present the variation of tra�c properties located in the network, using
di�erent spatial (lane, road segment or node) and temporal aggregations (i.e., di�erent tempo-ral granules). Fig. 9(a) presents an example of spatial animation that can either simulate tra�cbehaviours at the queue, road segment or node levels. The animation can be controlled throughthe GUI with an interaction box that is user-controlled.
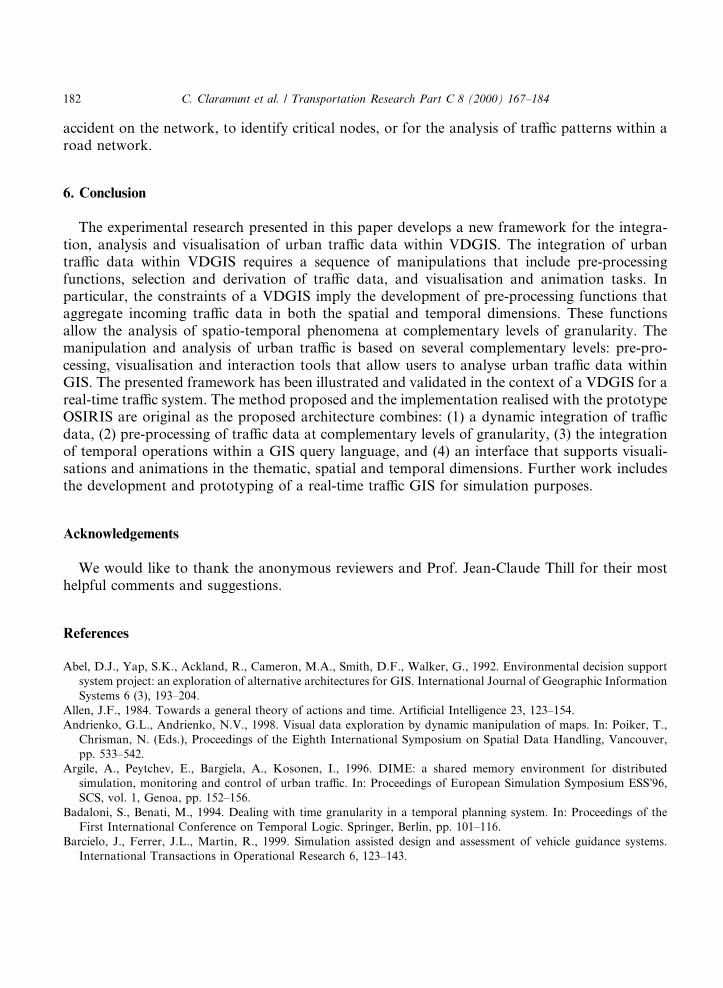
· Animated graphs that describe the variation of tra�c properties, using di�erent spatial (i.e.,lane, road segment or node) and temporal aggregation levels (di�erent temporal granules).Fig. 9(b) presents an example of thematic animation that simulates the variation of tra�cqueue values along the time line thanks to an interaction box that is user-controlled.
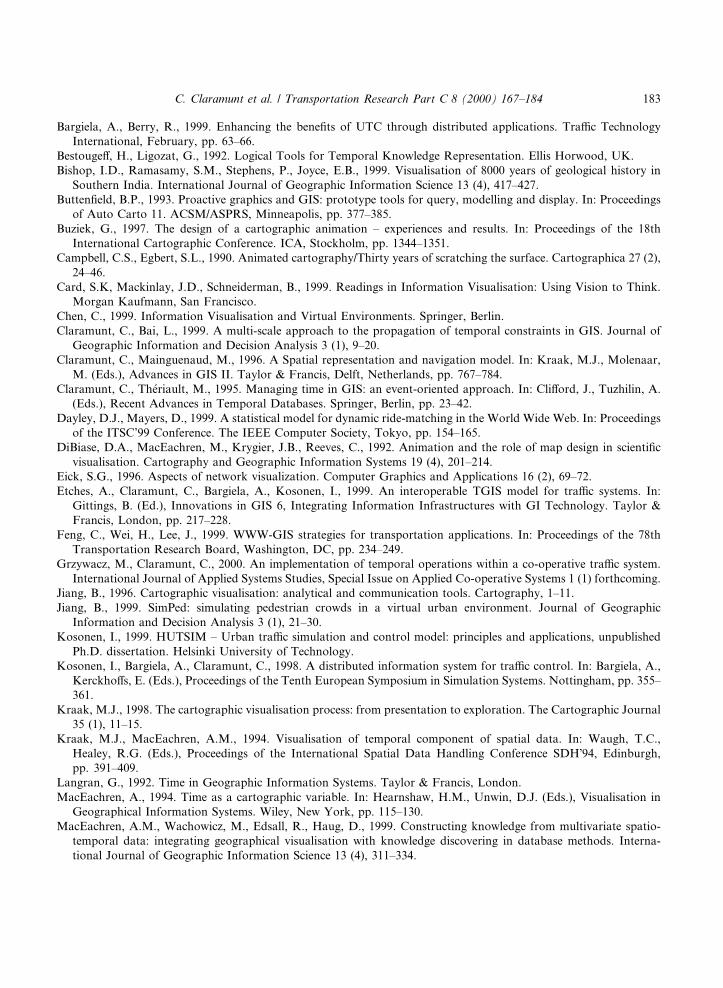
· Charts that present the temporal evolution of a tra�c parameter for a user-de®ned route or setof road elements (i.e., lane, road segment or node). Fig. 9(c) presents an example of variation oftra�c queue values along the time line for a set of tra�c network nodes.
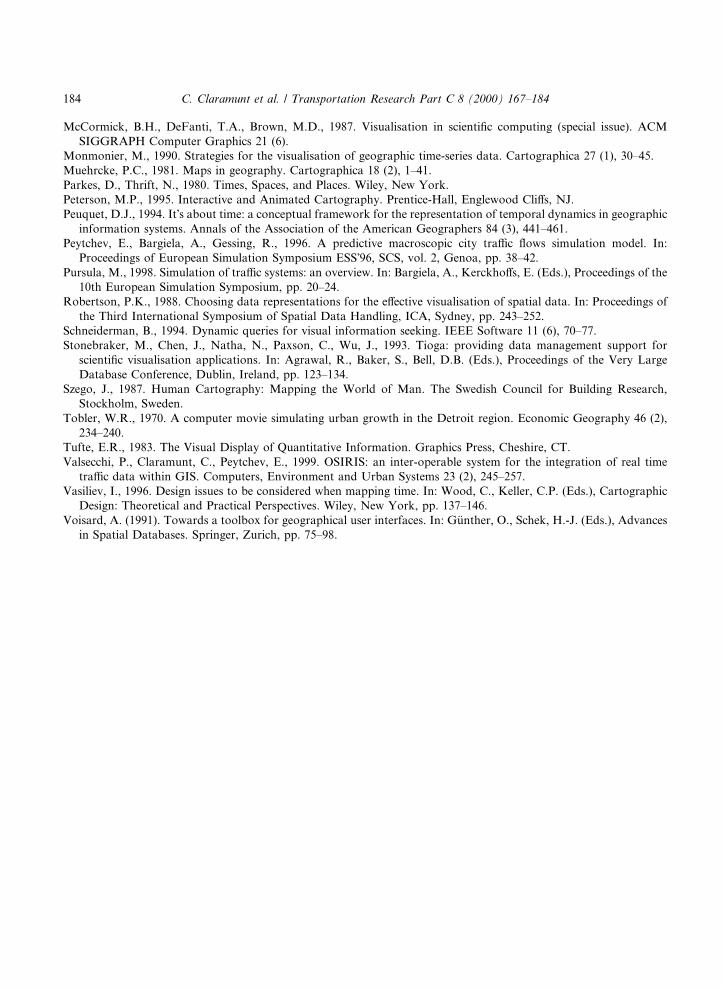
· Animations that present the evolution of the distribution of a tra�c parameter for a user-de®ned set of temporal components (i.e., lane, road segment or node). Fig. 9(d) presentsan animation that illustrates the distribution of tra�c values for a set of tra�c networknodes.
180 C. Claramunt et al. / Transportation Research Part C 8 (2000) 167±184
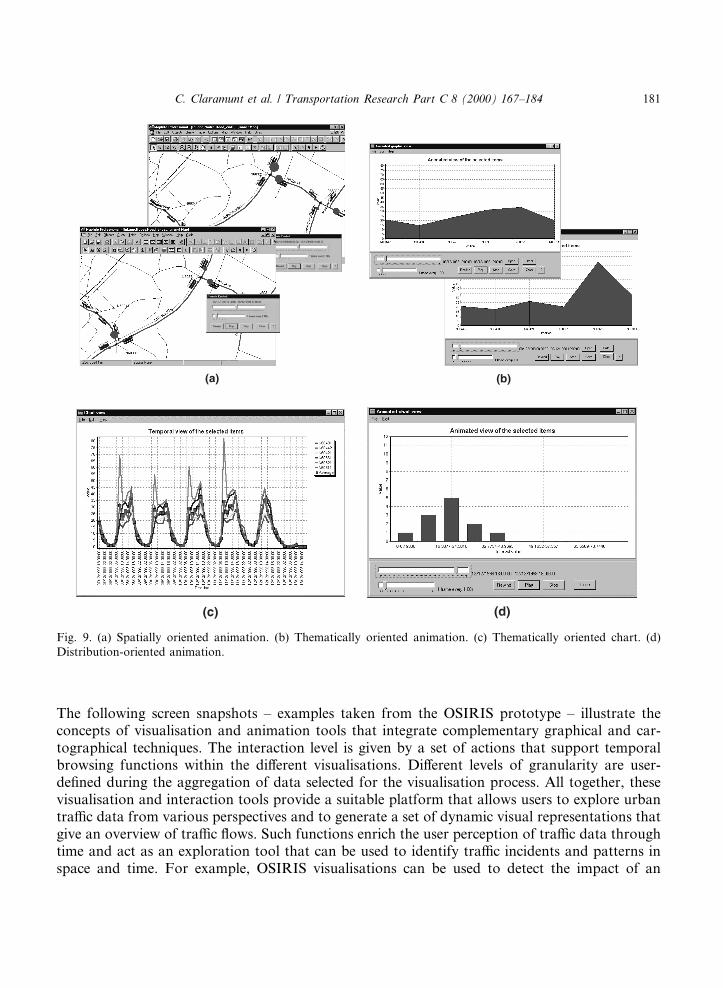
The following screen snapshots ± examples taken from the OSIRIS prototype ± illustrate theconcepts of visualisation and animation tools that integrate complementary graphical and car-tographical techniques. The interaction level is given by a set of actions that support temporalbrowsing functions within the di�erent visualisations. Di�erent levels of granularity are user-de®ned during the aggregation of data selected for the visualisation process. All together, thesevisualisation and interaction tools provide a suitable platform that allows users to explore urbantra�c data from various perspectives and to generate a set of dynamic visual representations thatgive an overview of tra�c ¯ows. Such functions enrich the user perception of tra�c data throughtime and act as an exploration tool that can be used to identify tra�c incidents and patterns inspace and time. For example, OSIRIS visualisations can be used to detect the impact of an
Fig. 9. (a) Spatially oriented animation. (b) Thematically oriented animation. (c) Thematically oriented chart. (d)
Distribution-oriented animation.
C. Claramunt et al. / Transportation Research Part C 8 (2000) 167±184 181
accident on the network, to identify critical nodes, or for the analysis of tra�c patterns within aroad network.
6. Conclusion
The experimental research presented in this paper develops a new framework for the integra-tion, analysis and visualisation of urban tra�c data within VDGIS. The integration of urbantra�c data within VDGIS requires a sequence of manipulations that include pre-processingfunctions, selection and derivation of tra�c data, and visualisation and animation tasks. Inparticular, the constraints of a VDGIS imply the development of pre-processing functions thataggregate incoming tra�c data in both the spatial and temporal dimensions. These functionsallow the analysis of spatio-temporal phenomena at complementary levels of granularity. Themanipulation and analysis of urban tra�c is based on several complementary levels: pre-pro-cessing, visualisation and interaction tools that allow users to analyse urban tra�c data withinGIS. The presented framework has been illustrated and validated in the context of a VDGIS for areal-time tra�c system. The method proposed and the implementation realised with the prototypeOSIRIS are original as the proposed architecture combines: (1) a dynamic integration of tra�cdata, (2) pre-processing of tra�c data at complementary levels of granularity, (3) the integrationof temporal operations within a GIS query language, and (4) an interface that supports visuali-sations and animations in the thematic, spatial and temporal dimensions. Further work includesthe development and prototyping of a real-time tra�c GIS for simulation purposes.
Acknowledgements
We would like to thank the anonymous reviewers and Prof. Jean-Claude Thill for their mosthelpful comments and suggestions.
References
Abel, D.J., Yap, S.K., Ackland, R., Cameron, M.A., Smith, D.F., Walker, G., 1992. Environmental decision support
system project: an exploration of alternative architectures for GIS. International Journal of Geographic Information
Systems 6 (3), 193±204.
Allen, J.F., 1984. Towards a general theory of actions and time. Arti®cial Intelligence 23, 123±154.
Andrienko, G.L., Andrienko, N.V., 1998. Visual data exploration by dynamic manipulation of maps. In: Poiker, T.,
Chrisman, N. (Eds.), Proceedings of the Eighth International Symposium on Spatial Data Handling, Vancouver,
pp. 533±542.
Argile, A., Peytchev, E., Bargiela, A., Kosonen, I., 1996. DIME: a shared memory environment for distributed
simulation, monitoring and control of urban tra�c. In: Proceedings of European Simulation Symposium ESSÕ96,
SCS, vol. 1, Genoa, pp. 152±156.
Badaloni, S., Benati, M., 1994. Dealing with time granularity in a temporal planning system. In: Proceedings of the
First International Conference on Temporal Logic. Springer, Berlin, pp. 101±116.
Barcielo, J., Ferrer, J.L., Martin, R., 1999. Simulation assisted design and assessment of vehicle guidance systems.
International Transactions in Operational Research 6, 123±143.
182 C. Claramunt et al. / Transportation Research Part C 8 (2000) 167±184
Bargiela, A., Berry, R., 1999. Enhancing the bene®ts of UTC through distributed applications. Tra�c Technology
International, February, pp. 63±66.
Bestouge�, H., Ligozat, G., 1992. Logical Tools for Temporal Knowledge Representation. Ellis Horwood, UK.
Bishop, I.D., Ramasamy, S.M., Stephens, P., Joyce, E.B., 1999. Visualisation of 8000 years of geological history in
Southern India. International Journal of Geographic Information Science 13 (4), 417±427.
Butten®eld, B.P., 1993. Proactive graphics and GIS: prototype tools for query, modelling and display. In: Proceedings
of Auto Carto 11. ACSM/ASPRS, Minneapolis, pp. 377±385.
Buziek, G., 1997. The design of a cartographic animation ± experiences and results. In: Proceedings of the 18th
International Cartographic Conference. ICA, Stockholm, pp. 1344±1351.
Campbell, C.S., Egbert, S.L., 1990. Animated cartography/Thirty years of scratching the surface. Cartographica 27 (2),
24±46.
Card, S.K, Mackinlay, J.D., Schneiderman, B., 1999. Readings in Information Visualisation: Using Vision to Think.
Morgan Kaufmann, San Francisco.
Chen, C., 1999. Information Visualisation and Virtual Environments. Springer, Berlin.
Claramunt, C., Bai, L., 1999. A multi-scale approach to the propagation of temporal constraints in GIS. Journal of
Geographic Information and Decision Analysis 3 (1), 9±20.
Claramunt, C., Mainguenaud, M., 1996. A Spatial representation and navigation model. In: Kraak, M.J., Molenaar,
M. (Eds.), Advances in GIS II. Taylor & Francis, Delft, Netherlands, pp. 767±784.
Claramunt, C., Th�eriault, M., 1995. Managing time in GIS: an event-oriented approach. In: Cli�ord, J., Tuzhilin, A.
(Eds.), Recent Advances in Temporal Databases. Springer, Berlin, pp. 23±42.
Dayley, D.J., Mayers, D., 1999. A statistical model for dynamic ride-matching in the World Wide Web. In: Proceedings
of the ITSC'99 Conference. The IEEE Computer Society, Tokyo, pp. 154±165.
DiBiase, D.A., MacEachren, M., Krygier, J.B., Reeves, C., 1992. Animation and the role of map design in scienti®c
visualisation. Cartography and Geographic Information Systems 19 (4), 201±214.
Eick, S.G., 1996. Aspects of network visualization. Computer Graphics and Applications 16 (2), 69±72.
Etches, A., Claramunt, C., Bargiela, A., Kosonen, I., 1999. An interoperable TGIS model for tra�c systems. In:
Gittings, B. (Ed.), Innovations in GIS 6, Integrating Information Infrastructures with GI Technology. Taylor &
Francis, London, pp. 217±228.
Feng, C., Wei, H., Lee, J., 1999. WWW-GIS strategies for transportation applications. In: Proceedings of the 78th
Transportation Research Board, Washington, DC, pp. 234±249.
Grzywacz, M., Claramunt, C., 2000. An implementation of temporal operations within a co-operative tra�c system.
International Journal of Applied Systems Studies, Special Issue on Applied Co-operative Systems 1 (1) forthcoming.
Jiang, B., 1996. Cartographic visualisation: analytical and communication tools. Cartography, 1±11.
Jiang, B., 1999. SimPed: simulating pedestrian crowds in a virtual urban environment. Journal of Geographic
Information and Decision Analysis 3 (1), 21±30.
Kosonen, I., 1999. HUTSIM ± Urban tra�c simulation and control model: principles and applications, unpublished
Ph.D. dissertation. Helsinki University of Technology.
Kosonen, I., Bargiela, A., Claramunt, C., 1998. A distributed information system for tra�c control. In: Bargiela, A.,
Kerckho�s, E. (Eds.), Proceedings of the Tenth European Symposium in Simulation Systems. Nottingham, pp. 355±
361.
Kraak, M.J., 1998. The cartographic visualisation process: from presentation to exploration. The Cartographic Journal
35 (1), 11±15.
Kraak, M.J., MacEachren, A.M., 1994. Visualisation of temporal component of spatial data. In: Waugh, T.C.,
Healey, R.G. (Eds.), Proceedings of the International Spatial Data Handling Conference SDHÕ94, Edinburgh,
pp. 391±409.
Langran, G., 1992. Time in Geographic Information Systems. Taylor & Francis, London.
MacEachren, A., 1994. Time as a cartographic variable. In: Hearnshaw, H.M., Unwin, D.J. (Eds.), Visualisation in
Geographical Information Systems. Wiley, New York, pp. 115±130.
MacEachren, A.M., Wachowicz, M., Edsall, R., Haug, D., 1999. Constructing knowledge from multivariate spatio-
temporal data: integrating geographical visualisation with knowledge discovering in database methods. Interna-
tional Journal of Geographic Information Science 13 (4), 311±334.
C. Claramunt et al. / Transportation Research Part C 8 (2000) 167±184 183
McCormick, B.H., DeFanti, T.A., Brown, M.D., 1987. Visualisation in scienti®c computing (special issue). ACM
SIGGRAPH Computer Graphics 21 (6).
Monmonier, M., 1990. Strategies for the visualisation of geographic time-series data. Cartographica 27 (1), 30±45.
Muehrcke, P.C., 1981. Maps in geography. Cartographica 18 (2), 1±41.
Parkes, D., Thrift, N., 1980. Times, Spaces, and Places. Wiley, New York.
Peterson, M.P., 1995. Interactive and Animated Cartography. Prentice-Hall, Englewood Cli�s, NJ.
Peuquet, D.J., 1994. ItÕs about time: a conceptual framework for the representation of temporal dynamics in geographic
information systems. Annals of the Association of the American Geographers 84 (3), 441±461.
Peytchev, E., Bargiela, A., Gessing, R., 1996. A predictive macroscopic city tra�c ¯ows simulation model. In:
Proceedings of European Simulation Symposium ESSÕ96, SCS, vol. 2, Genoa, pp. 38±42.
Pursula, M., 1998. Simulation of tra�c systems: an overview. In: Bargiela, A., Kerckho�s, E. (Eds.), Proceedings of the
10th European Simulation Symposium, pp. 20±24.
Robertson, P.K., 1988. Choosing data representations for the e�ective visualisation of spatial data. In: Proceedings of
the Third International Symposium of Spatial Data Handling, ICA, Sydney, pp. 243±252.
Schneiderman, B., 1994. Dynamic queries for visual information seeking. IEEE Software 11 (6), 70±77.
Stonebraker, M., Chen, J., Natha, N., Paxson, C., Wu, J., 1993. Tioga: providing data management support for
scienti®c visualisation applications. In: Agrawal, R., Baker, S., Bell, D.B. (Eds.), Proceedings of the Very Large
Database Conference, Dublin, Ireland, pp. 123±134.
Szego, J., 1987. Human Cartography: Mapping the World of Man. The Swedish Council for Building Research,
Stockholm, Sweden.
Tobler, W.R., 1970. A computer movie simulating urban growth in the Detroit region. Economic Geography 46 (2),
234±240.
Tufte, E.R., 1983. The Visual Display of Quantitative Information. Graphics Press, Cheshire, CT.
Valsecchi, P., Claramunt, C., Peytchev, E., 1999. OSIRIS: an inter-operable system for the integration of real time
tra�c data within GIS. Computers, Environment and Urban Systems 23 (2), 245±257.
Vasiliev, I., 1996. Design issues to be considered when mapping time. In: Wood, C., Keller, C.P. (Eds.), Cartographic
Design: Theoretical and Practical Perspectives. Wiley, New York, pp. 137±146.
Voisard, A. (1991). Towards a toolbox for geographical user interfaces. In: G�unther, O., Schek, H.-J. (Eds.), Advances
in Spatial Databases. Springer, Zurich, pp. 75±98.
184 C. Claramunt et al. / Transportation Research Part C 8 (2000) 167±184
Related Documents