A new fast technique for calculation of gas condensate well productivity by using pseudopressure method M. Bonyadi, M.R. Rahimpour * , F. Esmaeilzadeh Chemical Engineering Department, School of Chemical and Petroleum Engineering, Shiraz University, Shiraz 71345, Iran article info Article history: Received 18 February 2011 Accepted 28 July 2011 Available online xxx Keywords: Gas-condensate well Non-Darcy flow Permeability Producing gas-oil ratio Pseudopressure abstract This paper presents a new fast technique to obtain gas condensate well productivity without using simulator. The calculation uses a material balance model for reservoir depletion and Fevang and Whit- son’s two phase pseudopressure function for well inflow performance. The two phase pseudopressure technique cannot be applied independently for well performance evaluation since it requires the well production gas-oil ratio (GOR) as an input. Mott proposed a new method to generate a well’s production GOR by modeling the growth of the condensate banking (Region 1) without using a reservoir simulator. Also, Xiao and AL-Muraikhi described another way to generate well’s production GOR. In this work, an iterative method described to obtain the GOR for each reservoir pressure. High gas velocity impacts such as non-Darcy flow and high capillary number effects can be incorporated into the method. The proposed method has been tested by comparison with the results of fine-grid compositional simulation data in the literature and there is a reasonable agreement between the result of fine-grid simulation and the prediction from the proposed method. The new technique together with Mott’s and Xiao and AL-Muraikhi’s methods is used to obtain the productivity of a gas condensate well in a real field in Iran here referred to as SA4. Also, Genetic Algo- rithm is used for the optimization of history matching parameters from the toolbox MATLAB software. The results of the calculation show that, different methods of predicting GOR are adequate for quick estimation of gas condensate well productivity without using a simulator, but the new technique overlay is simpler and has a lesser error than the other methods. Ó 2011 Elsevier B.V. All rights reserved. 1. Introduction The prediction of well productivity in gas condensate reservoirs is a complex problem. However, accurate forecasts of productivity can be difficult because of the need to understand and account for the complex process that occurs in the near well region. Fine-grid compositional simulation can be used to get an accurate estimate of the well productivity. However, this method has the disadvan- tage of large run times. There have been several attempts using pseudopressure functions to estimate the well productivity. These methods are simple and have been shown to yield useful predic- tions. Kniazeff and Naville (1965); Eilerts et al. (1965) were the first to numerically model radial gas-condensate well deliverability. These studies show radial saturation and pressure profiles as functions of time and other operational variables, confirming that condensate blockage reduces well deliverability. Kniazeff and Naville also investigated the effect of non-Darcy flow in the gas phase on well deliverability. O’Dell and Miller (1967) presented the first gas rate equation using a pseudopressure function to describe the effect of condensate blockage. The equation is valid when the produced well stream is the original reservoir gas and when the blockage radius is relatively small. Fussell (1973) presented equa- tion of state (EOS) compositional simulation of radial gas- condensate wells producing by pressure depletion below the dew point. He showed that the O’DelleMiller equation, with a small correction to account for gas dissolved in the flowing oil phase, dramatically over predicts the deliverability loss from condensate blockage compared with simulation results. A fundamental understanding of gas condensate well deliverability was made by Fevang and Whitson (1995). They developed an accurate yet simple method using a two-phase pseudopressure and a three region model to calculate gas condensate well production performance. Fevang and Whitson showed that gas condensate well rate can be easily calculated using the instantaneous producing GOR (gener- ated from simulators), together with fluid PVT and gas-oil relative permeabilities. Mott (2003), proposed a novel and simpler * Corresponding author. E-mail address: [email protected] (M.R. Rahimpour). Contents lists available at SciVerse ScienceDirect Journal of Natural Gas Science and Engineering journal homepage: www.elsevier.com/locate/jngse 1875-5100/$ e see front matter Ó 2011 Elsevier B.V. All rights reserved. doi:10.1016/j.jngse.2011.07.012 Journal of Natural Gas Science and Engineering xxx (2011) 1e9 Please cite this article in press as: Bonyadi, M., et al., A new fast technique for calculation of gas condensate well productivity by using pseudopressure method, Journal of Natural Gas Science and Engineering (2011), doi:10.1016/j.jngse.2011.07.012

Welcome message from author
This document is posted to help you gain knowledge. Please leave a comment to let me know what you think about it! Share it to your friends and learn new things together.
Transcript
at SciVerse ScienceDirect
Journal of Natural Gas Science and Engineering xxx (2011) 1e9
Contents lists available
Journal of Natural Gas Science and Engineering
journal homepage: www.elsevier .com/locate/ jngse
A new fast technique for calculation of gas condensate well productivity by usingpseudopressure method
M. Bonyadi, M.R. Rahimpour*, F. EsmaeilzadehChemical Engineering Department, School of Chemical and Petroleum Engineering, Shiraz University, Shiraz 71345, Iran
a r t i c l e i n f o
Article history:Received 18 February 2011Accepted 28 July 2011Available online xxx
Keywords:Gas-condensate wellNon-Darcy flowPermeabilityProducing gas-oil ratioPseudopressure
* Corresponding author.E-mail address: [email protected] (M.R. Rahi
1875-5100/$ e see front matter � 2011 Elsevier B.V.doi:10.1016/j.jngse.2011.07.012
Please cite this article in press as: Bonyadpseudopressure method, Journal of Natural
a b s t r a c t
This paper presents a new fast technique to obtain gas condensate well productivity without usingsimulator. The calculation uses a material balance model for reservoir depletion and Fevang and Whit-son’s two phase pseudopressure function for well inflow performance. The two phase pseudopressuretechnique cannot be applied independently for well performance evaluation since it requires the wellproduction gas-oil ratio (GOR) as an input. Mott proposed a new method to generate a well’s productionGOR by modeling the growth of the condensate banking (Region 1) without using a reservoir simulator.Also, Xiao and AL-Muraikhi described another way to generate well’s production GOR. In this work, aniterative method described to obtain the GOR for each reservoir pressure. High gas velocity impacts suchas non-Darcy flow and high capillary number effects can be incorporated into the method. The proposedmethod has been tested by comparison with the results of fine-grid compositional simulation data in theliterature and there is a reasonable agreement between the result of fine-grid simulation and theprediction from the proposed method.
The new technique together with Mott’s and Xiao and AL-Muraikhi’s methods is used to obtain theproductivity of a gas condensate well in a real field in Iran here referred to as SA4. Also, Genetic Algo-rithm is used for the optimization of history matching parameters from the toolbox MATLAB software.The results of the calculation show that, different methods of predicting GOR are adequate for quickestimation of gas condensate well productivity without using a simulator, but the new technique overlayis simpler and has a lesser error than the other methods.
� 2011 Elsevier B.V. All rights reserved.
1. Introduction
The prediction of well productivity in gas condensate reservoirsis a complex problem. However, accurate forecasts of productivitycan be difficult because of the need to understand and account forthe complex process that occurs in the near well region. Fine-gridcompositional simulation can be used to get an accurate estimateof the well productivity. However, this method has the disadvan-tage of large run times. There have been several attempts usingpseudopressure functions to estimate the well productivity. Thesemethods are simple and have been shown to yield useful predic-tions. Kniazeff and Naville (1965); Eilerts et al. (1965) were the firstto numerically model radial gas-condensate well deliverability.These studies show radial saturation and pressure profiles asfunctions of time and other operational variables, confirming thatcondensate blockage reduces well deliverability. Kniazeff and
mpour).
All rights reserved.
i, M., et al., A new fast techGas Science and Engineering
Naville also investigated the effect of non-Darcy flow in the gasphase on well deliverability. O’Dell and Miller (1967) presented thefirst gas rate equation using a pseudopressure function to describethe effect of condensate blockage. The equation is valid when theproduced well stream is the original reservoir gas and when theblockage radius is relatively small. Fussell (1973) presented equa-tion of state (EOS) compositional simulation of radial gas-condensate wells producing by pressure depletion below the dewpoint. He showed that the O’DelleMiller equation, with a smallcorrection to account for gas dissolved in the flowing oil phase,dramatically over predicts the deliverability loss from condensateblockage compared with simulation results. A fundamentalunderstanding of gas condensate well deliverability was made byFevang andWhitson (1995). They developed an accurate yet simplemethod using a two-phase pseudopressure and a three regionmodel to calculate gas condensate well production performance.Fevang and Whitson showed that gas condensate well rate can beeasily calculated using the instantaneous producing GOR (gener-ated from simulators), together with fluid PVT and gas-oil relativepermeabilities. Mott (2003), proposed a novel and simpler
nique for calculation of gas condensate well productivity by using(2011), doi:10.1016/j.jngse.2011.07.012
M. Bonyadi et al. / Journal of Natural Gas Science and Engineering xxx (2011) 1e92
technique to calculate gas condensatewell production performanceusing a material balance model for reservoir depletion and Fevangand Whitson pseudopressure for well inflow performance. Moreimportantly, Mott’s method generated a well’s producing GOR bymodeling the growth of the condensate banking without a reser-voir simulator. Xiao and Al-Muraikhi (2004) proposed a method togenerate a well’s producing GOR by capturing the two maincontributing factors to condensate banking and productivity loss:liquid condensation and accumulation. In this work, a techniquehasbeen developed to obtain the gas condensate well productivity.
2. Two phase pseudopressure
Fevang and Whitson (1995) proposed a two phase pseudo-pressure method to model the deliverability of gas condensatewells. The gas production rate was calculated as
qg ¼ cZpR
pwf
Kro
BomoRs þ Krg
Bgmg
!dp (1)
Where
C ¼ 2pa1kh
ln�rerw
�þ S� 0:75
(2)
a1 ¼1/(2 p141.2) for field units, and a1 ¼1 for pure SI units. Theconstant C includes basic reservoir properties such as permeabilityk, thickness h, drainage radius, re; well bore radius, rw; and otherconstants. Skin, s, is a composite factor including nonideal floweffects such as damage, stimulation, drainage geometry, and partialpenetration. The producing gas/oil ratio (GOR), black oil PVTproperties and gas/oil relative permeabilities are needed to calcu-late pseudopressure integral and gas production rates. To evaluatethe pseudopressure integral, the area around the well is dividedinto three regions:
� Region 1: near the well region with pressure limits from Pwf toP*. P* is the outer boundary pressure of this region in whichboth gas and condensate phases flow. This region can accu-rately be modeled as steady state flow, meaning that whatcomes into Region 1 through its outer boundary, will flow atand be produced at the surface with no net accumulation offluids. Knowing the outer boundary pressure of this region, P*,is critical to calculation. Given the producing GOR, RP, solutioncondensate- gas ratio, rs, can be calculated as 1/RP and P* can belocated from the PVT table. If the GOR is known, the ratio krg/kroin Region 1 can be calculated as a function of pressure from thefollowing equation
Krg
KroðpÞ ¼
�RP � RS1� rsRP
�mgBgdmoBo
(3)
If the ratio krg/kro is known, the values of krg and kro can be calcu-lated from the relative permeability curves, and the pseudo-pressure integral can be evaluated.
� Region 2: A region of condensate buildup inwhich both gas andcondensate are present, but only the gas phase is flowing. Thepressure limits for this region are from P* to Pdew, with Pdewbeing the initial reservoir dew point. Since liquid condensate is
Please cite this article in press as: Bonyadi, M., et al., A new fast techpseudopressure method, Journal of Natural Gas Science and Engineering
immobile, kro ¼ 0. The gas phase relative permeability, krg, iscalculated as a function of oil saturation. The oil saturation inRegion 2, for the pressure range [P*, Pdew], is estimated asa function of pressure from CVD relative oil volume correctedfor initial water saturation:
SoðpÞ ¼ ½VroCVDðpÞð1� SiW Þ� (4)
� Region 3: The region far from the well in which only the gasphase is present. The pressure limits for this region are fromPdew to PR, where PR is the reservoir pressure. In Region 3, the gasphase relative permeability is constant and is equal to krg(siw).
Fevang and Whitson break the pseudopressure integral intothree parts, corresponding to the three flow regions discussed.
Total DPP ¼ZpR
pwf
Kro
BomoRs þ Krg
Bgdmg
!dp ¼
Region 1Zp*
pwf
Kro
BomoRS þ
Krg
Bgdmg
!dpþ
Region 2Zpd
p*
Krg
Bgdmgdpþ
Region 3 KrgðSiwÞZpR
pd
1Bgdmg
dp ð5Þ
At a given depletion stage PR, specifying the flowing bottom-hole pressure Pwf, if the P* or GOR is known, the gas productionrate can be calculated. The pseudopressure proposed by Fevang andWhitson cannot be used without running reservoir simulatorsbecause it requires thewell producing GOR as an input. Mott (2003)proposed a new technique to calculate well performance of gascondensate wells, using a material balance model for reservoirdepletion and a two-phase pseudopressure integral for well inflowperformance. In this technique, producing GOR can be generated bymodeling the growth of Region 1 without a reservoir simulator.Xiao and Al-Muraikhi (2004) also proposed a method to estimatethe growth of Region 1. This methodmodels condensate banking byconsidering the combinational effects of condensate dropout (PVTeffect) and condensate accumulation (relative permeabilitybehavior).
3. New calculation method
In this work, a new technique was proposed to estimate P*, RPand the production performance of a gas condensate well. Byanalogy to the Fevang andWhitson method, the oil production ratecan be obtained by this equation:
qo ¼ cZpR
pwf
Kro
moBoþ rs
Krg
mgBg
!dp (6)
Where C is defined by Eq. (2).In Eq. (6) a pseudopressure integral is defined based on the oil
phase. To evaluate it, the area around the well is divided into threeregions as proposed by Fevang and Whitson. Fevang and Whitson
nique for calculation of gas condensate well productivity by using(2011), doi:10.1016/j.jngse.2011.07.012
0 5 10 15 20 255
10
15
20
25
30
Time, Years
qg, M
MSC
F/da
y
qg, Fine-grid simulationqg,New MethodGOR,Fine-grid simulationGOR,New Method
5
10
15
20
25
30
GO
R, M
SCF/
STB
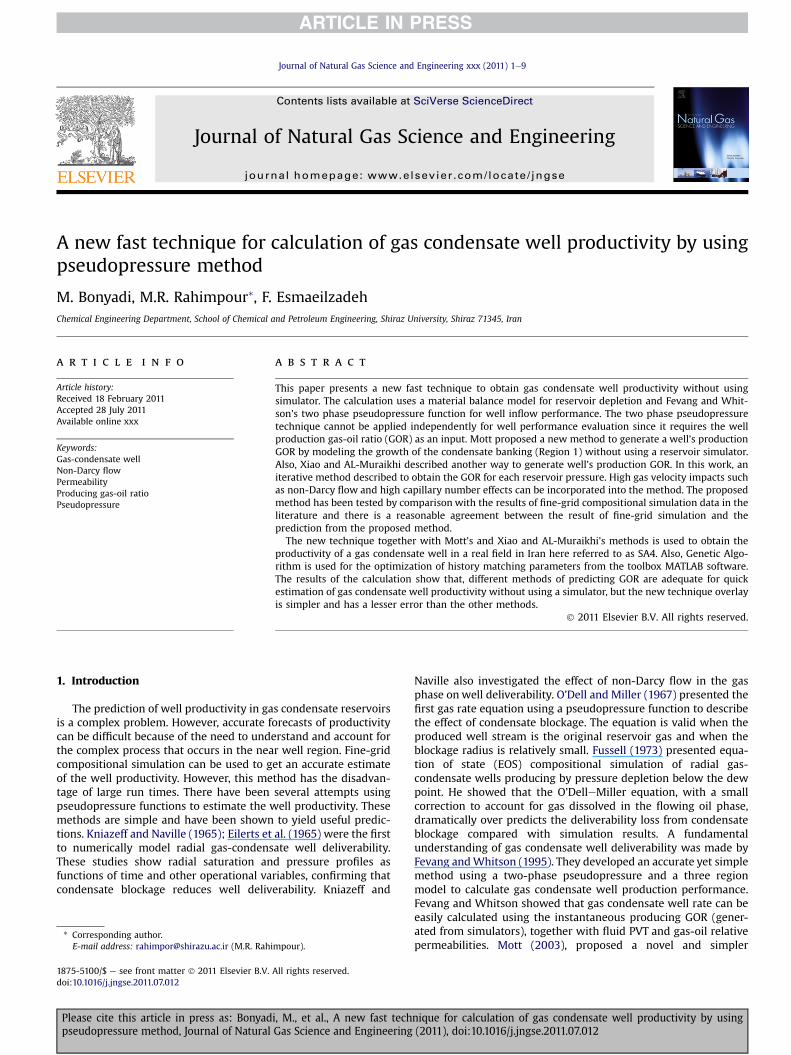
Fig. 1. Comparison of the results of new method with the results of fine-grid simu-lation for a rich gas condensate well.
12
14
16
18
20
22
24
26
0 1000 2000 3000 4000 5000 6000Pressure, psia
rs, S
TB /
MM
SCF
0
200
400
600
800
1000
1200
Rs,
MM
SCF
/ STB
rs,STB/MMSCFRs,SCF/STB
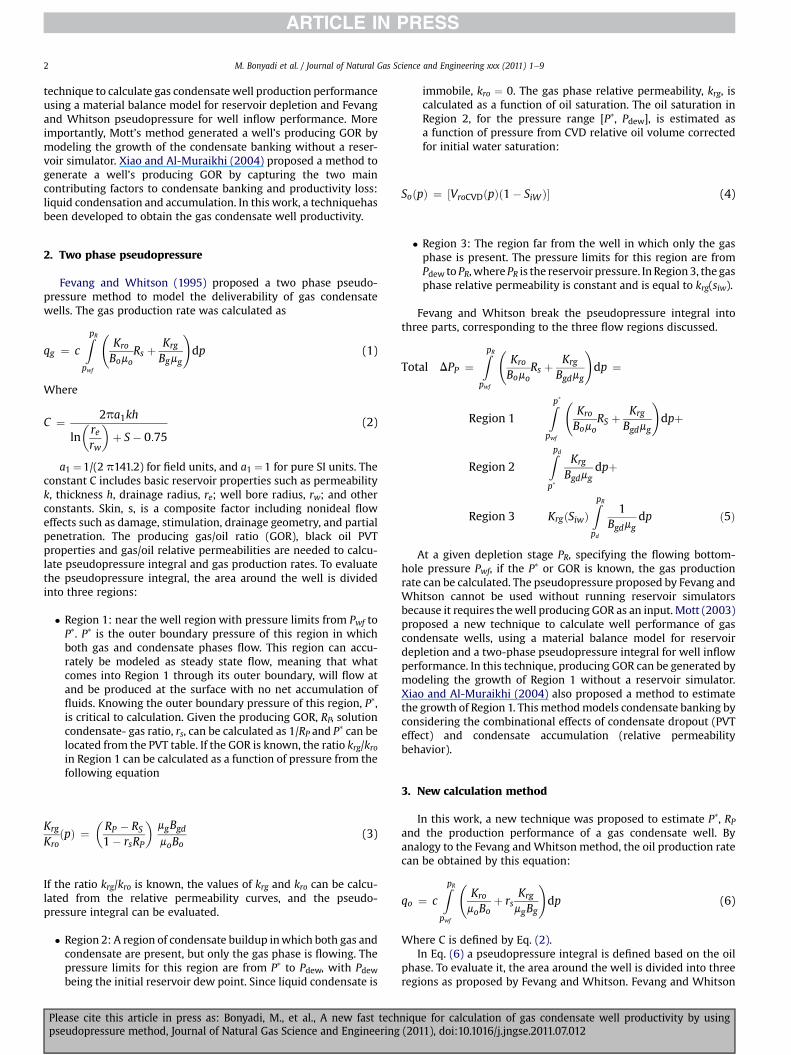
Fig. 3. Solution gas-oil ratio and oil-gas ratio versus pressure.
M. Bonyadi et al. / Journal of Natural Gas Science and Engineering xxx (2011) 1e9 3
break the pseudopressure integral into three parts, correspondingto the three flow regions discussed previously.
Total DPP ¼ZpR
pwf
Kro
moBors þ Krg
mgBgd
!dp ¼
Region 1Zp*
pwf
Kro
moBorS þ
Krg
mgBgd
!dpþ
Region 2Zpd
p*
rsKrg
Bgdmgdpþ
Region 3 KrgðSiwÞZpR
pd
rs1
Bgdmgdp ð7Þ
By knowing the value of producing GOR, the gas and oil flowrates can be obtained by Eqs. (1) and (5). Otherwise, if the gas andoil flow rates were known the GOR can be obtained by thefollowing equation:
0 5 10 15 205
10
15
20
25
30
35
40
45
Time, Years
qg, M
MSC
F/da
y
qg, Fine-grid simulationqg,New MethodGOR,Fine-grid simulationGOR,New Method
5
10
15
20
25
30
35
40
45
GO
R, M
SCF/
STB
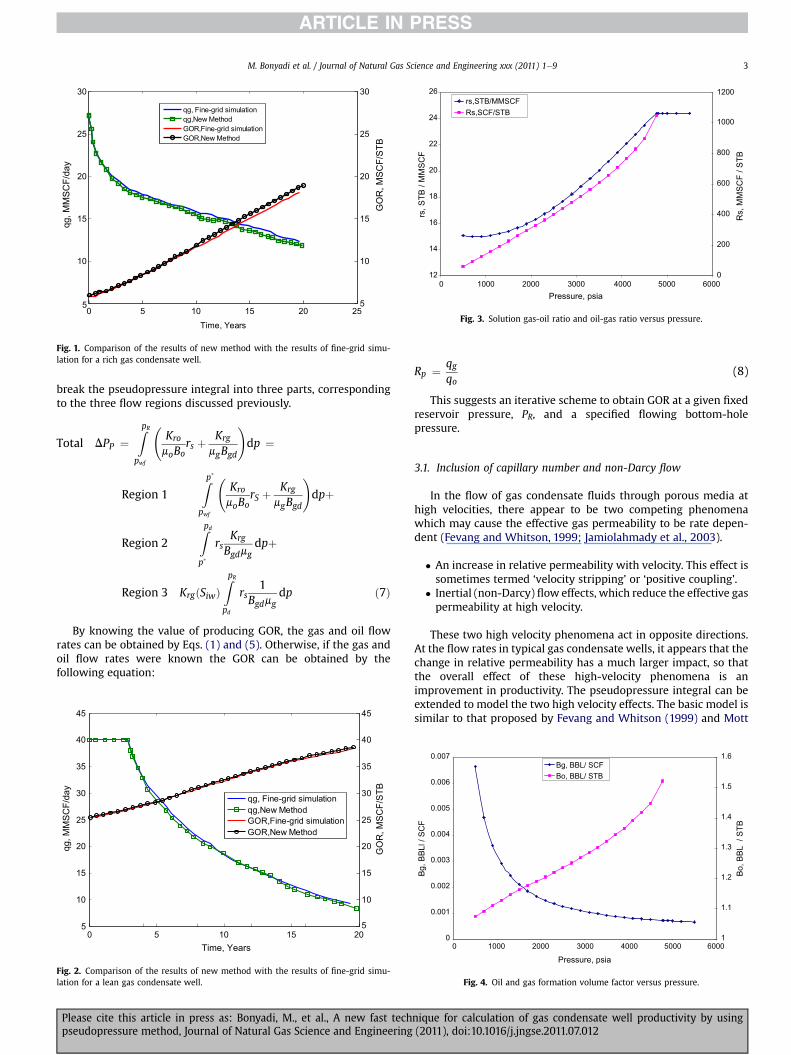
Fig. 2. Comparison of the results of new method with the results of fine-grid simu-lation for a lean gas condensate well.
Please cite this article in press as: Bonyadi, M., et al., A new fast techpseudopressure method, Journal of Natural Gas Science and Engineering
Rp ¼ qgqo
(8)
This suggests an iterative scheme to obtain GOR at a given fixedreservoir pressure, PR, and a specified flowing bottom-holepressure.
3.1. Inclusion of capillary number and non-Darcy flow
In the flow of gas condensate fluids through porous media athigh velocities, there appear to be two competing phenomenawhich may cause the effective gas permeability to be rate depen-dent (Fevang and Whitson, 1999; Jamiolahmady et al., 2003).
� An increase in relative permeability with velocity. This effect issometimes termed ‘velocity stripping’ or ‘positive coupling’.
� Inertial (non-Darcy) flow effects, which reduce the effective gaspermeability at high velocity.
These two high velocity phenomena act in opposite directions.At the flow rates in typical gas condensate wells, it appears that thechange in relative permeability has a much larger impact, so thatthe overall effect of these high-velocity phenomena is animprovement in productivity. The pseudopressure integral can beextended to model the two high velocity effects. The basic model issimilar to that proposed by Fevang and Whitson (1999) and Mott
0
0.001
0.002
0.003
0.004
0.005
0.006
0.007
0 1000 2000 3000 4000 5000 6000
Pressure, psia
Bg, B
BLl /
SC
F
1
1.1
1.2
1.3
1.4
1.5
1.6
Bo, B
BL /
STB
Bg, BBL/ SCFBo, BBL/ STB
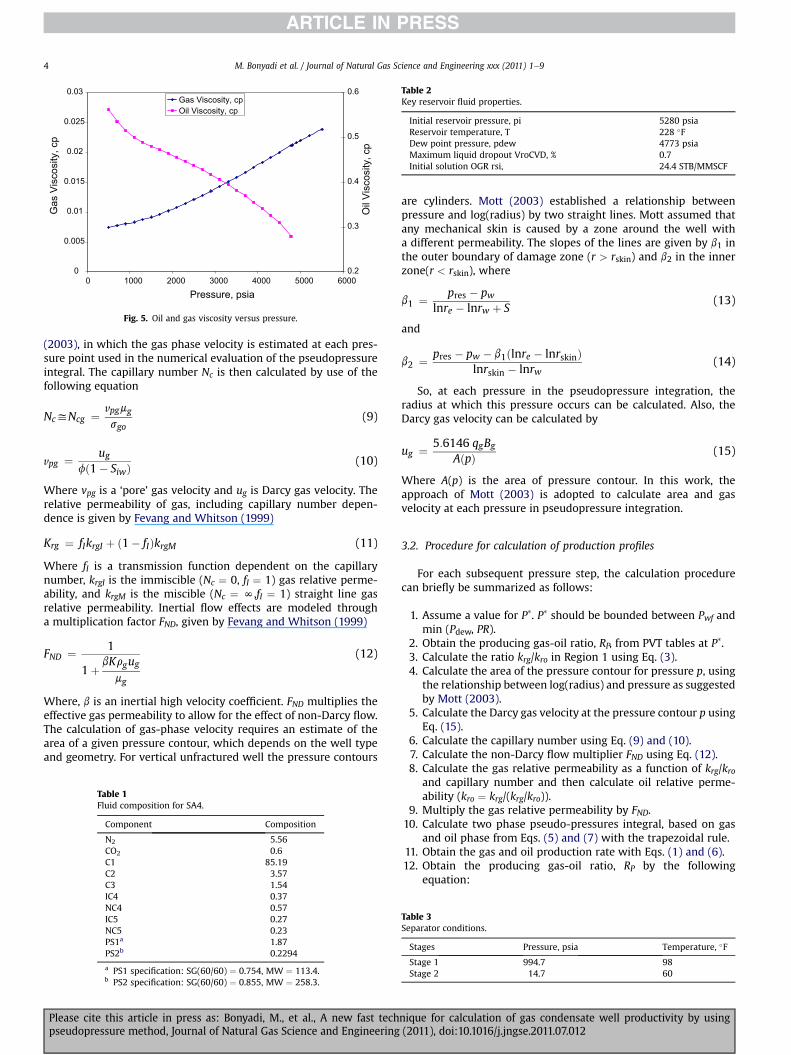
Fig. 4. Oil and gas formation volume factor versus pressure.
nique for calculation of gas condensate well productivity by using(2011), doi:10.1016/j.jngse.2011.07.012
0
0.005
0.01
0.015
0.02
0.025
0.03
0 1000 2000 3000 4000 5000 6000
Pressure, psia
Gas
Vis
cosi
ty, c
p
0.2
0.3
0.4
0.5
0.6
Oil
Visc
osity
, cp
Gas Viscosity, cpOil Viscosity, cp
Fig. 5. Oil and gas viscosity versus pressure.
Table 2Key reservoir fluid properties.
Initial reservoir pressure, pi 5280 psiaReservoir temperature, T 228 �FDew point pressure, pdew 4773 psiaMaximum liquid dropout VroCVD, % 0.7Initial solution OGR rsi, 24.4 STB/MMSCF
M. Bonyadi et al. / Journal of Natural Gas Science and Engineering xxx (2011) 1e94
(2003), in which the gas phase velocity is estimated at each pres-sure point used in the numerical evaluation of the pseudopressureintegral. The capillary number Nc is then calculated by use of thefollowing equation
NcyNcg ¼ vpgmgsgo
(9)
vpg ¼ ugfð1� SiwÞ
(10)
Where vpg is a ‘pore’ gas velocity and ug is Darcy gas velocity. Therelative permeability of gas, including capillary number depen-dence is given by Fevang and Whitson (1999)
Krg ¼ fIkrgI þ ð1� fIÞkrgM (11)
Where fI is a transmission function dependent on the capillarynumber, krgI is the immiscible (Nc ¼ 0, fI ¼ 1) gas relative perme-ability, and krgM is the miscible (Nc ¼ N,fI ¼ 1) straight line gasrelative permeability. Inertial flow effects are modeled througha multiplication factor FND, given by Fevang and Whitson (1999)
FND ¼ 1
1þ bKrgugmg
(12)
Where, b is an inertial high velocity coefficient. FND multiplies theeffective gas permeability to allow for the effect of non-Darcy flow.The calculation of gas-phase velocity requires an estimate of thearea of a given pressure contour, which depends on the well typeand geometry. For vertical unfractured well the pressure contours
Table 1Fluid composition for SA4.
Component Composition
N2 5.56CO2 0.6C1 85.19C2 3.57C3 1.54IC4 0.37NC4 0.57IC5 0.27NC5 0.23PS1a 1.87PS2b 0.2294
a PS1 specification: SG(60/60) ¼ 0.754, MW ¼ 113.4.b PS2 specification: SG(60/60) ¼ 0.855, MW ¼ 258.3.
Please cite this article in press as: Bonyadi, M., et al., A new fast techpseudopressure method, Journal of Natural Gas Science and Engineering
are cylinders. Mott (2003) established a relationship betweenpressure and log(radius) by two straight lines. Mott assumed thatany mechanical skin is caused by a zone around the well witha different permeability. The slopes of the lines are given by b1 inthe outer boundary of damage zone (r > rskin) and b2 in the innerzone(r < rskin), where
b1 ¼ pres � pwlnre � lnrw þ S
(13)
and
b2 ¼ pres � pw � b1ðlnre � lnrskinÞlnrskin � lnrw
(14)
So, at each pressure in the pseudopressure integration, theradius at which this pressure occurs can be calculated. Also, theDarcy gas velocity can be calculated by
ug ¼ 5:6146 qgBgAðpÞ (15)
Where A(p) is the area of pressure contour. In this work, theapproach of Mott (2003) is adopted to calculate area and gasvelocity at each pressure in pseudopressure integration.
3.2. Procedure for calculation of production profiles
For each subsequent pressure step, the calculation procedurecan briefly be summarized as follows:
1. Assume a value for P*. P* should be bounded between Pwf andmin (Pdew, PR).
2. Obtain the producing gas-oil ratio, RP, from PVT tables at P*.3. Calculate the ratio krg/kro in Region 1 using Eq. (3).4. Calculate the area of the pressure contour for pressure p, using
the relationship between log(radius) and pressure as suggestedby Mott (2003).
5. Calculate the Darcy gas velocity at the pressure contour p usingEq. (15).
6. Calculate the capillary number using Eq. (9) and (10).7. Calculate the non-Darcy flow multiplier FND using Eq. (12).8. Calculate the gas relative permeability as a function of krg/kro
and capillary number and then calculate oil relative perme-ability (kro ¼ krg/(krg/kro)).
9. Multiply the gas relative permeability by FND.10. Calculate two phase pseudo-pressures integral, based on gas
and oil phase from Eqs. (5) and (7) with the trapezoidal rule.11. Obtain the gas and oil production rate with Eqs. (1) and (6).12. Obtain the producing gas-oil ratio, RP by the following
equation:
Table 3Separator conditions.
Stages Pressure, psia Temperature, �F
Stage 1 994.7 98Stage 2 14.7 60
nique for calculation of gas condensate well productivity by using(2011), doi:10.1016/j.jngse.2011.07.012
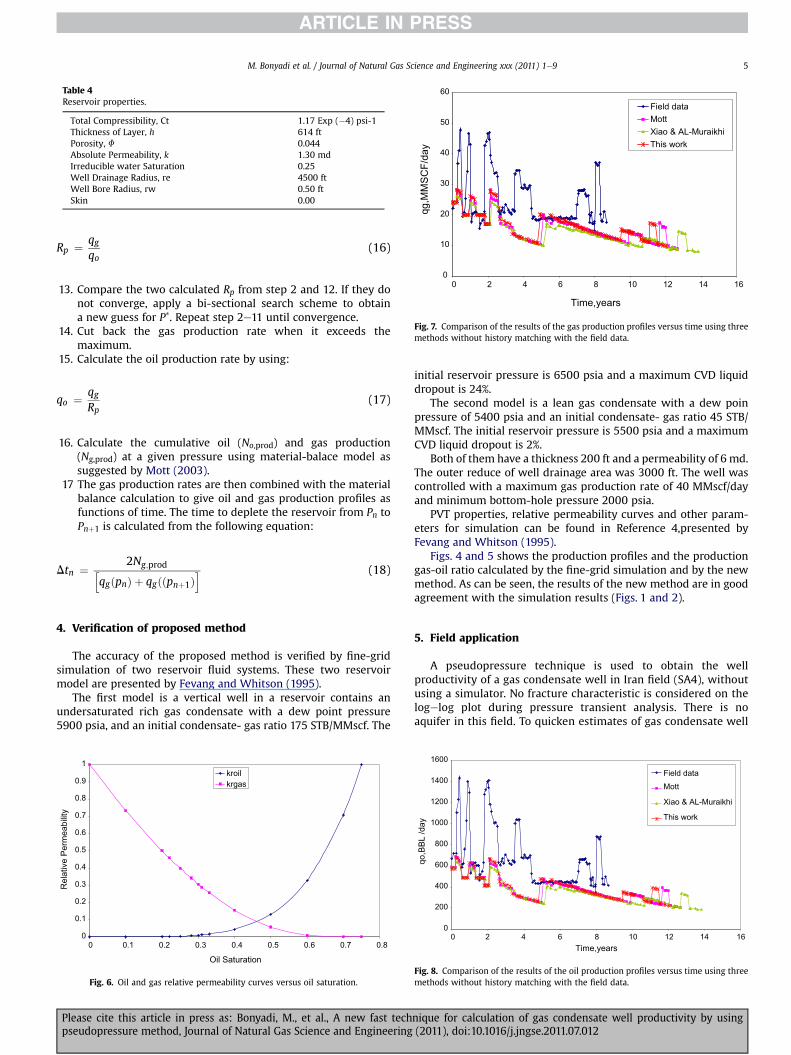
Table 4Reservoir properties.
Total Compressibility, Ct 1.17 Exp (�4) psi-1Thickness of Layer, h 614 ftPorosity, F 0.044Absolute Permeability, k 1.30 mdIrreducible water Saturation 0.25Well Drainage Radius, re 4500 ftWell Bore Radius, rw 0.50 ftSkin 0.00
10
20
30
40
50
60
qg,M
MSC
F/da
y
Field dataMottXiao & AL-MuraikhiThis work
M. Bonyadi et al. / Journal of Natural Gas Science and Engineering xxx (2011) 1e9 5
Rp ¼ qgqo
(16)
00 2 4 6 8 10 12 14 16
Time,years
Fig. 7. Comparison of the results of the gas production profiles versus time using threemethods without history matching with the field data.
13. Compare the two calculated Rp from step 2 and 12. If they donot converge, apply a bi-sectional search scheme to obtaina new guess for P*. Repeat step 2e11 until convergence.
14. Cut back the gas production rate when it exceeds themaximum.
15. Calculate the oil production rate by using:
qo ¼ qgRp
(17)
16. Calculate the cumulative oil (No,prod) and gas production(Ng,prod) at a given pressure using material-balace model assuggested by Mott (2003).
17 The gas production rates are then combined with the materialbalance calculation to give oil and gas production profiles asfunctions of time. The time to deplete the reservoir from Pn toPnþ1 is calculated from the following equation:
Dtn ¼ 2Ng;prodh i (18)
qgðpnÞ þ qgððpnþ1Þ4. Verification of proposed method
The accuracy of the proposed method is verified by fine-gridsimulation of two reservoir fluid systems. These two reservoirmodel are presented by Fevang and Whitson (1995).
The first model is a vertical well in a reservoir contains anundersaturated rich gas condensate with a dew point pressure5900 psia, and an initial condensate- gas ratio 175 STB/MMscf. The
0
0.1
0.2
0.3
0.4
0.5
0.6
0.7
0.8
0.9
1
0 0.1 0.2 0.3 0.4 0.5 0.6 0.7 0.8
Oil Saturation
Rel
ativ
e Pe
rmea
bilit
y
kroilkrgas
Fig. 6. Oil and gas relative permeability curves versus oil saturation.
Please cite this article in press as: Bonyadi, M., et al., A new fast techpseudopressure method, Journal of Natural Gas Science and Engineering
initial reservoir pressure is 6500 psia and a maximum CVD liquiddropout is 24%.
The second model is a lean gas condensate with a dew poinpressure of 5400 psia and an initial condensate- gas ratio 45 STB/MMscf. The initial reservoir pressure is 5500 psia and a maximumCVD liquid dropout is 2%.
Both of them have a thickness 200 ft and a permeability of 6 md.The outer reduce of well drainage area was 3000 ft. The well wascontrolled with a maximum gas production rate of 40 MMscf/dayand minimum bottom-hole pressure 2000 psia.
PVT properties, relative permeability curves and other param-eters for simulation can be found in Reference 4,presented byFevang and Whitson (1995).
Figs. 4 and 5 shows the production profiles and the productiongas-oil ratio calculated by the fine-grid simulation and by the newmethod. As can be seen, the results of the new method are in goodagreement with the simulation results (Figs. 1 and 2).
5. Field application
A pseudopressure technique is used to obtain the wellproductivity of a gas condensate well in Iran field (SA4), withoutusing a simulator. No fracture characteristic is considered on thelogelog plot during pressure transient analysis. There is noaquifer in this field. To quicken estimates of gas condensate well
0
200
400
600
800
1000
1200
1400
1600
0 2 4 6 8 10 12 14 16Time,years
qo,B
BL /d
ay
Field dataMott
Xiao & AL-Muraikhi
This work
Fig. 8. Comparison of the results of the oil production profiles versus time using threemethods without history matching with the field data.
nique for calculation of gas condensate well productivity by using(2011), doi:10.1016/j.jngse.2011.07.012
0
10
20
30
40
50
60
0 1 2 3 4 5 6 7 8 9 10
Time,years
qg, M
MSC
F/da
y
Field dataMottXiao & AL-MuraikhiThis work
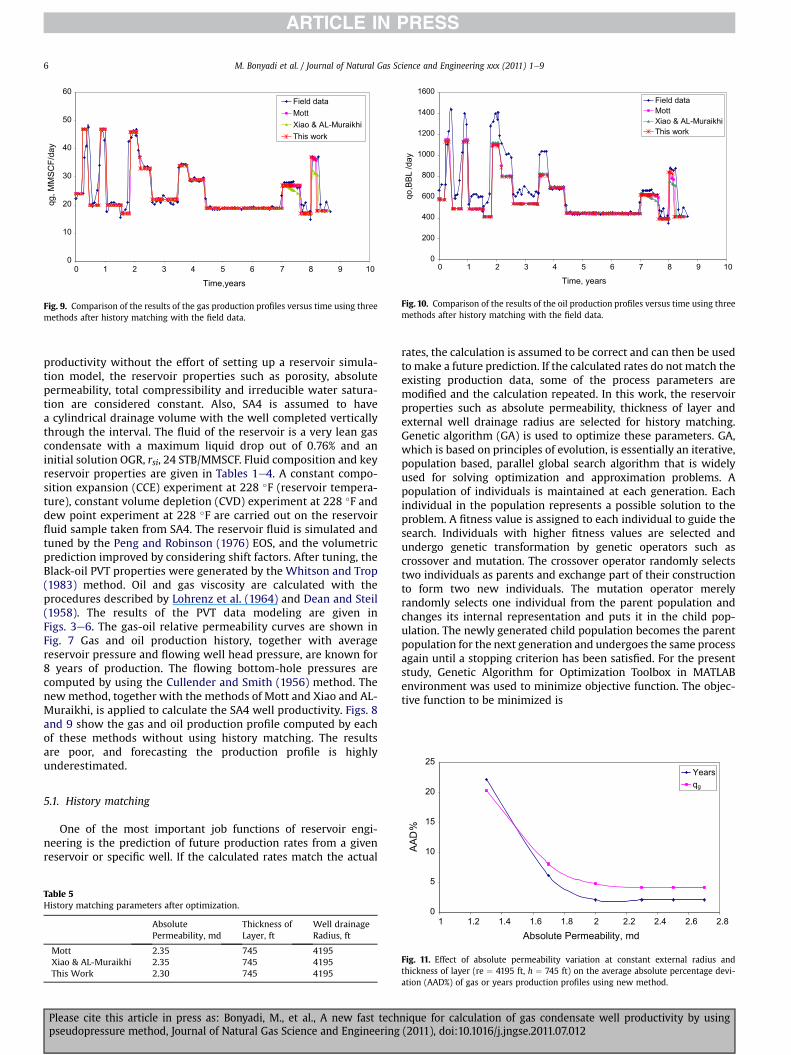
Fig. 9. Comparison of the results of the gas production profiles versus time using threemethods after history matching with the field data.
0
200
400
600
800
1000
1200
1400
1600
0 1 2 3 4 5 6 7 8 9 10
Time, years
qo,B
BL /d
ay
Field dataMottXiao & AL-MuraikhiThis work
Fig. 10. Comparison of the results of the oil production profiles versus time using threemethods after history matching with the field data.
25Years
M. Bonyadi et al. / Journal of Natural Gas Science and Engineering xxx (2011) 1e96
productivity without the effort of setting up a reservoir simula-tion model, the reservoir properties such as porosity, absolutepermeability, total compressibility and irreducible water satura-tion are considered constant. Also, SA4 is assumed to havea cylindrical drainage volume with the well completed verticallythrough the interval. The fluid of the reservoir is a very lean gascondensate with a maximum liquid drop out of 0.76% and aninitial solution OGR, rsi, 24 STB/MMSCF. Fluid composition and keyreservoir properties are given in Tables 1e4. A constant compo-sition expansion (CCE) experiment at 228 �F (reservoir tempera-ture), constant volume depletion (CVD) experiment at 228 �F anddew point experiment at 228 �F are carried out on the reservoirfluid sample taken from SA4. The reservoir fluid is simulated andtuned by the Peng and Robinson (1976) EOS, and the volumetricprediction improved by considering shift factors. After tuning, theBlack-oil PVT properties were generated by the Whitson and Trop(1983) method. Oil and gas viscosity are calculated with theprocedures described by Lohrenz et al. (1964) and Dean and Steil(1958). The results of the PVT data modeling are given inFigs. 3e6. The gas-oil relative permeability curves are shown inFig. 7 Gas and oil production history, together with averagereservoir pressure and flowing well head pressure, are known for8 years of production. The flowing bottom-hole pressures arecomputed by using the Cullender and Smith (1956) method. Thenew method, together with the methods of Mott and Xiao and AL-Muraikhi, is applied to calculate the SA4 well productivity. Figs. 8and 9 show the gas and oil production profile computed by eachof these methods without using history matching. The resultsare poor, and forecasting the production profile is highlyunderestimated.
10
15
20
AAD
%
qg
5.1. History matching
One of the most important job functions of reservoir engi-neering is the prediction of future production rates from a givenreservoir or specific well. If the calculated rates match the actual
Table 5History matching parameters after optimization.
AbsolutePermeability, md
Thickness ofLayer, ft
Well drainageRadius, ft
Mott 2.35 745 4195Xiao & AL-Muraikhi 2.35 745 4195This Work 2.30 745 4195
Please cite this article in press as: Bonyadi, M., et al., A new fast techpseudopressure method, Journal of Natural Gas Science and Engineering
rates, the calculation is assumed to be correct and can then be usedto make a future prediction. If the calculated rates do not match theexisting production data, some of the process parameters aremodified and the calculation repeated. In this work, the reservoirproperties such as absolute permeability, thickness of layer andexternal well drainage radius are selected for history matching.Genetic algorithm (GA) is used to optimize these parameters. GA,which is based on principles of evolution, is essentially an iterative,population based, parallel global search algorithm that is widelyused for solving optimization and approximation problems. Apopulation of individuals is maintained at each generation. Eachindividual in the population represents a possible solution to theproblem. A fitness value is assigned to each individual to guide thesearch. Individuals with higher fitness values are selected andundergo genetic transformation by genetic operators such ascrossover and mutation. The crossover operator randomly selectstwo individuals as parents and exchange part of their constructionto form two new individuals. The mutation operator merelyrandomly selects one individual from the parent population andchanges its internal representation and puts it in the child pop-ulation. The newly generated child population becomes the parentpopulation for the next generation and undergoes the same processagain until a stopping criterion has been satisfied. For the presentstudy, Genetic Algorithm for Optimization Toolbox in MATLABenvironment was used to minimize objective function. The objec-tive function to be minimized is
0
5
1 1.2 1.4 1.6 1.8 2 2.2 2.4 2.6 2.8Absolute Permeability, md
Fig. 11. Effect of absolute permeability variation at constant external radius andthickness of layer (re ¼ 4195 ft, h ¼ 745 ft) on the average absolute percentage devi-ation (AAD%) of gas or years production profiles using new method.
nique for calculation of gas condensate well productivity by using(2011), doi:10.1016/j.jngse.2011.07.012
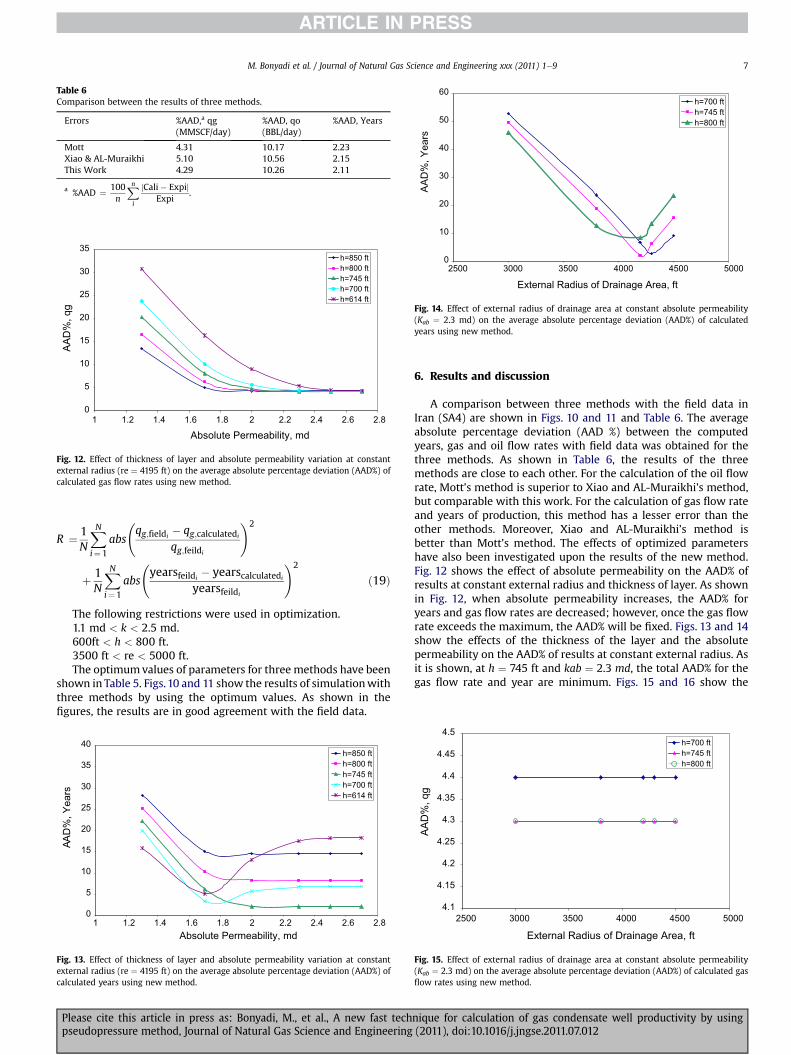
Table 6Comparison between the results of three methods.
Errors %AAD,a qg(MMSCF/day)
%AAD, qo(BBL/day)
%AAD, Years
Mott 4.31 10.17 2.23Xiao & AL-Muraikhi 5.10 10.56 2.15This Work 4.29 10.26 2.11
a %AAD ¼ 100n
Xni
jCali� ExpijExpi
.
0
5
10
15
20
25
30
35
1 1.2 1.4 1.6 1.8 2 2.2 2.4 2.6 2.8
Absolute Permeability, md
AAD
%, q
g
h=850 fth=800 fth=745 fth=700 fth=614 ft
Fig. 12. Effect of thickness of layer and absolute permeability variation at constantexternal radius (re ¼ 4195 ft) on the average absolute percentage deviation (AAD%) ofcalculated gas flow rates using new method.
0
10
20
30
40
50
60
500045004000350030002500
External Radius of Drainage Area, ft
AAD
%, Y
ears
h=700 fth=745 fth=800 ft
Fig. 14. Effect of external radius of drainage area at constant absolute permeability(Kab ¼ 2.3 md) on the average absolute percentage deviation (AAD%) of calculatedyears using new method.
M. Bonyadi et al. / Journal of Natural Gas Science and Engineering xxx (2011) 1e9 7
R ¼ 1N
XNi¼1
abs
qg;fieldi
� qg;calculatedi
qg;feildi
!2
þ 1N
XNi¼1
abs
yearsfeildi
� yearscalculatedi
yearsfeildi
!2
ð19Þ
The following restrictions were used in optimization.1.1 md < k < 2.5 md.600ft < h < 800 ft.3500 ft < re < 5000 ft.The optimumvalues of parameters for three methods have been
shown in Table 5. Figs.10 and 11 show the results of simulationwiththree methods by using the optimum values. As shown in thefigures, the results are in good agreement with the field data.
0
5
10
15
20
25
30
35
40
1 1.2 1.4 1.6 1.8 2 2.2 2.4 2.6 2.8Absolute Permeability, md
AAD
%, Y
ears
h=850 fth=800 fth=745 fth=700 fth=614 ft
Fig. 13. Effect of thickness of layer and absolute permeability variation at constantexternal radius (re ¼ 4195 ft) on the average absolute percentage deviation (AAD%) ofcalculated years using new method.
Please cite this article in press as: Bonyadi, M., et al., A new fast techpseudopressure method, Journal of Natural Gas Science and Engineering
6. Results and discussion
A comparison between three methods with the field data inIran (SA4) are shown in Figs. 10 and 11 and Table 6. The averageabsolute percentage deviation (AAD %) between the computedyears, gas and oil flow rates with field data was obtained for thethree methods. As shown in Table 6, the results of the threemethods are close to each other. For the calculation of the oil flowrate, Mott’s method is superior to Xiao and AL-Muraikhi’s method,but comparable with this work. For the calculation of gas flow rateand years of production, this method has a lesser error than theother methods. Moreover, Xiao and AL-Muraikhi’s method isbetter than Mott’s method. The effects of optimized parametershave also been investigated upon the results of the new method.Fig. 12 shows the effect of absolute permeability on the AAD% ofresults at constant external radius and thickness of layer. As shownin Fig. 12, when absolute permeability increases, the AAD% foryears and gas flow rates are decreased; however, once the gas flowrate exceeds the maximum, the AAD% will be fixed. Figs. 13 and 14show the effects of the thickness of the layer and the absolutepermeability on the AAD% of results at constant external radius. Asit is shown, at h ¼ 745 ft and kab ¼ 2.3 md, the total AAD% for thegas flow rate and year are minimum. Figs. 15 and 16 show the
4.1
4.15
4.2
4.25
4.3
4.35
4.4
4.45
4.5
500045004000350030002500
External Radius of Drainage Area, ft
AAD
%, q
g
h=700 fth=745 fth=800 ft
Fig. 15. Effect of external radius of drainage area at constant absolute permeability(Kab ¼ 2.3 md) on the average absolute percentage deviation (AAD%) of calculated gasflow rates using new method.
nique for calculation of gas condensate well productivity by using(2011), doi:10.1016/j.jngse.2011.07.012
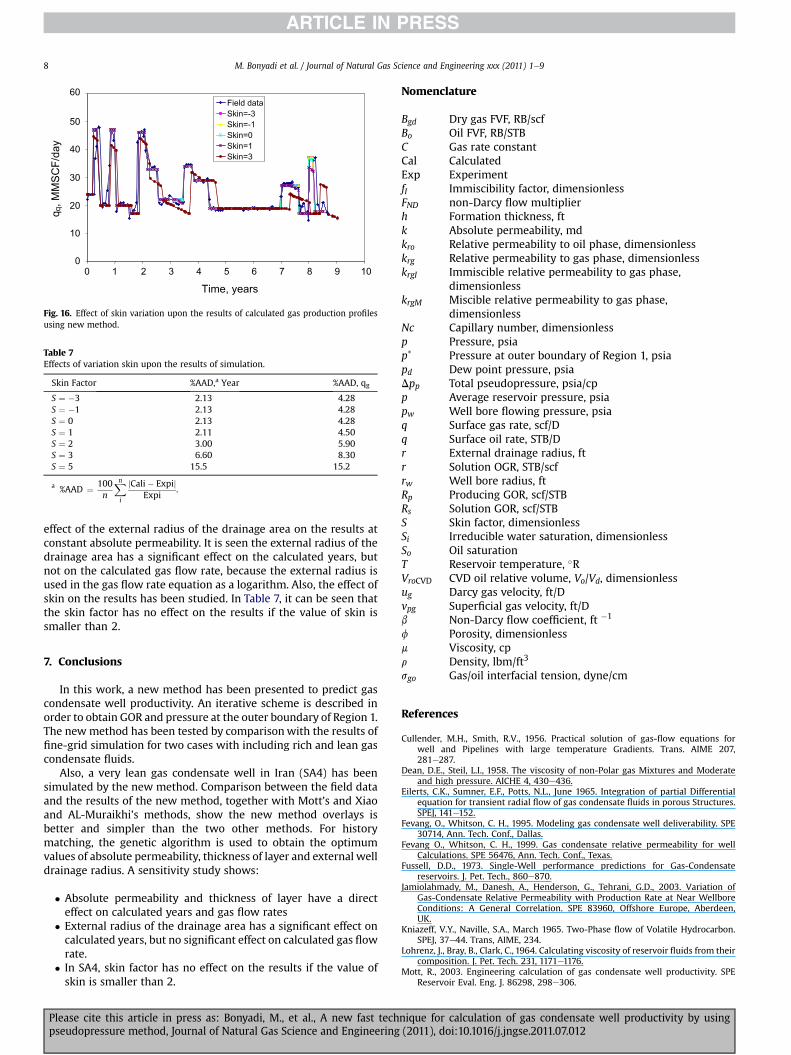
Table 7Effects of variation skin upon the results of simulation.
Skin Factor %AAD,a Year %AAD, qg
S ¼ �3 2.13 4.28S ¼ �1 2.13 4.28S ¼ 0 2.13 4.28S ¼ 1 2.11 4.50S ¼ 2 3.00 5.90S ¼ 3 6.60 8.30S ¼ 5 15.5 15.2
a %AAD ¼ 100n
Xni
jCali� ExpijExpi
.
0
10
20
30
40
50
60
0 1 2 3 4 5 6 7 8 9 10
Time, years
q q, M
MSC
F/da
y
Field dataSkin=-3Skin=-1Skin=0Skin=1Skin=3
Fig. 16. Effect of skin variation upon the results of calculated gas production profilesusing new method.
M. Bonyadi et al. / Journal of Natural Gas Science and Engineering xxx (2011) 1e98
effect of the external radius of the drainage area on the results atconstant absolute permeability. It is seen the external radius of thedrainage area has a significant effect on the calculated years, butnot on the calculated gas flow rate, because the external radius isused in the gas flow rate equation as a logarithm. Also, the effect ofskin on the results has been studied. In Table 7, it can be seen thatthe skin factor has no effect on the results if the value of skin issmaller than 2.
7. Conclusions
In this work, a new method has been presented to predict gascondensate well productivity. An iterative scheme is described inorder to obtain GOR and pressure at the outer boundary of Region 1.The newmethod has been tested by comparisonwith the results offine-grid simulation for two cases with including rich and lean gascondensate fluids.
Also, a very lean gas condensate well in Iran (SA4) has beensimulated by the new method. Comparison between the field dataand the results of the new method, together with Mott’s and Xiaoand AL-Muraikhi’s methods, show the new method overlays isbetter and simpler than the two other methods. For historymatching, the genetic algorithm is used to obtain the optimumvalues of absolute permeability, thickness of layer and external welldrainage radius. A sensitivity study shows:
� Absolute permeability and thickness of layer have a directeffect on calculated years and gas flow rates
� External radius of the drainage area has a significant effect oncalculated years, but no significant effect on calculated gas flowrate.
� In SA4, skin factor has no effect on the results if the value ofskin is smaller than 2.
Please cite this article in press as: Bonyadi, M., et al., A new fast techpseudopressure method, Journal of Natural Gas Science and Engineering
Nomenclature
Bgd Dry gas FVF, RB/scfBo Oil FVF, RB/STBC Gas rate constantCal CalculatedExp ExperimentfI Immiscibility factor, dimensionlessFND non-Darcy flow multiplierh Formation thickness, ftk Absolute permeability, mdkro Relative permeability to oil phase, dimensionlesskrg Relative permeability to gas phase, dimensionlesskrgI Immiscible relative permeability to gas phase,
dimensionlesskrgM Miscible relative permeability to gas phase,
dimensionlessNc Capillary number, dimensionlessp Pressure, psiap* Pressure at outer boundary of Region 1, psiapd Dew point pressure, psiaDpp Total pseudopressure, psia/cpp Average reservoir pressure, psiapw Well bore flowing pressure, psiaq Surface gas rate, scf/Dq Surface oil rate, STB/Dr External drainage radius, ftr Solution OGR, STB/scfrw Well bore radius, ftRp Producing GOR, scf/STBRs Solution GOR, scf/STBS Skin factor, dimensionlessSi Irreducible water saturation, dimensionlessSo Oil saturationT Reservoir temperature, �RVroCVD CVD oil relative volume, Vo/Vd, dimensionlessug Darcy gas velocity, ft/Dvpg Superficial gas velocity, ft/Db Non-Darcy flow coefficient, ft �1
f Porosity, dimensionlessm Viscosity, cpr Density, lbm/ft3
sgo Gas/oil interfacial tension, dyne/cm
References
Cullender, M.H., Smith, R.V., 1956. Practical solution of gas-flow equations forwell and Pipelines with large temperature Gradients. Trans. AIME 207,281e287.
Dean, D.E., Steil, L.I., 1958. The viscosity of non-Polar gas Mixtures and Moderateand high pressure. AICHE 4, 430e436.
Eilerts, C.K., Sumner, E.F., Potts, N.L., June 1965. Integration of partial Differentialequation for transient radial flow of gas condensate fluids in porous Structures.SPEJ, 141e152.
Fevang, O., Whitson, C. H., 1995. Modeling gas condensate well deliverability. SPE30714, Ann. Tech. Conf., Dallas.
Fevang O., Whitson, C. H., 1999. Gas condensate relative permeability for wellCalculations. SPE 56476, Ann. Tech. Conf., Texas.
Fussell, D.D., 1973. Single-Well performance predictions for Gas-Condensatereservoirs. J. Pet. Tech., 860e870.
Jamiolahmady, M., Danesh, A., Henderson, G., Tehrani, G.D., 2003. Variation ofGas-Condensate Relative Permeability with Production Rate at Near WellboreConditions: A General Correlation. SPE 83960, Offshore Europe, Aberdeen,UK.
Kniazeff, V.Y., Naville, S.A., March 1965. Two-Phase flow of Volatile Hydrocarbon.SPEJ, 37e44. Trans, AIME, 234.
Lohrenz, J., Bray, B., Clark, C., 1964. Calculating viscosity of reservoir fluids from theircomposition. J. Pet. Tech. 231, 1171e1176.
Mott, R., 2003. Engineering calculation of gas condensate well productivity. SPEReservoir Eval. Eng. J. 86298, 298e306.
nique for calculation of gas condensate well productivity by using(2011), doi:10.1016/j.jngse.2011.07.012

M. Bonyadi et al. / Journal of Natural Gas Science and Engineering xxx (2011) 1e9 9
O’Dell, H.G., Miller, R.N., 1967. Successfully Cycling a Low-permeability high-yieldgas condensate reservoir. J. Pet. Tech., 41e47.
Peng, D.Y., Robinson, D.B., 1976. A New two-constant equation of state. Ind. Eng.Chem. Fundam. 15, 59e64.
Please cite this article in press as: Bonyadi, M., et al., A new fast techpseudopressure method, Journal of Natural Gas Science and Engineering
Whitson, C.H., Trop, S.B., 1983. Evaluating constant volume depletion data. J. Pet.Tech., 610e620.
Xiao, J. J., Al-Muraikhi, A. J., 2004. A New Method for the Determination of GasCondensate Well Production Performance. SPE 90290, Ann. Tech. Conf., Texas.
nique for calculation of gas condensate well productivity by using(2011), doi:10.1016/j.jngse.2011.07.012
Related Documents