A New Era of School Reform: Going Where the Research Takes Us REL Contract #RJ96006101 Deliverable 2000-05 prepared by Robert J. Marzano Mid-continent Research for Education and Learning 2550 S. Parker Road, Suite 500 Aurora, CO 80014 303-337-0990 (phone) 303-337-3005 (fax)

Welcome message from author
This document is posted to help you gain knowledge. Please leave a comment to let me know what you think about it! Share it to your friends and learn new things together.
Transcript
A New Era of School Reform:Going Where the Research Takes Us
REL Contract #RJ96006101Deliverable 2000-05
prepared by
Robert J. Marzano
Mid-continent Research for Education and Learning2550 S. Parker Road, Suite 500
Aurora, CO 80014303-337-0990 (phone)
303-337-3005 (fax)
© 2000 McREL
To order copies of A New Era of School Reform: Going Where the Research Takes Us, contactMcREL:
Mid-continent Research for Education and Learning2550 S. Parker Road, Suite 500Aurora, Colorado 80014tel: 303-337-0990fax: 303-337-3005web site: mcrel.orge-mail: [email protected]
This work was produced in whole or in part with funds from the Office of Educational Research andImprovement (OERI), U.S. Department of Education, under Contract Number RJ96006101. Thecontent does not necessarily reflect the views of OERI or the Department of Education, nor doesmention of trade names, commercial products, or organizations imply endorsement by the federalgovernment.

i
TABLE OF CONTENTS
CHAPTER 1: A QUESTION OF SCHOOLING . . . . . . . . . . . . . . . . . . . . . . . . . . . . . . . . . . . . . 1
A Necessarily Technical Look . . . . . . . . . . . . . . . . . . . . . . . . . . . . . . . . . . . . . . . . . . . . . . 3Purpose and Direction of this Monograph . . . . . . . . . . . . . . . . . . . . . . . . . . . . . . . . . . . . . 8
PART I:GENERAL LITERATURE REVIEW
CHAPTER 2: THE SCHOOL EFFECTIVENESS MOVEMENT . . . . . . . . . . . . . . . . . . . . . . . 13
Edmonds . . . . . . . . . . . . . . . . . . . . . . . . . . . . . . . . . . . . . . . . . . . . . . . . . . . . . . . . . . . . . 13Rutter . . . . . . . . . . . . . . . . . . . . . . . . . . . . . . . . . . . . . . . . . . . . . . . . . . . . . . . . . . . . . . . . 14Klitgaard and Hall . . . . . . . . . . . . . . . . . . . . . . . . . . . . . . . . . . . . . . . . . . . . . . . . . . . . . . 15Brookover Et Al. . . . . . . . . . . . . . . . . . . . . . . . . . . . . . . . . . . . . . . . . . . . . . . . . . . . . . . . 15Outlier Studies . . . . . . . . . . . . . . . . . . . . . . . . . . . . . . . . . . . . . . . . . . . . . . . . . . . . . . . . . 16Case Studies . . . . . . . . . . . . . . . . . . . . . . . . . . . . . . . . . . . . . . . . . . . . . . . . . . . . . . . . . . . 17Implementation Studies . . . . . . . . . . . . . . . . . . . . . . . . . . . . . . . . . . . . . . . . . . . . . . . . . . 18Conclusions . . . . . . . . . . . . . . . . . . . . . . . . . . . . . . . . . . . . . . . . . . . . . . . . . . . . . . . . . . . 19
CHAPTER 3: SOME CLASSIC SYNTHESIS STUDIES . . . . . . . . . . . . . . . . . . . . . . . . . . . . . 21
Bloom . . . . . . . . . . . . . . . . . . . . . . . . . . . . . . . . . . . . . . . . . . . . . . . . . . . . . . . . . . . . . . . . 21Walberg . . . . . . . . . . . . . . . . . . . . . . . . . . . . . . . . . . . . . . . . . . . . . . . . . . . . . . . . . . . . . . 22Fraser Et Al. . . . . . . . . . . . . . . . . . . . . . . . . . . . . . . . . . . . . . . . . . . . . . . . . . . . . . . . . . . . 24Hattie . . . . . . . . . . . . . . . . . . . . . . . . . . . . . . . . . . . . . . . . . . . . . . . . . . . . . . . . . . . . . . . . 26Wang, Haertel, and Walberg . . . . . . . . . . . . . . . . . . . . . . . . . . . . . . . . . . . . . . . . . . . . . . 28Lipsey and Wilson . . . . . . . . . . . . . . . . . . . . . . . . . . . . . . . . . . . . . . . . . . . . . . . . . . . . . . 30Cotton . . . . . . . . . . . . . . . . . . . . . . . . . . . . . . . . . . . . . . . . . . . . . . . . . . . . . . . . . . . . . . . . 32Scheerens and Bosker . . . . . . . . . . . . . . . . . . . . . . . . . . . . . . . . . . . . . . . . . . . . . . . . . . . 34Creemers . . . . . . . . . . . . . . . . . . . . . . . . . . . . . . . . . . . . . . . . . . . . . . . . . . . . . . . . . . . . . 35Three Categories of Variables . . . . . . . . . . . . . . . . . . . . . . . . . . . . . . . . . . . . . . . . . . . . . 39
PART II: RESEARCH ON SCHOOL,TEACHER, AND STUDENT EFFECTS
CHAPTER 4: THE SCHOOL-LEVEL EFFECT . . . . . . . . . . . . . . . . . . . . . . . . . . . . . . . . . . . . 43
How Large Is the School Effect? . . . . . . . . . . . . . . . . . . . . . . . . . . . . . . . . . . . . . . . . . . . 44What Factors Are Associated with the School Effect? . . . . . . . . . . . . . . . . . . . . . . . . . . 49Conclusions about the School-Level Variables . . . . . . . . . . . . . . . . . . . . . . . . . . . . . . . . 55
ii
CHAPTER 5: THE TEACHER-LEVEL EFFECT . . . . . . . . . . . . . . . . . . . . . . . . . . . . . . . . . . . 59
How Big Is the Teacher-Level Effect? . . . . . . . . . . . . . . . . . . . . . . . . . . . . . . . . . . . . . . . 59What Constitutes the Teacher-Level Effect? . . . . . . . . . . . . . . . . . . . . . . . . . . . . . . . . . . 62Conclusions about Teacher-Level Variables . . . . . . . . . . . . . . . . . . . . . . . . . . . . . . . . . . 66
CHAPTER 6: THE STUDENT-LEVEL EFFECT . . . . . . . . . . . . . . . . . . . . . . . . . . . . . . . . . . . 67
How Big Is the Student-Level Effect? . . . . . . . . . . . . . . . . . . . . . . . . . . . . . . . . . . . . . . . 67What Constitutes the Student-Level Effect? . . . . . . . . . . . . . . . . . . . . . . . . . . . . . . . . . . 68Conclusions about Student-Level Variables . . . . . . . . . . . . . . . . . . . . . . . . . . . . . . . . . . 77Revisiting the Three Categories . . . . . . . . . . . . . . . . . . . . . . . . . . . . . . . . . . . . . . . . . . . . 77
PART III:APPLICATIONS
CHAPTER 7: USING THE KNOWLEDGE BASEABOUT SCHOOL EFFECTIVENESS . . . . . . . . . . . . . . . . . . . . . . . . . . . . . . . . . . . . . . 85
Staff Development . . . . . . . . . . . . . . . . . . . . . . . . . . . . . . . . . . . . . . . . . . . . . . . . . . . . . . 85Evaluation . . . . . . . . . . . . . . . . . . . . . . . . . . . . . . . . . . . . . . . . . . . . . . . . . . . . . . . . . . . . 88Data-Driven School Improvement . . . . . . . . . . . . . . . . . . . . . . . . . . . . . . . . . . . . . . . . . . 90Epilogue . . . . . . . . . . . . . . . . . . . . . . . . . . . . . . . . . . . . . . . . . . . . . . . . . . . . . . . . . . . . . . 93
REFERENCES . . . . . . . . . . . . . . . . . . . . . . . . . . . . . . . . . . . . . . . . . . . . . . . . . . . . . . . . . . . . . . 95

1
Chapter 1A QUESTION OF SCHOOLING
As the title indicates, the central thesis of this monograph is that educators stand at the dawn of anew era of school reform. This is not because a new decade, century, and millennium are beginning,although these certainly are noteworthy events. Rather, it is because the cumulative research of thelast 40 years provides some clear guidance about the characteristics of effective schools and effectiveteaching. Knowledge of these characteristics provides educators with possibilities for reform unlikethose available at any other time in history. In fact, one of the primary goals of this monograph is tosynthesize that research and translate it into principles and generalizations educators can use to effectsubstantive school reform.
The chapters that follow attempt to synthesize and interpret the extant research on the impact ofschooling on students’ academic achievement. The interval of four decades has been selectedbecause this is the period during which the effects of schooling have been systematically studied.According to Madaus, Airasian, and Kellaghan (1980):
In the 1950s and early 1960s, the struggle against poverty, racial and unequaleducational opportunity became more intense. Starting just after 1960, the effort todeal with these problems dominated domestic legislative action. . . . Attempts todocument and remedy the problems of unequal educational opportunity, particularlyas they related to minority-group children, provided the major impetus for school-effectiveness studies. In fact, major societal efforts to address the problems ofinequality were centered on the educational sphere. (p. 11)
It was in this context that the Civil Rights Act of 1964, a cornerstone of President Johnson’s “waron poverty,” specified that the Commissioner of Education should conduct a nationwide survey ofthe availability of educational opportunity. The wording of the mandate revealed an assumption onthe part of the Act’s authors that educational opportunity was not equal for all members of Americansociety:
The Commissioner shall conduct a survey and make a report to the President andCongress. . .concerning the lack of availability of equal educational opportunities[emphasis added] for individuals by reason of race, color, religion, or national originin public institutions. (In Madaus, Airasian, & Kellaghan, 1980, p. 12)
Madaus, Airasian, and Kellaghan explain: “It is not clear why Congress ordered the commissionerto conduct the survey, although the phrase ‘concerning the lack of availability of educationalopportunities’ implies that Congress believed that inequalities in opportunities did exist, and thatdocumenting these differences could provide a useful legal and political tool to overcome futureoppositions to school reform” (p. 12). According to Mosteller and Moynihan (1972), JamesColeman, who was selected to head the team of researchers conducting the survey, indicated in aninterview that he believed the study would disclose a great disparity in the quality of educationafforded black versus white students — a fact interpreted by Mosteller and Moynihan as evidencethat Coleman began the study with a conclusion already in mind.

2
Whether the project was undertaken with a bias has always been and will continue to be a matter ofspeculation only. However, it is not a matter of speculation that the study was the largest survey ofpublic education ever undertaken. Over 640,000 students in grades 1, 3, 6, 9, and 12 categorized intosix ethnic and cultural groups took achievement tests and aptitude tests. About 60,000 teachers inover 4,000 schools completed questionnaires about their background and training.
The report, published in July 1966, is entitled Equality of Educational Opportunity but commonlyis referred to as the “Coleman Report” in deference to its senior author. The findings were notfavorable regarding the impact of schooling:
Taking all of these results together, one implication stands above all: that schoolsbring little influence to bear on a child’s achievement that is independent of hisbackground and general social context; and that this very lack of an independenteffect means that the inequalities imposed on children by their home, neighborhood,and peer environment are carried along to become the inequalities with which theyconfront adult life at the end of school. (p. 325)
Madaus et al. (1980) explain that the report had two primary effects on perceptions about schoolingin America. First, it dealt a blow to the perception that schools could be a viable agent in equalizingthe disparity in students’ academic achievement due to environmental factors. Second, it spawnedthe perception that differences in schools have little, if any, relationship with student achievement.One of the most well-publicized findings from the report was that schools account for only about 10percent of the variances in student achievement — the other 90 percent was accounted for by studentbackground characteristics.
Coleman et al.’s findings were corroborated in 1972 when Jencks and his colleagues (1972)published Inequality: A Reassessment of the Effects of Family and Schooling in America, which wasbased on a re-analysis of data from the Coleman report. Among the findings articulated in the Jencksstudy were the following:
� Schools do little to lessen the gap between rich and poor students.� Schools do little to lessen the gap between more and less abled students.� Student achievement is primarily a function of one factor — the background of
the student.� There is little evidence that education reform can improve the influence a school
has on student achievement.
Taken at face value, the conclusions articulated and implied in the Coleman and Jencks reports painta somber picture for education reform. If schools have little chance of overcoming the influence ofstudents’ background characteristics, why put any energy into school reform?
More than three decades have passed since the commissioned survey was undertaken. What havewe learned since then? Is the picture of schooling more positive now? This monograph attempts toanswer these questions. As the following chapter will illustrate, when the research undertaken duringthe last four decades is considered as a set, there is ample evidence that schools can and do make apowerful difference in the academic achievement of students.

1The process of determining the relationship between a predicted or dependent variable and predictor orindependent variables is commonly referred to as “regression analysis.” The predictor variable is “regressed onto”the predictor variable. The reader will note that this phrase is used frequently throughout the monograph.
3
A NECESSARILY TECHNICAL LOOK
The discussion in this monograph is somewhat technical in nature. This is necessarily the casebecause the research on school effectiveness has become quite sophisticated, both in terms ofmethodology and statistics, particularly over the last two decades. (For a discussion of these changes,see Willms, 1992; Byrk & Raudenbush, 1992.) However, an attempt has been made to includediscussions of formulae and the rationale for specific data analysis and estimation techniques usedin this monograph. These explanations can be found in footnotes and, where appropriate, in endnotesafter each chapter.
Throughout this monograph, five indices are used to describe the relationship between studentachievement and various school-, teacher-, and student-level factors.
Percent of Variance Explained: PV
One of the most common indices found in the research on the effects of schooling is the percent ofvariance explained, or PV as referred to in this monograph. As mentioned previously, this was theindex used by Coleman for interpreting the survey data. A basic assumption underlying the use ofthis index is that the percent of variance explained by a predictor or independent variable (e.g.,schooling) relative to a predicted or dependent variable (e.g., student achievement) is a goodindication of the strength of relation between the two. Most commonly, a “set” of predictor variablesis used. For example, a given study might attempt to predict student achievement using (1) per-pupilexpenditures, (2) proportion of academic classes, and (3) average years of experience per teacher.The predictor variables considered as a set would account for a proportion of total variance in thepredicted variable1. The index used to judge the influence of predictor variables is the ratio ofvariance accounted for by the predictor variables over the total variance of the predicted variablemultiplied by 100. As mentioned previously, this index is referred to in this monograph as PV:
percent of varianceexplained by predictor or independent variables
PV = ——————————————————— × 100 percent of total variance
in the predicted or dependent variable
The Correlation Coefficient: r and R
An index closely related to PV is the correlation coefficient. When a single predictor or independentvariable (e.g., socioeconomic status) is used with a predicted or dependent variable (e.g., students’academic achievement), the relationship between the two is expressed as r — the Pearson product-moment correlation. When multiple predictors (e.g., prior knowledge, quality of the school,

4
socioeconomic status) are used with a predicted variable, the relationship between the predictorvariables considered as a set and the predicted variable is expressed as R — the multiple correlationcoefficient. In both cases, the percent of variance accounted for (PV) in the predicted or dependentvariable by the predictor or independent variables is computed by squaring the correlation coefficient(i.e., r2 or R2) and multiplying by 100. In short, there is a strong conceptual and mathematicalrelationship between PV and the univariate and multi-variate correlation coefficients. Commonly,when school effects are expressed in one metric, they are also expressed in the other.
As common as is the use of these metrics, they have been criticized as indicators of the relationshipbetween predictor or independent and predicted or dependent variables in the research on schooleffectiveness. This is especially the case with PV, as Hunter and Schmidt (1990) explain:
The percent of variance accounted for is statistically correct, but substantivelyerroneous. It leads to severe underestimates of the practical and theoreticalsignificance of relationships between variables. . . .The problem with all percentvariance accounted for indices of effect size is that variables that account for smallpercentages of the variance often have very important effects on the dependentvariable. (pp. 199–200)
To illustrate this circumstance, Hunter and Schmidt use the correlation between aptitude and heredityreported by Jensen (1980). This correlation is about .895, which implies that about 80 percent (.8952)of the (true) variance in aptitude is a function of heredity, leaving only 20 percent of the variance dueto environment (r = .447). The relative influence of heredity on aptitude, and environment onaptitude, then, is about 4 to 1 from the percent of variance perspective. However, regression theory(see Cohen & Cohen, 1975) tells us that the correlations between heredity and aptitude (H) andbetween environment and aptitude (E) (after the influence of heredity has been partialed out) areanalogous to the regression weights in a linear equation predicting aptitude from heredity andenvironment when dependent and independent variables are expressed in standard score form. (Forthis illustration, we will assume that heredity and environment are independent.) Using the quantitiesabove, this equation would be as follows:
Predicted Aptitude = .895(H) + .447(E)
This equation states that an increase of one standard deviation in heredity will be accompanied byan increase of .895 standard deviations in aptitude. Similarly, an increase of one standard deviationin environment will be accompanied by an increase of .447 standard deviations in aptitude. Thispaints a very different picture of the relative influences of heredity and environment on aptitude.Here the ratio is 2 to 1 as opposed to 4 to 1 from the percent of variance perspective.
The Binomial Effect Size Display: BESD
The potentially misleading impressions given by the correlation coefficient and the percent ofvariance explained has stimulated the use of a third metric — the binomial effect size display(BESD). Rosenthal and Rubin (1982) explain that the percent of variance accounted for index invitesmisleading interpretations of the relative influence of predictor variables on predicted variables.Whereas r or R can be interpreted with distortion (as evidenced above), the BESD provides for the
2A fourfold or tetrachoric correlation is basically equivalent to a Pearson product-moment correlation (r)when both the predictor variable and the predicted variable are dichotomized. Relative to the BESD, the predictorvariable is thought of as being dichotomized into two distinct groups. In most of the BESD illustrations used in thismonograph, the dichotomized independent variable will be thought of as effective schools versus ineffectiveschools. Similarly, relative to the BESD, the predicted variable is dichotomized into success or failure on somecriterion measure. In this monograph, the predicted variable will generally be thought of as success or failure onsome form of achievement test.
A common convention when using the BESD is to assume that the expectation for the predicted variable is a successrate of .50. To compute the BESD, the correlation coefficient is divided by 2 and then added to and subtracted from.50. For example, if the r between predictor and predicted is .50, then .50 ÷ 2 = .25. The percentage of subjects inthe experimental group that would be expected to “succeed” on the predicted variable is computed as .50 + .25 =.75. The percentage of subjects in the experimental group that would be expected to “fail” on the criterion measureis .50 .25 = .25. The converse of these computations is used for the control group. Rosenthal and Rubin (1982)make the case for the use of BESD as a realistic representation of the size of the treatment effect when the outcomevariable is continuous, provided that the groups are of equal size and variance.
5
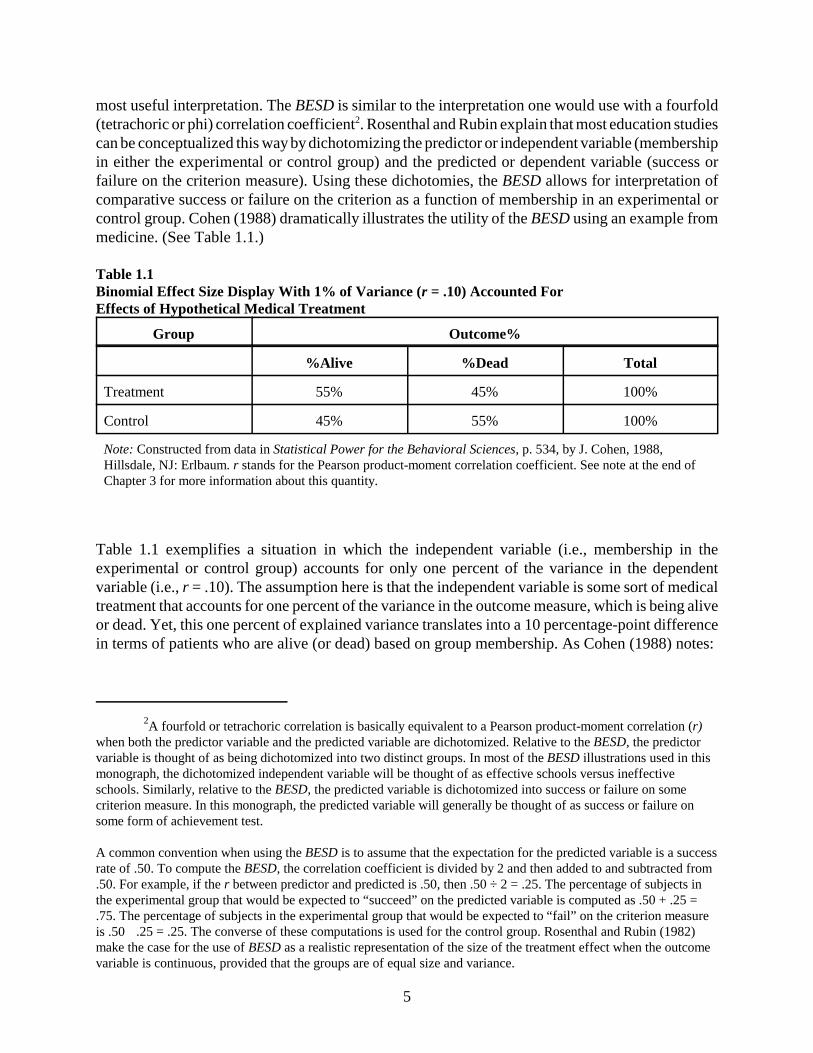
most useful interpretation. The BESD is similar to the interpretation one would use with a fourfold(tetrachoric or phi) correlation coefficient2. Rosenthal and Rubin explain that most education studiescan be conceptualized this way by dichotomizing the predictor or independent variable (membershipin either the experimental or control group) and the predicted or dependent variable (success orfailure on the criterion measure). Using these dichotomies, the BESD allows for interpretation ofcomparative success or failure on the criterion as a function of membership in an experimental orcontrol group. Cohen (1988) dramatically illustrates the utility of the BESD using an example frommedicine. (See Table 1.1.)
Table 1.1Binomial Effect Size Display With 1% of Variance (r = .10) Accounted ForEffects of Hypothetical Medical Treatment
Group Outcome%
%Alive %Dead Total
Treatment 55% 45% 100%
Control 45% 55% 100%
Note: Constructed from data in Statistical Power for the Behavioral Sciences, p. 534, by J. Cohen, 1988,Hillsdale, NJ: Erlbaum. r stands for the Pearson product-moment correlation coefficient. See note at the end ofChapter 3 for more information about this quantity.
Table 1.1 exemplifies a situation in which the independent variable (i.e., membership in theexperimental or control group) accounts for only one percent of the variance in the dependentvariable (i.e., r = .10). The assumption here is that the independent variable is some sort of medicaltreatment that accounts for one percent of the variance in the outcome measure, which is being aliveor dead. Yet, this one percent of explained variance translates into a 10 percentage-point differencein terms of patients who are alive (or dead) based on group membership. As Cohen (1988) notes:

6
This means, for example, that a difference in percent alive between .45 and .55,which most people would consider important (alive, mind you!) yields r = .10, and“only 1% of the variance accounted for,” an amount that operationally defines a“small” effect in my scheme. . . .
“Death” tends to concentrate the mind. But this in turn reinforces the principle thatthe size of an effect can only be appraised in the context of the substantive issuesinvolved. An r2 of .01 is indeed small in absolute terms, but when it represents a tenpercentage point increase in survival, it may well be considered large. (p. 534)
This same point is further dramatized by Abelson (1985). After analyzing the effect of variousphysical skills on the batting averages of professional baseball players, he found that the percent ofvariance accounted for by these skills was a minuscule .00317 — not quite one-third of one percent(r = .056). Commenting on the implications for interpreting education research, Abelson notes:
One should not necessarily be scornful of minuscule values for percentage ofvariance explained, provided there is statistical assurance that these values aresignificantly above zero, and that the degree of potential cumulation is substantial.(p. 133)
Finally, Cohen exhorts: “The next time you read ‘only X% of the variance is accounted for,’remember Abelson’s paradox” (p. 535).
The BESD provides for an interesting perspective on the findings from the Coleman report —namely, that schooling accounts for only about 10 percent of the variance in student achievement.When the associated r of .316 is displayed in terms of the BESD, the results lead to a differentinterpretation than that promoted by Coleman. This is shown in Table 1.2. To interpret Table 1.2,assume that the criterion measure is a state test that 50 percent of students are expected to pass.
As illustrated in Table 1.2, when the 10 percent of the variance in student achievement accountedfor by schooling is thought of in terms of success or failure on some measure (e.g., a state test onstandards), the difference between “effective” and “ineffective” schools is dramatic. Specifically,31.6 percent more students would pass the test in effective schools than in ineffective schools.
Table 1.2Binomial Effect Size Display with 10% of Variance (r = .316) Accounted For
Group Outcome%
% Success % Failure Total
Effective Schools 65.8% 34.2% 100%
Ineffective Schools 34.2% 65.8% 100%

3In this monograph, the term “effect size” and its related symbol ESd are reserved for the standardizedmean difference. However, it is important to note that r, R, and PV are also referred to as effect sizes in theliterature.
4Z scores are standardized scores with a mean of 0 and a standard deviation of one.
7
The Standardized Mean Difference Effect Size: ESd
Another index commonly used in discussions of the effects of schooling is the standardized meandifference. Glass (1976) first popularized this index now commonly used in research on schooleffects. Commonly referred to as an effect size3, the index is the difference between experimentaland control means divided by an estimate of the population standard deviation — hence, the name,standardized mean difference.
standardized mean � experimental group � � control groupdifference effect size = ————————————————
estimate of population standard deviation
Theorists have suggested a variety of ways to estimate the population standard deviation along withtechniques for computing the effect size index under different assumptions (see Cohen, 1988; Glass,1976; Hedges and Olkin, 1985). The effect size index used throughout this monograph uses thepooled standard deviation from experimental and control groups as the population estimate. It isfrequently referred to as Cohen’s d. It will be referred to as ESd throughout the remainder of thismonograph.
To illustrate the use of ESd, assume that the achievement mean of a school with a givencharacteristic is 90 on a standardized test and that the mean of a school that does not possess thischaracteristic is 80. Also assume that the population standard deviation is 10. The effect size wouldbe
90 � 80ESd = ———— = 1.0
10
This effect size can be interpreted in the following way: the mean of the experimental group is 1.0standard deviations larger than the mean of the control group. One might infer, then, that thecharacteristic possessed by the experimental school raises achievement test scores by one standarddeviation. Thus, the effect size (ESd) expresses the differences between means in standardized orZ score form4. It is this characteristic that gives rise to the fifth index commonly used in the researchon school effects — percentile gain.
Percentile Gain: P gain
Percentile gain (P gain) is the expected gain (or loss) in percentile points of the average student inthe experimental group compared to the average student in the control group. To illustrate, considerthe example above. Given an effect size, ESd, of 1.0, one can conclude that the average score in the

8
experimental group is 34.134 percentile points higher than the average score in the control group.This is necessarily so since the ESd translates the difference between experimental and control groupmeans into Z score form. Distribution theory tells us that a Z score of 1.0 is at the 84.134 percentilepoint of the standard normal distribution. To compute the P gain, then, ESd is transformed intopercentile points above or below the 50th percentile point on the standard normal distribution.
The Five Indices
In summary, five indices are commonly used in the research on school effects and form the basis forthe discussion to follow. As used in this monograph, those indices are PV, r or R, BESD, ESd, andP gain. Table 1.3 provides the explanations for these indices and their relationships.
These indices are used somewhat interchangeably throughout this monograph. The reader iscautioned to keep in mind the preceding discussion about the characteristics of each index and theirinterpretations and possible misinterpretations. The selection of the most appropriate indices to usein the following discussion was based on the indices used in the original research and theappropriateness of the indices to the overall point of the discussion.
PURPOSE AND DIRECTION OF THIS MONOGRAPH
As the previous discussion indicates, there are many ways to analyze and interpret the research onschool effects. One basic question addressed in this report is whether the 30-plus years of researchsince the Coleman report still supports the finding that schooling accounts for only 10 percent ofvariance in student achievement. A second basic question addressed is, What are the school-,classroom-, and student-level factors that influence student achievement?
Limitations
It should be noted at the outset that this monograph focuses only on those school- and teacher-levelcharacteristics that can be implemented without drastic changes in resources or personnel. Bydefinition, then, interventions that would require exceptional resources (e.g., year-round school,computers for every student, after-school programs) or additional personnel (e.g., lowerteacher/student ratios, tutoring for students) are not addressed in this report. This is not to say thatthese are not viable reform efforts. Indeed, structural changes such as these might hold the ultimatesolution to school reform. However, this report focuses on changes that can be implemented giventhe current structure and resources available to schools.
Outline
The remaining chapters in this monograph are organized in the following manner. The first section,“Part I: General Literature Review,” includes Chapters 2 and 3, which review the literature onprevious attempts to identify those variables impacting student achievement. Chapter 2 focuses onstudies that were part of the “school effectiveness movement”; Chapter 3 focuses on studies thatwere not part of this movement and that were more synthetic in nature. The studies in Chapter 3

9
might be considered “classic” studies of the effects of schooling. The second section, “Part II:Research on School, Teacher, and Student Effects,” includes Chapters 4, 5, and 6. Chapter 4 presentsa discussion of the research on school-level variables. Chapters 5 and 6, respectively, review theresearch on teacher-level variables and student-level variables. The final section, “Part III:Applications,” includes Chapter 7, which considers the implications of the findings from Chapters4, 5, and 6 for school reform.
Table 1.3Indices Used in This Monograph
Symbol Name Explanation and Relationshipto Other Indices
PV percent of variance explained Percentage of variance in the predicted or dependentvariable accounted for or explained by the predictoror independent variables. PV is commonly computedby squaring r (when one predictor or independentvariable is involved) or squaring R (when multiplepredictors or independent variables are involved).
r or R bivariate correlationcoefficient and multiplecorrelation coefficient
Relationship between predictor(s) and predictedvariable expressed as an index from �1.0 to +1.0 inthe case of r, and .00 to +1.00 in the case of R. r2 andR2 are equivalent to PV. When one independent orpredictor variable is involved, ESd is equal to
BESD binomial effect size display The expected difference between experimental andcontrol groups relative to the percentage of studentswho would pass a test on which the normal passingrate is 50%. BESD is usually computed using r.Specifically, r/2 is added and subtracted from 50%.
ESd standardized mean differenceeffect size
The difference between the experimental group meanand the control group mean standardized by anestimate of the population standard deviation. ESdcan be converted to r via the following formula:
P gain percentile gain The difference in percentile points between the meanof the experimental group and the mean of the controlgroup. P gain is computed by transforming ESd to apercentile point in the standard normal distributionand then subtracting 50%.
2r/�1�r2.
ESd
r = &&&&& RESd2 + 4

10
PART I:GENERAL LITERATURE REVIEW


13
Chapter 2THE SCHOOL EFFECTIVENESS MOVEMENT
There was a rather swift reaction to the works of Coleman and Jencks from the world of educationresearch. A number of efforts were launched to demonstrate the effectiveness of schools and to ratherpointedly provide a counter argument to that implicit in the Coleman and Jencks studies. Thischapter reviews studies that fall into the category of what might loosely be referred to as the “schooleffectiveness movement.”
Arguably, the school effectiveness movement can be thought of as a set of studies and reform effortsthat took place in the 1970s and early 1980s and shared the common purpose of identifying thosewithin-school factors that affect students’ academic achievement. The case might also be made thatstudies in this category were loosely joined by virtue of the people conducting the studies (i.e., arelatively small network of like-minded researchers) and/or by antecedent/consequent relationshipsbetween studies (i.e., one study built on the findings from a previous study). (For an extensive reviewof the school effectiveness research, see Good and Brophy, 1986.)
EDMONDS
It is probably accurate to say that Ron Edmonds is considered the figurehead of the schooleffectiveness movement. As Good and Brophy (1986) note:
Until his untimely death in 1983, [Edmonds] had been one of the key figures in theschool effectiveness movement. . . . Edmonds, more than anyone, had beenresponsible for the communication of the belief that schools can and do make adifference. (p. 582)
Edmonds’ contributions were primarily provocative and conceptual in nature (see Edmonds, 1979a,1979b, 1979c, 1981a, 1981b; Edmonds & Frederiksen, 1979). First and foremost, Edmonds assertedthat schools can and do make a difference in student achievement. In addition, he operationalizedthe definition of effective schools as those that close the achievement gap between students from lowsocioeconomic (SES) backgrounds and those from high socioeconomic backgrounds. Perhaps hismost salient contribution was the articulation of the five “correlates” — five school-level variablesthat allegedly are strongly correlated with student achievement:
1. Strong administrative leadership2. High expectations for student achievement3. An orderly atmosphere conducive to learning4. An emphasis on basic skill acquisition5. Frequent monitoring of student progress
Although other researchers proposed somewhat different lists (see Purkey & Smith, 1982, for adiscussion), Edmonds’ five correlates of effective schools became immensely popular. As Scheerensand Bosker (1997) explain, these five correlates became the framework for thinking about schooleffectiveness for at least a decade, although probably longer.
14
RUTTER
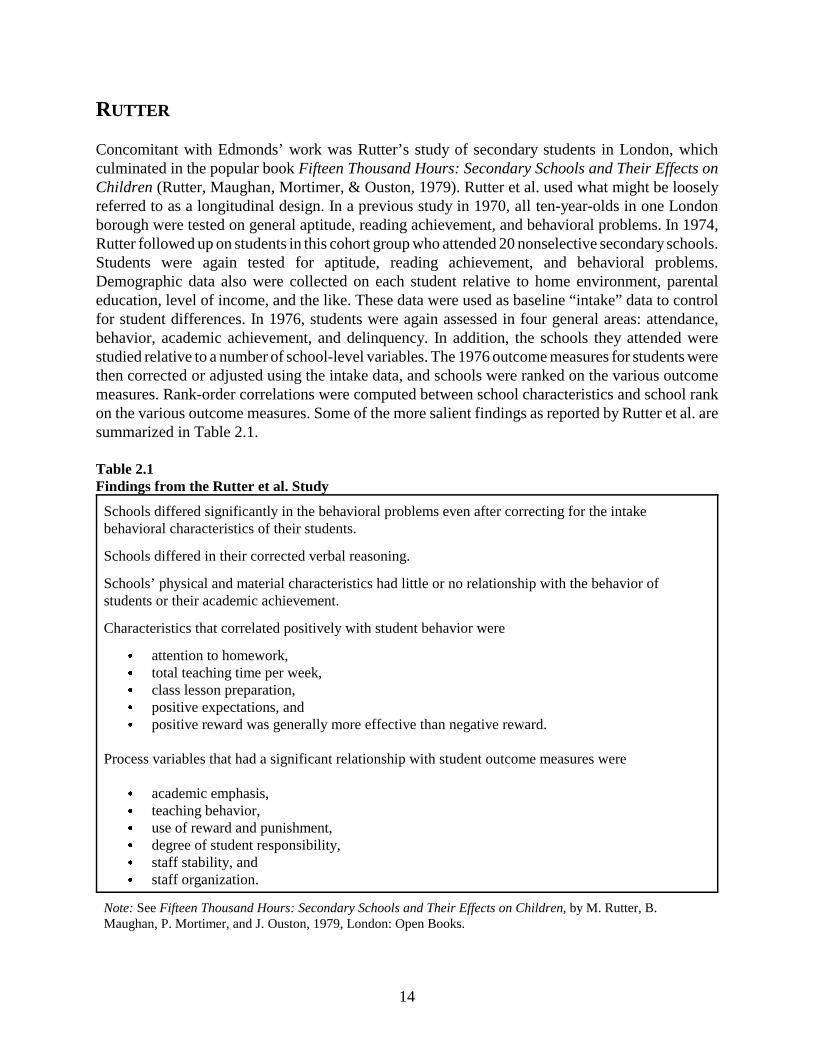
Concomitant with Edmonds’ work was Rutter’s study of secondary students in London, whichculminated in the popular book Fifteen Thousand Hours: Secondary Schools and Their Effects onChildren (Rutter, Maughan, Mortimer, & Ouston, 1979). Rutter et al. used what might be looselyreferred to as a longitudinal design. In a previous study in 1970, all ten-year-olds in one Londonborough were tested on general aptitude, reading achievement, and behavioral problems. In 1974,Rutter followed up on students in this cohort group who attended 20 nonselective secondary schools.Students were again tested for aptitude, reading achievement, and behavioral problems.Demographic data also were collected on each student relative to home environment, parentaleducation, level of income, and the like. These data were used as baseline “intake” data to controlfor student differences. In 1976, students were again assessed in four general areas: attendance,behavior, academic achievement, and delinquency. In addition, the schools they attended werestudied relative to a number of school-level variables. The 1976 outcome measures for students werethen corrected or adjusted using the intake data, and schools were ranked on the various outcomemeasures. Rank-order correlations were computed between school characteristics and school rankon the various outcome measures. Some of the more salient findings as reported by Rutter et al. aresummarized in Table 2.1.
Table 2.1Findings from the Rutter et al. Study
Schools differed significantly in the behavioral problems even after correcting for the intakebehavioral characteristics of their students.
Schools differed in their corrected verbal reasoning.
Schools’ physical and material characteristics had little or no relationship with the behavior ofstudents or their academic achievement.
Characteristics that correlated positively with student behavior were
& attention to homework,& total teaching time per week,& class lesson preparation,& positive expectations, and& positive reward was generally more effective than negative reward.
Process variables that had a significant relationship with student outcome measures were
& academic emphasis,& teaching behavior,& use of reward and punishment,& degree of student responsibility,& staff stability, and& staff organization.
Note: See Fifteen Thousand Hours: Secondary Schools and Their Effects on Children, by M. Rutter, B.Maughan, P. Mortimer, and J. Ouston, 1979, London: Open Books.

15
One aspect of the Rutter study that complicated the interpretation of its findings was the use of rank-order correlations. This statistic does not allow for a straightforward interpretation of the strengthof relationships between student achievement and the various outcome measures, such as ESd or PV,for at least two reasons. First, the unit of analysis is the school. Consequently, within-school variancedue to differences between individual students is not analyzed. Second, the magnitude of differencesbetween schools is lost with rank-order correlations. In fact, when a straightforward, multiple-regression analysis was performed using individual student achievement as the dependent variable,and student aptitude, parental occupation, selected SES factors, and school process as theindependent variables, school process variables uniquely accounted for only 1.6 percent of the totalvariance. In spite of its shortcomings, the publication of 15,000 Hours had a powerful effect onschool reform efforts in Britain and the United States, sparking intense interest in the study ofeffective schools.
KLITGAARD AND HALL
Klitgaard and Hall’s (1974) study was arguably the first, rigorous, large-scale attempt to identifyvariables associated with effective schools (Good & Brophy, 1986). These researchers analyzed threesets of data: two years’ worth of scores from 4th and 7th graders from 90 percent of Michiganschools, achievement scores from grades 2–6 in New York City, and scores from the Project Talenthigh school study. After analyzing residual scores from the regression of achievement scores onstudent background variables, they concluded that of the 161 Michigan schools in the study, aboutnine percent (i.e., 15) increased student achievement by one standard deviation (i.e., had an ESd of1.0) after controlling for background variables. Similarly, of the 627 schools in the New Yorksample, the residual achievement of 30 schools was one standard deviation above the mean.
Although the Klitgaard and Hall study provided clear evidence that some schools produce relativelylarge gains in student achievement, these “high-achieving” schools represented a small minority ofthose in the population. In addition, the Klitgaard and Hall study did not address whether the “highlyeffective schools” were equally effective for students from all backgrounds.
BROOKOVER ET AL.
The study by Brookover and his colleagues (Brookover et al., 1978; Brookover, Beady, Flood,Schweitzer, & Wisenbaker, 1979) was one of the most significant school effectiveness studies, notonly for its timing (i.e., it was one of the early studies conducted on school-level variables), but alsofor its breadth and rigor.
The study involved 68 elementary schools. Data were collected from each school for three sets ofvariables: school inputs, school social structure, and school social climate. School inputs includedthe socioeconomic status of students, school size, number of trained teachers per 1,000 pupils, andthe like. The school social structure was defined as teacher satisfaction with the school, parentalinvolvement in the school, and the extent to which teaching practices could be characterized as“open.” School social climate was measured via 14 variables that were subdivided into student-levelclimate variables (e.g., sense of academic futility among pupils, appreciation and expectations pupilshad for education), teacher-level climate variables (e.g., expectations about student graduation,

16
inclination toward improving student achievement), and administrator-level climate variables (e.g.,focus on academic achievement, high expectations for student achievement). Dependent variablesincluded average achievement per school in reading and mathematics, average student self-concept,and average student self-confidence. The data were analyzed by regressing the dependent variableson the independent variables entered into the equation in a step-wise progression. Results indicatedthat
when entered into the multiple regression first, the combined input set explains about75 percent of the variance in mean school achievement, the social structures setexplains 41 percent and the climate variables explain 72 percent in the representativestate sample. (Brookover et al., 1979, p. 54)
In short, the three categories of variables — inputs, structure, and climate — were found to be highlyrelated, making it difficult to determine the pattern of causality in terms of outcomes. Although thethree categories of variables considered as a set accounted for a sizeable amount of variance inschool-level achievement, eight percent (8%) was unique to inputs, only six percent (6%) was uniqueto climate, and four percent (4%) was unique to structure, again indicating a great deal of overlapbetween the effects of the input, structure, and climate variables. It is probably safe to say, however,that the Brookover et al. study (1978, 1979) established school climate as a central feature ofeffective schools. One limiting characteristic of the study was that the school was the unit ofanalysis, as was the case with the Rutter study. Consequently, within-school variance due todifferences between individual students was not analyzed.
OUTLIER STUDIES
A significant percentage of the school effectiveness studies might loosely be referred to as outlierstudies (Scheerens & Bosker, 1997). The general methodology employed in these studies was toidentify those schools that are “outliers” in terms of the expected achievement of their students basedon background variables (e.g., SES). Specifically, when using an outlier approach, studentachievement is regressed onto various background variables and a linear, multi-variable regressionequation established. Predicted achievement scores are then computed for each student andaggregated for each school. If a school’s average observed achievement is greater than its averagepredicted achievement, it is considered a “positive outlier.” If a school’s average observedachievement is less than its average predicted achievement, it is considered a “negative outlier.”
Purkey and Smith (1982, 1983) summarize the findings of the major outlier studies conducted upto the early 1980s, at which time the use of the outlier methodology was sharply curtailed. Thestudies that are the focus of their review include a study conducted by the New York State EducationDepartment (1974a, 1974b, 1976), a study conducted by the Maryland State Department ofEducation (Austin, 1978, 1979, 1981), Lezotte, Edmonds, and Ratner’s study (1974) of elementaryschools in Detroit, Brookover and Schneider’s (1975) study of elementary schools in Michigan, andSpartz’s (1977) study of schools in Delaware. Despite the use of a common methodology (i.e.,outliers) and a common level of schooling (i.e., elementary schools), results varied widely. Forexample, two of the three New York studies found that methods of reading instruction varied fromhigh-achieving to low-achieving schools; however, one of the three studies reported no differencein instruction. Instructional leadership was one of the characteristics of effective schools identified

17
in the Maryland study, but Spartz noted that a focus on effective administrative activities (e.g.,meetings) was more critical than administrative leadership, per se. Finally, where Spartz identifiedseven general variables associated with high achieving schools, Brookover and Schneider identifiedsix.
The reason for the discrepant findings in the studies is discussed in depth by Purkey and Smith(1982, 1983) and more recently by Scheerens (Scheerens, 1992; Scheerens & Bosker, 1997). Someof these shortcomings are due to the conventions of outlier methodology. They include smallsamples, weaknesses in the way outliers are identified owing to the fact that effects of importantbackground characteristics are not accounted for, and regression toward the mean given that bothsets of data points represent extremes. In spite of these criticisms, Scheerens and Bosker note thatthe following characteristics of effective schools can be inferred from the outlier research: (1) gooddiscipline, (2) teachers’ high expectations regarding student achievement, and (3) effectiveleadership by the school administrator.
CASE STUDIES
Another group of studies in the school effectiveness movement might be loosely referred to as casestudies. In these studies, a small set of schools was studied in depth. These schools were typicallyorganized into groups based on outcome measures — high-achieving schools versus low-achievingschools. The characteristics of schools in a group were then studied via ethnographic and/or surveytechniques.
To illustrate, consider the case study by Brookover and Lezotte (1979) involving eight schools,which was a follow-up to an earlier study (Brookover et al., 1978, 1979). Brookover and Lezotte’scase study focused on eight elementary schools. Five schools were defined as high need — less than50 percent of the 4th-grade students tested attained 75 percent of the objectives on the Michiganstatewide test. Three schools were defined as low need — 50 percent or more of the 4th-gradestudents tested attained 75 percent or more of the objectives on the statewide test. Of the low-needschools, one was defined as improving — it showed an increase of five percent or more in thepercentage of students attaining at least 75 percent of the objectives and a simultaneous decrease offive percent or more in the percentage attaining less than 25 percent of the objectives. Two of thelow-need schools were defined as declining — they showed a decrease of five percent or more in thepercentage of students attaining at least 75 percent of the objectives and a simultaneous increase offive percent or more in the percentage of students attaining less than 25 percent of the objectives.Of the high-need schools, all five were classified as improving. A team of field researchers was sentto each site where the researchers administered questionnaires and interviewed staff members overa three- to four-day period. From this qualitative data, generalizations were constructed about thedefining characteristics of effective schools. These included (1) high expectations for studentachievement, (2) school policies that focus on academic achievement, (3) clear academic goals, and(4) a strong focus on basic skills.
The results of some of the more well-known case studies are reported in Table 2.2. As this tableshows, these case studies had fairly homogeneous findings. The most frequently cited characteristicof effective schools, as reported in Table 2.2, is high expectations; the least frequently cited iseffective staff development. All other factors were equally emphasized in the case study research.

18
Although it cannot be said that the case study literature led to any new insights into thecharacteristics of effective schools, it did help solidify the importance of the five correlates.Specifically, each variable listed in Table 2.2, with the exception of staff development, can beconsidered synonymous with one of the five correlates or a subcomponent of one of the fivecorrelates. For example, “orderly climate” and “cooperative atmosphere” are analogous to “orderlyatmosphere conducive to learning,” and “high expectations” and “focus on basic skills” are anotherway of saying “high expectations for student achievement.”
Table 2.2 Summary of Case Study Results
VARIABLESTUDY
Weber(1971)
(n = 4)a
Venezky &Winfield (1979)
(n = 2)a
Glenn(1981)
(n = 4)a
Brookover &Lezotte (1979)
(n = 8)a
Strong Leadership X X
Orderly Climate X X
High Expectations X X X X
Frequent Evaluation X X
Achievement-Oriented Policy X X
Cooperative Atmosphere X X
Clear Academic Goals X X
Focus on Basic Skills X X
Effective Staff Development X
a Number of schools studied
IMPLEMENTATION STUDIES
Based on the assumption that the variables identified in the school effectiveness movement have acausal relationship with student achievement, a number of implementation studies were undertaken.Where all the other studies cited in this chapter were descriptive in nature, implementation studiesemployed interventions. In other words, an attempt was made to change school-level behavior onone or more of the factors considered important to effective schooling.
To illustrate, Milwaukee’s Project RISE (McCormack-Larkin & Kritek, 1983) began in March of1979 when the school board presented a mandate to district administrators to improve achievementin 18 elementary schools and 2 middle schools that historically had low scores on achievement tests.Project RISE was based on the assumption that the manipulation of eight critical factors can improvestudent achievement: (a) a shared belief that all students can learn and schools can be instrumental
19
in that learning, (b) an explicit mission of improving student achievement, (c) high levels ofprofessional collegiality among staff, (d) students’ sense of acceptance by the school, (e)identification of grade-level objectives, (f) an accelerated program for students’ achieving belowgrade level, (g) effective use of instructional time, and (h) a well-structured course of studies.
After three years, Project RISE schools had shown moderate increases in student achievement,particularly in mathematics. Perhaps most noteworthy about these modest gains is that they wereachieved with no new staff, no new materials, and a only small amount of additional money. This,in fact, seems to be the general pattern of results for efforts to implement research from the schooleffectiveness movement. Specifically, the implementation studies generally indicate that focusingon the five correlates or derivatives of them produces modest gains in achievement without anexpenditure of exceptional resources. (See Good and Brophy, 1986, for a discussion of efforts toimplement the primary findings from the school effectiveness movement.)
CONCLUSIONS
As a whole, the school effectiveness movement produced fairly consistent findings regarding thecharacteristics of high-performing schools. With some variation, five general features appear tocharacterize effective schools as identified by a variety of methodologies, most of which focus onidentifying schools where students perform better than expected based on student SES. Those fivefactors or five correlates as commonly referred to include (1) strong leadership, (2) high expectationsfor students, (3) an orderly atmosphere, (4) an emphasis on basic skills, and (5) effective monitoringof student achievement.


21
Chapter 3SOME CLASSIC SYNTHESIS STUDIES
Chapter 2 discussed the research of the 1970s and early 1980s that is commonly considered to be partof the school effectiveness movement. In this chapter, studies are considered that are not part of themovement as defined in Chapter 2. Although these studies, like those from the school effectivenessmovement, had as their basic purpose to articulate the defining characteristics of effective schools,many of them went beyond school characteristics to study teacher-level variables and those student-level variables that influence student achievement. In general, these studies were highly syntheticin nature in that they summarized the findings from a number of studies. In addition, many of thesestudies employed meta-analytic techniques as the primary data analysis strategy, providing averageeffect sizes (usually stated in terms of ESd or r) as the indication of the strength of the relationshipbetween a given variable and student achievement. This chapter is organized in loose chronologicalorder by individuals or groups of individuals who were the principal investigators for these syntheticefforts. It is safe to say that the works of these individuals and groups of individuals have come tobe known as seminal studies not formally associated with the school effectiveness movement.
BLOOM
In 1984, Bloom published two articles (1984a, 1984b) that demonstrated to educators, probably forthe first time, the utility of using ESd (the standardized mean difference) as a metric for gauging theutility of various instructional interventions. The more technical of the two articles was entitled The2 Sigma Problem: The Search for Methods of Instructions as Effective as One-to-One Tutoring(1984b). The basic premise of the article was that using the most effective instructional strategiescan produce achievement gains as large as those produced by one-on-one tutoring. Specifically,based on studies conducted by two of his graduate students — Anania (1982, 1983) and Burke(1984) — Bloom (1984b) concluded that tutoring has an effect size (ESd) of 2.00 (two sigmas) whencompared with group instruction:
It was typically found that the average student under tutoring was about two standarddeviations above the average of the control class (the average tutored student wasabove 98% of the students in the control class). (p. 4)
Inasmuch as it is a practical impossibility to assign a tutor to every student, Bloom sought to identify“alterable educational variables” (p. 5) that would approximate the two sigma achievement effectsizes obtained by tutoring. Alterable educational variables were defined as those factors that couldbe reasonably influenced by teacher behavior or by resources provided by the school or district.
Bloom explicitly noted the utility of meta-analysis in the search for these variables: “Within the lastthree years, this search has been aided by the rapid growth of the meta-analysis literature” (p. 5).Bloom identified a number of variables that, when combined, could potentially produce a two-sigmaeffect. These variables were adapted from a study reported by Walberg in 1984 (discussed in the nextsection). They included specific instructional techniques such as reinforcement, feedback, and

22
cooperative learning, and more general variables such as teacher expectancy. Bloom (1984b) alsowarned against assuming that effect sizes for different variables are additive:
In our attempt to solve the 2 sigma problems, we assume that two or three alterablevariables must be used that together contribute more to learning than any one ofthem. . . . So far, we have not found any two variable combinations that haveexceeded the 2 sigma effect. Thus, some of our present research reaches the 2 sigmaeffect, but does not go beyond it. (p. 6)
Both of Bloom’s 1984 articles (1984a, 1984b) also extolled the powerful effects of mastery learning(ML). For example, Bloom (1984b) wrote:
Because of more than 15 years of experience with ML at different levels of educationand in different countries, we have come to rely on ML as one of the possiblevariables to be combined with selected other variables. ML (the feedback-correctiveprocess) under good conditions yields approximately a 1 sigma effect size. (p. 6)
Although Bloom’s work and that of his colleagues is sometimes thought of in the narrow contextonly of mastery learning, in fact Bloom was probably the first researcher to demonstrate, via the useof the ESd index, the powerful influence that effective instruction can have on student achievement.
WALBERG
It is probably safe to say that Walberg has been one of the most prominent figures in the last 20 yearsrelative to attempts to identify those factors that most strongly influence school learning. Most of hiswritings make explicit reference to his “productivity model,” which was first articulated in 1980 ina publication entitled A Psychological Theory of Educational Productivity. In that article, Walbergargued that achievement in school can be described as a function of seven factors:
1. student ability (Abl)2. motivational factors (Mot)3. quality of instruction (Qal)4. quantity of instruction(Qan)5. classroom variables (Clas)6. home environment (Home)7. age or mental development (Age)
Walberg further argued that the most appropriate mathematical model to describe the extent to whichthese factors predict achievement is the Cobb-Douglas (1928) function borrowed from economics,as opposed to a more traditional linear regression model. The general form of the Cobb-Douglasfunction is O = aKbLc, where O is output or productivity, a is a constant, K is capital, L is labor, andb and c are exponents. When Walberg applied this function to his seven factors, the followingequation resulted:
Achievement = a x(Abl)bx(Mot)cx(Qal)dx(Qan)fx(Cls)gx(Hom)hx(Age)I

1This is the article from which Bloom (1984a, 1984b) derived his list of alterable variables.
23
Walberg (1980) detailed the many advantages of the Cobb-Douglas function, two of which are
• increasing the productivity or effectiveness of one factor while keeping the othersconstant produces diminishing returns
• a zero value for any factor will return a product of zero. (pp. 14–15)
These aspects of the Cobb-Douglas function had great intuitive appeal for Walberg in the contextof predicting student achievement. For example, it makes intuitive sense that increasing the quantityof instruction without increasing any of the other six factors in Walberg’s model will havediminishing returns on achievement over time. Similarly, a value of zero for motivational factors,for example, will produce zero achievement regardless of the values assigned to the other six factors.
In a 1984 article entitled “Improving the Productivity of America’s Schools,” Walberg expanded onhis productivity model.1 In this later work, Walberg identified nine factors organized into threegeneral categories:
A. Student Aptitude1. Ability or prior achievement2. Development as indexed by age or stage of maturation3. Motivation or self-concept as described by personality tests or the student’s
willingness to persevere intensively on learning tasks
B. Instruction1. The amount of time students are engaged2. The quality of instruction
C. Environment1. The home2. The classroom social groups3. The peer groups outside of school4. Use of out-of-school time (specifically, the amount of leisure time television
viewing)
In defense of the model, Walberg (1984) reported that “about 3,000 studies suggest that these factorsare the chief influences on cognitive, affective, and behavioral learning” (p. 22). Although Walbergreported average effect sizes for a variety of variables in each of the nine categories, he mixeddifferent types of effect sizes (i.e., correlations versus standardized mean differences) withoutspecifying which metric was being used, making it difficult, if not impossible, to ascertain therelative impact of the various factors. Nevertheless, Walberg’s productivity model has been in theforefront of many discussions about variables that influence student achievement, particularly in thelast decade.

24
FRASER, WALBERG, WELCH, AND HATTIE
In 1987, an issue of the International Journal of Educational Research was devoted to a summaryof the research on school- and classroom-level variables affecting achievement. The volumecontained six chapters written (without designating chapter authorship) by Fraser, Walberg, Welch,and Hattie. The overall title of the volume was “Synthesis of Educational Productivity Research,”signaling the strong influence of Walberg’s productivity model. Indeed, the first chapter of thevolume addressed the need for a major review of the literature and the utility of using meta-analysisas the synthetic technique with which to review the literature. It then specified Walberg’s (1984)nine-factor productivity model as that which would be used to organize the findings presented in thevolume. Three separate sets of findings were reported.
The first set of findings utilized Walberg’s productivity model to synthesize the results of 2,575individual studies. This synthesis was identical to Walberg’s 1984 article, which was used by Bloomin his two 1984 articles. As was the case with the 1984 Walberg article, Fraser et al. utilizedreporting conventions that made it difficult to interpret the findings. The overall conclusion of thisfirst set of findings was that “the first five essential factors in the educational productivity model(ability, development, motivation, quantity of instruction, quality of instruction) appear to substitute,compensate, or trade off for one another at diminishing rates of return” (p. 163).
The centerpiece of the journal issue was a section entitled “Identifying the Salient Facets of a Modelof Student Learning: A Synthesis of Meta-Analyses.” It synthesized the results of 134 meta-analyses,which were based on 7,827 studies and 22,155 correlations. An estimated 5–15 million students inkindergarten through college were involved in these studies as subjects. Seven factors that are clearlyrelated, but not identical, to the nine factors in Walberg’s productivity model were used to organizethe findings: (1) school factors, (2) social factors, (3) instructor factors, (4) instructional factors, (5)pupil factors, (6) methods of instruction, and (7) learning strategies. The average correlation withachievement across all seven factors was .20 (ESd = .41). The correlations and effect size (ESd) foreach of these seven factors are reported in Table 3.1.
Unlike the first set of findings reported in the Fraser et al. study, those summarized in Table 3.1provided specific information about the number of studies involved, the specific studies that wereused, and the variability and central tendency of the findings for different variables. In fact, theresults reported in Table 3.1 are still considered by many to be the most comprehensive review ofresearch in terms of the number of studies involved.
The third set of findings reported by Fraser et al. was specific to the science achievement of 17-, 13-,and 9-year-olds in the United States in 1981–82. The study incorporated data from studies involving1,955 seventeen-year-olds, 2,025 thirteen-year-olds, and 1,960 nine-year-olds. Loosely speaking,seven of Walberg’s nine factors were used to organize the data. The correlations and effect sizes foreach of the three age groups for each factor are reported in Table 3.2.

25
Table 3.1Summaries of the Relationships of Factors to Achievement
Factor No. of Meta-Analyses
No. ofStudies
No. ofRelationships
Average r AverageESd
1. School 16 781 3,313 .12 .25
2. Social 4 153 1,124 .19 .39
3. Instructor 9 329 1,097 .21 .44
4. Instruction 31 1,854 5,710 .22 .47
5. Pupil 25 1,455 3,776 .24 .47
6. Methods ofInstruction
37 2,541 6,352 .14 .29
7. LearningStrategies
12 714 783 .28 .61
Overall 134 7,827 22,155 .20 .41
Note: Adapted from “Syntheses of Educational Productivity Research,” by B. J. Fraser, H. J. Walberg, W. A.Welch, and J. A. Hattie, 1987, International Journal of Educational Research 11(2) [special issue], p. 207.
r is the Pearson product-moment correlation coefficient; ESd is Cohen’s effect size d.
Table 3.2 Science AchievementCorrelation and Effect Size by Productivity Factor for Three Age Levels
Factor 17-year-olds 13-year-olds 9-year-olds
r ESd r ESd r ESd
Ability .42 .926 .30 .629 .48 1.094
Motivation .27 .561 .23 .473 .25 .516
Quality of Instruction .09 .181 .09 .181 .01 .020
Quantity of Instruction .31 .652 .23 .473 0.00 0.00
Class Environment .23 .473 .25 .516 .14 .283
Home Environment .27 .561 .18 .366 .16 .324
Television –.16 -.324 –.09 -.181 –.10 -.201
Note: Adapted from “Syntheses of Educational Productivity Research,” by B. J. Fraser, H. J. Walberg, W. A.Welch, and J. A. Hattie, 1987, International Journal of Educational Research 11(2) [special issue], p. 220. r is the Pearson product-moment correlation coefficient; ESd stands for Cohen’s effect size d.
26
It is instructive to note that the seven factors used as the organizational framework in Table 3.2 aredefined quite differently from those in Table 3.1. For example, in Table 3.2, quality of instructionis defined as the total budget allocated for science instruction in a school; in Table 3.1, quality ofinstruction, a sub-factor of “Instruction,” addresses specific types of instructional techniques. Thesedifferences in definitions most likely account for the differences in findings reported by Fraser et al.For example, Table 3.2 reports correlations of .09 and .01 for quality of instruction and studentachievement; however, relative to the science achievement findings, the researchers reported anaverage correlation of .47 for quality of instruction and student achievement (see Fraser et al., 1987).
Although the Fraser et al (1987) monograph reported multiple findings, it concluded with an explicitvalidation of Walberg’s productivity model: “Overall, then, the work reported throughout themonograph provides much support for most of the factors in the productivity model in influencinglearning” (p. 230). Although this conclusion probably goes beyond the data reported, the Fraser etal. report was a milestone in the research on those factors that influence student achievement.Specifically, its review of 134 meta-analyses (see Table 3.1) provided some compelling evidence thatthe research literature considered as a whole supports the hypothesis that schools can make adifference in student achievement. This conclusion was made even more explicit by one of thevolume’s authors, John Hattie.
HATTIE
Hattie was one of the coauthors of the Fraser et al. special issue of The International Journal ofEducational Research. Specifically, Hattie was the primary author of the volume’s section entitled“Identifying the Salient Facets of a Model of Student Learning: A Synthesis of Meta-Analyses.” Asdescribed above, this section synthesized the results of 134 meta-analyses and was considered thecenterpiece of the volume.
In 1992, Hattie republished these findings under his own name in an article entitled “Measuring theEffects of Schooling.” However, in this later publication, he more strongly emphasized a number ofsalient findings from the synthesis of the 134 meta-analyses. First, he emphasized the practicalsignificance of the average effect size across the seven factors used to categorize the data (i.e.,school, social, instructor, instruction, pupil, methods of instruction, and learning strategies) from the7,827 studies and 22,155 effect sizes. Hattie explained:
Most innovations that are introduced in schools improve achievement by about .4standard deviations. This is the benchmark figure and provides a standard fromwhich to judge effects — a comparison based on typical, real-world effects ratherthan based on the strongest cause possible, or with the weakest cause imaginable. Ata minimum, this continuum provides a method for measuring the effects ofschooling. (p. 7)
Further, Hattie (1992) decomposed this average effect size into useful components. Specifically,based on Johnson and Zwick’s (1990) analysis of data from the National Assessment of EducationalProgress, Hattie reasoned that one could expect a gain in student achievement of .24 standarddeviations in a school where no innovations were used — in nontechnical terms, one might say thata “regular” school produces an effect size (ESd) of .24. Using the research of Cahen and Davis
27
(1977), Hattie further reasoned that about 42 percent of the effect size of .24 is due simply to studentmaturation. Thus, one could expect a regular school to produce an achievement gain of .14 standarddeviations above and beyond that from maturation (which is .10). Finally, Hattie reasoned that theinnovations identified in his meta-analyses increased achievement by .16 standard deviations aboveand beyond maturation and regular schooling. Hattie was perhaps the first to provide this perspectiveon the effects of maturation versus regular schooling and versus “innovative” schooling.
Hattie (1992) also articulated three major conclusions that could be drawn from his meta-analysis.First, he noted that one theme underlying the findings was that a “constant and deliberate attemptto improve the quality of learning on behalf of the system . . . typically relates to improvedachievement” (p. 8). Second, Hattie explained that “the most powerful, single moderator thatenhances achievement is feedback. The simplest prescription for improving education must be‘dollops of feedback’” (p. 9). Third, Hattie noted that strategies that focus on individualizinginstruction do not have great success: “Most innovations that attempt to individualize instruction arenot noted by success” (p. 9). He further explained that this is particularly disturbing especially inlight of Rosenshine’s (1979) research indicating that students spend about 60 percent of their timeworking alone.
In 1996, Hattie, Biggs, and Purdie published the results of a second meta-analysis that synthesizedthe findings from 51 different studies of instructional practices involving 270 effect sizes. Theprimary, independent variable and, hence, organizer for the meta-analysis was a taxonomy developedby Biggs and Collis (1982). The taxonomy includes four levels of cognitive tasks:
Level 1: Unistructional Tasks: Skills taught in a step-by-step fashion.Level 2: Multistructional Tasks: Skills taught that involve multiple strategies, but
with little or no emphasis on the metacognitive aspects of the processing.Level 3: Relational Tasks: Multiple skills taught with an emphasis on the
metacognitive aspects of the processing.Level 4: Extended Abstract: Multiple skills taught with an emphasis on
application to new domains.
The results of this meta-analysis are summarized in Table 3.3. One obvious inconsistency in thefindings reported in Table 3.3 is the lack of a taxonomic-like pattern in the effect sizes. Specifically,Hattie et al. (1996) hypothesized that the extended abstract tasks would produce greater learning (i.e.,a higher effect size) than the relational tasks, which would produce greater learning than the multi-instructional tasks, which would produce greater learning than the uninstructional task if thetaxonomy were valid. But this is not what they found. The researchers explain these unpredictedfindings as a function of the types of dependent measures that were used as opposed to possibleproblems with the classification system.
Taken together, Hattie’s synthetic efforts contributed significantly to the knowledge base aboutschooling. His re-analysis of the Fraser et al. (1987) data provided a new perspective on the results.The results of the Hattie et al. (1996) meta-analysis also added new insights to the growing researchbase on instructional practices.

28
Table 3.3Summary of Findings From Hattie et al. 1996 Meta-Analysis
Nature of Intervention N ESd
Unistructional 29 .84
Multistructional 16 .45
Relational 34 .22
Extended Abstract 40 .69
Note: Constructed from “Effects of Learning Skills Interventions on Student Learning: A Meta-Analysis,” by J.Hattie, J. Biggs, and N. Purdie, 1996, Review of Educational Research, 66(2), 99–136.
N is the number of studies; ESd stands for Cohen’s effect size d.
WANG, HAERTEL, AND WALBERG
Perhaps the most robust attempt to synthesize a variety of research and theoretical findings on thesalient variables affecting school learning was conducted by Wang, Haertel, and Walberg (1993).The final report on this effort was in an article entitled “Toward a Knowledge Base for SchoolLearning.” This publication became the basis for a number of other publications (e.g., Wang,Reynolds, & Walberg, 1994; Wang, Haertel, & Walberg, 1995). The 1993 Wang et al. articlecombined the results of three previous studies. Although not the first chronologically, the conceptualcenterpiece of the three studies was reported by Wang, Haertel, and Walberg (1990). It involved acomprehensive review of the narrative literature on school learning. The review addressed literaturein both general and special education including relevant chapters in the American EducationalResearch Association’s Handbook of Research on Teaching (Wittrock, 1986), the four-volumeHandbook of Special Education: Research and Practice (Wang, Reynolds, & Walberg, 1987–1991),Designs for Compensatory Education (Williams, Richmond, & Mason, 1986), and the variousannual review series that are reported in education, special education, psychology, and sociology.In total, the synthesis covered 86 chapters from annual reviews, 44 handbook chapters, 20government and commissioned reports, 18 book chapters, and 11 journal articles.
The review encompassed 3,700 references and produced 228 variables identified as potentiallyimportant to school learning. A rating on a 3-point scale was assigned by Wang, Haertel, andWalberg to each citation indicating the strength of the relationship between the variable and schoollearning. The 228 variables were then collapsed into 30 categories, which were grouped into sevenbroad domains: (1) state and district variables, (2) out-of-school contextual variables, (3) school-level variables, (4) student variables, (5) program design variables, (6) classroom instruction, and(7) climate variables.
The second study in the triad was reported by Reynolds, Wang, and Walberg (1992). The studysurveyed 134 education research experts who were first authors of the major annual reviews andhandbook chapters, book chapters, government documents, and journal review articles used in theWang et al. (1990) study. These experts were surveyed and asked to rate the 228 variables on a 4-

29
point Likert scale indicating the influence of each of the 228 variables on student learning. The scaleranged from 3, indicating strong influence on learning, to 2, indicating moderate influence, to 1,indicating little or no influence, to 0, indicating uncertain influence on learning. Forty-six percent(46%) of the experts responded to the survey. Mean scores were calculated for each of the 228variables. These mean ratings were then used to compute the mean ratings for the 30 categories andseven domains formulated in the Wang et al. (1990) study.
The third study in the triad was the six-chapter issue of the International Journal of EducationalResearch by Fraser and his colleagues (1987). As described previously, this study synthesized theresults of 134 meta-analyses. The Wang et al. (1993) study utilized 130 of the 134 meta-analysesalong with the results from six meta-analyses not addressed by Fraser et al. (1987), resulting in a database of 136 meta-analyses. Wang et al. (1993) determined that the 136 meta-analyses addressed only23 of the 30 categories identified in the Wang et al. (1990) and the Reynolds et al. (1990) studies.A weighted mean correlation was computed for each of these 23 variables.
To combine the results from the three studies, the mean ratings for the Wang et al. (1990) contentanalyses, the mean ratings from the education experts survey by Reynolds, Wang, and Walberg(1992), and the weighted mean correlations from the Fraser, Walberg, Welch, and Hattie (1987)study were transformed into Z scores. The Z scores were then transformed into T scores (i.e., scaledscores) with a mean of 50 and a standard deviation of 10.
The 30 variables were then organized into six categories referred to as the six “theoreticalconstructs” by Wang et al. (1993): (1) student characteristics, (2) classroom practices, (3) home andcommunity education context, (4) design and delivery of curriculum and instruction, (5) schooldemographics, culture, climate, policies and practices, and (6) state and district governance andorganizations. Average T scores were calculated for each of these six theoretical constructs. Theseare listed in Table 3.4.
Table 3.4T Scores for Wang et al.’s (1993) Theoretical Constructs
Theoretical Construct Average T score
Student characteristics 54.7
Classroom practices 53.3
Home and community educational contexts 51.4
Design and delivery of curriculum and instruction 47.3
School demographics, culture, climate, policies & practices 45.1
State and district governance 35.0
Note: See “Toward a Knowledge Base for School Learning,” by M. C. Wang, G. D. Haertel, and H. J. Walberg,1993, Review of Educational Research, 63(3), p. 270.
30
Average T scores also were computed for the 30 variables that made up the six theoretical constructs.The top five variables in descending order of importance as defined by their T-score values were
• classroom management• student use of metacognitive strategies• student use of cognitive strategies• home environment and parental support• student and teacher social interactions
The five variables with the weakest relationship to school learning as defined by their T-score valueswere
• program demographics• school demographics• state and district policies• school policy and organization• district demographics
Based on the composite findings, Wang, Haertel, and Walberg concluded that “proximal” variables— those closest to students — have a stronger impact on school learning than do “distal” variables— those somewhat removed from students. Given the breadth of the effort, the Wang et al. (1993)study is frequently cited in the research literature as a state-of-the-art commentary on the variablesthat affect student achievement.
LIPSEY AND WILSON
In 1993, psychologists Lipsey and Wilson conducted a meta-analysis of 302 studies that cut acrossboth education and psychotherapy. Their purpose was to provide an overview of the effects ofvarious categories of educational and psychological interventions on a variety of outcomes. Theresults for the various subcategories in education are reported in Table 3.5.
The mean effect size (ESd) across all studies (education and psychology) was .50 (SD = .29, N = 302studies, 16,902 effect sizes). It is interesting to note that this average effect size is relatively closeto that reported of .40 by Hattie in 1992. The relatively large average effect size was considered sostriking by Lipsey and Wilson that it led them to comment: “Indeed, the effect size distribution isso overwhelmingly positive that it hardly seems plausible that it presents a valid picture of theefficacy of treatment per se” (p. 1192).
Perhaps the biggest contribution of the Lipsey and Wilson meta-analysis was its detailed examinationof a variety of moderator variables commonly addressed in meta-analyses. Specifically, Lipsey andWilson analyzed the differential effects on the interpretation of effect sizes of (1) methodologicalquality, (2) publication bias, and (3) small sample bias.

31
Table 3.5Findings from Education Studies
Studies N Average ESd
1.0 General Education, K–12 and College
1.1 Computer aided/based instruction 622 0.362
1.2 Programmed or individualized instruction 724 0.296
1.3 Audio and visual based instruction 215 0.339
1.4 Cooperative task structures 414 0.629
1.5 Student tutoring 430 0.821
1.6 Behavioral objectives, reinforcement, cues, feedback, etc. 204 0.546
1.7 Other general education 546 0.327
2.0 Classroom Organization/Environment
2.1 Open classroom vs. traditional 295 -0.056
2.2 Class size 213 0.295
2.3 Between and within class ability grouping 224 0.119
2.4 Other classroom organization/environment 20 0.476
3.0 Feedback to Teachers 218 0.776
4.0 Test Taking
4.1 Coaching programs for test performance 210 0.275
4.2 Test anxiety 674 0.649
4.3 Examiner 22 0.35
5.0 Specific Instructional or Content Areas
5.1 Science and math instruction 1769 0.310
5.2 Special content other than science and math 697 0.497
5.3 Preschool and special education; developmental disabilities
5.3.1 Early Intervention for disadvantaged or handicapped 293 0.445
5.3.2 Special education programs or classrooms 277 0.503
5.3.3 Perceptual-motor and sensory stimulation treatment 318 0.264
5.3.4 Remedial language programs and bilingual 154 0.587
5.3.5 Other special education 265 0.731
5.4 Teacher training
5.4.1 In-service training for teachers 464 0.593
5.4.2 Practice or field experience during teacher training 85 0.184
6.0 Miscellaneous Educational Interventions 635 0.487
Note: Constructed from data in “The Efficacy of Psychological, Educational, and Behavioral Treatment,” by M.W. Lipsey and D. B. Wilson, 1993, American Psychologist, 48(12), 1181–1209. N is the number of studies. ESdstands for Cohen’s effect size d.

32
It is frequently assumed that studies that use more rigorous research designs will have lower effectsizes since they control for systematic variation not of experimental interest that might inflate effectsize estimates. However, Lipsey and Wilson found that there is no difference (i.e., statisticallysignificant differences) between effect sizes from studies rated high in methodological quality versusthose rated low. Neither were there differences in effect sizes for studies that used randomassignment to experimental and control groups versus those that use nonrandom assignments.However, there was a .29 differential between effect sizes that were computed from comparison ofexperimental versus control groups and those from one-group, pre-post test designs with the latterdesign having the larger effect size.
Another factor that is thought to inflate effect size estimates in the context of a meta-analysis issystematic differences between studies that are published versus those that are not published. Thegeneral assumption is that studies with statistically significant effect sizes will be published; thosethat do not report significant effect sizes will not. Therefore, if a meta-analysis samples only thosestudies that are published, the sample will be biased upwards, producing artificially high effect sizes.Lipsey and Wilson found that within their sample, published studies yielded mean effect sizes thataveraged .4 SDs larger than unpublished studies. They noted that “it is evident, therefore, thattreatment effects reported in published studies are indeed generally biased upward relative to thosein unpublished studies” (p. 1195).
The third moderator variable studied by Lipsey and Wilson was sample size. It has beendemonstrated conceptually that mean effect sizes based on small samples are biased upward as astatistical estimator of the population effect size means (see Hedges & Olkin, 1985). Consequently,the mean effect size in a meta-analysis that includes a high proportion of studies that use a smallsample size might have a bias toward overestimation. To study this statistical phenomenon, Lipseyand Wilson compared the average effect size for studies with less than 50 subjects and those withmore than 50 subjects. No significant difference was found between these two means, indicating thatsmall sample bias was not operating in their study.
Although the Lipsey and Wilson study is not commonly cited in the research literature in education,it is a valuable addition to the research base. First, it added significantly to the mounting body ofevidence that schools can make a difference. Also, it helped establish meta-analysis as a viable toolfor synthesizing the research on schooling.
COTTON
Cotton’s (1995) study was one of the most comprehensive of narrative reviews in that it includedover 1,000 citations. Narrative reviews are much more inductive and qualitative in nature than aremeta-analytic reviews. Where meta-analytic reviews rely on interpretations of mathematical averagesof effect sizes computed for each study, narrative reviews rely on interpretations of the subjectiveconclusions from the studies that are being synthesized. In spite of the fact that narrative reviewshave been shown to be subject to considerable error in their interpretation of findings (see Cooper& Rosenthal, 1980), they are still far more common than meta-analytic reviews of schooling.
Cotton’s review identified variables associated with student achievement at the classroom level, theschool level, and the district level. The major variables associated with these three levels are

33
summarized in Table 3.6. For each of the variables reported in Table 3.6, Cotton listed more specificelements. For example, in the school-level variable of “leadership and school improvement,” Cottonlists the following subcomponents:
1. Leaders undertake school restructuring efforts as needed to attain agreed-upongoals for students. . . .
2. Strong leadership guides the instructional program. . . .3. Administrators and other leaders continually strive to improve instructional
effectiveness. (pp. 28–29)
Table 3.6Three Levels of Variables in Cotton’s Review
Classroom-level variables:& planning and setting goals& classroom management and organization& instruction& teacher-student interactions& equity& assessment
School-level variables:& planning and learning goals& school management and organization& leadership and school improvement& administrator-teacher-student interactions& equity& assessment& special programs& parent and community involvement
District-level variables:& leadership and planning& curriculum& district-school interaction& assessment
Note: See Effective Schooling Practices: A Research Synthesis. 1995 Update, by K. Cotton, 1995, SchoolImprovement Research Series. Portland, OR: Northwest Regional Educational Laboratory.
Within these subcomponents, Cotton identifies even more specific characteristics. For example, thefollowing characteristics are listed under the first subcomponent:
Administrators and other leaders
� Review school operations in light of agreed-upon goals for student performance.� Work with school-based management team members to identify any needed
changes (in organization, curriculum, instruction, scheduling, etc.) to support

2 The specifics of HLM and how it might be used are discussed in some depth in Chapter 7 and, therefore,will not be addressed here.
34
attainment of goals for students.� Identify kinds of staff development needed to enable school leaders and other
personnel to bring about desired changes.� Study restructuring efforts conducted elsewhere for ideas and approaches to use
or adapt.� Consider school contextual factors when undertaking restructuring efforts factors
such as availability of resources, nature of incentive and disincentives, linkageswithin the school, school goals and priorities, factions and stresses among thestaff, current instructional practices, and legacy of previous innovations. (p. 28)
Cotton’s review is certainly impressive in its breadth. One criticism of the review, however, is thatit does little to synthesize the research findings into manageable units. To illustrate, at the classroomlevel over 160 elements are listed, at the school level over 220 elements are listed, and at the districtlevel over 50 elements are listed. Such a daunting list does little for district-, school-, or classroom-level educators seeking to make meaningful change. Another shortcoming of the Cotton review isthat it provides no explanation of how categories are formed and how components andsubcomponents in each category are identified. Additionally, Cotton offers no discussion of thefrequency with which the various elements she identifies are cited in the 1,000-plus references thataccompany the review.
SCHEERENS AND BOSKER
One of the most quantitatively sophisticated reviews of the research literature on factors influencingstudent achievement is that conducted by Scheerens and Bosker (see Scheerens & Bosker,1997;Scheerens, 1992; Bosker, 1992; Bosker & Witziers, 1995, 1996). The overall mathematical modelused to organize the research was a hierarchical linear model (HLM).2 The centerpiece of Scheerensand Bosker’s work was a meta-analysis of an international literature base of the effects of ninefactors on student achievement:
1. Cooperation: The extent to which staff members in a school supported one another,sharing resources, ideas, and problem solutions.
2. School Climate: The extent to which the school has an achievement-oriented culture andmaintains order in a positive manner.
3. Monitoring: The extent to which the school seeks out and uses feedback relative towhether it is accomplishing its academic goals.
4. Content Coverage: The extent to which the school monitors the coverage of theidentified curriculum.
5. Homework: The extent to which the school articulates and implements a homeworkpolicy.
6. Time: The amount of time a school allots for instruction.7. Parental Involvement: The extent to which parents are involved in the functions of the
school.

35
8. Pressure to Achieve: The extent to which the school communicates a strong message thatacademic achievement is a primary goal.
9. Leadership: The extent to which the school has strong leadership relative to the goal ofacademic achievement.
The specific effect sizes associated with these factors will be discussed in Chapter 4 in some depthand, thus, are not reported here. Suffice it to say that the Scheerens and Bosker study provides themost rigorous analysis of the research on these variables to date. In addition to thoroughly discussingthe nine factors just summarized, Scheerens and Bosker summarized the research from qualitativereviews, international analyses, and research syntheses on a number of school-level factors that affectachievement. This review is presented in Table 3.7. The synthesis reported in Table 3.7 is uniquein that it offers a comparison of qualitative syntheses with quantitative syntheses. Of particular noteis the pattern of support across all three literature bases for academic pressure to achieve, parentalinvolvement, orderly climate, and opportunity to learn.
CREEMERS
Using a narrative approach, Creemers (1994) synthesized much of the same research that Scheerensand Bosker synthesized. Creemers used the model shown in Figure 3.2 as the basic organizingscheme for his synthesis. He refers to this as the basic model of “educational effectiveness.” Withinthis general model, Creemers focused attention on quality of instruction. He offered the synthesisof research reprinted in Table 3.8.
Creemers’ coding of instructional strategies in terms of strong empirical evidence, moderatelyempirical evidence, and plausible empirical evidence makes for a rather straightforwardinterpretation of the classroom-level variables he identifies. Unfortunately, he offers little or noexplanation for his codings even though some seem to fly in the face of current research andconventional wisdom. For example, in Table 3.8 cooperative learning has an overall rating ofplausible only. However, a meta-analysis by Johnson et al. (1981) indicates that cooperative learninghas an average effect size (ESd) of .73 which is considered high moderate to large (Cohen, 1988).With these problems acknowledged, it is only fair to state that Creemers’ work is probablyconsidered the most comprehensive analysis of the research on instruction to date.
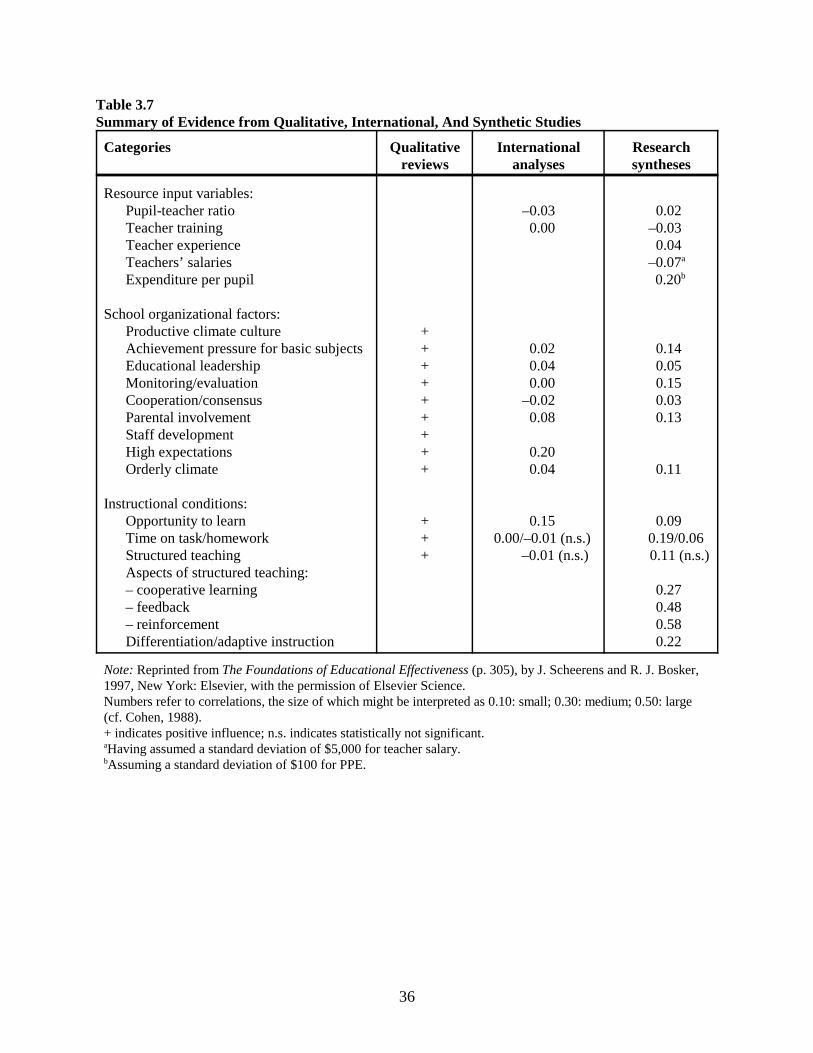
36
Table 3.7Summary of Evidence from Qualitative, International, And Synthetic Studies
Categories Qualitativereviews
Internationalanalyses
Researchsyntheses
Resource input variables:Pupil-teacher ratioTeacher trainingTeacher experienceTeachers’ salariesExpenditure per pupil
School organizational factors:Productive climate cultureAchievement pressure for basic subjectsEducational leadershipMonitoring/evaluationCooperation/consensusParental involvementStaff developmentHigh expectationsOrderly climate
Instructional conditions:Opportunity to learnTime on task/homeworkStructured teachingAspects of structured teaching:– cooperative learning– feedback– reinforcementDifferentiation/adaptive instruction
+++++++++
+++
–0.03 0.00
0.02 0.04 0.00–0.02 0.08
0.20 0.04
0.15 0.00/–0.01 (n.s.) –0.01 (n.s.)
0.02 –0.03 0.04
–0.07a
0.20b
0.14 0.05 0.15 0.03 0.13
0.11
0.09 0.19/0.06
0.11 (n.s.)
0.27 0.48 0.58 0.22
Note: Reprinted from The Foundations of Educational Effectiveness (p. 305), by J. Scheerens and R. J. Bosker,1997, New York: Elsevier, with the permission of Elsevier Science.Numbers refer to correlations, the size of which might be interpreted as 0.10: small; 0.30: medium; 0.50: large(cf. Cohen, 1988). + indicates positive influence; n.s. indicates statistically not significant.aHaving assumed a standard deviation of $5,000 for teacher salary.bAssuming a standard deviation of $100 for PPE.

37
QualityTime
Opportunity
QualityTime
Opportunity
Quality of Instruction& curriculum& grouping procedures& teacher behaviour
Context
School
Classroom
Student
Figure 3.2. The basic model of educational effectiveness.
Note: From The Effective Classroom (p. 27), by B. P. M. Creemers, 1994, London: Cassell. Reprinted with permission.
Time for learningOpportunity to learn
Time on taskOpportunities used
StudentAchievement
Motivation
AptitudesSocial background

38
Table 3.8Overview of Empirical Evidence for the Characteristics of Effective Instruction
CharacteristicsStrong
empiricalevidence
Moderateempiricalevidence
Plausible
CurriculumGrouping proceduresTeacher behaviour
CurriculumExplicitness and ordering of goals and contentStructure and clarity of contentAdvance organizersEvaluationFeedbackCorrective instruction
Grouping proceduresMastery learningAbility groupingCooperative learning
Differentiated materialEvaluationFeedbackCorrective instruction
Teacher behaviourManagement/orderly and quiet atmosphereHomeworkHigh expectationsClear goal setting
Restricted set of goalsEmphasis of basic skillsEmphasis on cognitive learning and transfer
Structuring the contentOrdering of goals and contentAdvance organizersPrior knowledge
Clarity of presentationQuestioningImmediate exerciseEvaluationFeedbackCorrective instruction
xx
x
xxx
x
x
xx
x
x
x
x
x
x
xx
xxxx
xx
xx
x
x
x
xx
x
x
Note: From The Effective Classroom (p. 94), by B. P. M. Creemers, 1994, London: Cassell. Reprinted withpermission.

39
THREE CATEGORIES OF VARIABLES
From the discussion in this chapter and the preceding chapter, it should be evident that there aremultiple ways to organize the research on variables that affect student achievement. However, oneorganizational pattern does seem to cut across a multitude of studies. Specifically, the followingthree categories appear to be implicit or explicit in a variety of studies: (1) school-level variables,(2) teacher-level variables, and (3) student-level variables. To illustrate, Table 3.9 summarizes theextent to which a number of popular models utilize these categories.
Table 3.9Three Categories of Variables
Study School Level Teacher Level Student Level
Elberts & Stone (1988) I E E
Carroll (1963, 1989) I E E
Rowe, Hill & Holmes-Smith (1993) E E E
Walberg (1984) I E E
Scheerens (1990) E E E
Creemers (1994) E E E
Scheerens & Bosker (1997) E E E
Cotton (1995) E E E
Wright, Horn, & Sanders (1997) E E E
van der Werf (1997) E E E
Goldstein (1997) I E E
Raudenbush & Bryk (1988) E E E
Raudenbush & Willms (1995) E E E
Note: E indicates that the categories were explicitly used in the study; I indicates that the three categories wereimplicit.
As Table 3.9 shows, all of the 13 studies reviewed explicitly use the teacher and student levels asprimary organizers for the variables affecting student achievement. In addition, 9 out of the13explicitly use the school level as a primary organizer, and the remaining 4 use the school levelimplicitly as an organizer. Given the wide acceptance of these levels as organizers, they areemployed in the remainder of this monograph.
Both the school effectiveness research reviewed in Chapter 2 and the quantitative and qualitativesynthesis reviewed in this chapter support the hypothesis that certain identifiable variables have asignificant impact on student achievement. In Part II, the variables specific to schools, teachers, andstudents are reviewed with an eye to their unique effects and their composition.


PART II:RESEARCH ON SCHOOL,
TEACHER, AND STUDENT EFFECTS

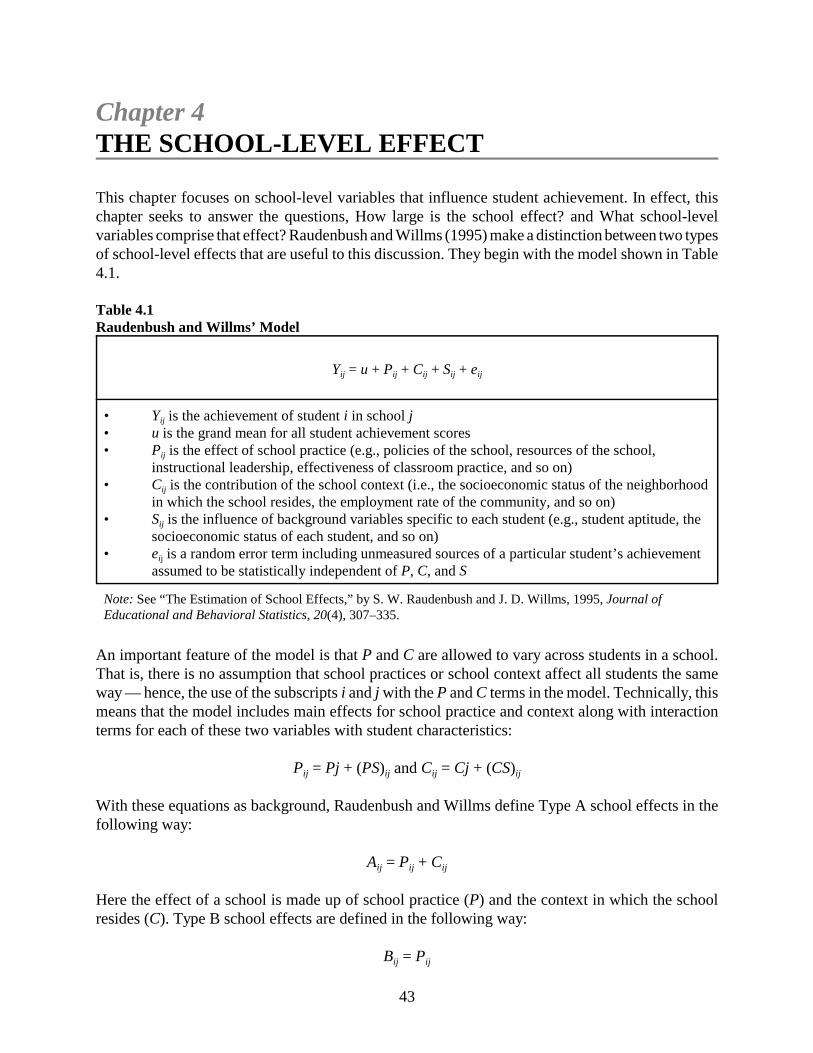
43
Chapter 4THE SCHOOL-LEVEL EFFECT
This chapter focuses on school-level variables that influence student achievement. In effect, thischapter seeks to answer the questions, How large is the school effect? and What school-levelvariables comprise that effect? Raudenbush and Willms (1995) make a distinction between two typesof school-level effects that are useful to this discussion. They begin with the model shown in Table4.1.
Table 4.1Raudenbush and Willms’ Model
Yij = u + Pij + Cij + Sij + eij
• Yij is the achievement of student i in school j• u is the grand mean for all student achievement scores• Pij is the effect of school practice (e.g., policies of the school, resources of the school,
instructional leadership, effectiveness of classroom practice, and so on)• Cij is the contribution of the school context (i.e., the socioeconomic status of the neighborhood
in which the school resides, the employment rate of the community, and so on)• Sij is the influence of background variables specific to each student (e.g., student aptitude, the
socioeconomic status of each student, and so on) • eij is a random error term including unmeasured sources of a particular student’s achievement
assumed to be statistically independent of P, C, and S
Note: See “The Estimation of School Effects,” by S. W. Raudenbush and J. D. Willms, 1995, Journal ofEducational and Behavioral Statistics, 20(4), 307–335.
An important feature of the model is that P and C are allowed to vary across students in a school.That is, there is no assumption that school practices or school context affect all students the sameway — hence, the use of the subscripts i and j with the P and C terms in the model. Technically, thismeans that the model includes main effects for school practice and context along with interactionterms for each of these two variables with student characteristics:
Pij = Pj + (PS)ij and Cij = Cj + (CS)ij
With these equations as background, Raudenbush and Willms define Type A school effects in thefollowing way:
Aij = Pij + Cij
Here the effect of a school is made up of school practice (P) and the context in which the schoolresides (C). Type B school effects are defined in the following way:
Bij = Pij
44
Here, only the effects of school practice are considered. The differences between Type A and TypeB effects are not trivial since one (Type A) includes the influence of environmental factors onstudent achievement, while the other does not. Although for many studies reviewed in this chapterit is difficult to ascertain specifically which type of school effect (i.e., A or B) has been addressed,in general it is safer to assume that discussions in the remainder of this chapter address Type Aeffects.
HOW LARGE IS THE SCHOOL EFFECT?
In Chapter 1 it was noted that the Coleman et al. (1966) study established the fact that schoolsaccount for about 10 percent of the variance of within-school achievement. Since then, a number ofstudies have attempted to identify the unique contribution of schools to student achievement. Theresults of some of the most prominent of these studies are reported in Table 4.2. In this section, notevery study reported in Table 4.2 will be commented on — only those that have characteristics thatprovide a unique perspective on the effects of schools on student achievement.
The Coleman and Jencks reports are, of course, the studies of the effects of schooling that initiallysparked an interest in (or, perhaps, the controversy over) the net impact of schooling. As mentionedin Chapter 1, the Jencks report used data collected for the Coleman report. Inspection of Table 4.2indicates that these studies generated the lowest estimates of the effect size for schools. Thisdiscrepancy has been discussed in depth by Madaus, Kellaghan, Rakow, and King (1979). They notethat although Coleman et al. had access to student scores on standardized tests of achievement ingeneral information, reading, and mathematics, they used a general measure of verbal ability as theprimary dependent measure. Additionally, this test primarily focused on vocabulary. This selectionwas made because Coleman and his colleagues found that the variation between schools was slightlygreater for aptitude tests (i.e., verbal ability) than it was for achievement tests, thus providing“indirect evidence that variations among schools have as much or more effect on the ability scoresas on achievement test scores” (p. 293). This use of general verbal aptitude as the primary dependentmeasure established a situation in which student background variables were highly likely to showmuch stronger relationships than were school-level variables. As explained by Madaus et al. (1979):
Despite these difficulties with standardized tests, the construct “verbal ability” in theColeman study has become equated with “school achievement” and the results havebeen generalized to the now popular myth that school facilities, resources, personnel,and curricula do not have a strong independent effect on achievement. Coleman’sfindings have been interpreted in the widest and most damaging possible sense,perhaps because verbal ability is considered so important, perhaps because of thetendency of social scientists to lose sight of the limits of their measures and to talkin broader and more commonly understood terms, and finally, perhaps because themedia and public feel the need to simplify complex studies. To assert that schoolsbring little influence to bear on a child’s general verbal ability that is independent ofhis background and general social context is not the same as asserting that schoolsbring little influence to bear on pupils’ achievement in a specific college preparatoryphysics course. We might hope that schools would have some independent influenceon general verbal ability. But the fact that home background variables seem to bevastly more influential in explaining verbal ability should not preclude or cloud any

45
expectations we have that schools should have some independent effect on traditionalcurriculum areas which are systematically and explicitly treated as part of theinstructional process. (p. 210)
In short, Coleman’s choice of verbal ability as the primary dependent measure probably resulted inan underestimate of the effects of schooling on student achievement.
The effect size estimate by Byrk and Raudenbush (1992) is noteworthy in that it utilized acomparison between Type A and Type B effects. Using HLM on mathematics achievement data from7,185 students nested in 160 schools, Byrk and Raudenbush estimated that school-level variablesaccount for 18 percent of the variance (r = .42) in student achievement when the following modelis used:
Yij = Boj + rij
Here, Yij is the achievement score for student i in school j. Boj is the average score for school j, andrij represent all those other factors that affect student achievement. In other words, the Byrk andRaudenbush model partials out all factors other than the school effect size into a large residualcategory (i.e., rij). However, when the average SES of schools was entered into the equation that hasschool mean as the outcome, Byrk and Raudenbush found that 69 percent of the variance isaccounted for by SES. One might interpret this as an estimate of the Type B school effect since theaverage SES of students might be considered a good proxy measure of school context. If this is thecase, then it indicates that Type B effects might be significantly lower than Type A. However,Teddlie, Reynolds, and Sammons (2000) provide evidence that certain HLM models can severelyunderestimate school-level effects. Specifically, they cite the HLM convention of “shrinking”residual values toward the mean as problematic from an interpretational perspective (p. 106).
Scheerens and Bosker (1997) provide still another perspective on the estimate of school effects.Using data from Bosker and Witziers (1995), they partitioned the school effects into two broadcategories: gross effects and net effects. The gross school effects were based on the meanachievement scores for schools without corrections for any background variables such as SES ofstudents, ethnicity, aptitude, and the like. Net school effects were based on the means of schools afterthe variance due to background variables had been accounted for. To determine the average grossand net school effects, Scheerens and Bosker examined findings from studies at the elementary andsecondary levels that cut across three subject areas (language arts, mathematics, and science) inmultiple countries (e.g., Netherlands, UK, other European countries, other industrialized countries,third-world countries). Using HLM, they examined the influences of studies and replications ongross and net school effects. (See Note 1 at the end of this chapter.) The percentage of varianceaccounted for by school membership for the gross school effect was 18.6. The percentage of varianceaccounted for by school membership for the net school effect was 8.4. However, when corrected forrandom “noise,” the estimate of net school effect was raised to 11 percent.

46
Table 4.2Summary of Studies on the Effect of Individual Schools on Student Achievement
Study ESd P gain PV
Coleman et al. (1966) .68.80
2529
10.3813.89
Jencks et al. (1972) .47.56
1821
5.297.29
Byrk & Raudenbush (1992) .93 32 18.00
Scheerens & Bosker (1997) .70 26 11.00
Rowe & Hill (1994) 1.32 40 30.00
Creemers (1994) 1.01 34 20.00
Stringfield & Teddlie (1989) 1.16 37 25.00
Bosker (1992) 1.19 38 26.00
Luyten (1994) .85 30 15.00
Madaus et al. (1979) 1.04 35 21.84
� (Q = 24.53, df = 9, p < .05) .96 33 18.49
� with outliers removed(Q = 12.2, df = 7, p > .05)
1.01 34 20
Note: Quantities were computed using data found in each of the studies listed in this table. Quantities werecomputed beginning with the r reported in each study. These were transformed to Zr and an average wascomputed. The average Zr was then transformed back to r. (See Note 4 at the end of this chapter for anexplanation of how Zr was computed.) The PV, ESd, and P gain were then computed from this average r. The twoeffect sizes from the Coleman and Jencks studies were each given a weight of .5 when computing the average r.All other r’s were given a weight of 1.r is the Pearson product-moment correlation; PV is percentage of variance explained; ESd is Cohen’s d; P gain ispercentile gain of experimental group. A Q statistic with p < .05 was interpreted as an indication that one or morecorrelations in the set were outliers. These outliers were identified using procedures described by Hedges andOlkin (1985). The Q statistic with outliers removed was then computed.
The effect size reported by Rowe and Hill (1994) is certainly much higher than most others reportedin Table 4.2. This is probably because the dependent measures used in the Rowe and Hill study wereexperimenter-designed, open-ended tasks. The significance of the use of experimenter-designeddependent measures is discussed in more depth in the next section. Briefly, though, as discussedbelow, a strong case can be made that studies using experimenter-designed assessments mightprovide more valid estimates of school-level effects than do studies employing standardizedassessments.

47
The school effect size estimate by Madaus et al. (1979) is unique because of its comparison of schooleffect size estimates based on standardized tests versus school effect estimates based on curriculum-specific assessments. Using data from Irish high schools, researchers were able to estimate theunique and common variance of a number of school-level variables and student-level variables. (SeeNote 2 at the end of the chapter for a discussion of the manner in which the effect size for this studywas computed.) This was done using two sets of dependent measures — one set used standardizedtests, the other used curriculum-specific tests designed to measure the content specific to thecurriculum. The effect size reported in Table 4.2 is that computed using the curriculum-specificassessments. The Madaus et al. school effect size computed using standardized tests was ESd = .595,PV = 8.07, which is considerably smaller than that using curriculum-specific assessments. Thisdiscrepancy led Madaus et al. to note:
Our findings provide strong evidence for the differential effectiveness of schools:differences in school characteristics do contribute to differences in achievement. Theextent to which these differences can be detected is determined by the measure used.Examinations geared to the curricula of schools are more sensitive indicators ofschool performance than are conventional norm-referenced standardized tests. (p.223)
The effect sizes reported in Table 4.2 lead to a different perspective on the effects of schools fromthat reported in the Coleman and Jencks reports. Specifically, the average effect size computed fromTable 4.2 can be regarded as a viable estimate of the population effect size for schools. That averageESd is.96 with an associated P gain of 33 and PV of 18.49. However, Hedges and Olkin (1985) notethat one might first ascertain the homogeneity (or lack thereof) of the set from which the averageeffect size is computed. If there are outliers in the set, the average will be biased in the direction ofthe outliers. Hedges and Olkin offer the Q statistic as an indicator of the homogeneity of effect sizesfrom which a given average effect size is computed. The Q statistic is distributed as chi square with(k-1) degrees of freedom where k is the number of effect sizes in the set. A significant (e.g., p < .05)statistic indicates that one or more elements of the set are outliers. Possible outliers can then beidentified and removed until the Q statistic falls below the level of significance. As shown in Table4.2, the Q statistic computed for the average ESd of .96 is significant (p < .05). When outliers areremoved, the newly computed average ESd is 1.01 with an associated P gain of 34 and PV of 20.00.Again, the binomial effect size display (BESD) provides a useful way of interpreting this finding.The BESD of the new school effect size estimate is shown in Table 4.3.
Table 4.3 provides a practical interpretation of the new effect size estimate. Specifically, when thePV of schools is assumed to be 20.00, it implies that the percentage of students who would pass astate-level test (for which the expected passing rate is 50 percent) is 72.36 percent for effectiveschools versus 27.64 percent for ineffective schools, for a differential of 44.72 percent. This is nota trivial difference, especially for the 44.72 percent of students.

48
Table 4.3Binomial Effect Size Display With School Accounting for 20% of Variance (r = .447)
Group Outcome %
%Success %Failure Total
Effective Schools 72.36% 27.64% 100%
Ineffective Schools 27.64% 72.36% 100%
Note: r stands for the Pearson product-moment correlation coefficient.
The Case for Even Larger School-Level Effects
In this section an argument is presented that the effect of some schools might be even larger than thatreported in Table 4.3. The assertion here is that the updated PV of 20 percent and its related effectsize (ESd) of 1.01 might be an underestimate of the school effect, at least in some situations. Threelines of evidence support this assertion.
First, as Klitgaard and Hall (1974) argue, studies such as those reported in Table 4.2 focus on theaverage effect size of all schools in a given sample. Focusing on the average effect size ignores thefact that some schools will have effect sizes much larger than the average (and some schools willhave effect sizes much smaller). As Klitgaard and Hall explain, even if one identifies the averageeffect size in the population, there still will be some highly effective schools whose effect sizes aremuch larger than the average.
To illustrate this point, it is useful to translate the average ESd of 1.01 reported in Table 4.2 into itsequivalent correlation. Using the formula reported in Table 1.3, we compute the equivalent r to be.45. In other words, we can say that the average correlation of the studies reported in Table 4.2 is .45.Again, this is an average within a distribution of correlations. Knowledge of the variance of thatdistribution would provide us with information with which to estimate the extremes of thedistribution.
One of the best estimates of the variance in the population of correlations from which the studies inTable 4.2 were chosen is that computed by Scheerens and Bosker. That variance is .0114. (See Note3 at the end of this chapter.) If we assume that the correlations in the population of schools aredistributed normally, then we can expect some schools to have correlations that are three standarddeviations (or more) above the mean. In this case, the estimated standard deviation of the populationof correlations is .1068 (i.e., �.0114). Consequently, one would expect some schools to havecorrelations three standard deviations above the mean, or .77 (.45 + .32). Reasoning from thisperspective, one might make a case that the most effective of schools in the population could accountfor as much as 59.29 percent of the variance in student achievement (.772x100 = 59.29).
A second line of evidence to consider when examining the effect sizes in Table 4.2 is the fact thatthe dependent measures employed most commonly in these studies were some form of externalstandardized test. As mentioned previously, Madaus (Madaus et al., 1979; Madaus et al., 1980) hasdetailed the problems with this practice in terms of measuring the effectiveness of schools. Madaus
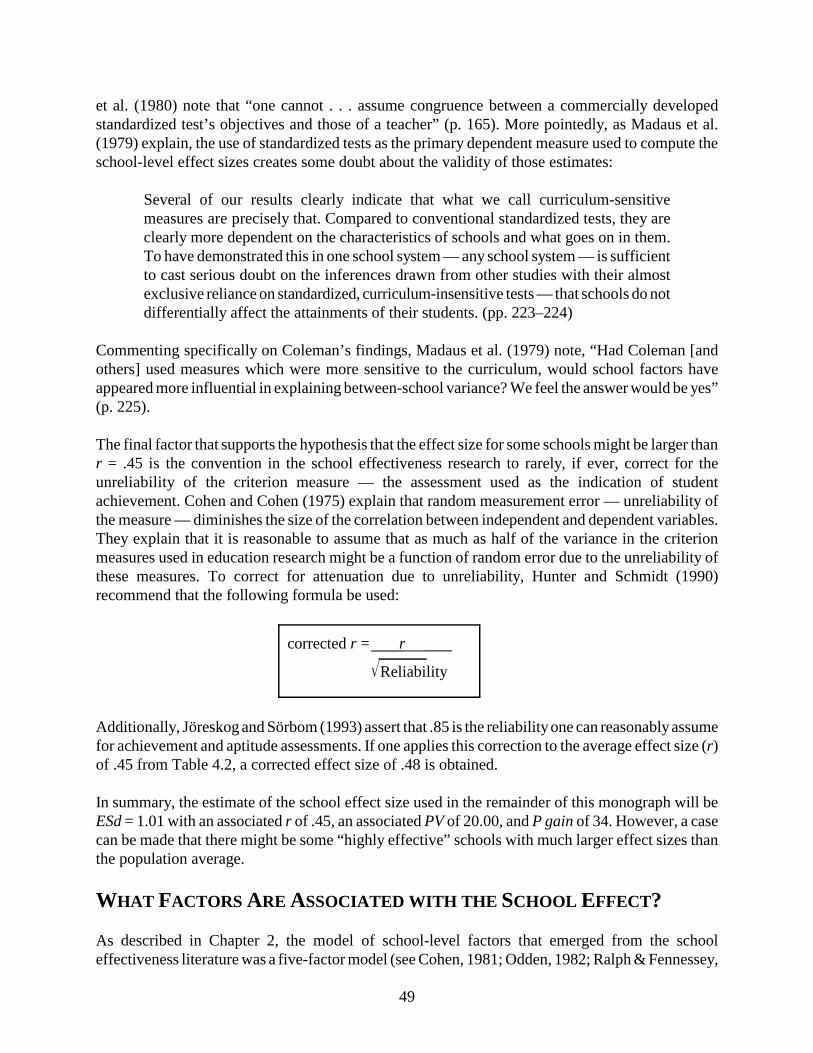
49
et al. (1980) note that “one cannot . . . assume congruence between a commercially developedstandardized test’s objectives and those of a teacher” (p. 165). More pointedly, as Madaus et al.(1979) explain, the use of standardized tests as the primary dependent measure used to compute theschool-level effect sizes creates some doubt about the validity of those estimates:
Several of our results clearly indicate that what we call curriculum-sensitivemeasures are precisely that. Compared to conventional standardized tests, they areclearly more dependent on the characteristics of schools and what goes on in them.To have demonstrated this in one school system — any school system — is sufficientto cast serious doubt on the inferences drawn from other studies with their almostexclusive reliance on standardized, curriculum-insensitive tests — that schools do notdifferentially affect the attainments of their students. (pp. 223–224)
Commenting specifically on Coleman’s findings, Madaus et al. (1979) note, “Had Coleman [andothers] used measures which were more sensitive to the curriculum, would school factors haveappeared more influential in explaining between-school variance? We feel the answer would be yes”(p. 225).
The final factor that supports the hypothesis that the effect size for some schools might be larger thanr = .45 is the convention in the school effectiveness research to rarely, if ever, correct for theunreliability of the criterion measure — the assessment used as the indication of studentachievement. Cohen and Cohen (1975) explain that random measurement error — unreliability ofthe measure — diminishes the size of the correlation between independent and dependent variables.They explain that it is reasonable to assume that as much as half of the variance in the criterionmeasures used in education research might be a function of random error due to the unreliability ofthese measures. To correct for attenuation due to unreliability, Hunter and Schmidt (1990)recommend that the following formula be used:
Additionally, Jöreskog and Sörbom (1993) assert that .85 is the reliability one can reasonably assumefor achievement and aptitude assessments. If one applies this correction to the average effect size (r)of .45 from Table 4.2, a corrected effect size of .48 is obtained.
In summary, the estimate of the school effect size used in the remainder of this monograph will beESd = 1.01 with an associated r of .45, an associated PV of 20.00, and P gain of 34. However, a casecan be made that there might be some “highly effective” schools with much larger effect sizes thanthe population average.
WHAT FACTORS ARE ASSOCIATED WITH THE SCHOOL EFFECT?
As described in Chapter 2, the model of school-level factors that emerged from the schooleffectiveness literature was a five-factor model (see Cohen, 1981; Odden, 1982; Ralph & Fennessey,
corrected r = r
�Reliability

50
1983) that included the following:
1. Strong administrative leadership2. A safe and orderly climate3. An emphasis on basic academic skills4. High expectations for student achievement5. A system for monitoring pupil performance
Although the five correlates have intuitive appeal, their validity has been challenged. Commentingon these five factors, Willms (1992) notes:
However, much of the literature on school process has been based on smallcomparative studies or ethnographies of exceptional schools. Critics claimed that themethods employed in these studies did not meet the standards of social scienceresearch; most studies did not control adequately for the background characteristicsof students. . . . Although the five-factor model has considerable face validity, theempirical evidence that these factors are more important then some other set offactors is not compelling. (p. 327)
What, then, are the school-level variables that research indicates are most strongly related to studentachievement and to what extent do they correspond to the “correlates?” Although the answers tothese questions are still somewhat elusive, there is more of a research base with which thesequestions might be answered than there was in the 1970s. As mentioned in Chapter 3, the mostquantitatively rigorous study to date of school variables was the meta-analysis by Scheerens andBosker (1997), which built on previous studies by Bosker and Witziers (Bosker & Witziers, 1996;Witziers & Bosker, 1997). Given its breadth and rigor, it will be used as the basis for consideringschool-level variables.
Scheerens and Bosker utilized HLM to analyze the effect sizes. This allowed for the estimation ofvariance within studies and across studies (see Note 1 at the end of this chapter). The generalfindings reported by Scheerens and Bosker for school-level variables are summarized in Table 4.4.
In this section, we consider eight of these factors in more depth as possible candidates for the criticalvariables that constitute the school-level effect. More specifically, homework is excluded from thediscussion here. It will be considered in Chapter 5 because research indicates that it is more of ateacher-level variable than a school-level variable (see Cooper, 1989).

51
Table 4.4Effect Sizes from Scheerens and Bosker’s Meta-Analysis
School-Level Variable N Nr AverageESda
P gain PV
1. Cooperation 20 41 .0584 2 .08
2. School Climate 22 62 .2193 9 1.18
3. Monitoring 24 38 .2995 12 2.19
4. Content Coverage 19 19 .1767 7 .77
5. Homework 13 41 .1150 4 .29
6. Time 21 56 .3936 15 3.73
7. Parental Involvement 14 29 .2559 10 1.61
8. Pressure to Achieve 26 74 .2678 11 1.76
9. School Leadership 38 108 .0999 4 .25
Note: Data computed from the Foundations of Educational Effectiveness, page 305, by J. Scheerens and R. J.Bosker, 1997, New York: Elsevier.N = number of studies. Nr = total number of replications across all studies, ESd is Cohen’s d, P gain is thepercentile gain of the experimental group, PV is the percentage of variance explained.a Scheerens and Bosker report effect sizes using the Fisher Z transformation of zero-order correlations. (See Note4 at the end of this chapter for an explanation of how Zr is computed.) The Zr was then transformed to ESd.
Cooperation
Cooperation has been identified by a variety of researchers as a school-level variable that impactsstudent achievement (see Venesky & Winfield, 1979; Glenn, 1991; Brookover & Lezotte, 1979;Frazer et al., 1987; Wang, Haertel & Walberg, 1993; and Cotton, 1995). At a very general level,cooperation can be described as the extent to which staff members in a school support one anotherby sharing resources, sharing ideas, and sharing solutions to common problems. Some indicators thatsignal cooperation at the school level are
• the frequency and quality of formal and informal meetings� frequency and quality of informal contacts between staff� the extent to which members agree on school policies� the extent to which staff cooperation is an explicit goal� the extent to which consensus is sought for critical decisions
As reported in Table 4.4, the average ESd for cooperation is .0584 with an associated P gain of 2 andPV of .08.
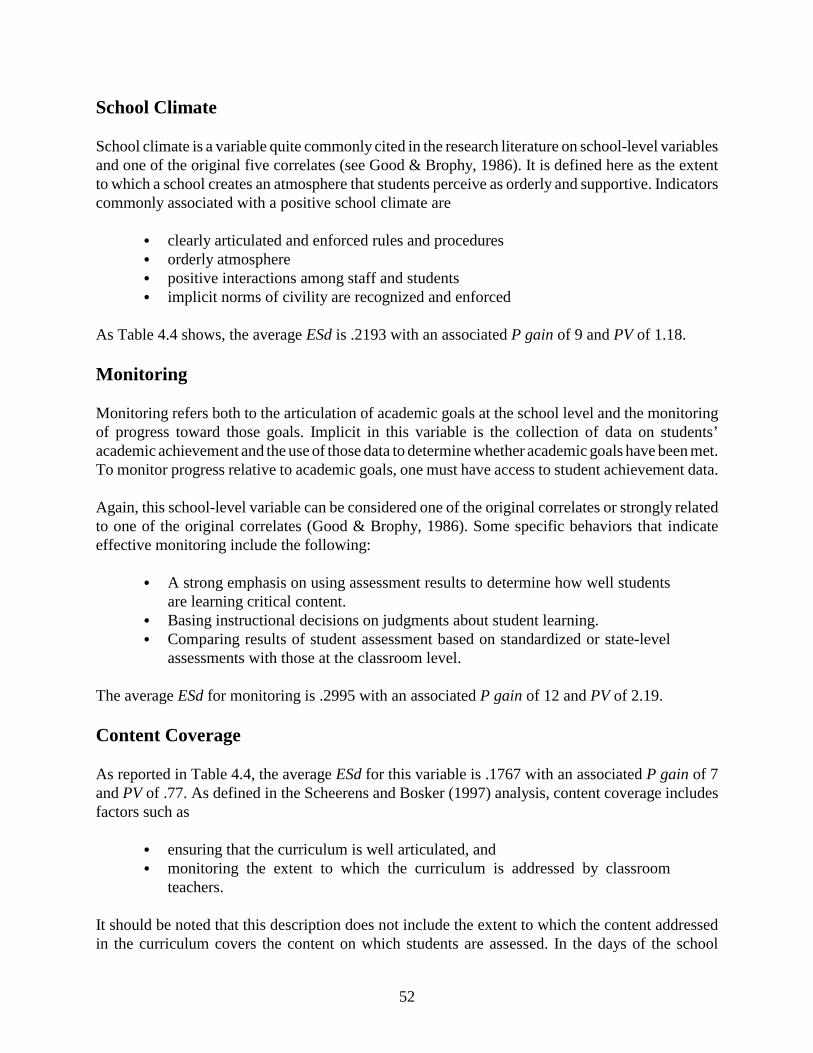
52
School Climate
School climate is a variable quite commonly cited in the research literature on school-level variablesand one of the original five correlates (see Good & Brophy, 1986). It is defined here as the extentto which a school creates an atmosphere that students perceive as orderly and supportive. Indicatorscommonly associated with a positive school climate are
� clearly articulated and enforced rules and procedures� orderly atmosphere� positive interactions among staff and students� implicit norms of civility are recognized and enforced
As Table 4.4 shows, the average ESd is .2193 with an associated P gain of 9 and PV of 1.18.
Monitoring
Monitoring refers both to the articulation of academic goals at the school level and the monitoringof progress toward those goals. Implicit in this variable is the collection of data on students’academic achievement and the use of those data to determine whether academic goals have been met.To monitor progress relative to academic goals, one must have access to student achievement data.
Again, this school-level variable can be considered one of the original correlates or strongly relatedto one of the original correlates (Good & Brophy, 1986). Some specific behaviors that indicateeffective monitoring include the following:
� A strong emphasis on using assessment results to determine how well studentsare learning critical content.
� Basing instructional decisions on judgments about student learning.� Comparing results of student assessment based on standardized or state-level
assessments with those at the classroom level.
The average ESd for monitoring is .2995 with an associated P gain of 12 and PV of 2.19.
Content Coverage
As reported in Table 4.4, the average ESd for this variable is .1767 with an associated P gain of 7and PV of .77. As defined in the Scheerens and Bosker (1997) analysis, content coverage includesfactors such as
� ensuring that the curriculum is well articulated, and� monitoring the extent to which the curriculum is addressed by classroom
teachers.
It should be noted that this description does not include the extent to which the content addressedin the curriculum covers the content on which students are assessed. In the days of the school
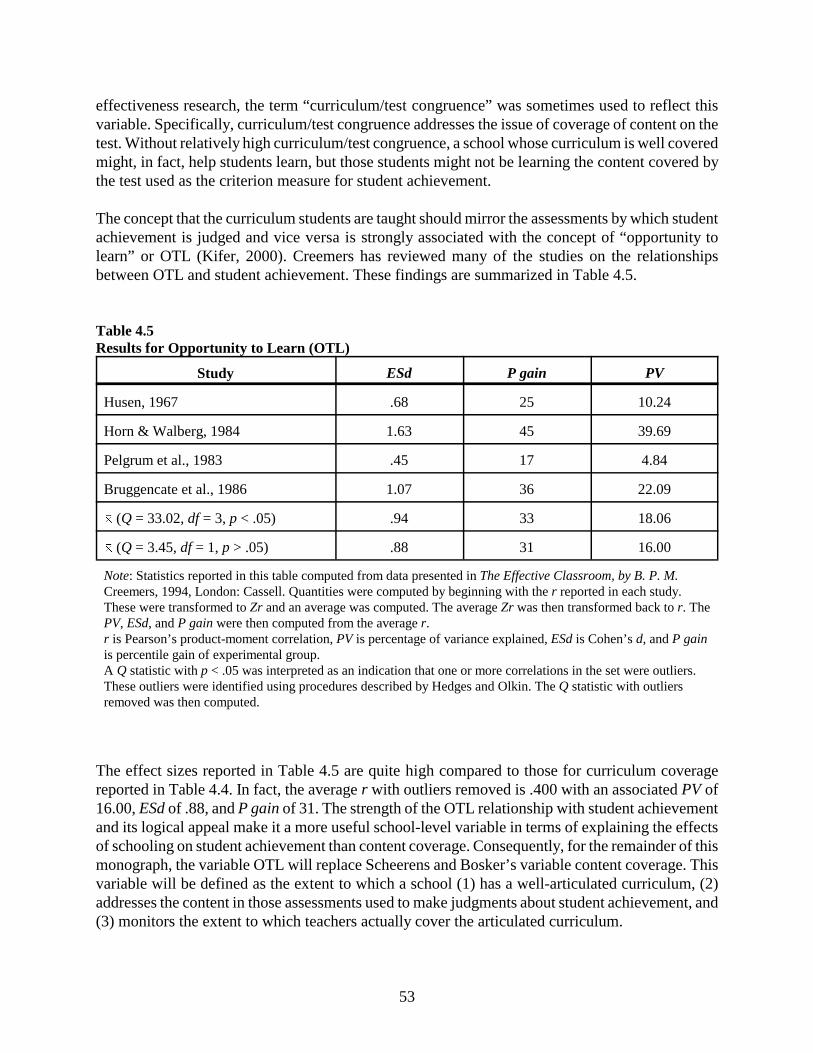
53
effectiveness research, the term “curriculum/test congruence” was sometimes used to reflect thisvariable. Specifically, curriculum/test congruence addresses the issue of coverage of content on thetest. Without relatively high curriculum/test congruence, a school whose curriculum is well coveredmight, in fact, help students learn, but those students might not be learning the content covered bythe test used as the criterion measure for student achievement.
The concept that the curriculum students are taught should mirror the assessments by which studentachievement is judged and vice versa is strongly associated with the concept of “opportunity tolearn” or OTL (Kifer, 2000). Creemers has reviewed many of the studies on the relationshipsbetween OTL and student achievement. These findings are summarized in Table 4.5.
Table 4.5Results for Opportunity to Learn (OTL)
Study ESd P gain PV
Husen, 1967 .68 25 10.24
Horn & Walberg, 1984 1.63 45 39.69
Pelgrum et al., 1983 .45 17 4.84
Bruggencate et al., 1986 1.07 36 22.09
� (Q = 33.02, df = 3, p < .05) .94 33 18.06
� (Q = 3.45, df = 1, p > .05) .88 31 16.00
Note: Statistics reported in this table computed from data presented in The Effective Classroom, by B. P. M.Creemers, 1994, London: Cassell. Quantities were computed by beginning with the r reported in each study.These were transformed to Zr and an average was computed. The average Zr was then transformed back to r. ThePV, ESd, and P gain were then computed from the average r.r is Pearson’s product-moment correlation, PV is percentage of variance explained, ESd is Cohen’s d, and P gainis percentile gain of experimental group.A Q statistic with p < .05 was interpreted as an indication that one or more correlations in the set were outliers.These outliers were identified using procedures described by Hedges and Olkin. The Q statistic with outliersremoved was then computed.
The effect sizes reported in Table 4.5 are quite high compared to those for curriculum coveragereported in Table 4.4. In fact, the average r with outliers removed is .400 with an associated PV of16.00, ESd of .88, and P gain of 31. The strength of the OTL relationship with student achievementand its logical appeal make it a more useful school-level variable in terms of explaining the effectsof schooling on student achievement than content coverage. Consequently, for the remainder of thismonograph, the variable OTL will replace Scheerens and Bosker’s variable content coverage. Thisvariable will be defined as the extent to which a school (1) has a well-articulated curriculum, (2)addresses the content in those assessments used to make judgments about student achievement, and(3) monitors the extent to which teachers actually cover the articulated curriculum.

54
Time
One of the most enduring school-level factors in the research literature is the effective use of time(see Berliner, 1979). As Table 4.4. shows, the average ESd is .3936 with an associated P gain of 15and PV of 3.73. The effect of time on achievement is, by far, the strongest identified in the Scheerensand Bosker (1997) study.
In the context of the Beginning Teacher Evaluation Studies (see Denham & Lieberman, 1980), theeffects of time were studied in great depth. Specifically, time was classified in those studies into fourbasic types: allocated time, instructional time, engaged time, and academic learning time (Borg,1980). Allocated time is that time in the school day specifically set aside for instruction, such asclasses, as opposed to noninstructional activities, such as recess, lunch, passing time, and the like.Instructional time is the in-class time that a teacher devotes to instruction as opposed tomanagement-oriented activities. Engaged time is that portion of instructional time during whichstudents are actually paying attention to the content being presented. Finally, academic learning timeis the proportion of engaged time during which students are successful at the tasks they are engagedin. Each of these categories of time has a stronger relationship with achievement than the previoustype. In other words, academic learning time has a stronger relationship with achievement than doesengaged time, and so on.
Although Scheerens and Bosker do not explicitly describe the type of time they are referring to, onecan infer from their comments that they are not considering engaged time or academic learning time.Rather, it appears that the variable time does not go beyond allocated time. Stated differently, thevariable of time as defined by Scheerens and Bosker includes
� maximizing the amount of time allocated for instruction,� minimizing the amount of instructional time lost to absenteeism and tardiness,
and� minimizing the amount of instructional time lost to unnecessary extracurricular
activities.
Parental Involvement
Parental involvement can be described in general terms as the extent to which parents are involvedin and supportive of the culture and operating procedures of the school. It is a variable that was nothighlighted as important within the school effectiveness movement. To illustrate, commenting onparental involvement within the school effectiveness literature, Good and Brophy (1986) note:
The degree of home and school cooperation is likely to be an important determinantof student achievement. However, this “obvious” possibility has received littleresearch attention. Whether parent-school communication differs in “more” and“less” effective schools is also unclear. (p. 590)
As indicated in Table 4.4, the average ESd for this variable is .2559 with an associated P gain of 10and PV of 1.61. Some of the specific behaviors that constitute this factor are

55
� good written information exchange between school and parents,� parental involvement in policy and curricular decisions, and� easy access for parents to administrators and teachers.
Pressure to Achieve
Pressure to achieve in the Scheerens and Bosker study is basically synonymous with the schooleffectiveness correlate of high expectations for student achievement. It can be defined as thecommunication of a strong school-level message that academic achievement is one of the primarygoals of the school. Specific behaviors within this category include the following:
� A clear focus on mastery of basic subjects.� High expectation for all students.� Use of records of student progress.
The average ESd for this category is .2678 with an associated P gain of 11 and PV of 1.76.
School Leadership
School leadership is defined here as the extent to which the school has strong administrativeleadership relative to the goal of academic achievement. The factors associated with effectiveleadership defined in this way are
� well-articulated leadership roles,� the school leader is an information provider, and� the school leader facilitates group decision making.
The average ESd for this factor is .0999 with an associated P gain of 4 and PV of .25. This is thesmallest effect size of the eight factors identified by Scheerens and Bosker, which is somewhatsurprising since strong administrative leadership is one of the five correlates in the effective schoolsliterature. One reason for the relatively small effect size computed by Scheerens and Bosker mightbe the way that school leadership is defined in their study as opposed to how it is defined in theschool effectiveness literature. In the Scheerens and Bosker study, leadership focuses primarily on“quality control.” In the school effectiveness literature, the definition of strong administrativeleadership goes well beyond this function. In fact, one might argue that in the school effectivenessliterature, leadership from the principal encompasses a majority of the school-level variablesidentified by Scheerens and Bosker (see Good & Brophy, 1986; Manassee, 1985). Specifically,school leadership as defined in the school effectiveness literature encompasses functions such asestablishing policies relative to the use of time, establishing policies relative to curriculum/testcongruence, and the like.
CONCLUSIONS ABOUT THE SCHOOL-LEVEL VARIABLES
If one accepts the interpretations just discussed, a rather straightforward picture emerges about theschool-level variables that affect student achievement and their relative influences. Specifically, the

56
eight factors drawn from the Scheerens and Bosker study might be ordered from largest effect tosmallest as shown in Table 4.6. In addition, these eight factors might be compared to the fivecorrelates from the school effectiveness literature as shown in Table 4.7.
Table 4.6School-Level Variables
Variable ESd P gain PV
Opportunity to Learn .88 31 16.00
Time .39 15 3.61
Monitoring .30 12 2.19
Pressure to Achieve .27 11 1.76
Parental Involvement .26 10 1.61
School Climate .22 8 1.18
Leadership .10 4 .25
Cooperation .06 2 .08
Note: PV is percentage of variance explained, ESd is Cohen’s d, and P gain is percentile gain of experimentalgroup.
Table 4.7Comparison with School Effectiveness Correlates
School Effectiveness Correlates Scheerens and Bosker Variables
• Administrative leadership • Cooperation• School leadership
• Safe and orderly climate • School climate
• Emphasis on basic skills • Opportunity to learn
• High expectations • Pressure to achieve
• Monitoring pupil performance • Monitoring
• Parental involvement• Time
As Table 4.7 shows, at least six of the eight variables considered in this chapter can be thought ofas strongly related to or identical to the five school effectiveness correlates, with the only outliersbeing time and parental involvement.
Another point that should be made about the school-level factors that make up the school effect istheir relatively small effect sizes, which should not be misconstrued as an indication that these

57
variables are not important. As illustrated in Chapter 1 using the BESD (binomial effect size display),relatively small effect sizes can have a rather profound effect on student achievement. Further, asdescribed by Brophy and Good (1986), “Many of the school effects variables probably havenonlinear relationships with outcomes” (p. 588). This would imply that factors like parentalinvolvement, for example, have a positive influence on student achievement up to a certain point,after which an increase in this variable no longer affects student achievement or might influence itnegatively.
The final conclusion that should be noted from this chapter is the updated estimate of the school-level effect. Specifically, that estimate is an r of .45 with an accompanying PV of 20.00, ESd of 1.01,and P gain of 34.
Chapter 4 Notes:
Note 1:The within-replication model used by Scheerens and Bosker (1997) was drs = rs + ers, indicating that the effect size inreplication r of study s is made up of an estimate of the population effect size for a replication within a given study ( rs)plus an error component due to sampling error (ers). The between-replication model was rs = s + urs, indicating thatthe average effect size for all replications within a given study is made up of an estimate of the population effect sizefor the replications within the study ( s) plus an error component due to sampling errors (urs).
Finally the between-studies model was s = o + vs, indicating that the effect size estimate within a given study iscomprised of the overall population effect size ( o) plus an error component. Thus, the effect computed for a specificreplication (drs) can be represented in the following way:
It is also important to note that Scheerens and Bosker used an effect size estimate (Cohen’s F) that was appropriate toaddress the variation in multiple means (i.e., ANOVA designs) as opposed to an effect size estimate based on acomparison of two means (e.g., Cohen’s d). Cohen’s F is defined as
where P is the interclass correlation coefficient operationally defined as the percentage of the total variance explainedby the variance between groups — in this case, the variance between schools. Although Cohen’s F ranges from 0 toinfinity, up to the value of about .50 it is roughly equivalent to r in terms of its interpretation.
F = � P 1–P
s
drs = o + vs + urs + ers
rs
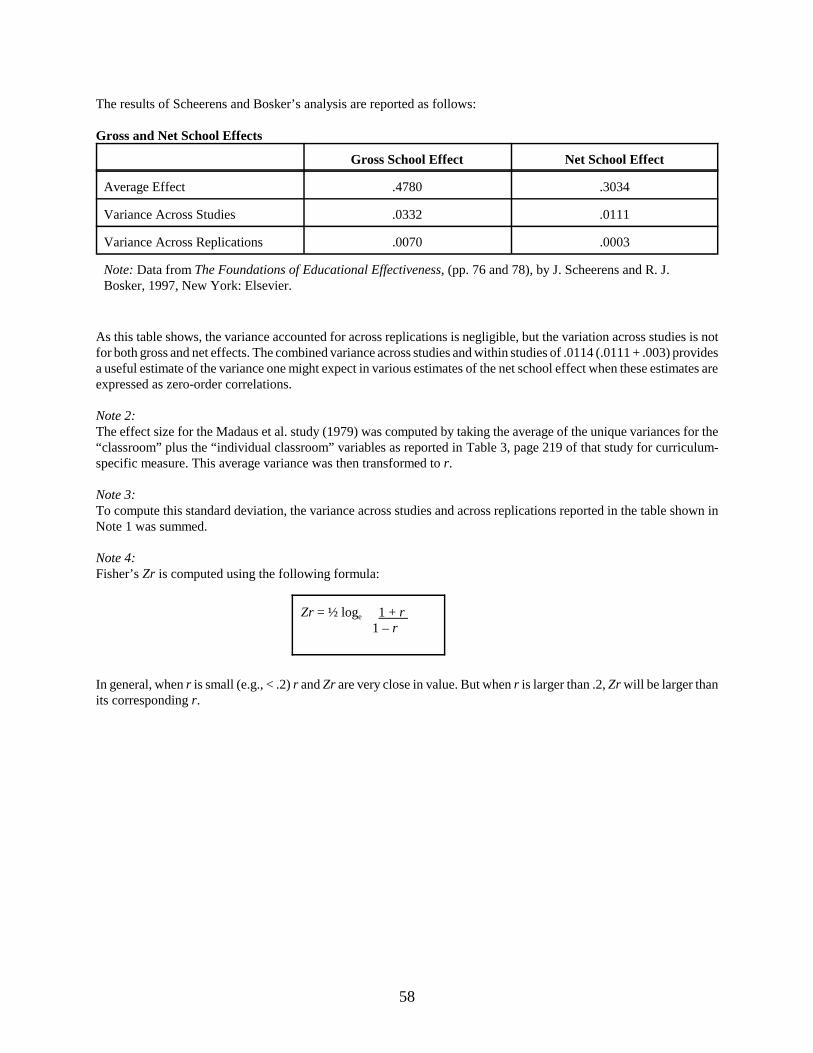
58
The results of Scheerens and Bosker’s analysis are reported as follows:
Gross and Net School Effects
Gross School Effect Net School Effect
Average Effect .4780 .3034
Variance Across Studies .0332 .0111
Variance Across Replications .0070 .0003
Note: Data from The Foundations of Educational Effectiveness, (pp. 76 and 78), by J. Scheerens and R. J.Bosker, 1997, New York: Elsevier.
As this table shows, the variance accounted for across replications is negligible, but the variation across studies is notfor both gross and net effects. The combined variance across studies and within studies of .0114 (.0111 + .003) providesa useful estimate of the variance one might expect in various estimates of the net school effect when these estimates areexpressed as zero-order correlations.
Note 2:The effect size for the Madaus et al. study (1979) was computed by taking the average of the unique variances for the“classroom” plus the “individual classroom” variables as reported in Table 3, page 219 of that study for curriculum-specific measure. This average variance was then transformed to r.
Note 3: To compute this standard deviation, the variance across studies and across replications reported in the table shown inNote 1 was summed.
Note 4:Fisher’s Zr is computed using the following formula:
In general, when r is small (e.g., < .2) r and Zr are very close in value. But when r is larger than .2, Zr will be larger thanits corresponding r.
Zr = ½ loge 1 + r 1 – r

Chapter 5THE TEACHER-LEVEL EFFECT
In this chapter we consider those variables that are specific to individual teachers within a school aswell as the overall effect of the teacher. Stated differently, we consider those variables that are underthe control of individual teachers regardless of the context provided by the school — those thingsa teacher might do to enhance student achievement no matter what the school’s position is aboutmonitoring student achievement, providing a positive climate, and so on. Brophy and Good (1986)describe the need to address teacher-level effects separately from school-level effects as follows:
Studies of large samples of schools yield important profiles of more and lesssuccessful schools, but these are usually group averages that may or may notdescribe how a single effective teacher actually behaves in a particular effectiveschool. Persons who use research to guide practice sometimes expect all teachers’behavior to reflect the group average. Such simplistic thinking is apt to lead theliterature to be too broadly and inappropriately applied. (p. 588)
In short, this chapter seeks to answer the questions, How big is the teacher-level effect? and Whatconstitutes that effect?
HOW BIG IS THE TEACHER-LEVEL EFFECT?
Most of the research on school-level effects discussed in Chapter 4 “sums over” the effect of teacherswithin a specific school. The effect of an individual teacher, then, is lost in the average for theschool. In this chapter, we first try to separate the effects of an individual teacher from that of aschool. Scheerens and Bosker (1977) note that unless the teacher effect is separated from the schooleffect
the [school] effect size is overestimated, since the important intermediate level of theclassroom is ignored. . . . In general, ignoring the intermediate classroom level leadsto an overestimate of school effects. This overestimate amounts to variance betweenclasses within schools divided by the average number of classes within schools. (p.80)
Results from the more salient studies that have attempted to partial out the teacher effect from theschool effect are reported in Table 5.1. The quantities reported in this table reveal a somewhatinconsistent picture of the relative effects of schools versus teachers. In the Springfield and Teddlie(1998) and Bosker (1992) studies, the percentage of variance accounted for by school variables andteacher variables is about equal. However, the Luyten (1994) study ascribes twice as much of aneffect to teachers as it does to schools. The Madaus et al. (1979) study addresses the issue of uniquecontributions of schools versus teachers perhaps most directly. As mentioned in Chapter 4, in thisstudy the unique and common variance for schools versus teachers was computed on a number ofdependent measures. The figures reported in Table 5.1 for the Madaus et al. study indicate that theratio of teacher to school effect is about 4.5 to 1 (i.e., 18 to 4) — the largest ratio of teacher to schooleffects among the studies reported in this table.

60
Table 5.1The Teacher-Level Effect
Study Percentage of Variance
School & Teacher School Teacher
Stringfield & Teddlie (1989)a 25% 13% 12%
Bosker (1992)a 25% (math)27% (language)
15%13%
11%14%
Luyten (1994)a 15% 5% 10%
Madaus et al. (1979)b 22% 4% 18%
a See these studies for data reported in this table.b Data computed from data found in Madaus et al. (1979). These researchers report the unique and commonvariance for two school-level factors that they refer to as the “classroom block” and the “individual/classroom”block. Despite the use of the term “classroom” to describe both categories of variables, the classroom blockcategory is closely related to the teacher-level variables as described in this monograph, and theindividual/classroom category is most closely related to the school-level variables as described in thismonograph. The average unique variance for scores on curriculum-specific dependent measures was used as theestimate of the variance accounted for by these two categories of variables.
There is some rather compelling research evidence that cannot easily be interpreted in effect sizemetrics. This evidence supports the assertion that the effects of teachers far exceed the independenteffects of schools. Specifically, the primacy of the teacher effect over the school effect has beenfirmly established by Sanders and his colleagues within the context of the Tennessee Value-AddedAssessment System (TVAAS) (see Sanders & Horn, 1994; Wright, Horn, & Sanders, 1997).
Reporting on 30 separate analyses across three grade levels (3–5) and five subject areas (math,reading, language arts, social studies, science) with some 60,000 students, Wright et al. (1997) founda number of interesting patterns. Specifically, the TVAAS researchers utilized the convention ofcomputing p-values for each F statistic and then translating each p value to its corresponding z-scoreby treating the p-values as two-tailed, standard normal deviates. Consequently, .05, .01, .001, and.0001 levels of significance correspond to Z scores of 1.96, 2.58, 3.29, and 3.89, respectively. Thegeneral findings from Wright et al.’s analysis are reported in Table 5.2.
Perhaps most striking about Table 5.2 is the consistently significant effects of teachers. The effectof the teacher was significant at the .0001 level 100 percent of the time. This is particularlycompelling inasmuch as 30 separate estimations were computed for each factor. No other factor hadthis level of consistency in the findings, not even the prior achievement of students (A). Anotherinteresting finding reported in Table 5.2 is that the heterogeneity of the class was significant in only3.3 percent of the 30 contrasts at the .05 level and not at all at higher levels of significance.

61
Table 5.2Findings From Tennessee Value Added System (TVAAS) Studies
FactorLevel of Significance
< .05 (1.96)a < .01 (2.58)a < .001 (3.29)a < .0001 (3.89)a
School (S) 27/30 = 90% 24/30 = 80% 20/30 = 66.7% 16/30 = 53.3%
Heterogeneity (H) 1/30 = 3.3% 0/30 = 0% 0/30 = 0% 0/30 = 0%
Class Size (C) 3/30 = 10% 1/30 = 3.3% 0/30 = 0% 0/30 = 0%
H*C 4/30 = 13.3% 0/30 = 0% 0/30 = 0% 0/30 = 0%
Teacher (S*H*C) (T) 30/30 = 100% 30/30 = 100% 30/30 = 100% 30/30 = 100%
Achievement Level (A) 26/30 = 86.7% 23/30 = 76.7% 23/30 = 76.7% 21/30 = 70%
A*S 21/30 = 70% 14/30 = 46.7% 8/30 = 26.7% 3/30 = 10%
A*H 10/30 = 33.3% 5/30 = 16.7% 4/30 = 13.3% 2/30 = 6.7%
A*H*C 4/30 = 13.3% 1/30 = 3.3% 0/30 = 0% 0/30 = 0%
A*T 9/30 = 30% 4/30 = 13.3% 2/30 = 6.6% 1/30 = 3.3%
Note: Table constructed using data from “Teacher and Classroom Context Effects on Student Achievement.Implications for Teacher Evaluation” (pp. 60–62), by S. P. Wright, S. P. Horn, and W. L. Sanders, 1997, Journalof Personnel Evaluation in Education, 11, 57–67.Heterogeneity (H) refers to the variance in achievement of students within a given class. The term T refers to the effects of individual teachers nested within a particular school (S), within a class with aspecific level of heterogeneity (H), with a specific class size (C). The term A stands for the average prior achievement of students within a class. All other terms in this table areinterpreted in the traditional manner for interactions.a Z score
These results lead Wright et al. (1997) to note:
The results of this study will document that the most important factor affectingstudent learning is the teacher. In addition, the results show wide variation ineffectiveness among teachers. The immediate and clear implication of this findingis that seemingly more can be done to improve education by improving theeffectiveness of teachers than by any other single factor. Effective teachers appearto be effective with students of all achievement levels regardless of the levels ofheterogeneity in their classes. If the teacher is ineffective, students under thatteacher’s tutelage will achieve inadequate progress academically, regardless of howsimilar or different they are regarding their academic achievement. (p. 63) [emphasesin original]
In sum, it appears safe to conclude that the variance accounted for by the individual classroomteacher is greater than that accounted for uniquely by the school as a unit. Exactly what uniquepercentage of variance to ascribe to schools versus teachers is not clear. However, a realistic yet

62
somewhat conservative estimate appears to be a ratio of 2 to 1 in favor of teachers. In the remainderof this monograph, we will assume that of the 20 percent of variance accounted for by schools asconcluded in Chapter 4, 13.34 percent is a function of teacher-level variables and 6.66 percent is afunction of school-level variables.
WHAT CONSTITUTES THE TEACHER-LEVEL EFFECT?
As is the case with school-level variables, lists of teacher-level variables abound in the researchliterature. For example, Cotton (1995) lists more than 160 teacher-level variables that contribute tostudent achievement. Frazer et al. (1987) list 25 variables; Walberg (1999) lists some 30 variables;and Scheerens (1992) lists more than 30. In spite of the exhaustive lists of teacher-level variables,three categories are commonly used to organize them: (1) instruction, (2) curriculum design, and (3)classroom management.
Instruction
The category of instruction is defined here as including those direct and indirect activitiesorchestrated by the teacher to expose students to new knowledge, to reinforce knowledge, or to applyknowledge. Within this category, Creemers (1994) lists the following:
� Advance organizers� Evaluation� Feedback� Corrective instruction� Mastery learning� Ability grouping� Homework� Clarity of presentation� Questioning
In a meta-analysis of research on instruction, Marzano (Marzano, 1998; Marzano, Gaddy, & Dean,2000; Marzano, Pickering, & Pollock, 2001) identified nine categories of instructional variables.These are reported in Table 5.3 along with their effect sizes.
It is important to comment on the relatively large effect sizes reported in Table 5.3 for specificinstructional strategies as opposed to those reported in Table 4.2 for the general effects at the schoollevel. The reason for this disparity has already been addressed in another context. Specifically, theeffect sizes in Table 5.3 are much higher than those reported in Table 4.2 because the studies fromwhich the effect sizes in Table 5.3 were computed used assessments that were specifically designedto assess the dependent variable in question. That is, the assessments used in these studies were“experiment-specific.” As described previously, Madaus et al. (1979) have shown that assessmentsspecific to the curriculum being taught are far more sensitive to effects due to schools, teachers, orboth than more general standardized tests.

63
Table 5.3Nine Categories of Instructional Strategies
Category ESd P gain P V
Identifying similarities and differences 1.61 45 27.04
Summarizing and note taking 1.00 34 20.25
Reinforcing effort and providing recognition .80 29 13.69
Homework and practice .77 28 12.96
Nonlinguistic representations .75 27 12.25
Cooperative learning .73 27 11.56
Setting goals and providing feedback .61 23 8.41
Generating and testing hypotheses .61 23 8.41
Activating prior knowledge .59 22 7.84
Note: ESd is Cohen’s d; P gain is percentile gain of experimental group; PV is percentage of variance explained.
Marzano (Marzano, 1998; Marzano et al., 2000; Marzano et al., 2001) also has organized the nineinstructional categories reported in Table 5.3 into a sequence for “unit design” as shown in Table 5.4.This protocol combines the nine instructional categories into a planning framework for units asopposed to individual lessons as was the case with the planning framework Hunter (1984) designed.
Curriculum Design
The category referred to as curriculum design addresses the order and pacing of content andinstructional activities. To distinguish this category of variables from those in the category ofinstruction, consider the fact that a teacher could use all of the instructional strategies listed in Table5.3, but still not address the subject-matter content in a logical way or pace activities in a way thatoptimizes learning.
Creemers lists two factors in this category: (1) explicit ordering of goals, and (2) clearly stated andwell-structured content. These factors are brought to life in the context of Bloom’s (1976) researchon the nature and structure of classroom tasks. Bloom reasoned that during a year of school, studentsencounter about 150 separate “learning units or learning tasks” (p. 87), each representing about sevenhours of school work. Assuming that the school day is divided into five academic courses, we caninfer that students encounter about 30 learning units within a year-long course or about 15 learningunits within a semester-long course. What is referred to here as curriculum design might beoperationally defined as the extent to which activities within these learning units are organized ina way that optimizes learning and the extent to which learning units are ordered in a way thatoptimizes learning. According to Clark and Yinger (1979), this aspect of instruction also involvesselecting appropriate learning activities and organizing these activities within and between units.

64
Table 5.4Planning Guide
When StrategiesMight be Used
Instructional Strategies
At the Beginningof a Unit
Setting Learning Goals
1. Identify clear learning goals.2. Allow students to identify and record their own learning goals.
During a Unit
Monitoring Learning Goals
1. Provide students feedback and help them self-assess their progress towardachieving their goals.
2. Ask students to keep track of their achievement of the learning goals and ofthe effort they are expending to achieve the goals.
3. Periodically celebrate legitimate progress toward learning goals.
Introducing New Knowledge
1. Guide students in identifying and articulating what they already know aboutthe topics.
2. Provide students with ways of thinking about the topic in advance.3. Ask students to compare the new knowledge with what is known.4. Have students keep notes on the knowledge addressed in the unit.5. Help students represent the knowledge in nonlinguistic ways, periodically
sharing these representations with others.6. Ask students to work sometimes individually, but other times in cooperative
groups.
Practicing, Reviewing, and Applying Knowledge
1. Assign homework that requires students to practice, review, and apply whatthey have learned; however, be sure to give students explicit feedback as tothe accuracy of all of their homework.
2. Engage students in long-term projects that involve generating and testinghypotheses.
3. Have students revise the linguistic and nonlinguistic representations ofknowledge in their notebooks as they refine their understanding of theknowledge.
At the End of aUnit
Helping Students Determine How Well They Have Achieved Their Goals
1. Provide students with clear assessments of their progress on each learninggoal.
2. Have students assess themselves on each learning goal and compare theseassessments with those of the teacher.
3. Have students articulate what they have learned about the content and aboutthemselves as learners.

65
Research by Nuthall (Nuthall, 1997; Nuthall & Alton-Lee, 1995) provides some guidance for within-unit and between-unit planning. Specifically, Nuthall’s research indicates that students should beexposed to informational knowledge at least three or four times before they can legitimately beexpected to remember that information or use it in meaningful ways. In addition, the time betweenexposures to that information should not exceed about two days. The interval created by the needfor multiple exposures to information and the need for those exposures to be relatively close in timehas been called the “time window” for learning (Rovee-Collier, 1995).
Also relevant to this discussion is Kulik and Kulik’s (1989) meta-analysis of the effects of goalstructure on student achievement. Specifically, they report an effect size (ESd) of .30 when goals arewell articulated and organized into a hierarchical structure. Finally, Creemers (1994) makes thefollowing comment about the structure of goals and their influence on student achievement:
The hierarchy of goals is reflected in the structure of a curriculum starting with easyexercises and simple knowledge and building up to more complex exercises andknowledge structures . . . Research shows that clearly structured curricula are moreeffective than less clearly structured curricula. The clear structure is expressed ingoals that should be achieved in succession: achieving the first goal is a condition forachieving later goals. (p. 49)
In summary, effective curriculum design appears to be a function of the learning goals that areestablished by the teacher, the manner in which these goals are organized, the activities selected tohelp students meet these goals, and the manner in which these activities are spaced and paced.
Classroom Management
Classroom management involves those teaching behaviors and teacher designed activities that aredesigned to minimize disruptions or distractions to the learning process and maximize theeffectiveness of interaction between teachers and students, and students and students. It is certainlynoteworthy that in their analysis of 30 variables influencing student achievement, Wang et al. (1993)listed classroom management as the most influential. (See Chapter 3 for a discussion.) Again, thelists of factors within this instructional category can be quite long. Cotton (1995) lists 19 factors thatdeal with management; Scheerens and Bosker (1997) list 22 elements.
In much of the research literature, the classroom management variables overlap greatly withvariables in the previous two categories — instruction and curriculum design. This makes intuitivesense — well-planned units that use the most effective instructional strategies will require littleattention to management. However, some unique classroom management activities have beenidentified by Emmer et al. (1984) and Evertson et al. (1984). These are reported in Table 5.5 forelementary and secondary classrooms.
As Table 5.5 shows, classroom management involves establishing and implementing procedures andrules for routine and nonroutine activities in the day-to-day life of the classroom. Although therecertainly are differences between management concerns in the elementary and secondary classroom,both have a great deal in common including establishing and implementing procedures and rules forseat work, group work, and discipline.

66
Table 5.5Classroom Management Variables
Elementary School Management
Room use:& teacher’s desk and storage& student’s desk and storage& bathroom use& use of centers and stations
Seat work:& student attention and participation& talking during seatwork& obtaining help& out-of-seat procedures& activities after seatwork is completed
Group work:& group behavior& individual behavior within a group
Discipline:& loss of privileges& checks or demerits& detention& restitution& confiscation
General procedures:& distributing material& interrupting& fire and disaster drills& classroom helpers
Secondary School Management
Seat work:& student attention& student participation& student talk& out-of-seat behavior& when seatwork is completed
Group work:& different roles in groups& use of materials& student participation and behavior
Discipline:& loss of privileges& checks or demerits& detention& restitution& confiscation
General procedures:& distributing material& behavior during disruption& special equipment
Note: See Classroom Management for Secondary Teachers, by E. T. Emmer, C. M. Evertson, J. P. Sanford, B.S. Clements, and M. E. Worsham, M. E, 1984, Englewood Cliffs, NJ: Prentice Hall; and ClassroomManagement for Elementary Teachers, by C. M. Evertson, E. T. Emmer, B. S. Clements, J. P. Sanford, and M.E. Worsham, 1984, Englewood Cliffs, NJ: Prentice Hall.
CONCLUSIONS ABOUT TEACHER-LEVEL VARIABLES
Based on the research on the effects of teacher-level variables, one can conclude that a reasonableestimate of the relative effects of teachers versus schools is 2 to 1. Chapter 4 established that a viableestimate of the effects of schooling is that it accounts for about 20 percent of the variance in studentachievement. Thus, 13.34 percent can be assigned to teachers and 6.66 percent to schools using the2 to 1 ratio. In addition, as described in this chapter, the unique effects of individual teachers can bethought of as consisting of the effective use of specific instructional strategies, effective curriculumdesign, and effective classroom management.
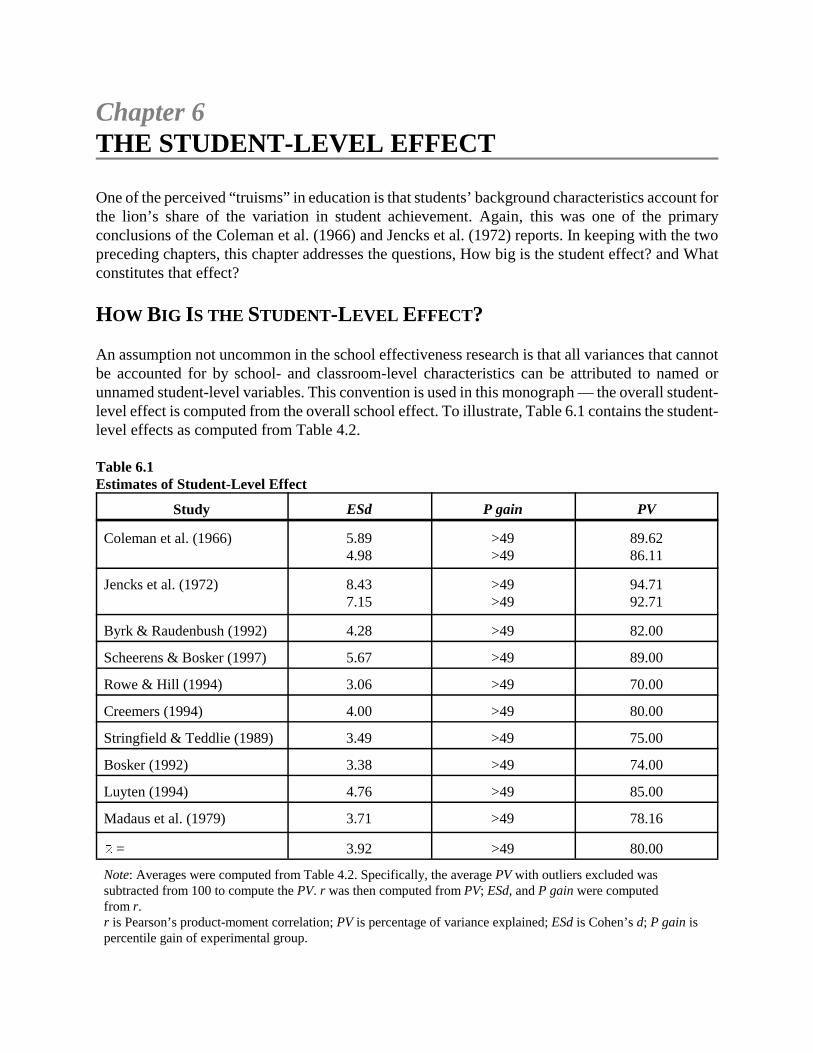
Chapter 6THE STUDENT-LEVEL EFFECT
One of the perceived “truisms” in education is that students’ background characteristics account forthe lion’s share of the variation in student achievement. Again, this was one of the primaryconclusions of the Coleman et al. (1966) and Jencks et al. (1972) reports. In keeping with the twopreceding chapters, this chapter addresses the questions, How big is the student effect? and Whatconstitutes that effect?
HOW BIG IS THE STUDENT-LEVEL EFFECT?
An assumption not uncommon in the school effectiveness research is that all variances that cannotbe accounted for by school- and classroom-level characteristics can be attributed to named orunnamed student-level variables. This convention is used in this monograph — the overall student-level effect is computed from the overall school effect. To illustrate, Table 6.1 contains the student-level effects as computed from Table 4.2.
Table 6.1Estimates of Student-Level Effect
Study ESd P gain PV
Coleman et al. (1966) 5.894.98
>49>49
89.6286.11
Jencks et al. (1972) 8.437.15
>49>49
94.7192.71
Byrk & Raudenbush (1992) 4.28 >49 82.00
Scheerens & Bosker (1997) 5.67 >49 89.00
Rowe & Hill (1994) 3.06 >49 70.00
Creemers (1994) 4.00 >49 80.00
Stringfield & Teddlie (1989) 3.49 >49 75.00
Bosker (1992) 3.38 >49 74.00
Luyten (1994) 4.76 >49 85.00
Madaus et al. (1979) 3.71 >49 78.16
� = 3.92 >49 80.00
Note: Averages were computed from Table 4.2. Specifically, the average PV with outliers excluded wassubtracted from 100 to compute the PV. r was then computed from PV; ESd, and P gain were computed from r.r is Pearson’s product-moment correlation; PV is percentage of variance explained; ESd is Cohen’s d; P gain ispercentile gain of experimental group.

68
It should be noted that the approach taken in Table 6.1 is highly conservative in terms of the effectsof schools and teachers. That is, it gives the benefit of the doubt to factors outside of the influenceof the school or classroom. This approach is used in this monograph in order to avoid drawing overlyoptimistic conclusions about the potential of school reform. Stated differently, this monograph seeksto demonstrate that even the most conservative perspective on the effects of schools and classroomson student achievement still indicates that schools and teachers can have a profound effect on studentachievement.
WHAT CONSTITUTES THE STUDENT-LEVEL EFFECT?
As is the case with school and teacher levels, there is no single way to organize the research onstudent-level variables. However, four factors are commonly considered in discussions of studentbackground — socioeconomic status (SES), prior knowledge, interest, and aptitude.
Socioeconomic Status (SES)
According to White (1982), the Coleman report confirmed for educators what they thought theyalready knew — “that a strong relationship exists between all kinds of academic achievementvariables and what has come to be known as socioeconomic status (SES)” (p. 46). White notes thatthe belief in the strong relationship between SES and achievement is so prevalent in the researchliterature that it is rarely questioned. As proof, he offers the following set of quotes:
The family characteristic that is the most powerful predictor of school performanceis socioeconomic status (SES): the higher the SES of the student’s family, the higherhis academic achievement. This relationship has been documented in countlessstudies and seems to hold no matter what measure of status is used (occupation ofprincipal breadwinner, family income, parents’ education, or some combination ofthese). (Boocock, 1972, p. 32)
To categorize youth according to the social class position of their parents is to orderthem on the extent of their participation and degree of success in the AmericanEducational System. This has been so consistently confirmed by research that it cannow be regarded as an empirical law. . . . SES predicts grades, achievement andintelligence test scores, retentions at grade level, course failures, truancy, suspensionsfrom school, high school dropouts, plans for college attendance, and total amount offormal schooling. (Charters, 1963, pp. 739–740)
The positive association between school completion, family socioeconomic status,and measured ability is well known. (Welch, 1974, p. 32)
White argues that in spite of the testimonies to the strong relationship between SES and academicachievement, reported correlations do not paint a clear picture. Specifically, correlations range from.10 to .80 as reported in the research literature. White speculates that one factor contributing to thevariation in reported relationships between SES and achievement is the variation in the way SES isdefined and, consequently, measured. In a meta-analysis of 101 reports yielding 636 effect sizes,
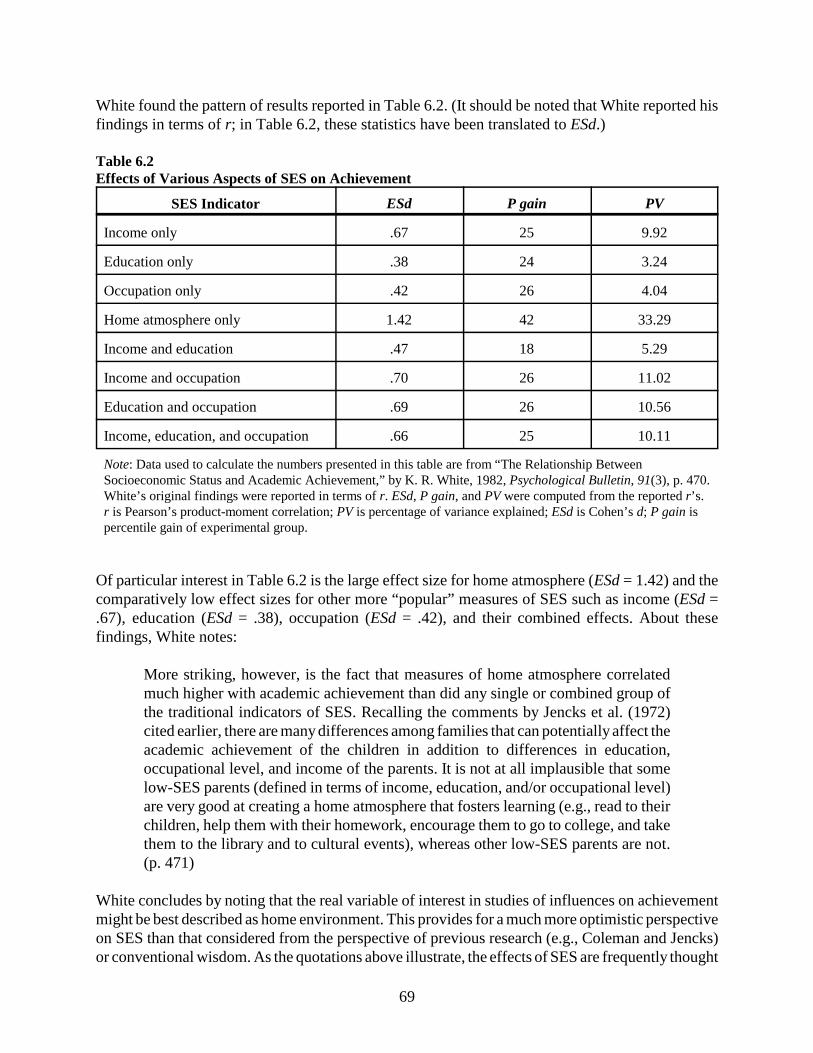
69
White found the pattern of results reported in Table 6.2. (It should be noted that White reported hisfindings in terms of r; in Table 6.2, these statistics have been translated to ESd.)
Table 6.2Effects of Various Aspects of SES on Achievement
SES Indicator ESd P gain PV
Income only .67 25 9.92
Education only .38 24 3.24
Occupation only .42 26 4.04
Home atmosphere only 1.42 42 33.29
Income and education .47 18 5.29
Income and occupation .70 26 11.02
Education and occupation .69 26 10.56
Income, education, and occupation .66 25 10.11
Note: Data used to calculate the numbers presented in this table are from “The Relationship BetweenSocioeconomic Status and Academic Achievement,” by K. R. White, 1982, Psychological Bulletin, 91(3), p. 470.White’s original findings were reported in terms of r. ESd, P gain, and PV were computed from the reported r’s.r is Pearson’s product-moment correlation; PV is percentage of variance explained; ESd is Cohen’s d; P gain ispercentile gain of experimental group.
Of particular interest in Table 6.2 is the large effect size for home atmosphere (ESd = 1.42) and thecomparatively low effect sizes for other more “popular” measures of SES such as income (ESd =.67), education (ESd = .38), occupation (ESd = .42), and their combined effects. About thesefindings, White notes:
More striking, however, is the fact that measures of home atmosphere correlatedmuch higher with academic achievement than did any single or combined group ofthe traditional indicators of SES. Recalling the comments by Jencks et al. (1972)cited earlier, there are many differences among families that can potentially affect theacademic achievement of the children in addition to differences in education,occupational level, and income of the parents. It is not at all implausible that somelow-SES parents (defined in terms of income, education, and/or occupational level)are very good at creating a home atmosphere that fosters learning (e.g., read to theirchildren, help them with their homework, encourage them to go to college, and takethem to the library and to cultural events), whereas other low-SES parents are not.(p. 471)
White concludes by noting that the real variable of interest in studies of influences on achievementmight be best described as home environment. This provides for a much more optimistic perspectiveon SES than that considered from the perspective of previous research (e.g., Coleman and Jencks)or conventional wisdom. As the quotations above illustrate, the effects of SES are frequently thought

70
of as impervious to change and extremely large. White’s meta-analysis indicates that the effects arenot as large as once thought. More important, if the ubiquitous SES effect is primarily a function ofhome environment, it can be altered. That is, interventions can be designed and implemented thatprovide parents with information and resources to establish a home environment that can positivelyaffect students’ academic achievement.
Prior Knowledge
Another apparent truism accepted by education practitioners and researchers is that prior knowledgeis a strong determinant of academic achievement (see Alexander, Kulikowich, & Jetton, 1994;Bjorklund, 1985; Chi & Ceci, 1987; Chi, Glaser, & Farr, 1988; Glaser, Lesgold, & Lajoie, 1987;Pressley & McCormick, 1995; Schneider & Pressley, 1989). Table 6.3 lists effect sizes for priorknowledge as reported in various studies.
Table 6.3Achievement and Prior Knowledge
Study ESd P gain PV
Bloom (1976) 2.20a 48 54.76
Dochy (1992) (in Dochy, Segers, & Buehl, 1999) 1.71 46 42.25
Tobias (1994) 1.76a 46 43.56
Alexander, Kulikowich, & Schulze (1994) 1.04a 35 21.16
Dochy et al. (1999) 1.76a 46 43.56
Schiefele & Krapp (1996) .43 16 4.41
Tamir (1996) 1.67 45 40.96
Boulanger (1981) 1.04 35 21.16
� (Q = 69.4, df = 7, p < .05) 1.43 42 33.64
� (Q = 6.07, df = 4, p > .05) 1.81 46 40.96
Note: Quantities were computed by beginning with the r reported in each study. These were transformed to Zrand an average was computed. The average Zr was then translated back to r. The PV, ESd, and P gain were thencomputed from the average r.r is Pearson’s product-moment correlation; PV is percentage of variance explained; ESd is Cohen’s d; P gain ispercentile gain of experimental group.A Q statistic with p < .05 was interpreted as an indication that one or more correlations in the set were outliers.These outliers were identified using procedures described by Hedges and Olkin (1985). The Q statistic withoutliers removed was then computed.a Estimated from reported data.
Of the studies listed in Table 6.3, perhaps the most extensive was that conducted by Dochy, Segers,and Buehl (1999). In their analysis of 183 studies, Dochy et al. found that 91.5 percent of the studiesdemonstrated positive effects of prior knowledge on learning, and that those that did not measured
1A factor loading is an index of the relationship between a given measure & in this case, the various testsof achievement in the 20 academic subjects & and a latent construct represented by the factor. Generally, a factorloading of .300 or greater is interpreted as a significant relationship between a given measure and a given latentconstruct (see Mulaik, 1972). In this case, the .300 criterion was relaxed to .290 because a number of factorloadings were less than ten thousandths of a point within the .300 point criterion.
71
prior knowledge in ways that were indirect, questionable, or even invalid. For example, some studiesmeasured prior knowledge by simply asking students if they were familiar with a topic.
Table 6.3 reports findings from studies analyzing the effects of prior knowledge on academicachievement; however, prior knowledge also has been shown to be related to skills that might beconsidered “higher order” in nature. For example, Alexander and Judy (1994) focused their analysison research related to the relationship between prior achievement and strategic or metacognitiveknowledge. They identify the following generalizations about this relationship:
1. A foundation of domain-specific knowledge is necessary to acquire strategicknowledge.
2. Inaccurate or incomplete domain knowledge can exhibit the learning of strategicknowledge.Strategic knowledge contributes to the utilization and acquisition of domain-specific knowledge.
3. As knowledge in a domain increases, strategic knowledge is altered.4. Differences in the relative importance of domain-specific and strategic
knowledge may be a consequence of the nature of the domain or the structure ofthe task to which they are applied.
One study that is perhaps most illuminating relevant to this discussion is that conducted by Rolfhusand Ackerman (1999), even though it was not about prior knowledge, per se. Rolfhus and Ackermanhelped define the structure of prior knowledge for academic subjects by assessing the domain-specific knowledge of 141 college students using traditional (i.e., forced-choice) tests for 20academic domains. They then factor analyzed the correlations between those assessments. Theseresults are reported in Table 6.4.
At least two elements of the findings reported in Table 6.4 are relevant to this discussion. First, andperhaps most striking, is the existence of a general factor that has factor loadings1 greater than +.290on all but one of the domain-specific tests (i.e., statistics). Yet, even this loading was .284. Thisimplies that academic competence is grounded in a common core of knowledge, supportingarguments made by Hirsch (1996), Bennett (1992), and Finn (1991) that a strong general knowledgebase enhances academic achievement.
A second relevant feature of the results reported in Table 6.4 is the existence of the four factors otherthan the general factor. As labeled in Table 6.4, they are (1) the humanities, (2) science, (3) civics,and (4) mechanics. If these factors represent commonalities between academic subjects, they mightprovide guidance in terms of organizing K–12 curricula. Specifically, the myriad of subjectscurrently addressed in most state curriculums via state-level content-area standards (see Marzano &

72
Kendall, 1999, for a discussion) might be organized into the four strands of humanities, science,civics, and mechanics as opposed to independent subject areas.
Table 6.4The Factor Structure of Knowledge Tests
TestFactor
General Humanities Science Civics Mechanical
Humanities
American LiteratureArtGeographyMusicWorld Literature
.612
.367
.603
.551
.665
.445 .624
.443 .404
Science
BiologyBusiness/ManagementChemistryEconomicsPhysicsPsychologyStatisticsTechnology
.524
.628
.426
.573
.556
.526
.586
.359
–.363
.408
.330
.375
.387
.440
.480
.318
Civics
American GovernmentAmerican HistoryLawWestern Civilization
.756
.813
.601
.705
.299
.344
.293
Mechanics
AstronomyElectronicsTools/Shop
.508
.410
.314
.383
.425
.625
Note: Adapted from “Assessing Individual Differences in Knowledge: Knowledge, Intelligence, and RelatedTraits,” by E. L. Rolfhus and P. L. Ackerman, 1999, Journal of Educational Psychology, 91(3), p. 518.Copyright © 1999 by the American Psychological Association. Adapted with the permission of APA and ofPhillip L. Ackerman.
Interest
Another student characteristic that presumably affects achievement is the interest students have inthe content being learned. It makes great intuitive sense that if a student is not interested in a given

73
topic, she will put little effort into the task of learning the content, and achievement will be affected.Table 6.5 presents findings from a number of studies that have examined the relationship betweenstudent interest and student achievement.
Table 6.5Interest and Achievement
Study ESd P gain PV
Schiefele, Krapp & Winteler (1992) .63 24 9.00
Schiefele & Krapp (1995) .75 27 12.25
Geisler-Brenstein & Schmeck (1996) .93 32 17.65
Tobias (1994) 1.01 34 20.25
Bloom (1976) .63 24 9.00
Steinkamp & Maehr (1983) .39 15 3.61
� (Q = 11.84, df = 5, p < .05) .73 27 11.56
� with outliers removed(Q = 5.48, df = 4, p > .05)
.80 29 13.69
Note: Quantities were computed by beginning with the r reported in each study. These were transformed to Zrand an average was computed. The average Zr was then transformed back to r.r is Pearson’s product-moment correlation; PV is percentage of variance explained; ESd is Cohen’s d; P gain ispercentile gain of experimental group.A Q statistic with p < .05 was interpreted as an indication that one or more correlations in the set were outliers.These outliers were identified using procedures described by Hedges and Olkin (1985). The Q statistic withoutliers removed was then computed.
As Table 6.5 shows, there is a moderate to strong relationship between interest and achievement forthese studies; the average ESd is .80 when outliers are removed. Again, the dynamics of thisrelationship are fairly straightforward — the more interest students have in a topic, the more energyand attention they will put into the topic; consequently, the more they will learn about the topic.However, a number of studies have delved quite extensively into the working principles underlyingthis dynamic. For example, Schiefele and Csikszentmihalyi (1994) found that interest also correlatessignificantly with students’ experience of efficacy, positive affect, and “potency” (feeling active,strong, and excited). An inference from their findings might be that the more students believe theycan control a topic and have some say over how it is addressed and developed, the more interest theyhave in the topic. In their study, Alexander, Kulikowich, and Schulze (1994) found that ascompetence in a domain increases, there is a corresponding increase in one’s interest in the domain.An inference here is that competence engenders interest, which in turn engenders more competence.
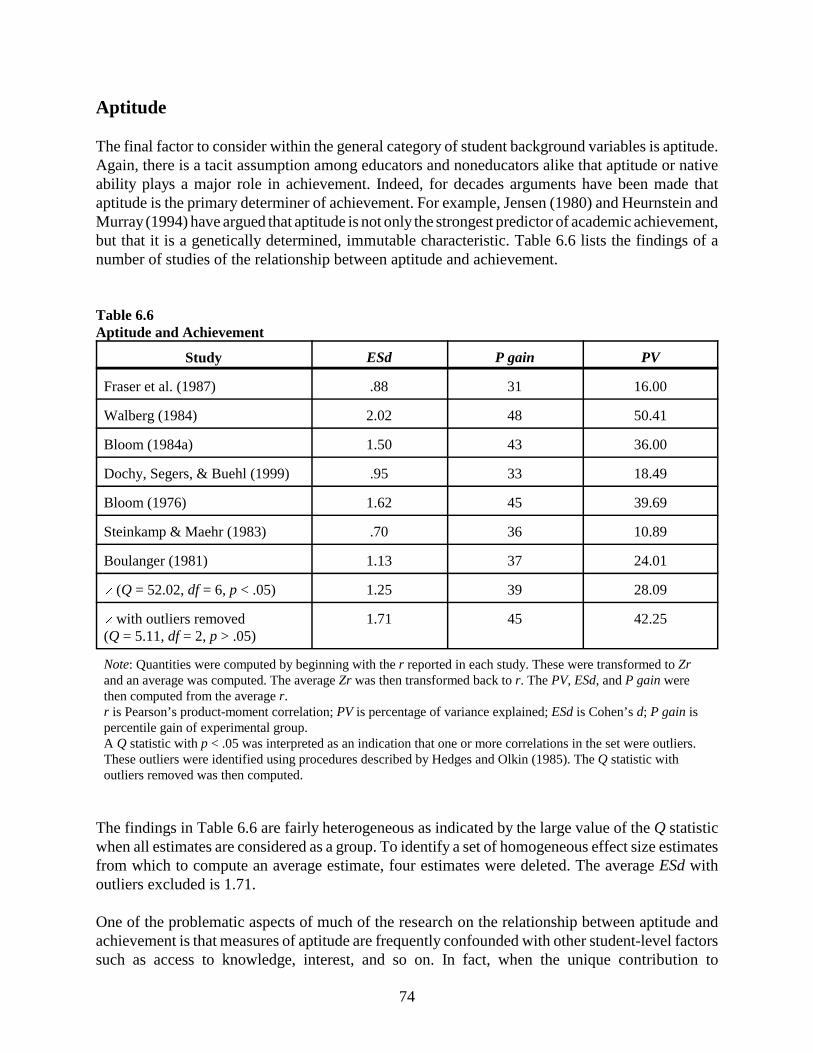
74
Aptitude
The final factor to consider within the general category of student background variables is aptitude.Again, there is a tacit assumption among educators and noneducators alike that aptitude or nativeability plays a major role in achievement. Indeed, for decades arguments have been made thataptitude is the primary determiner of achievement. For example, Jensen (1980) and Heurnstein andMurray (1994) have argued that aptitude is not only the strongest predictor of academic achievement,but that it is a genetically determined, immutable characteristic. Table 6.6 lists the findings of anumber of studies of the relationship between aptitude and achievement.
Table 6.6Aptitude and Achievement
Study ESd P gain PV
Fraser et al. (1987) .88 31 16.00
Walberg (1984) 2.02 48 50.41
Bloom (1984a) 1.50 43 36.00
Dochy, Segers, & Buehl (1999) .95 33 18.49
Bloom (1976) 1.62 45 39.69
Steinkamp & Maehr (1983) .70 36 10.89
Boulanger (1981) 1.13 37 24.01
� (Q = 52.02, df = 6, p < .05) 1.25 39 28.09
� with outliers removed(Q = 5.11, df = 2, p > .05)
1.71 45 42.25
Note: Quantities were computed by beginning with the r reported in each study. These were transformed to Zrand an average was computed. The average Zr was then transformed back to r. The PV, ESd, and P gain werethen computed from the average r.r is Pearson’s product-moment correlation; PV is percentage of variance explained; ESd is Cohen’s d; P gain ispercentile gain of experimental group.A Q statistic with p < .05 was interpreted as an indication that one or more correlations in the set were outliers.These outliers were identified using procedures described by Hedges and Olkin (1985). The Q statistic withoutliers removed was then computed.
The findings in Table 6.6 are fairly heterogeneous as indicated by the large value of the Q statisticwhen all estimates are considered as a group. To identify a set of homogeneous effect size estimatesfrom which to compute an average estimate, four estimates were deleted. The average ESd withoutliers excluded is 1.71.
One of the problematic aspects of much of the research on the relationship between aptitude andachievement is that measures of aptitude are frequently confounded with other student-level factorssuch as access to knowledge, interest, and so on. In fact, when the unique contribution to

2Factor scores are scores for individual subjects on the latent constructs (factors) identified within a factoranalysis. When a set of tests is highly correlated, these factor scores are considered to be better estimates of theunderlying traits that relate to the set of tests than are the individual scores on the tests themselves.
75
achievement attributable to aptitude is identified, it appears to be relatively small. To illustrate,consider the findings of Madaus et al. (1979), who found that the average correlation betweenachievement and aptitude (as measured by an IQ test) is .23 (ESd = .473) only when school-level,classroom-level, and home environment characteristics are partialed out and curriculum-specificdependent measures are used. The correlation between achievement and aptitude is .25 (ESd = .516)only when standardized tests are used.
Another problematic aspect of research in this area is defining exactly what is meant by aptitude.Although aptitude or intelligence can be described in a number of ways, one of the most widelyaccepted distinctions in the research and theory on intelligence is that between crystallizedintelligence (Gc) and fluid intelligence (Gf). This distinction was first proposed by Cattell(1971/1987) and further developed by Ackerman (1996).
In brief, intelligence is thought of as consisting of two constructs: intelligence as knowledge (Gc,or crystallized intelligence) and intelligence as process (Gf, or fluid intelligence). Crystalizedintelligence is exemplified by the ability to recognize or recall facts, generalizations, and principlesalong with the ability to learn and execute domain-specific skills and processes such as multiplyingand dividing, reading, writing, and the like. Fluid intelligence is exemplified by procedures such asabstract reasoning ability, working memory capacity, and working memory efficiency. It is assumedthat these mental processes are innate and not highly amenable to change through one’s environment.Where fluid intelligence is assumed to be innate, crystalized intelligence is thought to be learned.However, it is also assumed that fluid intelligence is instrumental in the development of crystalizedintelligence. That is, the more efficient one is at the cognitive processes involved in fluidintelligence, the more crystalized intelligence will be developed. A useful question relative to thepresent discussion is, What type of intelligence — crystalized or fluid — is more strongly related toacademic achievement?
One of the most extensive studies of the relationship between Gc, Gf, and academic achievement wasconducted by Rolfhus and Ackerman (1999). The researchers administered intelligence tests to 141adults along with tests of knowledge in 20 different subject areas (discussed in the previous sectionof this chapter on prior knowledge). After factor-analyzing scores from nine subscales within theintelligence test, they found evidence for a general verbal factor, which they associated with Gc, andthe existence of spatial and numeral factors, which they associated with Gf. To determine therelationship between Gc intelligence, Gf intelligence, and academic achievement, Rolfhus andAckerman correlated the factor scores2 with scores on the 20 academic domains. These results arereported in Table 6.7.
The most important point of Table 6.7 relative to the discussion is that in the domains of humanities,science, and civics, the verbal intelligence factor (Gc) has correlations greater than .200 with everyachievement test except one (i.e., statistics) and correlations greater than .300 with over half of theachievement tests in these domains. Conversely, the two factors associated with Gf (the spatial andnumerical factors) have no correlations greater than .300 with any of the achievement tests in any
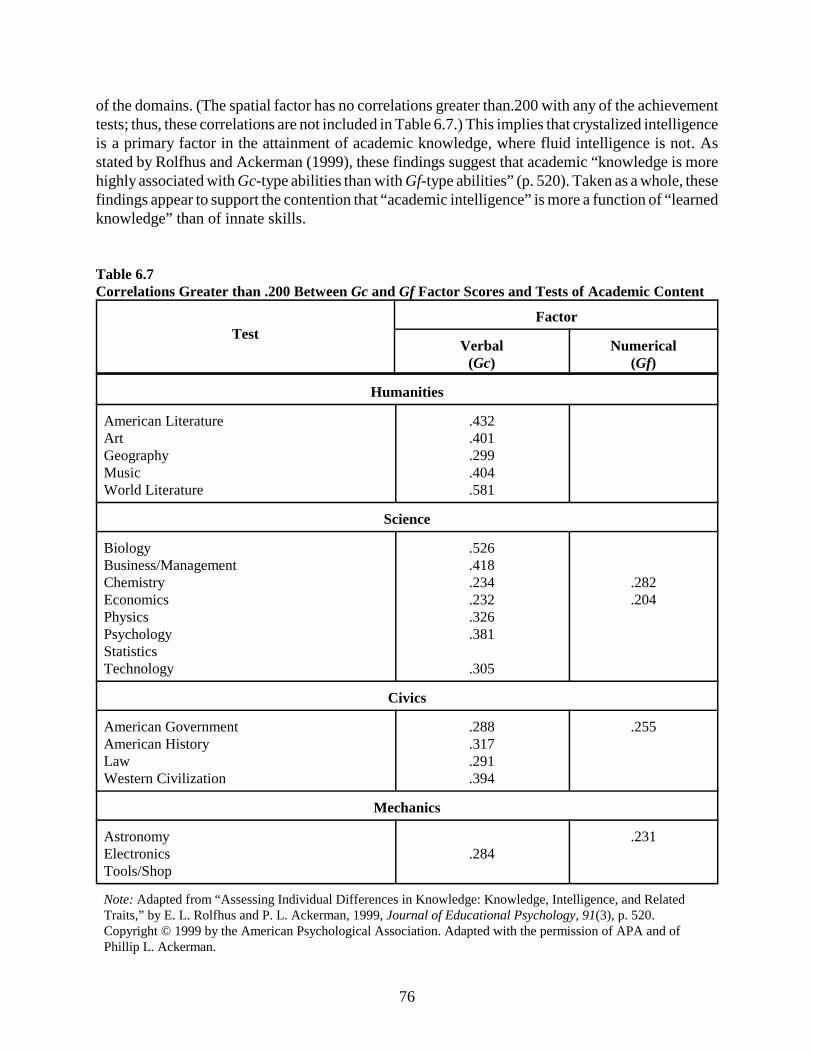
76
of the domains. (The spatial factor has no correlations greater than.200 with any of the achievementtests; thus, these correlations are not included in Table 6.7.) This implies that crystalized intelligenceis a primary factor in the attainment of academic knowledge, where fluid intelligence is not. Asstated by Rolfhus and Ackerman (1999), these findings suggest that academic “knowledge is morehighly associated with Gc-type abilities than with Gf-type abilities” (p. 520). Taken as a whole, thesefindings appear to support the contention that “academic intelligence” is more a function of “learnedknowledge” than of innate skills.
Table 6.7Correlations Greater than .200 Between Gc and Gf Factor Scores and Tests of Academic Content
TestFactor
Verbal(Gc)
Numerical(Gf)
Humanities
American LiteratureArtGeographyMusicWorld Literature
.432
.401
.299
.404
.581
Science
BiologyBusiness/ManagementChemistryEconomicsPhysicsPsychologyStatisticsTechnology
.526
.418
.234
.232
.326
.381
.305
.282
.204
Civics
American GovernmentAmerican HistoryLawWestern Civilization
.288
.317
.291
.394
.255
Mechanics
AstronomyElectronicsTools/Shop
.284.231
Note: Adapted from “Assessing Individual Differences in Knowledge: Knowledge, Intelligence, and RelatedTraits,” by E. L. Rolfhus and P. L. Ackerman, 1999, Journal of Educational Psychology, 91(3), p. 520.Copyright © 1999 by the American Psychological Association. Adapted with the permission of APA and ofPhillip L. Ackerman.
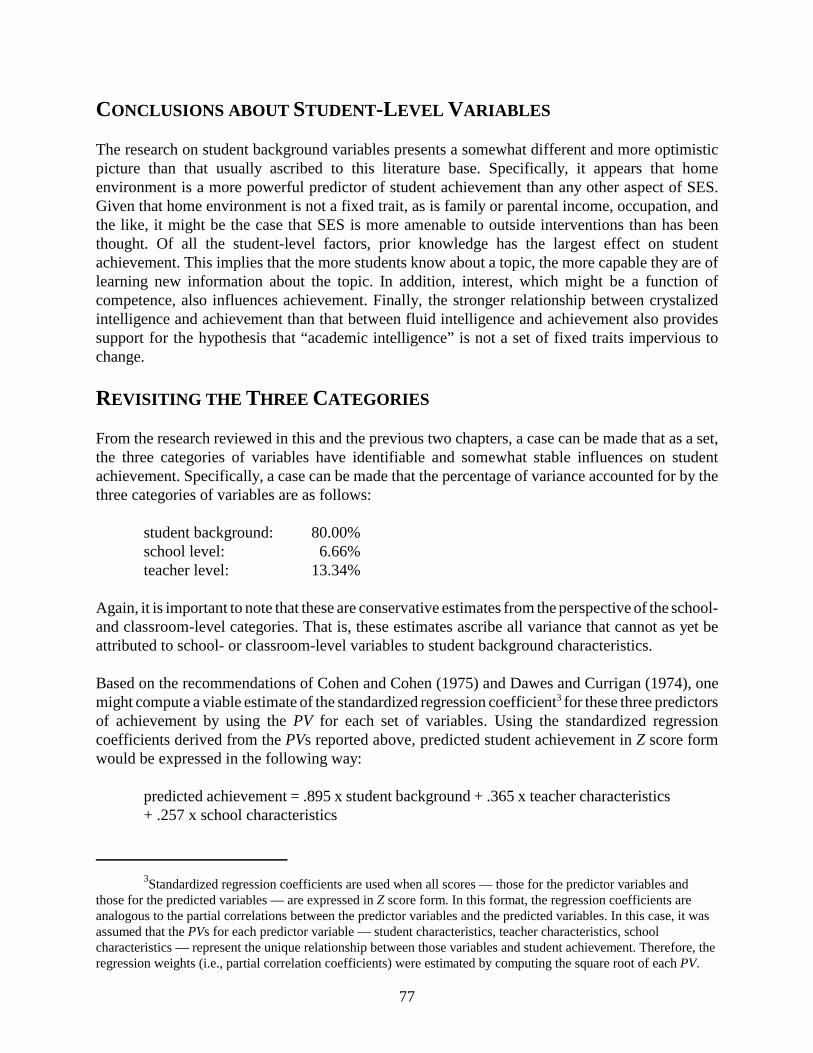
3Standardized regression coefficients are used when all scores — those for the predictor variables andthose for the predicted variables — are expressed in Z score form. In this format, the regression coefficients areanalogous to the partial correlations between the predictor variables and the predicted variables. In this case, it wasassumed that the PVs for each predictor variable — student characteristics, teacher characteristics, schoolcharacteristics — represent the unique relationship between those variables and student achievement. Therefore, theregression weights (i.e., partial correlation coefficients) were estimated by computing the square root of each PV.
77
CONCLUSIONS ABOUT STUDENT-LEVEL VARIABLES
The research on student background variables presents a somewhat different and more optimisticpicture than that usually ascribed to this literature base. Specifically, it appears that homeenvironment is a more powerful predictor of student achievement than any other aspect of SES.Given that home environment is not a fixed trait, as is family or parental income, occupation, andthe like, it might be the case that SES is more amenable to outside interventions than has beenthought. Of all the student-level factors, prior knowledge has the largest effect on studentachievement. This implies that the more students know about a topic, the more capable they are oflearning new information about the topic. In addition, interest, which might be a function ofcompetence, also influences achievement. Finally, the stronger relationship between crystalizedintelligence and achievement than that between fluid intelligence and achievement also providessupport for the hypothesis that “academic intelligence” is not a set of fixed traits impervious tochange.
REVISITING THE THREE CATEGORIES
From the research reviewed in this and the previous two chapters, a case can be made that as a set,the three categories of variables have identifiable and somewhat stable influences on studentachievement. Specifically, a case can be made that the percentage of variance accounted for by thethree categories of variables are as follows:
student background: 80.00%school level: 6.66%teacher level: 13.34%
Again, it is important to note that these are conservative estimates from the perspective of the school-and classroom-level categories. That is, these estimates ascribe all variance that cannot as yet beattributed to school- or classroom-level variables to student background characteristics.
Based on the recommendations of Cohen and Cohen (1975) and Dawes and Currigan (1974), onemight compute a viable estimate of the standardized regression coefficient3 for these three predictorsof achievement by using the PV for each set of variables. Using the standardized regressioncoefficients derived from the PVs reported above, predicted student achievement in Z score formwould be expressed in the following way:
predicted achievement = .895 x student background + .365 x teacher characteristics+ .257 x school characteristics

4Z score form is standard score form. Observed scores are translated to Z score form using the followingformula:
where x is the observed score, � is the mean of the set of scores, and SD is the standard deviation of the set of scores.
x – � SD
78
Using this equation, one can compute the predicted scores in Z score form4 for various levels ofstudent background, school characteristics, and classroom characteristics, as shown in Table 6.8.
Six situations are shown in Table 6.8:
• Situation 1: The achievement of students with an “average teacher” in an averageschool
• Situation 2: The achievement of students with an ineffective teacher in anineffective school
• Situation 3: The achievement of students with an ineffective teacher in anexceptional school
• Situation 4: The achievement of students with an exceptional teacher in anineffective school
• Situation 5: The achievement of students with an exceptional teacher in anexceptional school
• Situation 6: The achievement of students with an average teacher in anexceptional school
Conceptually, one might think of an exceptional teacher as one who makes optimum use of theteacher-level variables discussed in Chapter 5. More specifically, that teacher’s use of these variablesplaces him at the extreme positive end of the distribution of all teachers. The average teacher is onewhose use of the teacher-level variables places him in the middle of the distribution, and theineffective teacher is one whose use of the teacher-level variables places him at the extreme negativeend of the distribution. The same interpretation can be applied to schools. The exceptional schoolis one whose use of the school-level variables places it at the extreme positive end of thedistribution; an average school is in the middle of the distribution relative to its us of the school-levelvariables, and the ineffective school is at the extreme negative end of the distribution.
For each of the six situations included in Table 6.8, the predicted score for seven hypotheticalstudents is presented. One student enters school with achievement in a particular subject that placeshim at –3.00 standard deviations — the student is performing at the extreme negative end of thedistribution in that subject area. Another student enters the school performing at –2.00 standarddeviations and another at –1.00 standard deviations. The student with an entrance Z score of 0 isperforming precisely in the middle of the distribution. Finally, the next three students enterperforming at +1.00, +2.00, and +3.00 standard deviations, respectively. In short, the sevenhypothetical students broadly represent the range of student achievement in a given subject area.
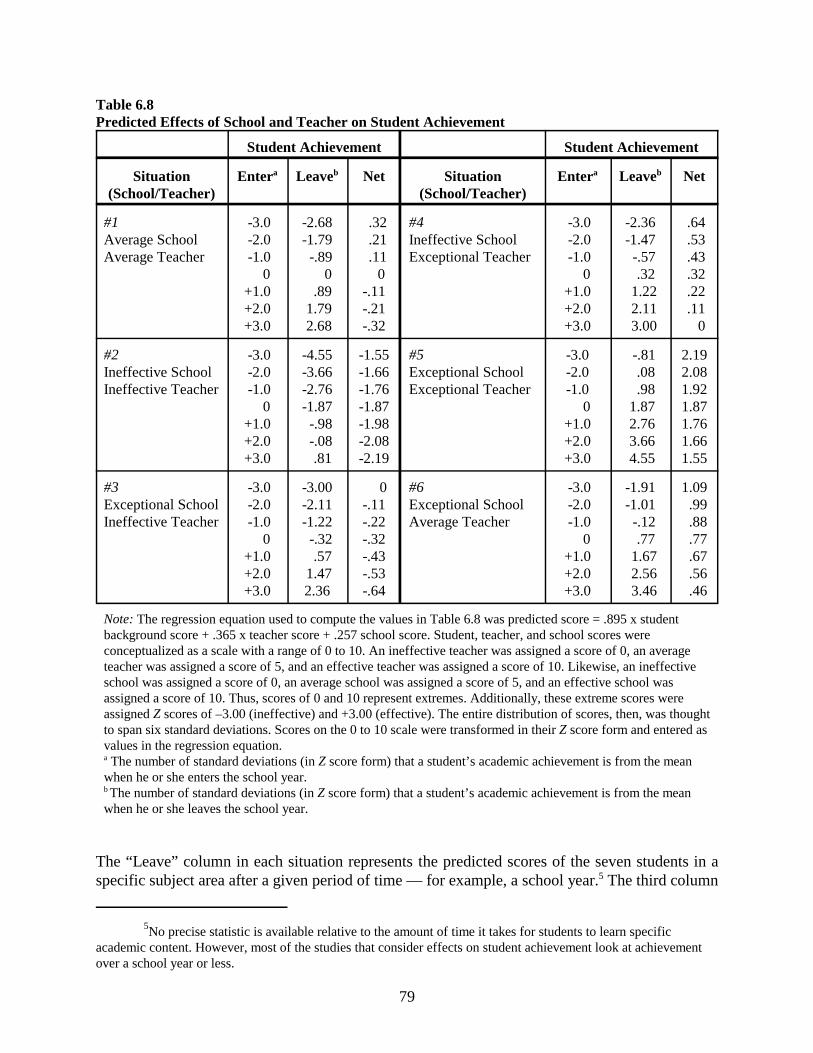
5No precise statistic is available relative to the amount of time it takes for students to learn specificacademic content. However, most of the studies that consider effects on student achievement look at achievementover a school year or less.
79
Table 6.8Predicted Effects of School and Teacher on Student Achievement
Student Achievement Student Achievement
Situation(School/Teacher)
Entera Leaveb Net Situation(School/Teacher)
Entera Leaveb Net
#1Average SchoolAverage Teacher
-3.0 -2.0 -1.0 0+1.0+2.0+3.0
-2.68-1.79 -.89 0 .89 1.79 2.68
.32 .21 .11 0-.11-.21-.32
#4Ineffective SchoolExceptional Teacher
-3.0 -2.0 -1.0 0+1.0+2.0+3.0
-2.36-1.47 -.57 .32 1.22 2.11 3.00
.64 .53 .43 .32 .22 .11 0
#2Ineffective SchoolIneffective Teacher
-3.0 -2.0 -1.0 0+1.0+2.0+3.0
-4.55-3.66-2.76-1.87 -.98 -.08 .81
-1.55-1.66-1.76-1.87-1.98-2.08-2.19
#5Exceptional SchoolExceptional Teacher
-3.0-2.0-1.0 0+1.0+2.0+3.0
-.81 .08 .98 1.87 2.76 3.66 4.55
2.192.081.921.871.761.661.55
#3Exceptional SchoolIneffective Teacher
-3.0 -2.0 -1.0 0+1.0+2.0+3.0
-3.00-2.11-1.22 -.32 .57 1.472.36
0-.11-.22-.32-.43-.53-.64
#6Exceptional SchoolAverage Teacher
-3.0 -2.0 -1.0 0+1.0+2.0+3.0
-1.91-1.01 -.12 .77 1.67 2.56 3.46
1.09 .99 .88 .77 .67 .56 .46
Note: The regression equation used to compute the values in Table 6.8 was predicted score = .895 x studentbackground score + .365 x teacher score + .257 school score. Student, teacher, and school scores wereconceptualized as a scale with a range of 0 to 10. An ineffective teacher was assigned a score of 0, an averageteacher was assigned a score of 5, and an effective teacher was assigned a score of 10. Likewise, an ineffectiveschool was assigned a score of 0, an average school was assigned a score of 5, and an effective school wasassigned a score of 10. Thus, scores of 0 and 10 represent extremes. Additionally, these extreme scores wereassigned Z scores of –3.00 (ineffective) and +3.00 (effective). The entire distribution of scores, then, was thoughtto span six standard deviations. Scores on the 0 to 10 scale were transformed in their Z score form and entered asvalues in the regression equation.a The number of standard deviations (in Z score form) that a student’s academic achievement is from the meanwhen he or she enters the school year.b The number of standard deviations (in Z score form) that a student’s academic achievement is from the meanwhen he or she leaves the school year.
The “Leave” column in each situation represents the predicted scores of the seven students in aspecific subject area after a given period of time — for example, a school year.5 The third column

80
in each situation — “Net” — represents the net gain or loss in Z score units at the end of the schoolyear. To illustrate, consider situation 1 (average school, average teacher) and the student who entersthe class performing at the mean — his Z score is 0. That student will leave the year-long courseperforming at exactly the same place in terms of the distribution of student scores for that subjectarea — a Z score of 0. This is not to say that learning has not occurred. Indeed, recall Hattie’s (1992)conclusions reported in Chapter 3. Specifically, Hattie estimated that one can expect an effect size(ESd) of .24 standard deviations due to maturation only. Our student entering the course performingat 0 standard deviations has learned, then, but he has not increased in standing relative to otherstudents.
Table 6.8 paints an interesting picture of the influence of student background variables, teacher-levelvariables, and school-level variables on student achievement. Prior to discussing this picture, it isimportant to note that the predictions in Table 6.8 are based on the deductively inferred theoreticalregression equation described earlier in this section. That model is surely a rough approximation onlyof the real-world relationships between student background variables, teacher-level variables, school-level variables, and academic achievement. The note at the end of this chapter describes some of theassumptions made in this model that may not mirror the real-world relationships among thesecategories of variables.
This caution aside, the figures listed in Table 6.8 are fodder for some thought-provoking hypotheses.They suggest that average schools and average teachers (situation 1), although they do little harm,do little to influence students’ relative position on the distribution of achievement scores for allstudents. Those students who enter with relatively low standings exit with relatively low standings.Those who enter with relatively high standings exit with relatively high standings. Finally, thestudent who enters the course in the middle of the distribution (Z = 0) exits the course in the sameposition — the middle of the distribution.
The ineffective teacher in the ineffective school (situation 2) appears to have a negative impact onthe standings of all students in his class. According to Table 6.8, the student who enters the classperforming in the center of the score distribution (Z = 0), leaves the course with a Z score of –1.87.Even the student in the class of an ineffective teacher embedded in an exceptional school (situation3) appears to lose ground in terms of relative achievement. The student who enters that teacher’scourse achieving in the middle of the score distribution (Z = 0) leaves performing below the meanof the distribution.
Situation 4 — the exceptional teacher in an ineffective school — produces some surprising results.All students either maintain their standing or increase it. The student entering the course performingat the middle of the distribution (Z = 0) leaves performing one-third of a standard deviation abovethe mean (Z = .32). Of course the exceptional teacher in the exceptional school (situation 5) producesthe greatest gains in student achievement. The student entering the course in the center of the scoredistribution (Z = 0) exits performing almost two standard deviations above the mean (Z = 1.87).Finally, even the average teacher in an effective school (situation 6) produces positive effects. Thestudent who enters the course performing in the center of the score distribution exits performingalmost three-fourths of a standard deviation above the mean (Z = .77).
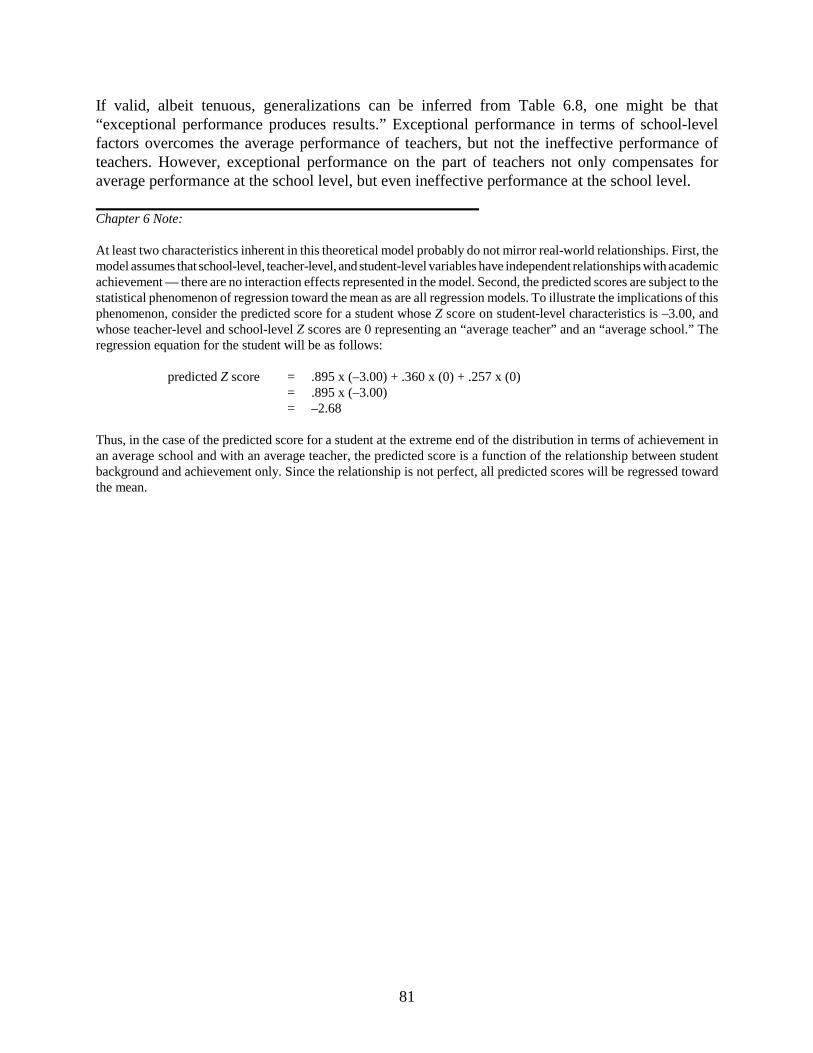
81
If valid, albeit tenuous, generalizations can be inferred from Table 6.8, one might be that“exceptional performance produces results.” Exceptional performance in terms of school-levelfactors overcomes the average performance of teachers, but not the ineffective performance ofteachers. However, exceptional performance on the part of teachers not only compensates foraverage performance at the school level, but even ineffective performance at the school level.
Chapter 6 Note:
At least two characteristics inherent in this theoretical model probably do not mirror real-world relationships. First, themodel assumes that school-level, teacher-level, and student-level variables have independent relationships with academicachievement — there are no interaction effects represented in the model. Second, the predicted scores are subject to thestatistical phenomenon of regression toward the mean as are all regression models. To illustrate the implications of thisphenomenon, consider the predicted score for a student whose Z score on student-level characteristics is –3.00, andwhose teacher-level and school-level Z scores are 0 representing an “average teacher” and an “average school.” Theregression equation for the student will be as follows:
predicted Z score = .895 x (–3.00) + .360 x (0) + .257 x (0)= .895 x (–3.00)= –2.68
Thus, in the case of the predicted score for a student at the extreme end of the distribution in terms of achievement inan average school and with an average teacher, the predicted score is a function of the relationship between studentbackground and achievement only. Since the relationship is not perfect, all predicted scores will be regressed towardthe mean.


PART III:APPLICATIONS


85
Chapter 7USING THE KNOWLEDGE BASE ABOUT SCHOOL EFFECTIVENESS
Chapters 4, 5, and 6 attempted to establish the relative effects of three categories of variablesinfluencing student achievement: school-level variables, classroom-level variables, and student-levelvariables. The key variables in each category of variables, as described in the previous three chapters,are reported in Table 7.1.
Table 7.1Categories and Key Variables
Category Key Variables
School
& Opportunity to learn& Time& Monitoring& Pressure to achieve& Parent involvement& School climate& Leadership& Cooperation
Teacher& Instruction& Curriculum design& Classroom management
Student& Home atmosphere& Prior knowledge& Aptitude& Interest
Given that Table 7.1 represents a fairly accurate accounting of the key variables within each of thethree categories, a useful question is, How might educators use this information? This chapterconsiders three possible uses of this information: (1) as a model for staff development, (2) as a modelfor evaluation, and (3) as a model for data-driven school improvement.
STAFF DEVELOPMENT
As a model of staff development, the knowledge base about the three categories of variables wouldbe used as the framework for a curriculum to be delivered to staff members in a school. To illustrate,Table 7.2 provides a brief description of the strategies that might be presented to staff members ina school for each of the variables in each of the three categories of variables.

86
Table 7.2Strategies for Key Variables
Category Variable Strategies
School Opportunity tolearn
• strategies for aligning the curriculum and achievement tests• strategies for designing assessments aligned with the curriculum• strategies for ensuring that the curriculum is covered
Time • strategies for increasing the amount of allocated time• strategies for decreasing absenteeism and tardiness
Monitoring • strategies for setting school-wide achievement goals for students• strategies for collecting and reporting data on student
achievement
Pressure toachieve
• strategies for communicating the importance of students’academic achievement
• strategies for celebrating and displaying student achievement
Parentalinvolvement
• strategies for involving parents in policy decisions• strategies for gaining parental support for policy decisions
Climate • strategies for identifying and communicating school rules andprocedures
• strategies for implementing and enforcing school rules andprocedures
Leadership • strategies for articulating leadership roles• strategies for transferring and communicating key information• strategies for group decision making
Cooperation • strategies for developing consensus around key issues• strategies for increasing the frequency and quality of informal
contacts among staff members• strategies for establishing and implementing behavioral norms
among staff
Teacher Instruction • teaching strategies that� enhance students’ abilities to identify similarities and
differences� enhance students’ abilities to summarize and take notes� reinforce effort and provide recognition� enhance the effectiveness of homework and practice� enhance students’ abilities to generate nonlinguistic
representations� provide students with opportunities to engage in cooperative
learning� enhance the effectiveness of academic goals and provide
students with feedback� enhance students’ abilities to generate and test hypotheses� activate students’ prior knowledge

Category Variable Strategies
87
Curriculumdesign
• planning strategies that� enhance the manner in which instruction goals are ordered
and paced within and between units� enhance the manner in which instructional activities are
ordered and paced within and between units
Classroommanagement
• strategies that enhance the identification and implementation ofrules and procedures for• room use• seatwork• group work• discipline
Student Homeatmosphere
• strategies for enhancing the extent to which parents provide theirchildren with an environment that supports academicachievement
Aptitude andprior knowledge
• strategies for enhancing students’ general backgroundknowledge
Interest • strategies for identifying and tapping into students’ interests
Rather than present information about all of the strategies listed in Table 7.2, the most salient needsfor a school would first be identified. This can be accomplished by collecting direct data on eachelement identified in Table 7.2 or by collecting perceptual data on each element. To illustrate,consider the school-level factor of time. A school could collect direct data on this factor bydetermining the actual amount of time allocated to instruction and the amount of time lost toabsenteeism, or the school could collect data from teachers and administrators about theirperceptions of the extent to which time was used effectively. The perceptual data are probably lessaccurate but easier to collect.
Regardless of the method used to collect data, those variables whose values are perceived as lessthan optimal would be targeted as the focus for staff development. This approach has been labeledthe “rational decision-making model” (Sproull & Zubrow, 1981) in that it assumes that the threecategories of variables have a straightforward, stable relationship with achievement in all schools.If a school can simply identify those variables on which it is not performing well, it can pinpoint andreceive the information it needs to improve student achievement. As straightforward as this approachsounds, it has been severely criticized (see Murnane, 1987; Willms, 1992). To illustrate, Willms(1992) makes the following comments about this approach:
Our knowledge about how schools have their efforts on instructional outcome isinadequate to support this kind of management strategy. . . . I doubt whether anothertwo decades of research will . . .help us specify a model for all seasons — a modelthat would apply to all schools in all communities at all times. (p. 65)

88
EVALUATION
In the service of evaluation, the knowledge base about the three categories of variables developedin this monograph can be used to identify the achievement gain that can be associated with school-and teacher-level variables as opposed to student variables. In effect, an evaluation model seeks to“evaluate” schools by determining how much of the variance in student achievement in a particularschool is attributable to school- and teacher-level variables as opposed to student backgroundvariables.
Perhaps the most well-known evaluation model is that used by Sanders and his colleagues, discussedbriefly in Chapter 5. That evaluation model uses the linear equation described in Table 7.3.
Table 7.3Wright et al.’s (1997) Linear Equation
Y = M + S + H + C + H*C + T (S*H*C*) + A*S + A*H + A*C + A*H*C + A*T (S*H) + E
Y is the gain score for an individual studentM is the overall meanS is the schoolH is the level of heterogeneity (in achievement) at the classroom levelC is the class sizeH*C is the heterogeneity-by-class size interactionT(S*H*C) is the teacher nested within a particular school (S) within a particular level of
heterogeneity (H) within a particular class size (C)A is the achievement level (broken down into four groups) for the studentA*S is the achievement-by-system interactionA*H is the achievement-by-heterogeneity interactionA*C is the achievement-by-class size interactionA*H*C* is the achievement-by-heterogeneity-by-class size interactionA*T(S*H*C) is the achievement-by-teacher interactionE is the error term
Note: See “Teacher and Classroom Context Effects on Student Achievement: Implications for TeacherEvaluation,” by S. P. Wright, S. P., Horn, and W. L. Sanders, 1997, Journal of Personnel Evaluation inEducation, 11, 57–67, specifically page 58.All terms are considered fixed effects with the exception of T(S*H*C*), A*T(T*H*C), and E.
The model described in Table 7.3 allows for the determination of the effect of a particular teacher(T) within a particular school (S) with a specific level of in-class heterogeneity (H) for a specificclass size (C). This effect is reflected in the term T*(S*H*C) and can be examined while controllingfor the effect of in-class heterogeneity (H), the achievement level of students (A), class size (C), theoverall effects of the school (S), and the various interaction terms included in the model. The modelcould just as easily be used to evaluate the effect of the school (S) after partitioning out the effectsof factors A, C, H, the nested teacher factor (T), and the various interaction terms explicit in themodel.

1Commonly, the student background variable P is “centered” around the district mean. For example, if thebackground characteristic were SES as indicated by family income, a given student’s score on this variable, P,would be centered by subtracting the average family income level in the district. This would render �0jk the expectedachievement score of a class where students exhibited average SES as measured by family income.
89
A growing trend in the evaluation literature is the use of HLM (see Byrk & Raudenbush, 1992) toestimate the effects of various factors. HLM designs use “levels” of regression equations. Toillustrate, consider the three-level hierarchical linear model described by Scheerens and Bosker,described in Table 7.4.
Table 7.4Scheerens and Bosker’s Three-Level Hierarchical Linear Model
Yijk = �0jk + �1Pijk + Rijk (student level)�0jk = �00k + �001Tjk + U0jk (teacher level)�00k = 000 + 001Sk + V00k (school level)
Yijk represents the achievement score of pupil i in a class taught by teacher j in school k. �0jk is the class-specific intercept.�00k is the school-level intercept. P is a student background variable.T represents a teacher-level variable.Sk represents a school-level variable. Rijk represents the error or residual term at the student level.U0jk represents the error or residual term at the teacher level. V00k represents the error or residual term at the school level.�1 is the regression coefficient representing the effect of the student background characteristics onachievement.�001 is the regression coefficient for the teacher variable. 001 is the regression coefficient for the school variable. 000 represents the grand mean.
Note: See The Foundations of Educational Effectiveness (p. 60), by J. Scheerens and R. J. Bosker, 1997, NewYork: Elsevier.
Using Scheerens and Bosker’s model, there would be a unique student-level equation for everystudent in the study, a unique teacher-level equation for every teacher in the study, and a uniqueschool-level equation for every teacher in the study. In the student-level equation, the achievementscore of a specific pupil in a class taught by a specific teacher in a specific school (Yijk ) is the sumof the class-specific intercept (�0jk), the background characteristics of a specific student as measuredon some scale (Pijk)
1 multiplied by the regression coefficient representing the effect of the studentbackground characteristics on achievement (�1 ), and all student-level variation not accounted forby the rest of the model (Rijk). The teacher-level equation decomposes the class-specific intercepts(�0jk) in the student-level equation. In effect, the teacher-level analysis seeks to account for thedifferences between class intercepts — differences in achievement from class to class. The school-level equation decomposes the school-level intercept (i.e., �00k) in the teacher-level equation.

90
HLM analysis is generally preferred over the use of the nonhierarchical designs (i.e., Sanders’approach) when assessing the effects of teachers or schools in that a system of equations like thatjust described allows for the simultaneous estimation of
1. the effects of student background characteristics on the achievement of studentsnested within classes;
2. the effect of teacher-level variables on the achievement of individual classesnested within schools; and
3. the effect of school-level variables on the achievement of individual schoolsnested within a district.
Although these same effects might be estimated using a model that is not hierarchical, HLM providesfor more precision in that error terms (i. e., Rijk, U0jk, V00k) are computed for each level of analysis,whereas with non-HLM designs, the errors associated with students, teachers, and schools areconfounded in a single term.
The knowledge base reviewed in this monograph might be used to improve the precision ofevaluation models in that sets of student background variables, teacher-level variables, and school-level variables might be included in the evaluation equations and their impact on achievementaccounted for. To illustrate, consider the student-level equation in the hierarchical model justdiscussed: Yijk = �0jk + �1Pijk + Rijk. As described, the equation includes one student-level variable,P, with its associated regression weight, �1. Given the discussion on student-level variables inChapter 6, this equation could be expanded to include four student-level variables: home atmosphere(P1), student prior knowledge of the content (P2), student interest in the topic (P3), and studentaptitude (P4). The student-level HLM equation would be Yijk = �0jk + �1P1ijk + B2P2ijk + B3P3ijk + B4P4ijk
+ Rijk.
The estimates of �0jk, then, would represent the individual class means corrected for these fourstudent-level variables. Comparing �0jk terms within a school would be tantamount to comparingstudent achievement between classes for which the initial differences in four key student backgroundvariables had been accounted. The same type of comparison between schools could be made afterteacher characteristics had been accounted for by including key teacher-level predictor variables inthe teacher-level equation, and so on. In short, the knowledge base regarding student-, teacher-, andschool-level variables allows for the specification of evaluation equations with more variables, whichin turn leads to more precision in the evaluation of teachers, schools, and districts.
DATA-DRIVEN SCHOOL IMPROVEMENT
The final use of the knowledge base developed in this monograph is for “data-driven schoolimprovement.” Although it is clear that previous approaches to school improvement (see previousdiscussion of the staff development approach) do not take into consideration the unique features ofspecific teachers and specific schools, data-driven school improvement provides for just that. Usingthis approach, a school first determines the relationship between school-level variables, teacher-levelvariables, student-level variables, and student achievement. This might be done by applying an HLMmodel with multiple predictors at each level as described in the previous section. Data could be

91
collected on student achievement and each predictor variable and their respective regression weightsestimated. These regression weights would be considered“baseline” effects.
The schools and teachers involved in the data-driven school improvement effort would then identifyspecific school- and teacher-level innovations they believe have a high potential for enhancingstudent achievement. These innovations would be implemented for a specific period of time andthen student achievement data would again be collected. To illustrate how data-driven schoolimprovement might be used, consider the following scenario.
A district wishing to engage in a data-driven school reform effort first gathers information on eachschool regarding the following:
1. The extent to which the articulated curriculum is actually taught by teachers andcovers key concepts in the state-level test
2. The extent to which instructional time is used effectively3. The extent to which specific achievement goals are articulated and progress
toward those goals monitored4. The extent to which the school communicates a clear message that student
achievement is a primary goal5. The extent to which parents are involved in and support school policies6. The extent to which an orderly atmosphere is established and maintained7. The extent to which the school establishes and maintains a cooperative
atmosphere8. The extent to which leadership roles are clearly articulated and consensus is
promoted
In addition, the district gathers data from each teacher on the following variables:
1. Use of effective instructional strategies2. Use of effective management techniques3. Effective unit planning
From students, data relative to the following variables are collected:
1. General aptitude2. Family support for academics3. Student interest in the topics presented at school4. The general knowledge base of students
Of course, a district might elect not to gather data on all school-level, teacher-level, and student-levelvariables, opting instead to focus on those variables for which data are most easily obtained. For thisdiscussion, however, we assume that a district wishes to collect data on all variables at each level.
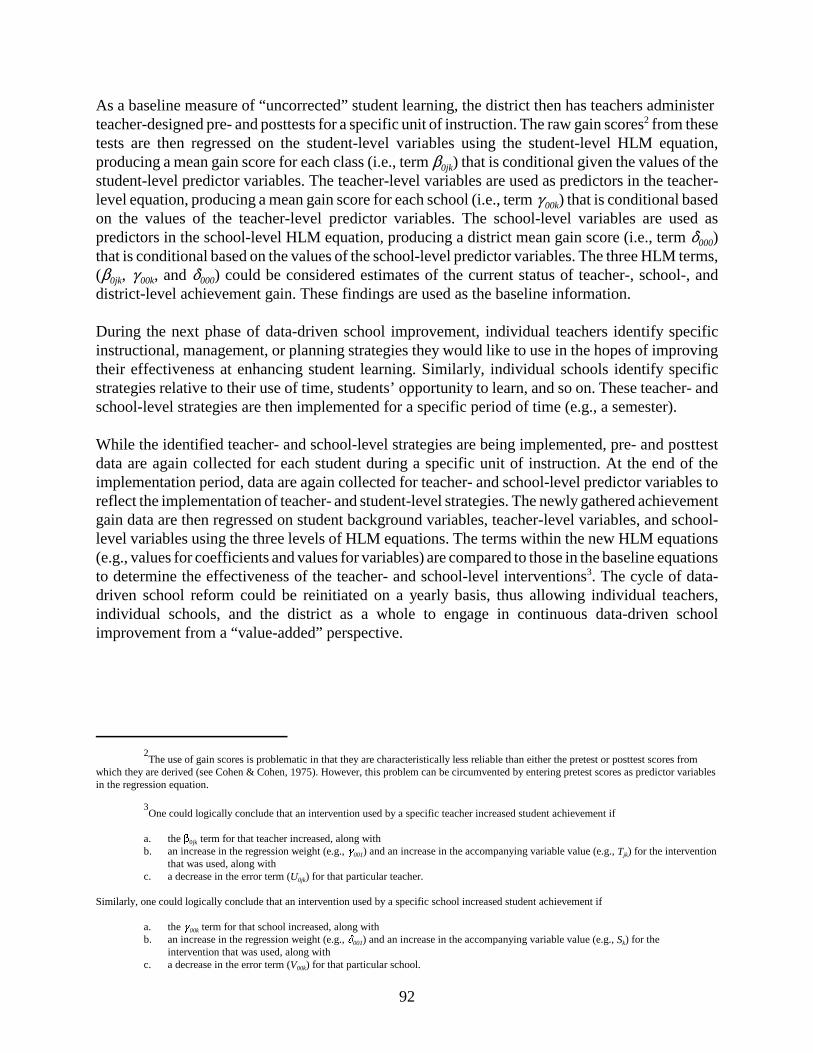
2The use of gain scores is problematic in that they are characteristically less reliable than either the pretest or posttest scores from
which they are derived (see Cohen & Cohen, 1975). However, this problem can be circumvented by entering pretest scores as predictor variablesin the regression equation.
3One could logically conclude that an intervention used by a specific teacher increased student achievement if
a. the �0jk term for that teacher increased, along withb. an increase in the regression weight (e.g., �001) and an increase in the accompanying variable value (e.g., Tjk) for the intervention
that was used, along withc. a decrease in the error term (U0jk) for that particular teacher.
Similarly, one could logically conclude that an intervention used by a specific school increased student achievement if
a. the �00k term for that school increased, along withb. an increase in the regression weight (e.g., 001) and an increase in the accompanying variable value (e.g., Sk) for the
intervention that was used, along withc. a decrease in the error term (V00k) for that particular school.
92
As a baseline measure of “uncorrected” student learning, the district then has teachers administer teacher-designed pre- and posttests for a specific unit of instruction. The raw gain scores2 from thesetests are then regressed on the student-level variables using the student-level HLM equation,producing a mean gain score for each class (i.e., term �0jk) that is conditional given the values of thestudent-level predictor variables. The teacher-level variables are used as predictors in the teacher-level equation, producing a mean gain score for each school (i.e., term �00k) that is conditional basedon the values of the teacher-level predictor variables. The school-level variables are used aspredictors in the school-level HLM equation, producing a district mean gain score (i.e., term �000)that is conditional based on the values of the school-level predictor variables. The three HLM terms,(�0jk, �00k, and �000) could be considered estimates of the current status of teacher-, school-, anddistrict-level achievement gain. These findings are used as the baseline information.
During the next phase of data-driven school improvement, individual teachers identify specificinstructional, management, or planning strategies they would like to use in the hopes of improvingtheir effectiveness at enhancing student learning. Similarly, individual schools identify specificstrategies relative to their use of time, students’ opportunity to learn, and so on. These teacher- andschool-level strategies are then implemented for a specific period of time (e.g., a semester).
While the identified teacher- and school-level strategies are being implemented, pre- and posttestdata are again collected for each student during a specific unit of instruction. At the end of theimplementation period, data are again collected for teacher- and school-level predictor variables toreflect the implementation of teacher- and student-level strategies. The newly gathered achievementgain data are then regressed on student background variables, teacher-level variables, and school-level variables using the three levels of HLM equations. The terms within the new HLM equations(e.g., values for coefficients and values for variables) are compared to those in the baseline equationsto determine the effectiveness of the teacher- and school-level interventions3. The cycle of data-driven school reform could be reinitiated on a yearly basis, thus allowing individual teachers,individual schools, and the district as a whole to engage in continuous data-driven schoolimprovement from a “value-added” perspective.

93
EPILOGUE
This monograph provides a quantitative review of the research literature regarding school-, teacher-,and student-level variables that affect student achievement. That review has resulted in a perspectiveon school reform that is far more optimistic than those promoted in the mid 1960s. In fact, thefindings reviewed in this monograph indicate that schools can make profoundly influence studentachievement. Specifically, the conclusions presented imply that student achievement can be stronglyaffected if schools
1. provide teachers with a well-articulated curriculum that specifically addresses thecontent on the assessments that are used to judge the academic achievement ofstudents and ensure that the articulated curriculum is actually taught;
2. optimize their use of instructional time;3. establish specific achievement goals for students and carefully monitor the extent
to which those goals are being met;4. communicate a clear message to all concerned that high academic achievement
is the primary goal of the school;5. involve parents in the processes of setting and enforcing policies;6. maintain an orderly environment for all concerned;7. maintain a cooperative environment for all concerned; and8. involve staff in key decisions and establish clear lines of communication and
leadership roles.
Along with the attention to the eight areas listed above, individual teachers must use the mosteffective instructional strategies, use the most effective managerial techniques, and design classroomcurriculum effectively. This monograph also implies that not all school-level factors must beaddressed equally or in the same way by each school. Similarly, not all teacher-level factors mustbe addressed equally by each teacher, implying that teacher improvement efforts will vary fromteacher to teacher. In an effort to facilitate school- and teacher-specific improvement efforts, thismonograph has articulated a process for data-driven improvement that uses some of the bestavailable data analysis techniques to help make decisions about which interventions should be usedby specific schools and specific teachers, and to evaluate the effectiveness of those interventions.
Finally, and perhaps most speculatively, the conclusions drawn in this monograph imply that evenstudent background characteristics might be altered to some degree in a way that enhances studentachievement. Specifically, student background might be altered by
• providing parents with information, resources, and techniques to make the homeenvironment more conducive to academic achievement; and
• providing students with interventions aimed at increasing their understanding ofa general academic knowledge base.
These suggestions are somewhat bold and highly optimistic given the perspective on school reformspawned in the 1960s. Even though there is a research base to support these recommendations,carrying them out will require the efforts of dedicated educators across all levels of the K–12 system.


95
REFERENCES
Abelson, R. P. (1985). A variance explained paradox: When a little is a lot. PsychologicalBulletin, 97, 166–169.
Ackerman, P. L. (1996). A theory of adult intellectual development: Process, personality,interests, and knowledge. Intelligence, 22, 227–257.
Alexander, P. A., & Judy, J. E. (1988). The interaction of domain-specific and strategicknowledge in academic performance. Review of Educational Research, 58(4), 375–404.
Alexander, P. A., Kulikowich, J. M., & Jetton, T. L. (1994). The role of subject-matterknowledge and interest in the processing of linear and nonlinear texts. Review ofEducational Research, 64(2), 201–252.
Alexander, P. A., Kulikowich, J. M., & Schulze, S. K. (1994). How subject-matter knowledgeaffects recall and interest. Review of Educational Research, 31(2), 313–337.
Anania, J. (1982). The effects of quality of instruction on the cognitive and affective learning ofstudents. (Doctoral dissertation, University of Chicago, 1981). Dissertation AbstractsInternational, 42, 4269A.
Anania, J. (1983). The influence of instructional conditions on student learning and achievement.Evaluation in Education: An International Review Series, 7(1), 1–92.
Austin, G. R. (1978). Process evaluation: A comprehensive study of outliers. Baltimore:Maryland State Department of Education.
Austin, G. R. (1979). An analysis of outlier exemplary schools and their distinguishingcharacteristics. College Park, MD: University of Maryland. Paper prepared for AERAannual meting, Los Angeles.
Austin, G. R. (1981). Exemplary schools and their identification. College Park, MD: Universityof Maryland, Center for Educational Research and Development. Unpublished paper.
Bennett, W. J. (1992). The de-valuing of America: The fight for our culture and our children.New York: Summit Books.
Berliner, D. C. (1979). Tempus educare. In P. L. Peterson & H. J. Walberg (Eds.), Research onteaching: Concepts, findings, and implications (pp. 120–135). Berkeley, CA: McCutchan.
Biggs, J. B., & Collis, K. F. (1982). Evaluating the quality of learning: The SOLO taxonomy.New York: Academic Press.

96
Bjorklund, D. F. (1985). The role of conceptual knowledge in the development of organization inchildren’s memory. In C. J. Brainerd & M. Pressley (Eds.), Basic processes in memorydevelopment (pp. 103–142). New York: Springer-Verlag.
Bloom, B. S. (1976). Human characteristics and school learning. New York: McGraw-Hill.
Bloom, B. S. (1984a). The search for methods of group instruction as effective as one-to-onetutoring. Educational Leadership, 41(8), 4–18.
Bloom, B. S. (1984b). The 2 sigma problem: The search for methods of instruction as effectiveas one-to-one tutoring. Educational Researcher, 13(6), 4–16.
Boocock, S. S. (1972). An introduction to the sociology of learning. Boston: Houghton-Mifflin.
Borg, W. R. (1980). Time and school learning. In C. Denham & A. Lieberman (Eds.), Time tolearn (pp. 33–72). Washington, DC: National Institute of Education, U.S. Department ofEducation.
Bosker, R. J. (1992). The stability and consistency of school effects in primary education.Enschede: University of Twente.
Bosker, R. J., & Witziers, B. (1995, January). School effects, problems, solutions and a meta-analysis. Paper presented at the International Congress for School Effectiveness andSchool Improvement, Leeuwarden, The Netherlands.
Bosker, R. J., & Witziers, B. (1996). The magnitude of school effects. Or: Does it really matterwhich school a student attends? Paper presented at the annual meeting of the AmericanEducational Research Association, New York.
Boulanger, D. F. (1981). Ability and science learning. Journal of Research in Science Teaching,18(2), 113–121.
Brookover, W. B., & Lezotte, L. W. (1979). Changes in school characteristics coincident withchanges in student achievement. East Lansing: Institute for Research on Teaching,Michigan State University. (ERIC Document Reproduction Service No. ED 181 005)
Brookover, W. B., & Schneider, J. M. (1975). Academic environments and elementary schoolachievement. Journal of Research and Development in Education, 9(1), 82–91.
Brookover, W. B., Beady, C., Flood, P., Schweitzer, J., & Wisenbaker, J. (1979). School socialsystems and student achievement: Schools can make a difference. New York: Praeger.
Brookover, W. B., Schweitzer, J. G., Schneider, J. M., Beady, C. H., Flood, P. K., &Wisenbaker, J. M. (1978). Elementary school social climate and school achievement.American Research Journal, 15, 301–318.

97
Brophy, J. E., & Good, T. L. (1970). Teacher communication of differential expectations forchildren’s classroom performance. Journal of Educational Psychology, 61, 365–374.
Bruggencate, C. G., Pelgrum, W. J., & Plomp, T. (1986). First results of the Second IEA ScienceStudy in the Netherlands. In W. J. Nijhof & E. Warries (Eds.), Outcomes of educationand training. Lisse: Swets & Zeitlinger.
Burke, A. J. (1984). Students’ potential for learning contrasted under tutorial and groupapproaches to instruction (Doctoral dissertation, University of Chicago, 1983).Dissertation Abstracts International, 44, 2025A.
Byrk, A. S., & Raudenbush, S. W. (1992). Hierarchical linear models. New York: Sage.
Cahen, S., & Davis, D. (1987). A between-grade levels approach to the investigation of theabsolute effects of schooling on achievement. American Educational Research Journal,24, 1–2.
Carroll, J. B. (1963). A model of school learning. Teachers College Record, 64, 723–733.
Cattell, R. B. (1987). Intelligence: Its structure, growth and action (Rev. ed.). Amsterdam: NorthHolland Press. (Original work published 1971)
Charters, W. W., Jr. (1963). The social background of teaching. In N. L. Gage (Ed.), Handbookof research on teaching (Ch. 14). Chicago: Rand McNally.
Chi, M. T. H., & Ceci, S. J. (1987). Content knowledge: Its role, representation, and restructuringin memory development. In H. W. Reese (Ed.), Advances in child development andbehavior (Vol. 20, pp. 91–142). Orlando, FL: Academic Press.
Chi, M. T. H., Glaser, R., & Farr, M. (1988). The nature of expertise. Hillsdale, NJ: Erlbaum.
Clark, C. M., & Yinger, R. J. (1979). Teacher’s thinking. In P. L. Peterson & H. J. Walberg(Eds.), Research in teaching: Concepts, findings and implications (pp. 231–263).Berkeley, CA: McCutchan.
Cobb, C. W., & Douglas, P. H. (1928). A theory of production. American Economic Review(supplement), 139–165.
Cohen, J. (1988). Statistical power for the behavioral sciences. Hillsdale, NJ: Erlbaum.
Cohen, J., & Cohen, P. (1975). Applied multiple regression/correlation analysis for thebehavioral sciences. New York: John Wiley & Sons.
Cohen, M. (1981). Effective schools: What the research says. Today’s Education, April/May,466–496.

98
Coleman, J. S., Campbell, E. Q., Hobson, C. J., McPartland, J., Mood, A. M., Weinfield, F. D.,& York, R. L. (1966). Equality of educational opportunity. Washington, DC: U. S.Government Printing Office.
Cooper, H. M. (1989). Homework. White Plains, NY: Longman.
Cooper, H. M., & Rosenthal, R. (1980). Statistical versus traditional procedures for summarizingresearch findings. Psychological Bulletin, 87, 442–449.
Cotton, K. (1995). Effective schooling practices: A research synthesis. 1995 update. SchoolImprovement Research Series. Portland, OR: Northwest Regional EducationalLaboratory.
Creemers, B. P. M. (1994). The effective classroom. London: Cassell.
Dawes, R. M., & Corrigan, B. (1974). Linear models in decision making. Psychological Bulletin,81, 95–100.
Denham, C., & Lieberman, A. (Eds.). (1980). Time to learn. Washington, DC: National Instituteof Education, U.S. Department of Education.
Dochy, F. (1992). Assessment of prior knowledge as a determinant for future learning. London:Jessica Kingsley. (http://ericae.net/books/dochy1/)
Dochy, F., Segers, M., & Buehl, M. M. (1999). The relationship between assessment practicesand outcomes of studies: The case of research on prior knowledge. Review of EducationalResearch, 69(2), 145–186.
Edmonds, R. R. (1979a). A discussion of the literature and issues related to effective schooling.Cambridge, MA: Center for Urban Studies, Harvard Graduate School of Education.
Edmonds, R. R. (1979b, October). Effective schools for the urban poor. Educational Leadership,37, 15–27.
Edmonds, R. R. (1979c). Some schools work and more can. Social Policy, 9, 28–32.
Edmonds, R. R. (1981a). Making public schools effective. Social Policy, 12(2).
Edmonds, R. R. (1981b). A report on the research project, “Search for effective schools...” andcertain of the designs for school improvement that are associated with the project.Unpublished report prepared for NIE. East Lansing, MI: The Institute for Research onTeaching, College of Education, Michigan State University.
Edmonds, R. R., & Frederiksen, J. R. (1979). Search for effective schools: The identification andanalysis of city schools that are instructionally effective for poor children. (ERICDocument Reproduction Service No. ED 170 396)

99
Elberts, R. W., & Stone, J. A. (1988). Student achievement in public schools: Do principalsmake a difference? Economic Education Review, 1, 291–299.
Emmer, E. T., Evertson, C. M., Sanford, J. P., Clements, B. S., & Worsham, M. E. (1984).Classroom management for secondary teachers. Englewood Cliffs, NJ: Prentice Hall.
Evertson, C. M., Emmer, E. T., Clements, B. S., Sanford, J. P., & Worsham, M. E. (1984).Classroom management for elementary teachers. Englewood Cliffs, NJ: Prentice Hall.
Finn, C. E., Jr. (1991). We must take charge: Our schools and our future. New York: The FreePress.
Fraser, B. J., Walberg, H. J., Welch, W. W., & Hattie, J. A. (1987). Synthesis of educationalproductivity research [Special issue]. Journal of Educational Research, 11(2).
Geisler-Brenstein, E., & Schmeck, R. R. (1996). The revised inventory of learning processes: Amultifaceted perspective on individual differences in learning. In M. Birenbaum & F. J.R. C. Dochy (Eds.), Alternatives in assessment of achievements, learning processes, andprior knowledge (pp. 284–317). Boston: Kluwer.
Glaser, R., Lesgold, A., & Lajoie, S. (1987). Toward a cognitive theory for the measurement ofachievement. In R. R. Ronning, J. Glover, J. C. Conoley, & J. C. Witt (Eds.), Theinfluence of cognitive psychology on testing and measurement (pp. 41–85). Hillsdale, NJ:Erlbaum.
Glass, G. V. (1976). Primary, secondary, and meta-analyses of research. Educational Researcher,5, 3-8.
Glenn, B. C. (1981). What works? An examination of effective schools for poor black children.Cambridge, MA: Center for Law and Education, Harvard University.
Goldstein, H. (1997). Methods of school effectiveness research. School Effectiveness and SchoolImprovement, 8(4), 369–395.
Good, T. L., & Brophy, J. E. (1986). School effects. In M. C. Wittrock (Ed.), Handbook ofresearch on teaching (3rd ed., pp. 570–602). New York: Macmillan.
Hattie, J. (1992). Measuring the effects of schooling. Australian Journal of Education, 36(1),5–13.
Hattie, J., Biggs, J., & Purdie, N. (1996). Effects of learning skills interventions on studentlearning: A meta-analysis. Review of Educational Research, 66(2), 99–136.
Hedges, L. V., & Olkin, I. (1985). Statistical methods for meta-analysis. San Diego, CA:Academic Press.

100
Heurnstein, R. J., & Murray, C. (1994). The bell curve: Intelligence and class structure inAmerican life. New York: The Free Press.
Hirsch, E. D., Jr. (1996). The schools we need and why we don’t have them. New York:Doubleday.
Horn, A., & Walberg, H. J. (1984). Achievement and interest as a function of quantity andquality of instruction. Journal of Educational Research, 77, 227–237.
Hunter, J. E., & Schmidt, F. L. (1990). Methods of meta-analysis: Correcting error and bias inresearch findings. Newbury Park, CA: Sage.
Hunter, M. (1984). Knowing, teaching, and supervising. In P. L. Hosford (Ed.), Using what weknow about teaching (pp. 169–192). Alexandria, VA: Association for Supervision andCurriculum Development.
Husen, T. (1967). International study of achievement in mathematics: A comparison of twelvecountries. New York: Wiley.
Jencks, C., Smith, M. S., Ackland, H., Bane, M. J., Cohen, D., Grintlis, H., Heynes, B., &Michelson, S. (1972). Inequality: A reassessment of the effect of family and schooling inAmerica. New York: Basic Books.
Jensen, A. R. (1980). Bias in mental testing. New York: The Free Press.
Johnson, D., Maruyama, G., Johnson, R., Nelson, D., & Skon, L. (1981). Effects of cooperative,competitive, and individualistic goal structures on achievement: A meta-analysis.Psychological Bulletin, 89(1), 47–62.
Johnson, E. G., & Zwick, R. (1990). Focusing the new design: The NAEP 1988 technical report:The nation’s report card. Princeton, NJ: Educational Testing Service.
Jöreskog, K. G., & Sörbom, D. (1993). LISREL 8: Structural equation modeling with theSIMPLIS command language. Hillsdale, NJ: Erlbaum.
Kifer, E. (2000). Large-scale assessment: Dimensions, dilemmas, and policy. Thousand Oaks,CA: Corwin Press.
Klitgaard, R. E., & Hall, G. R. (1974). Are there unusually effective schools? Journal of HumanResources, 74, 90–106.
Kulik, J. A., & Kulik, C. L. C. (1989). Meta-analysis in education. International Journal ofEducational Research, 13(3), 221–340.

101
Lezotte, L. W., Edmonds, R., & Ratner, G. (1974, September). A final report: Remedy for schoolfailure to equitably deliver basic school skills. East Lansing, MI: Department of Urbanand Metropolitan Studies, Michigan State University.
Lipsey, M. W., & Wilson, D. B. (1993). The efficacy of psychological, educational, andbehavioral treatment. American Psychologist, 48(12), 1181–1209.
Luyten, H. (1994). School effects: Stability and malleability. Enschide: University of Twente.
Madaus, G. F., Airasian, P. W., & Kellaghan, T. (1980). School effectiveness: A reassessment ofthe evidence. New York: McGraw-Hill.
Madaus, G. F., Kellaghan, T., Rakow, E. A., & King, D. (1979). The sensitivity of measures ofschool effectiveness. Harvard Educational Review, 49(2), 207–230.
Manassee, A. L. (1985). Improving conditions for principal effectiveness: Policy implications ofresearch. Elementary School Journal, 85, 439–463.
Marzano, R. J. (1998). A theory-based meta-analysis of research on instruction. Aurora, CO:Mid-continent Research for Education and Learning ( Document Reproduction No. ED427 087)
Marzano, R. J., Gaddy, B. B., & Dean, C. (2000). What works in classroom instruction. Aurora,CO: Mid-continent Research for Education and Learning.
Marzano, R. J., & Kendall, J. S. (with B. B. Gaddy). (1999). Essential knowledge: The debateover what American students should know. Aurora, CO: Mid-continent RegionalEducational Laboratory.
Marzano, R. J., Pickering, D. J., & Pollock, J. E. (2001). Classroom instruction that works:Research-based strategies for increasing student achievement. Alexandria, VA:Association for Supervision and Curriculum Development.
McCormack-Larkin, M., & Kritek, W. J. (1983). Milwaukee’s project RISE. EducationalLeadership, 40, 16–21.
Mosteller, F., & Moynihan, D. P. (1972). A pathbreaking report. In F. Mosteller & D. P.Moynihan (Eds.), On equality of educational opportunity. New York: Vintage Books.
Mulaik, S. A. (1972). The foundation of factor analysis. New York: McGraw-Hill.
Murnane, R. J. (1987). Improving education indicators and economic indicators: The sameproblems? Education Evaluation and Policy Analysis, 9(2), 101–116.

102
New York State Department of Education. (1974a, March). Reading achievement related toeducational and environmental conditions in 12 New York City elementary schools.Albany, NY: Division of Education Evaluation.
New York State Department of Education. (1974b). School factors influencing readingachievement: A case study of two inner city schools. Albany, NY: Office of EducationPerformance Review. (ERIC Document Reproduction Service No. 089 211)
New York State Department of Education. (1976, March). Three strategies for studying theeffects of school processes. Albany, NY: Bureau of School Programs Evaluation.
Nuthall, G. (1999). The way students learn. Acquiring knowledge from an integrated science andsocial studies unit. Elementary School Journal, 99(4), 303–341.
Nuthall, G., & Alton-Lee, A. (1995). Assessing classroom learning. How students use theirknowledge and experience to answer classroom achievement test questions in science andsocial studies. American Educational Research Journal, 32(1), 185–223.
Odden, A. (1982, summer). Schools can improve: Local strategies need state backing. StateEducation Leader, 1–3.
Pelgrum, W. J., Eggen, Th. J. H. M.,& Plomp, Tj. (1983) The second mathematics study: Results.Enschede: Twente University.
Pressley, M., & McCormick, C. B. (1995). Advanced educational psychology for educators,researchers and policymakers. New York: Harper Collins College Publishers.
Purkey, S. C., & Smith, M. S. (1982). Effective schools: A review. Madison, WI: WisconsinCenter for Educational Research, School of Education, University of Wisconsin atMadison.
Purkey, S. C., & Smith, M. S. (1983). Effective schools: A review. Elementary School Journal,83, 427–452.
Ralph, J. H., & Hennessey, J. (1983, June). Science or reform: Some questions about theeffective schools model. Phi Delta Kappan, 689–694.
Raudenbush, S. W., & Byrk, A. S. (1988). Methodological advances in analyzing the effects ofschools and classrooms on student learning. In E. Z. Rothkopf (Ed.), Review of Researchin Education: Vol. 15 (pp. 423–475). Washington, DC: American Educational ResearchAssociation.
Raudenbush, S. W., & Willms, J. D. (1995). The estimation of school effects. Journal ofEducational and Behavioral Statistics, 20(4), 307–335.

103
Reynolds, M. C., Wang, M. C., & Walberg, H. J. (1992). The knowledge base for special andgeneral education. Remedial and Special Education, 13(5), 6–10.
Rolfhus, E. L., & Ackerman, P. L. (1999). Assessing individual differences in knowledge:Knowledge, intelligence, and related traits. Journal of Educational Psychology, 91(3),511–526.
Rosenshine, B. V. (1979). Content, time, and direct instruction. In P. L. Peterson & H. J.Walberg (Eds.), Research on teaching (pp. 28–56). Berkeley, CA: McCutchon.
Rosenthal, R., & Rubin, D. B. (1982). A simple general purpose display of magnitude ofexperimental effect. Journal of Educational Psychology, 74(2), 166–169.
Rovee-Collier, C. (1995). Time windows in cognitive development. Developmental Psychology,31(2), 147–169.
Rowe, K. J., & Hill, P. W. (1994). Multilevel modeling in school effectiveness research: Howmany levels. Paper presented at the International Congress for School Effectiveness andImprovement, Melbourne, Australia.
Rowe, K. J., Hill, P. W., & Holmes-Smith, P. (1995). Methodological issues in educationalperformance and school effectiveness research: A discussion with worked examples.Australian Journal of Education, 39(3), 217–248.
Rutter, M., Maughan, B., Mortimer, P., & Ouston, J. (1979). Fifteen thousand hours: Secondaryschools and their effects on children. London: Open Books.
Sanders, W. L., & Horn, S. P. (1994). The Tennessee value-added assessment system (TVAAS):Mixed-model methodology in educational assessment. Journal of Personnel Evaluationin Education, 8, 299–311.
Scheerens, J. (1992). Effective schooling: Research, theory and practice. London: Cassell.
Scheerens, J., & Bosker, R. J. (1997). The foundations of educational effectiveness. New York:Elsevier.
Schiefele, U., & Csikszentmihalyi, M. (1994). Interest and the quality of experience inclassrooms. European Journal of Psychology of Education, 9, 251–270.
Schiefele, U., & Krapp, A. (1996). Topic interest and free recall of expository text. Learning andIndividual Differences, 8(2), 141–160.
Schiefele, U., Krapp, A., & Winteler, A. (1992). Interest as a predictor of academic achievement:A meta-analysis of research. In K. A. Renninger, S. Hidi, & A. Krapp (Eds.), The role ofinterest in learning and development (pp. 183–212). Hillsdale, NJ: Erlbaum.

104
Schneider, W., & Pressley, M. (1989). Memory development between 2 and 20. New York:Springer-Verlag.
Spartz, J. L. (1977). Delaware educational accountability system case studies: Elementaryschools grades 1–4. Dover, DE: Delaware Department of Public Instruction.
Sproull, L. S., & Zubrow, D. (1981). Performance information in school systems: Perspectivesfrom organizational theory. Educational Administration Quarterly, 17(3), 61–79.
Steinkamp, M. W., & Maehr, M. L. (1983). Affect, ability, and science achievement: Aquantitative synthesis of correlational research. Review of Educational Research, 53(3),369–396.
Stringfield, S., & Teddlie, C. (1989). The first three phases of the Louisiana school effectivenessstudy. In B. P. M. Creemers, T. Peters, & D. Reynolds (Eds.), School effectiveness andschool improvement: Proceedings of the Second International Congress, Rotterdam (pp.281–294). Lisse: Swets & Zeitlinger.
Tamir, P. (1996). Science assessment. In M. Birenbaum & F. J. R. C. Dochy (Eds.), Alternativesin assessment of achievements, learning processes, and prior knowledge (pp. 93–129).Boston: Kluwer.
Teddlie, C., Reynolds, D., & Sammons, P. (2000). The methodology and scientific properties ofschool effectiveness research. In C. Teddlie & D. Reynolds (Eds.), The internationalhandbook of school effectiveness research (pp. 55–133). London: Falmer Press.
Tobias, S. (1994). Interest, prior knowledge and learning. Review of Educational Research,64(1), 37–54.
van der Werf, G. (1997). Differences in school and instruction characteristics between high-,average-, and low-effective schools. School Effectiveness and School Improvement, 8(4),430–448.
Venezky, R. L., & Winfield, L. F. (1979). Schools that succeed beyond expectations in reading.(Studies on Educational Technical Report No. 1). Newark: University of Delaware.(ERIC Document Reproduction Service No. ED 177 484)
Walberg, H. J. (1980). A psychological theory of educational productivity. Washington, DC:National Institute of Education. (ERIC Document Reproduction Service No. ED 206 042)
Walberg, H. J. (1984). Improving the productivity of America’s schools. EducationalLeadership, 19–27.
Walberg, H. J. (1999). Productive teaching. In H. C. Waxman & H. J. Walberg (Eds.), Newdirections for teaching practice and research (pp. 75–106). Berkeley, CA: McCutchanPublishing Corporation.
105
Wang, M. C., Haertel, G. D., & Walberg, H. J. (1993). Toward a knowledge base for schoollearning. Review of Educational Research, 63(3), 249–294.
Wang, M. C., Haertel, G. D., & Walberg, H. J. (1995). Learning influences. In H. J. Walberg &G. D. Haertel (Eds.), Psychology and educational practice (pp. 199–211). Berkeley, CA:McCutchan.
Wang, M. C., Haertel, G. D., & Walberg, H. J. (1990). What influences learning? A contentanalysis of review literature. Journal of Educational Research, 84, 30–43.
Wang, M. C., Reynolds, M. C., & Walberg, H. J. (1994). What works and what doesn’t work:The case for the inclusive system. In K. K. Wong & M. C. Wang (Eds.), Rethinkingpolicy for at-risk students (pp. 151–176). Berkeley, CA: McCutchan.
Wang, M. C., Reynolds, M. C., & Walberg, H. J. (Eds.). (1987–1991). Handbook of specialeducation: Research and practice (Vols. 1–4). Oxford, England: Pergamon.
Weber, G. (1971). Inner-city children can be taught to read: Four successful schools.Washington, DC: Council for Basic Education.
Welch, F. (1974). Relationships between income and schooling. In F. N. Kerlinger (Ed.), Reviewof research in education. Ithaca, NY: Peacock.
White, K. R. (1982). The relationship between socioeconomic status and academic achievement.Psychological Bulletin, 91(3), 461–481.
Williams, B. I., Richmond, P. A., & Mason, B. J. (Eds.). (1986). Designs for compensatoryeducation: Conference proceedings and papers. Washington, DC: Research andEvaluation Associates.
Willms, J. D. (1992). Monitoring school performance: A guide for educators. Washington, DC:The Falmer Press.
Wittrock, M. C. (Ed.). (1986). Handbook of research on teaching (3rd ed.). New York:Macmillan.
Witziers, B., & Bosker, R. J. (1997, January). A meta-analysis on the effects of presumed schooleffectiveness enhancing factors. Paper presented at ICSEI, Memphis, TN.
Wright, S. P., Horn, S. P., & Sanders, W. L. (1997). Teacher and classroom context effects onstudent achievement. Implications for teacher evaluation. Journal of PersonnelEvaluation in Education, 11, 57–67.
Related Documents