Citation: Shen, X.; Yuan, D.; Jin, D.; Cao, C. A New Calculation Method of Cutterhead Torque Considering Shield Rolling Angle. Appl. Sci. 2022, 12, 396. https://doi.org/ 10.3390/app12010396 Academic Editor: Daniel Dias Received: 30 September 2021 Accepted: 28 December 2021 Published: 31 December 2021 Publisher’s Note: MDPI stays neutral with regard to jurisdictional claims in published maps and institutional affil- iations. Copyright: © 2021 by the authors. Licensee MDPI, Basel, Switzerland. This article is an open access article distributed under the terms and conditions of the Creative Commons Attribution (CC BY) license (https:// creativecommons.org/licenses/by/ 4.0/). applied sciences Article A New Calculation Method of Cutterhead Torque Considering Shield Rolling Angle Xiang Shen 1 , Dajun Yuan 2 , Dalong Jin 2 and Chengyong Cao 3,4, * 1 College of Civil and Transportation Engineering, Shenzhen University, Shenzhen 518060, China; [email protected] 2 Key Laboratory of Urban Underground Engineering of Ministry of Education, Beijing Jiaotong University, Beijing 100044, China; [email protected] (D.Y.); [email protected] (D.J.) 3 Key Laboratory for Resilient Infrastructures of Coastal Cities (MOE), Shenzhen University, Shenzhen 518060, China 4 Shenzhen Key Laboratory of Green, Efficient and Intelligent Construction of Underground Metro Station, Shenzhen 518060, China * Correspondence: [email protected]; Tel.: +86-18001066820 Abstract: The existing cutterhead torque calculation method usually simplifies the characteristics of the shield, which ignores the rolling angle. In this paper, the cross-river shield project of Wuhan Metro Line 8 is taken as the research focus. Firstly, the measured data of the cutterhead torque (CT), the rolling angle and rotation direction were analyzed. Then on this basis, the penetrability, tunneling thrust, and rolling angle were taken as the influential factors to analyze CT sensitivity. Finally, based on the theoretical calculation model, a modified solution of CT was obtained considering the rolling angle. The results show that the rolling angle can be reduced to zero by changing the direction of the cutterhead rotation; the rolling angle has a greater impact on CT than the other two factors as shown through the analysis of the range difference and Statistical Product and Service Solutions (SPSS) method. As the absolute value of the rolling angle increases, CT also increases, and the relationship between them is linear. To a certain extent, the rolling angle of the shield can reflect the difficulty of tunneling and the running status. By monitoring the rolling angle of the shield, the prediction of CT can be more in line with the actual construction conditions. Keywords: shield tunnel; rolling angle; cutterhead torque (CT); correlation analysis; modified solution 1. Introduction Due to the advantages of being unaffected by the climate, stable traffic capacity, strong resistance to war damage and to damage from shipping, underwater tunnels have increasingly become an important means of connection and a traffic lifeline between cities, regions, and even countries [1–3]. During long-distance tunneling using large- diameter shields, cutter wear and attitude control have a significant impact on the safety of tunneling [4,5]. Tunnel Boring Machine (TBM)tunneling is affected by complex factors, such as the soil properties, the water and soil pressure, the jack thrust, and the cutterhead torque (CT) [6,7]. Proving the dynamic mechanism of the interaction between machine and soil is a prerequisite for optimal control of shield construction mechanics [8]. CT is an important part of shield tunneling parameters [9,10]. It is related to whether the shield tunneling can be carried out with high efficiency. However, CT is affected by many factors such as the type of shield, the form of the cutterhead, the type of cutter, and the formation conditions. In recent years, as the diameter of shields continues to increase, CT is also increasing, and the gap between the maximum value of the cutterhead torque and the average value is also increasing in these projects. Therefore, it is very important to study the characteristics of CT and its influencing factors, and establish the two-way relationship Appl. Sci. 2022, 12, 396. https://doi.org/10.3390/app12010396 https://www.mdpi.com/journal/applsci

Welcome message from author
This document is posted to help you gain knowledge. Please leave a comment to let me know what you think about it! Share it to your friends and learn new things together.
Transcript
�����������������
Citation: Shen, X.; Yuan, D.; Jin, D.;
Cao, C. A New Calculation Method
of Cutterhead Torque Considering
Shield Rolling Angle. Appl. Sci. 2022,
12, 396. https://doi.org/
10.3390/app12010396
Academic Editor: Daniel Dias
Received: 30 September 2021
Accepted: 28 December 2021
Published: 31 December 2021
Publisher’s Note: MDPI stays neutral
with regard to jurisdictional claims in
published maps and institutional affil-
iations.
Copyright: © 2021 by the authors.
Licensee MDPI, Basel, Switzerland.
This article is an open access article
distributed under the terms and
conditions of the Creative Commons
Attribution (CC BY) license (https://
creativecommons.org/licenses/by/
4.0/).
applied sciences
Article
A New Calculation Method of Cutterhead Torque ConsideringShield Rolling AngleXiang Shen 1, Dajun Yuan 2, Dalong Jin 2 and Chengyong Cao 3,4,*
1 College of Civil and Transportation Engineering, Shenzhen University, Shenzhen 518060, China;[email protected]
2 Key Laboratory of Urban Underground Engineering of Ministry of Education, Beijing Jiaotong University,Beijing 100044, China; [email protected] (D.Y.); [email protected] (D.J.)
3 Key Laboratory for Resilient Infrastructures of Coastal Cities (MOE), Shenzhen University,Shenzhen 518060, China
4 Shenzhen Key Laboratory of Green, Efficient and Intelligent Construction of Underground Metro Station,Shenzhen 518060, China
* Correspondence: [email protected]; Tel.: +86-18001066820
Abstract: The existing cutterhead torque calculation method usually simplifies the characteristicsof the shield, which ignores the rolling angle. In this paper, the cross-river shield project of WuhanMetro Line 8 is taken as the research focus. Firstly, the measured data of the cutterhead torque (CT),the rolling angle and rotation direction were analyzed. Then on this basis, the penetrability, tunnelingthrust, and rolling angle were taken as the influential factors to analyze CT sensitivity. Finally, basedon the theoretical calculation model, a modified solution of CT was obtained considering the rollingangle. The results show that the rolling angle can be reduced to zero by changing the direction of thecutterhead rotation; the rolling angle has a greater impact on CT than the other two factors as shownthrough the analysis of the range difference and Statistical Product and Service Solutions (SPSS)method. As the absolute value of the rolling angle increases, CT also increases, and the relationshipbetween them is linear. To a certain extent, the rolling angle of the shield can reflect the difficulty oftunneling and the running status. By monitoring the rolling angle of the shield, the prediction of CTcan be more in line with the actual construction conditions.
Keywords: shield tunnel; rolling angle; cutterhead torque (CT); correlation analysis; modified solution
1. Introduction
Due to the advantages of being unaffected by the climate, stable traffic capacity,strong resistance to war damage and to damage from shipping, underwater tunnels haveincreasingly become an important means of connection and a traffic lifeline betweencities, regions, and even countries [1–3]. During long-distance tunneling using large-diameter shields, cutter wear and attitude control have a significant impact on the safetyof tunneling [4,5]. Tunnel Boring Machine (TBM)tunneling is affected by complex factors,such as the soil properties, the water and soil pressure, the jack thrust, and the cutterheadtorque (CT) [6,7]. Proving the dynamic mechanism of the interaction between machine andsoil is a prerequisite for optimal control of shield construction mechanics [8].
CT is an important part of shield tunneling parameters [9,10]. It is related to whetherthe shield tunneling can be carried out with high efficiency. However, CT is affected bymany factors such as the type of shield, the form of the cutterhead, the type of cutter, andthe formation conditions. In recent years, as the diameter of shields continues to increase,CT is also increasing, and the gap between the maximum value of the cutterhead torque andthe average value is also increasing in these projects. Therefore, it is very important to studythe characteristics of CT and its influencing factors, and establish the two-way relationship
Appl. Sci. 2022, 12, 396. https://doi.org/10.3390/app12010396 https://www.mdpi.com/journal/applsci
Appl. Sci. 2022, 12, 396 2 of 15
between the soil and the shield, which can lay the foundation for the establishment of themathematical model of CT [11,12].
At present, the empirical formula widely used in shield design and constructionareas is that proposed by Krause [13]. In view of the fact that the empirical formulacould have too many considerations, it is mainly based on the statistical results of a largenumber of construction data, ignoring the influence of complex formation conditions andmachine parameters on CT. Reilly [14] proposed an empirical formula to determine CT,but there still exist large uncertainties in this model. Therefore, in recent decades, manyattempts have been made to establish a cutterhead torque prediction method based onphysical models [15,16]. Taking account of cutterhead structure, cutting principle andthe interaction between cutterhead and soil composition, and corresponding calculationmethod of cutterhead torque as presented by Shi et al. [17]. Wang et al. [18] proposed a newcalculation model considering dynamic parameters, which was verified by laboratory tests,and established a shield load prediction model for cutterhead torque and thrust. Zhanget al. [19] established a shield load prediction model for cutterhead torque and thrust,taking into account the influence of the shield-soil interaction. Ates et al. [20] collected262 TBMs’ design parameters, and analyzed the relationship between TBM diameter andinstalled thrust capacity, nominal torque, and others. With the continuous developmentof shield tunnel technology, shield engineering will have to face a variety of geologicalconditions. González et al. [21] proposed a calculation model suitable for soils and softrock, and Zhou and Zhai [22] extended the existing theory to mixed-face ground. Althoughmethods based on physical models can predict the CT trend, there are still many key factorsthat have not been considered, such as cutterhead rotation, advance speed, total thrust, andtorque. Moreover, the theoretical calculation methods mentioned above are only suitablefor specific cutterhead design and geological conditions.
Due to the low accuracy of the theoretical calculation method of cutterhead torque,machine learning has been widely used in the prediction of tunnelling parameters [23,24].First, a large number of tunneling parameters need to be analyzed initially. In recentyears, Statistical Product and Service Solutions (SPSS) is often used in data analysis in civilengineering [25,26]. Three intelligent models were employed to predict advance speed,torque, thrust, and other operating parameters, including a predeveloped artificial neuralnetwork (ANN), hybrid particle swarm optimization (PSO)-ANN, and a hybrid imperialistcompetitive algorithm (ICA)-ANN [27–29]. Luo et al. [30] proposed an optimal controlmethod for slurry pressure based on random forest (RF) and particle swarm optimization(PSO). Qin et al. [31] proposed an approach of precise cutterhead torque prediction for shieldtunneling machines using a novel hybrid deep neural network. Shi et al. [32] proposed anovel VMD-EWT-LSTM-based multi-step prediction method for shield machine cutterheadtorque. Although these algorithms can achieve better prediction accuracy, the methodsrequire more data as the basic database for the prediction model. From the existing researchresults, more analysis is based on the data of the entire project.
Based on the above literature review, the empirical calculation model of cutterheadtorque is only a reference, and there is often a large error with the actual measured value.The existing theoretical calculation model of cutterhead torque is generally only applicableto a single formation. Machine learning prediction models require large amounts of dataas a basis. To resolve these problems, this paper aims to establish a calculation methodof cutterhead torque considering the rolling angle. Based on the Wuhan Metro Line 8project, a large amount of engineering data has been collected. Through the analysis offactors and SPSS, the correlation between tunneling speed, rotation speed, tunneling thrust,rolling angle, and cutterhead torque is analyzed. Based on a physical mechanics model, therolling angle is introduced and proposed, and a modified solution of the torque is proposed.In addition, the model is applied to the prediction of the torque in metro engineeringscenarios. The effectiveness of the model is verified and discussed through a comparisonof the theoretical solution and field data. Based on the strong correlation between thecutterhead torque and the rolling angle, the calculation method proposed in this paper
Appl. Sci. 2022, 12, 396 3 of 15
is more adaptable to the stratum, more in line with engineering reality, and has higherengineering application value.
2. Project Overview
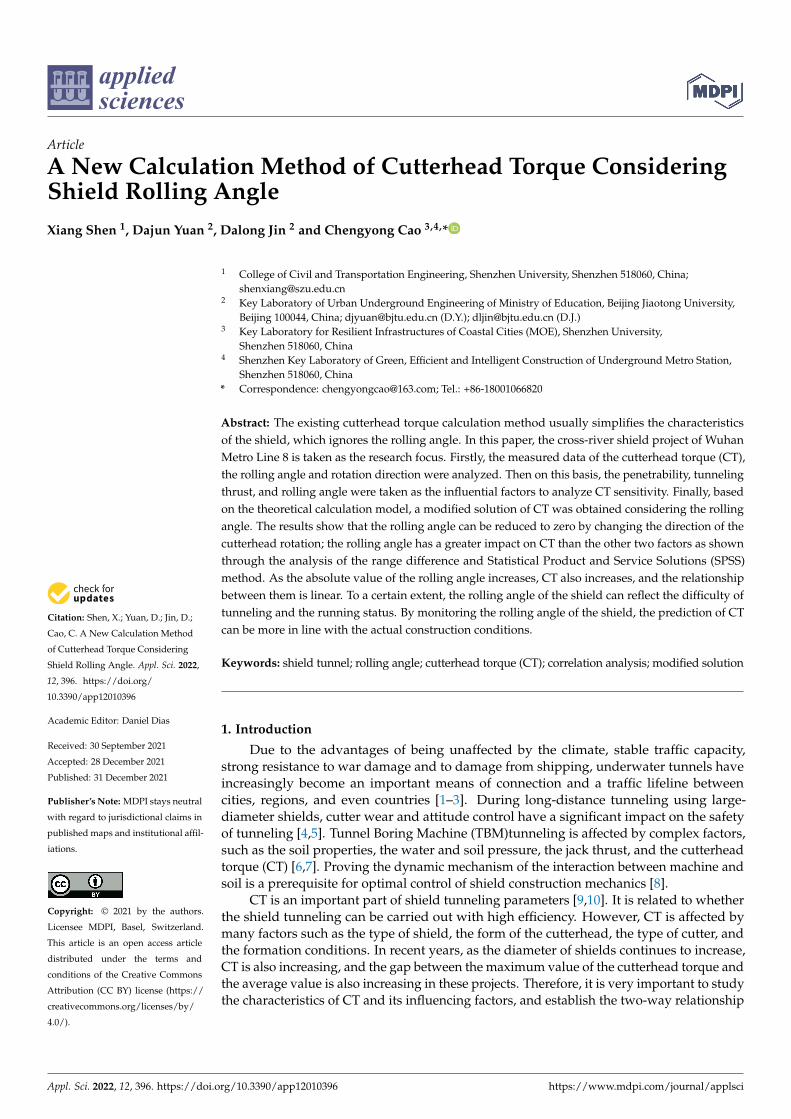
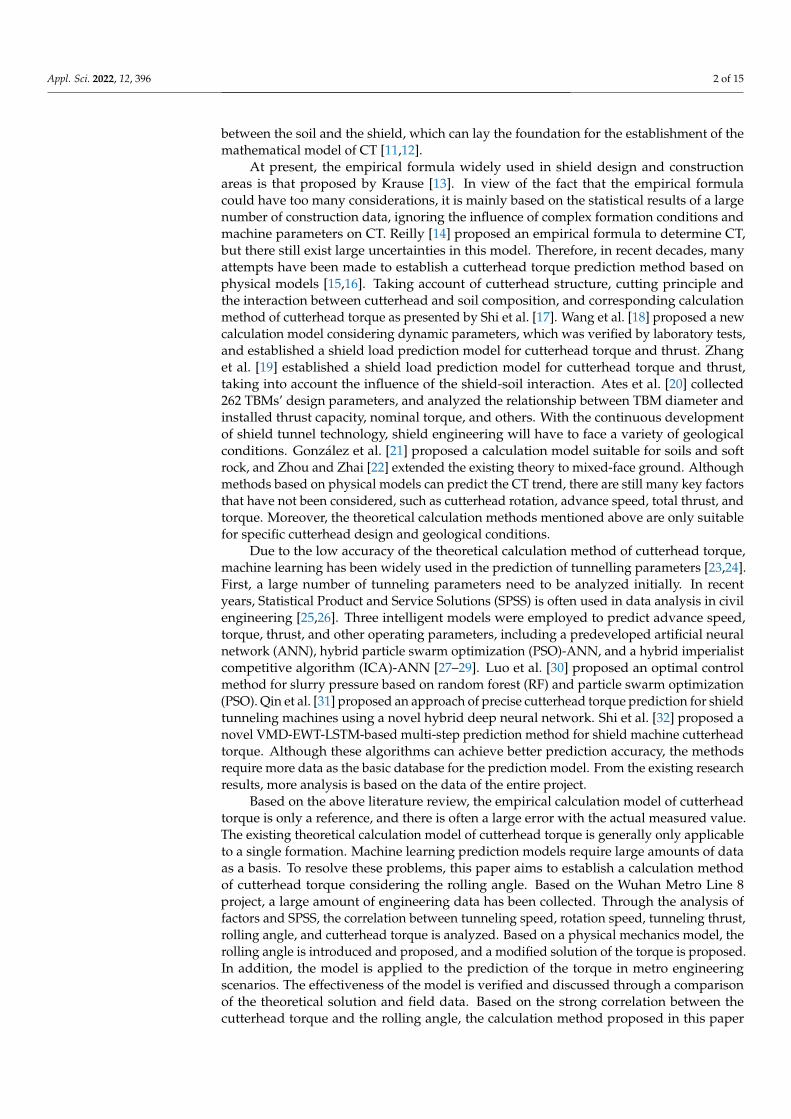
The total length of the Wuhan Metro Line 8 cross-river tunnel is 3186 m, and the widthis about 1500 m, as shown in Figure 1. A slurry TBM with a diameter of 12.51 m is adopted(see Figure 2). The main technical parameters of the shield are shown in Table 1. Thereare six arms with a spokes panel, and the opening ratio of the cutterhead is about 28.5%.The maximum water and soil pressure is up to 0.7 MPa in this project, and the maximumoverburden depth is up to 37 m. The deepest part of the river bottom is 51 m below thenormal water level.
Appl. Sci. 2022, 12, x FOR PEER REVIEW 3 of 15
comparison of the theoretical solution and field data. Based on the strong correlation be-
tween the cutterhead torque and the rolling angle, the calculation method proposed in
this paper is more adaptable to the stratum, more in line with engineering reality, and has
higher engineering application value.
2. Project Overview
The total length of the Wuhan Metro Line 8 cross-river tunnel is 3186 m, and the
width is about 1500 m, as shown in Figure 1. A slurry TBM with a diameter of 12.51 m is
adopted (see Figure 2). The main technical parameters of the shield are shown in Table 1.
There are six arms with a spokes panel, and the opening ratio of the cutterhead is about
28.5%. The maximum water and soil pressure is up to 0.7 MPa in this project, and the
maximum overburden depth is up to 37 m. The deepest part of the river bottom is 51 m
below the normal water level.
Figure 1. Plan of Wuhan Metro Line 8 crosses the Yangtze River.
Figure 2. Herrenknecht shield machine (Chutian).
Figure 1. Plan of Wuhan Metro Line 8 crosses the Yangtze River.
Appl. Sci. 2022, 12, x FOR PEER REVIEW 3 of 15
comparison of the theoretical solution and field data. Based on the strong correlation be-
tween the cutterhead torque and the rolling angle, the calculation method proposed in
this paper is more adaptable to the stratum, more in line with engineering reality, and has
higher engineering application value.
2. Project Overview
The total length of the Wuhan Metro Line 8 cross-river tunnel is 3186 m, and the
width is about 1500 m, as shown in Figure 1. A slurry TBM with a diameter of 12.51 m is
adopted (see Figure 2). The main technical parameters of the shield are shown in Table 1.
There are six arms with a spokes panel, and the opening ratio of the cutterhead is about
28.5%. The maximum water and soil pressure is up to 0.7 MPa in this project, and the
maximum overburden depth is up to 37 m. The deepest part of the river bottom is 51 m
below the normal water level.
Figure 1. Plan of Wuhan Metro Line 8 crosses the Yangtze River.
Figure 2. Herrenknecht shield machine (Chutian).
Figure 2. Herrenknecht shield machine (Chutian).
Appl. Sci. 2022, 12, 396 4 of 15
Table 1. Main technical parameters of shield.
Item Device Parameter Engineering Demand
Minimum turning radius 650 m 700 mMaximum pressure resistance 0.80 Mpa 0.67 Mpa
Maximum gradient 5% 7%Excavation diameter 12.54 m 14.60
Maximum advancing speed 60 mm/min 60 mm/minMaximum thrust 156,753 kN 140,000 kNMaximum torque 18.3~24.6 MN·m 17.2~20.3 MN·m
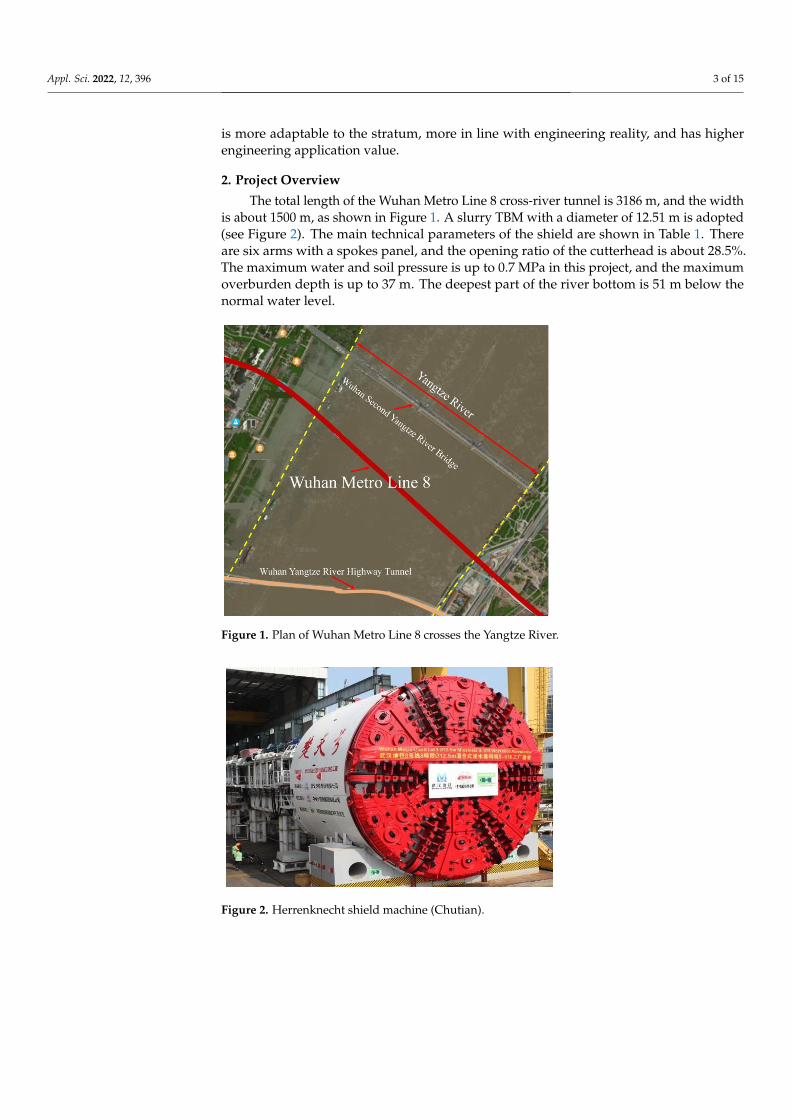
The slurry TBM needs to traverse the upper soft and lower hard composite stratumfor a long distance. The upper part of the tunnel is all silt fine sand. Strongly weatheredconglomerate (1365 m) and weakly weathered conglomerate (750 m) are distributed in themiddle of the tunnel, and strongly cemented conglomerate is distributed at the bottom ofthe tunnel, as shown in Figure 3. The project is faced with many technical problems suchas soil fracturing and collapse, low excavation efficiency, and attitude deviation [33].
Appl. Sci. 2022, 12, x FOR PEER REVIEW 4 of 15
Table 1. Main technical parameters of shield.
Item Device Parameter Engineering Demand
Minimum turning radius 650 m 700 m
Maximum pressure resistance 0.80 Mpa 0.67 Mpa
Maximum gradient 5% 7%
Excavation diameter 12.54 m 14.60
Maximum advancing speed 60 mm/min 60 mm/min
Maximum thrust 156,753 kN 140,000 kN
Maximum torque 18.3~24.6 MN·m 17.2~20.3 MN·m
The slurry TBM needs to traverse the upper soft and lower hard composite stratum
for a long distance. The upper part of the tunnel is all silt fine sand. Strongly weathered
conglomerate (1365 m) and weakly weathered conglomerate (750 m) are distributed in the
middle of the tunnel, and strongly cemented conglomerate is distributed at the bottom of
the tunnel, as shown in Figure 3. The project is faced with many technical problems such
as soil fracturing and collapse, low excavation efficiency, and attitude deviation [33].
Figure 3. Strata profile.
3. Correlation Analysis
Shield rolling angle is an important attitude parameter, but it is often ignored in en-
gineering. Faced with complex strata and high water pressure, there are problems with
the cutting of the cutterhead and the difficulty of controlling the torque. Excessive torque
results in an excessively large rolling angle. On the other hand, excessive large rolling
angle further increases the difficulty of controlling the torque. The rolling angle and
torque mutually restrict and influence each other. Therefore, it is necessary to ascertain
the inner relationship between the rolling angle and the torque. In this field test, Ring No.
480 to Ring No. 530 was selected as the test tunneling section (see Figure 4).
Soft soil
Silt
Silty fine sand
Strongly weathered Conglomerate
Weakly cementedConglomerate
Strongly cemented Conglomerate
210400 30012001300 600800 700 5009001100 1000
Maximum
water depth
31.92m Minimum
cover thickness
11.04m
25.98m
21.20m
Maximum earth-
water pressure
6.74bar
Shield tunnel
Ring No.
210400 30012001300 600800 700 5009001100 1000
480530
Figure 3. Strata profile.
3. Correlation Analysis
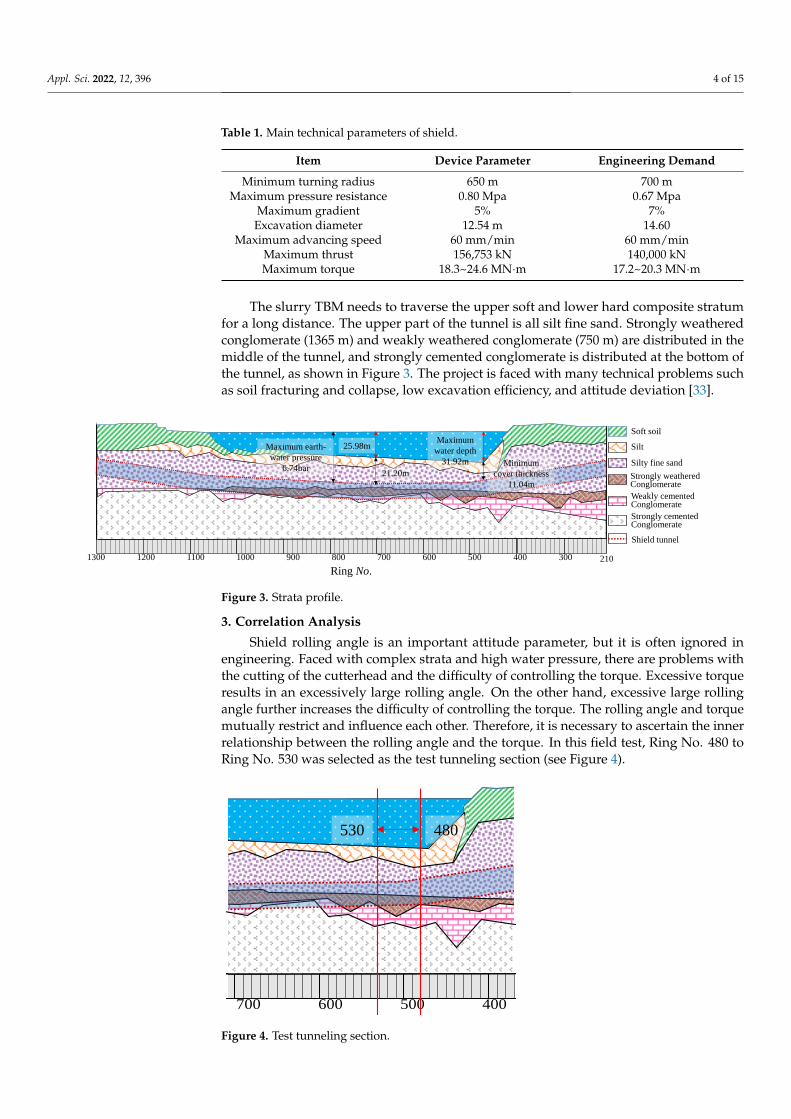
Shield rolling angle is an important attitude parameter, but it is often ignored inengineering. Faced with complex strata and high water pressure, there are problems withthe cutting of the cutterhead and the difficulty of controlling the torque. Excessive torqueresults in an excessively large rolling angle. On the other hand, excessive large rollingangle further increases the difficulty of controlling the torque. The rolling angle and torquemutually restrict and influence each other. Therefore, it is necessary to ascertain the innerrelationship between the rolling angle and the torque. In this field test, Ring No. 480 toRing No. 530 was selected as the test tunneling section (see Figure 4).
Appl. Sci. 2022, 12, x FOR PEER REVIEW 4 of 15
Table 1. Main technical parameters of shield.
Item Device Parameter Engineering Demand
Minimum turning radius 650 m 700 m
Maximum pressure resistance 0.80 Mpa 0.67 Mpa
Maximum gradient 5% 7%
Excavation diameter 12.54 m 14.60
Maximum advancing speed 60 mm/min 60 mm/min
Maximum thrust 156,753 kN 140,000 kN
Maximum torque 18.3~24.6 MN·m 17.2~20.3 MN·m
The slurry TBM needs to traverse the upper soft and lower hard composite stratum
for a long distance. The upper part of the tunnel is all silt fine sand. Strongly weathered
conglomerate (1365 m) and weakly weathered conglomerate (750 m) are distributed in the
middle of the tunnel, and strongly cemented conglomerate is distributed at the bottom of
the tunnel, as shown in Figure 3. The project is faced with many technical problems such
as soil fracturing and collapse, low excavation efficiency, and attitude deviation [33].
Figure 3. Strata profile.
3. Correlation Analysis
Shield rolling angle is an important attitude parameter, but it is often ignored in en-
gineering. Faced with complex strata and high water pressure, there are problems with
the cutting of the cutterhead and the difficulty of controlling the torque. Excessive torque
results in an excessively large rolling angle. On the other hand, excessive large rolling
angle further increases the difficulty of controlling the torque. The rolling angle and
torque mutually restrict and influence each other. Therefore, it is necessary to ascertain
the inner relationship between the rolling angle and the torque. In this field test, Ring No.
480 to Ring No. 530 was selected as the test tunneling section (see Figure 4).
Soft soil
Silt
Silty fine sand
Strongly weathered Conglomerate
Weakly cementedConglomerate
Strongly cemented Conglomerate
210400 30012001300 600800 700 5009001100 1000
Maximum
water depth
31.92m Minimum
cover thickness
11.04m
25.98m
21.20m
Maximum earth-
water pressure
6.74bar
Shield tunnel
Ring No.
210400 30012001300 600800 700 5009001100 1000
480530
Figure 4. Test tunneling section.
Appl. Sci. 2022, 12, 396 5 of 15
3.1. Measured Data Analysis
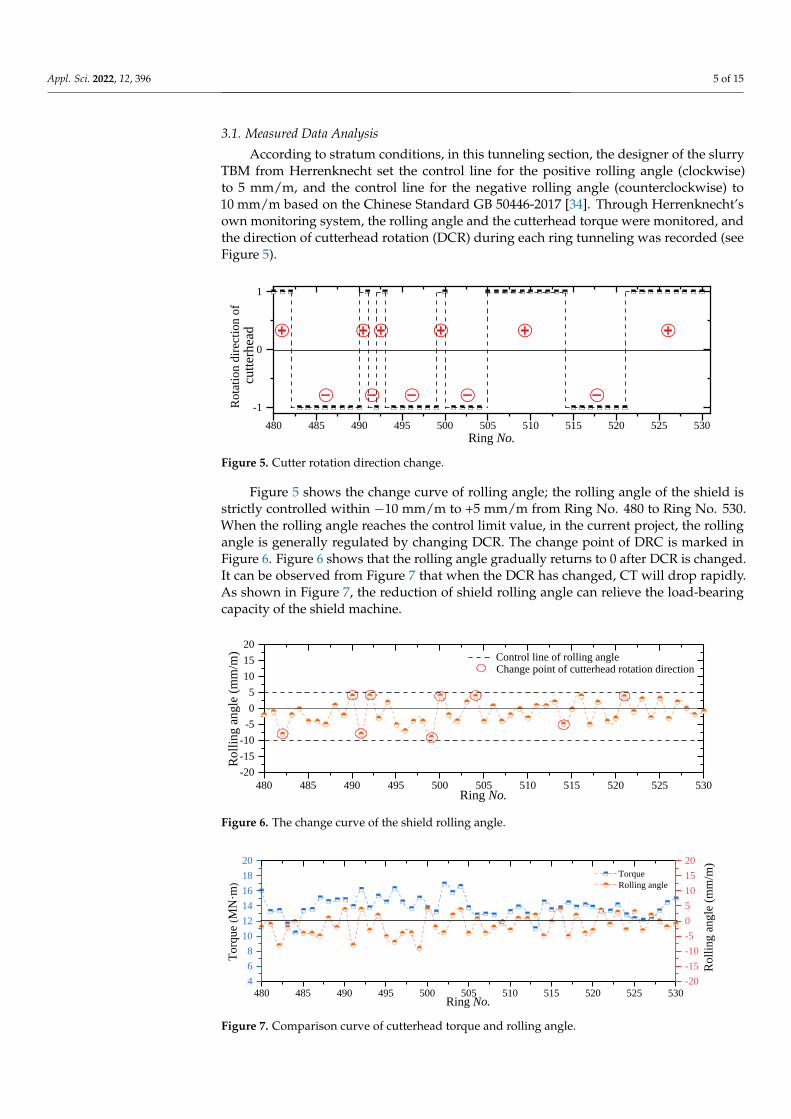
According to stratum conditions, in this tunneling section, the designer of the slurryTBM from Herrenknecht set the control line for the positive rolling angle (clockwise)to 5 mm/m, and the control line for the negative rolling angle (counterclockwise) to10 mm/m based on the Chinese Standard GB 50446-2017 [34]. Through Herrenknecht’sown monitoring system, the rolling angle and the cutterhead torque were monitored, andthe direction of cutterhead rotation (DCR) during each ring tunneling was recorded (seeFigure 5).
Appl. Sci. 2022, 12, x FOR PEER REVIEW 5 of 15
Figure 4. Test tunneling section.
3.1. Measured Data Analysis
According to stratum conditions, in this tunneling section, the designer of the slurry
TBM from Herrenknecht set the control line for the positive rolling angle (clockwise) to 5
mm/m, and the control line for the negative rolling angle (counterclockwise) to 10 mm/m
based on the Chinese Standard GB 50446-2017 [34]. Through Herrenknecht’s own moni-
toring system, the rolling angle and the cutterhead torque were monitored, and the direc-
tion of cutterhead rotation (DCR) during each ring tunneling was recorded (see Figure 5).
Figure 5. Cutter rotation direction change.
Figure 5 shows the change curve of rolling angle; the rolling angle of the shield is
strictly controlled within −10 mm/m to +5 mm/m from Ring No. 480 to Ring No. 530. When
the rolling angle reaches the control limit value, in the current project, the rolling angle is
generally regulated by changing DCR. The change point of DRC is marked in Figure 6.
Figure 6 shows that the rolling angle gradually returns to 0 after DCR is changed. It can
be observed from Figure 7 that when the DCR has changed, CT will drop rapidly. As
shown in Figure 7, the reduction of shield rolling angle can relieve the load-bearing ca-
pacity of the shield machine.
Through analyzing the changing trend of field data, it can be seen that there is a cer-
tain correlation between the rolling angle and CT. Nevertheless, the degree of correlation
between the two parameters needs further analysis and discussion.
Figure 6. The change curve of the shield rolling angle.
480 485 490 495 500 505 510 515 520 525 530
-1
0
1
Ro
tati
on
dir
ecti
on
of
Ring No.
cutt
erh
ead
480 485 490 495 500 505 510 515 520 525 530
-20
-15
-10
-5
0
5
10
15
20
Control line of rolling angleChange point of cutterhead rotation direction
Ro
llin
g a
ng
le (
mm
/m)
Ring No.
Figure 5. Cutter rotation direction change.
Figure 5 shows the change curve of rolling angle; the rolling angle of the shield isstrictly controlled within −10 mm/m to +5 mm/m from Ring No. 480 to Ring No. 530.When the rolling angle reaches the control limit value, in the current project, the rollingangle is generally regulated by changing DCR. The change point of DRC is marked inFigure 6. Figure 6 shows that the rolling angle gradually returns to 0 after DCR is changed.It can be observed from Figure 7 that when the DCR has changed, CT will drop rapidly.As shown in Figure 7, the reduction of shield rolling angle can relieve the load-bearingcapacity of the shield machine.
Appl. Sci. 2022, 12, x FOR PEER REVIEW 5 of 15
Figure 4. Test tunneling section.
3.1. Measured Data Analysis
According to stratum conditions, in this tunneling section, the designer of the slurry
TBM from Herrenknecht set the control line for the positive rolling angle (clockwise) to 5
mm/m, and the control line for the negative rolling angle (counterclockwise) to 10 mm/m
based on the Chinese Standard GB 50446-2017 [34]. Through Herrenknecht’s own moni-
toring system, the rolling angle and the cutterhead torque were monitored, and the direc-
tion of cutterhead rotation (DCR) during each ring tunneling was recorded (see Figure 5).
Figure 5. Cutter rotation direction change.
Figure 5 shows the change curve of rolling angle; the rolling angle of the shield is
strictly controlled within −10 mm/m to +5 mm/m from Ring No. 480 to Ring No. 530. When
the rolling angle reaches the control limit value, in the current project, the rolling angle is
generally regulated by changing DCR. The change point of DRC is marked in Figure 6.
Figure 6 shows that the rolling angle gradually returns to 0 after DCR is changed. It can
be observed from Figure 7 that when the DCR has changed, CT will drop rapidly. As
shown in Figure 7, the reduction of shield rolling angle can relieve the load-bearing ca-
pacity of the shield machine.
Through analyzing the changing trend of field data, it can be seen that there is a cer-
tain correlation between the rolling angle and CT. Nevertheless, the degree of correlation
between the two parameters needs further analysis and discussion.
Figure 6. The change curve of the shield rolling angle.
480 485 490 495 500 505 510 515 520 525 530
-1
0
1
Ro
tati
on
dir
ecti
on
of
Ring No.
cutt
erh
ead
480 485 490 495 500 505 510 515 520 525 530
-20
-15
-10
-5
0
5
10
15
20
Control line of rolling angleChange point of cutterhead rotation direction
Ro
llin
g a
ng
le (
mm
/m)
Ring No.
Figure 6. The change curve of the shield rolling angle.Appl. Sci. 2022, 12, x FOR PEER REVIEW 6 of 15
Figure 7. Comparison curve of cutterhead torque and rolling angle.
3.2. Factor Analysis of Torque
CT is affected by soil parameters and shield tunneling parameters. The overall stra-
tum and hydrological conditions of the selected excavation section are similar, so the in-
fluence of soil parameters can be ignored, and the impact of tunneling parameters on CT
is mainly considered. Xu et al. [35] studied the change law of CT under different thrust,
rotation speed and tunneling speed through the excavation model test, but did not con-
sider the influence of the rolling angle on the cutterhead torque. The rotation speed and
tunneling speed can be analyzed by the penetration. In this paper, the three variables of
penetration, tunneling thrust, and rolling angle are divided into four groups in the form
of intervals, as shown in Table 2.
Table 2. Factor level of the cutter torque.
Factor Level Penetration (mm) Tunneling Thrust (kN) Rolling Angle (mm/m)
1 [3.60, 8.00] [56,691, 61,000] [0, 1]
2 (8.00, 13.00] (61,000, 65,000] (1, 2]
3 (13.00, 18.00] (65,000, 69,000] (2, 3.5]
4 (18.00, 23.00] (69,000, 73,000] (3.5, 4.5]
The limit value of the positive rolling angle is set as +5 mm/m in the test section, and
the negative rolling angle is −10 mm/m. Due to the difference in the absolute value of the
positive and negative limit indexes, the following normalization processing has been
done:
' 0
/ 2 0
=
(1)
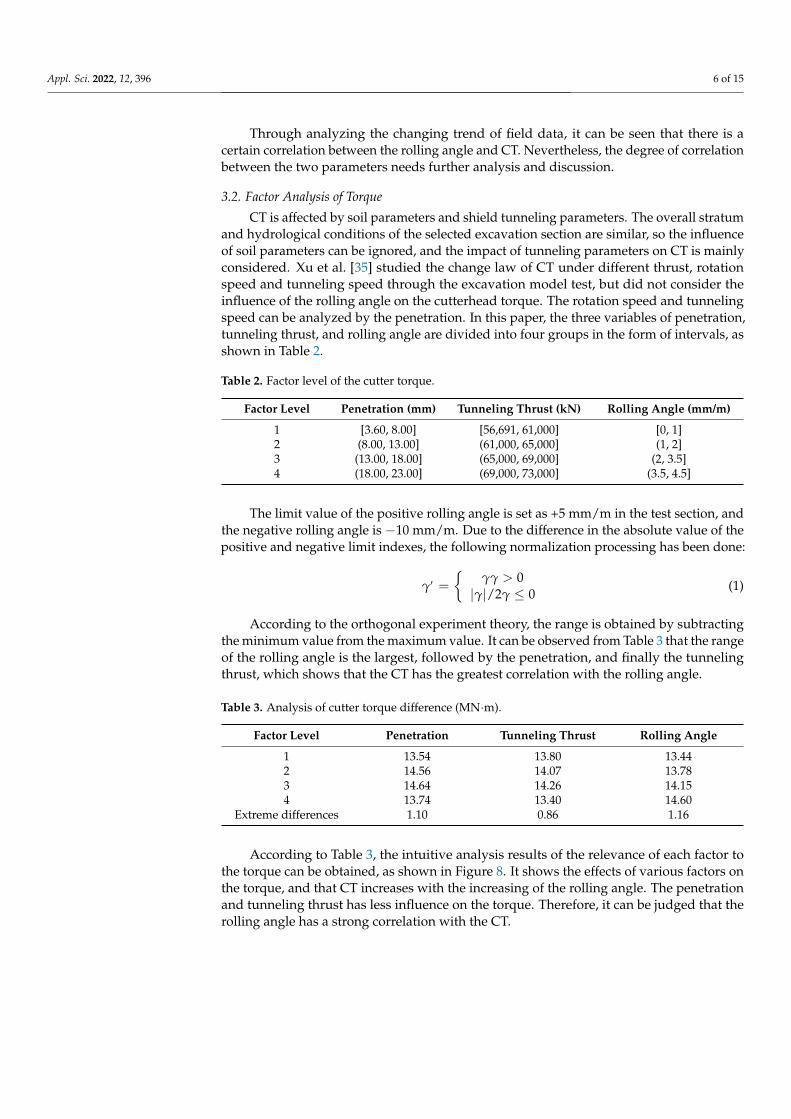
According to the orthogonal experiment theory, the range is obtained by subtracting
the minimum value from the maximum value. It can be observed from Table 3 that the
range of the rolling angle is the largest, followed by the penetration, and finally the tun-
neling thrust, which shows that the CT has the greatest correlation with the rolling angle.
Table 3. Analysis of cutter torque difference (MN·m).
Factor Level Penetration Tunneling Thrust Rolling Angle
1 13.54 13.80 13.44
2 14.56 14.07 13.78
3 14.64 14.26 14.15
4 13.74 13.40 14.60
Extreme differences 1.10 0.86 1.16
480 485 490 495 500 505 510 515 520 525 530
4
6
8
10
12
14
16
18
20
Torque
Rolling angle
To
rqu
e (M
N·m
)
Ring No.
-20
-15
-10
-5
0
5
10
15
20
R
oll
ing
angle
(m
m/m
)
Figure 7. Comparison curve of cutterhead torque and rolling angle.
Appl. Sci. 2022, 12, 396 6 of 15
Through analyzing the changing trend of field data, it can be seen that there is acertain correlation between the rolling angle and CT. Nevertheless, the degree of correlationbetween the two parameters needs further analysis and discussion.
3.2. Factor Analysis of Torque
CT is affected by soil parameters and shield tunneling parameters. The overall stratumand hydrological conditions of the selected excavation section are similar, so the influenceof soil parameters can be ignored, and the impact of tunneling parameters on CT is mainlyconsidered. Xu et al. [35] studied the change law of CT under different thrust, rotationspeed and tunneling speed through the excavation model test, but did not consider theinfluence of the rolling angle on the cutterhead torque. The rotation speed and tunnelingspeed can be analyzed by the penetration. In this paper, the three variables of penetration,tunneling thrust, and rolling angle are divided into four groups in the form of intervals, asshown in Table 2.
Table 2. Factor level of the cutter torque.
Factor Level Penetration (mm) Tunneling Thrust (kN) Rolling Angle (mm/m)
1 [3.60, 8.00] [56,691, 61,000] [0, 1]2 (8.00, 13.00] (61,000, 65,000] (1, 2]3 (13.00, 18.00] (65,000, 69,000] (2, 3.5]4 (18.00, 23.00] (69,000, 73,000] (3.5, 4.5]
The limit value of the positive rolling angle is set as +5 mm/m in the test section, andthe negative rolling angle is −10 mm/m. Due to the difference in the absolute value of thepositive and negative limit indexes, the following normalization processing has been done:
γ′ =
{γγ > 0|γ|/2γ ≤ 0
(1)
According to the orthogonal experiment theory, the range is obtained by subtractingthe minimum value from the maximum value. It can be observed from Table 3 that the rangeof the rolling angle is the largest, followed by the penetration, and finally the tunnelingthrust, which shows that the CT has the greatest correlation with the rolling angle.
Table 3. Analysis of cutter torque difference (MN·m).
Factor Level Penetration Tunneling Thrust Rolling Angle
1 13.54 13.80 13.442 14.56 14.07 13.783 14.64 14.26 14.154 13.74 13.40 14.60
Extreme differences 1.10 0.86 1.16
According to Table 3, the intuitive analysis results of the relevance of each factor tothe torque can be obtained, as shown in Figure 8. It shows the effects of various factors onthe torque, and that CT increases with the increasing of the rolling angle. The penetrationand tunneling thrust has less influence on the torque. Therefore, it can be judged that therolling angle has a strong correlation with the CT.
Appl. Sci. 2022, 12, 396 7 of 15
Appl. Sci. 2022, 12, x FOR PEER REVIEW 7 of 15
According to Table 3, the intuitive analysis results of the relevance of each factor to
the torque can be obtained, as shown in Figure 8. It shows the effects of various factors on
the torque, and that CT increases with the increasing of the rolling angle. The penetration
and tunneling thrust has less influence on the torque. Therefore, it can be judged that the
rolling angle has a strong correlation with the CT.
Figure 8. Analysis of factors affecting cutter torque.
3.3. SPSS Analysis
Statistical Product and Service Solutions (SPSS) is a data analysis software. Most of
the research on shield tunneling parameters is in the summary stage, and there is no suit-
able analysis method for the in-depth analysis of tunneling parameters. This paper uses
SPSS software to analyze the correlation between the rolling angle, penetration, tunneling
thrust, and cutterhead torque [36], and the analysis results are shown in Tables 4–6. When
the Sig value is less than 0.01, it indicates that the two variables have a strong correlation,
which is represented by two asterisks; iIf the Sig value is greater than or equal to 0.01 and
less than 0.05, it indicates that the two variables have a moderate correlation, which is
represented by one asterisk; if the Sig value is greater than or equal to 0.05, it indicates
that the two variables are weakly correlated.
According to the analysis results (see Tables 4 and 5), the Sig values between pene-
tration, tunneling thrust, and rolling angle are all greater than 0.05, which shows that the
correlation between penetration, thrust and rolling angle is weak. However, it is seen from
Table 6 that the correlation between the rolling angle and CT is significant. Therefore, the
theoretical calculation method of CT should consider the influence of rolling angle.
Through SPSS analysis, the strong correlation between the rolling angle and the CT is once
again proved.
Table 4. SPSS Analysis of penetration and cutterhead torque.
Variety Analysis Results Penetration Torque
Penetration Pearson correlation 1 0.160
Significant (double tail) 0.261
Torque Pearson correlation 0.160 1
Significant (double tail) 0.261
Table 5. SPSS Analysis of tunneling thrust and cutterhead torque.
Variety Analysis Results Tunneling Thrust Torque
Tunneling
thrust
Pearson correlation 1 −0.059
Significant (double tail) 0.682
Torque Pearson correlation −0.059 1
Significant (double tail) 0.682
12
13
14
15
16
To
rqu
e (
MN
·m)
Factor analysis1 2 3 4 31 2 4 42 31
Penetration Tunneling thrust Rolling angle
Figure 8. Analysis of factors affecting cutter torque.
3.3. SPSS Analysis
Statistical Product and Service Solutions (SPSS) is a data analysis software. Most of theresearch on shield tunneling parameters is in the summary stage, and there is no suitableanalysis method for the in-depth analysis of tunneling parameters. This paper uses SPSSsoftware to analyze the correlation between the rolling angle, penetration, tunneling thrust,and cutterhead torque [36], and the analysis results are shown in Tables 4–6. When the Sigvalue is less than 0.01, it indicates that the two variables have a strong correlation, which isrepresented by two asterisks; iIf the Sig value is greater than or equal to 0.01 and less than0.05, it indicates that the two variables have a moderate correlation, which is representedby one asterisk; if the Sig value is greater than or equal to 0.05, it indicates that the twovariables are weakly correlated.
Table 4. SPSS Analysis of penetration and cutterhead torque.
Variety Analysis Results Penetration Torque
PenetrationPearson correlation 1 0.160
Significant (double tail) 0.261
Torque Pearson correlation 0.160 1Significant (double tail) 0.261
Table 5. SPSS Analysis of tunneling thrust and cutterhead torque.
Variety Analysis Results Tunneling Thrust Torque
Tunneling thrust Pearson correlation 1 −0.059Significant (double tail) 0.682
Torque Pearson correlation −0.059 1Significant (double tail) 0.682
Table 6. SPSS Analysis of rolling angle and cutterhead torque.
Variety Analysis Results Rolling Angle Torque
Rolling angle Pearson correlation 1 0.391 **Significant (double tail) 0.005
Torque Pearson correlation 0.391 ** 1Significant (double tail) 0.005
Note: ** Indicates that at the 0.01 level (two-tailed), the correlation is significant.
According to the analysis results (see Tables 4 and 5), the Sig values between pen-etration, tunneling thrust, and rolling angle are all greater than 0.05, which shows thatthe correlation between penetration, thrust and rolling angle is weak. However, it is seen
Appl. Sci. 2022, 12, 396 8 of 15
from Table 6 that the correlation between the rolling angle and CT is significant. Therefore,the theoretical calculation method of CT should consider the influence of rolling angle.Through SPSS analysis, the strong correlation between the rolling angle and the CT is onceagain proved.
4. Modified Solution of Cutterhead Torque
According to the analysis results in Section 3, the rolling angle has a more significantcorrelation with CT than other tunneling parameters. In this section, based on the traditionalcalculation method of the torque, the rolling angle is considered, and a modified solutionof the torque is proposed.
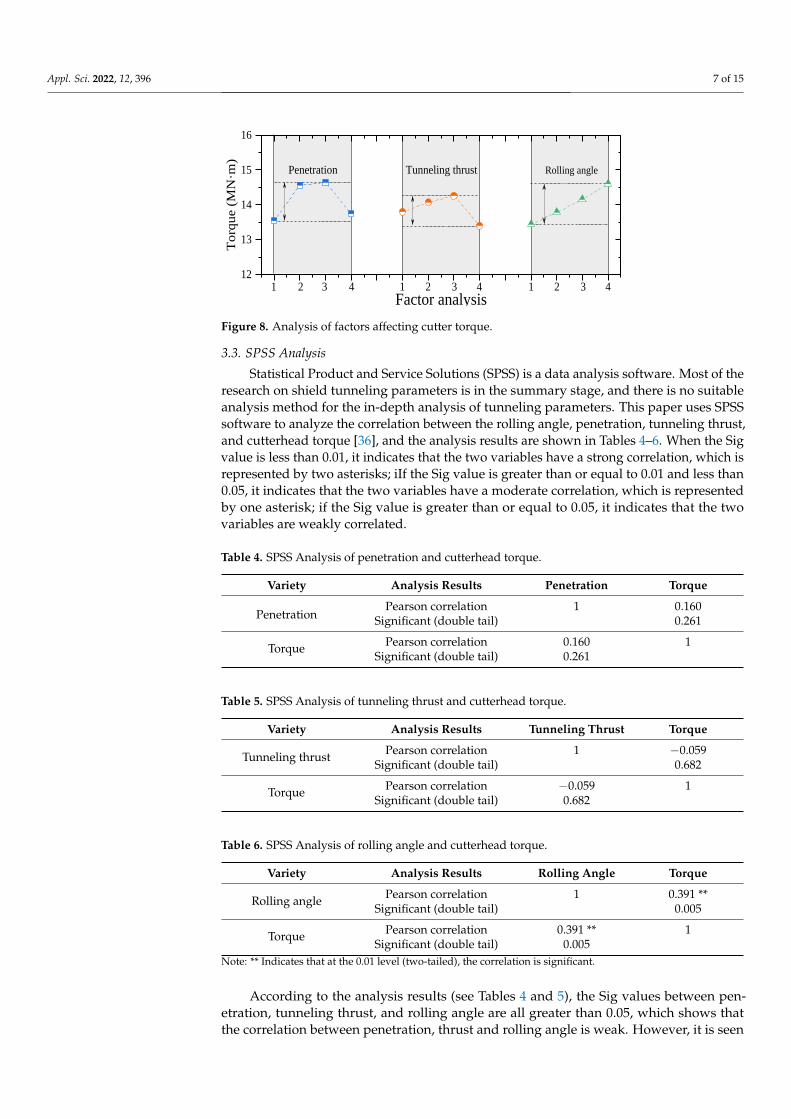
4.1. Krause Empirical Model
The Krause empirical load model is widely used in shield design and construction.In 1987, Krause collected and analyzed the construction load data from 397 sets of slurryshield tunneling machines made in Japan and 12 sets made in Germany. He proposed theempirical load model shown in Equation (2) [37,38]:
T = αD3 (2)
where T (kN·m) is the total torque; D (m) is the shield diameter; α (kN·m2) is the empiricalcoefficient that depends on the ground conditions and the type of shield. The range of α,determined by the statistical analysis of in-situ data and widely used in current engineering,is 9 to 23, as shown Figure 9 [19]. The empirical value range of CT in this paper is from17.75 MN·m to 45.35 MN·m (D = 12.54 m).
Appl. Sci. 2022, 12, x FOR PEER REVIEW 8 of 15
Table 6. SPSS Analysis of rolling angle and cutterhead torque.
Variety Analysis Results Rolling Angle Torque
Rolling angle Pearson correlation 1 0.391 **
Significant (double tail) 0.005
Torque Pearson correlation 0.391 ** 1
Significant (double tail) 0.005
Note: ** Indicates that at the 0.01 level (two-tailed), the correlation is significant.
4. Modified Solution of Cutterhead Torque
According to the analysis results in Section 3, the rolling angle has a more significant
correlation with CT than other tunneling parameters. In this section, based on the tradi-
tional calculation method of the torque, the rolling angle is considered, and a modified
solution of the torque is proposed.
4.1. Krause Empirical Model
The Krause empirical load model is widely used in shield design and construction.
In 1987, Krause collected and analyzed the construction load data from 397 sets of slurry
shield tunneling machines made in Japan and 12 sets made in Germany. He proposed the
empirical load model shown in Equation (2) [37,38]:
3T D= (2)
where T (kN·m) is the total torque; D (m) is the shield diameter; α (kN·m2) is the empirical
coefficient that depends on the ground conditions and the type of shield. The range of α,
determined by the statistical analysis of in-situ data and widely used in current engineer-
ing, is 9 to 23, as shown Figure 9 [19]. The empirical value range of CT in this paper is
from 17.75 MN·m to 45.35 MN·m (D = 12.54 m).
Figure 9. Cutterhead torque of the Krause empirical model.
4.2. Theoretical Calculation Model of Cutterhead Torque
When the shield tunnels in the ground, CT is mainly used to overcome the resistance
torque of the formation when the cutterhead cuts the soil (T1), the friction torque between
the front, side, and back of the cutterhead and the soil (T2), the resistance torque caused
by the seal of the cutterhead (T3), the friction torque caused by the main bearing of the
cutterhead (T4), and the friction loss torque of the reducer (T5) [18,22]. Therefore, the shield
cutterhead torque can be expressed as:
1 2 3 4 5T T T T T T= + + + + (3)
4.3. Modified Solution Derivation
2 4 6 8 10 12 14
0
10
20
30
40
50
60
70
12.54
Cu
tter
hea
d t
orq
ue
(MN
·m)
Shield diameter (m)
T=αD3
α=23
α=9
This paper
Figure 9. Cutterhead torque of the Krause empirical model.
4.2. Theoretical Calculation Model of Cutterhead Torque
When the shield tunnels in the ground, CT is mainly used to overcome the resistancetorque of the formation when the cutterhead cuts the soil (T1), the friction torque betweenthe front, side, and back of the cutterhead and the soil (T2), the resistance torque causedby the seal of the cutterhead (T3), the friction torque caused by the main bearing of thecutterhead (T4), and the friction loss torque of the reducer (T5) [18,22]. Therefore, the shieldcutterhead torque can be expressed as:
T = T1 + T2 + T3 + T4 + T5 (3)
4.3. Modified Solution Derivation
Table 7 shows the statistics of several shield projects on the torque composition ofthe cutterhead [39,40]. It shows that CT is mainly composed of overcoming formationresistance and friction. T1 and T2 account for about 80–90% of the total torque. Based on
Appl. Sci. 2022, 12, 396 9 of 15
this statistical data, this paper simplified the calculation model due to the unavailability ofsome shield mechanical parameters, as shown in Equation (4).
T= 1.2(T1 + T2) (4)
Table 7. Related projects.
Project T1 + T2 (kN·m) Total Torque (kN·m) Percentage (%)
Izmir Metro, Turkey 4297 5289 81.0London Heathrow Airport Tunnel 13,806 18,842 73.0
Beijing Metro Line 9, China - - 91.2Beijing Metro Line 10, China - - 93.8
T1 and T2 can be obtained by the following method. During the advancing process ofthe shield, the resistance torque generated by the cutter cutting the soil is:
T1 =∫ R0
0quhmaxrdr = 0.5quhmaxrR2
0 (5)
where qu is unconfined compressive strength of soil; hmax is maximum cutting depth perrevolution of the cutterhead; R0 is the radius of the outermost tool.
When the cutterhead is cutting, the front and side surfaces of the cutterhead rubagainst the soil, resulting in frictional resistance torque. The specific calculation formulacan be expressed as follows:
T2 = T21 + T22 (6)
T21 =
2π∫0
De2∫
0
(1− ξ) f · σn f · r2drdθ (7)
T22 =∫ 2π
0
D2
4f W p1 sin2 θdθ +
∫ 2π
0
D2
4f WKa p2 cos2 θdθ (8)
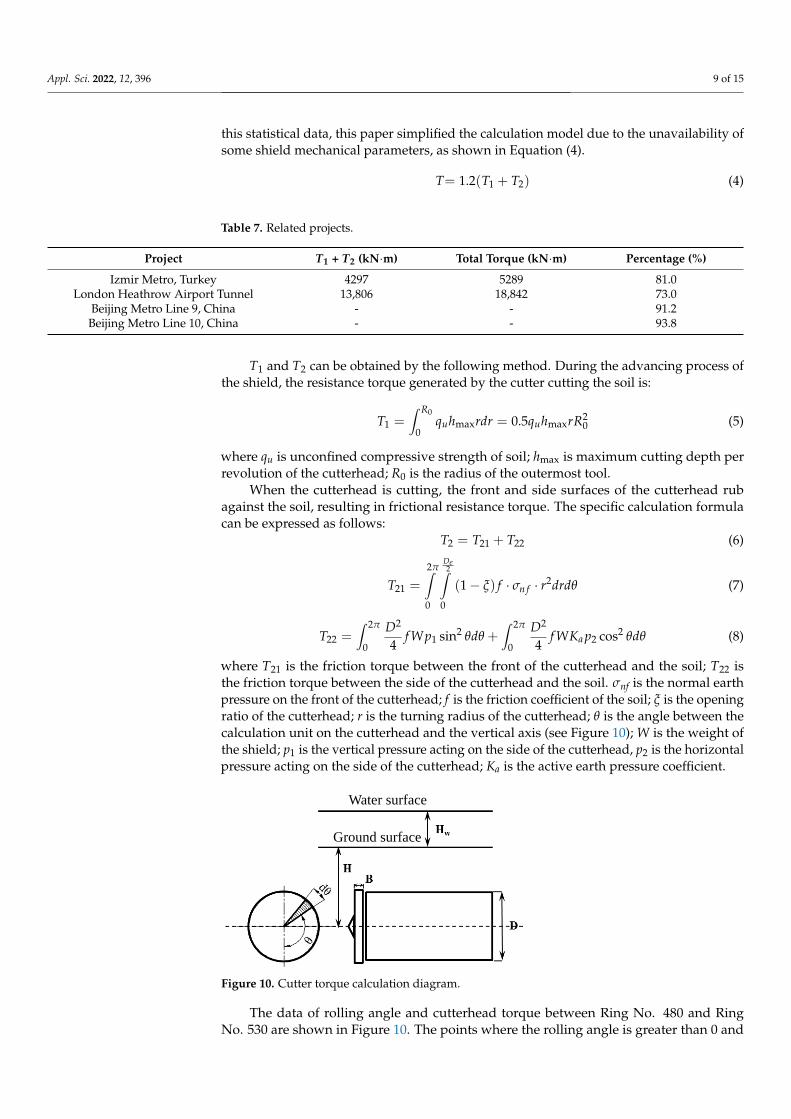
where T21 is the friction torque between the front of the cutterhead and the soil; T22 isthe friction torque between the side of the cutterhead and the soil. σnf is the normal earthpressure on the front of the cutterhead; f is the friction coefficient of the soil; ξ is the openingratio of the cutterhead; r is the turning radius of the cutterhead; θ is the angle between thecalculation unit on the cutterhead and the vertical axis (see Figure 10); W is the weight ofthe shield; p1 is the vertical pressure acting on the side of the cutterhead, p2 is the horizontalpressure acting on the side of the cutterhead; Ka is the active earth pressure coefficient.
Appl. Sci. 2022, 12, x FOR PEER REVIEW 9 of 15
Table 7 shows the statistics of several shield projects on the torque composition of the
cutterhead [39,40]. It shows that CT is mainly composed of overcoming formation re-
sistance and friction. T1 and T2 account for about 80–90% of the total torque. Based on this
statistical data, this paper simplified the calculation model due to the unavailability of
some shield mechanical parameters, as shown in Equation (4).
Table 7. Related projects.
Project T1 + T2 (kN·m) Total Torque (kN·m) Percentage (%)
Izmir Metro, Turkey 4297 5289 81.0
London Heathrow Airport Tunnel 13,806 18,842 73.0
Beijing Metro Line 9, China - - 91.2
Beijing Metro Line 10, China - - 93.8
( )1 2=1.2T T T+ (4)
T1 and T2 can be obtained by the following method. During the advancing process of
the shield, the resistance torque generated by the cutter cutting the soil is:
𝑇1 = ∫ 𝑞𝑢ℎ𝑚𝑎𝑥 𝑟 ⅆ𝑟𝑅0
0
= 0.5𝑞𝑢ℎ𝑚𝑎𝑥 𝑟 𝑅02 (5)
where qu is unconfined compressive strength of soil; hmax is maximum cutting depth per
revolution of the cutterhead; R0 is the radius of the outerm
ost tool.
When the cutterhead is cutting, the front and side surfaces of the cutterhead rub
against the soil, resulting in frictional resistance torque. The specific calculation formula
can be expressed as follows:
2 21 22T T T= + (6)
2 22
21
0 0
(1 )
eD
nfT f r drd
= − (7)
2 22 2
2 2
22 1 20 0
sin cos4 4
a
D DT fWp d fWK p d
= + (8)
where T21 is the friction torque between the front of the cutterhead and the soil; T22 is the
friction torque between the side of the cutterhead and the soil. σnf is the normal earth pres-
sure on the front of the cutterhead; f is the friction coefficient of the soil; ξ is the opening
ratio of the cutterhead; r is the turning radius of the cutterhead; θ is the angle between the
calculation unit on the cutterhead and the vertical axis (see Figure 10); W is the weight of
the shield; p1 is the vertical pressure acting on the side of the cutterhead, p2 is the horizontal
pressure acting on the side of the cutterhead; Ka is the active earth pressure coefficient.
Figure 10. Cutter torque calculation diagram.
Water surface
Ground surface
Figure 10. Cutter torque calculation diagram.
The data of rolling angle and cutterhead torque between Ring No. 480 and RingNo. 530 are shown in Figure 10. The points where the rolling angle is greater than 0 and
Appl. Sci. 2022, 12, 396 10 of 15
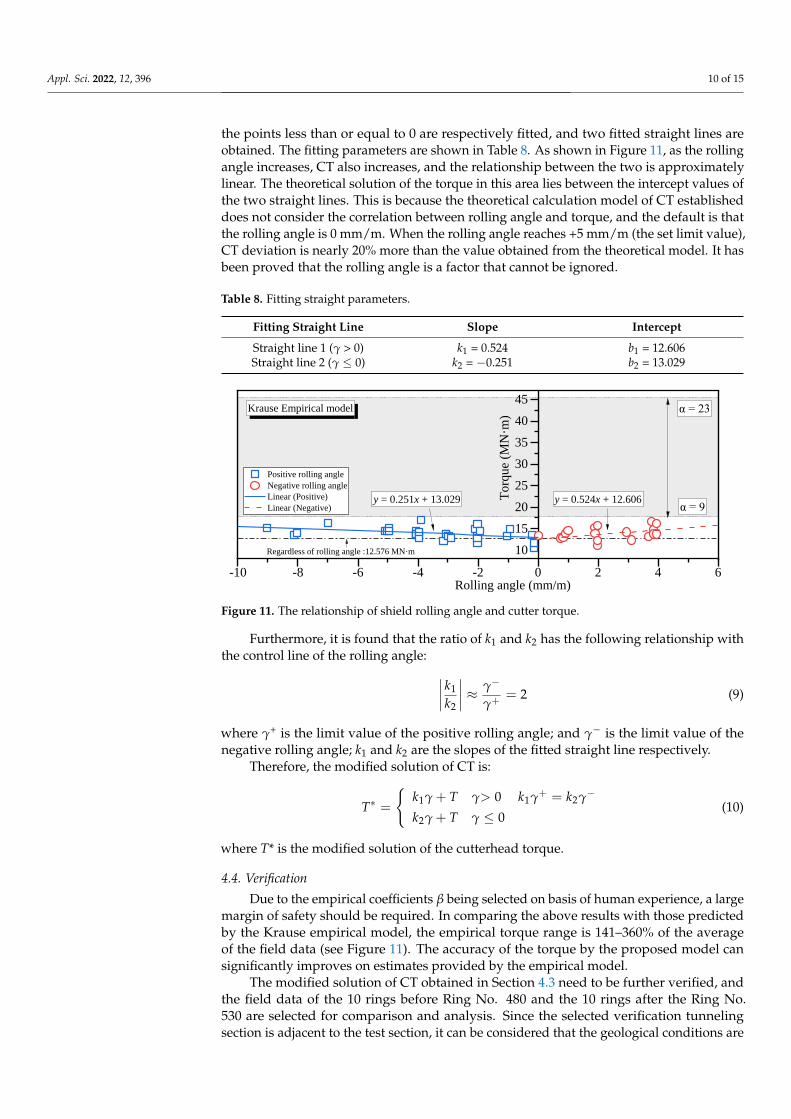
the points less than or equal to 0 are respectively fitted, and two fitted straight lines areobtained. The fitting parameters are shown in Table 8. As shown in Figure 11, as the rollingangle increases, CT also increases, and the relationship between the two is approximatelylinear. The theoretical solution of the torque in this area lies between the intercept values ofthe two straight lines. This is because the theoretical calculation model of CT establisheddoes not consider the correlation between rolling angle and torque, and the default is thatthe rolling angle is 0 mm/m. When the rolling angle reaches +5 mm/m (the set limit value),CT deviation is nearly 20% more than the value obtained from the theoretical model. It hasbeen proved that the rolling angle is a factor that cannot be ignored.
Table 8. Fitting straight parameters.
Fitting Straight Line Slope Intercept
Straight line 1 (γ > 0) k1 = 0.524 b1 = 12.606Straight line 2 (γ ≤ 0) k2 = −0.251 b2 = 13.029
Appl. Sci. 2022, 12, x FOR PEER REVIEW 10 of 15
The data of rolling angle and cutterhead torque between Ring No. 480 and Ring No.
530 are shown in Figure 10. The points where the rolling angle is greater than 0 and the
points less than or equal to 0 are respectively fitted, and two fitted straight lines are ob-
tained. The fitting parameters are shown in Table 8. As shown in Figure 11, as the rolling
angle increases, CT also increases, and the relationship between the two is approximately
linear. The theoretical solution of the torque in this area lies between the intercept values
of the two straight lines. This is because the theoretical calculation model of CT established
does not consider the correlation between rolling angle and torque, and the default is that
the rolling angle is 0 mm/m. When the rolling angle reaches +5 mm/m (the set limit value),
CT deviation is nearly 20% more than the value obtained from the theoretical model. It
has been proved that the rolling angle is a factor that cannot be ignored.
Figure 11. The relationship of shield rolling angle and cutter torque.
Table 8. Fitting straight parameters.
Fitting Straight Line Slope Intercept
Straight line 1 (γ > 0) k1 = 0.524 b1 = 12.606
Straight line 2 (γ ≤ 0) k2 = −0.251 b2 = 13.029
Furthermore, it is found that the ratio of k1 and k2 has the following relationship with
the control line of the rolling angle:
-
1
2
2k
k
+ = (9)
where γ+ is the limit value of the positive rolling angle; and γ− is the limit value of the
negative rolling angle; k1 and k2 are the slopes of the fitted straight line respectively.
Therefore, the modified solution of CT is:
* 1 1 2
2
>0 =
0
k T k kT
k T
+ − +=
+ (10)
where T* is the modified solution of the cutterhead torque.
4.4. Verification
Due to the empirical coefficients β being selected on basis of human experience, a
large margin of safety should be required. In comparing the above results with those pre-
dicted by the Krause empirical model, the empirical torque range is 141–360% of the av-
erage of the field data (see Figure 11). The accuracy of the torque by the proposed model
can significantly improves on estimates provided by the empirical model.
-10 -8 -6 -4 -2 0 2 4 6
10
15
20
25
30
35
40
45
Positive rolling angle
Negative rolling angle
Linear (Positive)
Linear (Negative)T
orq
ue
(MN
·m)
Rolling angle (mm/m)
Krause Empirical model α = 23
α = 9y = 0.251x + 13.029 y = 0.524x + 12.606
Regardless of rolling angle :12.576 MN·m
Figure 11. The relationship of shield rolling angle and cutter torque.
Furthermore, it is found that the ratio of k1 and k2 has the following relationship withthe control line of the rolling angle: ∣∣∣∣ k1
k2
∣∣∣∣ ≈ γ−
γ+= 2 (9)
where γ+ is the limit value of the positive rolling angle; and γ− is the limit value of thenegative rolling angle; k1 and k2 are the slopes of the fitted straight line respectively.
Therefore, the modified solution of CT is:
T∗ =
{k1γ + T γ> 0 k1γ+ = k2γ−
k2γ + T γ ≤ 0(10)
where T* is the modified solution of the cutterhead torque.
4.4. Verification
Due to the empirical coefficients β being selected on basis of human experience, a largemargin of safety should be required. In comparing the above results with those predictedby the Krause empirical model, the empirical torque range is 141–360% of the averageof the field data (see Figure 11). The accuracy of the torque by the proposed model cansignificantly improves on estimates provided by the empirical model.
The modified solution of CT obtained in Section 4.3 need to be further verified, andthe field data of the 10 rings before Ring No. 480 and the 10 rings after the Ring No.530 are selected for comparison and analysis. Since the selected verification tunnelingsection is adjacent to the test section, it can be considered that the geological conditions are
Appl. Sci. 2022, 12, 396 11 of 15
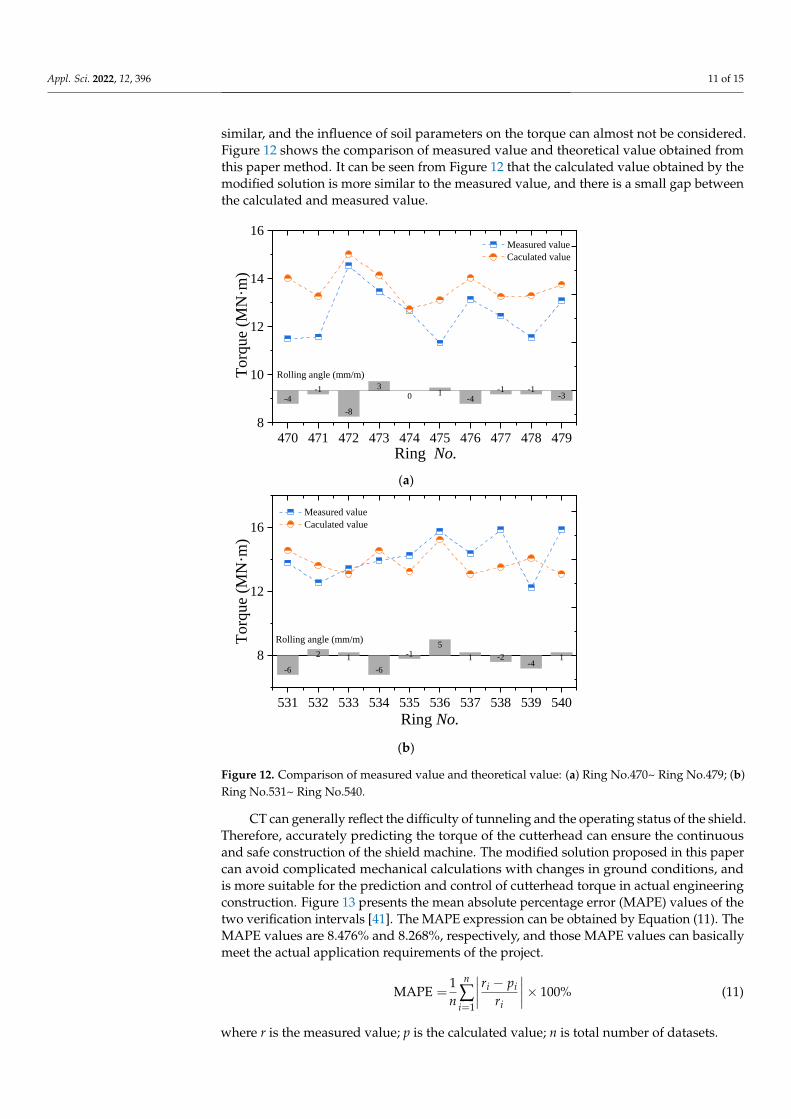
similar, and the influence of soil parameters on the torque can almost not be considered.Figure 12 shows the comparison of measured value and theoretical value obtained fromthis paper method. It can be seen from Figure 12 that the calculated value obtained by themodified solution is more similar to the measured value, and there is a small gap betweenthe calculated and measured value.
Appl. Sci. 2022, 12, x FOR PEER REVIEW 11 of 15
The modified solution of CT obtained in Section 4.3 need to be further verified, and
the field data of the 10 rings before Ring No. 480 and the 10 rings after the Ring No. 530
are selected for comparison and analysis. Since the selected verification tunneling section
is adjacent to the test section, it can be considered that the geological conditions are simi-
lar, and the influence of soil parameters on the torque can almost not be considered. Figure
12 shows the comparison of measured value and theoretical value obtained from this pa-
per method. It can be seen from Figure 12 that the calculated value obtained by the mod-
ified solution is more similar to the measured value, and there is a small gap between the
calculated and measured value.
(a)
(b)
Figure 12. Comparison of measured value and theoretical value: (a) Ring No.470~ Ring No.479; (b)
Ring No.531~ Ring No.540.
CT can generally reflect the difficulty of tunneling and the operating status of the
shield. Therefore, accurately predicting the torque of the cutterhead can ensure the con-
tinuous and safe construction of the shield machine. The modified solution proposed in
this paper can avoid complicated mechanical calculations with changes in ground condi-
tions, and is more suitable for the prediction and control of cutterhead torque in actual
engineering construction. Figure 13 presents the mean absolute percentage error (MAPE)
values of the two verification intervals [41]. The MAPE expression can be obtained by
Equation (11). The MAPE values are 8.476% and 8.268%, respectively, and those MAPE
values can basically meet the actual application requirements of the project.
470 471 472 473 474 475 476 477 478 4798
10
12
14
16
-4-1
-8
30 1
-4-1 -1
-3
To
rqu
e (M
N·m
)
Ring No.
Measured value
Caculated value
Rolling angle (mm/m)
531 532 533 534 535 536 537 538 539 540
8
12
16
-6
2 1
-6
-15
1 -2-4
1
To
rqu
e (M
N·m
)
Ring No.
Measured value
Caculated value
Rolling angle (mm/m)
Figure 12. Comparison of measured value and theoretical value: (a) Ring No.470~ Ring No.479; (b)Ring No.531~ Ring No.540.
CT can generally reflect the difficulty of tunneling and the operating status of the shield.Therefore, accurately predicting the torque of the cutterhead can ensure the continuousand safe construction of the shield machine. The modified solution proposed in this papercan avoid complicated mechanical calculations with changes in ground conditions, andis more suitable for the prediction and control of cutterhead torque in actual engineeringconstruction. Figure 13 presents the mean absolute percentage error (MAPE) values of thetwo verification intervals [41]. The MAPE expression can be obtained by Equation (11). TheMAPE values are 8.476% and 8.268%, respectively, and those MAPE values can basicallymeet the actual application requirements of the project.
MAPE =1n
n
∑i=1
∣∣∣∣ ri − piri
∣∣∣∣× 100% (11)
where r is the measured value; p is the calculated value; n is total number of datasets.
Appl. Sci. 2022, 12, 396 12 of 15
Appl. Sci. 2022, 12, x FOR PEER REVIEW 12 of 15
1
1MAPE= 100%
ni i
i i
r p
n r=
− (11)
where r is the measured value; p is the calculated value; n is total number of datasets.
(a) (b)
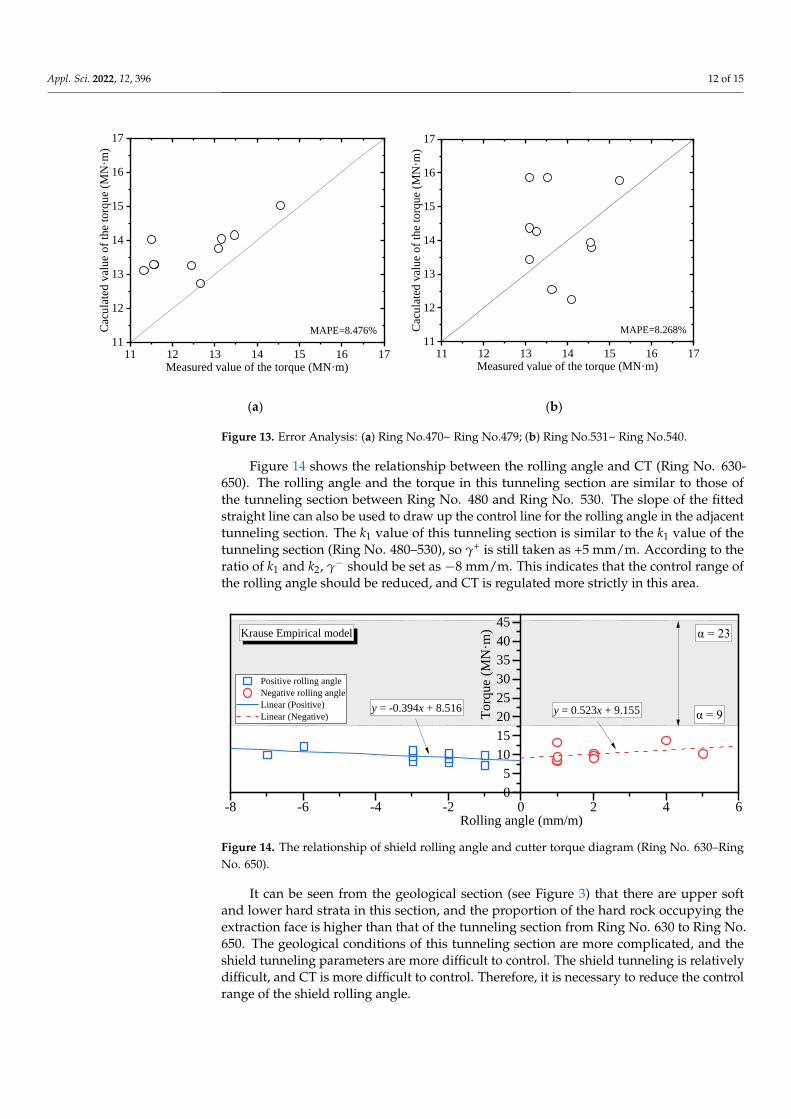
Figure 13. Error Analysis: (a) Ring No.470~ Ring No.479; (b) Ring No.531~ Ring No.540.
Figure 14 shows the relationship between the rolling angle and CT (Ring No. 630-
650). The rolling angle and the torque in this tunneling section are similar to those of the
tunneling section between Ring No. 480 and Ring No. 530. The slope of the fitted straight
line can also be used to draw up the control line for the rolling angle in the adjacent tun-
neling section. The k1 value of this tunneling section is similar to the k1 value of the tun-
neling section (Ring No. 480–530), so γ+ is still taken as +5 mm/m. According to the ratio
of k1 and k2, γ− should be set as −8 mm/m. This indicates that the control range of the rolling
angle should be reduced, and CT is regulated more strictly in this area.
Figure 14. The relationship of shield rolling angle and cutter torque diagram (Ring No. 630–Ring
No. 650).
It can be seen from the geological section (see Figure 3) that there are upper soft and
lower hard strata in this section, and the proportion of the hard rock occupying the ex-
traction face is higher than that of the tunneling section from Ring No. 630 to Ring No.
650. The geological conditions of this tunneling section are more complicated, and the
11 12 13 14 15 16 1711
12
13
14
15
16
17
Cac
ula
ted
val
ue
of
the
torq
ue
(MN
·m)
Measured value of the torque (MN·m)
MAPE=8.476%
11 12 13 14 15 16 1711
12
13
14
15
16
17
Measured value of the torque (MN·m)
Cac
ula
ted
val
ue
of
the
torq
ue
(MN
·m)
MAPE=8.268%
-8 -6 -4 -2 0 2 4 60
5
10
15
20
25
30
35
40
45
Positive rolling angle
Negative rolling angle
Linear (Positive)
Linear (Negative) To
rqu
e (M
N·m
)
Rolling angle (mm/m)
Krause Empirical model α = 23
α = 9y = -0.394x + 8.516 y = 0.523x + 9.155
Figure 13. Error Analysis: (a) Ring No.470~ Ring No.479; (b) Ring No.531~ Ring No.540.
Figure 14 shows the relationship between the rolling angle and CT (Ring No. 630-650). The rolling angle and the torque in this tunneling section are similar to those ofthe tunneling section between Ring No. 480 and Ring No. 530. The slope of the fittedstraight line can also be used to draw up the control line for the rolling angle in the adjacenttunneling section. The k1 value of this tunneling section is similar to the k1 value of thetunneling section (Ring No. 480–530), so γ+ is still taken as +5 mm/m. According to theratio of k1 and k2, γ− should be set as −8 mm/m. This indicates that the control range ofthe rolling angle should be reduced, and CT is regulated more strictly in this area.
Appl. Sci. 2022, 12, x FOR PEER REVIEW 12 of 15
1
1MAPE= 100%
ni i
i i
r p
n r=
− (11)
where r is the measured value; p is the calculated value; n is total number of datasets.
(a) (b)
Figure 13. Error Analysis: (a) Ring No.470~ Ring No.479; (b) Ring No.531~ Ring No.540.
Figure 14 shows the relationship between the rolling angle and CT (Ring No. 630-
650). The rolling angle and the torque in this tunneling section are similar to those of the
tunneling section between Ring No. 480 and Ring No. 530. The slope of the fitted straight
line can also be used to draw up the control line for the rolling angle in the adjacent tun-
neling section. The k1 value of this tunneling section is similar to the k1 value of the tun-
neling section (Ring No. 480–530), so γ+ is still taken as +5 mm/m. According to the ratio
of k1 and k2, γ− should be set as −8 mm/m. This indicates that the control range of the rolling
angle should be reduced, and CT is regulated more strictly in this area.
Figure 14. The relationship of shield rolling angle and cutter torque diagram (Ring No. 630–Ring
No. 650).
It can be seen from the geological section (see Figure 3) that there are upper soft and
lower hard strata in this section, and the proportion of the hard rock occupying the ex-
traction face is higher than that of the tunneling section from Ring No. 630 to Ring No.
650. The geological conditions of this tunneling section are more complicated, and the
11 12 13 14 15 16 1711
12
13
14
15
16
17
Cac
ula
ted
val
ue
of
the
torq
ue
(MN
·m)
Measured value of the torque (MN·m)
MAPE=8.476%
11 12 13 14 15 16 1711
12
13
14
15
16
17
Measured value of the torque (MN·m)
Cac
ula
ted
val
ue
of
the
torq
ue
(MN
·m)
MAPE=8.268%
-8 -6 -4 -2 0 2 4 60
5
10
15
20
25
30
35
40
45
Positive rolling angle
Negative rolling angle
Linear (Positive)
Linear (Negative) To
rqu
e (M
N·m
)
Rolling angle (mm/m)
Krause Empirical model α = 23
α = 9y = -0.394x + 8.516 y = 0.523x + 9.155
Figure 14. The relationship of shield rolling angle and cutter torque diagram (Ring No. 630–RingNo. 650).
It can be seen from the geological section (see Figure 3) that there are upper softand lower hard strata in this section, and the proportion of the hard rock occupying theextraction face is higher than that of the tunneling section from Ring No. 630 to Ring No.650. The geological conditions of this tunneling section are more complicated, and theshield tunneling parameters are more difficult to control. The shield tunneling is relativelydifficult, and CT is more difficult to control. Therefore, it is necessary to reduce the controlrange of the shield rolling angle.
Appl. Sci. 2022, 12, 396 13 of 15
5. Conclusions
Through the range and SPSS analysis methods, it is proved in this paper that thecutterhead torque has a strong correlation with the rolling angle. On the basis of thetheoretical solution of the torque, a modified solution considering the rolling angle isobtained. The main conclusions from this study are enumerated below.
(1) Ring No. 480 to Ring No. 530 are selected as the test tunneling section, and thefield data are analyzed. The results shows that the rolling angle is strictly controlled withina limited range, and can be reduced gradually to 0 mm/m by changing DCR.
(2) The three variables of penetration, thrust, and rolling angle are selected for intervalgrouping. Through range and SPSS analysis methods, it is proved that the rolling anglehas a stronger correlation with CT than the other two factors.
(3) Based on the theoretical calculation model of CT, and through regression analysisof the field data, the modified solution of CT considering the rolling angle is obtained.Using this calculation method, the prediction accuracy of CT is much higher than that ofthe traditional K model. Compared with the existing theoretical calculation methods, thepredicted value obtained by the method proposed in this paper is more in line with theactual engineering.
Due to the limited collection of engineering cases, the cutterhead torque calculationmethod proposed in this paper only verifies the tunneling parameters of this project, andsome useful conclusions have been obtained. However, in the future, it is necessary tocollect more comprehensive engineering data to further verify the rationality of this method.
6. Patents
This section is not mandatory but may be added if there are patents resulting from thework reported in this manuscript.
Author Contributions: Investigation and methodology, X.S. and C.C.; conceptualization, D.Y.; vali-dation, D.J. All authors have read and agreed to the published version of the manuscript.
Funding: This research was funded by the National Natural Science Foundation of China (GrantNos. 52090084, 52108377, 51938008) and China Postdoctoral Science Foundation (2021M702269,2021T140474).
Institutional Review Board Statement: Not applicable.
Informed Consent Statement: Not applicable.
Data Availability Statement: Not applicable.
Conflicts of Interest: The authors declare that they have no known competing financial interests orpersonal relationships that could have appeared to influence the work reported in this paper.
References1. Qian, Q.H.; Lin, P. Safety risk management of underground engineering in China: Progress, challenges and strategies. J. Rock
Mech. Geotech. 2016, 8, 423–442. [CrossRef]2. Chen, X.S. Research on combined construction technology for cross-metro tunnels in underground spaces. Engineering 2018, 4,
103–111. [CrossRef]3. Shen, X.; Yuan, D.J.; Cao, L.Q.; Jin, D.; Chen, X.; Gao, Z. Experimental investigation of the failure of shield grease seals under the
influence of environmental factors: A case study. Eng. Fail. Anal. 2022, 133, 105975. [CrossRef]4. Jin, D.L.; Zhang, Z.Y.; Yuan, D.J. Effect of dynamic cutterhead on face stability in EPB shield tunneling. Tunn. Undergr. Space
Technol. 2021, 110, 103827. [CrossRef]5. Shen, X.; Yuan, D.J.; Jin, D.L. Influence of shield attitude change on shield–soil interaction. Appl. Sci. Basel 2019, 9, 1812. [CrossRef]6. Liu, J.; Li, P.N.; Shi, L.; Fan, J.; Kou, X.Y.; Huang, D.Z. Spatial distribution model of the filling and diffusion pressure of
synchronous grouting in a quasi-rectangular shield and its experimental verification. Undergr. Space 2021, 6, 650–664. [CrossRef]7. Jin, Y.R.; Qin, C.J.; Tao, J.F.; Liu, C.L. An accurate and adaptative cutterhead torque prediction method for shield tunneling
machines via adaptative residual long-short term memory network. Mech. Syst. Sig. Process. 2022, 165, 108312. [CrossRef]8. Li, S.H.; Zhang, M.J.; Li, P.F. Analytical solutions to ground settlement induced by ground loss and construction loadings during
curved shield tunneling. J. Zhejiang Univ. Sci. A 2021, 22, 296–313. [CrossRef]
Appl. Sci. 2022, 12, 396 14 of 15
9. Han, M.D.; Cai, Z.X.; Qu, C.Y. Dynamic numerical simulation of cutterhead loads in TBM tunnelling. Tunn. Undergr. Space Technol.2017, 70, 286–298. [CrossRef]
10. Jin, D.L.; Yuan, D.J.; Li, X.G.; Su, W. Probabilistic analysis of the disc cutter failure during TBM tunneling in hard rock. Tunn.Undergr. Space Technol. 2021, 109, 103744. [CrossRef]
11. Tao, Y.; Shen, S.L.; Zhou, A.N.; Lyu, H.-M. Construction efficiency of shield tunnelling through soft deposit in Tianjin, China.Tunn. Undergr. Space Technol. 2021, 112, 103917.
12. Askilsrud, O.; Moulton, B. Tunnel Boring Machines. Mechanical Tunnelling. Raise Boring and Shaft Drilling Short Course; ColoradoSchool of Mines: Golden, CO, USA, 1998.
13. Maidl, B.; Herrenknecht, M.; Maidl, U.; Wehrmeyer, G.; Sturge, D.S. Mechanised Shield Tunneling, 2nd ed.; John Wiley & Sons:Hoboken, NJ, USA, 2013.
14. Reilly, B.J. EPBs for the north east line project. Tunn. Undergr. Space Technol. 1999, 14, 491–508. [CrossRef]15. Zhang, Q.; Hou, Z.D.; Huang, G.Y.; Cai, Z.X.; Kang, Y. Mechanical characterization of the load distribution on the cutterhead–
ground interface of shield tunneling machines. Tunn. Undergr. Space Technol. 2015, 47, 106–113. [CrossRef]16. Faramarzi, L.; Kheradmandian, A.; Azhari, A. Evaluation and Optimization of the Effective Parameters on the Shield TBM
Performance: Torque and Thrust—Using Discrete Element Method (DEM). Geotech. Geol. Eng. 2020, 38, 2745–2759. [CrossRef]17. Shi, H.; Yang, H.Y.; Gong, G.F. Determination of the cutterhead torque for EPB shield tunneling machine. Autom. Constr. 2011, 20,
1087–1095. [CrossRef]18. Wang, L.T.; Gong, G.F.; Shi, H.; Yang, H. Modeling and analysis of thrust force for EPB shield tunneling machine. Automat. Constr.
2012, 27, 138–146. [CrossRef]19. Zhang, Q.; Qu, C.Y.; Cai, Z.X. Modeling of the thrust and torque acting on shield machines during tunneling. Automat. Constr.
2014, 40, 60–67. [CrossRef]20. Ates, U.; Bilgin, N.; Copur, H. Estimating torque, thrust and other design parameters of different type TBMs with some criticism
to TBMs used in Turkish tunneling projects. Tunn. Undergr. Space Technol. 2014, 40, 46–63. [CrossRef]21. González, C.; Arroyo, M.; Gens, A. Thrust and torque components on mixed-face EPB drives. Tunn. Undergr. Space Technol. 2016,
57, 47–54. [CrossRef]22. Zhou, X.P.; Zhai, S.F. Estimation of the cutterhead torque for earth pressure balance TBM under mixed-face conditions. Tunn.
Undergr. Space Technol. 2018, 74, 217–229. [CrossRef]23. Zhang, K.; Lyu, H.M.; Shen, S.L.; Zhou, A. Evolutionary hybrid neural network approach to predict shield tunneling-induced
ground settlements. Tunn. Underg. Space Technol. 2020, 106, 103594. [CrossRef]24. Khotbehsara, M.M.; Manalo, A.; Aravinthan, T.; Ferdous, W. Synergistic effects of hygrothermal conditions and solar ultraviolet
radiation on the properties of structural particulate-filled epoxy polymer coatings. Constr. Build. Mater. 2021, 277, 122336.[CrossRef]
25. Yu, P.; Manalo, A.; Ferdous, W.; Abousnina, R.; Salih, C.; Heyer, T.; Schubel, P. Investigation on the physical, mechanical andmicrostructural properties of epoxy polymer matrix with crumb rubber and short fibres for composite railway sleepers. Constr.Build. Mater. 2021, 295, 123700. [CrossRef]
26. Zhao, R.; Yan, R.Q.; Chen, Z.H.; Mao, K.; Wang, P.; Gao, R.X. Deep learning and its applications to machine health monitoring.Mech. Syst. Sig. Process. 2019, 115, 213–237. [CrossRef]
27. Armaghani, D.J.; Koopialipoor, M.; Marto, A.; Yagiz, S. Application of several optimization techniques for estimating TBMadvance rate in granitic rocks. J. Rock Mech. Geotech. Eng. 2019, 11, 779–789. [CrossRef]
28. Sun, W.; Shi, M.L.; Zhang, C.; Zhao, J.; Song, X. Dynamic load prediction of tunnel boring machine (TBM) based on heterogeneousin-situ data. Autom. Constr. 2018, 92, 23–34. [CrossRef]
29. Gao, X.J.; Shi, M.L.; Song, X.G.; Zhang, C.; Zhang, H. Recurrent neural networks for real-time prediction of TBM operatingparameters. Autom. Constr. 2019, 98, 225–235. [CrossRef]
30. Luo, W.P.; Yuan, D.J.; Jin, D.L.; Lu, P.; Chen, J. Optimal Control of Slurry Pressure during Shield Tunnelling Based on RandomForest and Particle Swarm Optimization. CMES-Comp. Model. Eng. 2021, 128, 109–127. [CrossRef]
31. Qin, C.J.; Shi, G.; Tao, J.F.; Honggan, Y.; Yanrui, J.; Junbo, L.; Chengliang, L. Precise cutterhead torque prediction for shieldtunneling machines using a novel hybrid deep neural network. Mech. Syst. Signal. Process. 2021, 151, 107386. [CrossRef]
32. Shi, G.; Qin, C.J.; Tao, J.F.; Liu, C. A VMD-EWT-LSTM-based multi-step prediction approach for shield tunneling machinecutterhead torque. Knowl. Based Syst. 2021, 228, 107213. [CrossRef]
33. Wang, T.; Yuan, D.J.; Jin, D.L.; Li, X. Experimental study on slurry-induced fracturing during shield tunneling. Front. Struct Civ.Eng. 2021, 15, 333–345. [CrossRef]
34. GB 50446—2017. Code for Construction and Acceptance of Shield Tunneling Method; Ministry of Housing and Urban-Rural Construc-tion of the People’s Republic of China: Beijing, China, 2017.
35. Xu, Q.W.; Zhu, H.H.; Ding, W.Q.; Ge, X. Laboratory model tests and field investigations of EPB shield machine tunneling in softground in Shanghai. Tunn. Underg. Space Technol. 2011, 26, 1–14. [CrossRef]
36. Sabzi, S.; Javadikia, P.; Rabani, H.; Adelkhani, A. Mass modeling of Bam orange with ANFIS and SPSS methods for using inmachine vision. Measurement 2013, 46, 3333–3341. [CrossRef]
37. Krause, T. Schildvortrieb mit Flüssigkeits und Erdgestützter Ortsbrust. In Mitteilung des Instituts für Grundbau und Bodenmechanik;TU Braunschweig: Braunschweig, Germany, 1987; p. 624. (In German)

Appl. Sci. 2022, 12, 396 15 of 15
38. Maidl, B.; Herrenknecht, M.; Anheuser, L. Mechanised Shield Tunneling; Ernst & Sohn: Berlin, Germany, 1996.39. Jiang, H.; Jiang, Y.S.; Zhang, J.X.; Cheng, X.W.; Yang, Z.Y. Research on cutterhead torque during earth pressure balance shield
tunneling in sand gravel of Beijing metro. China Railw. Sci. 2013, 34, 59–65. (in Chinese).40. Li, C.; Zhou, H.W.; Zuo, J.P.; Ding, J.; Gao, M.; Shuai, Q. Torque calculation method of cutterhead in earth pressure balance shield
and quantitative analysis of several influencing factors. Chin. J. Rock Mech. Eng. 2013, 32, 760–766. (In Chinese)41. Hyndman, R.J.; Koehler, A.B. Another look at measures of forecast accuracy. Int. J. Forecast. 2006, 22, 679–688. [CrossRef]
Related Documents