A NEURON MODEL WITH SPATIALLY DISTRIBUTED SYNAPTIC INPUT RUSSELL D. FERNALD From the Department of Biomedical Engineering and The Johnson Research Foundation, University of Pennsylvania, Philadelphia, Pennsylvania 19104. Dr. Fernald's present address is the Max Planck Institute for Psychiatry, 8 Munchen 23, West Germany. ABSTRACr I have assembled a neuron model simulating contiguous patches of nerve cell membrane. With this model I have examined the functional significance of different spatial and temporal distributions of synaptic inputs. The model con- sists of two terminal electronic analogue circuits with inputs controlled by a LINC computer. One terminal represents the inside of a membrane patch, the other represents the outside. Two circuit designs are used: one simulates spike-generating regions of the neuron, the other simulates subthreshold activity in inexcitable re- gions. To simulate a neuron, patches are assembled in various spatial arrangements by suitable connection to the "intracellular" nodes. Thus the relation of neuron geometry to aspects of spatiotemporal summation of synaptic inputs can be inves- tigated readily. Performance of the model is assessed by comparison with results from microelectrode studies in the cochlear nucleus of the cat. In particular, the peristimulus time (PST) histogram and averaged membrane potential are used for quantitative comparison. The model suggests that the geometry of the neuron's receptive surface can account for a wide variety of physiologically observed beha- vior, particularly in response to dynamic stimuli. INTRODUCTION Information processing by assemblies of neurons depends on the detailed proper- ties of individual cells as well as on interconnections between cells. As more sophis- ticated experiments describe the behavior of nervous systems in greater detail, models of that behavior must include closer approximations both of the neuron itself and of neural interconnections. In particular, it is necessary in modeling studies to evaluate the functional significance of different spatial distributions of synaptic inputs. There is ample physiological evidence suggesting that it is an over- simplification to represent the synaptic input to a neuron as occurring at a single point. The branched dendritic receptive surface area can be many times larger than that of the cell body (Rall, 1961/1962) and can modify readily the state of the membrane potential (Rall, 1964; Rail, et al., 1967). 323

Welcome message from author
This document is posted to help you gain knowledge. Please leave a comment to let me know what you think about it! Share it to your friends and learn new things together.
Transcript
A NEURON MODEL
WITH SPATIALLY DISTRIBUTED
SYNAPTIC INPUT
RUSSELL D. FERNALD
From the Department of Biomedical Engineering and The Johnson Research Foundation,University of Pennsylvania, Philadelphia, Pennsylvania 19104. Dr. Fernald's present addressis the Max Planck Institutefor Psychiatry, 8 Munchen 23, West Germany.
ABSTRACr I have assembled a neuron model simulating contiguous patches ofnerve cell membrane. With this model I have examined the functional significanceof different spatial and temporal distributions of synaptic inputs. The model con-sists of two terminal electronic analogue circuits with inputs controlled by a LINCcomputer. One terminal represents the inside of a membrane patch, the otherrepresents the outside. Two circuit designs are used: one simulates spike-generatingregions of the neuron, the other simulates subthreshold activity in inexcitable re-gions. To simulate a neuron, patches are assembled in various spatial arrangementsby suitable connection to the "intracellular" nodes. Thus the relation of neurongeometry to aspects of spatiotemporal summation of synaptic inputs can be inves-tigated readily. Performance of the model is assessed by comparison with resultsfrom microelectrode studies in the cochlear nucleus of the cat. In particular, theperistimulus time (PST) histogram and averaged membrane potential are used forquantitative comparison. The model suggests that the geometry of the neuron'sreceptive surface can account for a wide variety of physiologically observed beha-vior, particularly in response to dynamic stimuli.
INTRODUCTION
Information processing by assemblies of neurons depends on the detailed proper-ties of individual cells as well as on interconnections between cells. As more sophis-ticated experiments describe the behavior of nervous systems in greater detail,models of that behavior must include closer approximations both of the neuronitself and of neural interconnections. In particular, it is necessary in modelingstudies to evaluate the functional significance of different spatial distributions ofsynaptic inputs. There is ample physiological evidence suggesting that it is an over-simplification to represent the synaptic input to a neuron as occurring at a singlepoint. The branched dendritic receptive surface area can be many times largerthan that of the cell body (Rall, 1961/1962) and can modify readily the state of themembrane potential (Rall, 1964; Rail, et al., 1967).
323
I have assembled a neuron model which simulates contiguous patches on a nervecell membrane. With this model synaptic inputs may be placed at an arbitrarylocation on the equivalent neuronal surface with respect to the site of spike initia-tion.
This model has been used successfully to simulate results from microelectrodestudies of single neurons in cat cochlear nucleus. The model has also predictedsome neuronal behavior which subsequent physiological experiments have verified.Finally, the model suggests a possible mechanism for achieving sensitivity to thedirection of change of a dynamically varying stimulus in neurons of the sensorypathways.
EXPERIMENTAL BACKGROUND
Recordings, both extracellular and intracellular, have been made from neuronsof the cat cochlear nucleus during presentation of frequency modulated tonalstimulus. Details of the experimental procedure are reported elsewhere (Erulkar etal., 1968; Femald, 1968; Fernald and Gerstein, 1970;1 Gerstein et al., 1968). Threemain results from these studies are pertinent here: first, three types of spike firingpatterns result from frequency modulated acoustic stimuli; second, the over-allshape of the firing pattern remains nearly constant over a range of frequencymodulation rates; third, the excursions of the membrane potential do not neces-sarily predict the spike firing pattern.The three different types of firing patterns are classified according to their sym-
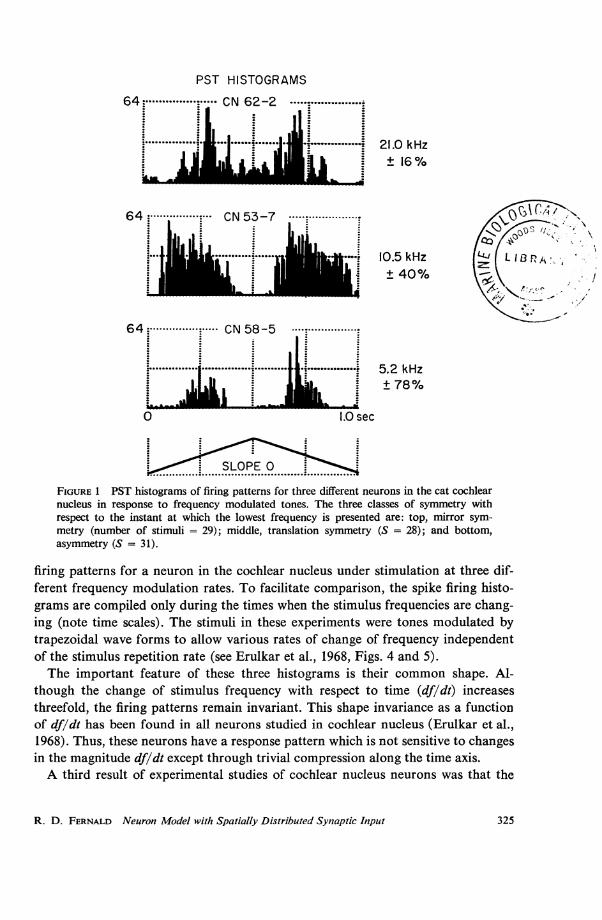
metry with regard to increasing or decreasing frequency of the stimulus (see Fig. 1).(The frequency modulated stimuli used in this study were all symmetrical withrespect to a point in time; the symmetries of the responses are given with respectto the same point in time). In Fig. 1 (top), unit CN 62-2 has "mirror symmetry"around the central coordinate which corresponds to the highest stimulus fre-quency. For this class of neurons the spike response is approximately equal toa given stimulus frequency, whether in the ascending or descending portion of thestimulus. The second class responses may be characterized as "translation sym-metry" with respect to the central coordinate (unit CN 53-7, Fig. 1, middle). Suchneurons show approximately the same response pattern to the stimulus whetherit is of increasing or decreasing frequency. There is no dependence of the responsepattern on exact stimulus frequency or sequence of presentation. The third class ofneurons (unit CN 58-5, Fig. 1, bottom) has a response pattern which is asymmetricwith respect to the central coordinate. For this class of neurons the response de-pends not only on the stimulus frequency, but also on the direction of change ofthat frequency.A second main experimental result was that the shape of the spike firing patterns
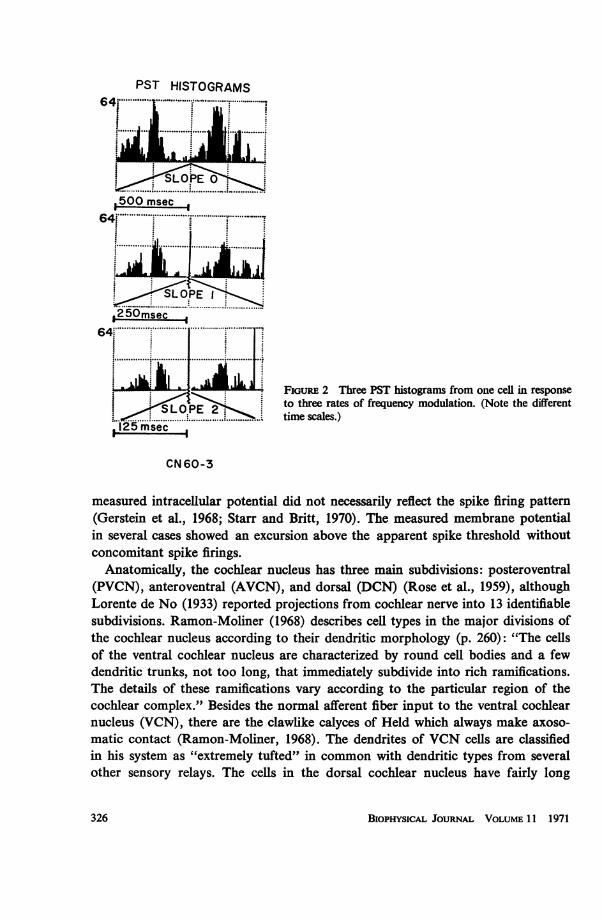
remained constant over a range of frequency modulation rates. Fig. 2 shows the
1 Fernald, R. D., and G. L. Gerstein. 1970. To be published.
BIOPHYSICAL JOURNAL VOLUME 11 1971324
PST HISTOGRAMS
................. .... ...... .......... 21.0kHzILL.AhlMIhiIIIE.LL... + 16%
64 CN53-7
10.5 kHz L I 83F,A+ 40% /
64.. CN 58-5
............. .. ....................... ................. 5.2 kHz
0ldlili j IizJh+±78%O 1.0 sec
SLOPE O............. ............................... ................
FIGURE 1 PST histograms of firing patterns for three different neurons in the cat cochlearnucleus in response to frequency modulated tones. The three classes of symmetry withrespect to the instant at which the lowest frequency is presented are: top, mirror sym-metry (number of stimuli = 29); middle, translation symmetry (S = 28); and bottom,asymmetry (S = 31).
firing patterns for a neuron in the cochlear nucleus under stimulation at three dif-ferent frequency modulation rates. To facilitate comparison, the spike firing histo-grams are compiled only during the times when the stimulus frequencies are chang-ing (note time scales). The stimuli in these experiments were tones modulated bytrapezoidal wave forms to allow various rates of change of frequency independentof the stimulus repetition rate (see Erulkar et al., 1968, Figs. 4 and 5).The important feature of these three histograms is their common shape. Al-
though the change of stimulus frequency with respect to time (df/dt) increasesthreefold, the firing patterns remain invariant. This shape invariance as a functionof df/dt has been found in all neurons studied in cochlear nucleus (Erulkar et al.,1968). Thus, these neurons have a response pattern which is not sensitive to changesin the magnitude df/dt except through trivial compression along the time axis.A third result of experimental studies of cochlear nucleus neurons was that the
R. D. FERNALD Neuron Model with Spatially Distributed Synaptic Input 325
PST HISTOGRAMS
1A eLiinJinLS ...L FIGURE 2 Three PST histograms from one cell in responseS...../Lpb .. . .........tothree rates of frequency modulation. (Note the different
................ ............... tim e scales.)_125 msec I1
CN 60-3
measured intracellular potential did not necessarily reflect the spike firing pattern(Gerstein et al., 1968; Starr and Britt, 1970). The measured membrane potentialin several cases showed an excursion above the apparent spike threshold withoutconcomitant spike firings.
Anatomically, the cochlear nucleus has three main subdivisions: posteroventral(PVCN), anteroventral (AVCN), and dorsal (DCN) (Rose et al., 1959), althoughLorente de No (1933) reported projections from cochlear nerve into 13 identifiablesubdivisions. Ramon-Moliner (1968) describes cell types in the major divisions ofthe cochlear nucleus according to their dendritic morphology (p. 260): "The cellsof the ventral cochlear nucleus are characterized by round cell bodies and a fewdendritic trunks, not too long, that immediately subdivide into rich ramifications.The details of these ramifications vary according to the particular region of thecochlear complex." Besides the normal afferent fiber input to the ventral cochlearnucleus (VCN), there are the clawlike calyces of Held which always make axoso-matic contact (Ramon-Moliner, 1968). The dendrites of VCN cells are classifiedin his system as "extremely tufted" in common with dendritic types from severalother sensory relays. The cells in the dorsal cochlear nucleus have fairly long
BIOPHYsIcAL JouRNAL VOLUME 11 1971326
"wavy" dendrites with a bipolar orientation (Ramon-Moliner, 1968). This phylo-genetically more recent portion of the cochlear nucleus also appears to have sub-stantially different response properties (Molnar and Pfeiffer, 1968). Thus for cellsin the cochlear nucleus the dendritic structure can be expected to be an importantfactor in determining the responses of the neuron.
PREVIOUS MODELS OF DENDRITIC TREES
Rail (1961, 1962, 1964) has presented a general model for dendritic trees consistingof a series of discrete compartments. Spatial nonuniformity is represented by dif-ferences between compartments. Using differential equations to describe the cellmembrane in each compartment, Rall has applied the model to a variety of situa-tions. One application of particular interest here is the effect of different spatio-temporal input sequences on transient soma depolarization. Using a 10-compart-ment model in which the first compartment represented the soma, and the secondthrough tenth compartments, successively more remote dendritic surfaces, Rallexamined two excitatory input pulse sequences (Rail, 1964, Fig. 7): one movingtoward the soma and one moving away from the soma. The differences in somapotential are striking. Sweeping toward the soma results in a large potential witha long latency and rapid decay time. Sweeping away from the soma, on the otherhand, gives a more rapid rise to a lower level which has a slower decay. The effectof distributing the same excitation uniformly over the same compartments at asingle time gives an intermediate effect. Clearly, depending on the threshold andstate of excitation in the soma, the spike firings of the cell could be quite differentfor the two cases. In his work, however, Rail has considered only subthresholdbehavior. The ways such subthreshold phenomena might influence spike firings havenot been modeled in any detail.
In the cochlear nucleus various electrophysiological findings may in generalbe explained by a distribution of synaptic input over the surface of the neuronbeing studied (Erulkar et al., 1968; Gerstein et al., 1968; Starr and Britt, 1970).Anatomical descriptions support the idea that some cells in the cochlear nucleushave a large dendritic surface area (Ramon-Moliner, 1962, 1968). To attempt asystematic explanation of the potential role of dendritic inputs to cells in the cochlearnucleus, the following model was assembled.
THE MODEL
Simulation ofa Membrane Patch
To simulate a distributed denditic surface coupled to an active, spike-initiating somaticsurface, I have used nonlinear analogue circuits developed by E. R. Lewis (1964, 1965, 1968).The two-terminal electronic circuit is designed to represent a patch of nerve cell membrane1 cm2 in area. Two realizations have been used: one to simulate active or electrically excit-able membrane (spike initiator patch), the second to simulate passive, subthreshold mem-brane (subthreshold patch). The circuit for subthreshold events is valid for the graded be-
R. D. FERNALD Neuron Model with Spatially Distributed Synaptic Input 327
havior of EPSP (excitatory postsynaptic potential) and IPSP (inhibitory postsynapticpotential) synaptic input, but is incapable of large excursions of membrane potential suchas spikes.
Between the two terminals of each circuit are six parallel networks. Four are approxi-mate realizations of the elements specified by Hodgkin and Huxley: membrane capacitance,leakage current, sodium current, and potassium current. Two are approximate realizationsof synaptic conductances: inhibitory and excitatory.The electrical properties of the circuits are quite similar to those measured in physio-
logical preparations. The spike is clipped at 0 v, but otherwise exhibits a time course quitesimilar to spikes physiologically observed (Fernald, 1967, 1968). There is a threshold, absoluteand relative refractory periods, and a postspike hyperpolarization.
Simulation ofSynaptic Input
Since these models are two terminal networks, the input and output terminals are equiva-lent. Synaptic currents require the presence of a chemical transmitter substance which ispresumed independent of the intracellular potential. Thus simulation of a synaptic currentrequires a third terminal which allows independent input of simulated transmitter substance.Two such terminals are provided in the models; one for excitatory synaptic inputs and onefor inhibitory synaptic inputs.The inhibitory synaptic circuit produces a hyperpolarizing current proportional to input
voltage and approaches zero as the simulated membrane potential approaches -8 v (corre-sponding to -80 mv in a nerve cell). The inhibitory synaptic current is unable to hyperpolar-ize the simulated membrane potential beyond this level. This is in general agreement withfindings in nerve cells.The excitatory synaptic input similarly produces a depolarizing current proportional to
input voltage which approaches zero as the membrane potential approaches zero. In neurons,the excitatory synapse is usually considered to change transiently the local permeability ofthe postsynaptic membrane to all ions. Thus the nerve synapse becomes ineffective when thepostsynaptic membrane potential reaches the equilibrium potential of 0 mv. In most casesthe range of interesting behavior for the membrane potential is below the threshold of spikeinitiation (about -50 mv). Once the threshold has been exceeded, regenerative permeabilitychanges and initiation of an action potential occur, so that EPSP activity is of little conse-quence until the firing is completed. For these reasons the excitatory synaptic circuit is anadequate model for this work.
Since it is assumed that synaptic activity reflects local conductance changes, the size andhence the effectiveness of any PSP depends on the local PSP. For small excursions of themembrane potential, however, local conductance changes can be closely approximated bymembrane potential changes as in the model presented here.
Assemblies of Circuits
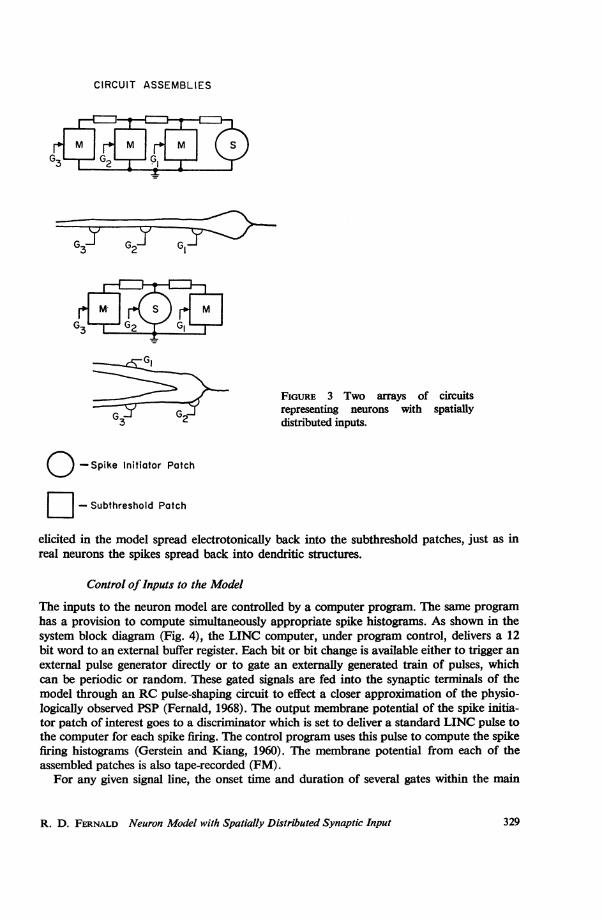
Several circuits can be used to represent a single neuron by appropriately connecting theirintracellular nodes (Fig. 3). The nodes representing the outside of the membrane patchesare connected together since the extracellular fluid impedance is assumed negligible comparedto the intracellular fluid impedance. Such an assembly approximates a spatial distributionof nerve cell membrane in a manner analogous to the compartment array of Rall (1964).A salient difference, however, is the connection of patches capable of graded subthresholdresponse to "active" patches which can initiate classic action potentials (spikes). Spikes
BIOPHYSICAL JOURNAL VOLUME 11 1971328
CIRCUIT ASSEMBLIES
Y GCY
G3 G Q G
-G
FIGURE 3 Two arrays of circuits
G G representing neurons with spatially2 distributed inputs.
O -Spike Initiator Patch
- Subthreshold Patch
elicited in the model spread electrotonically back into the subthreshold patches, just as inreal neurons the spikes spread back into dendritic structures.
Control of Inputs to the Model
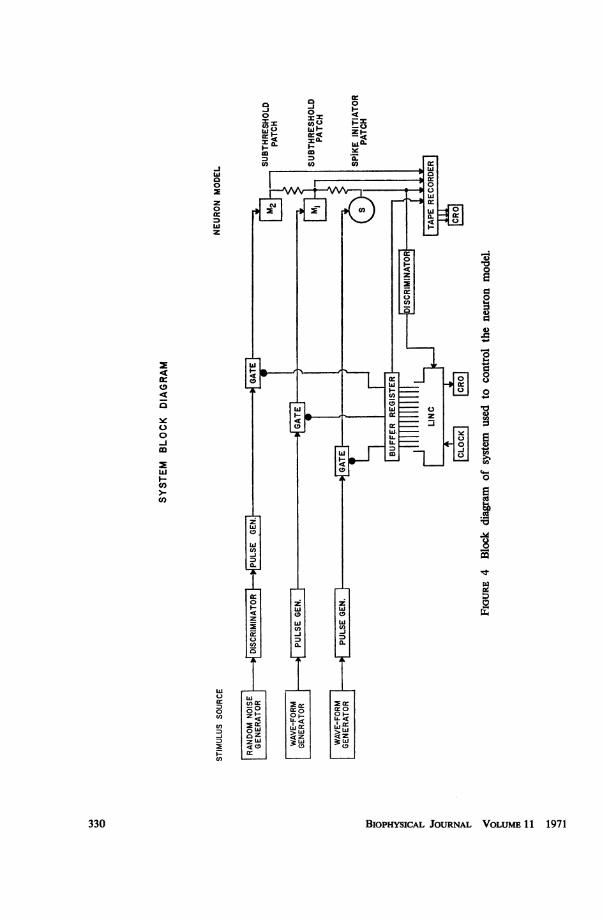
The inputs to the neuron model are controlled by a computer program. The same programhas a provision to compute simultaneously appropriate spike histograms. As shown in thesystem block diagram (Fig. 4), the LINC computer, under program control, delivers a 12bit word to an external buffer register. Each bit or bit change is available either to trigger anexternal pulse generator directly or to gate an externally generated train of pulses, whichcan be periodic or random. These gated signals are fed into the synaptic terminals of themodel through an RC pulse-shaping circuit to effect a closer approximation of the physio-logically observed PSP (Fernald, 1968). The output membrane potential of the spike initia-tor patch of interest goes to a discriminator which is set to deliver a standard LINC pulse tothe computer for each spike firing. The control program uses this pulse to compute the spikefiring histograms (Gerstein and Kiang, 1960). The membrane potential from each of theassembled patches is also tape-recorded (FM).
For any given signal line, the onset time and duration of several gates within the main
R. D. FERNALD Neuron Model with Spatially Distributed Synaptic Input 329
a 9i 0
-J 0.-
oo41o E El
ILLw.
U)
C
0
0
w
cn0ci)
C/)
Cf)
BIOPHYSICAL JOURNAL VOLUME 11 1971
lr
IC
0
-jco
w
I--C')
C,)
A9
00
a
*a
0
0*-
0
0
0)
0
C'sU
8
'U
x0
330
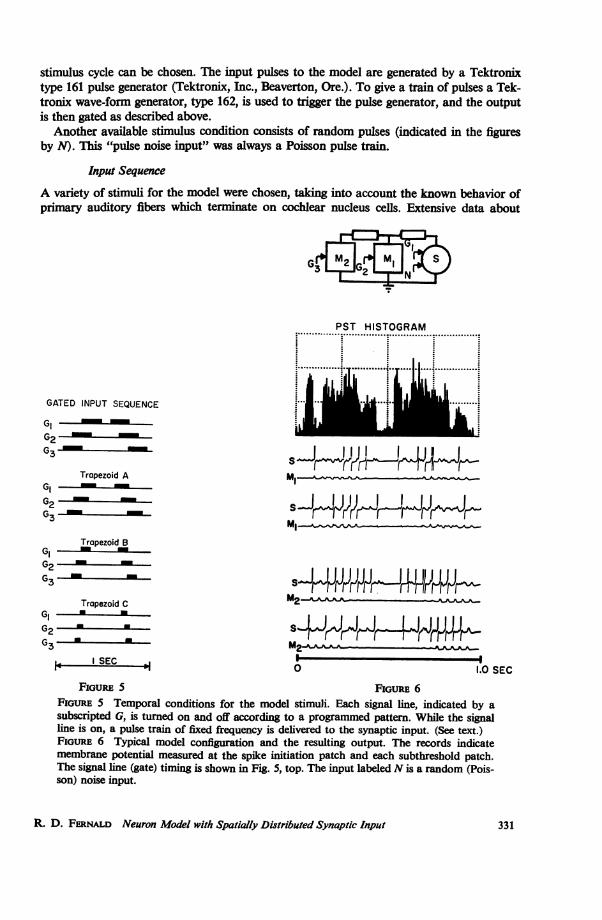
stimulus cycle can be chosen. The input pulses to the model are generated by a Tektronixtype 161 pulse generator (Tektronix, Inc., Beaverton, Ore.). To give a train of pulses a Tek-tronix wave-form generator, type 162, is used to trigger the pulse generator, and the outputis then gated as described above.
Another available stimulus condition consists of random pulses (indicated in the figuresby N). This "pulse noise input" was always a Poisson pulse train.
Input Sequence
A variety of stimuli for the model were chosen, taking into account the known behavior ofprimary auditory fibers which terminate on cochlear nucleus cells. Extensive data about
GATED INPUT SEQUENCE
G2G3
Trapezoid A
G2 - -
G3 - -
Trapezoid B
G2 -_
G3-
PST HISTOGRAM............................................ .............
* iI
ii. ........... ......r...
. I... . ..'~ ~ ~~~~~~T...r ' ............
ml -
M,-
a~PLJJLLJILM1 1 F1 flrrFFrF-
Trapezoid CG -'
G2 _--
_G3
L.4 I SEC
4¾4w 4W
,S -A
0 1.0 SECFiGuRE 5 FIGURE 6
FIGURE 5 Temporal conditions for the model stimuli. Each signal line, indicated by asubscripted G, is turned on and off according to a programmed pattern. While the signalline is on, a pulse train of fixed frequency is delivered to the synaptic input. (See text.)FiouRE 6 Typical model configuration and the resulting output. The records indicatemembrane potential measured at the spike initiation patch and each subthreshold patch.The signal line (gate) timing is shown in Fig. 5, top. The input labeled N is a random (Pois-son) noise input.
R. D. FERNALD Neuron Model with Spatially Distributed Synaptic Input
MIL a
Ii
331
primary auditory fiber spike trains have been accumulated by Kiang (1965), Rose et al.(1967), and Hind et al. (1967). Since primary auditory fibers provide input spike trains toneurons of the cochlear nucleus, the properties of the input to the simulated cochlear nucleuscells are determined.
For example, the spontaneous activity of auditory fibers has been reported as Poisson incharacter. Hence the "noise" input to the model may safely be taken as a Poisson process.
For simulating actual auditory stimulation, the gate duration in the model serves to de-fine the length of time during an auditory stimulus that a primary fiber is firing, while thepulse train which is gated approximates the actual primary fiber output. The gate lengthdepends on both the neuron's response area for a given intensity and the auditory stimulusbeing simulated. Thus, for a tone burst which lies within the response area of a primaryfiber, the gate duration lasts the length of the tone burst. For frequency modulation, how-ever, the stimulus "moves through" the response area of the cell and hence the gate shouldbe on during two portions of the stimulus cycle: once as the frequency moves up through theresponse area, and once as it moves down through the response area. The gate durationdepends on both the modeled response area at the given intensity, and the rate of frequencymodulation.
Fig. 5 shows a gating sequence which is appropriate for simulating four rates of frequencymodulation. As the rate of modulation increases (shown from top to bottom in the figure),the input gate duration is proportionately decreased. This particular set of stimulus gatesapplies for the examples presented in the following figures where another stimulus set is notshown.
Operation of the Model
The model implicitly has a large number of parameters and hence a still larger number ofparameter combinations, each yielding a unique model configuration. One aim of the studywas to delimit experimentally this parameter space in order to find the range of values ofparameters with which the model best described the observed behavior. The obvious methodfor working through an experimental problem of this type is to vary systematically a singleparameter, holding the remaining parameters constant. Parameters that were varied in thisstudy included simulated cell shape (unipolar, bipolar, etc.), simulated cell size, number andlocation of synaptic terminations, and the type of input pulse trains.A single experiment consists of the presentation of 250 stimulus cycles with routine col-
lection of the interval and PST histograms. A stimulus cycle of 1 sec was chosen to coincidewith cat cochlear nucleus experiments (the model simulates real time). Fig. 6 indicates atypical spatial configuration, a PST histogram, and membrane potential records. Resultsreported here are selected from more than 500 such experiments.
RESULTS AND DISCUSSION
The results are presented in four sections. The first deals with the reproducibilityand sensitivity of the model system, the second section with the relationship be-tween the membrane potential and the spike firing pattern for various spatialarrays of the model neuron, the third with the details of modeling the three firingpattern symmetries found in cochlear nucleus neurons, and the fourth with model-ing of the constancy of the shape of firing patterns for different modulation rates.
BIoPHYsIcAL JouRNAL VOLUME 11 1971332
Reproducibility and General Properties
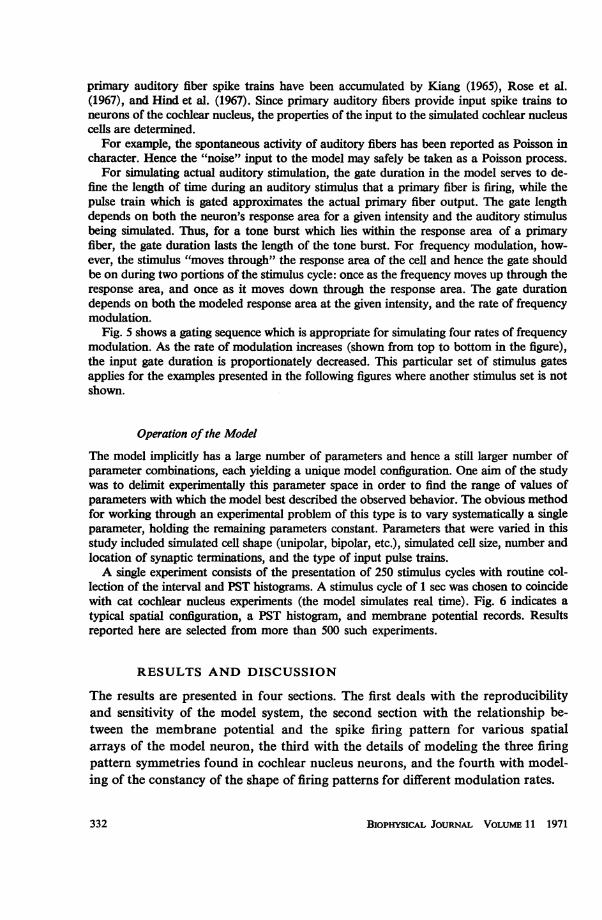
Since this simulation was done on analogue devices with digital control, the re-peatability or statistical stationarity of the results is important. Stationarity isparticularly important since statistical measurements (interval and PST histograms)are used to characterize and assess the behavior of the model. Any drift in parametervalues cannot be properly treated. To test the stationarity of the model, identicalexperiments were performed during the study with the interval between pairs ofexperiments varying from hours to months. The comparison of spike firing histo-grams produced by the experiments consistently showed little or no difference(Fernald, 1968).The general sensitivity of this distributed model to spatiotemporal summation
is shown in Fig. 7. The difference between the two cases of Fig. 7 is the sequenceof simulated primary fiber center frequencies arrayed along the modeled dendrite.The model cell E-86 has the synapse from its input cell with the highest stimulusfrequency most distant from the spike initiator, while the model cell E-90 is theopposite case. There are clear differences between the two cases. First, E-86, withthe high frequency input most distant, has approximately 18% more spike firingsthan E-90. Furthermore, this increase in number of spikes is disproportionatelydistributed, with more going to the stimulus half-cycle corresponding to the spatio-temporal sweep toward the spike initiator patch. This suggests that the effects ofhigher excitation at a distance are distributed unequally due to the spatial and tem-poral summation of the stimulus (in Fig. 7 the values offi and f3 differ by 37%).In both case it is important to remember that the same net amount of excitation isdelivered to the model cell during each half of the stimulus cycle. The difference in
PST HISTOGRAMS
64 - .. . 64.... ... ............
GI GI IG21 I G21 aG3 N G3 N
G G G G3 GIf f ffi2 f3 f 2f,I
E-86 E-90
f, 'f2> f3FIouREu 7 A comparison of PST histograms produced by two related simulations. In eachcase the same stimulus and circuit arrays were used. The gated stimulus pulse frequenciesin the two cases are different, however. As illustrated schematically, the frequency of theinputs to M1 and M8 are switched between the two cases, synaptic strength remainingconstant.
R. D. FERNALD Neuron Model with Spatially Distributed Synaptic Input 333
number of firings and firing pattern between the two halves is entirely a function ofthe spatial distribution of the inputs. The relative importance of a synaptic inputas a function of distance depends greatly on intensity and timing with which it isactivated relative to other synaptic inputs on that dendritic branch. It is influencedto a lesser extent by activity on other dendritic branches (cf. Fig. 9 and Fernald,1968).
Explicit Simulation of Cochlear Nucleus Data
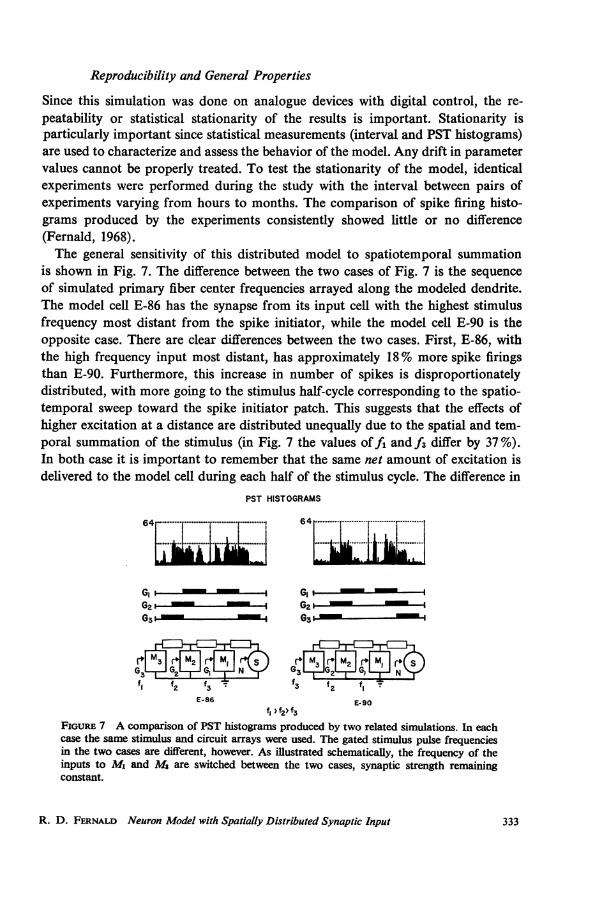
Membrane Potential. Experimental work in cochlear nucleus neurons(Gerstein et al., 1968; Starr and Britt, 1970) and elsewhere (Spencer and Kandel,1961) has suggested that the potential measured by the microelectrode in some casesis not simply correlated with generation of spikes. A proposed explanation for suchobservations is that the electrode is at a point distant from the site of spike initiation,and, at a given moment, that the cell interior is not isopotential. This explanationhas been examined with the use of the model, by recording the simulated membranepotential simultaneously at several sites under various stimulus conditions.
32...'~'v.**Ee32 I2.
.................... j-..'
Gi G~~~~IGjG2_ G2, -
G3 I G31 - - g
32.j. i .. 32 l
....................... ...... . ................. ..
........... .
.. ....... .....
........................... s ... ......W ........................... .................
G3i - I - --
G2 -- G21 ----- I
G3 l-- G'31 I
0 1.0 SEC
FIGURE 8 PST histograms and averaged membrane potential for a simulation array.The simulation has two inhibitory inputs (indicated by open arrowheads): a gated inputto the subthreshold patch M2, and a noise input to subthreshold M1. The remaining in-puts are excitatory (indicated by filled arrowheads). The averaged membrane potentialmeasured at the subthreshold patch Ml is shown below each PST histogram.
BIOPHYSICAL JOURNAL VOLUME 11 1971334
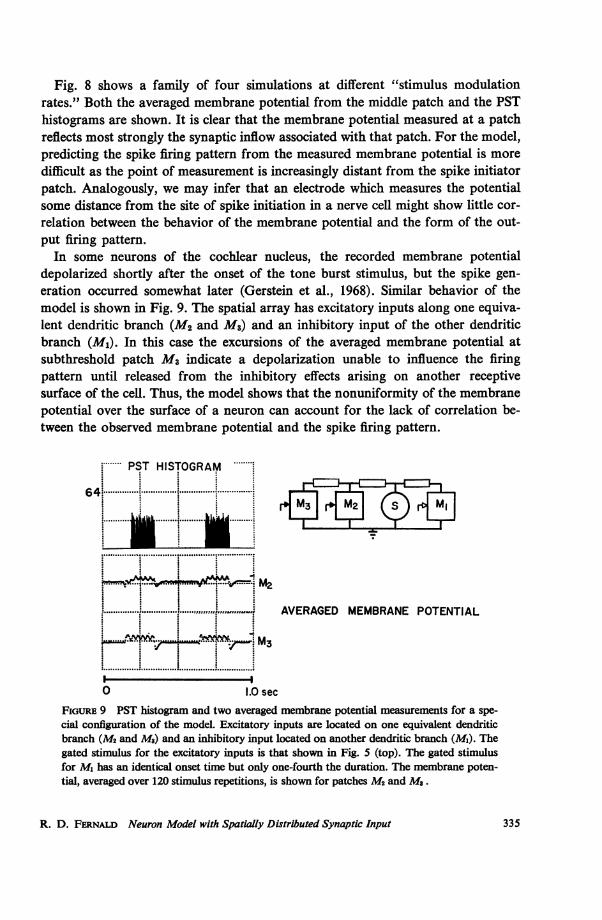
Fig. 8 shows a family of four simulations at different "stimulus modulationrates." Both the averaged membrane potential from the middle patch and the PSThistograms are shown. It is clear that the membrane potential measured at a patchreflects most strongly the synaptic inflow associated with that patch. For the model,predicting the spike firing pattern from the measured membrane potential is moredifficult as the point of measurement is increasingly distant from the spike initiatorpatch. Analogously, we may infer that an electrode which measures the potentialsome distance from the site of spike initiation in a nerve cell might show little cor-relation between the behavior of the membrane potential and the form of the out-put firing pattern.
In some neurons of the cochlear nucleus, the recorded membrane potentialdepolarized shortly after the onset of the tone burst stimulus, but the spike gen-eration occurred somewhat later (Gerstein et al., 1968). Similar behavior of themodel is shown in Fig. 9. The spatial array has excitatory inputs along one equiva-lent dendritic branch (M2 and M3) and an inhibitory input of the other dendriticbranch (M1). In this case the excursions of the averaged membrane potential atsubthreshold patch M3 indicate a depolarization unable to influence the firingpattern until released from the inhibitory effects arising on another receptivesurface of the cell. Thus, the model shows that the nonuniformity of the membranepotential over the surface of a neuron can account for the lack of correlation be-tween the observed membrane potential and the spike firing pattern.
PST HISTOGRAM
64 . . ........ . . .
.......... . . ..........
L __................................
..............................
5 . .-i
AVERAGED MEMBRANE POTENTIAL
I I0 1.0 sec
FIGURE 9 PST histogram and two averaged membrane potential measurements for a spe-cial configuration of the model. Excitatory inputs are located on one equivalent dendriticbranch (Mi and Ms) and an inhibitory input located on another dendritic branch (M1). Thegated stimulus for the excitatory inputs is that shown in Fig. 5 (top). The gated stimulusfor Ml has an identical onset time but only one-fourth the duration. The membrane poten-tial, averaged over 120 stimulus repetitions, is shown for patches M2 and Ms.
R. D. FERNALD Neuron Model with Spatially Distributed Synaptic Input 335
M3
Firing Pattern Symmetries
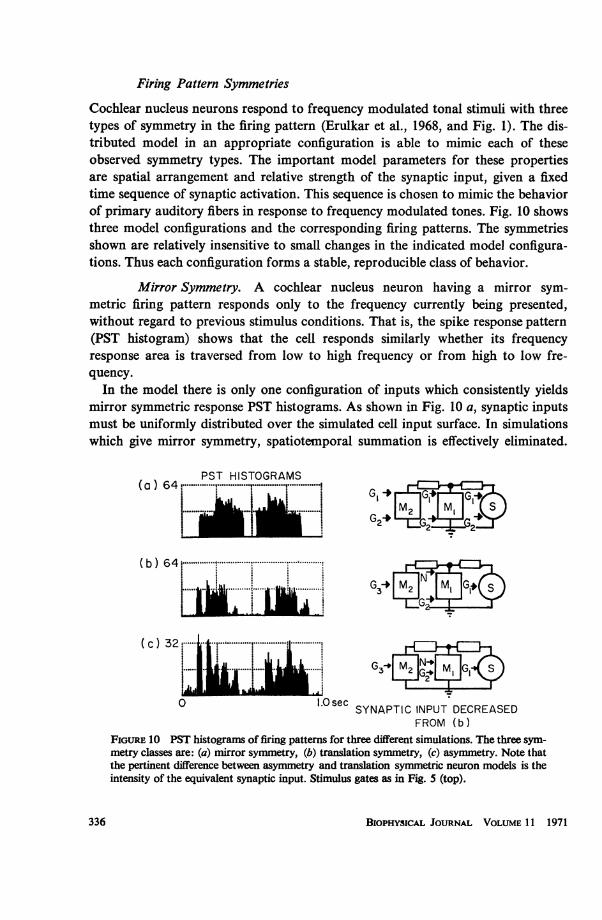
Cochlear nucleus neurons respond to frequency modulated tonal stimuli with threetypes of symmetry in the firing pattern (Erulkar et al., 1968, and Fig. 1). The dis-tributed model in an appropriate configuration is able to mimic each of theseobserved symmetry types. The important model parameters for these propertiesare spatial arrangement and relative strength of the synaptic input, given a fixedtime sequence of synaptic activation. This sequence is chosen to mimic the behaviorof primary auditory fibers in response to frequency modulated tones. Fig. 10 showsthree model configurations and the corresponding firing patterns. The symmetriesshown are relatively insensitive to small changes in the indicated model configura-tions. Thus each configuration forms a stable, reproducible class of behavior.
Mirror Symmetry. A cochlear nucleus neuron having a mirror sym-metric firing pattern responds only to the frequency currently being presented,without regard to previous stimulus conditions. That is, the spike response pattern(PST histogram) shows that the cell responds similarly whether its frequencyresponse area is traversed from low to high frequency or from high to low fre-quency.
In the model there is only one configuration of inputs which consistently yieldsmirror symmetric response PST histograms. As shown in Fig. 10 a, synaptic inputsmust be uniformly distributed over the simulated cell input surface. In simulationswhich give mirror symmetry, spatiotemporal summation is effectively eliminated.
PST HISTOGRAMS(a) 64r ........ r. . .......... . . ....... . ..
(b) 64.;
......... .. ....... G3 m
(c) 32 ...... .
..... .....i.M G3M
0 1~~~~~~.OsecSYNAPTIC INPUT DECREASED
FROM (b)FIGURE 10 PST histograms of firing patterns for three different simulations. The three sym-metry classes are: (a) mirror symmetry, (b) translation symmetry, (c) asymmetry. Note thatthe pertinent difference between asymmetry and translation symmetric neuron models is theintensity of the equivalent synaptic input. Stimulus gates as in Fig. 5 (top).
BIOPHYSICAL JOURNAL VOLUME 11 1971336
That is, the synaptic inputs drive the membrane potential uniformly over the wholecell.
This result suggests that cells which produce mirror symmetric firing patternsmay receive input fibers uniformly over their surface. Neurons with mirror sym-metric firing patterns may be simple follower cells (or relay cells as described byPfeiffer, 1966) which faithfully respond to the stimulus of the moment.
Asymmetry. A cochlear nucleus cell with an asymmetric firing patternresponds to frequency as well as direction and rate of change of frequency. Of thesethree stimulus properties, an asymmetric cell can detect2 only the direction ofchange of frequency. It is important to note that the firing pattern of such a neuronconstitutes a "recoding" of the information as it passes through the cochlear nucleus.Information about the the direction and rate of change of frequency are in thespike firing pattern, but changed from the way that they appeared in the stimulus.As shown previously in Fig. 7, asymmetric firing patterns in the model arise as
a consequence of spatiotemporal summation of synaptic inputs over a distributeddendritic surface area. For the firing patterns in Figs. 7 and 10 c, the synapticinputs are sequentially arrayed along a single equivalent dendritic branch. Thestimulus sequence moves towards the spike initiator over one half-cycle and re-verses that direction over the second half of the stimulus cycle.
Translation Symmetry. A cochlear nucleus neuron having a translationsymmetric firing pattern responds when the stimulus frequency is within the neuron'sresponse area. The firing pattern gives no indication of detailed frequency or ofdirection of frequency change. This information is not available to higher neuronssince details of the order of frequency presentation do not exist in the firing pat-tern.
In the model, a range of spatial arrays can produce translation symmetric firingpatterns if the intensity of the synaptic input is made sufficiently strong. In thiscase the simulated cell shows an "onset sensitivity" or exaggerated response to thebeginning of the stimulus. This configuration of the model is shown in Figure10 b. The change in symmetry of firing pattern between Figs. 10 b and 10 c corre-sponds only to a change in synaptic input strength. In Fig. 10 b, subthresholdinteractions and spatiotemporal summation at the spike initiator patch are notimportant in determining the firing pattern.
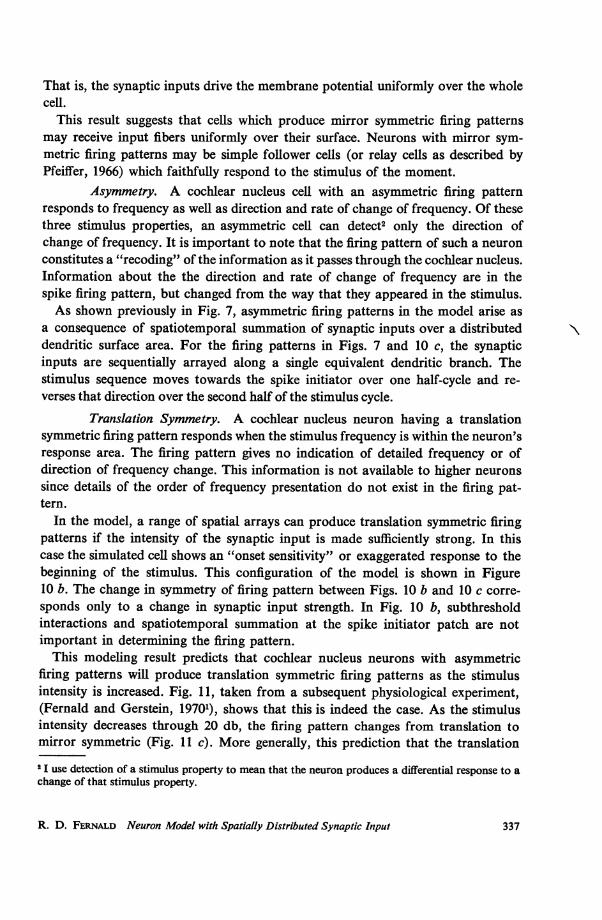
This modeling result predicts that cochlear nucleus neurons with asymmetricfiring patterns will produce translation symmetric firing patterns as the stimulusintensity is increased. Fig. 11, taken from a subsequent physiological experiment,(Fernald and Gerstein, 19701), shows that this is indeed the case. As the stimulusintensity decreases through 20 db, the firing pattern changes from translation tomirror symmetric (Fig. 11 c). More generally, this prediction that the translation2 Iuse detection of a stimulus property to mean that the neuron produces a differential response to achange of that stimulus property.
R. D. FERNALD Neuron Model with Spatially Distributed Synaptic Input 337
FREQUENCY MODULATIONPST HISTOGRAMS
(a) 2r3.F:i'...
15 db
(b)2,5. .... ................................................
25 db
(C) 3.2: ... S-. ........ FIGURE 11 PST histograms from asingle cochlear nucleus neuron com-
i......... .*-****-*-s¢ ' >piled for frequency modulated stimuli35UdbU| 1 * . at three different intensities. (a) most
15 kHz .......n....... mtense stimulus, S = 28; (b) inter-I mediate, S = 25; (c) least intense,.3kHZ~: 5 =20................................................................
0 LO sec
symmetric firing pattern arises from high stimulus intensity might explain therelatively few cases of translation symmetry reported (Erulkar et al., 1968; Fernaldand Gerstein, 19701). A more thorough study of firing pattern as a function ofstimulus intensity has confirmed the model prediction (Fernald and Gerstein, 19701).
Shape Constancy
In the cochlear nucleus experiments the responses of a single cell to frequencymodulated tones were computed for each member of a family of trapezoidal modu-lation wave forms. For these frequency modulation rates, the spike response pat-tern shape and symmetry remained constant with a corresponding change intime scale.
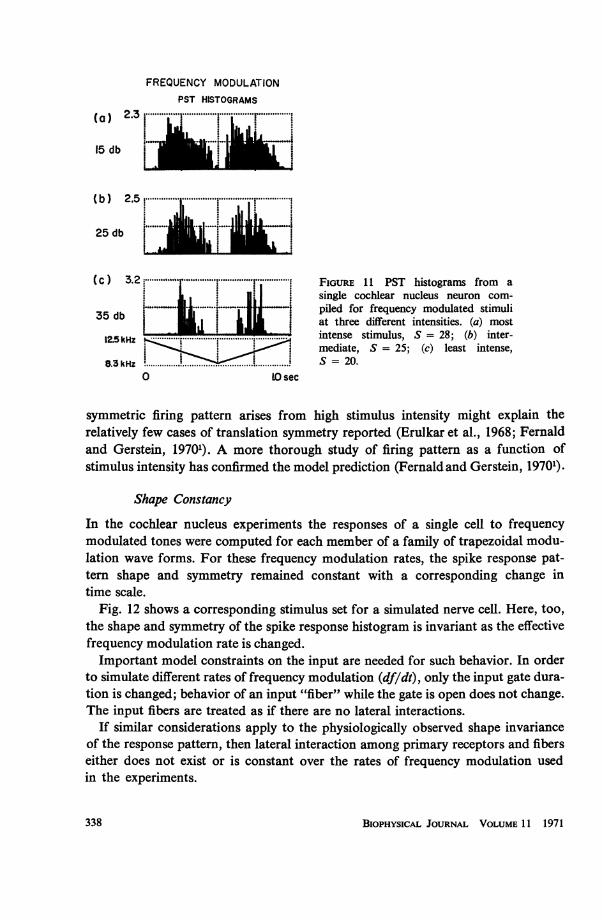
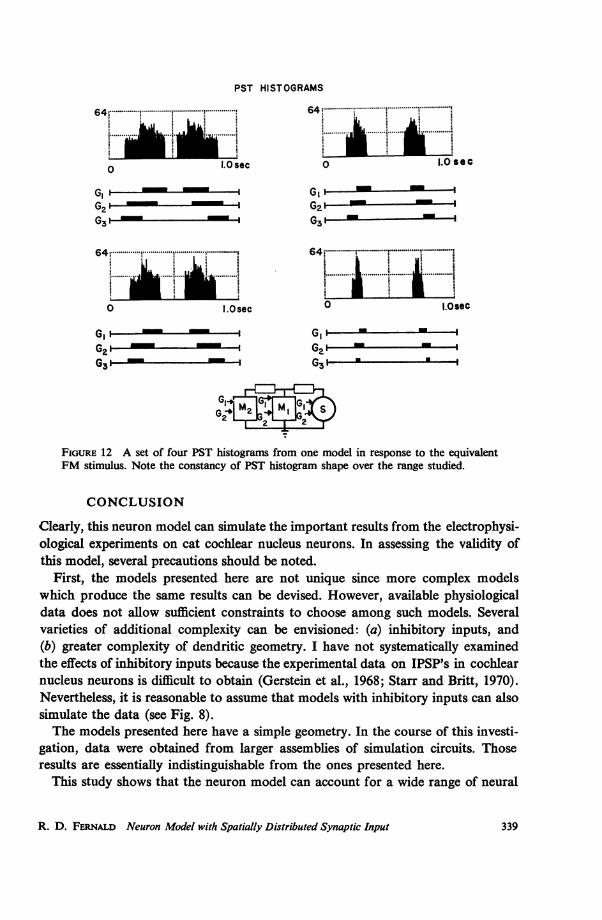
Fig. 12 shows a corresponding stimulus set for a simulated nerve cell. Here, too,the shape and symmetry of the spike response histogram is invariant as the effectivefrequency modulation rate is changed.Important model constraints on the input are needed for such behavior. In order
to simulate different rates of frequency modulation (df/dt), only the input gate dura-tion is changed; behavior of an input "fiber" while the gate is open does not change.The input fibers are treated as if there are no lateral interactions.
If similar considerations apply to the physiologically observed shape invarianceof the response pattern, then lateral interaction among primary receptors and fiberseither does not exist or is constant over the rates of frequency modulation usedin the experiments.
BIOPHYSICAL JOURNAL VOLUME 11 1971338
PST HISTOGRAMS
. . . . -. . 64 . .............. ............... ..............-.-.......
o 10sec 0 l.osec
GI GI I- 1
G32 G31 - - I
64: .~ 164r. t:.0Osec O J.Osec
GI - G2I I
-GI G
G
FIGURE 12 A set of four PST histograms from one model in response to the equivalentFM stimulus. Note the constancy of PST histogram shape over the range studied.
CONCLUSION
Clearly, this neuron model can simulate the important results from the electrophysi-ological experiments on cat cochlear nucleus neurons. In assessing the validity ofthis model, several precautions should be noted.
First, the models presented here are not unique since more complex modelswhich produce the same results can be devised. However, available physiologicaldata does not allow sufficient constraints to choose among such models. Severalvarieties of additional complexity can be envisioned: (a) inhibitory inputs, and(b) greater complexity of dendritic geometry. I have not systematically examinedthe effects of inhibitory inputs because the experimental data on IPSP's in cochlearnucleus neurons is difficult to obtain (Gerstein et al., 1968; Starr and Britt, 1970).Nevertheless, it is reasonable to assume that models with inhibitory inputs can alsosimulate the data (see Fig. 8).The models presented here have a simple geometry. In the course of this investi-
gation, data were obtained from larger assemblies of simulation circuits. Thoseresults are essentially indistinguishable from the ones presented here.
This study shows that the neuron model can account for a wide range of neural
R. D. FERNALD Neuron Model with Spatially Distributed Synaptic Input 339
behavior by virtue of its distributed receptive surface. This suggests that in thephysiological system, the synaptic contacts over the dendritic surface area couldplay an important role in determining single neuron behavior. Spatially arrayedsynaptic inputs might generally be important in sensory systems which show a dif-ferential response to the direction of change of a dynamic stimulus. The effects ofdistributed synaptic inputs result directly in such a differential response and mightexplain similar responses measured for example, in the visual system.
I thank George Gerstein for his helpful comments and discussion throughout the course of the studyand during the preparation of the manuscript.I am extremely grateful to E. R. Lewis for providing the neural patch circuits.I thank S. Freeman for typing the manuscript and B. Fore for his photographic work.
This study was supported by N.I.H. grants 2-tOl-GM-00606 and NB-05606
Receivedfor publication 29 July 1970 and in revisedform 15 December 1970.
REFERENCES
ERULKAR, S. D., R. A. BUTLER, and G. L. GERSTEIN. 1968. J. Neurophysiol. 31:537.FERNALD, R. D. 1967. Proceedings of 20th Conference on Engineering in Medicine and Biology,
Boston.FERNALD, R. D. 1968. Cat cochlear nucleus neurons: a distributed model and some experimental
observations. Ph.D. Dissertation. University of Pennsylvania, Philadelphia.GERSTEIN, G. L., and N. Y-S. KIANG. 1960. Biophys. J. 1:15.GERSTEIN, G. L., R. A. BUTLER, and S. D. ERULKAR. 1968. J. Neurophysiol. 31:526.HIND, J. E., D. J. ANDERSON, J. F. BRUGGE, and J. E. RoSE. 1967. J. Neurophysiol. 30:794.KIANG, N. Y-S. 1965. Discharge Patterns of Single Fibers in the Cat's Auditory Nerve. The M.I.T.
Press, Cambridge, Mass.LEWIS, E. R. 1964. In Neural Theory and Modelling. R. F. Reiss, editor. Stanford University Press,
Stanford, Calif. 154-189.LEWIS, E. R. 1965. J. Theor. Biol. 10:125.LEWiS, E. R. 1968. Proc. I.E.E.E. (Inst. Elec. Electron Eng.). 56:931.LORENTE DE N6., R. 1933. Laryngoscope. 43:1.MOLNAR, C. E., and R. R. PFEFFER. 1968. Proc. l.E.E.E. (Inst. Elec. Electron Eng.). 56:993.PFEIFFER, R. R. 1966. Exp. Brain Res. 1:220.RALL, W. 1961/1962. Ann. N. Y. Acad. Sci. 96:1071.RALL, W. 1964. In Neural Theory and Modelling. R. F. Reiss, editor. Stanford University Press,
Stanford, Calif. 73-97.RALL, W., T. G. SMITH, K. FRANK, R. E. BURKE, and P. G. NELSON. 1967. J. Neurophysiol. 30:1169.RAMON-MOLINER, E. 1962. J. Comp. Neurol. 119:211.RAMoN-MOLINER, E. 1968. In The Structure and Function of Nervous Tissue. G. H. Bourne, editor.Academic Press Inc., New York. 1:205-264.
RoSE, J. E., R. GALAMBOS, and J. R. HUGHES. 1959. Bull. Johns Hopkins Hosp. 104:211.ROSE, J. E., J. F. BRUGGE, D. J. ANDERSON, and J. E. HINm. 1967. J. Neurophysiol. 30:769.SPENCER, W. A., and E. R. KANDEL. 1961. J. Neurophysiol. 24:272.STARR, A., and R. BRITT. 1970. J. Neurophysiol. 33:137.
340 BIOPHiYSICAL JOURNAL VOLUME 11 1971
Related Documents