A NATIONAL WASTE RESEARCH, DEVELOPMENT (R&D) AND INNOVATION ROADMAP FOR SOUTH AFRICA: PHASE 2 WASTE RDI ROADMAP The economic benefits of moving up the waste management hierarchy in South Africa: The value of resources lost through landfilling

Welcome message from author
This document is posted to help you gain knowledge. Please leave a comment to let me know what you think about it! Share it to your friends and learn new things together.
Transcript
A NATIONAL WASTE RESEARCH, DEVELOPMENT (R&D) AND
INNOVATION ROADMAP FOR SOUTH AFRICA:
PHASE 2 WASTE RDI ROADMAP
The economic benefits of moving up the waste management hierarchy
in South Africa: The value of resources lost through landfilling

A National Waste Innovation Programme for South Africa: Phase 2 Waste RDI Roadmap
ii | P a g e
Document to be referenced as:
Department of Science and Technology (2014). A National Waste R&D and Innovation Roadmap for
South Africa: Phase 2 Waste RDI Roadmap. The economic benefits of moving up the waste
management hierarchy in South Africa: The value of resources lost through landfilling. Department
of Science and Technology: Pretoria
Prepared by Anton Nahman and Linda Godfrey of the Council for Scientific and Industrial Research
(CSIR) on behalf of the Department of Science and Technology (DST).
DST/CSIR Waste R&D and Innovation Roadmap, Phase 2, Output 2.1
All documents are available online at http://www.wasteroadmap.co.za
Cover photographs courtesy of Linda Godfrey (CSIR)
Date: March 2014
©Department of Science and Technology

A National Waste Innovation Programme for South Africa: Phase 2 Waste RDI Roadmap
iii | P a g e
DOCUMENT INDEX
Reports as part of this project include:
Phase 2: Waste RDI Roadmap
REPORT NUMBER REPORT TITLE AUTHORS
CSIR/NRE/GES/ER/ 2014/0015/A
The economic benefits of moving up the waste management hierarchy in South Africa: The value of resources lost through landfilling
Nahman, A. and Godfrey, L.
Phase 1: Status Quo Assessment
REPORT NUMBER REPORT TITLE AUTHORS
CSIR/NRE/SUSET/ER/ 2012/0045/A
Phase 1 - HCD: Skills for an Innovative Waste Sector: Workshop Report (11-12 July 2012)
Lombard, R.K., Lombard, J., Godfrey, L. and Roman, H.
CSIR/NRE/PW/ER/ 2012/0052/A
Phase 1 - HCD: Current waste HCD initiatives in South Africa
Lombard, J., Lombard, R.K. Godfrey, L. and Roman, H.
CSIR/NRE/SUSET/ER/ 2012/0053/A
Phase 1 - HCD: Core waste management skills and implementation modalities
Lombard, J., Lombard, R.K., Godfrey, L. and Roman, H.
CSIR/NRE/SUSET/ER/ 2012/0063/A
Phase 1 - Institutional framework: Current and required institutional mechanisms to support waste innovation
Schoeman, C., Mapako, M., Kalan, S., Godfrey, L. and Roman, H.

A National Waste Innovation Programme for South Africa: Phase 2 Waste RDI Roadmap
iv | P a g e
Table of Contents
1 INTRODUCTION ............................................................................................................................. 1
1.1 Background ......................................................................................................................... 1
1.2 Benefits of moving up the waste hierarchy ....................................................................... 2
3 METHODOLOGY FOR ESTIMATING THE RESOURCE VALUE OF WASTE ........................................ 3
3.1 Quantity .............................................................................................................................. 4
3.2 Unit value ........................................................................................................................... 5
3.3 Waste streams .................................................................................................................... 7
4 INPUT DATA .................................................................................................................................. 8
4.1 Quantities ........................................................................................................................... 8
4.2 Unit values ........................................................................................................................ 10
4.3 Assumptions and limitations ............................................................................................ 11
5 RESULTS ...................................................................................................................................... 13
5.1 Resource value from increased recycling/recovery ......................................................... 13
5.2 Additional economic benefits .......................................................................................... 15
5.3 Unit benefits of recycling/recovery .................................................................................. 17
6 DISCUSSIONS .............................................................................................................................. 18
6.1 Benefits versus costs ........................................................................................................ 19
6.2 Sharing of cost and benefit .............................................................................................. 19
6.3 Adding value along the recycling value chain .................................................................. 20
7 CONCLUSIONS AND RECOMMENDATIONS................................................................................. 21
8 ACKNOWLEDGEMENTS ............................................................................................................... 21
9 REFERENCES ................................................................................................................................ 22
Annexure 1: Benefits of moving up the waste hierarchy
Annexure 2: Calculation of value per selected waste stream

A National Waste Innovation Programme for South Africa: Phase 2 Waste RDI Roadmap
v | P a g e
List of Figures
Figure 1: Waste hierarchy ................................................................................................................. 1
Figure 2: Simple schematic of the recycling value chain showing value addition at each point
along the chain ................................................................................................................... 6
Figure 3: Example of value addition along the value chain, the case of plastics ............................ 20
List of Tables
Table 1: Waste quantities and assumed recycling/recovery rates under various scenarios (tonnes
per year) ............................................................................................................................. 9
Table 2: Unit values (R/tonne) for the 13 selected waste streams (2013) .................................... 10
Table 3: Potential resource value (per year) under different scenarios of resource recovery ...... 14
Table 4: Benefits of waste recovery in terms of resource value and avoided disposal costs (per
year) .................................................................................................................................. 16
Table 5: Benefits of recycling/recovery per tonne of waste (in terms of resource value and
avoided disposal costs) ..................................................................................................... 17
Table 6: Unit benefits (excluding/including avoided disposal costs) of recovery for 13 selected
waste streams .................................................................................................................. 18

A National Waste Innovation Programme for South Africa: Phase 2 Waste RDI Roadmap
1 | P a g e
1 INTRODUCTION
1.1 Background
The most recent waste baseline study shows that South Africa landfills approximately 90% of all
waste generated (as at 2011) (DEA, 2012). While the policy environment exists for moving waste up
the hierarchy away from landfilling towards reuse, recycling and recovery (Figure 1), landfilling
remains the predominant method of waste management.
Discussions around moving away from landfilling towards alternative technology solutions are
usually stalled by the perceived higher cost of alternatives relative to landfilling. Typical landfilling
disposal fees range from R100-R150/T for general waste, up to R600-R800/T for hazardous waste
(DST, 2013). However, these tipping fees, especially for general waste, are thought to be artificially
low, since many municipal landfill sites are not designed and operated according to sanitary
engineered landfill standards which would drive up costs (through higher CAPEX and OPEX costs).
New norms and standards for disposal of waste to landfill (DEA, 2013) are expected to assist in
correcting these price ‘distortions’ by significantly increasing waste disposal costs at new landfills, or
where new cells are developed at existing landfills (DEA, 2013; DST, 2013).
Therefore, with the perceived higher cost of alternatives being a constraint to their implementation
in South Africa, the question arises as to how one can drive waste management towards alternative
technology solutions which appear to be more ‘expensive’ than simply disposing of waste to landfill?
This report turns the argument around by looking at the value of resources which are currently lost
to the South African economy by disposing of them as waste to landfill1. By understanding the value
of resources lost to the South African economy, an informed discussion can be had between
stakeholders (government and industry) on the economic (as opposed to the financial) benefits of
moving waste up the hierarchy.
Figure 1: Waste hierarchy
1 From an economic perspective, the value of these resources can be seen as additional ‘costs’ associated with landfilling
(or ‘benefits’ associated with alternatives) that are currently not being accounted for in decision-making processes.

A National Waste Innovation Programme for South Africa: Phase 2 Waste RDI Roadmap
2 | P a g e
The aim of this research is therefore to determine the monetary value of resources potentially
available to the South African economy by recovering them from our waste streams. Specifically,
the focus is on the economic benefits of recovery2
The term ‘recovered’ is used throughout the report in reference to the recovery of materials from
the waste. These resources are then available for diversion into waste reuse, recycling or recovery
(including energy recovery) activities. The assumption is made that all reasonable measures have
been taken to first reduce the amount of waste generated, and where waste cannot be reduced,
alternatives to landfilling are maximised.
1.2 Benefits of moving up the waste hierarchy
Moving waste up the hierarchy towards reuse, recycling and recovery contributes to the principles
of a ‘green economy’ in a number of ways:
Re-introduction of resources back into the economy
Contribution to economic growth and job creation, and
Reducing social and environmental costs
Each of these benefits is discussed briefly in Annexure 1.
The focus of this research is on the first benefit of
moving waste up the hierarchy – “Re-introduction of
resources back into the economy” – which we
quantify in terms of a ‘resource value.’ In other
words, we estimate the monetary value of the
resources that can potentially be recovered from the
waste stream. Importantly, this implies that the
values reported in this study are likely to under-
estimate the full benefits of moving waste up the
hierarchy, as the benefits associated with job creation and economic growth, as well as the avoided
costs and externalities associated with virgin material extraction, are not taken into account. In
Section 5.2, we bring in estimates from previous research regarding the financial costs and
externalities associated with landfill disposal, to supplement the estimates from the current study
regarding the potential value of recovered resources, in order to provide a more comprehensive
picture of the benefits of moving waste up the hierarchy.
2 An economic evaluation of waste management options requires assessment of both the costs and benefits of each
option. Such an evaluation is beyond the scope of this report, which aims to provide a preliminary assessment of the benefits (not accounting for costs) of moving up the waste management hierarchy, based on the value of resources lost through landfilling.
The focus of this research is on the
“Re-introduction of resources back into
the economy” – which we quantify in
terms of a ‘resource value’ – the
monetary value of the resources that
can potentially be recovered from the
waste stream

A National Waste Innovation Programme for South Africa: Phase 2 Waste RDI Roadmap
3 | P a g e
3 METHODOLOGY FOR ESTIMATING THE RESOURCE VALUE OF
WASTE
All economic activities (including waste management activities, such
as landfilling or recycling) incur both benefits and costs. However,
certain of these benefits and costs, such as environmental or social
externalities3, are intangible or difficult to quantify, and are
therefore not typically accounted for in policy and decision making,
which can in turn lead to incorrect decisions being made. Economic
valuation refers to the process by which economists quantify (in
monetary terms) the unaccounted for benefits and/or costs of
economic activities or policy actions. The information generated
through this process can then be used to contribute towards
improved decision making, in conjunction with other relevant
information.
The aim of this study is to
assess the benefits of
increased recovery of
resources from waste.
The focus is therefore on
the potential value of the
materials that could be
recycled; rather than the
value of materials
currently being recycled.
In this study, the aim is to quantify the economic benefits of moving waste up the hierarchy in South
Africa, based on the potential value of the resources that could be recovered. Note that the costs of
recovery are not taken into account; such that the results of this study cannot, on their own, be used
to justify the choice of one waste management option over another (in other words, a full cost-
benefit analysis of waste management options is not conducted). Instead, the information presented
in this report should be seen as one further source of information that can be used in the decision
making process, alongside other information.
Previous studies on the economic benefits of moving waste up the hierarchy have tended to focus
either on the cost savings of waste minimisation, or on the contribution of existing recycling
activities to GDP (or gross value added, GVA). For example, a study of the value of recycling in the EU
focuses on the value (calculated as price multiplied by quantity) of materials that are currently being
recycled (ETC/SCP 2011). However, a distinction needs to be drawn between the ‘current’ value of
recycling (i.e. the value of materials currently being recycled), and the ‘potential’ value of recycling
(the value of materials currently being landfilled that could be recycled). If the aim is to assess the
benefits of increased recovery of resources from waste, as in the current study, then the focus
should be on the potential value of the materials that could be recycled; rather than the value of
materials currently being recycled.
According to the EEA (2011:18), while estimates of turnover from recycling in the EU study referred
to above are based on the amount of material currently being recycled, “data on… waste generation
signal the maximum amount that could be recycled. Assuming that all waste is recycled provides an
indication of the maximum potential for recyclables to meet… material consumption needs. Of
3 Externalities can be defined as the positive or negative side effects (external benefits or costs) of a particular economic
activity (e.g. landfilling) that do not enter into formal markets associated with the activity in question (and are therefore not incorporated in market prices for the activity); but are instead borne by other groups in society and/or by future generations; or are dispersed throughout society as a whole. Examples include the impacts of landfill gas or leachate on the environment, or the impacts of odours on residents living in the vicinity of a landfill site.

A National Waste Innovation Programme for South Africa: Phase 2 Waste RDI Roadmap
4 | P a g e
course, this upper limit is theoretical because in reality not all waste can be recycled.” 4 This insight
suggests a potential methodology for providing an indicative assessment of the value of resources
that could potentially be recovered from the waste stream and re-introduced into the economy.
This methodology involves quantifying (in tonnes) the resources (waste) available, and multiplying
this quantity by a representative unit value (in R/tonne).
( ) ( ) ( )
Where: Q = quantity of a waste stream available to the economy (tonnes)
UV = unit value (R/tonne)
This method of determining resource value will therefore be used to estimate the economic benefits
of moving up the waste hierarchy in South Africa, in terms of the value of the resources that could
potentially be recovered. The following sub-sections present more detail on the approach used in
the study.
3.1 Quantity
While it would be ideal to assume that 100% of all waste generated could be recovered, and to base
the resource value on this quantity, this may not be realistic, particularly in the short- to medium-
term, given current physical or economic limitations to recycling and recovery.
As such, four scenarios have been modelled based on proposed increases in recovery rates of waste
streams for the short-, medium- and long-term, i.e. as more resources are recovered from the waste
stream and made available to the economy.
1. Scenario 1: Baseline (2011) waste quantities and recycling rates, as per the National Waste
Information Baseline (DEA 2012); reflecting the tonnages of materials that were being
recycled as at 2011.
2. Scenario 2: Short-term scenario (2017) based on targets in Industry Waste Management
Plans (IndWMP) and targeted recycling rates for 2017 (BMI Research 2013). Where a short-
term target was not available for a particular waste stream, a middle point between Scenario
1 and Scenario 3 was adopted.
3. Scenario 3: A medium-term scenario (2022), based on the goal of the DST’s Waste Research,
Development and Innovation (RDI) Roadmap (DST, 2012), to reduce industrial waste5 by 20%
and domestic waste6 by 60% by 2022, from the 2011 baseline. This goal of reducing waste to
landfill was translated to recycling/recovery targets for the individual waste streams.
4. Scenario 4: A hypothetical long-term scenario of 100% recycling/recovery, reflecting the
tonnages that could be recovered if all waste was diverted from landfill.7
4 For some materials, there are (currently) technical limits to recycling
5 For the purposes of this study, industrial waste has been interpreted to include hazardous and unclassified waste as
per the National Waste Information Baseline (DEA, 2012). 6 For the purposes of this study, domestic waste has been interpreted to include general waste as per the National
Waste Information Baseline (DEA, 2012). 7 While a recovery rate of 100% is not necessarily realistic, given that some portion of the waste stream will inevitably be
landfilled, the intention of this scenario is to provide an indication of the total resource value of all waste generated in South Africa.

A National Waste Innovation Programme for South Africa: Phase 2 Waste RDI Roadmap
5 | P a g e
It must be emphasized that the recovery rates outlined in the scenarios are in no way legal targets,
and have only been set for the purposes of determining the value of resources available in South
Africa’s waste stream, and for prompting innovation.
3.2 Unit value
We use the term ‘unit value’ rather than ‘price’ to represent the value per tonne; since in economic
terms the value per unit of a good or service is not necessarily equal to its market price. Generally
speaking, economic value refers to the maximum amount that users of a good or service are willing
to pay for the good or service. The decision to purchase a unit of the good or service implies that the
user places a higher value on the good or service than its market price. Nevertheless, in the absence
of costly and time-consuming valuation studies in which a large number of surveys are conducted
with users regarding their maximum willingness to pay per unit of a specific good or service, market
prices must often suffice as a proxy of unit values.
In determining the unit value per tonne of recyclable materials, it is important to note that “a
recycled product does not always replace a resource of equal value. The level of processing of the
recycled product or virgin product determines its value” (ETC/SCP 2011:25). As such, “the unit price
of the recyclables is usually lower than the corresponding price for virgin material. This is due to the
fact that the recyclable would require some further processing before it has the form required to
enter the production chain (de-inking and re-pulping for paper or melting for metal scrap). The
difference in unit prices represents the level of processing required. The required processing depends
on the suitability for recycling of the material itself and the level of purity of the material (in terms of
amount of foreign materials mixed with the recyclables)” (ETC/SCP 2011:28). In turn, the level of
processing required (and therefore the unit value of the recyclable material relative to the value of
the corresponding virgin material) varies for different types of recyclable materials.
Since unit prices increase along the recycling value chain, it is necessary to choose a specific point
along the chain where unit values will be determined. Figure 2 illustrates a simple schematic of the
recycling value chain. The arrows represent exchanges of materials, each of which also entails
monetary exchanges (in the opposite direction). For example, collectors purchase waste materials
from individuals or waste pickers, and in turn sell the collected materials to recyclers. In turn, the
recyclers undertake processing of the waste materials, and sell the recycled materials to
downstream industries for further processing and ultimately for use as a raw material in production
processes. Importantly, at each point along the value chain, value is added to the waste materials.
This implies that the ‘value’ (and the price) per tonne of the material increases along the chain.

A National Waste Innovation Programme for South Africa: Phase 2 Waste RDI Roadmap
6 | P a g e
Figure 2: Simple schematic of the recycling value chain showing value addition at each point along
the chain
Unit values should ideally be based on the point along the value
chain where comparisons with other options would generally be
made. In this case, the comparison is with landfilling, and unit
values for alternative recycling options should therefore be
chosen that are as close as possible to the landfilling option in
the value chain, that is, based on the willingness-to-pay by
recyclers for collected waste. We therefore generally use the
prices paid by recyclers to collectors as a proxy of the unit value8.
Exceptions occur in the case of wastes for which there is
currently no significant recycling market (e.g. because recycling is
either technically or economically infeasible), in which case
potential unit values were estimated by other means, such as in
terms of a Waste-to-Energy (WtE) potential.
“The price paid by recyclers
to collectors is used as a
proxy of the unit value.”
“Where no significant
recycling market exists, unit
value is estimated by other
means, e.g. Waste-to-energy
(WtE) potential.”
It is important to note that in basing our assessment on the prices paid by recyclers for waste
material before any value has been added in terms of processing of the materials, the values
estimated in this study should be seen as a minimum or lower-bound estimate of the full potential
benefits of recovery to the economy. Introducing these materials into the economy creates
opportunity for further value-add as part of a growing manufacturing sector.
8 Strictly speaking, since markets for waste and waste products do not function freely, a number of corrections should be
made to these prices, such as taking into account implicit municipal subsidies for bringing collected waste to private recyclers. Nevertheless, estimation of accurate “shadow unit values” was beyond the scope of this report. The limitations of using unit values based on uncorrected market prices should be borne in mind in interpreting the results presented in this report.

A National Waste Innovation Programme for South Africa: Phase 2 Waste RDI Roadmap
7 | P a g e
3.3 Waste streams
A very simplistic approach towards valuing the resources available for recycling and recovery in
South Africa would involve multiplying the total tonnage of waste generated by a single, average
unit price. However, the intention of this research is to support specific interventions with regards
to research, development and innovation for targeted waste streams which have high potential for
re-introduction into the South African economy. Specific values per waste stream are therefore
required. Using the waste categories outlined in the Waste Information Regulations (DEA, 2012a),
specific waste streams were targeted for valuation, based on the following criteria –
i. The perceived moderate to high potential for recycling and recovery (global trends)
ii. The magnitude of waste generated (high tonnage waste streams)
iii. The availability and accuracy of data
The methodology has been applied to thirteen key waste streams in South Africa, as follows:
General waste
o Municipal waste (non-recyclable portion)
o Organic waste (component of municipal waste)
o Other (industrial and agricultural biomass waste)
o Construction and demolition waste
o Paper
o Glass
o Plastic
o Metals
o Tyres
Unclassified waste
o Waste electric and electronic equipment (WEEE)
o Slag (from mineral processing)
o Ash (from power generation)
Hazardous waste
o Waste oils
As further data becomes available, additional waste streams can be included in the valuation,
thereby building a more comprehensive picture of the value of resources available to the South
African economy.

A National Waste Innovation Programme for South Africa: Phase 2 Waste RDI Roadmap
8 | P a g e
4 INPUT DATA
The following section presents the quantity and unit value data used as inputs into the model. Data
regarding the quantities of waste was obtained largely from the National Waste Information
Baseline Report (DEA 2012), supported by data available in the general literature. Data pertaining to
unit values was obtained largely from discussions with various collectors, recycling companies,
sector associations, and waste management companies.
It is noted that data pertaining to the economic value of recycling is limited, even in developed
countries (ETC/SCP 2011). These data constraints are even more apparent in developing country
contexts. Nevertheless, sections 4.1 and 4.2 provide information on how quantities and unit values
for the various waste streams were established for this study.
4.1 Quantities
For each of the 13 waste streams included in this report, quantities of waste (in tonnes per year)
being generated in South Africa (as at 2011)9, as well as the proportions currently being recycled and
landfilled, were obtained from the National Waste Information Baseline (DEA 2012). These
quantities are summarised in Table 1.
Table 1 also presents the proposed recycling/recovery rates for each of the four scenarios, on which
the resource valuation modelling has been conducted:
1. Scenario 1: Baseline (2011) reflecting the tonnages of materials that were being recycled as
at 2011 (DEA 2012)
2. Scenario 2: Short-term scenario (2017) based on targets in Industry Waste Management
Plans (IndWMP) and targeted recycling rates for 2017 (BMI Research 2013)
3. Scenario 3: A medium-term scenario (2022), based on the goal of the DST’s Waste RDI
Roadmap (DST, 2012)
4. Scenario 4: A hypothetical long-term scenario of 100% recycling/recovery, reflecting the
tonnages that could be recovered if all waste was diverted from landfill.
9 The DEA baseline waste information for 2011 (DEA, 2012) represents the most recent national overview of waste
generation, landfilling and recycling tonnages for South Africa. While regulations are in place to give effect to a national waste information system, routine, annual waste tonnage data for South Africa is not yet available.

A National Waste Innovation Programme for South Africa: Phase 2 Waste RDI Roadmap
9 | P a g e
Table 1: Waste quantities and assumed recycling/recovery rates under various scenarios (tonnes per year)
Stream
BASELINE (2011) SCENARIO 1 SCENARIO 2 SCENARIO 3 SCENARIO 4
Generated (t/yr)
Landfilled (t/yr)
Recycled (t/yr)
Recycled (%)
Recycled / recovered
(t/yr)
Recycled / recovered
(%)
Recycled / recovered
(t/yr)
Recycled / recovered
(%)
Recycled / recovered
(t/yr)
Recycled / recovered
(%)
Municipal waste (non-recyclable portion)
8 062 934 8 062 934 0 0 2 015 734 25 4 031 467 50 8 062 934 100
Organic component of municipal waste
3 023 600 1 965 340 1 058 260 35 1 587 390 53 2 116 520 70 3 023 600 100
Biomass waste from industry
36 171 127 36 171 127 0 0 10 851 338 30 21 702 676 60 36 171 127 100
Construction and demolition waste
4 725 542 3 969 455 756 087 16 1 559 429 33 2 362 771 50 4 725 542 100
Paper 1 734 411 745 797 988 614 57 1 087 476 63 1 387 529 80 1 734 411 100
Plastic 1 308 637 1 073 082 235 555 18 537 850 41 785 182 60 1 308 637 100
Glass 959 816 652 675 307 141 32 417 520 44 575 890 60 959 816 100
Metals 3 121 203 624 241 2 496 962 80 2 653 022 85 2 809 083 90 3 121 203 100
Tyres 246 631 236 766 9 865 4 103 585 42 197 305 80 246 631 100
WEEE 64 045 57 161 6 884 11 19 453 30 32 023 50 64 045 100
Slag (from mineral processing)
5 370 968 2 685 484 2 685 484 50 3 356 855 63 4 028 226 75 5 370 968 100
Ash (from power generation)
36 220 000 33 930 896 2 289 104 6 4 766 552 13 7 244 000 20 36 220 000 100
Waste oils 120 000 67 200 52 800 44 69 600 58 86 400 72 120 000 100
TOTAL 101 128 914 90 242 158 10 886 756 11 29 025 804 29 47 359 071 47 101 128 914 100
Notes:
Figures for ‘slag’ based on ferrous metal slag from steel, manganese, chrome, vanadium etc. processing and non-ferrous metal slag from aluminium etc. processing
Figures for ‘ash’ based on fly ash and bottom ash from Eskom’s coal-fired power stations
A National Waste Innovation Programme for South Africa: Phase 2 Waste RDI Roadmap
10 | P a g e
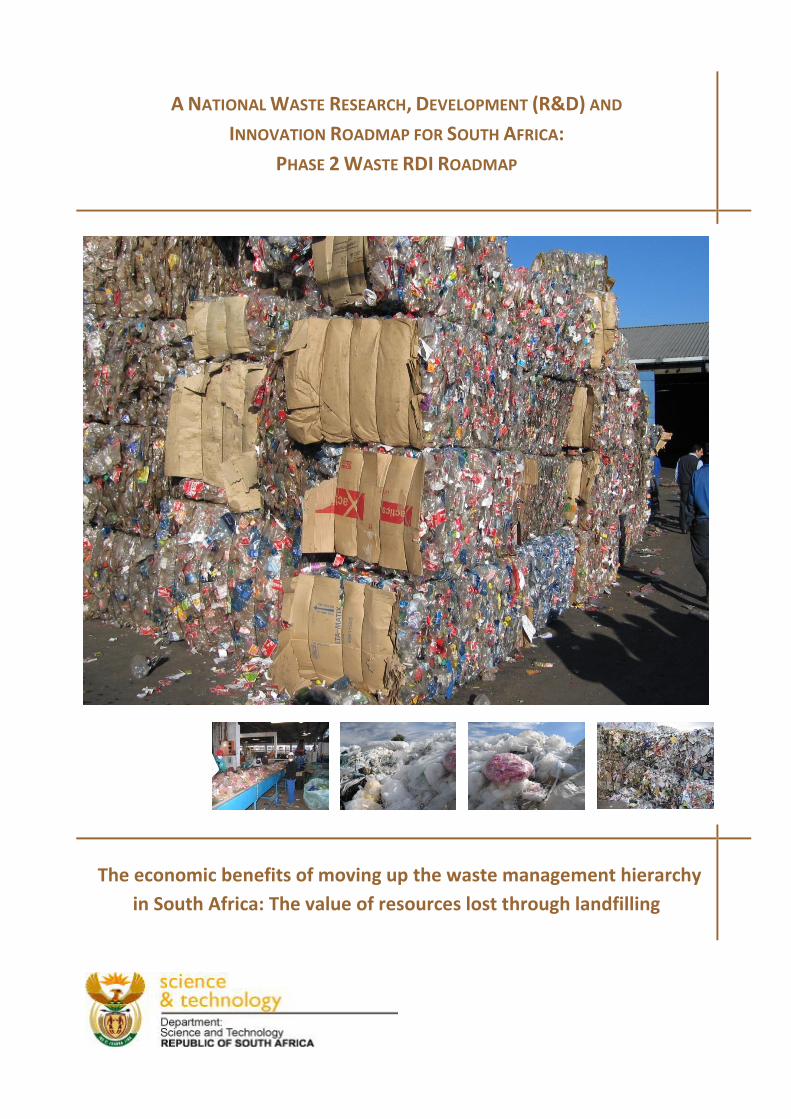
4.2 Unit values
For each of the 13 waste streams included in this report, unit values were calculated based on prices
paid by recyclers to collectors. Where no significant recycling market exists, unit value was
calculated by other means, e.g. waste-to-energy (WtE) potential. Annexure 2 provides a detailed
explanation on the calculation of unit value for each waste stream. The final results are presented in
Table 2.
Table 2: Unit values (R/tonne) for the 13 selected waste streams (2013)
Stream Range in prices
(R/t) Unit value
(R/t)
Disclaimer:
All prices quoted in the
report are average
prices based on data
from multiple sources,
multiple geographic
regions, and for a period
of time (2013), and as
such should not be seen
as the current (January
2014) market price that
could be obtained for a
waste.
Municipal waste (non-recyclable portion)
N/A (own calculations) 367.38
Organic component of municipal waste
N/A (own calculations) 188.63
Biomass waste from industry
N/A (own calculations) 188.63
Construction and demolition waste
85 - 90 87.50
Paper10 200 - 2000 744.47
Plastic11 1900 - 3960 3119.54
Glass 450 - 500 490.00
Metals12 1000 - 7000 2270.00
Tyres N/A (own calculations) 367.00
WEEE 1000 1000.00
Slag 170 - 180 175.00
Ash 0 - 5 3.00
Waste oils 2777.78 2777.78
Prices paid by recyclers vary greatly, depending on the company, geographic region, quality of
recyclables, markets, whether recyclables are received loose or baled, etc. In addition, the wide
ranges seen in the middle column of Table 2 reflects the range of prices associated with different
materials within each stream, such as ferrous vs. non-ferrous metals, different grades of paper,
different polymers of plastic, etc. This implies that presenting minimum and maximum values based
on the range in prices for each waste stream is not appropriate; since doing so would ignore the
heterogeneity of materials included within each waste stream. As such, the unit values presented in
the last column of Table 2, and which are used in the analysis to follow, were calculated as
‘representative values’ for each waste stream, taking all of these factors into consideration. For
example, the unit value of metals was calculated taking into account the relative contribution of
ferrous vs non-ferrous metals to the total metal waste stream in South Africa.
10
The wide variation occurs due to different grades (R200 for mixed up to R2000 for white) 11
The wide variation occurs due to different types of plastics (PE-LD – PET) 12
Wide range from ferrous to non-ferrous

A National Waste Innovation Programme for South Africa: Phase 2 Waste RDI Roadmap
11 | P a g e
4.3 Assumptions and limitations
A number of assumptions and limitations associated with the study should be borne in mind before
drawing conclusions on the basis of the results presented in this report. These include the following:
Only the benefits of moving up the waste hierarchy have been estimated; costs of recovery
are not taken into account. These could include, for example, additional costs of collection,
transport and processing to deal with different waste streams; as well as the decrease in
revenue from disposal. All of these factors need to be brought into a financial and economic
evaluation of waste management options. Therefore, the results of this study cannot, on
their own, be used to justify the choice of one waste management option over another,
which would require a rigorous assessment of both benefits and costs, as well as other
information.
Estimation of accurate “shadow unit values”, based on corrections to market prices (e.g. by
taking into account implicit municipal subsidies for bringing collected waste to private
recyclers) was beyond the scope of this report.
The unit values used to value recyclable materials are based on prices at a point in the value
chain where a comparison can be made with landfilling. . However, in the case of recovery,
there are opportunities for further value addition along the value chain, while in the case of
landfilling, such opportunities are lost. It could therefore be argued that, at an economy-
wide level, if opportunities for further value addition are taken into account, the full benefits
of recovery to the economy exceed the values estimated in this report.
The report focuses specifically on 13 waste streams. Other waste streams, some of which
may also have recycling potential, are excluded from the analysis. For example, although we
include slag from mineral processing, we exclude other mining waste (amounting to
510,000,000 tonnes per year, according to Purnell 2009), for which there may also be
recycling potential, but for which insufficient data exists relating to the composition (and
therefore value).
Some materials can be recycled a number of times; whereas in this study we only consider
the resource values associated with one round of recycling. For example, paper can be
recycled up to seven times (PAMSA 2013), whilst glass is in principle infinitely recyclable
(GRC 2008). In this study we are only considering the resource values associated with one
round of recycling.
The study focuses on the benefits of recycling in terms of resource value only. There are
multiple economic benefits associated with moving up the waste hierarchy, particularly from
a green economy perspective. Although the report provides an indication of the additional
benefits associated with avoided disposal costs, the benefits associated with job creation
and economic growth, as well as the avoided costs and externalities associated with virgin
material extraction, are still not taken into account.
The study uses waste quantities (as at 2011) and unit values (as at 2013) on which to
calculate resource value, and has not included the likely growth in the generation of waste
due to economic development. For general waste this growth rate is in the region of 2-4%
per annum (Fiehn & Ball, 2005; DEA, 2012), which will further add to the quantity of
resources available and the resultant resource value.

A National Waste Innovation Programme for South Africa: Phase 2 Waste RDI Roadmap
12 | P a g e
Furthermore, it is acknowledged that –
Prices paid for recyclables are often influenced by factors external to the South African
economy, e.g. demand for resources by emerging markets can drive up prices; oil price
fluctuations, etc. Changes within the external environment, over which South Africa has
little control, could therefore influence local recycling prices and therefore unit value.
Increased recovery of recyclables can cause prices to decrease, especially if supply exceeds
demand. This has not been taken into account in the model, since market stimulation (local
and international) is critical to maximising recycling and recovery.

A National Waste Innovation Programme for South Africa: Phase 2 Waste RDI Roadmap
13 | P a g e
5 RESULTS
In this section, we bring together the data on quantities of waste recovered (Section 4.1) and the
unit values of the materials (Section 4.2), to obtain an estimate of the resource value of waste
recovery in South Africa, both currently and under a number of scenarios as they relate to increased
recovery rates.
For the sake of convenience, the scenarios are repeated here:
1. Scenario 1: Baseline (2011) reflecting the tonnages of materials that were being recycled
and recovered as at 2011
2. Scenario 2: Short-term scenario (2017) based on targets in Industry Waste Management
Plans (IndWMP) and targeted recycling rates (BMI Research 2013)
3. Scenario 3: A medium-term scenario (2022), based on the goal of the DST’s Waste RDI
Roadmap (DST, 2012)
4. Scenario 4: A hypothetical long-term scenario of 100% recycling/recovery, reflecting the
tonnages that could be recovered if all waste was diverted from landfill
5.1 Resource value from increased recycling/recovery
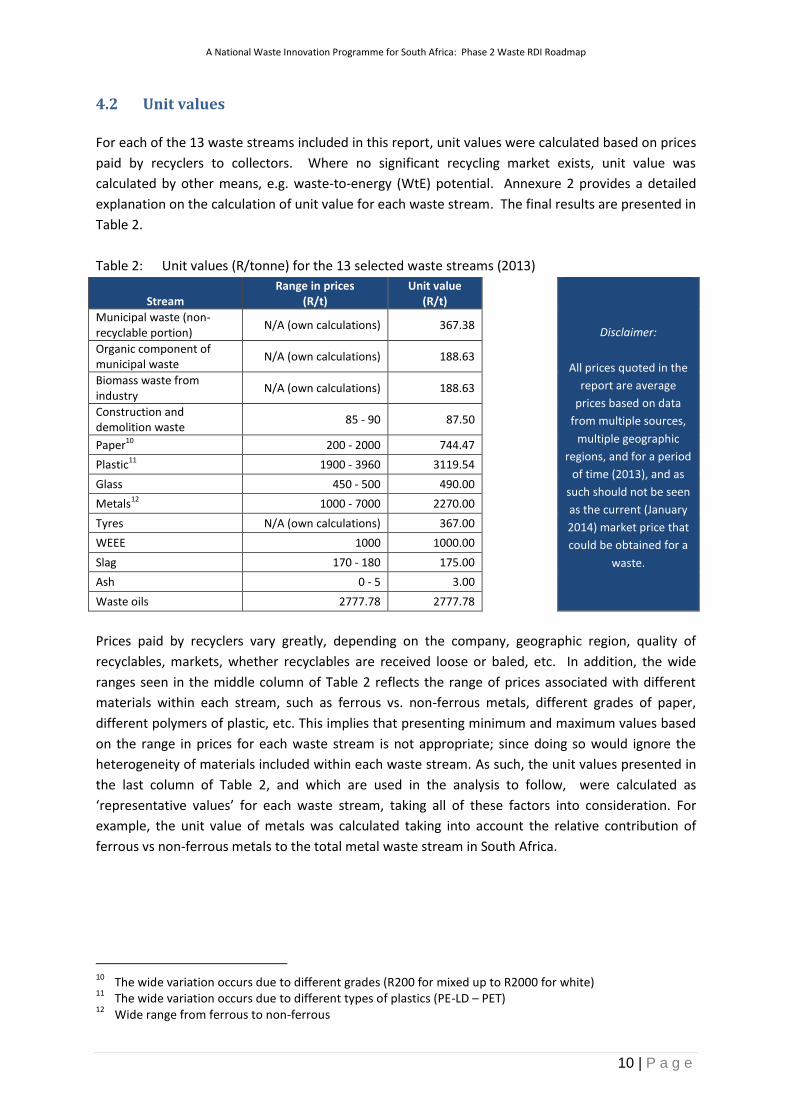
The values across all four scenarios are summarised in Table 3. The results of the modelling show
that the value of resources currently being recycled/recovered from the 13 waste streams is R8.2
billion/year (Baseline Scenario). However, with increased recovery of resources from the waste
stream, the resource value can increase to R12.8 billion/year under Scenario 2; R17.4 billion/year
under Scenario 3; to R25.2 billion/year under Scenario 4. Achieving the goal of the DST Waste RDI
Roadmap could therefore potentially unlock R17.4 billion/year worth of resources into the economy,
which otherwise would have been lost through disposal to landfill.
The benefits of increased recycling/recovery can be calculated as the difference between the current
resource values (baseline) and the potential higher resource values associated with the various
increased recovery scenarios. The benefits of increased recycling/recovery (relative to the baseline)
range from R4.6 billion/year under Scenario 2, R9.2 billion/year under Scenario 3, to R17.0
billion/year under Scenario 4 (Table 3). Achieving the goal of the Waste RDI Roadmap could
therefore unlock an additional R9.2 billion worth of resources (at current prices and tonnages).
It must be re-emphasised that these estimates are likely to underestimate the full benefits of
resource recovery to the South African economy; for a number of reasons (see Section 4.3).
A National Waste Innovation Programme for South Africa: Phase 2 Waste RDI Roadmap
14 | P a g e
Table 3: Potential resource value (per year) under different scenarios of resource recovery
Quantity recycled / recovered (t/year) Unit value (R/t)
Value (Rand/year)
Stream Scenario 1 Scenario 2 Scenario 3 Scenario 4 Scenario 1 Scenario 2 Scenario 3 Scenario 4
Municipal waste (non-recyclable portion)
0 2 015 734 4 031 467 8 062 934 367.38 0 740 547 527 1 481 095 054 2 962 190 108
Organic component of municipal waste
1 058 260 1 587 390 2 116 520 3 023 600 188.63 199 624 053 299 436 079 399 248 106 570 354 437
Biomass waste from industry
0 10 851 338 21 702 676 36 171 127 188.63 0 2 046 933 732 4 093 867 465 6 823 112 441
Construction and demolition waste
756 087 1 559 429 2 362 771 4 725 542 87.50 66 157 613 136 450 038 206 742 463 413 484 925
Paper 988 614 1 087 476 1 387 529 1 734 411 744.47 735 995 662 809 595 449 1 032 976 649 1 291 220 811
Plastic 235 555 537 850 785 182 1 308 637 3119.54 734 824 361 1 677 846 536 2 449 411 002 4 082 351 670
Glass 307 141 417 520 575 890 959 816 490.00 150 499 090 204 584 780 282 185 904 470 309 840
Metals 2 496 962 2 653 022 2 809 083 3 121 203 2270.00 5 668 103 740 6 022 360 735 6 376 617 729 7 085 130 810
Tyres 9 865 103 585 197 305 246 631 367.00 3 620 455 38 015 658 72 410 862 90 513 577
WEEE 6 884 19 453 32 023 64 045 1000.00 6 884 000 19 453 250 32 022 500 64 045 000
Slag 2 685 484 3 356 855 4 028 226 5 370 968 175.00 469 959 700 587 449 625 704 939 550 939 919 400
Ash 2 289 104 4 766 552 7 244 000 36 220 000 3.00 6 867 312 14 299 656 21 732 000 108 660 000
Waste oils 52 800 69 600 86 400 120 000 2777.78 146 666 667 193 333 333 240 000 000 333 333 333
Total 10 886 756 29 025 804 47 359 071 101 128 914 8 189 202 652 12 790 306 399 17 393 249 283 25 234 626 353
Benefit of increased recycling relative to baseline (Scenario 1) 4 601 103 747 9 204 046 631 17 045 423 701

A National Waste Innovation Programme for South Africa: Phase 2 Waste RDI Roadmap
15 | P a g e
5.2 Additional economic benefits
It is important to emphasise that the value estimates in Table 3 are calculated in terms of resource
value only. Recall from Section 1.2 that there are multiple economic benefits from moving up the
waste hierarchy, particularly from a green economy perspective. The values reported in Table 3
exclude the benefits associated with job creation and enterprise development; the indirect
‘multiplier’ (knock-on) effects on the macro-economy; the avoided financial costs and externalities
associated with disposal; and the avoided financial costs and externalities associated with virgin
material production.
In terms of the avoided costs of disposal, current disposal (tipping) fees are generally in the range of
R100 to R150 per tonne. It is acknowledged that these do not necessarily reflect full financial costs
of landfilling, which would include capital, operating and closure costs over the lifetime of a landfill.
Estimates from some municipalities suggest that full financial costs are likely to be much higher than
the range of tipping fees reported here; nevertheless, in the absence of sufficient data on true
landfill costs, these tipping fees will be used as a conservative estimate of avoided financial costs.
Furthermore, a study by Nahman et al. (2011) estimated externalities (social and environmental
costs) associated with landfilling in the City of Cape Town at approximately R111 per tonne.
Assuming that the latter can be extrapolated to other areas of South Africa, we can use these figures
to supplement our estimated resource values with the benefits in terms of the avoided financial
costs and externalities associated with landfill disposal, to give a more comprehensive estimate of
the benefits of recycling. The results are summarised in Table 4.
It can be seen that, in terms of the resource value of recovered materials plus the avoided financial
costs and externalities associated with landfill disposal, the current value of recycling/recovery is in
the order of R10.5 billion/year; which could increase to R18.9 billion/year under Scenario 2, to R27.4
billion/year under Scenario 3, and to as much as R46.5 billion/year under Scenario 4. Achieving the
goal of the DST Waste RDI Roadmap, taking into account avoided financial costs and externalities
associated with landfill disposal, could therefore potentially unlock R27.4 billion/year worth of
resources into the economy, which otherwise would have been lost through disposal to landfill.
The benefits of increased recycling/recovery relative to the baseline (difference between current
value and potential value under each scenario), in terms of resource values and avoided disposal
costs, range from R8.4 billion/year under Scenario 2, R16.9 billion/year under Scenario 3, to R36.0
billion/year under the 100% recycling Scenario 4 (Table 4).
Of course, even these values are likely to represent an under-estimate of the full benefits of moving
waste up the hierarchy. Although we have now incorporated the benefits associated with avoided
disposal costs; the benefits associated with job creation and economic growth, as well as the
avoided costs and externalities associated with virgin material extraction, are still not taken into
account.

A National Waste Innovation Programme for South Africa: Phase 2 Waste RDI Roadmap
16 | P a g e
Table 4: Benefits of waste recovery in terms of resource value and avoided disposal costs (per year)
Quantity Recycled / recovered (t/year) Unit value (R/tonne)
Value (Rand/year)
Baseline Scenario 2 Scenario 3 Scenario 4
Baseline Scenario 2 Scenario 3 Scenario 4
Resource value 10 886 756 29 025 804 47 359 071 101 128 914 *varies by
waste stream 8 189 202 652 12 790 306 399 17 393 249 283 25 234 626 353
Avoided financial costs of landfilling
10 886 756 29 025 804 47 359 071 101 128 914 100 1 088 675 600 2 902 580 356 4 735 907 080 10 112 891 400
Avoided externalities of landfilling
10 886 756 29 025 804 47 359 071 101 128 914 111 1 203 966 346 3 209 963 616 5 237 439 640 11 183 846 599
Total 10 481 844 598 18 902 850 372 27 366 596 003 46 531 364 353
Benefit of increased recycling relative to baseline 8 421 005 774 16 884 751 405 36 049 519 755

A National Waste Innovation Programme for South Africa: Phase 2 Waste RDI Roadmap
17 | P a g e
5.3 Unit benefits of recycling/recovery
The values estimated in this report can be translated into benefits per tonne of waste recycled (i.e.
the ‘unit benefits’ of recycling); which can be compared with the costs per tonne (unit costs) of
recycling (not estimated in this report) for policy and decision-making purposes. The value estimates
in Table 4 were therefore divided by the quantities recycled in each scenario, to provide an estimate
of the benefits of recycling per tonne (including the benefits associated with the resource value of
recyclables, as well as the avoided financial costs and externalities associated with landfilling) (see
Table 5).
Table 5: Benefits of recycling/recovery per tonne of waste (in terms of resource value and avoided
disposal costs)
BENEFIT PER TONNE (R/t):
Baseline Scenario 2 Scenario 3 Scenario 4
Resource value 752 441 367 250
Avoided financial costs of landfilling
100 100 100 100
Avoided Externalities of landfilling
111 111 111 111
Total 963 651 578 460
Furthermore, the benefits per tonne illustrated in Table 5 pertain only to the resource value of
recycling and the avoided financial and external costs of landfilling; they exclude other benefits such
as the avoided financial and external costs of virgin material extraction, benefits in terms of job
creation and economic growth, etc. As such, the estimates provided in this report are likely to
underestimate the full benefits associated with moving up the waste management hierarchy;
although the costs of moving up the hierarchy will also need to be taken into account.

A National Waste Innovation Programme for South Africa: Phase 2 Waste RDI Roadmap
18 | P a g e
6 DISCUSSIONS
While this research is based on limited data and has provided a simplified model of a complex socio-
economic system, the results do highlight some key points which require further discussion.
Based on the results of this research and the apparent considerable value of resources ‘locked-up’ in
South Africa’s waste stream, one must question why South Africa currently only experiences a
national recycling rate of ± 10% (DEA, 2012). While disposal costs, especially for general waste, are
particularly low, the value of recyclables alone should drive a more aggressive recovery of these
resources, especially waste streams with high unit benefits of recovery (i.e. where the benefits of
recovery are high on a per tonne basis). In Table 6, we summarise the unit benefits per waste
stream (in terms of resource value only, in column 2; and including the additional benefits
associated with avoided disposal costs of R211 per tonne, in column 3); as well as the current
recycling rates (as at 2011).
Table 6: Unit benefits (excluding/including avoided disposal costs) of recovery for 13 selected
waste streams
Stream Unit benefit (in terms of resource
value only) (R/t)
Unit benefit (in terms of resource value plus avoided
disposal costs) (R/t)
Current recycling rate
(%)
Plastic 3119.54 3330.54 18
Waste oils 2777.78 2988.78 44
Metals 2270.00 2481.00 80
WEEE 1000.00 1211.00 11
Paper 744.47 955.47 57
Glass 490.00 701.00 32
Tyres 367.00 578.00 4
Municipal waste (non-recyclable portion)
367.38 578.00 0
Organic component of municipal waste
188.63 399.63 35
Biomass waste from industry
188.63 399.63 0
Slag 175.00 386.00 50
Construction and demolition waste
87.50 298.50 16
Ash 3.00 214.00 6
Possible reasons for the lower than expected recycling rate for certain waste streams, given the
available resource value, include –
1. Unit costs of recovery exceed benefits
2. Costs and benefits are not borne by the same parties
3. Lack of access to waste streams (limited recovery)
4. Lack of markets for recovered resources
5. Lack of infrastructure/technology to recover resources
6. Recyclate more expensive than virgin materials

A National Waste Innovation Programme for South Africa: Phase 2 Waste RDI Roadmap
19 | P a g e
6.1 Benefits versus costs
With information now available on the unit benefit of recovery per waste stream (Table 6), the
sector must compare these benefits with the unit costs of recycling/recovery of each waste stream,
to assess the economic viability of alternatives (based on a rigorous cost-benefit analysis approach),
and to identify where economic opportunities exist.
Assessment of the costs of recycling/recovery was beyond the scope of this report. This requires
empirical data based on actual waste management projects, pilot projects, or, at the very least, the
advanced stages of engineering analysis. Such information is currently lacking in South Africa, and,
the data that is available tends to provide conflicting results, given the wide range in cost estimates
for different technologies in different contexts. Much work is therefore required in assessing the
costs and benefits (including external costs and benefits) of alternative waste management options
in South Africa, in order to provide reliable information for decision making.
6.2 Sharing of cost and benefit
While preliminary evidence suggests that for many waste streams, the benefits of recovery and
recycling exceed the costs, the benefits and costs are typically not shared by the same party. In the
case of domestic waste, municipalities typically bear the cost of collection, separation and disposal,
while the private sector realises the financial benefit of recycling, with access to the resource. In
other words, there is no real incentive for municipalities to spend more on putting source separation
measures in place to maximise collection of recyclables (increased management costs), when they
realise none of the resource value opportunities. This may be different for industrial waste, where
the private sector may have more control over costs and benefits.
In economic terminology, recycling is a good example of an activity with positive externalities - costs
are borne by one party to undertake the activity, but the benefits are realised by another party. In
such cases, the usual recommendation from an economic perspective (aside from mandatory
regulations, etc.) would be to ensure that financial incentives are provided to those bearing the
costs, through some form of transfer from the beneficiaries to the providers, e.g. by means of
subsidies or some form of trading or compensation scheme. In principle, given the large difference
between the benefits and costs, there should be some opportunity for win-win compensation.
Alternatively, in some countries there is more use of voluntary mechanisms, whereby industry itself
recognises the benefits of investing more heavily in recycling (including collection, separation).
Possible reasons why this hasn't taken off in South Africa may be that (i) virgin materials are
relatively cheap, so there is no incentive for industry to switch towards greater use of recycled
materials, and (ii) municipalities act as gatekeepers to the waste, particularly domestic waste, which
increases the risk of investment by the private sector.
Industrial waste may be more accessible to increased recycling/recovery, and this must be
supported. Furthermore, mechanisms should be put in place to facilitate greater ease of access by
the private sector to municipal waste, without compromising the municipality’s constitutional
A National Waste Innovation Programme for South Africa: Phase 2 Waste RDI Roadmap
20 | P a g e
responsibility to ensure the safe management of domestic waste, or which will result in increased
environmental or social risk.
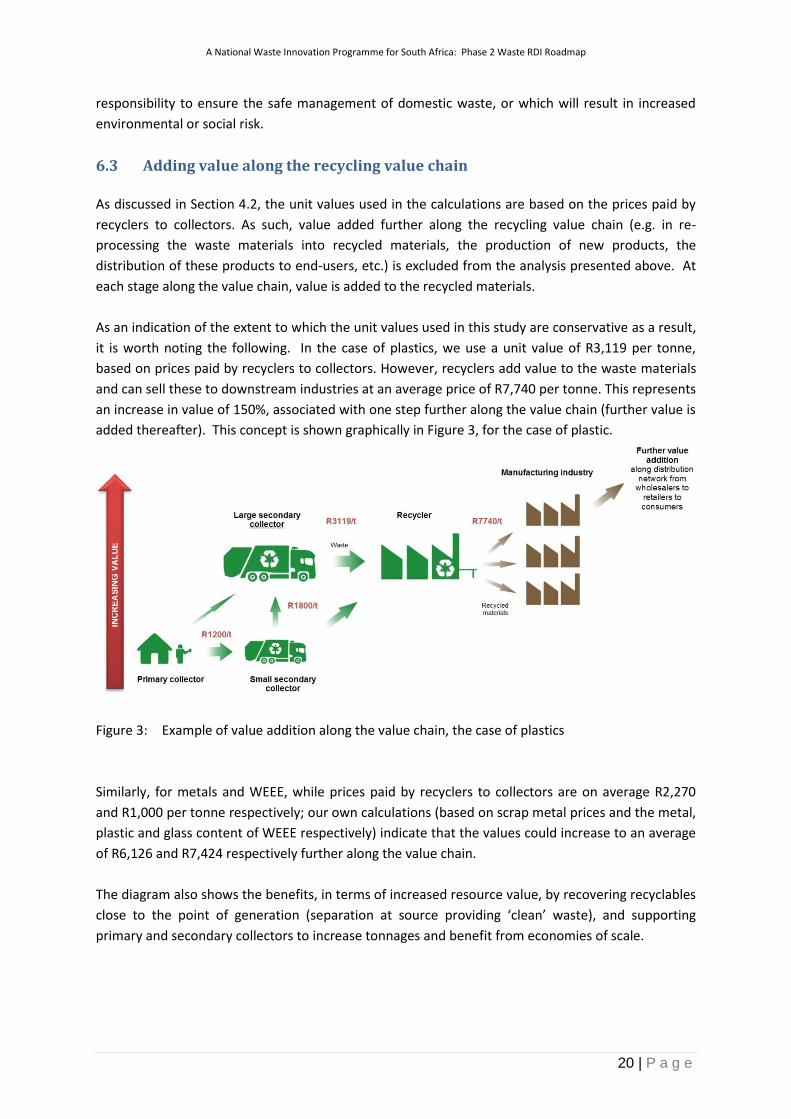
6.3 Adding value along the recycling value chain
As discussed in Section 4.2, the unit values used in the calculations are based on the prices paid by
recyclers to collectors. As such, value added further along the recycling value chain (e.g. in re-
processing the waste materials into recycled materials, the production of new products, the
distribution of these products to end-users, etc.) is excluded from the analysis presented above. At
each stage along the value chain, value is added to the recycled materials.
As an indication of the extent to which the unit values used in this study are conservative as a result,
it is worth noting the following. In the case of plastics, we use a unit value of R3,119 per tonne,
based on prices paid by recyclers to collectors. However, recyclers add value to the waste materials
and can sell these to downstream industries at an average price of R7,740 per tonne. This represents
an increase in value of 150%, associated with one step further along the value chain (further value is
added thereafter). This concept is shown graphically in Figure 3, for the case of plastic.
Figure 3: Example of value addition along the value chain, the case of plastics
Similarly, for metals and WEEE, while prices paid by recyclers to collectors are on average R2,270
and R1,000 per tonne respectively; our own calculations (based on scrap metal prices and the metal,
plastic and glass content of WEEE respectively) indicate that the values could increase to an average
of R6,126 and R7,424 respectively further along the value chain.
The diagram also shows the benefits, in terms of increased resource value, by recovering recyclables
close to the point of generation (separation at source providing ‘clean’ waste), and supporting
primary and secondary collectors to increase tonnages and benefit from economies of scale.

A National Waste Innovation Programme for South Africa: Phase 2 Waste RDI Roadmap
21 | P a g e
7 CONCLUSIONS AND RECOMMENDATIONS
This report estimates the potential benefits of recycling in terms
of the resource value of the materials that could be recovered
and recycled back into the economy. The results of the
modelling show that –
Recycling at ±10% (as at 2011 baseline) unlocked R8.2
billion/year worth of resources into the South African
economy
Achieving the DST target (Scenario 3) would unlock R17.4
billion/year worth of resources
Achieving 100% recycling and recovery targets (Scenario
4) would unlock R25.2 billion/year worth of resources
into the South African economy, which would have been
lost to landfill.
It is found that, purely in terms of resource value, the benefits of
additional recycling/recovery, over and above the value of
resources currently being recycled, range between R4.6 - R17.0
billion/year. If benefits in terms of avoided financial and external
costs associated with landfill disposal are taken into account, the
benefits increase to between R8.4 - R36.0 billion/year.
On a per tonnage basis, the benefits of recycling (in terms of
resource value and avoided disposal costs) range between R460
and R963 per tonne, which in many cases exceeds current
estimates of the cost per tonne of recycling.
It is recommended that the methodology and data inputs be
tested with the sector to fine-tune the research findings, to test
the main findings, and to evaluate where opportunity waste
streams exist for increased recycling or recovery. It is reiterated
that the estimates of the benefits of recycling/recovery should
be treated as under-estimates of the full potential benefits of
moving waste up the hierarchy in South Africa; although the
costs of moving up the hierarchy also need to be taken into
account.
KEY HIGHLIGHTS:
▶ Considerable value (not
only resource value but
broader economic value) is
locked-up in waste that is
currently being disposed
of to landfill in South
Africa
▶ Waste disposal costs
(tipping fees) in South
Africa are particularly low,
however, the value of
recyclables alone should
drive a more aggressive
recovery of these
resources than what we
currently see (especially
waste streams with high
unit values)
▶ We need to actively
investigate ways of
overcoming the financial,
bureaucratic and
technological constraints
restricting waste recovery
in South Africa
▶ The annual resource value
of waste (R25.2b)
represents ~0.86% of
South Africa’s GDP (2011)
8 ACKNOWLEDGEMENTS
The authors would like to thank the various organisations who willingly shared their experience and
provided price data into this study. Without this input, this study would not have been possible. Dr
Martin de Wit of Sustainable Options Pty (Ltd) who undertook the independent, external review of
the final report and who provided valuable and insightful review comments.
A National Waste Innovation Programme for South Africa: Phase 2 Waste RDI Roadmap
22 | P a g e
9 REFERENCES
ACR (Australian Council of Recyclers) (2008). Australian recycling values: a net benefits assessment,
cited in Australia’s Green Economic Potential, 2010. Centre for Policy Development, CPD
Occasional Paper 10.
ASPASA (The Aggregate and Sand Producers Association of Southern Africa). (2014). The Aggregate
and Sand Industry in South Africa. Available at http://www.aspasa.co.za/PDFs/THE-
AGGREGATE-AND-SAND-INDUSTRY-IN-SA.pdf. Accessed 23 January 2014.
Aulakh, S. and Thorpe, L. (2011). From Waste Management to Resource Recovery: A Developing
Sector. Sheffield, United Kingdom: Ekogen.
Austin, G. and Gets, A. (2009). Sustainable Cities: Biogas Energy from Waste: A Feasibility Study and
Guidelines for Implementing Biogas from Waste Projects in Municipalities: Technical Report.
Cape Town: Report by Agama Biogas for the South African Cities Network.
BMI Research. (2013). Recycle Assessment Report. Johannesburg: BMI Research.
Botes, A. (2012). Scrap metal recycling in South Africa. Available at
http://urbanearth.co.za/articles/scrap-metal-recycling-south-africa. Accessed 20 January
2014.
DEA (Department of Environment Affairs). (2012). National Waste Information Baseline Report.
Pretoria: Department of Environmental Affairs.
DEA (Department of Environment Affairs). (2012a). National Waste Information Regulations.
Government Gazette No. 35583, 13 August 2012.
DEA (Department of Environment Affairs). (2013). National Norms and Standards for Disposal of
Waste to Landfill. Government Gazette No. 36784, 23 August 2013.
DEAT (Department of Environmental Affairs and Tourism). (2005). National Waste Management
Strategy Implementation South Africa: Recycling: Waste Stream Analysis and Prioritisation
for Recycling. Pretoria: Department of Environmental Affairs and Tourism.
De Wit, M.P. and Nahman, A. (2009). Costing the integrated waste management bylaw with specific
reference to airspace savings. Draft report (Phase II), De Wit Sustainable Options Pty (Ltd.),
Brackenfell.
DST (Department of Science and Technology). (2012). A National Waste RDI Roadmap for South
Africa: Phase 1 Status Quo Assessment. Skills for an Innovative Waste Sector: Core waste
management skills and implementation modalities. Department of Science and Technology:
Pretoria.
DST (Department of Science and Technology) (2013). South African Waste Sector – 2012. An analysis
of the formal private and public waste sector in South Africa. A National Waste RDI
Roadmap for South Africa: Phase 1 Status Quo Assessment. Department of Science and
Technology: Pretoria.
DTI (Department of Trade and Industry). (2013). Government Notice No. R. 543 of Government
Gazette No. 36708. Export control guidelines on the exportation of ferrous and non-ferrous
waste and scrap. 2 August 2013. Pretoria: Republic of South Africa.
EEA (European Environment Agency). (2011). Earnings, jobs and innovation: The role of recycling in a
green economy. European Environment Agency: Report no. 8/2011. Luxembourg: Office for
Official Publications of the European Union
EP (European Parliament). (2013). Report on Eco-innovation - Jobs and Growth through
environmental policy, 2012/2294(INI). Committee on the Environment, Public Health and

A National Waste Innovation Programme for South Africa: Phase 2 Waste RDI Roadmap
23 | P a g e
Food Safety. Rapporteur: Karin Kadenbach. Available at
http://www.europarl.europa.eu/sides/getDoc.do?type=REPORT&reference=A7-2013-
0333&language=EN. Accessed 18 January 2014.
ETC/SCP (European Topic Centre on Sustainable Consumption and Production). (2011). Green
economy and recycling in Europe. Working paper 5/2011. Copenhagen: European Topic
Centre on Sustainable Consumption and Production
Fiehn H. and Ball J. (2005). Background research paper: Waste. South Africa Environment Outlook.
National State of the Environment Project. Department of Environmental Affairs and
Tourism: Pretoria.
Goosey , M. (2013). The Materials Content of WEEE – Plastics. IeMRC Industrial Director, EuPC,
Brussels: 17th April 2013. Available at
http://www.lboro.ac.uk/research/iemrc/Events%20write%20up/Events%20write%20up/MT
GIeMRCBrussels170413.pdf. Accessed 20 January 2014.
GRC (The Glass Recycling Company). (2008). About the Glass Recycling Company. Available at:
http://www.theglassrecyclingcompany.co.za. Accessed 5 December 2008.
Groundwork (2007). Options for the use and disposal of waste tyres. Available at
http://www.groundwork.org.za/Cement/Options%20for%20the%20use%20and%20disposal
%20of%20waste%20tyres.pdf). Accessed 20 January 2014.
Harley, J. (2006). Cement Kilns: Groundwork Report. Analysis and write up of burning alternative
fuels in cement kilns. Pietermaritzburg: Groundwork.
Human, E. (2014). Personal Communication. CEO: South African Tyre Recycling Process Company
(SATRP). 15 January 2014.
ITAC (International Trade Administation Commission of South Africa). (2013). Price Preference
System Summary, December 2013 and January 2014. Available at:
http://www.itac.org.za/docs/Price%20Preference%20System%20Summary%20December%2
02013%20and%20January%202014%20-%20amended%2012%20Dec%202013.pdf. Accessed
20 January 2014
Kinsella, S. (2012). Paperwork: Comparing Recycled to Virgin Paper. Why Recycled Content is Crucial
for Printing & Writing Paper. Environmental Paper Network.
Lochan, R. (2014). Personal Communication. Rose Foundation. 21 January 2014.
Nahman, A. (2011). Pricing landfill externalities: Emissions and disamenity costs in Cape Town, South
Africa. Waste Management 31: 2046-2056.
PAMSA (Paper Manufacturers Association of South Africa). (2013). Paper Fact Sheet: August 2013.
Accessed 19 December 2013. Available at http://www.thepaperstory.co.za/#facts-figures/.
Accessed 20 January 2014
Plastics SA. (2013). Plastics recycling survey. 2012 update. Johannesburg: Plastics SA.
Purnell, G. (2009). National Waste Quantification and Waste Information System. Pretoria:
Department of Environmental Affairs.
Robinson, B.H. (2009). E-waste: An assessment of global production and environmental impacts.
Science of the Total Environment 408: 183–191
ROSE Foundation. (2014). Material Safety Data Sheet (MSDS): Used Lubricating Oil. Available at:
http://www.rosefoundation.org.za/docs/safetydatasheet.pdf. Accessed 22 January 2014
SAPPI. (2011). Paper and paper packaging: Cape Kraft Mill. Available at
http://www.sappi.com/regions/sa/SappiSouthernAfrica/Paper%20and%20Paper%20Packagi
ng/Pages/Cape-Kraft-Mill.aspx. Accessed 13 January 2014.

A National Waste Innovation Programme for South Africa: Phase 2 Waste RDI Roadmap
24 | P a g e
UNEP (United Nations Environment Programme). (2011). Towards a green economy: Pathways to
Sustainable Development and Poverty Eradication. United Nations Environment Program.
UNEP (United Nations Environment Programme). (2013). Guidelines for National Waste
Management Strategies: Moving from Challenges to Opportunities. United Nations
Environment Program.
Wilson, D.C., Parker, D., Cox, J., Strange, K., Willis, P., Blakey, N. and Raw, L. (2012). Business waste
prevention: A review of the evidence. Waste Management and Research 30: 17-28
WRAP (Waste and Resources Action Program). (2012). Electrical product material composition.
Oxon, UK. Available at www.wrap.org.uk/electrical

A National Waste Innovation Programme for South Africa: Phase 2 Waste RDI Roadmap
25 | P a g e
Annexure 1: Benefits of moving up the waste hierarchy
Re-introduction of resources back into the economy
The recovery of resources from waste, through recycling and recovery activities, allows for valuable
materials or energy to be re-introduced into the economy, while also reducing the costs and
externalities associated with virgin material extraction.
Recycling helps to ensure secure supplies of essential resources, and reduces the need for extracting
and refining (or importing) virgin materials. This means that both the financial costs, as well as the
externalities (social and environmental costs) associated with virgin material extraction can be
avoided. Similarly, the recovery of, for example energy, from waste (a renewable source) reduces
the need to generate energy using fossil fuels (non-renewable), thereby contributing towards energy
security and avoiding the negative environmental impacts associated with burning fossil fuels, such
as greenhouse gas emissions.
Recycling and recovery therefore contribute to resource and energy efficiency, and the decoupling
of economic development from resource use and environmental impact (EEA 2011). As such, waste
is increasingly seen as a valuable resource (UNEP 2013). Indeed, according to UNEP (2013:29),
“’Waste’ is first of all an economic concept – implicit in the word is the fact that resources are not
being used efficiently. There is an economic loss every time resources (assuming they have some
other potential use) are utilized in a way that results in being discarded as waste. Raw materials
entering a production chain and ending as waste also represent a loss of energy and water. Industrial
waste reflects inefficiencies in production processes. If resources can be saved, recovered, or used
more efficiently, there is a net economic gain.”
In the European Union (EU) recycling meets a substantial proportion of the demand for resources
such as paper and cardboard, as well as iron and steel. The EU has identified 14 critical materials,
many of them metals, which show a high supply risk and which could constrain future economic and
technological development within the region. The recovery of these materials through, for example,
the recycling of electronic and electrical equipment (WEEE), or through urban mining, is seen as a
means of securing supplies of rare metals and other critical resources (EEA 2011).
Contribution to economic growth and job creation
Recycling and recovery contribute to economic growth and job creation, and can also foster
innovation and create new business opportunities (EEA 2011, UNEP 2013).
According to a report by the European Environment Agency, recycling and recovery “create more
jobs at higher income levels than landfilling or incinerating waste” (EEA 2011:7). In other words, not
only does moving waste up the hierarchy result in a net increase in employment levels13; but the
resulting jobs are also higher paid and more ‘decent.’ In addition, “numerous opportunities exist for
eco-innovation and development of new technologies in the recycling sector, potentially creating
markets for new products and services” (EEA 2011:11). The EEA also argues that the recycling sub-
13
Net increase in employment, where job losses in landfilling are outweighed by the creation of ‘green’ jobs in recycling and recovery.

A National Waste Innovation Programme for South Africa: Phase 2 Waste RDI Roadmap
26 | P a g e
sector is becoming an increasingly significant contributor to GDP and trade in the EU. While South
Africa’s waste sector is estimated to contribute 0.51% to GDP, Australia has been able to create a
recycling industry contributing 1.2% to the country’s GDP (ACR, 2008), and a recent publication by
the European Parliament shows the European eco-innovation industry (which includes the waste
sector) to have grown to 2.5% of the EU’s GDP, during a time when other sectors have been severely
affected by the recession (EP, 2013).
In the United Kingdom (UK), a study revealed that only 11% of employment in the waste
management sector is related to disposal activities (including disposal to landfill and by incineration);
with the vast majority of employment in activities related to recycling and recovery (Figure 1-1)
(Aulakh and Thorpe 2011).
Figure 1-1: Employment by activity in the UK waste sector (adapted from: Aulakh and Thorpe
2011).
Reducing social and environmental costs
Waste recycling and recovery also reduces the social and environmental costs (externalities)
associated with landfill disposal. Externalities associated with landfill disposal include, e.g. health
hazards, odours, visual impacts, contamination of soil and water resources, emissions of greenhouse
gases, reduced land availability and value.
Whilst recycling and recovery are often perceived to be more expensive than landfilling from a
purely financial perspective, this is not necessarily the case from a ‘true cost’ or ‘full cost’
perspective, when external costs are taken into account. For example, according to UNEP (2013:30),
“good waste management provides direct economic benefits through improving human health and
the environment, including higher productivity, lower medical costs, better environmental quality and
the maintenance of ecosystem services. It is the community at large, and often its poorest members,
that reap the largest share of these benefits. By proper pricing of raw materials, water, energy and
waste management, costs can be shifted away from the poor and the general community to those
manufacturing the products or generating the waste. This is more equitable and also more effective,
as it provides an incentive to reduce waste generation.” The economic assessment of costs and
Carrying and collection
22%
Sorting and sale17%
Brokerage or dealing
15%
Processing of recyclate
17%
Composting8%
Energy recovery7%
Treatment3%
Disposal -incineration
7%
Disposal - landfill4%
Employment by ActivitySource: ekosgen 2011, Sample of 677 responses

A National Waste Innovation Programme for South Africa: Phase 2 Waste RDI Roadmap
27 | P a g e
benefits (including externalities) of different waste management options is still in its infancy in South
Africa, such that it is not yet possible to make general statements in support of one option or
another. Much work remains to be done in this area.
A National Waste Innovation Programme for South Africa: Phase 2 Waste RDI Roadmap
28 | P a g e
Annexure 2: Calculation of value per selected waste stream
The following sub-sections describe the determination of unit values for each of the recyclable
materials included in this assessment. Note that, in some cases (depending on data availability), in
addition to the unit values used in the calculation of resource values in the report; we also provide
indicative estimates of higher resource values associated with value addition further along the value
chain, to illustrate the concept of value addition (See Section 6.3), and to give an indication of the
extent to which the estimates provided in the report are conservative.
1. Municipal waste (non-recyclable portion); organic component of municipal waste, and
biomass waste from industry
In the case of the non-recyclable portion of municipal waste, the organic waste fraction within
municipal waste, and biomass waste from industry, significant recycling markets do not currently
exist, since unit values are relatively low, given limited downstream applications. Nevertheless, these
streams have Waste-to-Energy (WtE) potential, and can also be used to a certain extent in
composting and in the production of animal feed, etc. Thus, for these streams, unit values were
determined in terms of WtE potential, rather than in terms of the prices paid by recyclers. This was
done by determining how much energy (in kWh) could be obtained per tonne of each stream, and
then by applying the average price of electricity per kWh.
A report by Agama Biogas for the South African Cities Network (Austin and Gets 2009) estimates the
total electricity generation potential of solid waste conversion in six Metros in South Africa at 6,000
GWh/a (based on a projected MSW quantity of 9,906,810 tonnes of waste in these Metros in 2010);
of which 1,500 GWh/a is derived from the organic fraction (4,823,621 t/a). This implies a WtE
potential of 605.64 kWh/t of waste from general MSW, and 310.97 kWh/t from organic waste. Given
the average electricity price in South Africa for 2012/13 of 60.66 c/kWh (Eskom 2012), this works out
to a value of R367.38 per tonne for the non-recyclable portion of MSW, and R188.63 per tonne for
the organic component of municipal waste and for biomass waste from industry.
2. Paper
According to DEAT (2005), the prices paid by recyclers for waste paper ranged from R600-R1800 per
tonne (DEAT 2005 report). More recently; according to information from various collectors, recycling
companies, pulp and paper companies and paper mills; the prices paid to collectors for various types
of waste paper in South Africa range from R200 to R2,000 per tonne, depending on the grade. Based
on the data obtained from these various sources, pertaining to prices across the various grades, an
average price (paid by recyclers and paper mills to collectors) of R744.47 per tonne was calculated.
This will be used as an estimate of the unit value of paper per tonne.
Looking further along the value chain, an international packaging manufacturing company claimed
that over the period January to December 2013, the price they paid to recyclers for waste paper was
in the range of R1,000 to R1,500 per tonne. This gives an indication of the extent to which value is
added one step further along the value chain.
However, even this is an underestimate of the full potential benefits of the recycling of waste paper.
For example, another way to calculate the unit value of recycled paper is based on the use of waste

A National Waste Innovation Programme for South Africa: Phase 2 Waste RDI Roadmap
29 | P a g e
paper as a raw material in paper mills, as an alternative source of fibre to virgin wood pulp. 65% of
recovered paper in South Africa is used for this purpose (PAMSA, 2013). Paper is recyclable up to
seven times before the fibres become too short for use in new paper production (PAMSA, 2013).
According to ETC/SCP (2011:29), recycled paper “can be assumed as the equivalent product of pulp,
as an input to paper mills.” The international pulp price (6 month average from May 2013 to
November 2013) was obtained from Indexmundi (www.indexmundi.com), at R8,293 per tonne.
However, the value per ton of recycled paper is lower than the price of pulp (ETC/SCP 2011), both
because of the costs of de-inking and processing, and because of efficiency losses between the
quantity of recycled paper used in the process and the quantity of pulp that can be produced as a
result. This was reflected by determining the quantity of pulp that can be obtained per tonne of
waste paper. According to Kinsella (2012), the production of 1 tonne of Kraft pulp requires 1.4
tonnes of recovered paper, implying a 71% level of efficiency. However, according to SAPPI (2011),
its Cape Kraft Mill is able to produce 60,000 tonnes of paper a year from just 67,000 tonnes of waste
paper, implying an efficiency of 89.5%. We therefore assumed an average efficiency of 80% for
South Africa (i.e. for every tonne of waste paper, 0.8 tonnes of pulp can be produced. This gives rise
to a value of R6,634.55 per tonne of waste paper, in terms of the pulp that could potentially be
produced.
Although this value does not include the cost of de-inking and of the process to convert the material
into pulp (ETC/SCP 2011), it gives an indication of the extent to which value is added along the value
chain, and therefore serves as an important reminder that the values provided in this report are very
much minimum estimates of the full potential benefits of resource recovery.
3. Glass
In the case of glass, there is generally a relatively high difference between the unit price of waste
glass and that of glass products, since glass waste generally takes the form of glass cullet, and
requires significant further processing (ETC/SCP 2011). Unlike the case of plastics, paper and metals,
where there is a wide diversity of different types and associated prices, prices for waste glass cullet
are relatively standardised. Data from both collectors of various types, and from recycling
companies, suggests an average price paid by recyclers to collectors for waste glass of R490/tonne.
4. Plastics
In the case of plastics, “the importance of sorting and cleaning of the waste materials becomes
evident. In order to increase the value of a recyclable, all foreign material should be removed. This
is… very difficult in the case of plastics, since the separation of mixed plastics into plastic types is
technologically difficult and, thus, costly… The low price of plastic wastes, which is caused by the
limited applicability of plastic recyclables and the high cost of reprocessing, does not allow for a safe
comparison of the wastes to primary production” (ETC/SCP 2011:28-29). In turn, the low unit prices
of plastic wastes relative to the price of virgin materials result in relatively low recycling rates for
plastic (e.g. 18% in South Africa) as compared to other materials; implying a particular need for
intervention in this waste stream in order to incentivise recycling. Given the level (and costs) of
sorting and processing required to render plastic wastes suitable for manufacturing of new plastic
products, it can be expected that the difference between the lower bound and higher unit values for
plastics is relatively high.

A National Waste Innovation Programme for South Africa: Phase 2 Waste RDI Roadmap
30 | P a g e
Given the different types of plastics recycled in South Africa, each with different prices, it was
necessary to determine the composition of the plastic waste stream, in order to estimate an average
weighted price per tonne of plastic wastes. For this purpose, we used data from the 2012 Plastics SA
recycling survey (Plastics SA 2013) regarding the tonnages recovered for different plastic materials
(in 2011, excluding exports); as shown in the first five columns of Table 2.1.
Table 2.1: Composition of recovered plastics in South Africa
Type
Packaging Non-packaging
Total Proportion of total
Proportion of PE-LD, PE-HD, PP and
PET
Price paid by recyclers,
R/tonne, 2013)
PE-LD/LLD 89,493 6,359 95,852 39.01 43.30% 3 080.00
PE-HD 27,108 11,871 38,979 15.86 17.61% 2 740.00
PP 21,549 18,734 40,283 16.39 18.20% 3 230.00
PET 46,276 46,276 18.83 20.90% 3 425.00
PVC 587 16,117 16,704 6.79
PS and PS-E 1,636 1,578 3,214 1.31
ABS 550 605 1,155 0.47
Other 1,267 1967 3,234 1.32
Total 188,466 57,231 245,697 100 100 3 119.54
Average 2013 prices (paid by recyclers to collectors, per kg) for PE-LD, PE-HD and PP were obtained
from a survey of numerous recycling companies published by Plastics SA (2013). These prices roughly
corresponded with data received pertaining to the selling prices of both small buy-back centres and
large collection companies, and were therefore seen as representative (see last column of Table 2.1,
where prices have been converted to a per tonne basis). For PET, an average of R3,425 per tonne
was calculated based on information from both recyclers and collectors.
Prices for the other plastic types were not as readily available. However, given that PE-LD, PE-HD, PP
and PET make up 90% of total plastics recovery in South Africa, it was deemed sufficient to
extrapolate the data and base the valuation only on these four types. We extrapolated the tonnages
recovered of these four types (from the Plastics SA data) to the total quantity of plastics recycled in
SA (as per DEA 2012). These proportions (Table 2.1, column 6) were then used to weight the prices
(for 2013) of the four representative materials, and thereby to obtain a weighted average
representative unit value for plastic waste, calculated at R3,119.54 per tonne.
Over the same period, recyclers sold the recycled materials to downstream industries at prices
averaging R7,740.37 per tonne (more than double what they pay) for PE-LD, PE-HD and PP. This
gives an indication of the extent to which value is added along the value chain.
However, it should be borne in mind that even this higher value is an underestimate of the full
potential benefit of the plastics that could be recovered, but rather presents the value at one step
further along the chain. Nevertheless, this is indicative of the extent to which value is added at each
stage along the chain, and therefore of the extent to which the values provided in this report are
very much a minimum estimate of the of the potential benefits of recycling to the South African
economy.

A National Waste Innovation Programme for South Africa: Phase 2 Waste RDI Roadmap
31 | P a g e
5. Metals
Relative to other waste types, metals such as iron, steel and aluminium are characterised by a “high
unit price of scrap, which is comparable to the price of virgin material, since the scrap does not
require particular processing before it can be used in metal production” (ETC/SCP 2011: 29-30).
These high unit prices relative to the price of virgin materials explains the relatively high recycling
rate for metals (e.g. 80% in South Africa) compared to other waste types. In addition, in South Africa,
collectors of used beverage cans, for example, are paid a flat rate, ensuring a stable supply (DEAT
2005).
Prices for scrap metals vary significantly between different types of metals, particularly between
ferrous (iron and steel) and non-ferrous metals. According to the Metal Recyclers Association (in DEA
2012), 86% (2,640,000 t/yr) of total metal scrap recycled in South Africa is ferrous scrap (iron, steel
etc.) and the remaining 14% (420,000 t/yr) is non-ferrous scrap (aluminium, copper etc.).
Unfortunately, a more detailed breakdown of specific metals within these categories could not be
ascertained. It was therefore necessary to determine a weighted average unit value for metals based
simply on the breakdown between ferrous and non-ferrous metals recycled in South Africa.
As a unit value to be used in the analysis, we use prices paid by recyclers to collectors for scrap
metals. Most collectors provided prices for used beverage cans (UBCs) only; however, UBCs make up
only a small proportion of total metal recovery and recycling in South Africa; where the bulk of scrap
metal arises from industrial sources rather than packaging. We were able to obtain prices from a
large waste management company regarding the average prices paid by recyclers for ferrous and
non-ferrous scrap metals more generally (rather than simply for UBCs). Based on this information,
prices paid are in the range of R1,500 per tonne for ferrous scrap, and R7,000 per tonne for non-
ferrous scrap (mainly aluminium). Taking into account the proportions of ferrous (86%) and non-
ferrous (14%) scrap recycled in South Africa referred to above, this results in a weighted average unit
value of R2,270 per tonne, which will be used as an estimate of the unit value of scrap metals.
To give an indication of the extent to which this value is conservative, we can look at international
scrap metal spot trading prices; since a relatively large proportion of scrap metal in South Africa is
destined for export, and local prices are generally influenced by international market prices.
However, according to a new set of scrap metal export guidelines (Department of Trade and Industry
(DTI) 2013); scrap metals intended for export must first be offered to domestic users (e.g. foundries,
mills and smelters) at 20% lower than international prices. For December 2013 and January 2014,
prices have effectively been fixed by a price preference system managed by the International Trade
Administration Commission of South Africa (ITAC 2013). These prices were therefore used to
determine a higher estimate of the unit value for scrap metal in South Africa. An average unit value
for ferrous metals was calculated based on the average prices of various grades of steel and iron
scrap; while an average for non-ferrous metals was calculated based on the average prices of various
grades of aluminium, copper, brass, bronze, zinc, lead and tin. In this way, a unit value for ferrous
metals was calculated at R3,029.35 per tonne, and for non-ferrous metals at R25,145.83 per tonne.
This works out to a weighted average of R6125.66 per tonne, based on the proportions of ferrous
and non-ferrous metals recycled in South Africa (86% ferrous scrap and 14% non-ferrous scrap).

A National Waste Innovation Programme for South Africa: Phase 2 Waste RDI Roadmap
32 | P a g e
It is worth noting that, as expected, these prices are lower than international spot prices against
which scrap metal prices in South Africa are benchmarked. For example, average international spot
prices over November-December 2013 for ferrous scrap according to the Metal Bulletin
(http://www.metalbulletin.com/My-price-book.html) were R4,199 per tonne; and R45,556 per
tonne for non-ferrous metals (based on aluminium, copper and brass and non-ferrous alloys only);
giving a weighted average of R9,989 per tonne. However, given both the 20% discount for local
recyclers, as well as the costs associated with transport etc., local prices can be expected to be
somewhat lower than the international prices. The preference prices from ITAC can therefore be
seen as indicative of the prices received for scrap metals locally, and are therefore used as a higher
estimate of the unit values for metals.
It is also worth noting that the resulting values based on a price of R6,125.66 per tonne correspond
with data reported by the Metals Recycling Association (in Botes 2012), which shows that between
2.5 – 3 million tonnes of scrap metal is recycled every year in South Africa, and that the scrap metal
industry is worth between R15 million and R20 million a year (employing 15,000 people in the formal
sector and approximately 440,000 people in the informal sector). As mentioned above, high
recycling rates for metals relative to other materials are attributed to the relatively high value per
tonne of metal compared to other recyclable materials (Botes 2012).
6. Waste electric and electronic equipment (WEEE)
An important constraint to the recovery of rare and precious metals from WEEE is the fact that
electronic and electrical products tend to be composed of a large number of different materials,
each of which is only present in small quantities, but across a multitude of applications and products
(‘dissipative use’) (EEA 2011). As such, in the case of WEEE, “a comparison with a resource has no
meaning at all, since the raw material for electronic and electrical equipment production consists
mostly of metal, glass and plastic. A comparison of the WEEE economy with these raw materials
would be invalid since the added value of the processing of these materials into complex electric and
electronic equipment by far supersedes the cost of the raw materials.” (ETC/SCP 2011:28-29).
Furthermore, recovery of such metals therefore requires the development of specialised recycling
infrastructure. As such, global recycling rates of rare metals for which demand is projected to
increase in future (due to their use in emerging technologies such as renewable energy and ICT) are
low – e.g. 1% for gallium, germanium, indium, neodymium and tantalum, and 15% for ruthenium.
For cobalt, palladium and platinum, recycling rates are higher (60-70%). These factors explain the
relatively low recycling rate of WEEE in South Africa (11%).
Prices paid by recyclers to collectors for WEEE could only be obtained from one waste management
company, who indicated a price of R1,000/tonne across all types of WEEE. This will be used as an
estimate of the unit value per tonne of WEEE.
To give an indication of the extent to which this unit value is conservative, we attempt to derive a
weighted average value per tonne of WEEE, based on the values of the contents of which WEEE is
composed. According to DEA (2012), typical material fractions in WEEE are as follows:
Printed circuit boards (2%)
CRT & LCD screens (12%)
Cables (2%)

A National Waste Innovation Programme for South Africa: Phase 2 Waste RDI Roadmap
33 | P a g e
Metal-plastic mixture (5%)
Plastics (15%)
Metals (60%)
Pollutants (3%)
Others (1%).
In the case of metals and plastics, it is necessary to obtain a more refined breakdown, given the
variation in prices between different types of metals and plastics respectively.
The metals fraction within WEEE (60%) consists of a range of different metals, including ferrous,
non-ferrous and precious metals, with a wide variation in prices. According to a study in the UK
(WRAP, 2012), the average concentration of precious metals in the WEEE stream is estimated at
30g/tonne (0.003%), of which
21.41g/tonne consists of silver,
6.45g/tonne gold and
2.14g/tonne Platinum Group Metals (PGMs), such as palladium and platinum.
These precious metals are typically found in ICT equipment, such as printed circuit boards. In
comparison, these materials are commercially mined at concentrations of 850g/tonne (silver),
5g/tonne (gold) and <2g/tonne (PGMs). Other metals found in WEEE include lead, aluminium, iron
and copper; as well as metals such as cadmium, antimony, tantalum, gallium and indium. Based on
WRAP (2012) and Robinson (2009), the concentrations of various metals in WEEE can be estimated
as in Table 2.2.
Table 2.2: Assumed concentration of various metals in WEEE based on WRAP (2012) and Robinson
(2009)
Metal Typical concentration
in WEEE (%)
Silver 0.002141
Gold 0.000645
PGMs 0.000214
Antimony 0.17
Cadmium 0.018
Copper 4.1
Lead 0.29
Tin 0.24
Zinc 0.51
Aluminium 13.7425
Iron 36.415
Total 55.49
For the other metals, reliable information regarding typical concentrations could not be obtained.
Nevertheless, since the typical total metal fraction in WEEE is 60%, the metals listed in the table
(with a total concentration in WEEE of 55.49%) can be seen as representative.

A National Waste Innovation Programme for South Africa: Phase 2 Waste RDI Roadmap
34 | P a g e
Unit values for most of the metals in Table 2.2 were calculated based on the relevant scrap metal
prices, as an average for each metal across the various grades; as per ITAC (2013) – see above. For
precious metals, we used the scrap metal price calculator at http://www.silverrecyclers.com, which
calculates scrap prices at various purities based on current spot prices. To account for the costs
associated with extracting and refining precious metals from WEEE, we assumed the lowest possible
levels of purity (i.e. 0.292 (7 karats) for gold, 0.925 for silver, and 0.800 for PGMs). For PGMs, we
took an average across the scrap prices for platinum and palladium, since prices of the former are
roughly double that of the latter, and no reliable indication could be found of the breakdown
specifically of platinum, palladium and other PGM’s within WEEE.
Similarly, the plastics fraction within WEEE (15% of total WEEE) consists of a range of different
polymers, including PE, PP, PS, PVC, PET, etc (Goosey 2013). However, no reliable information could
be found regarding the breakdown of the plastic content of WEEE into different types of plastics. We
therefore used a weighted average unit value for general plastic waste as determined above as an
estimate of the value per tonne of the plastic content within WEEE. Since we are here focused on
establishing an indicative higher value estimate, we used the higher estimate of the weighted
average unit value of plastic waste (associated with the prices at which recyclers sell recycled plastic
to downstream industries), namely R7,740.37 per tonne.
Finally, CRT and LCD screens are composed largely of glass. For example, according to Goosey
(2013), 83% of LCD screens is composed of glass. Assuming a similar proportion for CRT screens, and
considering that CRT and LCD screens typically make up 12% of WEEE (see above), it can be assumed
that glass makes up approximately 10% (83% of 12%) of WEEE. Again, we use the average unit value
of glass (R490/tonne) calculated above as an estimate of the unit value of the glass content in WEEE.
Taking into account the material fractions and unit values of the various types of metals, plastics and
glass found in WEEE, an indicative higher weighted average unit value per tonne of WEEE can be
calculated (based only on the metal, plastic and glass content for which unit values could be
estimated, representing approximately 80% of the total weight of WEEE), as in Table 2.3.
Table 2.3: Composition and unit values of potentially recoverable metals, plastics and glass in WEEE
g/t WEEE % of total WEE Price [R/T] Unit value [R/T] of WEEE
Silver 21.41 0.002141% 6 263 164.25 134.09
Gold 6.45 0.000645% 124 289 678.11 801.67
PGMs 2.14 0.000214% 297 618 239.52 636.90
Antimony 1700 0.170000% 24 740.00 42.06
Cadmium 180 0.018000% 7 560.00 1.36
Copper 41000 4.100000% 44 067.27 1 806.76
Lead 2900 0.290000% 9 918.23 28.76
Tin 2400 0.240000% 139 858.65 335.66
Zinc 5100 0.510000% 10 237.24 52.21
Aluminium 13.74% 9 251.46 1 271.38
Iron 36.42% 3 029.35 1 103.14
TOTAL METALS 55.49%
PLASTICS 15.00% 7 740.37 1 161.06
GLASS 9.96% 490.00 48.80
Total 80.45% 7 423.86

A National Waste Innovation Programme for South Africa: Phase 2 Waste RDI Roadmap
35 | P a g e
In this way, an indicative higher estimate of the weighted average unit value of one tonne of WEEE
(based on potentially recoverable metals, plastics and glass, accounting for 80% of the total weight
of WEEE) can be calculated at R7,423.86 per tonne (see Table 2.3). While this value seems high, it is
in fact low relative to figures from WRAP (2012), which estimated a replacement value of the
materials in an average tonne of WEEE items at approximately £825, equivalent to almost R15,000
per tonne at current exchange rates.
7. Tyres
Information obtained from the recycling sector showed that waste tyres can be recycled to produce
rubber crumb, which can be sold for approximately R3,000 per tonne to road builders. However,
collection and transport of waste tyres from tyre dealers costs between R700 and R1,900 per tonne,
while processing to produce rubber crumb costs another R2,000 per tonne, excluding overhead
costs. It is therefore clear that recycling of tyres to produce rubber crumb is currently not
economically viable. The new tyre levy of R2.30/kg may partially address this. In the meantime, a
more viable option may simply be to recover energy by using tyres in cement kilns or brick making
plants, where waste tyres can replace up to 15% of the coal currently being used to produce energy
(Groundwork 2014). With a calorific value similar to that of coal (Harley 2006), the WtE potential of
tyres is relatively high, and has been valued at R367 per tonne. This figure will therefore be used as
an indicative unit value for waste tyres.
8. Slag
According to Purnell (2009), approximately 510,000,000 tonnes of mining waste is generated per
year in South Africa. This mining waste consists of a variety of materials, some of which may have
significant recycling potential. However, owing to a lack of data regarding the composition of this
waste stream, we focus here specifically on the more limited category ‘slag’ used in DEA (2012),
quantified at 5,370,968 tonnes per year. This category consists of ferrous metal slag from steel,
manganese, chrome, vanadium etc. processing, and non-ferrous metal slag from aluminium etc.
processing (DEA 2012). This slag (aggregate) can be used as a building material in the construction of
roads and buildings. According to the Aggregate and Sand Producers Association of South Africa
(ASPASA 2014), for many purposes, recycled aggregate can substitute for primary aggregates.
However, prices for recycled aggregate are likely to be lower than those for virgin aggregates
(Purnell 2009). The CSIR’s Built Environment Unit estimates a price for recycled aggregate in the
construction industry at between R170 per R180 per tonne. A unit value of R175 per tonne will
therefore be used in this study.
9. Ash
Ash produced by Eskom’s power plants, approximately 90% of which is in the form of “fly ash”
(Purnell 2009), can potentially be sold and used in the cement industry. Eskom sells this ash at low
prices (on a sliding scale ranging between R0 and R5 per tonne, depending on whether the ash is
collected on-site or off-site, and by Eskom or by the users themselves), in order to make it attractive
to customers. Taking a straight average over the range of prices yields a unit value of R3 per tonne,
which will be used in our calculations.

A National Waste Innovation Programme for South Africa: Phase 2 Waste RDI Roadmap
36 | P a g e
10. Construction and demolition waste
Construction and demolition waste consists of a range of materials, including concrete, bricks,
masonry, ceramics, metals, plastic, paper, cardboard, gypsum drywall, timber, insulation, asphalt,
glass, carpeting, roofing, and excavation materials (DEA 2012). A study in the Western Cape
estimated that concrete and masonry together make up about 33.3% of this waste, followed by
wood (25%) and drywall (12.5%) (Viljoen 2010, in DEA 2012). Some of this waste can be crushed to
produce recycled aggregate, although currently the majority is used as backfill in construction. For
slag from mineral processing (see above), we used a unit value of R175 per tonne for aggregate.
However, since not all of the construction and demolition waste can be used to produce recycled
aggregate, and since the current practice is for construction and demolition waste to be used simply
as backfill (which can be assumed to have a lower value as compare to the value of aggregate), we
will assume a unit value equal to half of the unit value for aggregate, i.e. R87.50 per tonne.
11. Waste oils
Information from the recycling sector revealed that a value of R2.50 per litre can be used for waste
oil. Based on an assumed density of 0.9 kg/L (in the case of used lubricating oil) (ROSE Foundation
2014), this works out to a unit value of R2,778 per tonne.
Related Documents