(This is a sample cover image for this issue. The actual cover is not yet available at this time.) This article appeared in a journal published by Elsevier. The attached copy is furnished to the author for internal non-commercial research and education use, including for instruction at the authors institution and sharing with colleagues. Other uses, including reproduction and distribution, or selling or licensing copies, or posting to personal, institutional or third party websites are prohibited. In most cases authors are permitted to post their version of the article (e.g. in Word or Tex form) to their personal website or institutional repository. Authors requiring further information regarding Elsevier’s archiving and manuscript policies are encouraged to visit: http://www.elsevier.com/copyright

Welcome message from author
This document is posted to help you gain knowledge. Please leave a comment to let me know what you think about it! Share it to your friends and learn new things together.
Transcript

(This is a sample cover image for this issue. The actual cover is not yet available at this time.)
This article appeared in a journal published by Elsevier. The attachedcopy is furnished to the author for internal non-commercial researchand education use, including for instruction at the authors institution
and sharing with colleagues.
Other uses, including reproduction and distribution, or selling orlicensing copies, or posting to personal, institutional or third party
websites are prohibited.
In most cases authors are permitted to post their version of thearticle (e.g. in Word or Tex form) to their personal website orinstitutional repository. Authors requiring further information
regarding Elsevier’s archiving and manuscript policies areencouraged to visit:
http://www.elsevier.com/copyright

Author's personal copy
A multi-objective optimization strategy for energy plants in Italy
Federica Cucchiella ⁎, Idiano D'Adamo, Massimo GastaldiDepartment of Industrial and Information Engineering and Economics, Faculty of Engineering, University of L'Aquila, Via Giovanni Gronchi 18, Zona Industriale Pile, 67100 Aquila, Italy
H I G H L I G H T S
► A greater protection of the environment and human health is nowadays relevant.► An integrated management system for the reduction of waste production can be useful.► The analysis of the Italian situation highlights a strong use of landfills.► A solution is proposed for the drastic reduction of this trend.► Both environmental and economic benefits, of our proposal, are quantified.
a b s t r a c ta r t i c l e i n f o
Article history:Received 7 August 2012Received in revised form 3 November 2012Accepted 3 November 2012Available online xxxx
Keywords:Energy recoveryWaste ValorisationFinancial Net Present ValueExternal Net Benefits
In recent years, Europe has promoted a series of waste regulations to achieve greater protection of the environ-ment. This objective can be obtained by adopting an integrated management system for the reduction of wasteproduction and developing systems for waste sorting, energy recovery and waste recycling. Such interventionsthat find their justification in an environmental perspective must be also sustainable from an economic perspec-tive. An analysis of the Italian situation highlights a dependency on landfills; this phenomenonmust be reducedto identify actions aimed at safeguarding and protecting the environment. The aim of this paper is to analyse theeconomic and environmental benefits from diverting waste from landfills towards energy recovery in twentyItalian regions.
© 2012 Elsevier B.V. All rights reserved.
1. Introduction
Wastemanagement plays a central role in the environmental policy ofthe European Union (EU) in both the reduction of greenhouse gas emis-sions and the development of sustainable patterns of consumption andproduction. Policies aimed at improving energy efficiency and developingrenewable sources enable the integration of economic and environmentalgoals (Calabrese et al., 2005; Cucchiella and D'Adamo, 2012b; Gold et al.,2010; Koh et al., 2012). The presence ofmature and profitable energy sec-tors, such as those associated with the use of fossil fuels, determines thekey role of State incentives to promote green energy production(Cucchiella andD'Adamo, 2012a;Mendonca et al., 2010).When assessingthe UE-27 situation, the European Environment Agency (2011) revealedthe following:
• a growth of waste volume; the amount of municipal solid waste(MSW) in 2020 will increase by 25% compared to 2005. This trendemphasises the necessity to intensify the efforts aimed at the reduc-tion of waste.
• an increase in solutions aimed at treating and recycling waste com-pared to a reduced use of landfills; in 2005, 46% was sent to landfills;this value was reduced to 39% in 2010 and is projected to be 34% in2020. In absolute terms, recycled kg increased more than incineratedkg.
• net emissions of greenhouse gases produced from waste managementare expected to decrease from a maximum level of approximately55 million t of equivalent CO2 per year in 1990 to 10 million t of equiv-alent CO2 in 2020; 75% of avoided emissions will be connected torecycling and 25% to incineration.
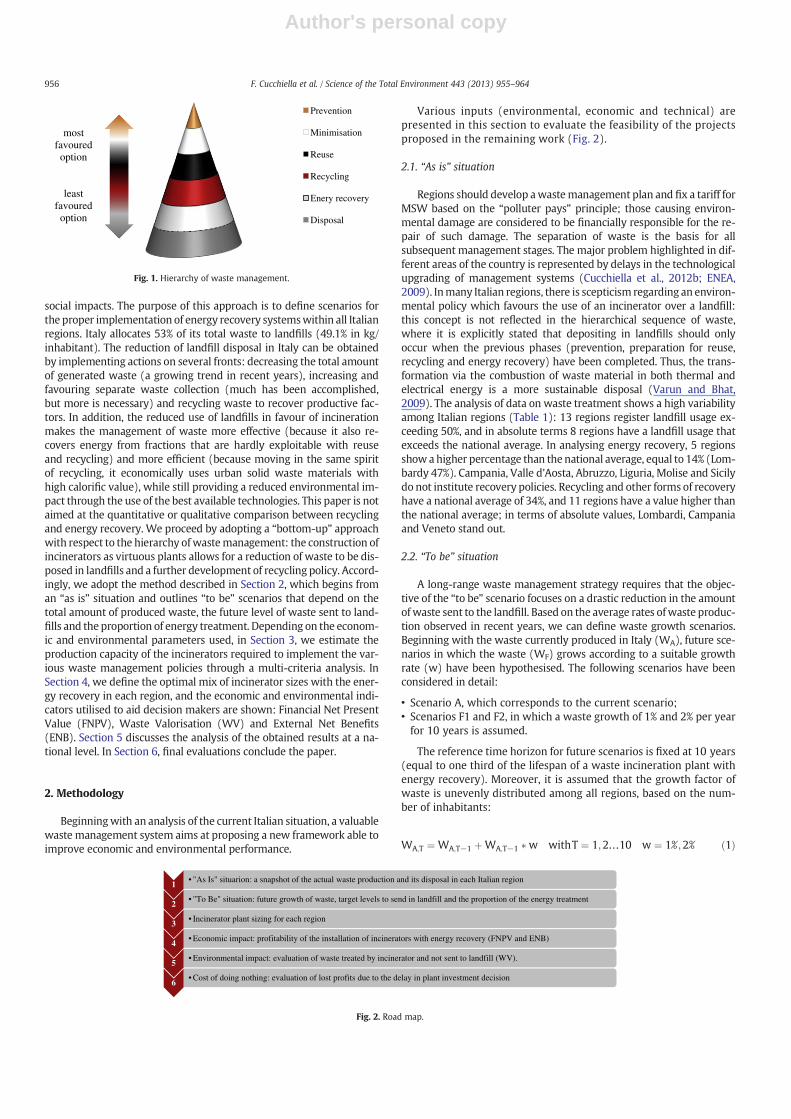
The EU waste hierarchy defines the priorities in waste management(Fig. 1); it gives preference to waste prevention andminimisation, thento reuse and recycling, then to energy recovery and finally to disposal(landfill). The primary focus of the strategy for preventing waste pro-duction is reducing the environmental impact of waste and of productsthat will becomewaste. The strategy places particular emphasis on bio-degradable and food waste that must be redirected for disposal usingmethods other than landfills. However, this strategy does not indicatespecifications on a chosen method—a situation which has led mostMember States to opt for incinerators.
This research aims to select the correct size and location of inciner-ators and to evaluate their economic, financial, environmental and
Science of the Total Environment 443 (2013) 955–964
⁎ Corresponding author.E-mail addresses: [email protected] (F. Cucchiella),
[email protected] (I. D'Adamo), [email protected] (M. Gastaldi).
0048-9697/$ – see front matter © 2012 Elsevier B.V. All rights reserved.http://dx.doi.org/10.1016/j.scitotenv.2012.11.008
Contents lists available at SciVerse ScienceDirect
Science of the Total Environment
j ourna l homepage: www.e lsev ie r .com/ locate /sc i totenv
Author's personal copy
social impacts. The purpose of this approach is to define scenarios forthe proper implementation of energy recovery systemswithin all Italianregions. Italy allocates 53% of its total waste to landfills (49.1% in kg/inhabitant). The reduction of landfill disposal in Italy can be obtainedby implementing actions on several fronts: decreasing the total amountof generated waste (a growing trend in recent years), increasing andfavouring separate waste collection (much has been accomplished,but more is necessary) and recycling waste to recover productive fac-tors. In addition, the reduced use of landfills in favour of incinerationmakes the management of waste more effective (because it also re-covers energy from fractions that are hardly exploitable with reuseand recycling) and more efficient (because moving in the same spiritof recycling, it economically uses urban solid waste materials withhigh calorific value), while still providing a reduced environmental im-pact through the use of the best available technologies. This paper is notaimed at the quantitative or qualitative comparison between recyclingand energy recovery. We proceed by adopting a “bottom-up” approachwith respect to the hierarchy ofwastemanagement: the construction ofincinerators as virtuous plants allows for a reduction of waste to be dis-posed in landfills and a further development of recycling policy. Accord-ingly, we adopt the method described in Section 2, which begins froman “as is” situation and outlines “to be” scenarios that depend on thetotal amount of produced waste, the future level of waste sent to land-fills and the proportion of energy treatment. Depending on the econom-ic and environmental parameters used, in Section 3, we estimate theproduction capacity of the incinerators required to implement the var-ious waste management policies through a multi-criteria analysis. InSection 4, we define the optimal mix of incinerator sizes with the ener-gy recovery in each region, and the economic and environmental indi-cators utilised to aid decision makers are shown: Financial Net PresentValue (FNPV), Waste Valorisation (WV) and External Net Benefits(ENB). Section 5 discusses the analysis of the obtained results at a na-tional level. In Section 6, final evaluations conclude the paper.
2. Methodology
Beginningwith an analysis of the current Italian situation, a valuablewaste management system aims at proposing a new framework able toimprove economic and environmental performance.
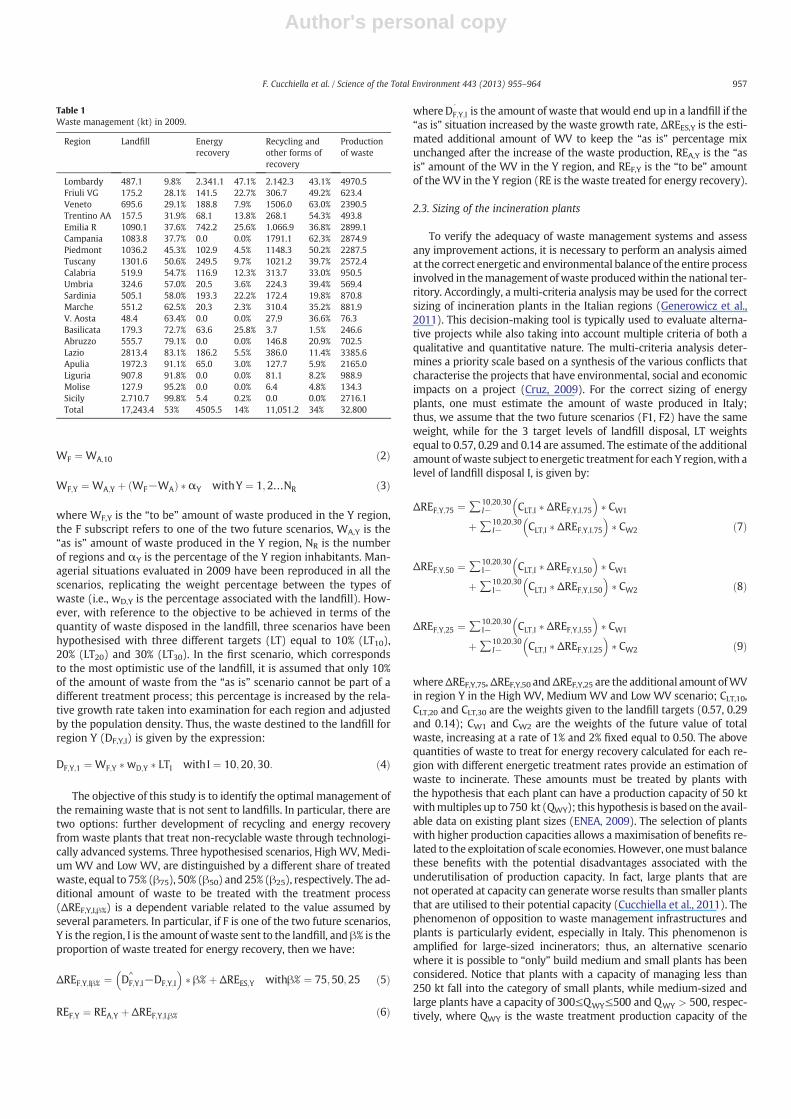
Various inputs (environmental, economic and technical) arepresented in this section to evaluate the feasibility of the projectsproposed in the remaining work (Fig. 2).
2.1. “As is” situation
Regions should develop awastemanagement plan and fix a tariff forMSW based on the “polluter pays” principle; those causing environ-mental damage are considered to be financially responsible for the re-pair of such damage. The separation of waste is the basis for allsubsequent management stages. The major problem highlighted in dif-ferent areas of the country is represented by delays in the technologicalupgrading of management systems (Cucchiella et al., 2012b; ENEA,2009). Inmany Italian regions, there is scepticism regarding an environ-mental policy which favours the use of an incinerator over a landfill:this concept is not reflected in the hierarchical sequence of waste,where it is explicitly stated that depositing in landfills should onlyoccur when the previous phases (prevention, preparation for reuse,recycling and energy recovery) have been completed. Thus, the trans-formation via the combustion of waste material in both thermal andelectrical energy is a more sustainable disposal (Varun and Bhat,2009). The analysis of data on waste treatment shows a high variabilityamong Italian regions (Table 1): 13 regions register landfill usage ex-ceeding 50%, and in absolute terms 8 regions have a landfill usage thatexceeds the national average. In analysing energy recovery, 5 regionsshow ahigher percentage than the national average, equal to 14% (Lom-bardy 47%). Campania, Valle d'Aosta, Abruzzo, Liguria, Molise and Sicilydo not institute recovery policies. Recycling and other forms of recoveryhave a national average of 34%, and 11 regions have a value higher thanthe national average; in terms of absolute values, Lombardi, Campaniaand Veneto stand out.
2.2. “To be” situation
A long-range waste management strategy requires that the objec-tive of the “to be” scenario focuses on a drastic reduction in the amountofwaste sent to the landfill. Based on the average rates ofwaste produc-tion observed in recent years, we can define waste growth scenarios.Beginning with the waste currently produced in Italy (WA), future sce-narios in which the waste (WF) grows according to a suitable growthrate (w) have been hypothesised. The following scenarios have beenconsidered in detail:
• Scenario A, which corresponds to the current scenario;• Scenarios F1 and F2, in which a waste growth of 1% and 2% per yearfor 10 years is assumed.
The reference time horizon for future scenarios is fixed at 10 years(equal to one third of the lifespan of a waste incineration plant withenergy recovery). Moreover, it is assumed that the growth factor ofwaste is unevenly distributed among all regions, based on the num-ber of inhabitants:
WA;T ¼ WA;T−1 þWA;T−1 �w withT ¼ 1;2…10 w ¼ 1% ;2% ð1Þ
Prevention
Minimisation
Reuse
Recycling
Enery recovery
Disposal
most favoured option
least favoured option
Fig. 1. Hierarchy of waste management.
1• "As Is" situarion: a snapshot of the actual waste production and its disposal in each Italian region
2• "To Be" situation: future growth of waste, target levels to send in landfill and the proportion of the energy treatment
3• Incinerator plant sizing for each region
4• Economic impact: profitability of the installation of incinerators with energy recovery (FNPV and ENB)
5• Environmental impact: evaluation of waste treated by incinerator and not sent to landfill (WV).
6• Cost of doing nothing: evaluation of lost profits due to the delay in plant investment decision
Fig. 2. Road map.
956 F. Cucchiella et al. / Science of the Total Environment 443 (2013) 955–964
Author's personal copy
WF ¼ WA;10 ð2Þ
WF;Y ¼ WA;Y þ WF−WAð Þ �αY withY ¼ 1;2…NR ð3Þ
where WF,Y is the “to be” amount of waste produced in the Y region,the F subscript refers to one of the two future scenarios, WA,Y is the“as is” amount of waste produced in the Y region, NR is the numberof regions and αY is the percentage of the Y region inhabitants. Man-agerial situations evaluated in 2009 have been reproduced in all thescenarios, replicating the weight percentage between the types ofwaste (i.e., wD,Y is the percentage associated with the landfill). How-ever, with reference to the objective to be achieved in terms of thequantity of waste disposed in the landfill, three scenarios have beenhypothesised with three different targets (LT) equal to 10% (LT10),20% (LT20) and 30% (LT30). In the first scenario, which correspondsto the most optimistic use of the landfill, it is assumed that only 10%of the amount of waste from the “as is” scenario cannot be part of adifferent treatment process; this percentage is increased by the rela-tive growth rate taken into examination for each region and adjustedby the population density. Thus, the waste destined to the landfill forregion Y (DF,Y,I) is given by the expression:
DF;Y;1 ¼ WF;Y �wD;Y � LTI withI ¼ 10;20;30: ð4Þ
The objective of this study is to identify the optimal management ofthe remaining waste that is not sent to landfills. In particular, there aretwo options: further development of recycling and energy recoveryfrom waste plants that treat non-recyclable waste through technologi-cally advanced systems. Three hypothesised scenarios, HighWV, Medi-um WV and Low WV, are distinguished by a different share of treatedwaste, equal to 75% (β75), 50% (β50) and 25% (β25), respectively. The ad-ditional amount of waste to be treated with the treatment process(ΔREF,Y,I,β%) is a dependent variable related to the value assumed byseveral parameters. In particular, if F is one of the two future scenarios,Y is the region, I is the amount of waste sent to the landfill, and β% is theproportion of waste treated for energy recovery, then we have:
ΔREF;Y;Iβ% ¼ D^F;Y;I−DF;Y;I
� �� β% þ ΔREES;Y withβ% ¼ 75;50;25 ð5Þ
REF;Y ¼ REA;Y þ ΔREF;Y;I;β% ð6Þ
whereD^F;Y;I is the amount of waste that would end up in a landfill if the
“as is” situation increased by the waste growth rate, ΔREES,Y is the esti-mated additional amount of WV to keep the “as is” percentage mixunchanged after the increase of the waste production, REA,Y is the “asis” amount of the WV in the Y region, and REF,Y is the “to be” amountof theWV in the Y region (RE is the waste treated for energy recovery).
2.3. Sizing of the incineration plants
To verify the adequacy of waste management systems and assessany improvement actions, it is necessary to perform an analysis aimedat the correct energetic and environmental balance of the entire processinvolved in themanagement of waste producedwithin the national ter-ritory. Accordingly, a multi-criteria analysis may be used for the correctsizing of incineration plants in the Italian regions (Generowicz et al.,2011). This decision-making tool is typically used to evaluate alterna-tive projects while also taking into account multiple criteria of both aqualitative and quantitative nature. The multi-criteria analysis deter-mines a priority scale based on a synthesis of the various conflicts thatcharacterise the projects that have environmental, social and economicimpacts on a project (Cruz, 2009). For the correct sizing of energyplants, one must estimate the amount of waste produced in Italy;thus, we assume that the two future scenarios (F1, F2) have the sameweight, while for the 3 target levels of landfill disposal, LT weightsequal to 0.57, 0.29 and 0.14 are assumed. The estimate of the additionalamount ofwaste subject to energetic treatment for each Y region,with alevel of landfill disposal I, is given by:
ΔREF;Y;75 ¼ ∑10;20;30I− CLT;I � ΔREF;Y;I;75
� �� CW1
þ∑10;20;30I− CLT;I � ΔREF;Y;I;75
� �� CW2 ð7Þ
ΔREF;Y;50 ¼ ∑10;20;30I− CLT;I � ΔREF;Y;I;50
� �� CW1
þ∑10;20;30I− CLT;I � ΔREF;Y;I;50
� �� CW2 ð8Þ
ΔREF;Y;25 ¼ ∑10;20;30I− CLT;I � ΔREF;Y;I;55
� �� CW1
þ∑10;20;30I− CLT;I � ΔREF;Y;I;25
� �� CW2 ð9Þ
whereΔREF,Y,75,ΔREF,Y,50 andΔREF,Y,25 are the additional amount ofWVin region Y in the High WV, Medium WV and Low WV scenario; CLT,10,CLT,20 and CLT,30 are the weights given to the landfill targets (0.57, 0.29and 0.14); CW1 and CW2 are the weights of the future value of totalwaste, increasing at a rate of 1% and 2% fixed equal to 0.50. The abovequantities of waste to treat for energy recovery calculated for each re-gion with different energetic treatment rates provide an estimation ofwaste to incinerate. These amounts must be treated by plants withthe hypothesis that each plant can have a production capacity of 50 ktwithmultiples up to 750 kt (QWY); this hypothesis is based on the avail-able data on existing plant sizes (ENEA, 2009). The selection of plantswith higher production capacities allows a maximisation of benefits re-lated to the exploitation of scale economies. However, onemust balancethese benefits with the potential disadvantages associated with theunderutilisation of production capacity. In fact, large plants that arenot operated at capacity can generate worse results than smaller plantsthat are utilised to their potential capacity (Cucchiella et al., 2011). Thephenomenon of opposition to waste management infrastructures andplants is particularly evident, especially in Italy. This phenomenon isamplified for large-sized incinerators; thus, an alternative scenariowhere it is possible to “only” build medium and small plants has beenconsidered. Notice that plants with a capacity of managing less than250 kt fall into the category of small plants, while medium-sized andlarge plants have a capacity of 300≤QWY≤500 and QWY > 500, respec-tively, where QWY is the waste treatment production capacity of the
Table 1Waste management (kt) in 2009.
Region Landfill Energyrecovery
Recycling andother forms ofrecovery
Productionof waste
Lombardy 487.1 9.8% 2.341.1 47.1% 2.142.3 43.1% 4970.5Friuli VG 175.2 28.1% 141.5 22.7% 306.7 49.2% 623.4Veneto 695.6 29.1% 188.8 7.9% 1506.0 63.0% 2390.5Trentino AA 157.5 31.9% 68.1 13.8% 268.1 54.3% 493.8Emilia R 1090.1 37.6% 742.2 25.6% 1.066.9 36.8% 2899.1Campania 1083.8 37.7% 0.0 0.0% 1791.1 62.3% 2874.9Piedmont 1036.2 45.3% 102.9 4.5% 1148.3 50.2% 2287.5Tuscany 1301.6 50.6% 249.5 9.7% 1021.2 39.7% 2572.4Calabria 519.9 54.7% 116.9 12.3% 313.7 33.0% 950.5Umbria 324.6 57.0% 20.5 3.6% 224.3 39.4% 569.4Sardinia 505.1 58.0% 193.3 22.2% 172.4 19.8% 870.8Marche 551.2 62.5% 20.3 2.3% 310.4 35.2% 881.9V. Aosta 48.4 63.4% 0.0 0.0% 27.9 36.6% 76.3Basilicata 179.3 72.7% 63.6 25.8% 3.7 1.5% 246.6Abruzzo 555.7 79.1% 0.0 0.0% 146.8 20.9% 702.5Lazio 2813.4 83.1% 186.2 5.5% 386.0 11.4% 3385.6Apulia 1972.3 91.1% 65.0 3.0% 127.7 5.9% 2165.0Liguria 907.8 91.8% 0.0 0.0% 81.1 8.2% 988.9Molise 127.9 95.2% 0.0 0.0% 6.4 4.8% 134.3Sicily 2.710.7 99.8% 5.4 0.2% 0.0 0.0% 2716.1Total 17,243.4 53% 4505.5 14% 11,051.2 34% 32.800
957F. Cucchiella et al. / Science of the Total Environment 443 (2013) 955–964

Author's personal copy
single plants. Thus, different scenarios have been analysed for each re-gion that depends on the following:
• the proportion of treated waste: there are three options; High WV(with β=75%), Medium WV (with β=50%), Low WV (with β=25%);
• the presence or absence of a constraint on the plant productioncapacity:‡ “Normal” scenario where it is possible to build plants of any size;‡ “Alternative” scenario where it is possible to build plants thathave a maximum production capacity of 500 kt.
To verify the sustainability of the construction of an incinerator, threedifferent aspects – economic, environmental and those connected toinaction (do nothing) – have been considered.
2.4. The indicators for the economic impact
Beginning with the information and the assessments contained inthe previous sections, one must identify the indicators that permit theproper choices regarding the correct location and sizing of incineratorson national territory. Financial aspects can be synthesised using anFNPV that estimates the profitability of projects that can hypotheticallybe achieved in the different regions. This indicator is based on cash flowforecasts (following EU suggestions, an interest rate of 5% has been con-sidered). A recent paper (Cucchiella et al., 2011) showed a negative cor-relation between the FNPV and a single plant size in Italy (Fig. 3); thisindicator is negative for systems with treatment capacities of less than350 kt. FNPV measures the performance of the plant investment inde-pendently from its location by considering sales, operating and invest-ment costs (the residual portion of energy recovery is analysed in theoperating costs). Furthermore, critical variables of incinerator projectshave been identified in the selling price of electricity, the selling priceof thermal energy and initial investment costs. Notice that physicalwaste composition plays a relevant role in the Lower Heating Value(LHV) utilised to calculate the performance indicator (LHV is definedas the energy content released from the combustion of the organic com-ponent ofwaste in an incinerator; a growth in the LHVvalue determinesan increase in the FNPV indicator. In this paper, an average valuerecorded in the energy recovery plants localised in Italy is consideredto be equal to 10.4 MJ kg−1). In each region, when more plants are re-quired the overall FNPV is given by the sum of the single contributions.
The FNPV only considers financial sources; to translate the environ-mental advantages/disadvantages in economic terms, a numeric valueassociated with the externalities is provided. They are measured witha positive sign (external benefits) because the direct emissions pro-duced by the combustion of waste are lower than the indirect emissionscorresponding to those avoided (Riber et al., 2008). The External NetBenefits are evaluated using a unit value estimated at € 9/t (ENBU)
ENBY;β% ¼ ∑NIRE;Y
x¼1 ΔREF;Y;β%� �
x� ENBU ð10Þ
where ENBY,β% corresponds to the total net external benefits of the Y re-gion with a share of energy enhancement β% and (ΔREF,Y,β%)X is the ad-ditional amount of theWV associatedwith the generic X plant, installedin the Y region with NIRE,Y plants.
2.5. The indicators for the environmental impact
The construction of an incinerator generates a negative opinion inthe population from an environmental perspective, leading to a prefer-ence of landfills over the construction of these plants. Nevertheless,studies on the life cycle ofMSW(Damgaard et al., 2010) and the numer-ous plants already in use show that emissions released from the incin-erator are not relevant when modern technologies are used. Theenergetic recovery is regulated by Legislative Decree No. 133 — 11May 2005 and implements European Directive 2000/76/EC. The legallimits of the incinerators are as follows:
○ NOX equal to 200 mg/Nm3, equal to the limit imposed for the gen-eration of coal;
○ SO2 equal to 50 mg/Nm3, equal to one quarter of that required forbiomass;
○ CO equal to 50 mg/Nm3, equal to half of that required for biomass.
The analysis performed on the actual emissions of the Italianplants shows that they are well below legal limits.
2.6. “Do nothing” cost
The construction of publicworks is often delayed or blocked becauseof policy decisions, bureaucratic delays or lack of funds (Chen et al.,2010; Dorini et al., 2011). This non-profit scenario is an estimate ofthe “do nothing” cost (DNC). As this phenomenon is particularly acutein relation to policies of environmental recovery, onemust find an indi-cator that is suitable for its estimation. Thus, time delays (unjustifiedfrom an economic perspective) in the plant realisation are analysed.Considering a construction time (estimated in 3 years), the relativestart-up (6 months) and lifespan (30 years), the cost consequences re-lated to delays in construction for three different hypotheses (1, 2 and3 years) have been estimated by
DNCD ¼ FNPVY;β%−FNPVDY;β% ð11Þ
where DNCD are the “do nothing” costs of delaying the plant andFNPVD
Y;β% corresponds to the FNPV with a delay of D years. DNC relatedto different production capacities are reported in Table 2.
For example, if the plant has a production capacity of 400 kt and theproject is implemented with a delay of 1 year, the FNPV obtained isequal to 7.293 k€. The DNC economically quantifies this delay and isequal to 7.293 k€–7.657 k€= −364 k€. The DNC increases both withthe growth of delay and the production capacity due to the economiesof scale.
3. Sizing of the incenerators: a regional perspective
The performances of incineration plants are directly related totheir size; the further the potential of the plant is from those of largeroutput, the lower the return. As shown in Fig. 3, the Financial NetPresent Value shows a positive sign for plants with production ca-pacities of at least 350 kt. Thus, it is very important to define thetrend of waste to be treated in terms of time and initial value. Follow-ing the framework presented in the previous sections and taking into
-16840 -18298 -18485 -14986-11486 -5825
471 7657 1090323301 31123 37419
48928 58275
50kt 100kt 150kt 200kt 250kt 300kt 350kt 400kt 450kt 500kt 550kt 600kt 650kt 700kt
Fig. 3. Financial Net Present Value (k€) based on the plant treatment capacity.
958 F. Cucchiella et al. / Science of the Total Environment 443 (2013) 955–964

Author's personal copy
account the evolutionary dynamics related to the amount of waste,the following scenarios have been considered:
○ Scenario A, in which the production of waste in Italy amounts to32.800 kt;
○ Scenarios F1 and F2, in which waste growth of 1% and 2% per yearfor 10 years is assumed, giving future values of 36.232 kt and39.983 kt.
For each of the 20 regions, the quantities of waste sent to a landfill(DF,Y,I) have been estimated (Eq. (4)) with respect to the threehypothesised landfill scenarios (LT10), (LT20) and (LT30) and presentedin Table 3. Currently, Italian regulations indicate landfill disposal onlyin extreme cases and only for those materials that cannot be reused,recycled or recovered to produce energy. The landfill is the last step ofdisposal and an indispensable point of the final treatment of waste:whatever system is chosen (composting, recycling or recovery), thereis always a “waste ofwaste.”Nothing useful can be taken frommaterialsif they are placed in landfills, and these materials can also become dan-gerous pollutants. For a sustainable development of society, resourcesmust be recycled as much as possible. Agriculture is involved in an im-portant production/consumption system: the food chain. Food waste isa source of value because existing technologies allow for the recovery,recycling and sustainability of ingredients inside the food chain. The ag-ricultural sector requires a secure, long-term supply of nutrients and or-ganic matter to compensate for losses. Organic matter plays animportant role in maintaining soil functions and preventing the prog-ress of soil degradation (Felipó et al., 2004; Westerman and Bicudo,2005). Utilisation of organic wastes occurs more easily if there are eco-nomic incentives. However, the economic incentives in Italy are mar-ginal and sometimes absent. The landfill represents the worst solutionin terms of the quantities of pollutants released (Cucchiella et al.,2012a). A study provided by the European Commission (2010) on
food waste generation estimates annual food waste generation in theEU 27 at approximately 89.277 kt and at 8.778 kt in Italy in 2006 (ap-proximately 25% of total produced waste). Even if the recycling offood waste represents an important strategy for sustainable develop-ment, the lack of Italian regional data prevents its separate evaluationin the analysis presented in this paper. However, a recent work demon-strates how the incineration, composting and anaerobic digestion pro-cesses are clearly underperforming, from an environmental point ofview, with respect to the mechanical recycling process (Piemonte,2011). In Japan, a study was conducted to evaluate current food wasterecycling practices and their environmental and economic aspects.This study showed the cost improvement of animal feed facilities by in-troducing a recycling loop (Takata et al., 2012). Based on the Tianjincase, the study evaluates the current and possible patterns of MSWmanagement with regard to GHG emissions using LCA (Zhao et al.,2009).
It is widely recognised that appropriate policies to encourage wastecollection, separation and appropriate reuse (through either recyclingor incineration) are needed. This study is not a comparative assessmentof the two solutions (recycling or incinerators); it assumes that the twoprocesses are concomitant (European Commission, 2011). The choicesare connected to implemented policies, the availability of funds andthe ability of users to allow for the application of moremodern sustain-able models. In particular, we have assumed three scenarios (High, Me-dium and LowWV) that are characterised for the different incidence ofthe proportion of waste treated by the incineration process (respective-ly 75%, 50% and 25%). The latter scenario is preferable if we consider thehierarchical sequence of waste as a parameter of choice. The regionalvalues of Waste Valorisation (ΔREF,Y,I,β%) estimated using Formula (5)are presented in Table 4.
To take into account the dynamic aspects of generated waste, theamount of waste to be treated has been considered to be a variable re-lated to the following:
• the future growth of waste (F1 and F2 scenarios);• the quantity of waste to be disposed in landfills (LT10, LT20 and LT30scenarios);
• the percentage of waste to be recovered and recycled (High, Medi-um and Low WV scenarios).
Multi-criteria analysis using Formulas (7), (8) and (9) provides theplanned production capacities of incinerators located in the Italian re-gions (Table 5).
4. Economic and environmental impact: a regional perspective
Calculating the optimal size of an incinerator is a difficult problem:though a large facility, regardless of the funding problems,makes it pos-sible to exploit economies of scale, there are other aspects to consider.The larger the size of the incinerator, the larger the geographical catch-ment area from which one must convey the waste to be burned. Thegoal of these facilities is, in fact, to work with a quantity of waste thatis as close as possible to their maximum capacity, thus having cost func-tions characterised by high fixed costs and low marginal costs. Increas-ing the geographical area of collection means increasing the cost ofwaste transportation, with the resulting consequential increase of
Table 2“Do nothing cost” (DNC), expressed in k€.
QWR (kt) Production capacity (kt)
350 400 450 500 550 600 650 700 750
D(y) 1 −23 −364 −519 −1.110 −1.482 −1.782 −2.330 −2.775 −3.2722 −44 −712 −1.014 −2.166 −2.894 −3.479 −4.549 −5.418 −6.3873 −65 −1.043 −1.485 −3.173 −4.238 −5.095 −6.662 −7.935 −9.354
Table 3Waste disposed in landfills (kt).
Total waste F1 F2
% disposal 10% 20% 30% 10% 20% 30%
Lombardy 54.0 108.1 162.1 59.9 119.7 179.6Friuli VG 19.5 39.0 58.6 21.7 43.4 65.1Veneto 77.5 155.0 232.5 86.2 172.3 258.5Trentino AA 17.6 35.1 52.7 19.5 39.1 58.6Emilia R 118.0 236.0 354.1 127.9 255.8 383.6Campania 121.3 242.7 364.0 135.5 270.9 406.4Piedmont 115.1 230.2 345.4 127.7 255.4 383.1Tuscany 140.8 281.6 422.5 152.5 304.9 457.4Calabria 58.6 117.2 175.9 65.9 131.7 197.6Umbria 35.3 70.6 105.9 38.4 76.8 115.2Sardinia 56.2 112.4 168.6 62.4 124.9 187.3Marche 60.7 121.3 182.0 66.7 133.4 200.1V. Aosta 5.3 10.6 15.9 5.8 11.6 17.4Basilicata 20.5 41.1 61.6 23.4 46.8 70.2Abruzzo 61.6 123.2 184.7 68.2 136.3 204.5Lazio 306.9 613.9 920.8 334.9 669.8 1004.7Apulia 219.3 438.6 657.9 243.4 486.8 730.2Liguria 99.5 198.9 298.4 109.0 217.9 326.9Molise 14.6 29.2 43.9 16.6 33.3 49.9Sicily 300.9 601.9 902.8 333.6 667.1 1000.7
959F. Cucchiella et al. / Science of the Total Environment 443 (2013) 955–964

Author's personal copy
total disposal costs (Cucchiella et al., 2011). The selection criteria usedto identify the proper sizing of plants are as follows:
1. the lower work capacity limit for each plant is fixed at 350 kt. Infact, plants below this limit have negative values in terms of finan-cial sustainability (Fig. 3);
2. the best choice among the possible configurations is the one thatmaximises the FNPV.
Regarding the second criterion, it is worth noting that solutions suchas the configuration of plants with a lowerWV value than that requiredis admissible; in such cases the decrease in the ENBmust be lower thanthe FNPV increase. However, configurations in which the WV is higherthan that requested is not suitable because, otherwise, the share subjectto energy recovery would be too dominant compared to the amountsubject to recycling or other forms of recovery. With reference to theexisting incinerators, it is assumed that they have saturated their pro-duction capacity, so that any additional waste is to be allocated tonewly-built incinerators. The constraints on the production capacityare considered only in reference to the High WV situation; in the
other scenarios, only 3 cases showed a distinction between the Normaland Alternative scenario:
• in the Low WV scenario, the QWY > 500kt is only for Lazio (700 kt)and Sicily (650 kt), but in the first case, the FNPV of a 500 kt plant islarger than that of two 350 kt plants and in the second case one ofthe plants has a negative FNPV; thus, there is a perfect coincidencebetween the Normal and the Alternative scenario for these two re-gions;
• the Medium WV scenario QWY > 500kt exists in 8 regions, but inLombardy, Emilia Romagna, Campania, Piedmont and Tuscany oneof the two plants has a negative FNPV, thus resulting in a coinci-dence between the Normal and Alternative scenario. Indeed, thereare variations for Lazio, Apulia and Sicily.
To support decisions for the proper sizing in each region, differentindicators have been estimated (Table 6):
➢ Financial Net Present Value, which provides an estimate of the fi-nancial impact;
➢ The Waste Valorisation is relative to the environmental impact,and an estimate is provided by the production capacity; in fact, ifthe plants are used to full capacity, the capacity of waste treat-ment at full range corresponds to the amount of waste divertedfrom landfill treatment;
➢ Financial Net Present Value/Waste Valorisation is expressed in €/tas a measure of the financial return arising from the treatment of1 t of MSW;
➢ External Net Benefits is linked by a linear relationship to the WV; itmeasures in economic terms the environmental benefits associatedwith the incinerators (Eq. (10)).
Table 6 has relevant regional policy implications. For example,according to the data presented in Table 6, Lombardy is the most virtu-ous region in themanagement of waste because of the reduced amountof waste sent to landfills (9.8%) and the highest use of energy recovery(47.1%). Table 6 shows the sizing of the incinerators required to meetthe needs of this region in each of the 4 hypothesised scenarios. The sce-nario High WV Normal (waste to be sent to incinerators equal to 75%,without a constraint on the size of each single plant) requires a 750 ktplant. Where there should be a limit on the size of each plant (HighWV Alternative), it is possible to cope with the disposal of 750 ktusing one of the configurations shown in Table 7. Considering theFNPV (Fig. 3) associated with each plant based on the capacity of
Table 4Estimated waste to incinerate (kt), F1 and F2 scenarios.
F1 scenario F2 scenario
Total waste %disposal
High WV Medium WV Low WV High WV Medium WV Low WV
10% 20% 30% 10% 20% 30% 10% 20% 30% 10% 20% 30% 10% 20% 30% 10% 20% 30%
Lombardy 621 580 540 499 472 445 378 364 351 940 895 851 806 776 746 671 656 641Friuli VG 148 133 119 104 94 85 60 55 50 180 164 148 132 121 110 83 77 72Veneto 545 487 428 370 332 293 196 177 157 627 562 498 433 390 347 239 217 196Trentino AA 126 113 100 87 78 69 47 43 39 148 134 119 104 95 85 60 55 51Emilia R 858 770 681 593 534 475 327 298 268 992 896 800 704 640 576 416 384 352Campania 819 728 637 546 485 425 273 243 212 915 813 711 610 542 474 305 271 237Piedmont 789 702 616 530 472 414 270 242 213 886 790 694 599 535 471 311 279 247Tuscany 971 865 760 654 584 513 337 302 267 1.072 958 843 729 653 576 386 348 310Calabria 411 367 323 279 249 220 147 132 118 476 426 377 328 295 262 179 163 146Umbria 240 214 187 161 143 125 81 72 64 263 234 205 177 157 138 90 81 71Sardinia 401 359 317 275 247 219 148 134 120 467 420 373 327 295 264 186 171 155Marche 411 366 321 275 245 214 139 123 108 455 405 354 304 271 238 154 138 121V. d'Aosta 36 32 28 24 21 19 12 11 9 39 35 30 26 23 20 13 12 10Basilicata 148 133 117 102 92 81 56 50 45 177 160 142 125 113 101 72 66 60Abruzzo 416 370 323 277 246 216 139 123 108 460 409 358 307 273 239 153 136 119Lazio 2.089 1.859 1.628 1.398 1.245 1.091 708 631 554 2.296 2.045 1.794 1.542 1.375 1.208 789 705 622Apulia 1.488 1.323 1.159 994 884 775 501 446 391 1658 1476 1.293 1.111 989 867 563 502 441Liguria 671 597 522 448 398 348 224 199 174 736 654 572 490 436 381 245 218 191Molise 99 88 77 66 59 51 33 29 26 112 100 87 75 67 58 37 33 29Sicily 2.032 1.806 1.581 1.355 1.204 1.054 678 603 527 2.253 2.003 1.753 1.502 1.336 1.169 752 668 585
Table 5Production capacity of incinerators (kt) — QWY.
Energy recovery High WV Medium WV Low WV
Lombardy 750 650 500Friuli VG 150 100 50Veneto 550 400 200Trentino AA 150 100 50Emilia R 850 600 350Campania 800 550 250Piedmont 800 550 250Tuscany 950 650 350Calabria 400 300 150Umbria 250 150 100Sardinia 400 300 100Marche 400 250 150V. d'Aosta 50 0 0Basilicata 150 100 50Abruzzo 400 250 150Lazio 2.050 1.400 700Apulia 1.450 1.000 500Liguria 650 450 200Molise 100 50 50Sicily 2.000 1.350 650Total 13.300 9.200 4.800
960 F. Cucchiella et al. / Science of the Total Environment 443 (2013) 955–964

Author's personal copy
waste treatment, it is possible to estimate the total FNPV of eachsolution.
The C4 configuration is not to be considered among the possiblesolutions because it has a higher total value of treated waste thanrequired; however, the C2 configurations are not appropriate be-cause one of the two plants is characterised by the negative FNPV.Thus, the C3 configuration is suitable. However, it is possible to createplants with a lower production capacity if we consider the C1 configu-ration with the maximum allowed value. Thus, the C1 configurationshould be compared with C3; C1 assumes a higher FNPV at 15.173 k€,and the lack of disposal of the remaining 250 kt produces a reductionof the ENB estimated at 2.250 k€. Thus, the C1 configuration is thefinal solution for this scenario. The Medium WV scenario that providesfor a 650 kt plant compared to the Normal scenario has a reduction ofprofits amounting to 19.766 k€. In some regions, the amount of wasteproduced is insufficient to justify the incinerator investment; this out-come can only occur if the objective is to allocate 75% of waste to incin-eration. Fig. 3 suggests that the financial return of these investments ispositive for plants with a size of at least 350 kt. In Friuli, Trentino, Um-bria, V.d'Aosta, Basilicata and Molise, the plants requested are smallerthan 350 kt. These regions should identify alternative solutions totreat waste or to send their waste to incinerators of neighbouring re-gions if changes can bemade in the current legislative structure. Noticethat Friuli and Trentino have already discovered alternatives to the useof landfills. In fact, only 28% and 32% of waste are sent to their landfills,respectively, and recycling policies have been already implemented. ForVeneto (use of landfills is below 30%), it is estimated that a plant with acapacity equal to 550 kt is needed if a High WV scenario is to beimplemented. If local policies impose a limit on the size of the plant,the most convenient solution is for the construction of a single plant
with a capacity of 500 kt. Emilia Romagna is currently the second regionper quantity of waste submitted to energy recovery with a low alloca-tion of waste to landfill wD;Yb38%
� �. The demand required in the High
WV Normal scenario is relative to the construction of a 850 kt plant,but the choice falls on a plant equal to the maximum size allowed(750 kt), which has a greater FNPV (+44.922 k€) and a lower ENB(−900 k€) compared to a joint solution with 500 kt and 350 kt plants.However, the latter option is adopted in the case of a HighWV Alterna-tive scenario because the relative earnings are greater than thoseobtained with a single 500 kt plant. The MediumWV scenario providesfor a 600 kt plant that, when compared to the normal scenario, has a re-duction of profits amounting to 31,275 k€. Campania and Piedmonthave a good mix in waste management 37%bwD;Yb46%
� �but the abso-
lute data of waste sent to landfill is excessive. The selected capacity(800 kt) is a dimension that is not admissible: the 750 kt plant pro-duces profit for an amount greater than 53,380 k€ compared to theprofits produced by two 400 kt plants. The missed use of a 50 kt incin-erator determines a decrease in the ENB equal to 450 k€. In the HighWV Alternative scenario, it would be better to opt for 500 kt plants,which have higher earnings compared to two 400 kt plants(+7.987 k€). Apulia uses landfills formore than 90% of itswaste; to im-plement a High WV solution, plants equal to 1.450 kt are planned.Without capacity constraints, the better solution is the construction ofplants that are as large as possible, thus one 750 kt plant and one700 kt plant. As each plant cannot exceed the capacity of waste treat-ment amounting to 500 kt, the optimal combination is given by two500 kt plants and one 450 kt plant, with a reduction of profits equalto 69.464 k€ compared to the previous solution, while the MediumWV scenario has a reduction of earnings amounting to 77.570 k€, avalue determined by two 650 kt and 350 kt plants. For the latter
Table 6Economic and environmental indicators.
Scenarios High WV Normal High WV Alternative Medium WV Low WV
Indicators FNPVk€
WVkt
FNPV/WV
FNPVk€
WVkt
FNPV/WV
FNPVk€
WVkt
FNPV/WV
FNPVk€
WVkt
FNPV/WV
Lombardy 68.694 750 91.6 23.301 500 46.6 48.928 650 75.3 23.301 500 46.6Friuli VG 0 0 0.0 0 0 0.0 0 0 0.0 0 0 0.0Veneto 31.123 550 56.6 23.301 500 46.6 7.657 400 19.1 0 0 0.0Trentino 0 0 0.0 0 0 0.0 0 0 0.0 0 0 0.0Emilia R 68.694 750 91.6 23.772 850 28.0 37.419 600 62.4 471 350 1.3Campania 68.694 750 91.6 23.301 500 46.6 31.123 550 56.6 0 0 0.0Piedmont 68.694 750 91.6 23.301 500 46.6 31.123 550 56.6 0 0 0.0Tuscany 68.694 750 91.6 34.204 950 36.0 48.928 650 75.3 471 350 1.3Calabria 7.657 400 19.1 7.657 400 19.1 0 0 0.0 0 0 0.0Umbria 0 0 0.0 0 0 0.0 0 0 0.0 0 0 0.0Sardinia 7.657 400 19.1 7.657 400 19.1 0 0 0.0 0 0 0.0Marche 7.657 400 19.1 7.657 400 19.1 0 0 0.0 0 0 0.0V. d'Aosta 0 0 0.0 0 0 0.0 0 0 0.0 0 0 0.0Basilicata 0 0 0.0 0 0 0.0 0 0 0.0 0 0 0.0Abruzzo 7.657 400 19.1 7.657 400 19.1 0 0 0.0 0 0 0.0Lazio 168.511 2.050 82.2 93.204 2.000 46.6 117.622 1.400 84.0 58.275 700 83.3Apulia 126.969 1.450 87.6 57.505 1.450 39.7 49.399 1.000 49.4 23.301 500 46.6Liguria 48.928 650 75.3 23.301 500 46.6 10.903 450 24.2 0 0 0.0Molise 0 0 0.0 0 0 0.0 0 0 0.0 0 0 0.0Sicily 160.689 2.000 80.3 93.204 2.000 46.6 107.203 1.350 79.4 48.928 650 75.3Total 910.318 12.050 45.8a 449.022 11.350 25.3a 490.305 7.600 29.1a 154.747 3.050 12.7a
ENB (M€) 108 102 68 27
a Average values.
Table 7Choice of the plant in the High WV Alternative scenario — Lombardy.
Configuration Size of the 1st plant — kt Size of the 2 nd plant — kt Treated waste Maximum size limit 1st selection criterion 2nd selection criterion — k€
C1 500 – 500 ® ® 23.301C2 500 250 750 ® # 11.815C3 400 350 750 ® ® 8.128C4 500 300 800 # # 17.476
®=satisfied; # not satisfied.
961F. Cucchiella et al. / Science of the Total Environment 443 (2013) 955–964
Author's personal copy
scenario, another theoretical solution involves the construction of twoplants of 750 kt and 250 kt, which have a FNPV equal to 57.208 k€(larger than the choicemade), but the 250 kt plant generates a negativeprofit and does not fall among feasible solutions. Calabria, Sardinia,Marche and Abruzzo are regions where the minimum quantity thatcan justify the investment of an incinerator is only reached if the currentpolicy is strongly directed to the use of incinerators (High WV with apercentage of waste sent to the landfill equal to 75%). The systems re-quired to copewith the amount of waste produced should have a treat-ment capacity of 400 kt. Among these regions there should be adifferent priority; in Calabria and Sardinia the use of landfills is relatedto less than 60% of the waste, while in the Marche region this percent-age reaches 63% and in Abruzzo almost 80% ofwaste ends up in landfills.The observed situation for Lazio is more negative compared to that ofAbruzzo: this region generates 2.813 kt ofwaste and 83% is sent to land-fills—an amount that, in absolute terms, is higher than the rest of theCountry (Table 1). A scenario based on a strong energy recovery (β=75%), can be implemented with the following combination of facilities:two plants of 750 kt and a plant of 550 kt. This combination is the onethat appears to have the higher FNPV. However, if policies and local re-sistance require compliance with a constraint equal to 500 kt, the bestsolution is the construction of four 500 kt plants (in this case therewould be a reduction in profit equal to 75.307 k€ compared to the pre-vious solution). To implement a solution where 50% of the waste istreated with an incinerator, a treatment capacity of 1.400 kt is planned;to maximise the FNPV, the choice should fall on larger plants and thusthe best choice would be two plants of 750 kt and 650 kt. In this case,the financial result is superior to the High WV Alternative scenario,with an increase equal to 24.418 k€.
5. Analysis of results: a national perspective
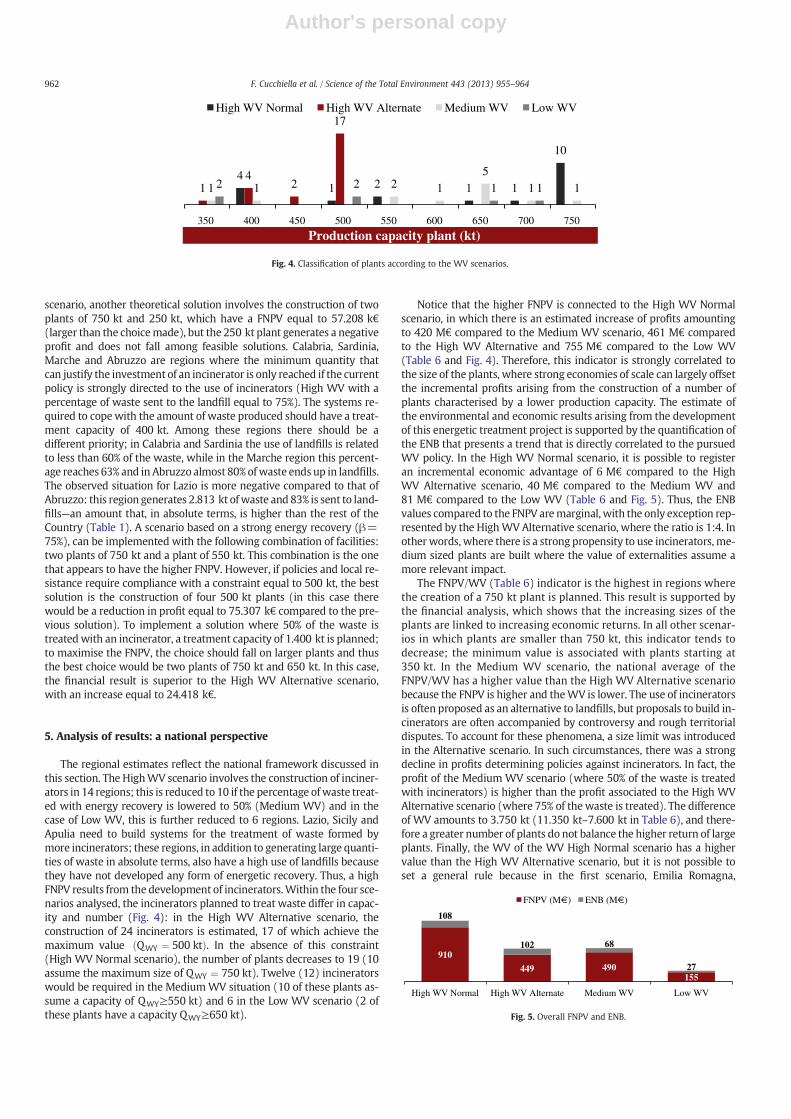
The regional estimates reflect the national framework discussed inthis section. The HighWV scenario involves the construction of inciner-ators in 14 regions; this is reduced to 10 if the percentage ofwaste treat-ed with energy recovery is lowered to 50% (Medium WV) and in thecase of Low WV, this is further reduced to 6 regions. Lazio, Sicily andApulia need to build systems for the treatment of waste formed bymore incinerators; these regions, in addition to generating large quanti-ties of waste in absolute terms, also have a high use of landfills becausethey have not developed any form of energetic recovery. Thus, a highFNPV results from the development of incinerators.Within the four sce-narios analysed, the incinerators planned to treat waste differ in capac-ity and number (Fig. 4): in the High WV Alternative scenario, theconstruction of 24 incinerators is estimated, 17 of which achieve themaximum value QWY ¼ 500 ktð Þ. In the absence of this constraint(High WV Normal scenario), the number of plants decreases to 19 (10assume the maximum size of QWY ¼ 750 kt). Twelve (12) incineratorswould be required in the MediumWV situation (10 of these plants as-sume a capacity of QWY≥550 kt) and 6 in the Low WV scenario (2 ofthese plants have a capacity QWY≥650 kt).
Notice that the higher FNPV is connected to the High WV Normalscenario, in which there is an estimated increase of profits amountingto 420 M€ compared to the Medium WV scenario, 461 M€ comparedto the High WV Alternative and 755 M€ compared to the Low WV(Table 6 and Fig. 4). Therefore, this indicator is strongly correlated tothe size of the plants, where strong economies of scale can largely offsetthe incremental profits arising from the construction of a number ofplants characterised by a lower production capacity. The estimate ofthe environmental and economic results arising from the developmentof this energetic treatment project is supported by the quantification ofthe ENB that presents a trend that is directly correlated to the pursuedWV policy. In the High WV Normal scenario, it is possible to registeran incremental economic advantage of 6 M€ compared to the HighWV Alternative scenario, 40 M€ compared to the Medium WV and81 M€ compared to the Low WV (Table 6 and Fig. 5). Thus, the ENBvalues compared to the FNPV aremarginal, with the only exception rep-resented by the HighWV Alternative scenario, where the ratio is 1:4. Inother words, where there is a strong propensity to use incinerators, me-dium sized plants are built where the value of externalities assume amore relevant impact.
The FNPV/WV (Table 6) indicator is the highest in regions wherethe creation of a 750 kt plant is planned. This result is supported bythe financial analysis, which shows that the increasing sizes of theplants are linked to increasing economic returns. In all other scenar-ios in which plants are smaller than 750 kt, this indicator tends todecrease; the minimum value is associated with plants starting at350 kt. In the Medium WV scenario, the national average of theFNPV/WV has a higher value than the High WV Alternative scenariobecause the FNPV is higher and theWV is lower. The use of incineratorsis often proposed as an alternative to landfills, but proposals to build in-cinerators are often accompanied by controversy and rough territorialdisputes. To account for these phenomena, a size limit was introducedin the Alternative scenario. In such circumstances, there was a strongdecline in profits determining policies against incinerators. In fact, theprofit of the Medium WV scenario (where 50% of the waste is treatedwith incinerators) is higher than the profit associated to the High WVAlternative scenario (where 75% of the waste is treated). The differenceof WV amounts to 3.750 kt (11.350 kt–7.600 kt in Table 6), and there-fore a greater number of plants do not balance the higher return of largeplants. Finally, the WV of the WV High Normal scenario has a highervalue than the High WV Alternative scenario, but it is not possible toset a general rule because in the first scenario, Emilia Romagna,
41 2 1 1
10
14
2
17
1 1 2 15
1 12 2 1 1
350 400 450 500 550 600 650 700 750
High WV Normal High WV Alternate Medium WV Low WV
Production capacity plant (kt)
Fig. 4. Classification of plants according to the WV scenarios.
910
449 490155
108
102 68
27
High WV Normal High WV Alternate Medium WV Low WV
FNPV (M€) ENB (M€)
Fig. 5. Overall FNPV and ENB.
962 F. Cucchiella et al. / Science of the Total Environment 443 (2013) 955–964

Author's personal copy
Tuscany, Lombardy, Campania and Piedmont have a 750 kt plant, whilein the second, the first two regions have aWVb750 kt value, unlike theother three which have a value of WV>750 kt. In some regions, theamount ofwaste produced is such as to justify the construction of incin-erators both by adopting a policy that is strongly geared towards ener-getic treatment (β=75%) and in an intermediate situation (β=50%) ofenergy recovery. Therefore, these regions (Lombardy, Veneto, EmiliaRomagna, Campania, Piedmont, Tuscany, Lazio, Apulia, Liguria andSicily) have a greater degree of freedom in the choice of their wastemanagement policy. Calabria, Sardinia, Marche and Abruzzo can onlyobtain positive returns from the construction of incinerators if theyadopt policies that are strongly aimed at energy recovery by addressing75% of their waste to these plants. Finally, in other regions with a highcontribution of waste to incinerators, the amount of waste generatedis insufficient to justify such investments; this is the case for Friuli,Trentino, Umbria, Valle d'Aosta, Basilicata andMolise, where it is appro-priate to implement an aggregation process with neighbouringterritories.
In 2009, energy recovery in Italy was equal to 14% of the total mixof waste treatment. Table 8 presents estimated data on energy recov-ery after the adoption of the waste management policies proposed inthis paper. For example, the choice of a HighWVNormal policy makesit possible to achieve an energy recovery equal to 41% in the F2 sce-nario, an increase of 27% with respect to the current rate.
Each region must contribute to the achievement of a sustainablewaste management. Fig. 6 proposes an estimation of the increase ofthe WV depending on the implemented waste management policies.In the “as is” situation, Lombardy and Emilia Romagna prevail in abso-lute terms of WV; in the “to be” situation and in the High WV Normalscenario, Lombardy maintains leadership with 3.000 kt of WV,followed by the “new entries” Lazio and Sicily, which reach a valueof 2.000 kt. Emilia, together with Apulia, is placed at a value of1.500 kt. These five regions contribute to 62% of the national WV.
An ideal system requires that when a project contributes to makinga nationmore sustainablewe can immediately proceed. The future gen-erated profits can compensate for the scarcity of economic resources.Thus, the DNC is a variable thatmust be considered in the strategy of in-frastructure endowment and cost assessment (Fig. 7).
Such costs make reference to the 2011–2041 timeframe coveringthe lifespan of incinerators utilising energy recovery. For example,in the HighWVNormal scenario, if year zero (2011) of all incinerators
is delayed to 2012, a loss of 43 M€ is registered over the next30 years. If the delay is 2 years, the inactivity cost doubles and be-comes equal to 85 M€ and triples (equal to 124 M€) if the delay is3 years. Regardless of the delay taken into consideration, 50% of theinactivity costs are determined by delays in choices made by Lazio,Apulia and Sicily, regions where the need to change waste manage-ment is more urgent. In other scenarios, although the DNCs decreasethey are still very high. Notice that the increased delays tend to in-crease costs because the projects are profitable at time zero; themore the construction is delayed, the more the missed profits accu-mulate. Moreover, a smaller number of large plants, which are themost profitable, results in a lower DNC in the Medium WV and LowWV scenarios, compared to that of the High WV Normal scenario.
6. Conclusions
The reduction of waste and its harmful effects is an essential ele-ment in a sustainable environmental strategy. The use of landfillsdoes not protect public health or environmental quality and doesnot promote the conservation of natural resources. The objective ofthis paper was to minimise the use of landfills. The experience ofmany European countries shows that recycling and energy recoveryare two positive approaches that do not exclude one another. The en-vironmental impact produced by recycling is preferable, but it is in-sufficient in improving the as is situation. The construction ofincinerators can achieve measurable economic and environmentalresults; in fact, the tons of waste not sent to landfills lead to a reduc-tion of pollutant emissions and a profitable investment. The“bottom-up” approach adopted in this paper precisely defines theamount of treated waste but does not specify the value of recycling;there is still a wide margin of application given the increasing valueof waste produced and the large amount of waste disposed of in Ital-ian landfills. The economic analysis shows that it is more convenientto build an incinerator than to use a landfill; this result is supportedby the benefits derived from environmental analysis that shows howenergy recovery plants placed in Italy produce emissions that arebelow existing legal (and stringent) limits. The financial analysis in-dicates, however, that small plants are not profitable, and in particu-lar the trend of the FNPV as a function of the production capacityshows that the impact of economies of scale is very significant.Therefore, the wealth produced does not depend on the number ofincinerators but rather on their size and the limitations on the sizeof the plant that would produce the loss of high profit opportunities.Environmental (WV=12.005 kt) and financial (FNPV=910 M€)maximisations are both observed in the High WV Normal scenariothat presents an ENB value equal to 108 M€, which is a high econom-ic advantage, but is lower in relation to the obtained financial value.Starting from an initial energy recovery rate at 14% and a total pro-duction of 32.8 Mt of waste, the High WV Normal scenario reduced
Table 8Estimated energy recovery (%).
Scenario High WV normal High WV alternative Medium WV Low WV
A 50% 48% 37% 23%F1 46% 44% 33% 21%F2 41% 40% 30% 19%
0
500
1000
1500
2000
2500
3000
3500
As is Low WV Medium WV less Low WV High WV Normal less Medium WV
o
Fig. 6. Actual and future production capacities in different scenarios (kt).
963F. Cucchiella et al. / Science of the Total Environment 443 (2013) 955–964

Author's personal copy
the use of landfills to 32% and 27%, respectively, when the total wasteamounted at 36 Mt and 40 Mt. In theMediumWV scenario, these re-ductions amounted to 19% and 16%. Given the high value of producedwaste, Lazio, Sicily and Apulia are regions that are most in need of astronger change in waste management policies. Finally, in a policyinspired by the reduction of costs, data that emerge from the missedbenefits (do nothing costs) cannot go unnoticed: −43 M€, −85 M€
and −124 M€ if the intervention plan in the High WV Normal sce-nario is delayed by 1, 2 and 3 years, respectively. The adoption ofGSCM results are appropriate for this sector and should be drivenby market demand; it is induced by the need to ensure full compli-ance with environmental regulations and is required by a civil socie-ty, which requires and desires sustainable waste management.
References
Calabrese A, Gastaldi M, Ghiron NL. Real option's model to evaluate infrastructureflexibility: an application to photovoltaic technology. Int J Technol Manag 2005;29:173–91.
Chen H-W, Chang N-B, Chen J-C, Tsai S-J. Environmental performance evaluation oflarge-scale municipal solid waste incinerators using data envelopment analysis.Waste Manag 2010;30:1371–81.
Cruz JM. The impact of corporate social responsibility in supply chain management:multicriteria decision-making approach. Decis Support Syst 2009;48:224–36.
Cucchiella F, D'Adamo I. Estimation of the energetic and environmental impacts of aroof-mounted building-integrated photovoltaic systems. Renew Sustain EnergyRev 2012a;16:5245–59.
Cucchiella F, D'Adamo I. Feasibility study of developing photovoltaic power projects inItaly: An integrated approach. Renew Sustain Energy Rev 2012b;12:1562–76.
Cucchiella F, D'Adamo I, Gastaldi M. Green supply chain and the energy recovery plantin Abruzzo. Procedia Soc Behav Sci 2011;25:54–72.
Cucchiella F, D’Adamo I, Gastaldi M. Municipal waste management and energy recov-ery in an Italian region. Waste Manag Res 2012a;30:1290–8.
Cucchiella F, D’Adamo I, Gastaldi M, Koh SCL. Renewable energy options for buildings:Performance evaluations of integrated photovoltaic systems. Energy Build2012b;55:208–17.
Damgaard A, Riber C, Fruergaard T, Hulgaard T, Christensen TH. Life-cycle-assessmentof the historical development of air pollution control and energy recovery in wasteincineration. Waste Manag 2010;30:1244–50.
Dorini G, Kapelan Z, Azapagic A. Managing uncertainty in multiple-criteria decision mak-ing related to sustainability assessment. Clean Technol Environ Policy 2011;13:133–9.
ENEA. Rapporto Energia e Ambiente 2008: analisi e scenari; 2009.European Commission. Preparatory study on food waste across EU 27. European Com-
mission (DG ENV), Directorate C — Industry; 2010.European Commission. available at http://ec.europa.eu/index_it.htm 2011.European Environment Agency. available at http://www.eea.europa.eu/it 2011.Felipó MT, Huerta O, Lopez M, Soliva M. Research on organic wastes soil recycling
and its applicability to local scenarios. In: Ferrer-Balas D, Mulder KF, Bruno J,Sans R, editors. International Conference on Engineering Education in Sustain-able Development. Barcelona: Universitat Politècnica de Catalunya; 2004.
Generowicz A, Kulczycka J, Kowalski Z, Banach MA. Assessment of waste managementtechnology using BATNEEC options, technology quality method and multi-criteriaanalysis. J Environ Manage 2011;92:1314–20.
Gold S, Seuring S, Beske P. Sustainable supply chain management and inter-organizationalresources: a literature review. Corp Soc Responsib Environ Manag 2010;17:230–45.
Koh SCL, Cucchiella F, Baldwin J, Shi G. Natural resource based green supply chain man-agement. Supply Chain Management: An International Journal 2012;17:54–67.
Mendonca M, Jacobs D, Sovacool B. Powering the Green Economy — the feed-in tariffhandbook. Energy 2010;35:4618–9.
Piemonte V. Bioplastic wastes: the best final disposition for energy saving. J Polym En-viron 2011;19:988–94.
Riber C, Bhander GS, Hauschild M, Christensen TH. Environmental assessment of wasteincineration in a life-cycle-perspective (EASEWASTE). Waste Manag Res 2008;26:96-103.
Takata M, Fukushima K, Kino-Kimata N, Nagao N, Niwa C, Toda T. The effects ofrecycling loops in food waste management in Japan: based on the environmentaland economic evaluation of food recycling. Sci Total Environ 2012;432:309–17.
Varun, Prakash R, Bhat IK. Energy, economics and environmental impacts of renewableenergy systems. Renew Sustain Energy Rev 2009;13:2716–21.
Westerman PW, Bicudo JR. Management considerations for organic waste use in agri-culture. Bioresour Technol 2005;96:215–21.
Zhao W, van der Voet E, Zhang Y, Huppes G. Life cycle assessment of municipal solidwaste management with regard to greenhouse gas emissions: case study of Tianjin,China. Sci Total Environ 2009;407:1517–26.
-43
-21
-23
-7
-85
-42
-45
-14
-124
-61
-65
-21
High WV Normal
High WV Alternative
Medium WV
Low WV
Delay 3 years Delay 2 years Delay 1 year
Fig. 7. “Do nothing” costs (M€).
964 F. Cucchiella et al. / Science of the Total Environment 443 (2013) 955–964
Related Documents