METHODOLOGY ARTICLE Open Access A motif-independent metric for DNA sequence specificity Luca Pinello 1,2 , Giosuè Lo Bosco 3* , Bret Hanlon 4 and Guo-Cheng Yuan 1,2* Abstract Background: Genome-wide mapping of protein-DNA interactions has been widely used to investigate biological functions of the genome. An important question is to what extent such interactions are regulated at the DNA sequence level. However, current investigation is hampered by the lack of computational methods for systematic evaluating sequence specificity. Results: We present a simple, unbiased quantitative measure for DNA sequence specificity called the Motif Independent Measure (MIM). By analyzing both simulated and real experimental data, we found that the MIM measure can be used to detect sequence specificity independent of presence of transcription factor (TF) binding motifs. We also found that the level of specificity associated with H3K4me1 target sequences is highly cell-type specific and highest in embryonic stem (ES) cells. We predicted H3K4me1 target sequences by using the N- score model and found that the prediction accuracy is indeed high in ES cells.The software to compute the MIM is freely available at: https://github.com/lucapinello/mim. Conclusions: Our method provides a unified framework for quantifying DNA sequence specificity and serves as a guide for development of sequence-based prediction models. Background Of the entire 3GB human genome, only about 2% codes for proteins. The identification of biological functions of the entire genome remains a major challenge [1,2]. One powerful venue to gain functional insights is to identify the proteins that bind to each genomic region. Recent development of chromatin immunoprecipitation followed by microarray or sequencing (ChIP- chip or ChIPseq) technologies has made it feasible to map genome-wide protein-DNA interaction profiles [3-5]. The data generated by these experiments have not only greatly facilitated the genome-wide characterization of regulatory elements such as enhancers [6,7] but also been integrated with other data sources to build gene regulatory networks [8-11]. An important question is to what extent a specific pro- tein-DNA interaction is mediated at the level of genomic sequences. While it is well known that specific sequence motifs are crucial for transcription factors (TF) mediated cis-regulation, there are many other proteins, such as chromatin modifiers, whose target sequences cannot sim- ply be characterized by a handful of distinct motifs [12]. Such sequences are often regarded as nonspecific and not studied further. However, recent studies in nucleo- some positioning have provided new insights by going beyond this motif-centric view [13]. Here various sequence features have been associated with nucleosome positioning, including poly dA:dT track [14,15], abun- dance of G/C content [16,17], and certain periodic pat- terns [18,19]. Such patterns cannot be captured by traditional motif analysis methods. Similar results have been obtained by analyzing histone modification [20,21] and DNA methylation data [22,23]. Despite the success of these recent sequence-based prediction models, it remains difficult to determine which sequences lack intrinsic specificity because a poor prediction outcome might imply than more sophisticated models. A guide is needed for developing sequence-based prediction models. To this end, here we present a simple approach to quantify sequence specificity based on the frequency distribution of k-mers. We will also systemati- cally investigate the relative merit of various distance or * Correspondence: [email protected]; [email protected] 1 Department of Biostatistics, Harvard School of Public Health, 677 Huntington Avenue, Boston MA 02115, USA 3 Dipartimento di Matematica ed Informatica, Via Archirafi 34, Palermo 90123, Italy Full list of author information is available at the end of the article Pinello et al. BMC Bioinformatics 2011, 12:408 http://www.biomedcentral.com/1471-2105/12/408 © 2011 Pinello et al; licensee BioMed Central Ltd. This is an Open Access article distributed under the terms of the Creative Commons Attribution License (http://creativecommons.org/licenses/by/2.0), which permits unrestricted use, distribution, and reproduction in any medium, provided the original work is properly cited.

Welcome message from author
This document is posted to help you gain knowledge. Please leave a comment to let me know what you think about it! Share it to your friends and learn new things together.
Transcript

METHODOLOGY ARTICLE Open Access
A motif-independent metric for DNA sequencespecificityLuca Pinello1,2, Giosuè Lo Bosco3*, Bret Hanlon4 and Guo-Cheng Yuan1,2*
Abstract
Background: Genome-wide mapping of protein-DNA interactions has been widely used to investigate biologicalfunctions of the genome. An important question is to what extent such interactions are regulated at the DNAsequence level. However, current investigation is hampered by the lack of computational methods for systematicevaluating sequence specificity.
Results: We present a simple, unbiased quantitative measure for DNA sequence specificity called the MotifIndependent Measure (MIM). By analyzing both simulated and real experimental data, we found that the MIMmeasure can be used to detect sequence specificity independent of presence of transcription factor (TF) bindingmotifs. We also found that the level of specificity associated with H3K4me1 target sequences is highly cell-typespecific and highest in embryonic stem (ES) cells. We predicted H3K4me1 target sequences by using the N- scoremodel and found that the prediction accuracy is indeed high in ES cells.The software to compute the MIM is freelyavailable at: https://github.com/lucapinello/mim.
Conclusions: Our method provides a unified framework for quantifying DNA sequence specificity and serves as aguide for development of sequence-based prediction models.
BackgroundOf the entire 3GB human genome, only about 2% codesfor proteins. The identification of biological functions ofthe entire genome remains a major challenge [1,2]. Onepowerful venue to gain functional insights is to identifythe proteins that bind to each genomic region. Recentdevelopment of chromatin immunoprecipitation followedby microarray or sequencing (ChIP- chip or ChIPseq)technologies has made it feasible to map genome-wideprotein-DNA interaction profiles [3-5]. The data generatedby these experiments have not only greatly facilitated thegenome-wide characterization of regulatory elements suchas enhancers [6,7] but also been integrated with other datasources to build gene regulatory networks [8-11].An important question is to what extent a specific pro-
tein-DNA interaction is mediated at the level of genomicsequences. While it is well known that specific sequencemotifs are crucial for transcription factors (TF) mediated
cis-regulation, there are many other proteins, such aschromatin modifiers, whose target sequences cannot sim-ply be characterized by a handful of distinct motifs [12].Such sequences are often regarded as nonspecific andnot studied further. However, recent studies in nucleo-some positioning have provided new insights by goingbeyond this motif-centric view [13]. Here varioussequence features have been associated with nucleosomepositioning, including poly dA:dT track [14,15], abun-dance of G/C content [16,17], and certain periodic pat-terns [18,19]. Such patterns cannot be captured bytraditional motif analysis methods. Similar results havebeen obtained by analyzing histone modification [20,21]and DNA methylation data [22,23].Despite the success of these recent sequence-based
prediction models, it remains difficult to determinewhich sequences lack intrinsic specificity because a poorprediction outcome might imply than more sophisticatedmodels. A guide is needed for developing sequence-basedprediction models. To this end, here we present a simpleapproach to quantify sequence specificity based on thefrequency distribution of k-mers. We will also systemati-cally investigate the relative merit of various distance or
* Correspondence: [email protected]; [email protected] of Biostatistics, Harvard School of Public Health, 677Huntington Avenue, Boston MA 02115, USA3Dipartimento di Matematica ed Informatica, Via Archirafi 34, Palermo 90123,ItalyFull list of author information is available at the end of the article
Pinello et al. BMC Bioinformatics 2011, 12:408http://www.biomedcentral.com/1471-2105/12/408
© 2011 Pinello et al; licensee BioMed Central Ltd. This is an Open Access article distributed under the terms of the Creative CommonsAttribution License (http://creativecommons.org/licenses/by/2.0), which permits unrestricted use, distribution, and reproduction inany medium, provided the original work is properly cited.

similarity functions for capturing specific sequence infor-mation. While k-mers have been extensively to detectsplice sites [24], to study functional genomic regions[25],to identify protein coding genes[26] and used in motifanalysis (reviewed by [27]), to our knowledge, they havenot been used to quantify sequence specificity.We evaluated the performance of our approach by ana-
lyzing one simulated datasets and two real experimentaldatasets, corresponding to a TF (STAT1) and a histonemodification (H3K4me1) respectively. Our results haveprovided new insights into the role of DNA sequences inmodulating protein-DNA interactions regardless of motifpresence.
ResultsA simple measure of sequence specificityWhile specific sequence information has been identifiedin the absence of distinct motifs, to our knowledge, it isalways associated with enrichment of certain k-mers(where k is a small number, such as 4). Its main differ-ence with motifs is that, when k is small, a single k-mermay occur many times in the genome and thereforewould not be useful for any practical purpose. On theother hand, we reasoned that more specific informationcan be obtained by combinations of multiple k-mers.Therefore, it seems appropriate to quantify sequence spe-cificity by aggregating enrichment information for all k-mers. For the rest of the paper, we fix k = 4, although themethod presented below is equally applicable to anychoice of k. Treating complementary sequences as identi-cal, there are 136 non-redundant 4-mers. By counting thefrequency of each 4-mer, each input sequence is thenmapped to a 136 dimensional numerical vector contain-ing the frequency of each k-mer. The distributions corre-sponding to sequences containing specific informationshould be distinct from those for random sequences,which are generated to match the number and length ofthe input sequences. We use the symmetric Kullback-Leibler (KL) divergence [28] for comparing frequencydistributions and average over the entire set of inputsequences. We term the resulting value as the MotifIndependent Metric (MIM). To evaluate statistical signif-icance, we estimate the null distribution by computingMIM values for sets of random sequences. The detailedprocedure is described in the Methods section.
Model ValidationSimulated dataAs an initial evaluation, we synthetically generated 8sequence sets each containing 2000 sequences, mimickingTF ChIPseq experiments for which the corresponding TFrecognizes a single motif: TTGACA. The differencebetween these sequence sets is the motif strength, which isparameterized by a real number ε (see Methods). In
particular, a perfect motif corresponds to ε = 0, whereas arandom sequence corresponds to ε = 0.25. In a typicalChIPseq experiment, only a subset of target sequencescontains the motif. To simulate this fact, we randomlyselected 1000 sequences from each set and inserted themotif at a randomly selected location. As control, we alsosynthesized 1000 sets of 2000 random sequences each.We calculated the MIM values for each sequence set
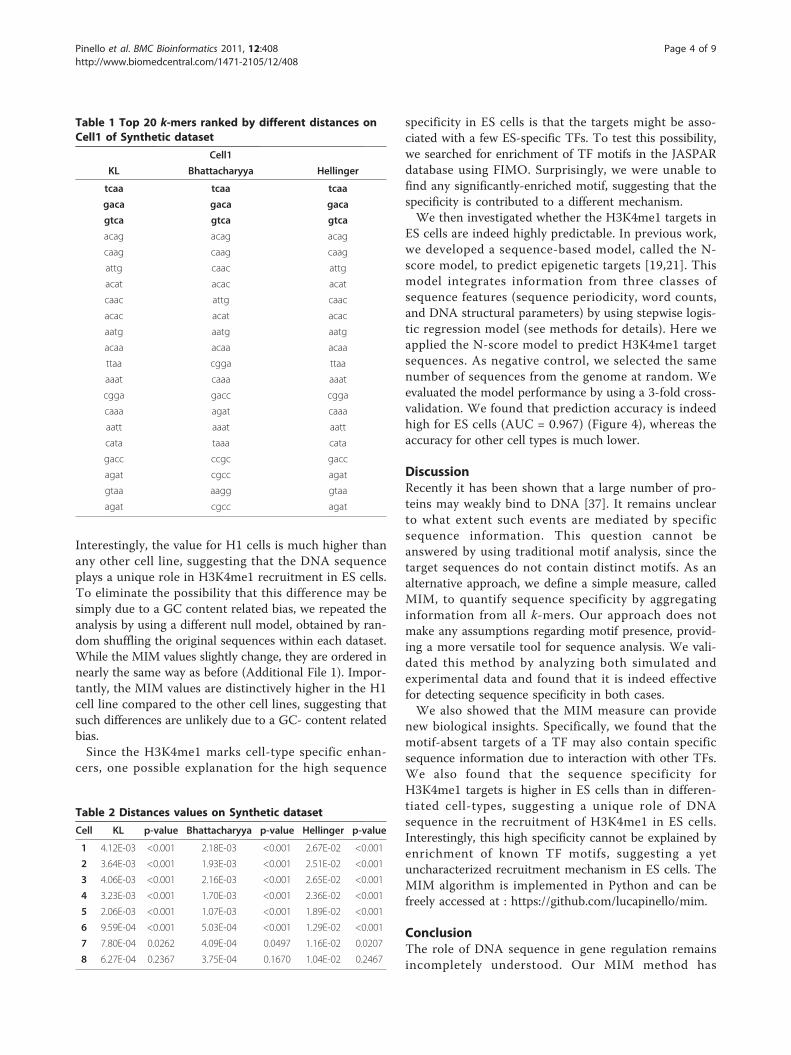
and evaluated the statistical significance of the resultingvalues. We found that the MIM values are statistically sig-nificant (p-value < 0.001) for ε up to 0.1 (Figure 1a and1b). The information content for the corresponding motifis 5.35 bit, which is still lower than 98% of the motifs inthe JASPAR core database [29]. In the following we willshow that our method indeed performs well for real data.We ranked each k-mer according to its relative contribu-tion to the MIM. The most informative k-mers are shownin Table 1. The methodology used to select such motif isoutlined in the methods section. We noticed that the topk-mers are substrings of the inserted motif (highlighted inbold in Table 1), suggesting that these k-mers may be usedas a seed for motif detection, in a similar way as the dic-tionary approach [30]. In additional to the KL divergenceconsidered here, there are a number of other metrics tocompare frequency distributions. We selected a few com-monly used metrics and repeated the above analysis(Methods). We found that the results are quite similar(Table 2).Real ChIPseq dataTo validate our method using real experimental data, weanalyzed a publicly available ChIPseq dataset for STAT1[31], a member of the signal transducer and activator oftranscription (STAT) family TFs, in the HeLa S3 cell line.The dataset contains 39,000 target sequences, 35% ofwhich contains the consensus motif TTCCNGGAA (JAS-PAR database [29]). As control, we sampled randomsequences from genomic background matching the num-ber and length of the target sequences.We evaluated the level of sequence specificity of the
whole set of target sequences by using the MIM measure.The sequences are indeed highly specific (see Figure 2aand 2b). Again, among the top ranked k-mers, several aresubstrings of the “classic” STAT1 motif (highlighted inbold in Table 3), suggesting it may provide useful informa-tion for identifying discriminative sequence signatureswithout the knowledge of TF motifs. Furthermore, theresults are not sensitive to the specific choice of distancesas in the simulated data experiment (Table 4).
Detecting sequence specificity in absence of a dominantmotifSTAT1As mentioned above, while the presence of STAT1motif can explain the sequence specificity for 35% of the
Pinello et al. BMC Bioinformatics 2011, 12:408http://www.biomedcentral.com/1471-2105/12/408
Page 2 of 9

target sequences, it is unclear how TF is recruited to theother 65% of the targets. In order to evaluate the role ofDNA sequence specificity for these motif-absent targets,we compared the MIM values between the motif-pre-sent and motif-absent subsets of targets. Surprisingly,we found that the MIM value for motif-absent targets isalmost indistinguishable from motif-present targets (seeFigure 2a and 2b). This high level of specificity cannotbe simply explained by promoter-related biases, becauseonly 11% of target sequences are located in promoters.To gain mechanistic insights, we searched for enrich-
ment of other TF motifs in the JASPAR database [29],using the FIMO software [32]. We found two motifs thatare significantly enriched (threshold p-value < 10-6): SP1and ESR1, both have previously been shown to interactwith STAT1 [33,34]. Therefore, STAT1 might be recruitedto the motif-absent targets through interaction with theseother TFs. We further compared the associated geneontology terms between the motif-present and motif-absent sets to see if there are any functional differences.We found that these two sets share many similar biologi-cal functions, such as hydrolase and ATPase activities (p <10-17). On the other hand, while the motif-present targetsare highly enriched for the voltage-gated calcium channel
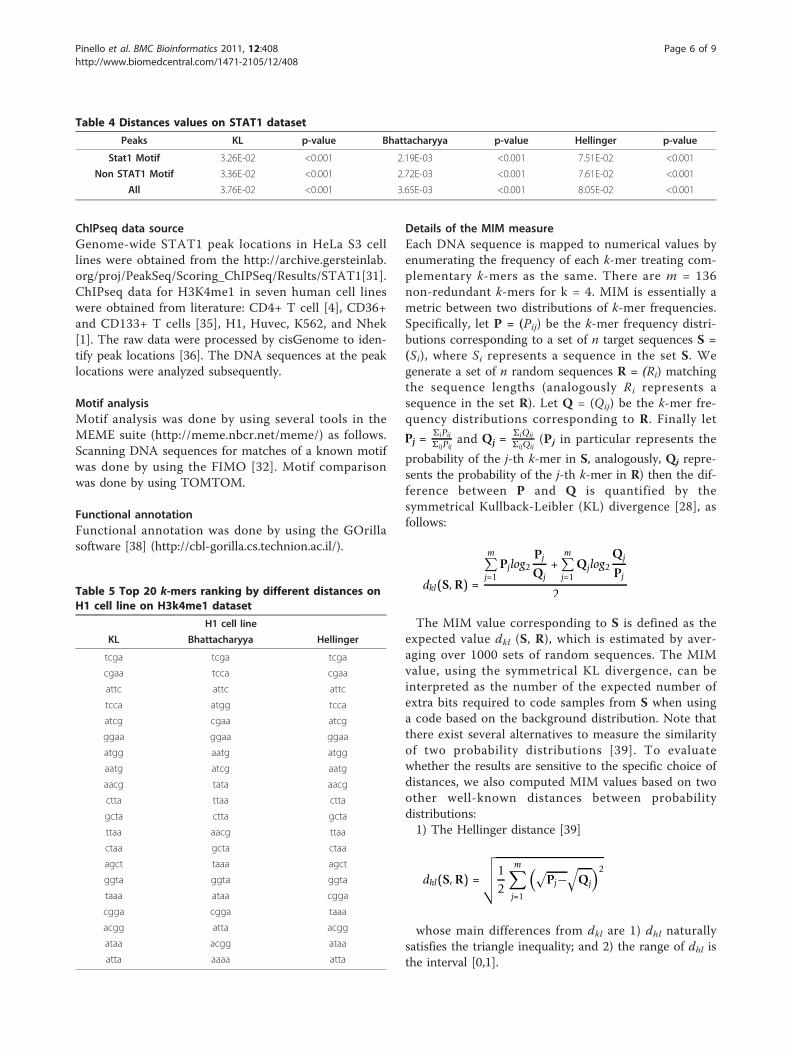
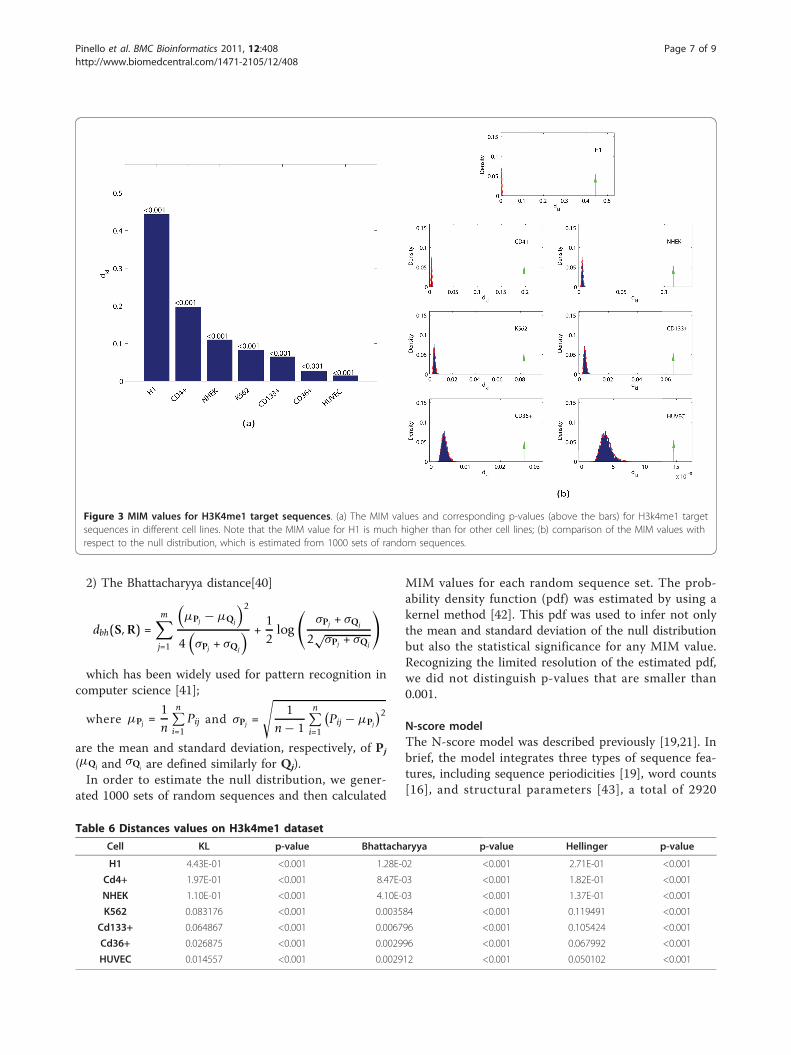
complex (p < 10-12), the motif-absent targets are highlyenriched for cytoplasmic components instead (p < 10-12).H3K4me1Unlike TFs, histone (de)modifying enzymes usually do notdirectly interact with DNA. The role of DNA sequences inthe regulation of histone modification patterns remainspoorly understood. As an example, the histone modifica-tion H3K4me1 plays an important role in gene regulationby demarcating cell-type specific enhancers [6]; yet how itis recruited to enhancer regions is poorly understood. Wehypothesized that the role of DNA sequence may play acell-type specific role and aimed to detect such differencesby using our MIM measure. To this end, we assembled anH3K4me1 ChIPseq dataset in seven human cell-lines,including H1 (a human embryonic stem cell line), K562 (amyelogenous leukemia cell line), Huvec (human umbilicalvein endothelial cells), Nhek (normal human epidermalkeratinocytes), and three T cell-lines (CD4+, CD36+, andCD133+) from the public domain [1,4,35]. For each cellline, we identified the peak locations by using cisGenome[36] then calculated the MIM value for DNA sequences atthe peaks (in Table 5 the top 20 k-mers ranking by differ-ent distances on H1 cell line). The MIM values are highlycell-type specific (see Figure 3a and 3b and Table 6).
Figure 1 MIM values for simulated sequences. (a) The MIM values and corresponding p-values (above the bars) for the simulated data. Notethat the MIM values change in the same direction as motif strength; (b) comparison of the MIM values with respect to the null distribution,which is obtained by using 1000 sets of random sequences.
Pinello et al. BMC Bioinformatics 2011, 12:408http://www.biomedcentral.com/1471-2105/12/408
Page 3 of 9
Interestingly, the value for H1 cells is much higher thanany other cell line, suggesting that the DNA sequenceplays a unique role in H3K4me1 recruitment in ES cells.To eliminate the possibility that this difference may besimply due to a GC content related bias, we repeated theanalysis by using a different null model, obtained by ran-dom shuffling the original sequences within each dataset.While the MIM values slightly change, they are ordered innearly the same way as before (Additional File 1). Impor-tantly, the MIM values are distinctively higher in the H1cell line compared to the other cell lines, suggesting thatsuch differences are unlikely due to a GC- content relatedbias.Since the H3K4me1 marks cell-type specific enhan-
cers, one possible explanation for the high sequence
specificity in ES cells is that the targets might be asso-ciated with a few ES-specific TFs. To test this possibility,we searched for enrichment of TF motifs in the JASPARdatabase using FIMO. Surprisingly, we were unable tofind any significantly-enriched motif, suggesting that thespecificity is contributed to a different mechanism.We then investigated whether the H3K4me1 targets in
ES cells are indeed highly predictable. In previous work,we developed a sequence-based model, called the N-score model, to predict epigenetic targets [19,21]. Thismodel integrates information from three classes ofsequence features (sequence periodicity, word counts,and DNA structural parameters) by using stepwise logis-tic regression model (see methods for details). Here weapplied the N-score model to predict H3K4me1 targetsequences. As negative control, we selected the samenumber of sequences from the genome at random. Weevaluated the model performance by using a 3-fold cross-validation. We found that prediction accuracy is indeedhigh for ES cells (AUC = 0.967) (Figure 4), whereas theaccuracy for other cell types is much lower.
DiscussionRecently it has been shown that a large number of pro-teins may weakly bind to DNA [37]. It remains unclearto what extent such events are mediated by specificsequence information. This question cannot beanswered by using traditional motif analysis, since thetarget sequences do not contain distinct motifs. As analternative approach, we define a simple measure, calledMIM, to quantify sequence specificity by aggregatinginformation from all k-mers. Our approach does notmake any assumptions regarding motif presence, provid-ing a more versatile tool for sequence analysis. We vali-dated this method by analyzing both simulated andexperimental data and found that it is indeed effectivefor detecting sequence specificity in both cases.We also showed that the MIM measure can provide
new biological insights. Specifically, we found that themotif-absent targets of a TF may also contain specificsequence information due to interaction with other TFs.We also found that the sequence specificity forH3K4me1 targets is higher in ES cells than in differen-tiated cell-types, suggesting a unique role of DNAsequence in the recruitment of H3K4me1 in ES cells.Interestingly, this high specificity cannot be explained byenrichment of known TF motifs, suggesting a yetuncharacterized recruitment mechanism in ES cells. TheMIM algorithm is implemented in Python and can befreely accessed at : https://github.com/lucapinello/mim.
ConclusionThe role of DNA sequence in gene regulation remainsincompletely understood. Our MIM method has
Table 1 Top 20 k-mers ranked by different distances onCell1 of Synthetic dataset
Cell1
KL Bhattacharyya Hellinger
tcaa tcaa tcaa
gaca gaca gaca
gtca gtca gtca
acag acag acag
caag caag caag
attg caac attg
acat acac acat
caac attg caac
acac acat acac
aatg aatg aatg
acaa acaa acaa
ttaa cgga ttaa
aaat caaa aaat
cgga gacc cgga
caaa agat caaa
aatt aaat aatt
cata taaa cata
gacc ccgc gacc
agat cgcc agat
gtaa aagg gtaa
agat cgcc agat
Table 2 Distances values on Synthetic dataset
Cell KL p-value Bhattacharyya p-value Hellinger p-value
1 4.12E-03 <0.001 2.18E-03 <0.001 2.67E-02 <0.001
2 3.64E-03 <0.001 1.93E-03 <0.001 2.51E-02 <0.001
3 4.06E-03 <0.001 2.16E-03 <0.001 2.65E-02 <0.001
4 3.23E-03 <0.001 1.70E-03 <0.001 2.36E-02 <0.001
5 2.06E-03 <0.001 1.07E-03 <0.001 1.89E-02 <0.001
6 9.59E-04 <0.001 5.03E-04 <0.001 1.29E-02 <0.001
7 7.80E-04 0.0262 4.09E-04 0.0497 1.16E-02 0.0207
8 6.27E-04 0.2367 3.75E-04 0.1670 1.04E-02 0.2467
Pinello et al. BMC Bioinformatics 2011, 12:408http://www.biomedcentral.com/1471-2105/12/408
Page 4 of 9

extended previous work by further accounting forsequence specificity due to accumulation of weaksequence features. The information can be used as aguide to systematically investigate the regulatorymechanisms for a wide variety of biological processes.
MethodsSynthetic data generationWe simulated ChIPseq data for a TF whose motifsequence is TTGACA. In order to simulate the variationof motif sites among different target sequences, wemodeled the position weight matrix (PWM) as illu-strated in Table 7, where ε measures the mutation rateof the motif and can change between 0 (perfect motif)and 0.25 (totally random). We sampled ε at 8 differentvalues: 0, 0.001, 0.005, 0.01, 0.05, 0.1, 0.1667, and 0.25.For each choice of ε, we generated 2000 sequences of500 bp each. The sequences were initially generated byrandomly sampling from the background distributionwith the probabilities of A,C,G,T equal to 0.15, 0.35,0.35, 0.15, respectively. In addition, we randomlyselected a subset of 1000 sequences and inserted themotif at a random location.
Figure 2 MIM values for STAT1 target sequences. (a) The MIM values and corresponding p-values (above the bars) for different subsets ofSTAT1 target sequences: all targets, STAT1 motif containing ones, and STAT1 motif absent ones; (b) comparison of the MIM values with respectto the null distribution, which is estimated by using 1000 sets of random sequences.
Table 3 Top 20 k-mers ranked by different distances onmotif sequences on STAT1 dataset
STAT1 Motif
KL Bhattacharyya Hellinger
aata atat aata
ttaa tata ttaa
aaat aata aaat
aaaa ttaa aaaa
ggaa atta ggaa
atat aaat atat
atac taaa atac
tcaa atac tcaa
aatt aatt aatt
acat ataa acat
taca taca taca
aggg cata aggg
cgga aaaa cgga
atta attg atta
attg acat attg
taga tcaa taga
caaa agcg caaa
acta gata acta
ccag taga ccag
agca cgga agca
Pinello et al. BMC Bioinformatics 2011, 12:408http://www.biomedcentral.com/1471-2105/12/408
Page 5 of 9
ChIPseq data sourceGenome-wide STAT1 peak locations in HeLa S3 celllines were obtained from the http://archive.gersteinlab.org/proj/PeakSeq/Scoring_ChIPSeq/Results/STAT1[31].ChIPseq data for H3K4me1 in seven human cell lineswere obtained from literature: CD4+ T cell [4], CD36+and CD133+ T cells [35], H1, Huvec, K562, and Nhek[1]. The raw data were processed by cisGenome to iden-tify peak locations [36]. The DNA sequences at the peaklocations were analyzed subsequently.
Motif analysisMotif analysis was done by using several tools in theMEME suite (http://meme.nbcr.net/meme/) as follows.Scanning DNA sequences for matches of a known motifwas done by using the FIMO [32]. Motif comparisonwas done by using TOMTOM.
Functional annotationFunctional annotation was done by using the GOrillasoftware [38] (http://cbl-gorilla.cs.technion.ac.il/).
Details of the MIM measureEach DNA sequence is mapped to numerical values byenumerating the frequency of each k-mer treating com-plementary k-mers as the same. There are m = 136non-redundant k-mers for k = 4. MIM is essentially ametric between two distributions of k-mer frequencies.Specifically, let P = (Pij) be the k-mer frequency distri-butions corresponding to a set of n target sequences S =(Si), where Si represents a sequence in the set S. Wegenerate a set of n random sequences R = (Ri) matchingthe sequence lengths (analogously Ri represents asequence in the set R). Let Q = (Qij) be the k-mer fre-quency distributions corresponding to R. Finally let
Pj = �iPij
�ijPijand Qj = �iQij
�ijQij(Pj in particular represents the
probability of the j-th k-mer in S, analogously, Qj repre-sents the probability of the j-th k-mer in R) then the dif-ference between P and Q is quantified by thesymmetrical Kullback-Leibler (KL) divergence [28], asfollows:
dkl(S, R) =
m∑j=1
Pjlog2Pj
Qj+
m∑j=1
Qjlog2Qj
Pj
2
The MIM value corresponding to S is defined as theexpected value dkl (S, R), which is estimated by aver-aging over 1000 sets of random sequences. The MIMvalue, using the symmetrical KL divergence, can beinterpreted as the number of the expected number ofextra bits required to code samples from S when usinga code based on the background distribution. Note thatthere exist several alternatives to measure the similarityof two probability distributions [39]. To evaluatewhether the results are sensitive to the specific choice ofdistances, we also computed MIM values based on twoother well-known distances between probabilitydistributions:1) The Hellinger distance [39]
dhl(S, R) =
√√√√12
m∑j=1
(√Pj−
√Qj
)2
whose main differences from dkl are 1) dhl naturallysatisfies the triangle inequality; and 2) the range of dhl isthe interval [0,1].
Table 4 Distances values on STAT1 dataset
Peaks KL p-value Bhattacharyya p-value Hellinger p-value
Stat1 Motif 3.26E-02 <0.001 2.19E-03 <0.001 7.51E-02 <0.001
Non STAT1 Motif 3.36E-02 <0.001 2.72E-03 <0.001 7.61E-02 <0.001
All 3.76E-02 <0.001 3.65E-03 <0.001 8.05E-02 <0.001
Table 5 Top 20 k-mers ranking by different distances onH1 cell line on H3k4me1 dataset
H1 cell line
KL Bhattacharyya Hellinger
tcga tcga tcga
cgaa tcca cgaa
attc attc attc
tcca atgg tcca
atcg cgaa atcg
ggaa ggaa ggaa
atgg aatg atgg
aatg atcg aatg
aacg tata aacg
ctta ttaa ctta
gcta ctta gcta
ttaa aacg ttaa
ctaa gcta ctaa
agct taaa agct
ggta ggta ggta
taaa ataa cgga
cgga cgga taaa
acgg atta acgg
ataa acgg ataa
atta aaaa atta
Pinello et al. BMC Bioinformatics 2011, 12:408http://www.biomedcentral.com/1471-2105/12/408
Page 6 of 9
2) The Bhattacharyya distance[40]
dbh(S, R) =m∑
j=1
(μPj − μQj
)2
4(σPj + σQj
) +12
log
(σPj + σQj
2√σPj + σQj
)
which has been widely used for pattern recognition incomputer science [41];
where μPj =1n
n∑i=1
Pij and σPj =
√1
n − 1
n∑i=1
(Pij − μPj
)2
are the mean and standard deviation, respectively, of Pj
(μQj and σQj are defined similarly for Qj).In order to estimate the null distribution, we gener-
ated 1000 sets of random sequences and then calculated
MIM values for each random sequence set. The prob-ability density function (pdf) was estimated by using akernel method [42]. This pdf was used to infer not onlythe mean and standard deviation of the null distributionbut also the statistical significance for any MIM value.Recognizing the limited resolution of the estimated pdf,we did not distinguish p-values that are smaller than0.001.
N-score modelThe N-score model was described previously [19,21]. Inbrief, the model integrates three types of sequence fea-tures, including sequence periodicities [19], word counts[16], and structural parameters [43], a total of 2920
Figure 3 MIM values for H3K4me1 target sequences. (a) The MIM values and corresponding p-values (above the bars) for H3k4me1 targetsequences in different cell lines. Note that the MIM value for H1 is much higher than for other cell lines; (b) comparison of the MIM values withrespect to the null distribution, which is estimated from 1000 sets of random sequences.
Table 6 Distances values on H3k4me1 dataset
Cell KL p-value Bhattacharyya p-value Hellinger p-value
H1 4.43E-01 <0.001 1.28E-02 <0.001 2.71E-01 <0.001
Cd4+ 1.97E-01 <0.001 8.47E-03 <0.001 1.82E-01 <0.001
NHEK 1.10E-01 <0.001 4.10E-03 <0.001 1.37E-01 <0.001
K562 0.083176 <0.001 0.003584 <0.001 0.119491 <0.001
Cd133+ 0.064867 <0.001 0.006796 <0.001 0.105424 <0.001
Cd36+ 0.026875 <0.001 0.002996 <0.001 0.067992 <0.001
HUVEC 0.014557 <0.001 0.002912 <0.001 0.050102 <0.001
Pinello et al. BMC Bioinformatics 2011, 12:408http://www.biomedcentral.com/1471-2105/12/408
Page 7 of 9

candidate features. Model selection was done by step-wise logistic regression. The final model was used fortarget prediction.
Most informative k-mers selectionGiving Pj and Qj associated to S and R respectively, it ispossible to calculate their Kullback-Leibler (KL) diver-gence for each j, where j indicates the j-th k-mer com-ponent. This results in a list of 136 distance values,whose ranking can be used as a guide to identify themost informative k-mers.
Additional material
Additional file 1: Choice of the null model for sequence specificity.(a) The MIM values for H3k4me1 target sequences in different cell linesexperiment with a null model obtained shuffling the original sequences.(b) The MIM values for the same experiment using as a null model a setof random sequences extracted from genome with matching lengths.Note that the the H1 cell line is far more specific than the other celllines independently of the null model chosen.
AcknowledgementsWe thank Zhen Shao for help with H3K4me1 data collection and initialprocessing. GY’s research was supported by the NIH grant HG005085 and aCareer Incubator Award from the Harvard School of Public Health.
Author details1Department of Biostatistics, Harvard School of Public Health, 677Huntington Avenue, Boston MA 02115, USA. 2Department of Biostatisticsand Computational Biology, Dana-Farber Cancer Institute, 44 Binney Street,Boston MA 02115, USA. 3Dipartimento di Matematica ed Informatica, ViaArchirafi 34, Palermo 90123, Italy. 4Department of Statistics, University ofWisconsin, 1300 University Ave Madison, WI 53706, USA.
Authors’ contributionsLP and GY conceived and designed the study. LP and GL have implementedthe MIM methodology. LP and BH analyzed the data. LP and GY interpretedthe data. All authors wrote, read and approved the manuscript.
Received: 26 July 2011 Accepted: 21 October 2011Published: 21 October 2011
References1. Birney E, et al: Identification and analysis of functional elements in 1% of
the human genome by the ENCODE pilot project. Nature 2007,447(7146):799-816.
2. TCGA: Comprehensive genomic characterization defines humanglioblastoma genes and core pathways. Nature 2008, 455(7216):1061-8.
3. Bussemaker HJ, Li H, Siggia ED: Regulatory element detection using aprobabilistic segmentation model. Proc Int Conf Intell Syst Mol Biol 2000,8:67-74.
4. Barski A, et al: High-resolution profiling of histone methylations in thehuman genome. Cell 2007, 129(4):823-37.
5. Mikkelsen TS, et al: Genome-wide maps of chromatin state in pluripotentand lineage-committed cells. Nature 2007, 448(7153):553-60.
6. Heintzman ND, et al: Histone modifications at human enhancers reflectglobal cell-type-specific gene expression. Nature 2009, 459(7243):108-12.
7. Crawford GE, et al: Genome-wide mapping of DNase hypersensitive sitesusing massively parallel signature sequencing (MPSS). Genome Res 2006,16(1):123-31.
8. Yeang CH, Ideker T, Jaakkola T: Physical network models. J Comput Biol2004, 11(2-3):243-62.
9. Harbison CT, et al: Transcriptional regulatory code of a eukaryoticgenome. Nature 2004, 431(7004):99-104.
10. Zhou Q, et al: A gene regulatory network in mouse embryonic stemcells. Proc Natl Acad Sci USA 2007, 104(42):16438-43.
11. Chang LW, et al: Computational identification of the normal andperturbed genetic networks involved in myeloid differentiation andacute promyelocytic leukemia. Genome Biol 2008, 9(2):R38.
12. Kouzarides T: Chromatin modifications and their function. Cell 2007,128(4):693-705.
13. Jiang C, Pugh BF: Nucleosome positioning and gene regulation:advances through genomics. Nat Rev Genet 2009, 10(3):161-72.
14. Sekinger EA, Moqtaderi Z, Struhl K: Intrinsic histone-DNA interactions andlow nucleosome density are important for preferential accessibility ofpromoter regions in yeast. Mol Cell 2005, 18(6):735-48.
15. Yuan GC, et al: Genome-scale identification of nucleosome positions in S.cerevisiae. Science 2005, 309(5734):626-30.
16. Peckham HE, et al: Nucleosome positioning signals in genomic DNA.Genome Res 2007, 17(8):1170-7.
17. Tillo D, Hughes TR: G+C content dominates intrinsic nucleosomeoccupancy. BMC Bioinformatics 2009, 10:442.
18. Field Y, et al: Distinct modes of regulation by chromatin encodedthrough nucleosome positioning signals. PLoS Comput Biol 2008, 4(11):e1000216.
19. Yuan GC, Liu JS: Genomic sequence is highly predictive of localnucleosome depletion. PLoS Comput Biol 2008, 4(1):e13.
20. Ku M, et al: Genomewide analysis of PRC1 and PRC2 occupancyidentifies two classes of bivalent domains. PLoS Genet 2008, 4(10):e1000242.
21. Yuan GC: Targeted recruitment of histone modifications in humanspredicted by genomic sequences. J Comput Biol 2009, 16(2):341-55.
Figure 4 N-score prediction of H3K4me1 target sequences.Receiver operating characteristic (ROC) curves for different cell linesusing the N-score. Note as the AUC for H1 is much higher than forother cell lines.
Table 7 PWM for synthetic motif generation
1 2 3 4 5 6
A ε ε ε 1-3ε ε 1-3ε
C ε ε ε ε 1-3ε ε
G ε ε 1-3ε ε ε ε
T 1-3ε 1-3ε ε ε ε ε
Pinello et al. BMC Bioinformatics 2011, 12:408http://www.biomedcentral.com/1471-2105/12/408
Page 8 of 9

22. Bock C, et al: CpG island methylation in human lymphocytes is highlycorrelated with DNA sequence, repeats, and predicted DNA structure.PLoS Genet 2006, 2(3):e26.
23. Das R, et al: Computational prediction of methylation status in humangenomic sequences. Proc Natl Acad Sci USA 2006, 103(28):10713-6.
24. Salzberg SL: A method for identifying splice sites and translational startsites in eukaryotic mRNA. Comput Appl Biosci 1997, 13(4):365-76.
25. DeCaprio D, et al: Conrad: gene prediction using conditional randomfields. Genome Res 2007, 17(9):1389-98.
26. Narlikar L, et al: Genome-wide discovery of human heart enhancers.Genome Res 2010, 20(3):381-92.
27. Ji H, Wong WH: Computational biology: toward deciphering generegulatory information in mammalian genomes. Biometrics 2006,62(3):645-63.
28. Kullback S, Leibler RA: On Information and Sufficiency. The Annals ofMathematical Statistics 1951, 22(1):79-86.
29. Sandelin A, et al: JASPAR: an open-access database for eukaryotictranscription factor binding profiles. Nucleic Acids Res 2004, , 32 Database:D91-4.
30. Bussemaker HJ, Li H, Siggia ED: Building a dictionary for genomes:identification of presumptive regulatory sites by statistical analysis. ProcNatl Acad Sci USA 2000, 97(18):10096-100.
31. Rozowsky J, et al: PeakSeq enables systematic scoring of ChIP-seqexperiments relative to controls. Nat Biotechnol 2009, 27(1):66-75.
32. Grant CE, Bailey TL, Noble WS: FIMO: scanning for occurrences of a givenmotif. Bioinformatics 2011, 27(7):1017-8.
33. Look DC, et al: Stat1 depends on transcriptional synergy with Sp1. J BiolChem 1995, 270(51):30264-7.
34. Panchanathan R, et al: Mutually positive regulatory feedback loopbetween interferons and estrogen receptor-alpha in mice: implicationsfor sex bias in autoimmunity. PLoS One 2010, 5(5):e10868.
35. Cui K, et al: Chromatin signatures in multipotent human hematopoieticstem cells indicate the fate of bivalent genes during differentiation. CellStem Cell 2009, 4(1):80-93.
36. Ji H, et al: An integrated software system for analyzing ChIP-chip andChIP-seq data. Nat Biotechnol 2008, 26(11):1293-300.
37. Hu S, et al: Profiling the human protein-DNA interactome reveals ERK2as a transcriptional repressor of interferon signaling. Cell 2009,139(3):610-22.
38. Eden E, et al: GOrilla: a tool for discovery and visualization of enrichedGO terms in ranked gene lists. BMC Bioinformatics 2009, 10:48.
39. Deza E, Deza MM: Dictionary of distances. Elsevier; 2006.40. Theodoridis S, Koutroumbas K: Pattern Recognition. Academic Press;,
Fourth 2009.41. Kailath T: The Divergence and Bhattacharyya Distance Measures in Signal
Selection. Communications, IEEE Transactions on [legacy, pre - 1988] 1967,15(1):52-60.
42. Bowman AW, Azzalini A: Applied Smoothing Techniques for DataAnalysis. Oxford Univeristy Press; 1997.
43. Lee W, et al: A high-resolution atlas of nucleosome occupancy in yeast.Nat Genet 2007, 39(10):1235-44.
doi:10.1186/1471-2105-12-408Cite this article as: Pinello et al.: A motif-independent metric for DNAsequence specificity. BMC Bioinformatics 2011 12:408.
Submit your next manuscript to BioMed Centraland take full advantage of:
• Convenient online submission
• Thorough peer review
• No space constraints or color figure charges
• Immediate publication on acceptance
• Inclusion in PubMed, CAS, Scopus and Google Scholar
• Research which is freely available for redistribution
Submit your manuscript at www.biomedcentral.com/submit
Pinello et al. BMC Bioinformatics 2011, 12:408http://www.biomedcentral.com/1471-2105/12/408
Page 9 of 9
Related Documents