See discussions, stats, and author profiles for this publication at: http://www.researchgate.net/publication/50851248 A Molecular Phylogeny of Living Primates ARTICLE in PLOS GENETICS · MARCH 2011 Impact Factor: 7.53 · DOI: 10.1371/journal.pgen.1001342 · Source: PubMed CITATIONS 292 READS 85 14 AUTHORS, INCLUDING: Julie Horvath North Carolina Museum of Natural Sciences 16 PUBLICATIONS 1,132 CITATIONS SEE PROFILE Miguel Moreira Brazilian National Cancer Institute 51 PUBLICATIONS 1,200 CITATIONS SEE PROFILE Bailey Douglas Kessing Leidos Biomedical Research 33 PUBLICATIONS 2,156 CITATIONS SEE PROFILE Available from: Christian Roos Retrieved on: 09 October 2015

Welcome message from author
This document is posted to help you gain knowledge. Please leave a comment to let me know what you think about it! Share it to your friends and learn new things together.
Transcript
Seediscussions,stats,andauthorprofilesforthispublicationat:http://www.researchgate.net/publication/50851248
AMolecularPhylogenyofLivingPrimates
ARTICLEinPLOSGENETICS·MARCH2011
ImpactFactor:7.53·DOI:10.1371/journal.pgen.1001342·Source:PubMed
CITATIONS
292
READS
85
14AUTHORS,INCLUDING:
JulieHorvath
NorthCarolinaMuseumofNaturalSciences
16PUBLICATIONS1,132CITATIONS
SEEPROFILE
MiguelMoreira
BrazilianNationalCancerInstitute
51PUBLICATIONS1,200CITATIONS
SEEPROFILE
BaileyDouglasKessing
LeidosBiomedicalResearch
33PUBLICATIONS2,156CITATIONS
SEEPROFILE
Availablefrom:ChristianRoos
Retrievedon:09October2015

A Molecular Phylogeny of Living PrimatesPolina Perelman1¤, Warren E. Johnson1, Christian Roos2, Hector N. Seuanez3, Julie E. Horvath4,
Miguel A. M. Moreira3, Bailey Kessing5, Joan Pontius5, Melody Roelke5, Yves Rumpler6, Maria Paula C.
Schneider7, Artur Silva7, Stephen J. O’Brien1, Jill Pecon-Slattery1*
1 Laboratory of Genomic Diversity, National Cancer Institute–Frederick, Frederick, Maryland, United States of America, 2 Gene Bank of Primates and Primate Genetics
Laboratory, German Primate Center, Gottingen, Germany, 3 Division of Genetics, Instituto Nacional de Cancer and Department of Genetics, Universidade Federal do Rio de
Janeiro, Rio de Janeiro, Brazil, 4 Department of Evolutionary Anthropology and Institute for Genome Sciences and Policy, Duke University, Durham, North Carolina, United
States of America, 5 SAIC–Frederick, Laboratory of Genomic Diversity, National Cancer Institute–Frederick, Frederick, Maryland, United States of America,
6 Physiopathologie et Medecine Translationnelle, Faculte de Medecine, Universite Louis Pasteur, Strasbourg, France, 7 Universidade Federal do Para, Belem, Brazil
Abstract
Comparative genomic analyses of primates offer considerable potential to define and understand the processes that mold,shape, and transform the human genome. However, primate taxonomy is both complex and controversial, with marginalunifying consensus of the evolutionary hierarchy of extant primate species. Here we provide new genomic sequence(,8 Mb) from 186 primates representing 61 (,90%) of the described genera, and we include outgroup species fromDermoptera, Scandentia, and Lagomorpha. The resultant phylogeny is exceptionally robust and illuminates events inprimate evolution from ancient to recent, clarifying numerous taxonomic controversies and providing new data on humanevolution. Ongoing speciation, reticulate evolution, ancient relic lineages, unequal rates of evolution, and disparatedistributions of insertions/deletions among the reconstructed primate lineages are uncovered. Our resolution of the primatephylogeny provides an essential evolutionary framework with far-reaching applications including: human selection andadaptation, global emergence of zoonotic diseases, mammalian comparative genomics, primate taxonomy, andconservation of endangered species.
Citation: Perelman P, Johnson WE, Roos C, Seuanez HN, Horvath JE, et al. (2011) A Molecular Phylogeny of Living Primates. PLoS Genet 7(3): e1001342.doi:10.1371/journal.pgen.1001342
Editor: Jurgen Brosius, University of Munster, Germany
Received September 15, 2010; Accepted February 16, 2011; Published March 17, 2011
This is an open-access article, free of all copyright, and may be freely reproduced, distributed, transmitted, modified, built upon, or otherwise used by anyone forany lawful purpose. The work is made available under the Creative Commons CC0 public domain dedication.
Funding: This project has supported with federal funds from the National Cancer Institute, National Institutes of Health, under contract N01-CO-12400. Thisresearch has been supported (in part) by the Intramural Research Program of the NIH, NCI, Center for Cancer Research, the Duke Primate Genomics Initiative, andInstitute for Genome Sciences and Policy at Duke University. In Brazil, support included CNPq grant 303583/2007-0 (HNS) and CNPq grant 304403/2008-3(MAMM). The content of this publication does not necessarily reflect the views or policies of the Department of Health and Human Services, nor does its mentionof trade names, commercial products, or organizations imply endorsement by the U.S. Government. The funders had no role in study design, data collection andanalysis, decision to publish, or preparation of manuscript.
Competing Interests: The authors have declared that no competing interests exist.
* E-mail: [email protected]
¤ Current address: Laboratory of Cytogenetics of Animals, Institute of Chemical Biology and Fundamental Medicine, Novosibirsk, Russia
Introduction
The human genome project has revolutionized such fields as
genomics, proteomics and medicine. Markedly absent from these
many advances however, is a formal evolutionary context to
interpret these findings, as the phylogenetic hierarchy of primate
species has only modest local (family and genus level) molecular
resolution with little consensus on overall primate radiations. The
exact number of primate genera is controversial and species counts
range from 261–377 [1-3]. Although whole genome sequencing of
12 primate species are now completed, or nearly so, broader
genome representation of man’s closest relatives is necessary to
interpret human evolution, adaptation and genome structure to
assist in biomedical advances.
Primate taxonomy has undergone considerable revision but
current views [1-3] concur that 67–69 primate genera originated
from a common ancestor during the Cretaceous/Paleocene
boundary roughly 80–90 MYA. An Eocene expansion formed
the major extant lineages of 1) Strepsirrhini, which is composed of
Lorisiformes (galagos, pottos, lorises), Chiromyiformes (Malagasy
aye-aye) and Lemuriformes (Malagasy lemurs); 2) Tarsiiformes
(tarsiers) and 3) Simiiformes composed of Platyrrhini (New World
monkeys) and Catarrhini, which includes Cercopithecoidea (Old
World monkeys) and Hominoidea (human, great apes, gibbons)
(see Figure 1). Primate taxonomy, initially imputed from
morphological, adaptive, bio-geographical, reproductive and
behavioral traits, with inferences from the fossil record [1-3] is
complex. Recent application of molecular genetic data to resolve
primate systematics has been informative, but limited in scope and
constrained to just specific subsets of taxa. Efforts to overcome this
deficiency using a supermatrix approach [4,5] with published
sequences culled from these prior studies are inherently flawed by
a prohibitively large proportion of missing data for each taxon (e.g.
59–85% see [5]).
Here we employ large-scale sequencing and extensive taxon
sampling to provide a highly resolved phylogeny that affirms,
reforms and extends previous depictions of primate speciation. In
turn, the clarity of the primate phylogeny forms a solid framework
for a novel depiction of diverse patterns of genome evolution
among primate lineages. Such insights are essential in ongoing and
future comparative genomic investigation of adaptation and
selection in humans and across primates.
PLoS Genetics | www.plosgenetics.org 1 March 2011 | Volume 7 | Issue 3 | e1001342

Results/Discussion
A comprehensive molecular phylogeny based on 34,927 bp
(after correction for ambiguous sites from the original dataset of
43,493 bp per operational taxonomic unit, OTU) amplified from
54 nuclear genes in 191 taxa including 186 primates representing
61 genera is presented (Figure 1, Figure 2, Figure S1, Table S1,
and Table S2). The phylogeny is highly resolved, with bootstrap
values of 90–100% and Bayesian posterior probabilities of 0.9–1.0
at 166 of the 189 nodes (88%)(Table 1, Table 2, Table 3). Further,
only 3 of 189 nodes (nodes 28, 38, 158) are polytomies in the
bootstrap analyses (Table 1 and Table 3; Figure 2, Figure S1).
(Note: nodes listed hereafter refer to Figure 2, Figure S1, Table 1, Table 2,
Table 3). Roughly equal amounts of coding (14742 bp) and non-
coding (17185 bp) genomic regions were sampled from X
chromosome (4870 bp), Y chromosome (2630 bp) and autosomes
(27427 bp) (Table 4) using newly developed PCR primers derived
from a bioinformatics approach specific to primates in addition to
primers from previous large-scale phylogenetic analyses (Materials
and Methods, Tables S2, S3, S4).
Separate phylogenetic analyses of these data partitions are
generally concordant. The greatest proportion of phylogenetically
informative sites occurred in Y-linked genes (56%) compared with
regions sequenced from the X-chromosome (40%) and autosomes
(42%) (Table 4, Table S4), a finding also observed in carnivores
[6,7]. However, greater frequency of phylogenetic inconsistencies
or unresolved nodes occur in these subset trees (Figures S2, S3, S4,
S5, S6, S7, S8, S9, S10, S11, S12, S13), compared with the entire
concatenated data set (Figure 2, Figure S1). Thus, these findings
illustrate the need for both genome-wide datasets and maximum
representation of species to resolve differences among previous
studies that used only single genes, the uniparentally inherited
mtDNA molecular marker and smaller numbers of primate taxa.
Resolution of Early Primate DivergenceThe relative placement of suborder Strepsirrhini and infraorder
Tarsiiformes at an early stage of primate evolution has been
difficult to resolve [8-11]. Presently distributed in the islands of
Borneo, Sumatra, Sulawesi and the Philippines, Tarsiiformes had
a broad Holarctic distribution during the Eocene [10]. Phyloge-
netic placement of tarsiers has alternatively been defined as 1)
sister taxa to Strepsirrhini to form Prosimii [2,8,12], 2) allied with
Simiiformes (Anthropoidea) to form Haplorrhini [1,13,14] and 3)
a separate relict lineage with an independent origin [15]. Here we
provide strong evidence that strepsirrhines split with suborder
Haplorrhini approximately 87 MYA (node 185). The ancient
lineage is monophyletic and defined by a long branch and eight
shared insertions/deletions (indels) (node 144). Rooted by
Lagomorpha, the phylogeny affirms Dermoptera as the closest
mammalian order relative to Primates, followed by Scandentia
[16,17].
A long continuous Tarsiiformes branch (node 142), marked by
25 synapomorphic indels, is consistent with a relict lineage of
ancient origin. The sequence phylogeny unambiguously supports
tarsiers as a sister lineage (albeit distant) to Simiiformes (BS = 85
MP; 98 ML; 0.99 PP) to form Haplorrhini (node 143). A few indels
(Table S5) define alternate evolutionary topologies, such as tarsiers
aligned with Strepsirrhini (1 indel, ZFX) or Scandentia (1 indel,
DCTN2), compared with those that support an ancestral grouping
of Tarsiiformes +Strepsirrhini +Dermoptera +Scandentia (2 indels,
PLCB4, POLA1). These incongruent alternatives suggest further
investigation of more complex rare genomic changes as cladistic
markers of ancient speciation is needed [17,18].
StrepsirrhiniAided by samples of rare taxa, the phylogeny expands upon
recent findings [19-21] to better resolve long-standing questions on
the evolution of Lorisiformes and the two endemic Madagascar
infraorders of Chiromyiformes and Lemuriformes. Our data
affirm the ancient split of Strepsirrhini, approximately 68.7 MYA
(node 144), into the progenitors of Lemuriformes/Chiromyiformes
(origin 58.6 MYA, node 174) and Lorisiformes (origin 40.3 MYA,
node 184).
Lorisiformes evolution includes the radiation of Lorisidae
(pottos and lorises, 37 MYA, node 179) and Galagidae (19.9
MYA, node 183) species. Within Lorisidae, the four extant genera
split into the African subfamily Perodicticinae (Arctocebus, Perodictus)
and the Asian subfamily Lorisinae (Nycticebus, Loris) and are the
most divergent within all of primates. For example, mean
nucleotide divergence between Lorisidae species is 4–5 times that
observed in family Hominidae (Figure 3) and significantly
(p,0.05) exceed the average genetic divergence across all of
Strepsirrhini (nodes 176–178, Table S7, Figure 3). Galagidae are
found only in Africa and currently are divided into four genera.
However, the Otolemur lineage (node 180) is placed as part of a
paraphyletic grouping (node 182) along with two other extant
Galago lineages (nodes 181, 183), suggesting that further taxonomic
investigation of Galago is warranted.
Common ancestors of Chiromyiformes and Lemuriformes likely
colonized the island of Madagascar prior to 58.6 MYA (node 174).
Noted for extensive adaptive evolution, the relative hierarchical
branching patterns of the four Lemuriformes families (Indriidae,
Lepilemuridae, Lemuridae, Cheirogaleidae) recognized by taxon-
omists, has proven difficult to resolve conclusively. Inferences on
species versus subspecies classification are controversial with as
many as 97 Malagasy lemurs [22] under taxonomic review.
Chiromyiformes diverged from a common ancestor with Lemur-
iformes shortly after colonisation of Madagascar [14,19] and today
consists of a single relict genus Daubentonia defined by a long
branch with high indel frequency (N = 14) (Figure 2, Figure S1,
Table S7). The evolution of the four Lemuriformes families began
38.6 MYA (node 173) with the emergence of Lemuridae, followed
by Indriidae and a monophyletic lineage that split 32.9 MYA
(node 152) to form the sister lineages of Lepilemuridae and
Author Summary
Advances in human biomedicine, including those focusedon changes in genes triggered or disrupted in develop-ment, resistance/susceptibility to infectious disease, can-cers, mechanisms of recombination, and genome plastic-ity, cannot be adequately interpreted in the absence of aprecise evolutionary context or hierarchy. However, little isknown about the genomes of other primate species, asituation exacerbated by a paucity of nuclear molecularsequence data necessary to resolve the complexities ofprimate divergence over time. We overcome this deficien-cy by sequencing 54 nuclear gene regions from DNAsamples representing ,90% of the diversity present inliving primates. We conduct a phylogenetic analysis todetermine the origin, evolution, patterns of speciation, andunique features in genome divergence among primatelineages. The resultant phylogenetic tree is remarkablyrobust and unambiguously resolves many long-standingissues in primate taxonomy. Our data provide a strongfoundation for illuminating those genomic differences thatare uniquely human and provide new insights on thebreadth and richness of gene evolution across all primatelineages.
Primate Phylogeny
PLoS Genetics | www.plosgenetics.org 2 March 2011 | Volume 7 | Issue 3 | e1001342

Primate Phylogeny
PLoS Genetics | www.plosgenetics.org 3 March 2011 | Volume 7 | Issue 3 | e1001342

Cheirogaleidae. This branching pattern among families agrees
with earlier nuclear gene segment findings [20] that differ from
studies using mtDNA sequence and Alu insertion variation which
were unable to resolve these hierarchical associations [19].
Further, relatively weak nodal support here collapses Lemur-
iformes into an unresolved trichotomy of Lemuridae, Indriidae,
and the Lepilemuridae + Cheirogaleidae lineage (node 158).
Optimal resolution of this node is observed with exon sequences
(Figures S8 and S9), indicating that intron sites may be saturated,
while more conserved coding regions remain informative and
reflect the ancient rapid radiation of Lemuriformes families.
New World Primates (Platyrrhini)The phylogeny clarifies formerly unresolved questions concern-
ing New World primate evolution including branching order
among families, relative divergence of genera within families, and
phylogenetic placement of Aotus, and provides genetic support for
examples of adaptive evolution that led to nocturnalism, ‘‘phyletic
dwarfism’’ and species diversification within the Amazonian
rainforest. Here, Platyrrhini clearly diverged from a common
ancestor with Catarrhini (node 141) roughly 43.5 MYA during the
Eocene. Although questions remain about the route and nature of
primate colonization of the New World [23,24] and the impact of
historic global climate change in neotropical regions [25,26], the
phylogeny unambiguously resolves the relative divergence pattern
among families from a common ancestor 24.8 MYA (node 78).
The common ancestor to Pitheciidae (uakaris, titis and sakis)
originated 20.2 MYA (node 140) and the majority of these species
currently are distributed in the neotropical Amazonian basin
extending from the Andean slopes to the Atlantic. Next to radiate
are the Atelidae (node 126), with the most basal lineage leading to
Alouatta (howler monkeys), currently widely distributed from
Mexico to northern Argentina, followed by the divergence of
Ateles (spider monkeys) from South American lineage comprised of
sister genera (node 121) of Lagothrix (woolly monkeys) and
Brachyteles (muriquis).
The Cebidae radiation initiated with the emergence of sister
taxa Cebus (Cebinae) and Saimiri (Saimirinae) approximately 20
MYA (node 113), in agreement with other molecular studies [27-
30]. Subsequently, during a relatively brief interval (,700,000
years) a lineage arose (node 112) that split to form the
Callitrichinae (marmosets and tamarins) and Aotus (night mon-
keys). The Aotus lineage (node 98) radiated with unusually high
numbers of synapomorphic indels (N = 15), the most observed in
Simiiformes (Table 2 and Table 3), to form a complex species
group of controversial taxonomic designation as subfamily or
family and uncertainty over its exact placement relative to other
Cebidae lineages. Here, Aotus is the sister lineage to Callitrichinae
(marmosets, tamarins) as originally hypothesized by Goodman
(1998) [1,28]. Aotus species divide into sister lineages, with the
‘‘grey-necked’’ species (A. trivirgatus + A. lemurinus griseimembra)
distributed north of the Amazon River, and ‘‘red-necked’’ species
A. nancymaae, A. azarae species and associated subspecies located most
to the south (nodes 98, 101, 102). The unusual depth of divergence
(i.e. sizeable nucleotide substitutions/site; high indel frequency)
may exemplify adaptive speciation as Aotus are the only nocturnal
Simiiformes [31], and thereby may have reduced competition with
diurnal small-bodied platyrrhines inhabiting the same neotropical
environments.
Another case of adaptation termed ‘‘phyletic dwarfism,’’ defined
as a gradient in morphological size partially correlated with
evolutionary time [32], is supported in Cebidae. Aotus, Cebus and
Saimiri species are larger than the more derived and smaller
squirrel-sized Callitrichinae of Saguinus, Leontopithecus, Callimico,
Mico, Cebuella and Callithrix. In Callitrichinae, Saguinus is the first to
diverge with S. fuscicollis currently distributed south of the Amazon
River. Subsequently, the genus diversified into northern (S. bicolor,
S. midas, S. martinsi, S. geoffroyi, S. oedipus) and south Amazonian
species (S. imperator, S. mystax, S. labiatus); a trend generally similar
to findings based on mtDNA [33] and single nuclear genes [34].
The hierarchical branching order among the remaining Calli-
trichinae of Leontopithecus, Callimico, Callithrix and Mico mirrors
decreasing body size and culminates with the smallest platyrrhine
species, Cebuella pygmaea, as most derived. This phylogenetic
depiction of Callitrichinae is concordant with several other
morphological and reproductive traits [32,35] related to dwarfism
and perhaps reflects adaptive evolution selected by fluctuating
resource availability within the Amazon and Atlantic coast
rainforests [36].
Old World Primates (Cercopithecoidea)Cercopithecoidea (family Cercopithecidae) speciation patterns
are confounded by symplesiomorphic traits in morphology,
behavior and reproduction, and are further confused by
hybridization between sympatric species, subspecies and popula-
tions (summarized in [2]). Cercopithecidae includes two subfam-
ilies, Colobinae and Cercopithecinae, which diverged 18 MYA
(node 62), but classification schemes [2] are marked by
inconsistencies between morphological [37,38] and genetic data,
as well as differences among genetic data studies [4,27,39-44].
Colobinae radiation started approximately 12 MYA (node 42)
with species adapted to an arboreal, leaf-eating existence. Asian
(tribe Presbytini) and African (tribe Colobini) genera are
monophyletic (nodes 53 and 61, respectively), supporting earlier
genetic findings [4,40] over morphology-based taxonomy [2,45].
Whilst African genera Piliocolobus and Colobus are commonly
recognized, the taxonomic schemes for the critically endangered
Asian langur and leaf monkeys, all sharing digestive adaptations
for an arboreal folivorous diet, have ranged from a single genus
Presbytis to three distinct genera (Trachypithecus, Semnopithecus,
Presbytis). Here, the Presbytis lineage, distinguished by 3 indel
events (node 56), diverged first within Asian Colobinae, followed
by the odd-nosed group (Rhinopithecus, Nasalis, Pygathrix), Trachy-
pithecus and Semnopithecus. As odd-nosed species are not exclusively
arboreal and folivorous, the results indicate either 1) morpholog-
ical convergence between Presbytis with Trachypithecus and Semno-
Figure 1. The molecular phylogeny of 61 Primate genera, two Dermoptera genera, and one Scandentia genus and rooted byLagomorpha. Shown is the maximum likelihood tree based on 34,927 bp sequenced from 54 genes amplified from selected single speciesrepresenting each genus. All unmarked nodes have bootstrap support of 100%. Nodes with green circles have bootstrap proportions,70%, greycircles 71–80%, black circles 81–90% and red circles 91–99%. Boxes indicate genus of species with completed, nominated or draft whole genomesequence accomplished. Numbers in parenthesis next to each genus indicate number of species present in study followed by the total numberdescribed [3]. Numbers in parentheses next to family names indicate number of genera included in study followed by total described [3]. Numbers inbold refer to nodes on Figure 2, Figure S1, Table 1, Table 2, Table 3. Reference fossil dates used for calibration of tree in dating algorithms arerepresented by letters A-H on nodes (see Materials and Methods). Fossil dates are as follows and sources are listed in Materials and Methods: A)Galagidae-Lorisidae split 38–42 MYA, B) Simiiformes emerge 36–50 MYA, C) Catarrhini emerge 20–38 MYA, D) Platyrrhini emerge 20–27 MYA, E) TribePapionini emerge 6–8 MYA, F) Theropithecus emerge 3.5–4.5 MYA, G) Family Hominidae emerge 13–18 MYA, H) Homo-Pan split 6–7 MYA.doi:10.1371/journal.pgen.1001342.g001
Primate Phylogeny
PLoS Genetics | www.plosgenetics.org 4 March 2011 | Volume 7 | Issue 3 | e1001342

Table 1. Node Support, Branch Lengths, Divergence Times, and Nucleotide Substitution Rates for Strepsirrhini, Tarsiiformes, andOutgroups in Figure 2.
NodeFig. 2
Date(MY)
Date95% HPD Rate
Rate95% HPD
BranchLength (ML)*
BranchLength (MP)*
Indels perBranch*
NodeSupport (ML)
NodeSupport (MP)
PosteriorProbability
142 - - - ND 720.35 1374 25 100 100 ND
143 81.27 69.51 95.81 7.00 3.29 11.44 43.47 508 0 98 85 0.99
144 68.74 58.77 76.61 9.91 5.98 14.30 188.50 591 9 100 100 1.00
145 1.91 0.80 3.23 5.36 1.65 10.29 4.35 18 0 82 75 1.00
146 2.93 1.52 4.52 7.08 2.60 12.28 29.27 70 1 100 100 1.00
147 7.44 3.95 11.47 6.10 1.87 12.29 20.32 47 3 100 99 1.00
148 11.49 5.91 17.24 8.20 4.72 12.04 174.39 447 9 100 100 1.00
149 2.05 0.87 3.55 7.54 3.62 12.44 87.86 211 2 100 100 1.00
150 14.32 7.80 21.88 10.68 5.07 18.42 105.05 352 4 100 100 1.00
151 24.99 15.07 34.52 6.86 3.01 11.69 49.73 230 5 100 100 1.00
152 32.92 22.39 43.81 6.51 2.22 12.55 26.46 171 0 100 99 1.00
153 2.48 1.01 4.26 5.56 1.66 11.10 3.55 29 0 83 73 0.99
154 3.25 1.44 5.31 6.33 2.21 12.04 25.11 73 1 100 100 1.00
155 2.51 0.75 4.37 6.06 2.34 10.82 28.69 87 2 100 100 1.00
156 7.75 4.36 11.95 5.70 2.12 10.65 49.09 106 4 100 100 1.00
157 17.43 9.83 25.51 5.97 2.96 9.78 112.80 347 9 100 100 1.00
158 37.44 26.37 49.30 5.50 1.39 10.80 6.29 84 0 note A note A 0.71
159 1.30 0.54 2.13 6.91 2.16 13.19 5.77 12 0 95 90 1.00
160 2.18 1.10 3.35 5.97 1.64 11.61 3.41 19 0 63 58 1.00
161 1.42 0.50 2.43 4.95 1.60 9.17 6.07 19 0 99 81 1.00
162 2.91 1.57 4.27 5.78 1.65 11.06 9.62 31 0 100 97 1.00
163 4.80 2.81 7.04 5.47 1.11 10.92 3.03 17 0 94 82 1.00
164 1.31 0.47 2.38 7.43 3.01 12.62 24.80 81 0 100 100 1.00
165 4.86 2.70 7.07 5.64 1.50 11.14 3.26 14 0 100 100 0.89
166 5.67 3.36 8.13 5.96 1.71 11.50 13.08 34 0 100 100 1.00
167 8.24 4.54 12.27 5.90 2.79 9.68 73.14 190 4 100 100 1.00
168 3.70 2.24 5.33 8.15 3.49 13.69 47.77 116 4 100 100 1.00
169 9.66 5.91 14.13 7.88 3.05 13.23 84.87 243 1 100 100 1.00
170 21.28 12.54 29.54 5.98 1.87 11.52 24.64 84 1 100 99 1.00
171 1.60 0.52 3.01 5.85 3.66 8.66 143.24 297 5 100 100 1.00
172 26.19 15.95 35.55 6.71 2.66 12.19 71.66 229 1 100 100 1.00
173 38.64 26.40 49.95 7.53 3.04 14.66 130.69 208 9 100 100 1.00
174 58.61 38.63 76.77 5.57 1.78 10.89 50.36 355 1 100 100 0.99
175 1.22 0.36 2.31 4.31 1.91 6.86 36.82 82 3 100 100 1.00
176 10.15 5.44 15.09 7.63 3.79 12.15 82.01 179 4 100 100 1.00
177 21.14 14.30 27.89 8.27 4.73 13.19 128.04 289 7 100 100 1.00
178 19.92 12.15 28.37 6.14 3.32 9.87 103.73 284 2 100 100 1.00
179 36.98 31.06 42.66 5.53 1.60 10.64 17.97 178 0 89 99 1.00
180 8.84 4.17 14.16 6.56 2.18 12.93 38.27 123 0 100 100 1.00
181 0.81 0.20 1.61 7.43 4.32 11.04 108.14 247 3 100 100 1.00
182 15.37 9.43 22.59 6.19 2.14 11.45 25.56 42 2 100 100 1.00
183 19.90 12.82 27.49 7.21 4.54 10.47 146.51 410 3 100 100 1.00
184 40.34 35.17 45.61 9.71 3.46 16.83 495.69 1143 15 100 100 1.00
185 87.18 75.90 98.64 7.94 3.84 12.83 57.17 343 0 99 87 0.91
186 13.29 7.91 19.31 6.90 5.69 8.22 552.07 951 39 100 100 1.00
187 92.26 81.69 102.84 7.64 3.97 11.96 53.39 555 0 73 98 0.54
188 14.03 8.91 20.03 10.76 8.63 13.15 836.42 1100 39 100 100 1.00
189 root root 92.55 406 0 root root root
Primate Phylogeny
PLoS Genetics | www.plosgenetics.org 5 March 2011 | Volume 7 | Issue 3 | e1001342
pithecus, 2) adaptation for an expanded diet in the odd-nosed
group, or 3) that a folivorous diet is a symplesiomorphic trait
within Asian colobines.
Trachypithecus and Semnopithecus genera consist of closely related,
often sympatric species (node 51), distributed in the Indian
subcontinent and SE Asia, with inconsistent phylogenetic
resolution among species [4,27,40,44,46]. Nonetheless, all genetic
studies, including the present, place Trachypithecus vetulus (monticola)
nested within the Semnopithecus clade (node 50), suggesting the need
for taxonomic revision. Further, previously ambiguous associations
between Trachypithecus and Semnopithecus (nodes 43–51) are clarified.
Inter-specific genetic differences are roughly half those observed
among other colobine genera (Figure 2, Figure S1, Table 3, Table
S9) and may indicate that recent speciation, taxonomic over-
splitting, reticulate evolution, or a combination thereof, (e. g. see
[40,44,46]) are common within the Asian Colobinae radiation.
The remainder of Old World monkeys (tribes Papionini and
Cercopithecini) [2] arose from a common ancestor approximately
11.5 MYA (node 41). Considerable interest in Cercopithecinae
speciation is motivated not only by primate conservation, but
increased biomedical surveillance for novel zoonotic agents and
comparative research of host-pathogen adaptation relevant to the
study of deadly human viral pandemics such as HIV/SIV.
Cercopithecini (guenons, patas monkey, talapoin, green mon-
keys) include lineages rooted by divergent monotypic genera
followed by more recent speciation, characterized by transition
from an arboreal to a terrestrial lifestyle. Generally arboreal,
Miopithecus and Allenopithecus are early offshoots with respect to the
two Cercopithecini subclades formed approximately 7 MYA. The
Cercopithecus lineage (node 34) radiated after Miopithecus and
retained an arboreal lifestyle. The second, rooted by Allenopithecus,
forms a terrestrial clade of Erythrocebus patas and Chlorocebus species,
with Cercopithecus l’hoesti separated the other Cercopithecus. This
paraphyly, also reported in earlier genetic studies [39,47,48] and
counter to initial morphological classifications [2], suggests
taxonomic revision of Cercopithecus. Further, resolution of Alleno-
pithecus (node 40) and Miopithecus (node 35) speciation herein
suggests a single evoluiontary transition from an arboreal to a
terrestrial lifestyle in E. patas, C. l’hoesti, and Chlorocebus species.
Papionini (macaques, mandrills, drills, baboons, geladas,
mangabeys) is a taxonomically complex tribe [2]. One of the
more familiar genera within Cercopithecoidea, Macaca (macaques)
diverged 5.1 MYA and today is represented by an African lineage
comprised of a single species M. sylvanus, and an Asian lineage
consisting of well-defined species groups (fascicularis, sinica, mulatta,
nemestrina, Sulawesi) inhabiting India and Asia, SE Asia and
Sundaland [49]. With the exception of the fascicularis group, which
is split in this study whereby M. arctoides [fascicularis] is more closely
aligned with M. thibetana [sinica] rather than M. fascicularis as
expected, our data otherwise strongly support these macaque
species groups (nodes 6, 11). Moreover, the phylogeny affirms
Groves [2] proposal that Lophocebus and Theropithecus are distinct
clades apart from Papio (nodes 18, 19), although the average
nucleotide divergence among these three genera are generally less
than between other recognized Papionin genera (Macaca, Man-
drillus, Cercocebus) (Figure 2, Figure S1, Table 3, Table S9). Lastly,
sequence divergence between tribes is unequal with Cercopithecini
nearly twice that of Papionini (mean branch length = 13.1, 7.43,
respectively, p,0.005) and there are numerous instances of
discordance between the present phylogeny with previous mtDNA
studies [4,5] suggesting that continued resolution of Cercopithe-
cinae speciation and of Papionini in particular, will likely include
evidence of reticulate evolution represented by ongoing and
historic episodes of hybridization (e.g. see [39,48]).
HominoideaOnce contentiously debated, the closest human relative of
chimpanzee (Pan) within subfamily Homininae (Gorilla, Pan, Homo)
is now generally undisputed. The branch forming the Homo and
Pan lineage apart from Gorilla is relatively short (node 73, 27 steps
MP, 0 indels) compared with that of the Pan genus (node 72, 91
steps MP, 2 indels) and suggests rapid speciation into the 3 genera
occurred early in Homininae evolution. Based on 54 gene regions,
Homo-Pan genetic distance range from 6.92 to 7.9061023
substitutions/site (P. paniscus and P. troglodytes, respectively), which
is less than previous estimates based on large scale sequencing of
specific regions such as chromosome 7 [50]. The highly
endangered orangutan forms the single genus Pongo in subfamily
Ponginae (nodes 75–76), the sister lineage to Homininae.
Currently restricted to the islands of Borneo and Sumatra,
orangutans once inhabited all of Southeast Asia during the
Pleistocene [51]. Differences in behavior, morphology, karyology,
and genetic data between the two island populations [2] support
the taxonomic designation as two separate species of Bornean (P.
pygmaeus) and Sumatran orangutans (P. abelii), and these designa-
tions are upheld by the data presented here.
Hylobatidae (siamang, gibbons, hoolock) are noted for exception-
al rates of chromosome re-arrangement [52,53], 10–20 times faster
than in most mammals [54]. Classification schemes of the 12 species
range from two genera (Hylobates and Symphalangus) to four subgenera
and/or genera (Hylobates, Nomascus, Symphalangus, Hoolock), defined by
unique numbers of chromosomes [54,55]. The eight species
included in this study form three clades that coincide with genus
designation (absent is Hoolock; nodes 64–69) that diverged rapidly 8.9
MYA. Moreover, Nomascus species appear more recent than
Symphalangus and Hylobates, with node divergence dates estimated at
less than 1 MY (Table 3, Table S9, Figure 2). Thus, Hylobatidae
exhibits episodes of rapid divergence perhaps related to excessive
genome re-organization and warrants additional investigation.
Genome Divergence, Rate Heterogeneity, and IndelsThe clarity of the primate phylogeny here can be used to assess
nucleotide divergence patterns, rates of substitution and accumu-
lation of synapomorphic and autapomorphic indels. Genome
divergence varies across primate lineages, with the least inter-
specific differences observed in Cercopithecidae lineages and the
most in Lorisidae, reflecting recent speciation in the former and
the more ancient origins of the latter (Figure 3, Table 1, Table 3,
Tables S7 and S9).
The global rate of nucleotide substitution across the entire
primate phylogeny is 6.16361024 substitutions/ site/ MY, but
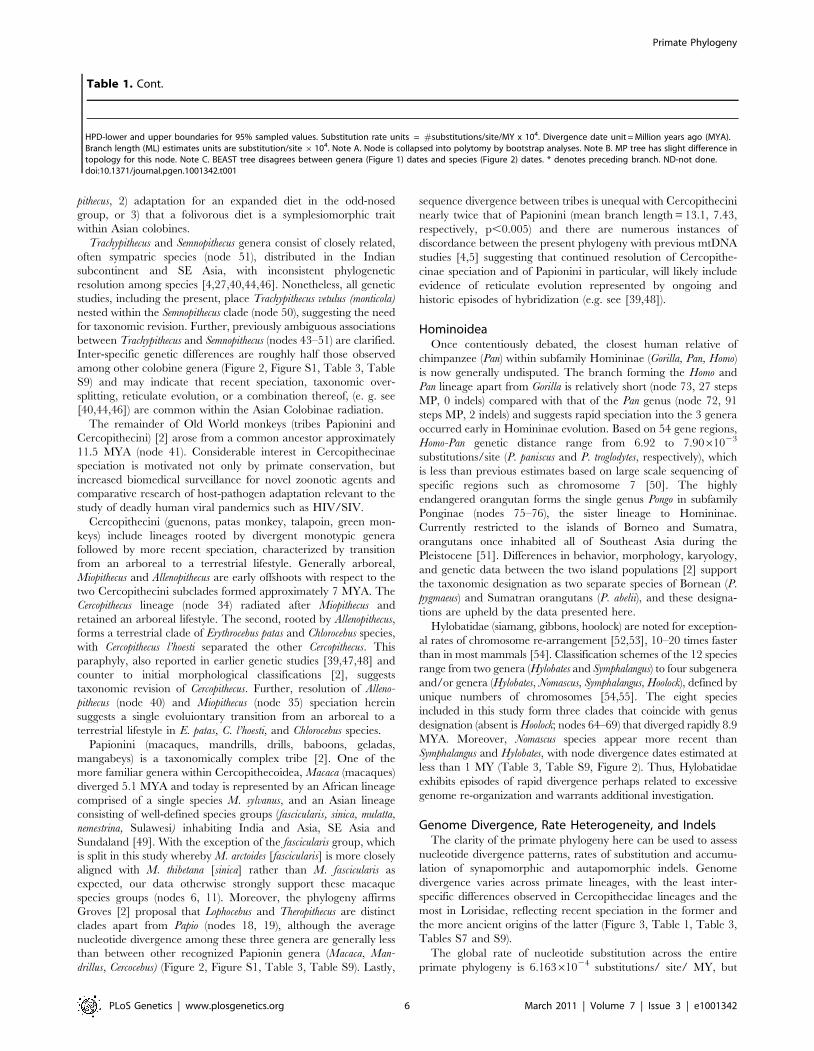
HPD-lower and upper boundaries for 95% sampled values. Substitution rate units = #substitutions/site/MY x 104. Divergence date unit = Million years ago (MYA).Branch length (ML) estimates units are substitution/site 6104. Note A. Node is collapsed into polytomy by bootstrap analyses. Note B. MP tree has slight difference intopology for this node. Note C. BEAST tree disagrees between genera (Figure 1) dates and species (Figure 2) dates. * denotes preceding branch. ND-not done.doi:10.1371/journal.pgen.1001342.t001
Table 1. Cont.
Primate Phylogeny
PLoS Genetics | www.plosgenetics.org 6 March 2011 | Volume 7 | Issue 3 | e1001342

Table 2. Node Support, Branch Lengths, Divergence Times, and Nucleotide Substitution Rates for Platyrrhini in Figure 2.
NodeFig. 2
Date(MY)
Date 95%HPD Rate
Rate 95%HPD
BranchLength (ML)*
BranchLength (MP)*
Indels perBranch*
NodeSupport (ML)
NodeSupport (MP)
PosteriorProbability
78 24.82 20.55 29.25 7.23 2.00 14.59 193.05 542 18 100 100 1.00
79 0.78 0.24 1.41 5.53 1.37 11.79 2.65 6 0 85 79 1.00
80 1.35 0.74 2.54 6.00 2.05 11.04 0.46 6 0 100 100 0.62
81 1.53 0.59 2.28 6.00 1.42 13.06 11.34 21 0 Note A Note A 1.00
82 3.79 1.95 5.78 6.94 2.22 13.47 12.91 54 3 100 100 1.00
83 2.17 0.85 3.73 8.72 3.32 15.60 21.22 67 0 100 100 1.00
84 4.82 2.88 7.21 6.93 1.74 14.24 6.47 45 1 100 99 1.00
85 5.96 3.83 8.59 14.08 6.99 22.57 63.16 197 1 100 100 1.00
86 10.68 7.62 14.24 7.81 3.12 14.53 20.18 89 2 100 100 1.00
87 0.50 0.11 1.00 8.91 6.40 11.72 116.51 352 11 100 100 1.00
88 13.55 9.86 17.27 6.46 1.90 12.57 7.44 47 0 99 98 1.00
89 1.31 0.51 2.26 8.57 2.90 16.30 12.42 32 0 100 100 1.00
90 2.82 1.41 4.29 9.77 3.62 17.40 22.72 77 0 100 100 1.00
91 1.04 0.41 1.87 4.97 2.62 7.53 20.40 61 0 100 100 1.00
92 5.34 3.43 7.60 7.06 1.96 14.03 9.59 37 0 100 99 1.00
93 1.75 0.56 3.15 5.74 1.72 11.57 9.48 18 0 100 100 1.00
94 3.75 1.89 6.04 6.63 2.63 12.37 19.11 81 1 100 100 1.00
95 6.96 4.67 9.39 6.36 1.40 13.42 7.39 25 0 100 99 1.00
96 8.42 5.72 11.38 9.24 5.51 13.39 58.42 182 7 100 100 1.00
97 14.89 11.04 18.48 14.21 6.92 23.71 57.88 177 7 100 100 1.00
98 5.54 3.20 7.85 6.92 4.83 9.23 94.86 303 15 100 99 1.00
99 0.95 0.43 1.68 12.54 4.53 22.23 14.12 33 0 100 100 1.00
100 2.01 1.06 3.19 12.33 4.59 22.36 21.31 61 0 100 100 1.00
101 3.84 2.29 5.66 7.13 1.91 13.88 10.06 38 0 100 100 1.00
102 2.80 1.13 4.85 4.87 1.53 10.16 10.85 30 0 100 99 1.00
103 1.55 0.62 2.71 5.75 1.23 12.41 1.33 3 1 65 69 0.98
104 1.95 0.91 3.31 6.74 2.34 12.63 23.91 71 1 100 100 1.00
105 1.78 0.68 3.03 6.13 1.19 12.60 1.54 14 0 80 68 0.94
106 2.15 0.98 3.54 8.15 2.90 14.79 28.06 89 1 100 100 1.00
107 6.00 3.13 9.35 9.25 4.68 16.58 79.96 254 3 100 100 1.00
108 0.73 0.25 1.31 5.86 1.40 12.18 1.81 1 2 76 74 0.99
109 1.26 0.47 2.21 6.28 1.36 12.78 5.33 19 0 99 96 1.00
110 2.24 1.05 3.73 10.15 6.17 15.64 128.52 386 5 100 100 1.00
111 15.40 9.59 20.67 6.24 1.64 13.92 21.87 89 1 100 100 1.00
112 19.25 15.29 23.45 6.21 1.29 13.50 3.34 30 2 91 80 1.00
113 19.95 15.66 24.03 9.17 3.50 16.63 23.23 86 0 100 100 1.00
114 1.91 0.86 3.23 7.96 2.26 15.71 6.22 24 0 93 90 1.00
115 2.83 1.48 4.40 7.06 1.48 14.20 3.35 6 0 71 58 1.00
116 3.42 1.96 5.29 8.09 2.61 15.95 11.70 59 0 100 100 1.00
117 1.43 0.44 2.66 3.85 1.54 6.70 12.07 41 0 100 100 1.00
118 5.07 2.87 7.50 9.12 4.22 14.97 52.54 160 6 100 100 1.00
119 2.92 1.12 4.99 7.93 3.79 12.64 49.65 123 1 100 100 1.00
120 0.64 0.19 1.25 6.35 3.73 9.17 54.55 119 1 100 100 1.00
121 9.53 6.10 13.44 5.69 1.34 12.11 7.20 72 0 96 95 1.00
122 11.25 7.25 15.46 6.47 2.29 11.96 26.52 99 3 100 100 1.00
123 4.24 2.23 6.29 5.29 1.06 11.30 2.18 32 1 58 62 0.94
124 4.94 2.93 7.26 5.88 1.46 11.95 5.01 28 0 98 89 1.00
125 6.03 3.74 8.57 10.05 5.02 16.60 95.07 306 6 100 100 1.00
126 16.13 10.52 21.35 7.19 2.50 13.02 42.19 142 4 100 100 1.00
Primate Phylogeny
PLoS Genetics | www.plosgenetics.org 7 March 2011 | Volume 7 | Issue 3 | e1001342

exhibits significant heterogeneity across lineages (Figure 3) and
among branches (Table 1, Table 2, Table 3; Tables S6, S7, S8).
For example, the ‘‘hominoid slow-down’’ hypothesized to have
occurred in human evolution, is confounded by the reduced rates
observed in all Catarrhini (not just Homininae) compared with
Platyrrhini and Strepsirrhini (Figure 3, Table S10). By contrast,
the ‘‘phyletic dwarfism’’ of the Callitrichinae (nodes 97, 85) and
the evolution of nocturnalism in Aotinae are correlated with
increased rates along specific branches (see nodes 99, 100) rather
than an being a function of an average rate among all branches
within the lineage (Figure 3), suggesting that an adaptive ‘‘speed-
up’’ occurred in the common ancestors of these extant species.
The genome accumulates indels over evolutionary time, altering
the degree of sequence homology between taxa. Further, large-scale
genome sequence analysis demonstrate that indel formation is an
indicator of genome plasticity, positively correlated with adjacent
nucleotide substitution rate [56,57], gene segmental duplication,
chromosomal position, hybridization between species and specia-
tion, and is enhanced by molecular mechanisms of recombination
among repetitive elements [58-60]. Here, the distribution of indels is
ubiquitous in both coding and noncoding segments (Tables S4, S5,
S6), but is markedly disjunct among primate lineages (Figure 3).
Excluding the infraorders Tarsiiformes (25 indels) and Chiromyi-
formes (14 indels) due to statistically inadequate sampling, the indel
frequency per branch varies by a factor of 20 (Table 1, Table 2,
Table 3; Tables S7, S8, S9) with the greatest accumulation within
Lorisidae (particularly Arctocebus calabarensis) and the least in
Cercopithecidae (Figure 3). The major correlate of indel frequency
is not substitution rate, but overall genome divergence represented
by branch length (R-square = 0.659 Lorisiformes; 0.610 Lemur-
iformes; 0.3286 Simiiformes; P,0.05).
ConclusionsThe molecular genetic resolution of the primate phylogeny
provides a robust comparative genomic resource to affirm, alter,
and extend previous taxonomic inferences. Approximately half of
the 261–377 species and 90% of the genera are included
facilitating resolution of long-standing phylogenetic ambiguities.
Early events within primate evolution are resolved such as:
Dermoptera is the closest mammalian order to Primates;
Tarsiiformes are sister taxa with Simiiformes to form Haplorrhini;
Chiromyiformes (Daubentoniidae) and Lemuriformes are mono-
phyletic indicating a common ancestral lineage colonized the
island of Madagascar once; and the hierarchical divergence
pattern among New World families Pitheciidae, Atelidae, and
Cebidae is clarified.
Additional insights are possible because the relative branching
patterns among infraorders, parvorders, superfamilies, families,
subfamilies, genera and species are resolved with high measures of
support for all but three nodes. For example, Old World monkeys
(Cercopithecoidea) display remarkably low levels of divergence,
particularly within Papionini, consistent with reticulate evolution,
recent speciation and possibly augmented by taxonomic over-
splitting. By contrast, the Lorisidae are marked by extraordinary
divergence relative to other primate lineages. In the New World,
the phylogenetic placement of the unique, nocturnal Aotinae is
unambiguously resolved, diverging rapidly after the sister lineage
of Cebinae+Saimirinae and prior to the Callitrichinae within the
family Cebidae. Further, the pattern of divergence of Callitrichi-
nae is correlated with a gradation in species size, supporting
‘‘phyletic dwarfism’’ [32,35]. In the context of human evolution,
the large amount of sequence available here for each well-
recognized species in Hominidae provides a baseline estimate of
average genetic divergence per taxonomic level in primates.
However, deviations from these values observed across diverse
lineages illustrate the remarkable biodiversity and species richness
within the Primate order.
One of the more intriguing unresolved questions is the origin of
primates. Generally concordant, most molecular data suggest
extant primates arose approximately 85 MYA from a common
NodeFig. 2
Date(MY)
Date 95%HPD Rate
Rate 95%HPD
BranchLength (ML)*
BranchLength (MP)*
Indels perBranch*
NodeSupport (ML)
NodeSupport (MP)
PosteriorProbability
127 22.76 18.14 27.08 6.92 1.67 13.38 11.49 54 0 100 99 1.00
128 3.09 1.53 4.73 6.74 1.48 13.79 3.51 35 0 56 69 0.61
129 3.65 1.92 5.58 6.48 1.51 13.12 9.37 31 0 94 99 1.00
130 1.60 0.56 2.86 6.65 2.88 11.46 22.04 54 0 100 100 1.00
131 5.22 3.00 7.63 7.56 3.16 13.25 31.90 81 0 100 100 1.00
132 2.74 1.07 4.74 6.38 1.41 12.50 11.43 27 0 100 100 1.00
133 4.92 2.35 7.98 6.09 2.12 11.59 27.14 68 0 100 100 1.00
134 9.86 6.23 13.97 9.62 5.91 14.68 97.02 324 0 100 100 1.00
135 3.39 1.45 5.71 7.30 2.63 14.03 25.76 93 2 100 100 1.00
136 1.88 0.56 3.51 7.79 3.57 12.53 41.60 134 1 100 100 1.00
137 7.51 4.36 10.88 8.02 3.29 14.27 44.54 153 1 100 100 1.00
138 4.00 1.65 7.11 7.80 4.34 12.31 72.10 247 1 100 100 1.00
139 13.69 9.24 18.34 8.15 3.40 14.25 48.09 156 2 100 100 1.00
140 20.24 15.29 25.16 6.81 2.40 13.66 26.81 104 4 100 100 1.00
141 43.47 38.55 48.36 9.36 6.27 12.46 350.20 714 1 100 100 1.00
HPD-lower and upper boundaries for 95% sampled values. Substitution rate units = #substitutions/site/MY 6 104. Divergence date unit = Million years ago (MYA).Branch length (ML) estimates units are substitution/site 6104. Note A. Node is collapsed into polytomy by bootstrap analyses. Note B. MP tree has slight difference intopology for this node. Note C. BEAST tree disagrees between genera (Figure 1) dates and species (Figure 2) dates. * denotes preceding branch. ND-not done.doi:10.1371/journal.pgen.1001342.t002
Table 2. Cont.
Primate Phylogeny
PLoS Genetics | www.plosgenetics.org 8 March 2011 | Volume 7 | Issue 3 | e1001342

Table 3. Node Support, Branch Lengths, Divergence Times, and Nucleotide Substitution Rates for Catarrhini in Figure 2.
NodeFig. 2
Date(MY)
Date 95%HPD Rate
Rate 95%HPD
BranchLength (ML)*
BranchLength (MP)*
Indels perBranch*
NodeSupport (ML)
NodeSupport (MP)
PosteriorProbability
1 1.18 0.63 1.80 4.32 1.90 7.43 1.51 12 1 100 85 1.00
2 1.41 0.86 2.06 4.67 1.85 8.13 0.98 4 0 100 75 1.00
3 1.68 1.11 2.33 4.83 2.47 7.56 6.91 21 0 100 100 1.00
4 1.44 0.84 2.09 5.67 2.63 9.19 6.16 20 1 100 99 1.00
5 2.48 1.77 3.27 4.96 2.12 8.48 2.96 17 0 100 97 1.00
6 3.13 2.35 3.98 5.35 2.62 8.45 5.52 19 0 100 100 1.00
7 1.53 0.90 2.29 4.46 1.69 7.78 0.78 3 0 78 64 0.99
8 1.80 1.09 2.55 4.33 1.72 7.36 3.58 10 0 97 96 1.00
9 3.53 2.69 4.47 3.90 1.65 7.09 1.31 7 0 73 78 1.00
10 2.77 1.94 3.67 4.02 1.55 6.97 2.39 9 0 98 95 1.00
11 2.38 1.40 3.37 3.82 1.71 6.66 3.41 14 0 97 96 1.00
12 4.13 3.26 5.01 4.09 1.79 6.67 3.29 12 1 100 99 1.00
13 5.12 4.27 5.93 5.33 3.03 7.95 16.00 53 3 100 100 1.00
14 6.67 5.37 8.07 4.61 1.99 7.85 6.27 22 0 100 100 1.00
15 0.72 0.35 1.17 4.54 1.97 7.62 1.89 8 0 88 87 1.00
16 1.21 0.70 1.79 5.31 3.06 8.07 10.66 40 1 100 100 1.00
17 3.24 2.46 4.07 4.78 2.06 7.90 3.69 10 0 65 78 1.00
18 0.29 0.08 0.55 5.44 3.68 7.69 17.09 51 0 100 100 1.00
19 4.06 3.36 4.70 3.84 2.11 5.93 9.35 33 0 100 100 1.00
20 0.93 0.45 1.51 4.99 2.67 7.64 11.37 36 0 100 100 1.00
21 3.33 2.25 4.58 5.39 2.67 8.98 8.30 35 0 100 99 1.00
22 1.34 0.68 2.16 4.46 2.63 6.58 15.13 49 1 100 100 1.00
23 4.85 3.58 6.23 5.30 2.54 8.54 9.47 36 2 100 100 1.00
24 8.13 6.69 9.68 5.46 2.79 8.66 18.14 55 2 100 100 1.00
25 8.22 6.60 10.01 4.08 1.97 6.48 12.37 43 0 100 Note A 1.00
26 0.90 0.37 1.52 4.73 2.54 7.35 9.93 38 0 100 100 1.00
27 2.22 1.33 3.24 4.61 1.99 7.88 2.89 13 1 77 75 1.00
28 2.94 1.94 3.94 4.52 1.60 7.79 2.43 10 0 Note A Note A 0.59
29 3.51 2.43 4.66 4.27 2.03 6.92 6.26 26 0 100 Note A 1.00
30 5.22 3.96 6.61 4.25 1.83 7.27 2.30 9 0 72 62 1.00
31 3.73 2.60 4.84 5.44 2.68 8.84 8.40 38 1 100 99 1.00
32 5.24 3.94 6.55 4.75 1.96 7.98 3.01 14 0 83 89 1.00
33 5.93 4.60 7.29 4.46 1.70 7.78 0.63 10 0 63 65 0.90
34 6.16 4.81 7.60 4.51 1.77 7.76 4.37 7 2 99 96 1.00
35 7.28 5.70 8.88 4.34 1.74 7.46 3.41 Note B 1 63 Note A 1.00
36 1.19 0.62 1.81 4.86 2.06 8.17 1.33 6 0 64 58 0.98
37 1.50 0.84 2.17 4.84 2.78 7.22 16.01 53 0 100 100 1.00
38 4.47 3.04 5.91 4.44 1.75 7.66 1.59 Note B 0 Note A Note A 0.82
39 4.95 3.52 6.46 4.40 2.35 6.88 11.18 Note B 0 100 100 1.00
40 7.63 6.03 9.37 4.44 1.90 7.72 2.08 Note A 0 61 Note A 1.00
41 11.50 9.18 13.85 4.53 2.39 6.81 26.96 86 0 100 100 1.00
42 12.28 9.42 15.07 5.56 3.03 8.80 28.39 94 4 100 100 1.00
43 1.28 0.68 1.91 4.86 2.04 8.16 3.20 14 0 100 99 1.00
44 2.00 1.29 2.81 4.44 1.68 7.67 1.34 5 0 92 91 1.00
45 0.64 0.29 0.99 4.71 1.84 8.31 0.76 3 0 91 91 1.00
46 0.85 0.43 1.27 4.74 2.52 7.41 7.19 23 0 100 100 1.00
47 2.40 1.57 3.23 4.76 2.21 7.92 7.22 23 0 100 100 1.00
48 0.74 0.36 1.20 5.45 2.41 8.83 3.86 15 0 97 98 1.00
49 1.41 0.85 2.07 5.22 2.32 8.68 5.23 16 0 100 100 1.00
Primate Phylogeny
PLoS Genetics | www.plosgenetics.org 9 March 2011 | Volume 7 | Issue 3 | e1001342
ancestor. However, the debate continues over the geographic
locale most consistent with the existing fossil record
[9,10,12,16,23,26,61-63]. A parsimonious interpretation of the
present data would suggest an Asian origin as the ancient Asian
Tarsiiformes and the strepsirrhine Lorisinae are most basal and
the closest relatives of primates, Dermoptera and Scandentia, are
also exclusive to Asia.
Primate genomes harbor remarkable differences in patterns of
speciation, genome diversity, rates of evolution and frequency of
insertion/deletion events that are fascinating in their own right,
but also provide needed insight into human evolution. Advances
in human biomedicine including those focused on changes in
genes triggered or disrupted in development, resistance/suscep-
tibility to infectious disease, cancers, mechanisms of recombina-
tion and genome plasticity, cannot be adequately interpreted in
the absence of a precise evolutionary context or hierarchy.
Resolution of the primate species phylogeny here provides a
validated framework essential in the development, interpretation
and discovery of the genetic underpinnings of human adaptation
and disease.
Materials and Methods
Ethics StatementPrimate DNA samples were obtained following the guidelines of
Institutional Animal Care and Use Committee policies of respective
research institutions (see Table S1). All tissue samples for the
Laboratory of Genomic Diversity were collected in full compliance
with specific Federal Fish and Wildlife permits from the Conservation
of International Trade in Endangered Species of Wild flora and Fauna:
Endangered and Threatened Species, Captive Bred issued to the
National Cancer Institute (NCI)-National Institutes of Health (NIH)
(S.J.O. principal officer) by the U.S. Fish and Wildlife Services of the
Department of the Interior. Duke University Lemur samples (J.E.H.)
were collected under research project BS-4-06-1 and Institutional
Animal Care and Use Committee (IACUC) project A094-06-03, and
this paper is Duke Lemur Center publication #1192.
DNA SpecimensA complete list of individual and source DNA are presented in
Table S1. DNA was extracted from whole blood, buffy coat, hair
NodeFig. 2
Date(MY)
Date 95%HPD Rate
Rate 95%HPD
BranchLength (ML)*
BranchLength (MP)*
Indels perBranch*
NodeSupport (ML)
NodeSupport (MP)
PosteriorProbability
50 2.48 1.64 3.37 5.11 2.31 8.61 7.54 27 0 100 100 1.00
51 4.05 2.93 5.36 5.96 3.40 8.91 25.02 83 0 100 100 1.00
52 1.07 0.53 1.70 4.87 2.09 7.99 4.56 13 1 100 100 1.00
53 2.09 1.24 3.08 5.68 3.09 8.53 22.94 68 3 100 100 1.00
54 6.21 4.40 8.12 4.40 1.64 7.68 1.68 16 0 87 84 1.00
55 6.69 4.67 8.58 4.42 1.66 7.80 6.04 27 0 100 100 1.00
56 0.91 0.38 1.56 4.35 3.01 5.78 34.00 111 3 100 100 1.00
57 8.30 6.06 10.61 4.53 1.77 7.95 1.81 6 0 100 97 1.00
58 8.81 6.50 11.18 4.44 2.14 7.11 14.36 46 0 100 100 1.00
59 2.65 1.50 3.97 4.96 1.97 8.55 3.87 18 0 87 88 1.00
60 3.52 2.21 5.05 5.85 3.52 8.83 32.35 86 2 100 100 1.00
61 9.12 6.49 11.71 5.14 2.55 8.29 15.32 77 0 100 100 1.00
62 17.57 13.88 21.52 7.58 4.66 10.65 106.46 294 7 100 100 1.00
63 20.32 16.59 24.22 4.61 2.59 7.12 54.22 190 4 100 100 1.00
64 1.86 0.98 2.85 4.94 2.22 8.14 6.34 19 0 79 78 1.00
65 3.26 1.95 4.54 8.70 5.39 12.55 43.89 137 1 100 100 1.00
66 Note C - - NoteC - - 2.78 Note B 0 100 Note A Note C
67 0.56 0.23 0.94 4.78 1.99 7.85 3.50 7 0 98 96 1.00
68 0.92 0.42 1.47 4.37 1.69 7.69 1.34 8 0 64 75 1.00
69 1.34 0.80 1.98 3.48 2.25 4.88 23.66 12 2 100 100 1.00
70 8.93 6.58 11.52 6.73 4.73 9.04 77.38 235 3 100 100 1.00
71 1.24 0.66 1.90 4.47 1.67 7.53 3.43 19 0 100 97 1.00
72 2.17 1.28 3.21 6.14 4.03 8.55 27.46 91 2 100 100 1.00
73 6.60 5.40 7.96 4.87 2.02 8.20 7.57 27 0 100 99 1.00
74 8.30 6.58 10.07 6.54 4.21 9.35 53.10 177 3 100 100 1.00
75 1.31 0.61 2.20 4.80 3.70 6.08 73.78 231 1 100 100 1.00
76 16.52 13.45 19.68 4.18 1.84 7.34 13.96 61 3 100 100 1.00
77 31.56 25.66 37.88 5.40 1.97 9.60 109.47 440 5 100 100 1.00
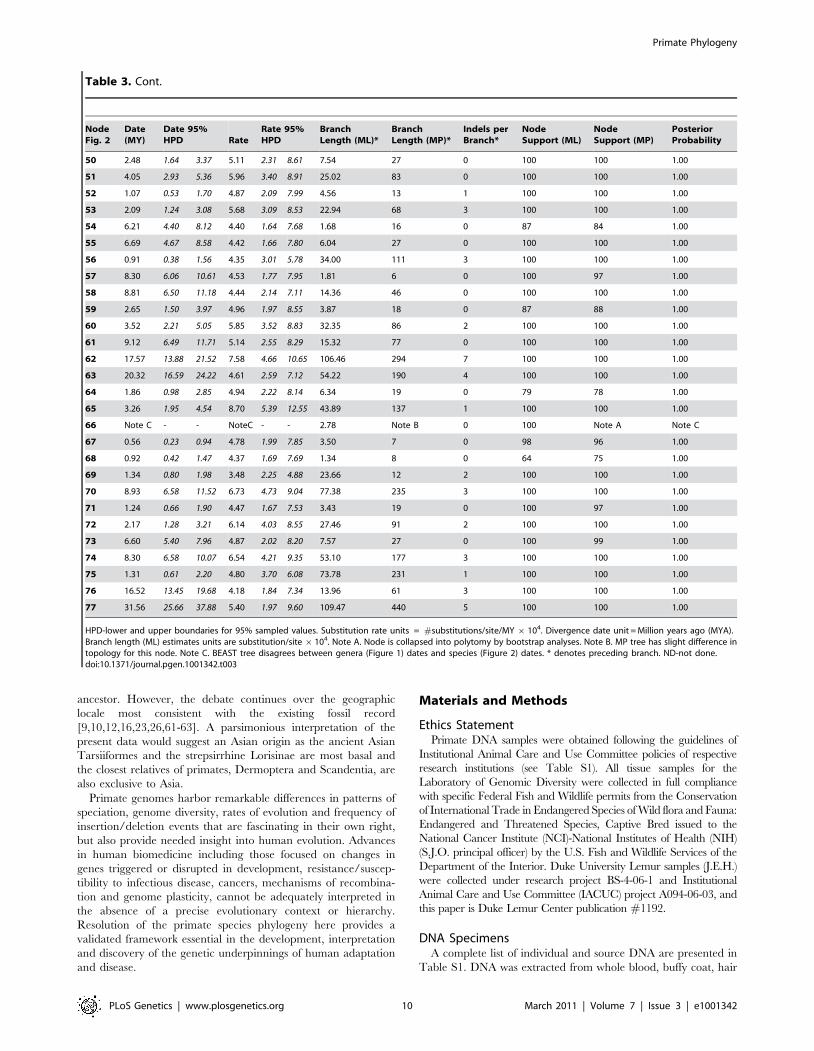
HPD-lower and upper boundaries for 95% sampled values. Substitution rate units = #substitutions/site/MY 6 104. Divergence date unit = Million years ago (MYA).Branch length (ML) estimates units are substitution/site 6104. Note A. Node is collapsed into polytomy by bootstrap analyses. Note B. MP tree has slight difference intopology for this node. Note C. BEAST tree disagrees between genera (Figure 1) dates and species (Figure 2) dates. * denotes preceding branch. ND-not done.doi:10.1371/journal.pgen.1001342.t003
Table 3. Cont.
Primate Phylogeny
PLoS Genetics | www.plosgenetics.org 10 March 2011 | Volume 7 | Issue 3 | e1001342

Primate Phylogeny
PLoS Genetics | www.plosgenetics.org 11 March 2011 | Volume 7 | Issue 3 | e1001342

or buccal swab samples using DNeasy Blood & Tissue Kit
(Qiagen) following manufacture’s protocol. DNA from different
tissues (muscle, kidney etc) or cell culture pellets was extracted
using standard phenol:chloroform extraction methods. Proteinase
K digestion in lysis buffer (100 mM NaCl, 10 mM Tris-HCl
pH 8.0, 25 mM EDTA pH 8.0, 0.6% SDS, 100 mg/ml RNAse A)
at 56 uC for 3–12 hours rotating was followed by 30 minute
phenol, phenol:chloroform 70:30, and chloroform extractions
using phase-lock gel tubes (Eppendorf) followed by ethanol
precipitation and 70% ethanol wash. Dried DNA was reconsti-
tuted in TE pH 7.4 buffer and stored at 4 uC. DNA was quantified
using Nanodrop (Thermo Scientific) and its quality was assessed
using 0.7% agarose gel electrophoresis.
DNA of limited quantity was used for whole-genome amplifi-
cation using REPLI-g Midi Kit (Qiagen). 50–100 ng of genomic
DNA (depending on its quality) was used per one 50 ml reaction
according to the manufacturer’s protocol. A negative control (no
template) was included in every WGA and was verified by
downstream PCR and sequencing. Some strepsirrhine DNA was
extracted and/or whole genome amplified as previously described
[21].
Amplification of Gene SegmentsA complete list of 54 primer sets used in this study is presented
in Table S2. This list includes primers from earlier studies
[12,16,21,64-68], as well as those designed specifically for this
study using a unique bioinformatics approach (Pontius, unpub-
lished data). A panel of species representing the breadth of primate
diversity was used in the testing and optimization of PCR primers
and included: Gorilla gorilla, Pan paniscus, Nomascus leucogenys,
Symphalanges syndactylus, Erythrocebus patas, Macaca fuscata, Macaca
tonkeana, Chiropotes satanas, Saimiri boliviensis, Saimiri sciureus, Callithrix
jacchus, Ateles fusciceps, Saguinus fuscicollis, Cheirogaleus medius, Lemur
catta and Tupaia minor.
All nuclear gene regions in all the samples were amplified with
the following conditions. Either 30 ng of genomic DNA or 1 ml of
WGA product was diluted 1:10 with 0.1XTE per PCR reaction.
DNA quantity was increased for poor quality DNA. Genomic and
WGA DNA was aliquoted into plates, dried at room temperature
and stored at 4 uC. Each 15 ml PCR reaction contained 2 mM
MgCl2, 250 mM of each dNTP, 150 mM of each forward and
reverse primer, 0.8 units of AmpliTaq Gold polymerase (ABI) with
1X GeneAmp 10X PCR Gold Buffer. PCR was performed in PE
ABI GeneAmp 9700 and Biometra T1 thermal cyclers. PCRs
were carried out using a touchdown program with the following
parameters: initial denaturation for 10 min at 95 uC; followed by
10 cycles of 95 uC for 15 s, 60–52 uC (2 cycles for each of the five
down gradient annealing temperature steps: 60 uC, 58 uC, 56 uC,
54 uC and 52 uC) for 30 s, and 72 uC for 1 min; and followed by
25 cycles of 95 uC for 15 s, 50 uC for 30 s, and 72 uC for 1 min;
and a final extension at 72 uC for 30 min. PCR products were
analyzed on 2% agarose gels. Only PCR products that produced
single bands were sequenced. PCR products were purified using
AMPure kit (Agencourt) or Mag-Bind EZ Pure (OMEGA). PCR
products were sequenced directly in two reactions with forward
and reverse primers. The sequencing reactions were carried out
with the BigDye Terminator v1.1 cycle sequencing kit (Applied
Biosystems, Inc.). For 10 ml sequencing reactions we used 0.25 ml
of BigDye, 2 ml of 5X Sequencing buffer, 0.32 mM primer and 2.5
ml of PCR product (we diluted PCR product if bands on the gel
were too bright). Sequencing reactions were performed as
following: 25 cycles of 96 uC for 10 s, 50 uC for 5 s, 60 uC for 4
minutes. Sequencing products were purified using paramagnetic
sequencing clean-up CleanSEQ (Agencourt) or Mag-bind SE
DTR (OMEGA). PCR and sequencing cleanups were performed
on Beckman Coulter Biomek FX laboratory automation worksta-
tion. The sequencing products were analyzed with an ABI PRISM
3730 XL 96-well capillary sequencer. Some of the prosimian PCR
products and sequences were obtained following earlier published
methods [21]. Consensus sequences for each individual were
generated from sequences in forward and reverse directions using
Sequencher 4.9 program (Gene Codes Corporation). All sequenc-
es were deposited in GenBank under accession numbers presented
in Table S11.
DNA Sequence AnalysesMultiple sequence files for each gene segment amplified were
aligned by MAFFT version 6 [69,70], imported into Se-Al ver
Figure 2. The molecular phylogeny of 186 primates and four species representing the two outgroup orders of Scandentia,Dermoptera, and rooted by Lagomorpha. (See also Figure S1). Shown is the maximum likelihood tree derived from 34,927 bp of sequence from54 genes. Node support is .90% for 166 nodes. Each node within the tree is numbered and listed in Table 1, Table 2, Table 3 to provide all nodesupport values for ML, MP and Bayesian methods of analysis as well as estimated dates of divergence. Numbers in boxes represent estimatedivergence times for major nodes as listed in Table 1, Table 2, Table 3. * denotes nodes whose divergence time is estimated to be less than 1 MYA.doi:10.1371/journal.pgen.1001342.g002
Table 4. Sequence Variation by Gene Category and Data Partition in Primate Phylogeny after Correction For Ambiguous Sites.
CategorySequenceSites (bp)
%Category(of 34,927 bp)
%Total
ConstantSites (bp)
% Category(of18,306 bp) % Total
InformativeSites (bp)
%Category(of 14,683 bp) % Total
AutapomorphicSites (bp)
%Category(of 1,938 bp)
%Total
Total 34927 100% 100% 18306 100% 52.41% 14683 100% 42.04% 1938 100% 5.55%
Autosomes 27427 78.53% 100% 14452 78.95% 52.69% 11432 77.86% 41.69% 1543 79.62% 5.62%
X Genes 4870 13.94% 100% 2673 14.60% 54.88% 1939 13.20% 39.81% 258 13.31% 5.29%
Y Genes 2630 7.53% 100% 1181 6.45% 50.04% 1312 8.94% 55.59% 137 7.06% 5.80%
Non-Coding 16371 46.87% 100% 7452 40.70% 45.52% 7878 53.63% 48.12% 1041 53.89% 6.35%
Coding 14742 42.40% 100% 8657 47.30% 58.72% 5439 37.02% 36.39% 646 33.35% 4.38%
UTR 3814 10.92% 100% 2197 12.00% 57.60% 1366 9.30% 35.81% 251 12.95% 6.58%
doi:10.1371/journal.pgen.1001342.t004
Primate Phylogeny
PLoS Genetics | www.plosgenetics.org 12 March 2011 | Volume 7 | Issue 3 | e1001342
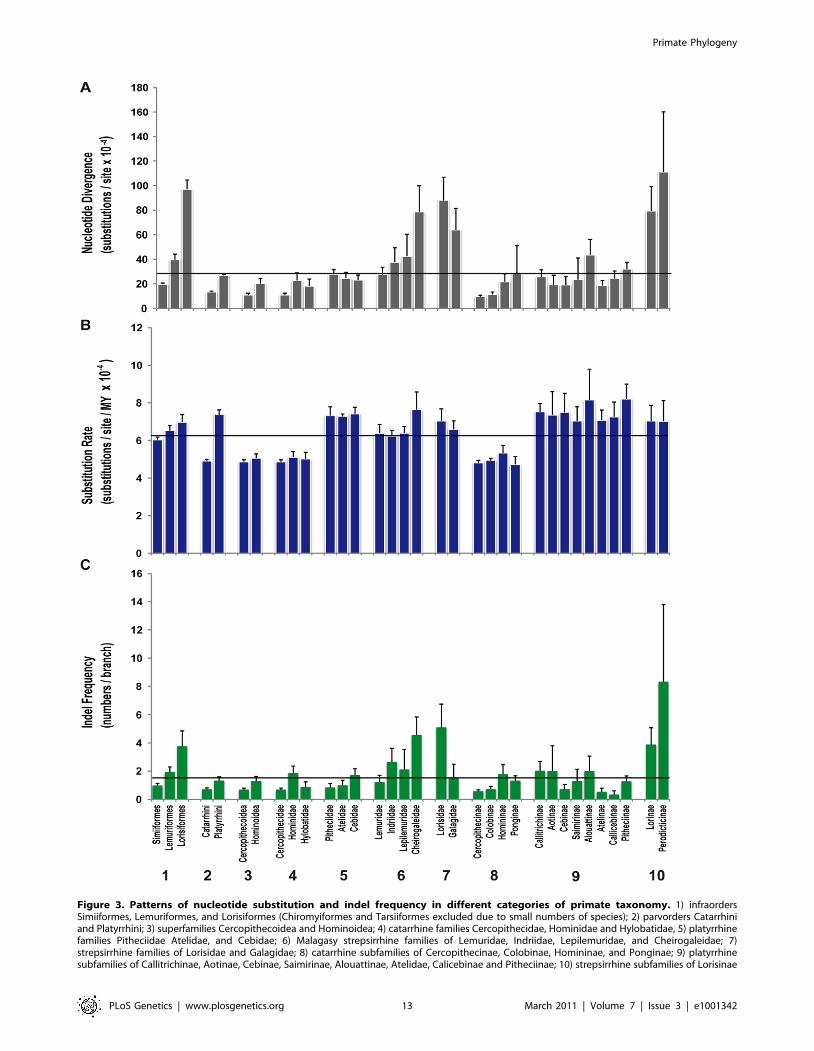
Figure 3. Patterns of nucleotide substitution and indel frequency in different categories of primate taxonomy. 1) infraordersSimiiformes, Lemuriformes, and Lorisiformes (Chiromyiformes and Tarsiiformes excluded due to small numbers of species); 2) parvorders Catarrhiniand Platyrrhini; 3) superfamilies Cercopithecoidea and Hominoidea; 4) catarrhine families Cercopithecidae, Hominidae and Hylobatidae, 5) platyrrhinefamilies Pitheciidae Atelidae, and Cebidae; 6) Malagasy strepsirrhine families of Lemuridae, Indriidae, Lepilemuridae, and Cheirogaleidae; 7)strepsirrhine families of Lorisidae and Galagidae; 8) catarrhine subfamilies of Cercopithecinae, Colobinae, Homininae, and Ponginae; 9) platyrrhinesubfamilies of Callitrichinae, Aotinae, Cebinae, Saimirinae, Alouattinae, Atelidae, Calicebinae and Pitheciinae; 10) strepsirrhine subfamilies of Lorisinae
Primate Phylogeny
PLoS Genetics | www.plosgenetics.org 13 March 2011 | Volume 7 | Issue 3 | e1001342

2.0a11 [71] and verified by eye. Regions of sequence ambiguity
within the alignment were identified by GBLOCK version 0.91b
[72], and removed from subsequent phylogenetic analyses. A
FilemakerPro database was created to manage all sequence
records for each individual DNA specimen and the concatenated
dataset was exported. The final, post-GBLOCK, edited, annotat-
ed PAUP* nexus alignment of the 54 concatenated genes used for
this study is publically available at the following website:
http://lgdfm3.ncifcrf.gov/190Taxa_Rabbit_PAUP.zip
The file is a compressed zip file that can be viewed in either a
generic text editor, PAUP*, or alignment programs that read large
nexus format files.
Phylogenetic Reconstruction of PrimatesGene partitions were analyzed separately, as well as combined,
for genome comparison and phylogenetic reconstruction. Six gene
partitions were created, corresponding to X-chromosome, Y-
chromosome, autosome, intron, exon and UTR segments. A
separate phylogenetic analysis was conducted for each of the six
data partitions to compare the concordance among tree topologies
derived from each partition. It should be noted that the Y-
chromosome tree is not directly comparable to the topologies of
the other data partitions because the number of males (N = 127)
was a subset of the total (N = 191). In the concatenated data set of
all 54 genes, females were coded as ‘‘missing’’ for the Y-
chromosome gene sequence. Aligned multiple sequence files of
either combined data or gene partitions were imported into
ModelTest ver 3.7 [73] and the optimal model of nucleotide
substitution was selected using the AIC criterion. Models are listed
in Table S12.
Phylogenetic trees based on nucleotide data were obtained using
a heuristic search with different optimality criteria of maximum
likelihood (ML) and maximum parsimony (MP) as implemented in
PAUP* ver 4.0a109 [74] for Macintosh (X86) and additional runs
of ML as implemented in GARLI ver 0.96 [75]. In PAUP*,
conditions for the ML analysis included starting trees obtained by
stepwise addition, and branch swapping using the tree-bisection-
reconnection (TBR) algorithm. The MP analyses used step-wise
addition of taxa, TBR branch swapping and excluded indels.
Support for nodes within the phylogeny used bootstrap analysis
with identical settings established for each method of phylogenetic
reconstruction and values greater than 50% were retained. The
number of bootstrap iterations consisted of 1000 for MP methods
and 100 for ML. Detailed control files used for GARLI ML
analyses are available from corresponding author.
Bayesian Analyses of Primate Sequences: PosteriorProbability, Node Support, and Divergence Dating
We estimated the phylogeny and divergence time splits
simultaneously using a Bayesian approach as implemented in the
program BEAST ver 1.5.3 [76,77]. Due to computational
constraints, analyses were performed with 5 different sets of
species: 1) genus-level data set including 61 Primate genera, two
Dermoptera genera and one Scandentia genus rooted by
Lagomorpha, 2) Catarrhini species with outgroups, 3) Platyrrhini
species with outgroups, 4) Strepsirrhini species with outgroups and
5) genus-level analysis with a partitioned data set allowing for rate
heterogeneity and different substitution models for autosome, X-
chromosome, and Y-chromosome sequences.
By using the uncorrelated lognormal relaxed-clock model, rates
were allowed to vary among branches without the a priori
assumption of autocorrelation between adjacent branches. This
model allows sampling of the coefficient of variation of rates, which
reflects the degree of departure from a global clock. Based on the
results of ModelTest, we assumed a GTR+I+G model of DNA
substitution with four rate categories. Uniform priors were
employed for GTR substitution parameters (0, 100), gamma shape
parameter (0, 100) and proportion of invariant sites parameter (0, 1).
The uncorrelated lognormal relaxed molecular clock model was
used to estimate substitution rates for all nodes in the tree, with
uniform priors on the mean (0, 100) and standard deviation (0, 10)
of this clock model. We employed the Yule process of speciation as
the tree prior and a Unweighted Pair Group Method with
Arithmetic Mean (UPGMA) tree to construct a starting tree, with
the ingroup assumed to be monophyletic with respect to the
outgroup. To obtain the posterior distribution of the estimated
divergence times, nine calibration points were applied as normal
priors to constrain the age of the following nodes (labeled A-H in
Figure 1 of main text): A) mean = 40.0 MYA, standard deviation
(stdev) = 3.0 for time to most recent common ancestor (TMRCA) of
galagids and lorisids [78], B) mean = 43.0 MYA, stdev = 4.5 for
TMRCA of Simiiformes [79,80], C) mean = 29.0 MYA, stdev = 6.0
for TMRCA of Catarrhini [80], D) mean = 23.5 MYA, stdev = 3.0
for TMRCA of Platyrrhini [26,81], E) mean = 7 MYA, stdev = 1.0
for TMRCA of Papionini [82], F) mean = 4.0 MYA, stdev = 0.4 for
TMRCA of Theropithecus clade [40,83], G) mean = 15.5 MYA,
stdev = 2.5 for TMRCA of Hominidae [14] and H) mean = 6.5
MYA, stdev = 0.8 for TMRCA of Homo-Pan [84]. A normal prior
for the mean root height of 90.0 MYA with stdev = 6.0 was used
based on molecular estimates of MRCA of all Primates [14,82,85].
The calibration points selected are based on fossil dates that have
undergone extensive review in previous publications and are
supported by a consensus of paleoanthropologists. Rather than re-
iterate the considerable amount of information forming the basis for
each calibration point, we list the respective citations with the most
detailed overview and attendant references.
Four to seven independent Markov chain Monte Carlo
(MCMC) runs for each analysis were run for 20–100 million
generations to ensure sampling of estimated sample size (ESS)
values. The Auto Optimize Operators function was enabled to
maximize efficiency of MCMC runs. Trees were saved every 1000
generations. Log files from each run were imported into Tracer
ver 1.4.1, and trees sampled from the first 1 million generations
were discarded. Mixing of trees was assessed in Tracer by
examination of ESS values. Analysis of these parameters in Tracer
suggested that the number of MCMC steps was more than
adequate, with ESS of all parameters often exceeding 200, and
Tracer plots showing strong equilibrium after discarding burn-in.
Tree files from the individual runs were combined using
LogCombiner ver 1.5.3 after removing 1000 trees from each
sample. The maximum-clade-credibility tree topology and mean
node heights were calculated from the posterior distribution of the
trees. Final summary trees were produced in TreeAnnotator ver
1.5.3 and viewed in FigTree ver 1.3.1.
and Perodicticinae. (A) Mean nucleotide divergence and standard error computed from branch lengths per taxonomic level from Figure 2, Figure S1,Table 1, Table 2, Table 3, and Tables S6, S7, S8. (B) Mean rate of nucleotide substitution and standard error computed from BEAST analysis for eachbranch within taxonomic level from Table 1, Table 2, Table 3, and Tables S6, S7, S8. (C) Mean number of synapomorphic and autapomorphic indelsper branch and standard error computed from Table 1, Table 2, Table 3, and Tables S6, S7, S8. Horizontal lines reflect global mean for primatephylogeny for each parameter.doi:10.1371/journal.pgen.1001342.g003
Primate Phylogeny
PLoS Genetics | www.plosgenetics.org 14 March 2011 | Volume 7 | Issue 3 | e1001342
Computation of Nucleotide Substitution RatesHeterogeneity in nucleotide substitution rates among primate
taxa was assessed by a Bayesian approach, allowing for unequal
rates of nucleotide substitution among lineages as implemented in
BEAST. Rate estimates provided for each branch within the
primate phylogeny were analyzed by ANOVA as implemented in
SAS (SAS Institute Inc., SAS 9.1.3). Significant differences among
means used the Duncan multiple means test.
Statistical Analyses of Insertion/Deletion Events amongPrimate Lineages
Indels were assessed as possible indicators of genome plasticity
among primate lineages. An a priori approach was developed that
used the derived primate phylogenetic tree (Figure 2) as a guide for
identification of synapomorphic and autapomorphic indels. First, all
indels were identified using FASTGAP on GBLOCKED alignments
and verified by eye. Second, only indels that correctly conformed to
the species associations of the primate phylogeny (Figure 2) were
used and identified as a subset of synapomorphic events (Table 1,
Table 2, Table 3; Tables S5, S6). Third, another subset of
autapomorphic indels were identified and assessed as potential
signatures of genome plasticity for a given species (Tables S7, S8, S9).
Infrequently, some indels included in the analysis were positioned in
regions that did not amplify across all species. In these cases, indels
were identified as synapomorphic for a lineage providing ,70% of
the relevant species were successfully PCR amplified, and that
species with missing sequence for the indel did not all occur on the
same node within the lineage. The hypothesis that patterns of
nucleotide substitution are influenced by indel frequency was tested
by regression of ln-transformed branch length against ln-transformed
indels per branch. Tests of the association between genome rates of
evolution and indel frequency were conducted by regression of the
rate of nucleotide substitution (substitution/site/MY) versus ln-
transformed indel frequency per branch. Statistical software used
was SAS (SAS Institute Inc., SAS 9.1.3).
Supporting Information
Figure S1 Large tabloid format of Figure 2 from main text.
Found at: doi:10.1371/journal.pgen.1001342.s001 (1.23 MB PDF)
Figure S2 Maximum likelihood phylogeny of autosome data
partition (27,427 bp).
Found at: doi:10.1371/journal.pgen.1001342.s002 (0.22 MB PDF)
Figure S3 Maximum likelihood bootstrap consensus phylogeny
of autosome data partition (27,427 bp).
Found at: doi:10.1371/journal.pgen.1001342.s003 (0.28 MB PDF)
Figure S4 Maximum likelihood phylogeny of X-linked data
partition (4,870 bp).
Found at: doi:10.1371/journal.pgen.1001342.s004 (0.22 MB PDF)
Figure S5 Maximum likelihood bootstrap consensus phylogeny
of X-linked data partition (4,870 bp).
Found at: doi:10.1371/journal.pgen.1001342.s005 (0.29 MB PDF)
Figure S6 Maximum likelihood phylogeny of intron data
partition (16,371 bp).
Found at: doi:10.1371/journal.pgen.1001342.s006 (0.22 MB PDF)
Figure S7 Maximum likelihood bootstrap consensus phylogeny
of intron data partition (16,371 bp).
Found at: doi:10.1371/journal.pgen.1001342.s007 (0.29 MB PDF)
Figure S8 Maximum likelihood phylogeny of exon data
partition (14,742 bp).
Found at: doi:10.1371/journal.pgen.1001342.s008 (0.22 MB PDF)
Figure S9 Maximum likelihood bootstrap consensus phylogeny
of exon data partition (14,742 bp).
Found at: doi:10.1371/journal.pgen.1001342.s009 (0.29 MB PDF)
Figure S10 Maximum likelihood phylogeny of UTR data
partition (3,814 bp).
Found at: doi:10.1371/journal.pgen.1001342.s010 (0.22 MB PDF)
Figure S11 Maximum likelihood bootstrap consensus phylogeny
of UTR data partition (3,814 bp).
Found at: doi:10.1371/journal.pgen.1001342.s011 (0.28 MB PDF)
Figure S12 Maximum likelihood phylogeny of Y-linked data
partition of N = 127 males only (2,630 bp).
Found at: doi:10.1371/journal.pgen.1001342.s012 (0.03 MB PDF)
Figure S13 Maximum likelihood bootstrap consensus phylogeny
of Y-linked data partition of N = 127 males only (2,630 bp).
Found at: doi:10.1371/journal.pgen.1001342.s013 (0.03 MB PDF)
Table S1 List of DNA specimens used in study.
Found at: doi:10.1371/journal.pgen.1001342.s014 (0.08 MB PDF)
Table S2 List of 54 gene regions, primers and source used in
study.
Found at: doi:10.1371/journal.pgen.1001342.s015 (0.05 MB PDF)
Table S3 Putative gene ontology of 54 genes used in this study.
Found at: doi:10.1371/journal.pgen.1001342.s016 (0.07 MB PDF)
Table S4 Chromosome location, phylogenetic informativity and
nucleotide variation of 54 genes.
Found at: doi:10.1371/journal.pgen.1001342.s017 (0.04 MB PDF)
Table S5 Synapomorphic and autapomorphic indels sorted by
branch node and species listed in Figure 2.
Found at: doi:10.1371/journal.pgen.1001342.s018 (0.08 MB PDF)
Table S6 Synapomorphic and autapomorphic indels sorted by
gene.
Found at: doi:10.1371/journal.pgen.1001342.s019 (0.07 MB PDF)
Table S7 Genome rates, branch lengths, and indels for
Strepsirrhini species and Tarsiiformes.
Found at: doi:10.1371/journal.pgen.1001342.s020 (0.03 MB PDF)
Table S8 Genome rate, branch length, and indels within
Platyrrhini species.
Found at: doi:10.1371/journal.pgen.1001342.s021 (0.04 MB PDF)
Table S9 Genome rates, branch lengths, and indels for
catarrhine species.
Found at: doi:10.1371/journal.pgen.1001342.s022 (0.03 MB PDF)
Table S10 Genome rates across primate genera.
Found at: doi:10.1371/journal.pgen.1001342.s023 (0.04 MB PDF)
Table S11 NCBI Accession Numbers.
Found at: doi:10.1371/journal.pgen.1001342.s024 (0.03 MB PDF)
Table S12 Models of nucleotide substitution for maximum
likelihood phylogenetic analyses of combined and partitioned data
in Figure 2, Figures S1, S2, S3, S4, S5. NOTE: Y genes only 127
individuals (males).
Found at: doi:10.1371/journal.pgen.1001342.s025 (0.03 MB PDF)
Acknowledgments
We acknowledge generous support from D. Swofford for use of
PAUP_dev_ICC. We thank explicitly sample providers listed in Table
S1. This research was not possible without the outstanding technical
assistance from Amy Chen, Alex Peters, Christina Walker, Nathan Follin,
Joseph Bullard, Amy Zheng, Rasshmi Shankar, Gary Chen, Matthew
Healy, Lisa Maslan, and Carrie McCracken at the Laboratory of Genomic
Primate Phylogeny
PLoS Genetics | www.plosgenetics.org 15 March 2011 | Volume 7 | Issue 3 | e1001342
Diversity; Stephanie Merrett, Wendy Parris, and Lisa Bukovnik at Duke
University; Christiane Schwarz at the German Primate Center; Kelly Rose
Lobo de Souza and Shayany Pinto Felix at the Genetics Division-INCA;
and Soraya Silva Andrade at the UFPA.
Author Contributions
Conceived and designed the experiments: JPS. Performed the experiments:
PP HNS JEH MAMM MPCS AS JPS. Analyzed the data: PP WEJ JPS.
Contributed reagents/materials/analysis tools: PP WEJ CR HNS JEH
MAMM BK JP MR YR MPCS AS SJO JPS. Wrote the paper: PP WEJ
CR HNS JEH MAMM JP MR MPCS AS SJO JPS. Implemented,
supervised, and directed research project: JPS. Conducted phylogenetic
and statistical analyses: JPS. Curated DNA samples and DNA sequences:
PP. Performed BEAST analysis: WEJ.
References
1. Goodman M, Porter CA, Czelusniak J, Page SL, Schneider H, et al. (1998)
Toward a phylogenetic classification of Primates based on DNA evidence
complemented by fossil evidence. Molecular Phylogenetics and Evolution 9:
585–598.
2. Groves CP (2001) Primate taxonomy. Washington, DC: Smithsonian Institution
Press. 350 p.
3. Wilson DE, Reeder DM (2005) Mammal species of the world : a taxonomic and
geographic reference. Baltimore: Johns Hopkins University Press. 2142 p.
4. Chatterjee HJ, Ho SYW, Barnes I, Groves C (2009) Estimating the phylogeny
and divergence times of primates using a supermatrix approach. BMC
Evolutionary Biology 9: 259.
5. Fabre PH, Rodrigues A, Douzery EJP (2009) Patterns of macroevolution among
Primates inferred from a supermatrix of mitochondrial and nuclear DNA.
Molecular Phylogenetics and Evolution 53: 808–825.
6. Pecon-Slattery J, Wilkerson AJP, Murphy WJ, O’Brien SJ (2004) Phylogenetic
assessment of introns and SINEs within the Y chromosome using the cat family
Felidae as a species tree. Molecular Biology and Evolution 21: 2299–2309.
7. Johnson WE, Eizirik E, Pecon-Slattery J, Murphy WJ, Antunes A, et al. (2006)
The Late Miocene radiation of modern Felidae: A genetic assessment. Science
311: 73–77.
8. Eizirik E MW, Springer MS, O’Brien SJ (2004) Molecular Phylogeny and
Dating of Early Primate Divergences. In: Ross CF KR, ed. Anthropoid Origins:
New Visions. New York: Kluwer Academic/Plenum. pp 45–65.
9. Bajpai S, Kay RF, Williams BA, Das DP, Kapur VV, et al. (2008) The oldest
Asian record of Anthropoidea. Proceedings of the National Academy of Sciences
of the United States of America 105: 11093–11098.
10. Kay RF, Ross C, Williams BA (1997) Anthropoid origins. Science 275: 797–804.
11. Nowak RM (1999) Walker’s mammals of the world. Baltimore: Johns Hopkins
University Press. 1936 p.
12. Murphy WJ, Eizirik E, Johnson WE, Zhang YP, Ryder OA, et al. (2001)
Molecular phylogenetics and the origins of placental mammals. Nature 409:
614–618.
13. Schmitz J, Ohme M, Zischler H (2001) SINE insertions in cladistic analyses and
the phylogenetic affiliations of Tarsius bancanus to other primates. Genetics 157:
777–784.
14. Matsui A, Rakotondraparany F, Munechika I, Hasegawa M, Horai S (2009)
Molecular phylogeny and evolution of prosimians based on complete sequences
of mitochondrial DNAs. Gene 441: 53–66.
15. Arnason U, Adegoke JA, Bodin K, Born EW, Esa YB, et al. (2002) Mammalian
mitogenomic relationships and the root of the eutherian tree. Proceedings of the
National Academy of Sciences of the United States of America 99: 8151–8156.
16. Janecka JE, Miller W, Pringle TH, Wiens F, Zitzmann A, et al. (2007) Molecular
and genomic data identify the closest living relative of primates. Science 318:
792–794.
17. Kriegs JO, Churakov G, Jurka J, Brosius J, Schmitz J (2007) Evolutionary history
of 7SL RNA-derived SINEs in supraprimates. Trends in Genetics 23: 158–161.
18. Churakov G, Kriegs JO, Baertsch R, Zemann A, Brosius J, et al. (2009) Mosaic
retroposon insertion patterns in placental mammals. Genome Research 19:
868–875.
19. Roos C, Schmitz J, Zischler H (2004) Primate jumping genes elucidate
strepsirrhine phylogeny. Proceedings of the National Academy of Sciences of the
United States of America 101: 10650–10654.
20. Horvath JE, Willard HF (2007) Primate comparative genomics: lemur biology
and evolution. Trends in Genetics 23: 173–182.
21. Horvath JE, Weisrock DW, Embry SL, Fiorentino I, Balhoff JP, et al. (2008)
Development and application of a phylogenomic toolkit: resolving the
evolutionary history of Madagascar’s lemurs. Genome Research 18: 489–499.
22. Mittermeier R, Ganzhorn J, Konstant W, Glander K, Tattersall I, et al. (2008)
Lemur Diversity in Madagascar. International Journal of Primatology 29:
1607–1656.
23. Takai M, Anaya F, Shigehara N, Setoguchi T (2000) New fossil materials of the
earliest new world monkey, Branisella boliviana, and the problem of platyrrhine
origins. American Journal of Physical Anthropology 111: 263–281.
24. Takai M, Anaya F (1996) New specimens of the oldest fossil platyrrhine,
Branisella boliviana, from Salla, Bolivia. American Journal of Physical
Anthropology 99: 301–317.
25. Poux C, Chevret P, Huchon D, de Jong WW, Douzery EJP (2006) Arrival and
diversification of caviomorph rodents and platyrrhine primates in South
America. Systematic Biology 55: 228–244.
26. Hodgson JA, Sterner KN, Matthews LJ, Burrell AS, Jani RA, et al. (2009)
Successive radiations, not stasis, in the South American primate fauna.
Proceedings of the National Academy of Sciences of the United States of
America 106: 5534–5539.
27. Osterholz M, Walter L, Roos C (2008) Phylogenetic position of the langur
genera Semnopithecus and Trachypithecus among Asian colobines, and genus
affiliations of their species groups. BMC Evolutionary Biology 8: 58.
28. Opazo JC, Wildman DE, Prychitko T, Johnson RM, Goodman M (2006)
Phylogenetic relationships and divergence times among New World monkeys
(Platyrrhini, Primates). Molecular Phylogenetics and Evolution 40: 274–280.
29. Steiper ME, Ruvolo M (2003) New World monkey phylogeny based on X-linked
G6PD DNA sequences. Molecular Phylogenetics and Evolution 27: 121–130.
30. Osterholz M, Walter L, Roos C (2009) Retropositional events consolidate the
branching order among New World monkey genera. Molecular Phylogenetics
and Evolution 50: 507–513.
31. Ankel-Simons F, Rasmussen DT (2008) Diurnality, Nocturnality, and the
Evolution of Primate Visual Systems. American Journal of Physical Anthropol-
ogy. pp 100–117.
32. Ford SM, Davis LC (1992) Systematics and body size: implications for feeding
adaptations in New World monkeys. American Journal of Physical Anthropol-
ogy 88: 415–468.
33. Cropp SJ, Larson A, Cheverud JM (1999) Historical biogeography of tamarins,
genus Saguinus: The molecular phylogenetic evidence. American Journal of
Physical Anthropology 108: 65–89.
34. Canavez FC, Moreira MAM, Simon F, Parham P, Seuanez HN (1999)
Phylogenetic relationships of the callitrichinae (Platyrrhini, Primates) based on
beta(2)-microglobulin DNA sequences. American Journal of Primatology 48:
225–236.
35. Ford SM (1980) Callitrichids as phyletic dwarfs, and the place of Callitrichidae
in Platyrrhini. Primates 21: 31–43.
36. Moynihan M (1976) The New World primates : adaptive radiation and the
evolution of social behavior, languages, and intelligence. Princeton, N.J.:
Princeton University Press. 262 p.
37. Fleagle JG (1988) Primate adaptation and evolution. San Diego: Academic Press.
486 p.
38. Delson E (1992) Evolution of Old World Monkeys. In: Jones S MR, Pilbeam D,
eds. The Cambridge Encyclopedia of Human Evolution. Cambridge UK:
Cambridge University Press. pp 217–222.
39. Xing J, Wang H, Zhang Y, Ray DA, Tosi AJ, et al. (2007) A mobile element-
based evolutionary history of guenons (tribe Cercopithecini). BMC Biology 5: 5.
40. Ting N, Tosi AJ, Li Y, Zhang YP, Disotell TR (2008) Phylogenetic incongruence
between nuclear and mitochondrial markers in the Asian colobines and the
evolution of the langurs and leaf monkeys. Molecular Phylogenetics and
Evolution 46: 466–474.
41. Page SL, Goodman M (2001) Catarrhine phylogeny: Noncoding DNA evidence
for a diphyletic origin of the mangabeys and for a human-chimpanzee clade.
Molecular Phylogenetics and Evolution 18: 14–25.
42. Page SL, Chiu CH, Goodman M (1999) Molecular phylogeny of old world
monkeys (Cercopithecidae) as inferred from gamma-globin DNA sequences.
Molecular Phylogenetics and Evolution 13: 348–359.
43. Moulin S, Gerbault-Seureau M, Dutrillaux B, Richard FA (2008) Phyloge-
nomics of African guenons. Chromosome Research 16: 783–799.
44. Karanth KP, Singh L, Collura RV, Stewart CB (2008) Molecular phylogeny and
biogeography of langurs and leaf monkeys of South Asia (Primates : Colobinae).
Molecular Phylogenetics and Evolution 46: 683–694.
45. Groves CP (1989) Cercopithecus and company: a primate radiation. Science
244: 860–861.
46. Karanth KP (2008) Primate numts and reticulate evolution of capped and
golden leaf monkeys (Primates: Colobinae). Journal of biosciences 33: 761–770.
47. Tosi AJ, Melnick DJ, Disotell TR (2004) Sex chromosome phylogenetics indicate
a single transition to terrestriality in the guenons (tribe Cercopithecini). Journal
of Human Evolution 46: 223–237.
48. Tosi AJ, Disotell TR, Morales JC, Melnick DJ (2003) Cercopithecine Y-
chromosome data provide a test of competing morphological evolutionary
hypotheses. Molecular Phylogenetics and Evolution 27: 510–521.
49. Ziegler T, Abegg C, Meijaard E, Perwitasari-Farajallah D, Walter L, et al.
(2007) Molecular phylogeny and evolutionary history of Southeast Asian
macaques forming the M. silenus group. Molecular Phylogenetics and Evolution
42: 807–816.
Primate Phylogeny
PLoS Genetics | www.plosgenetics.org 16 March 2011 | Volume 7 | Issue 3 | e1001342

50. Elango N, Thomas JW, Yi SV, Progra NCS (2006) Variable molecular clocks in
hominoids. Proceedings of the National Academy of Sciences of the United
States of America 103: 1370–1375.
51. Steiper ME (2006) Population history, biogeography, and taxonomy of
orangutans (Genus : Pongo) based on a population genetic meta-analysis of
multiple loci. Journal of Human Evolution 50: 509–522.
52. Muller S, Hollatz M, Wienberg J (2003) Chromosomal phylogeny and evolution
of gibbons (Hylobatidae). Human Genetics 113: 493–501.
53. Jauch A, Wienberg J, Stanyon R, Arnold N, Tofanelli S, et al. (1992)
Reconstruction of genomic rearrangements in great apes and gibbons by
chromosome painting. Proceedings of the National Academy of Sciences of the
United States of America 89: 8611–8615.
54. Misceo D, Capozzi O, Roberto R, Dell’Oglio MP, Rocchi M, et al. (2008)
Tracking the complex flow of chromosome rearrangements from the
Hominoidea Ancestor to extant Hylobates and Nomascus Gibbons by high-
resolution synteny mapping. Genome Research 18: 1530–1537.
55. Roos C, Geissmann T (2001) Molecular phylogeny of the major hylobatid
divisions. Molecular Phylogenetics and Evolution 19: 486–494.
56. Zhu LC, Wang Q, Tang P, Araki H, Tian DC (2009) Genomewide Association
between Insertions/Deletions and the Nucleotide Diversity in Bacteria.
Molecular Biology and Evolution 26: 2353–2361.
57. Tian DC, Wang Q, Zhang PF, Araki H, Yang SH, et al. (2008) Single-
nucleotide mutation rate increases close to insertions/deletions in eukaryotes.
Nature 455: 105-U170.
58. Volfovsky N, Oleksyk TK, Cruz KC, Truelove AL, Stephens RM, et al. (2009)
Genome and gene alterations by insertions and deletions in the evolution of
human and chimpanzee chromosome 22. BMC Genomics 10: 51.
59. Chen JQ, Wu Y, Yang HW, Bergelson J, Kreitman M, et al. (2009) Variation in
the Ratio of Nucleotide Substitution and Indel Rates across Genomes in
Mammals and Bacteria. Molecular Biology and Evolution 26: 1523–1531.
60. Kehrer-Sawatzki H, Cooper DN (2007) Understanding the recent evolution of
the human genome: insights from human-chimpanzee genome comparisons.
Human Mutation 28: 99–130.
61. Schmitz J, Roos C, Zischler H (2005) Primate phylogeny: molecular evidence
from retroposons. Cytogenetic and Genome Research 108: 26–37.
62. Tabuce R, Marivaux L, Lebrun R, Adaci M, Bensalah M, et al. (2009)
Anthropoid versus strepsirhine status of the African Eocene primates Algeripithecus
and Azibius: craniodental evidence. Proceedings of the Royal Society B-
Biological Sciences 276: 4087–4094.
63. Yoder AD, Burns MM, Zehr S, Delefosse T, Veron G, et al. (2003) Single origin
of Malagasy Carnivora from an African ancestor. Nature 421: 734–737.
64. Teeling EC, Scally M, Kao DJ, Romagnoli ML, Springer MS, et al. (2000)
Molecular evidence regarding the origin of echolocation and flight in bats.
Nature 403: 188–192.
65. Venta PJ, Brouillette JA, Yuzbasiyan-Gurkan V, Brewer GJ (1996) Gene-specific
universal mammalian sequence-tagged sites: application to the canine genome.
Biochemical Genetics 34: 321–341.
66. Lyons LA, Laughlin TF, Copeland NG, Jenkins NA, Womack JE, et al. (1997)
Comparative anchor tagged sequences (CATS) for integrative mapping of
mammalian genomes. Nature Genetics 15: 47–56.
67. Moreira MAM (2002) SRY evolution in Cebidae (Platyrrhini: Primates). Journal
of Molecular Evolution 55: 92–103.68. Flynn JJ, Nedbal MA (1998) Phylogeny of the Carnivora (Mammalia):
Congruence vs incompatibility among multiple data sets. Molecular Phyloge-
netics and Evolution 9: 414–426.69. Katoh K, Toh H (2008) Recent developments in the MAFFT multiple sequence
alignment program. Brief Bioinform 9: 286–298.70. Katoh K, Asimenos G, Toh H (2009) Multiple alignment of DNA sequences
with MAFFT. Methods in Molecular Biology 537: 39–64.
71. Rambaut A (2007) Se-Al. Sequence Alignment Editor. Oxford: University ofOxford.
72. Talavera G, Castresana J (2007) Improvement of phylogenies after removingdivergent and ambiguously aligned blocks from protein sequence alignments.
Systematic Biology 56: 564–577.73. Posada D, Crandall KA (1998) MODELTEST: testing the model of DNA
substitution. Bioinformatics 14: 817–818.
74. Swofford DL (2002) PAUP*. Phylogenetic Analysis Using Parsimony (*andOther Methods). Version 4. Sinauer Associates, Sunderland, Massachusetts.
75. Zwickl DJ (2006) Genetic algorithm approaches for the phylogenetic analysis oflarge biological sequence datasets under the maximum likelihood criterion.
Austin: The University of Texas.
76. Drummond AJ, Rambaut A (2007) BEAST: Bayesian evolutionary analysis bysampling trees. BMC Evolutionary Biology 7: 214.
77. Drummond AJ, Ho SYW, Phillips MJ, Rambaut A (2006) Relaxedphylogenetics and dating with confidence. PLoS Biol 4: e88. doi:10.1371/
journal.pbio.0040088.78. Seiffert ER, Simons EL, Attia Y (2003) Fossil evidence for an ancient divergence
of lorises and galagos. Nature 422: 421–424.
79. Franzen JL, Gingerich PD, Habersetzer J, Hurum JH, von Koenigswald W,et al. (2009) Complete primate skeleton from the Middle Eocene of Messel in
Germany: morphology and paleobiology. PLoS ONE 4: e5723. doi:10.1371/journal.pone.0005723.
80. Poux C, Douzery EJ (2004) Primate phylogeny, evolutionary rate variations, and
divergence times: a contribution from the nuclear gene IRBP. American Journalof Physical Anthropology 124: 1–16.
81. Kay RF, Fleagle JG, Mitchell TRT, Colbert M, Bown T, et al. (2008) Theanatomy of Dolichocebus gaimanensis, a stem platyrrhine monkey from
Argentina. Journal of Human Evolution 54: 323–382.82. Steiper ME, Young NM, Sukarna TY (2004) Genomic data support the
hominoid slowdown and an Early Oligocene estimate for the hominoid-
cercopithecoid divergence. Proceedings of the National Academy of Sciences ofthe United States of America 101: 17021–17026.
83. Tosi AJ, Detwiler KM, Disotell TR (2005) X-chromosomal window into theevolutionary history of the guenons (Primates : Cercopithecini). Molecular
Phylogenetics and Evolution 36: 58–66.
84. Vignaud P, Duringer P, Mackaye HT, Likius A, Blondel C, et al. (2002) Geologyand palaeontology of the Upper Miocene Toros-Menalla hominid locality,
Chad. Nature 418: 152–155.85. Tavare S, Marshall CR, Will O, Soligo C, Martin RD (2002) Using the fossil
record to estimate the age of the last common ancestor of extant primates.Nature 416: 726–729.
Primate Phylogeny
PLoS Genetics | www.plosgenetics.org 17 March 2011 | Volume 7 | Issue 3 | e1001342
Related Documents