HAL Id: tel-03155484 https://tel.archives-ouvertes.fr/tel-03155484 Submitted on 12 Mar 2021 HAL is a multi-disciplinary open access archive for the deposit and dissemination of sci- entific research documents, whether they are pub- lished or not. The documents may come from teaching and research institutions in France or abroad, or from public or private research centers. L’archive ouverte pluridisciplinaire HAL, est destinée au dépôt et à la diffusion de documents scientifiques de niveau recherche, publiés ou non, émanant des établissements d’enseignement et de recherche français ou étrangers, des laboratoires publics ou privés. A Modelling-Based Sustainability Assessment in Manufacturing Organizations Yasamin Eslami To cite this version: Yasamin Eslami. A Modelling-Based Sustainability Assessment in Manufacturing Organizations. En- gineering Sciences [physics]. Politecnico di Bari, 2019. English. tel-03155484

Welcome message from author
This document is posted to help you gain knowledge. Please leave a comment to let me know what you think about it! Share it to your friends and learn new things together.
Transcript
HAL Id: tel-03155484https://tel.archives-ouvertes.fr/tel-03155484
Submitted on 12 Mar 2021
HAL is a multi-disciplinary open accessarchive for the deposit and dissemination of sci-entific research documents, whether they are pub-lished or not. The documents may come fromteaching and research institutions in France orabroad, or from public or private research centers.
L’archive ouverte pluridisciplinaire HAL, estdestinée au dépôt et à la diffusion de documentsscientifiques de niveau recherche, publiés ou non,émanant des établissements d’enseignement et derecherche français ou étrangers, des laboratoirespublics ou privés.
A Modelling-Based Sustainability Assessment inManufacturing Organizations
Yasamin Eslami
To cite this version:Yasamin Eslami. A Modelling-Based Sustainability Assessment in Manufacturing Organizations. En-gineering Sciences [physics]. Politecnico di Bari, 2019. English. �tel-03155484�
Department of Mechanics, Mathematics and Management MECHANICAL AND MANAGEMENT ENGINEERING
Ph.D. Program SSD: ING-IND/16– Tecnologie E Sistemi Di Lavorazione
Final Dissertation
A Modelling-Based Sustainability Assessment in Manufacturing Organizations
by
Yasamin Eslami
Supervisor:
Prof. Ing . Miche le DASSISTI Jury Members:
Prof. Ing . Miche le DASSISTI Prof. Hervé PANETTO Prof. Mario LEZOCHE Prof. Francesco Maddalen
Coordinator of Ph.D. Program:
Giuseppe DEMELIO
Defence Date: 23/07/2019 Course n°31, 01/11/2015-31/10/2018

This page is left black intentionally.
ACKNOWLEDGMENT
It is my proud privilege to release the feeling of my gratitude to people who directly or indirectly have lent their hand in this venture and helped me conduct this research work. Without their continued efforts and support, I would have not been able to bring my work to a successful completion.
This dissertation could not be written to its fullest without Prof. Ing. Michele Dassisti, who served as my supervisor, as well as one who challenged and encouraged me during the time, I was working with him. I’d be always grateful for the opportunities he created for me, for his personal and professional care and for his insightful comments. I am extremely thankful and indebted to him for his sincere and valuable guidance extended to me and the work especially in times of need.
I wish to express my sincere thanks to my co-supervisor, Prof. Hervé Panetto, whose guidance and immense knowledge was of a great deal in conducting the research. I benefitted greatly from our fruitful discussions, his motivations, encouragement and words of advice which all made him the backbone of this thesis.
I gratefully acknowledge Dr. Mario Lezoche, for his valuable inputs to our discussions. It was a real privilege for me to share of his exceptional scientific knowledge, his expertise and also his extraordinary human qualities. He was without a doubt instrumental in helping me crank out this thesis.
I also place on record, my sense of gratitude to Politecnico di Bari and DMMM, for funding me and supporting me in the first steps of scientific demand and consequently in development and conclusion of the work.
My sincere thanks go to CRAN and University of Lorraine in Nancy for giving me the access to their lab and providing me with excellent material and human condition without which the completion of the work was not possible.
I would like to thank my friends and family who always stood by me in good and bad times Back home in Iran, here in Italy, in France, in the U.S.A and the ones spread in the world. Their names cannot be disclosed by, but I’d like to acknowledge and appreciate their permanent support and encouragements. No matter how far they were, I always have them by my side.
Last but not the least I would like to express my heart full indebtedness and owe a deep sense of gratitude to my parents, Mohammad and Roya, whose love and support moved me through all the steps of my life from day one till now and also this work. I doubt that I will ever be able to convey my appreciation fully to them. However, this work is heartily dedicated to them as they gave meaning to everything I have in life. I also take the opportunity to give thanks to my brothers, Majid and Amin, for their unceasing love, support and encouragement. I’ve never felt weak by having them in my life and they never let me feel alone while I was miles away from home.
Yasamin Eslami
June 2019 – Bari - Italy
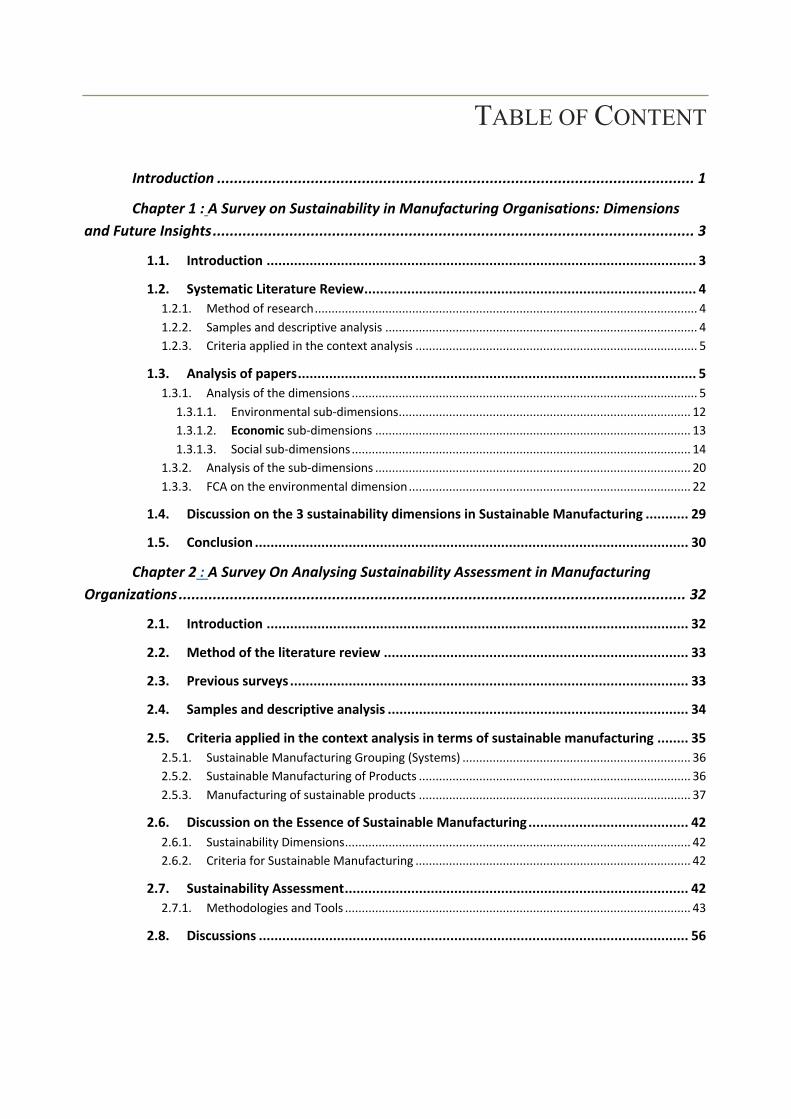
TABLE OF CONTENT
Introduction ................................................................................................................ 1
Chapter 1 : A Survey on Sustainability in Manufacturing Organisations: Dimensions and Future Insights ................................................................................................................. 3
1.1. Introduction .............................................................................................................. 3
1.2. Systematic Literature Review ..................................................................................... 4 1.2.1. Method of research .................................................................................................................. 4 1.2.2. Samples and descriptive analysis ............................................................................................. 4 1.2.3. Criteria applied in the context analysis .................................................................................... 5
1.3. Analysis of papers ...................................................................................................... 5 1.3.1. Analysis of the dimensions ....................................................................................................... 5
1.3.1.1. Environmental sub-dimensions ....................................................................................... 12 1.3.1.2. Economic sub-dimensions .............................................................................................. 13 1.3.1.3. Social sub-dimensions ..................................................................................................... 14
1.3.2. Analysis of the sub-dimensions .............................................................................................. 20 1.3.3. FCA on the environmental dimension .................................................................................... 22
1.4. Discussion on the 3 sustainability dimensions in Sustainable Manufacturing ........... 29
1.5. Conclusion ............................................................................................................... 30
Chapter 2 : A Survey On Analysing Sustainability Assessment in Manufacturing Organizations ....................................................................................................................... 32
2.1. Introduction ............................................................................................................ 32
2.2. Method of the literature review .............................................................................. 33
2.3. Previous surveys ...................................................................................................... 33
2.4. Samples and descriptive analysis ............................................................................. 34
2.5. Criteria applied in the context analysis in terms of sustainable manufacturing ........ 35 2.5.1. Sustainable Manufacturing Grouping (Systems) .................................................................... 36 2.5.2. Sustainable Manufacturing of Products ................................................................................. 36 2.5.3. Manufacturing of sustainable products ................................................................................. 37
2.6. Discussion on the Essence of Sustainable Manufacturing ......................................... 42 2.6.1. Sustainability Dimensions ....................................................................................................... 42 2.6.2. Criteria for Sustainable Manufacturing .................................................................................. 42
2.7. Sustainability Assessment ........................................................................................ 42 2.7.1. Methodologies and Tools ....................................................................................................... 43
2.8. Discussions .............................................................................................................. 56
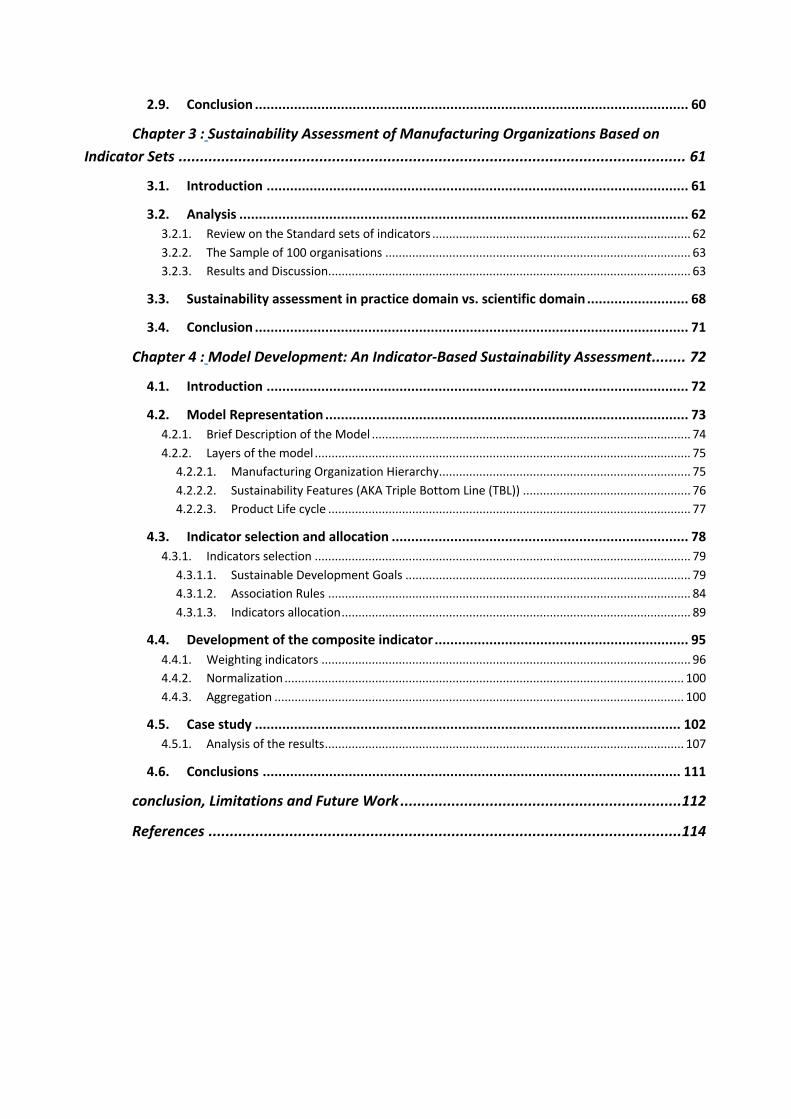
2.9. Conclusion ............................................................................................................... 60
Chapter 3 : Sustainability Assessment of Manufacturing Organizations Based on Indicator Sets ....................................................................................................................... 61
3.1. Introduction ............................................................................................................ 61
3.2. Analysis ................................................................................................................... 62 3.2.1. Review on the Standard sets of indicators ............................................................................. 62 3.2.2. The Sample of 100 organisations ........................................................................................... 63 3.2.3. Results and Discussion ............................................................................................................ 63
3.3. Sustainability assessment in practice domain vs. scientific domain .......................... 68
3.4. Conclusion ............................................................................................................... 71
Chapter 4 : Model Development: An Indicator-Based Sustainability Assessment ........ 72
4.1. Introduction ............................................................................................................ 72
4.2. Model Representation ............................................................................................. 73 4.2.1. Brief Description of the Model ............................................................................................... 74 4.2.2. Layers of the model ................................................................................................................ 75
4.2.2.1. Manufacturing Organization Hierarchy ........................................................................... 75 4.2.2.2. Sustainability Features (AKA Triple Bottom Line (TBL)) .................................................. 76 4.2.2.3. Product Life cycle ............................................................................................................ 77
4.3. Indicator selection and allocation ............................................................................ 78 4.3.1. Indicators selection ................................................................................................................ 79
4.3.1.1. Sustainable Development Goals ..................................................................................... 79 4.3.1.2. Association Rules ............................................................................................................ 84 4.3.1.3. Indicators allocation ........................................................................................................ 89
4.4. Development of the composite indicator ................................................................. 95 4.4.1. Weighting indicators .............................................................................................................. 96 4.4.2. Normalization ....................................................................................................................... 100 4.4.3. Aggregation .......................................................................................................................... 100
4.5. Case study ............................................................................................................. 102 4.5.1. Analysis of the results ........................................................................................................... 107
4.6. Conclusions ........................................................................................................... 111
conclusion, Limitations and Future Work .................................................................. 112
References ............................................................................................................... 114
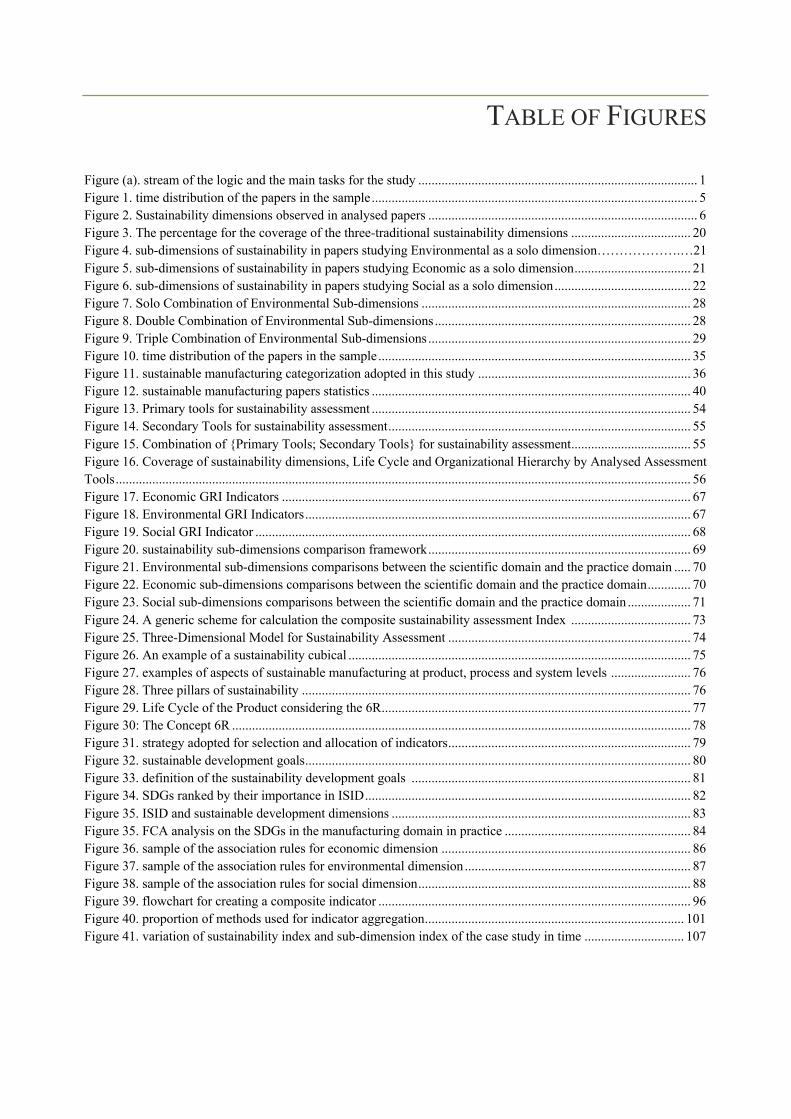
TABLE OF FIGURES
Figure (a). stream of the logic and the main tasks for the study .................................................................................... 1 Figure 1. time distribution of the papers in the sample .................................................................................................. 5 Figure 2. Sustainability dimensions observed in analysed papers ................................................................................. 6 Figure 3. The percentage for the coverage of the three-traditional sustainability dimensions .................................... 20 Figure 4. sub-dimensions of sustainability in papers studying Environmental as a solo dimension……………….…21 Figure 5. sub-dimensions of sustainability in papers studying Economic as a solo dimension ................................... 21 Figure 6. sub-dimensions of sustainability in papers studying Social as a solo dimension ......................................... 22 Figure 7. Solo Combination of Environmental Sub-dimensions ................................................................................. 28 Figure 8. Double Combination of Environmental Sub-dimensions ............................................................................. 28 Figure 9. Triple Combination of Environmental Sub-dimensions ............................................................................... 29 Figure 10. time distribution of the papers in the sample .............................................................................................. 35 Figure 11. sustainable manufacturing categorization adopted in this study ................................................................ 36 Figure 12. sustainable manufacturing papers statistics ................................................................................................ 40 Figure 13. Primary tools for sustainability assessment ................................................................................................ 54 Figure 14. Secondary Tools for sustainability assessment ........................................................................................... 55 Figure 15. Combination of {Primary Tools; Secondary Tools} for sustainability assessment .................................... 55 Figure 16. Coverage of sustainability dimensions, Life Cycle and Organizational Hierarchy by Analysed Assessment Tools ............................................................................................................................................................................. 56 Figure 17. Economic GRI Indicators ........................................................................................................................... 67 Figure 18. Environmental GRI Indicators .................................................................................................................... 67 Figure 19. Social GRI Indicator ................................................................................................................................... 68 Figure 20. sustainability sub-dimensions comparison framework ............................................................................... 69 Figure 21. Environmental sub-dimensions comparisons between the scientific domain and the practice domain ..... 70 Figure 22. Economic sub-dimensions comparisons between the scientific domain and the practice domain ............. 70 Figure 23. Social sub-dimensions comparisons between the scientific domain and the practice domain ................... 71 Figure 24. A generic scheme for calculation the composite sustainability assessment Index .................................... 73 Figure 25. Three-Dimensional Model for Sustainability Assessment ......................................................................... 74 Figure 26. An example of a sustainability cubical ....................................................................................................... 75 Figure 27. examples of aspects of sustainable manufacturing at product, process and system levels ........................ 76 Figure 28. Three pillars of sustainability ..................................................................................................................... 76 Figure 29. Life Cycle of the Product considering the 6R ............................................................................................. 77 Figure 30: The Concept 6R .......................................................................................................................................... 78 Figure 31. strategy adopted for selection and allocation of indicators ......................................................................... 79 Figure 32. sustainable development goals .................................................................................................................... 80 Figure 33. definition of the sustainability development goals .................................................................................... 81 Figure 34. SDGs ranked by their importance in ISID .................................................................................................. 82 Figure 35. ISID and sustainable development dimensions .......................................................................................... 83 Figure 35. FCA analysis on the SDGs in the manufacturing domain in practice ........................................................ 84 Figure 36. sample of the association rules for economic dimension ........................................................................... 86 Figure 37. sample of the association rules for environmental dimension .................................................................... 87 Figure 38. sample of the association rules for social dimension .................................................................................. 88 Figure 39. flowchart for creating a composite indicator .............................................................................................. 96 Figure 40. proportion of methods used for indicator aggregation .............................................................................. 101 Figure 41. variation of sustainability index and sub-dimension index of the case study in time .............................. 107

Figure 42. Sustainability index in the Pre-Manufacturing Stage ............................................................................... 108 Figure 43. Sustainability index in the Manufacturing Stage ...................................................................................... 109 Figure 44. Sustainability index in the Use Stage ....................................................................................................... 109 Figure 45. Sustainability index in the Post- Use Stage .............................................................................................. 110
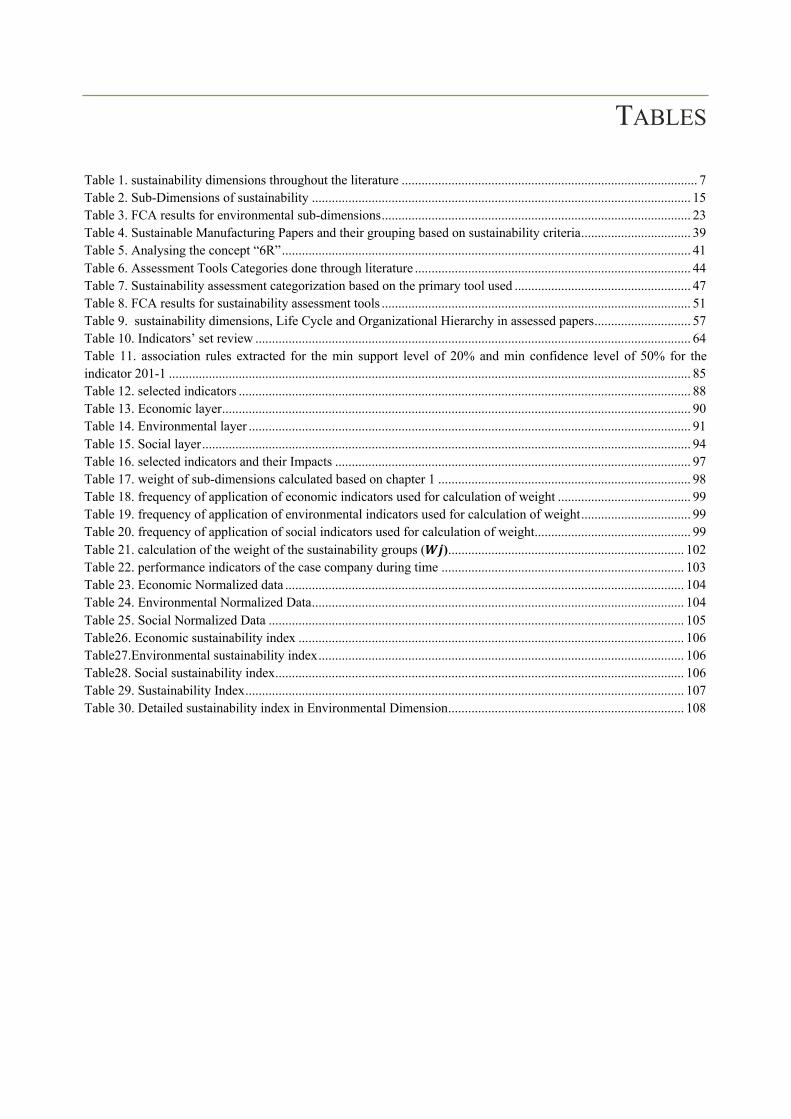
TABLES
Table 1. sustainability dimensions throughout the literature ......................................................................................... 7 Table 2. Sub-Dimensions of sustainability .................................................................................................................. 15 Table 3. FCA results for environmental sub-dimensions ............................................................................................. 23 Table 4. Sustainable Manufacturing Papers and their grouping based on sustainability criteria ................................. 39 Table 5. Analysing the concept “6R” ........................................................................................................................... 41 Table 6. Assessment Tools Categories done through literature ................................................................................... 44 Table 7. Sustainability assessment categorization based on the primary tool used ..................................................... 47 Table 8. FCA results for sustainability assessment tools ............................................................................................. 51 Table 9. sustainability dimensions, Life Cycle and Organizational Hierarchy in assessed papers ............................. 57 Table 10. Indicators’ set review ................................................................................................................................... 64 Table 11. association rules extracted for the min support level of 20% and min confidence level of 50% for the indicator 201-1 ............................................................................................................................................................. 85 Table 12. selected indicators ........................................................................................................................................ 88 Table 13. Economic layer ............................................................................................................................................. 90 Table 14. Environmental layer ..................................................................................................................................... 91 Table 15. Social layer ................................................................................................................................................... 94 Table 16. selected indicators and their Impacts ........................................................................................................... 97 Table 17. weight of sub-dimensions calculated based on chapter 1 ............................................................................ 98 Table 18. frequency of application of economic indicators used for calculation of weight ........................................ 99 Table 19. frequency of application of environmental indicators used for calculation of weight ................................. 99 Table 20. frequency of application of social indicators used for calculation of weight ............................................... 99 Table 21. calculation of the weight of the sustainability groups (𝑾𝒋) ....................................................................... 102 Table 22. performance indicators of the case company during time ......................................................................... 103 Table 23. Economic Normalized data ........................................................................................................................ 104 Table 24. Environmental Normalized Data ................................................................................................................ 104 Table 25. Social Normalized Data ............................................................................................................................. 105 Table26. Economic sustainability index .................................................................................................................... 106 Table27.Environmental sustainability index .............................................................................................................. 106 Table28. Social sustainability index ........................................................................................................................... 106 Table 29. Sustainability Index .................................................................................................................................... 107 Table 30. Detailed sustainability index in Environmental Dimension ....................................................................... 108
1
INTRODUCTION
Organizations are struggling to survive in today’s competitive market. They are mostly obliged to meet customers’ expectations and demand for sustainable products from one side and comply with governmental rules and regulations regarding energy, resources, materials, etc. on the other side. In addition, the bottom up demand of customers for more sustainable products and the top down need to comply with the governmental rules and regulation, made the manufacturing organizations think about ways, tools and methodologies to evaluate and assess the level of sustainability in the whole manufacturing system. Consequently, introducing tools and methodologies for sustainability assessment that truly helps manufacturers evaluate their organization without any inaccuracies is deeply felt.
Studying the growing methods and tools for sustainability assessment, Moldavska & Welo (2015) questioned the applicability of those methods by real manufacturing companies and stated that there is a gap between the needs of manufacturing companies to improve their performance in terms of sustainability and the efficiency and capability of the available assessment tools. In addition, literature still lacks a framework that can evaluate sustainable manufacturing as a whole. On the other hand, the lack of systematic view and standardization in the existing assessment methods make them ad hoc and also not capable in recognizing the opportunities to have a sustainable organization (Smullin, 2016).
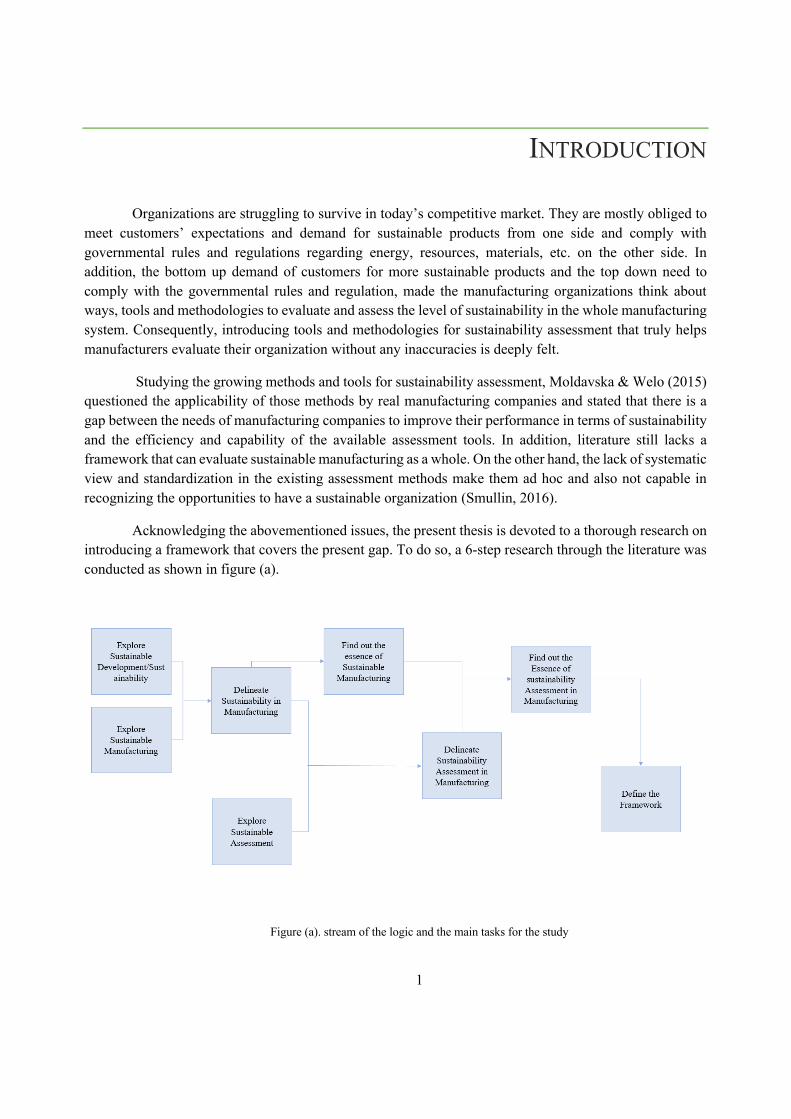
Acknowledging the abovementioned issues, the present thesis is devoted to a thorough research on introducing a framework that covers the present gap. To do so, a 6-step research through the literature was conducted as shown in figure (a).
Figure (a). stream of the logic and the main tasks for the study
2
Based on the figure, prior studies must be done in order to get deep in the concept of sustainability assessment in manufacturing; to serve the purpose the first two research questions were emerged as “How sustainability is defined through its dimensions? and What sub-dimensions can denominate sustainable manufacturing?”. The first chapter is entirely dedicated to finding a respond to these questions. A systematic literature review was conducted on the literature available for the concept of sustainability and sustainable manufacturing to highlight the aspects of sustainability and sustainable manufacturing and scrutinize its dimensions and sub-dimensions. Finally, the observations are analysed through Formal Concept Analysis (FCA) and the results will help take one step further in developing the model.
Moving from sustainable manufacturing to sustainability assessment, the second chapter starts with arising two other questions: “How can sustainable manufacturing be achieved” and “How can sustainable manufacturing be assessed?” to find a proper answer for them, an exploration of sustainability assessment was directed on the concepts of sustainability assessments and its tools which resulted in characterization of sustainability assessment in manufacturing and discovering its essence as a consequence; which itself could be followed by proposing the framework.
The first two chapters will delineate the trend toward sustainable manufacturing and sustainability assessment in the scientific domain. Therefore, prior to development of the model, it has been decided to have an analysis of sustainable manufacturing in the manufacturing domain in practice. However, organizations perception of operational sustainability can reveal their strategies on how to be a sustainable organization, endeavouring the three pillars of economics, environmental and social internal assets. The chapter is centred on the investigation on the role of indicators’ choice and their meaning for the purpose of the sustainability assessment of manufacturing organizations. To this point, an analysis has been conducted on sustainability assessment of 100 manufacturing organizations using GRI indicators for assessing their sustainability state. A Formal Concept Analysis was run to look over the indicators and their interpretations to reach a given degree of sustainability of the organization.
Noticing the result of the three chapters, the focal point of the final chapter will be on the final research question: “how we can help manufacturing organizations in terms of assessing sustainability” and “how we can help manufacturing organizations discover opportunities to reach a better state of sustainability”. To be able to respond to the question, a model-based sustainability assessment tools based on indicators will be development. In addition, the process of aggregating indicators to create a composite sustainability development index will be fully scrutinized. The step by step procedure will be described and the effectiveness of the proposed model will be examined by a real case company.
3
CHAPTER 1 A SURVEY ON SUSTAINABILITY IN
MANUFACTURING ORGANISATIONS: DIMENSIONS AND FUTURE INSIGHTS
1.1. Introduction
Manufacturing enterprises are forced by several increasing challenges such as resource depletion, economic stagnation, human being pursuing higher life quality and stricter regulations and banning policies. Sustainable manufacturing has intended to empower the companies to cope with such challenges and guide them to stand out in the competitive market today. Therefore, manufacturers are now tending to reset to manufacturing processes and manufactured products that minimize environmental impacts while considering social and economic dimensions. On the other hand, Jawahir et al. (2014) insisted on the need for having an expanded look at sustainable manufacturing as he stated that: “sustainable manufacturing at product, process and system level, must demonstrate reduced negative environmental impacts, offer improved energy and resource efficiency, generate minimum quality of waste, provide operational personnel health while maintaining and/or improving the product and process quality with the overall life cycle cost benefits.”
Sustainable manufacturing aims at creating a future in which 100% of products are recyclable, manufacturing causes zero impact on the environmental and complete disassembly of a product at its end of life is routine (Rachuri, Sriram, & Sarkar, 2009). To make this vision come true and to move in that direction, companies need to reply to a series of questions: How sustainability is defined through its dimensions? and What sub-dimensions can denominate sustainable manufacturing? Considering the questions, companies will be able to understand the scope and goals of sustainability regarding to their own field and also will detect the means which serve the purpose of reaching sustainability in a manufacturing organization (Arena et al., 2009). To investigate the first question, which is the focus of the present chapter, it is needed to delineate the domain on which sustainability can act on and define its strategies.
The term sustainability has been used interchangeably with sustainable development. In spite of the introduction of sustainable development, the World Commission on Environment and Development (WCED, 1987) made nearly 30 years ago, there is still no single agreed-upon definition for sustainability. The same definition by WCED has been used the most and widely by manufacturers, engineers, economists and others as a working definition of sustainability: “development that meets the needs of the present generation without compromising the ability of future generations to meet their own needs”. This definition is compatible with several other interpretations of sustainability throughout the literature (Voinov & Farley, 2007). The definition made by the U.S Department of Commerce (DoC) for sustainable manufacturing paves the path to move from sustainability to sustainable manufacturing: “the creation of manufactured products that use processes that minimize negative environmental impacts, conserve energy and natural
4
resources, are safe for employees, communities and consumers and are economically sound” (Huang & Badurdeen, 2017). Corresponding to this definition and based on (Uva et al., 2017), sustainability is known as a delicate balance between the economic, environmental and social health of a community, nation and of course the earth. However, the concept of sustainability needs to be more than the traditional three dimensions (namely: economy, society, and the environment) and this classification for the domains of sustainability seems to be too broad and more delineation is needed to help manufacturers identify more specific issues on which they can act to be more “sustainable”. To win over the purpose, the chapter tries to organize the literature on sustainability in manufacturing, looking through its dimensions and sub-dimensions in order to get a detailed view of sustainable manufacturing.
The chapter is structured as the following: the literature review methodology will be described in sections 2. The samples will be introduced in the same section as well as the applied criteria for the content analysis. Section 3 starts with an analysis of the papers so that the sustainability dimensions, their sub-dimensions and the groupings of sustainable manufacturing are explored by applying Formal Concept Analysis (FCA). The results will be discussed in section 4. Finally, conclusions are described.
1.2. Systematic Literature Review
1.2.1. Method of research
The study of the present chapter is formed by a systematic literature review on sustainable manufacturing and the domains of sustainability in manufacturing organizations. To do so, the first question from the abovementioned sequence must have been answered through the work: how sustainability is defined through its dimensions? To that aim, papers were identified by means of a structured keyword search on major databases and publisher websites (Scopus, Elsevier ScienceDirect, Web of Science). Keywords such as “manufacturing” and “manufacturing system” were combined (using AND) with sustainability-related ones, such as “sustainable/sustainability”, “sustainable development” and “sustainable manufacturing system”. All the searches were applied in “Title, Keyword, Abstract” field. First, there were two issues excluded from further analysis as they seemed bias from the scope of the research, due to the dissimilarity of interests and distant from the authors’ aptness zone: (1) chemical product manufacturing process and (2) manufacturing by renewable energy. However, it is highly important to note that the focus of the study was on statistical data, therefore, business-oriented papers (i.e. ( Gurtu, Searcy, & Jaber, 2016)) and the papers which investigate sustainability in a global level ( i.e. (Gurtu, Searcy, & Jaber, 2017))were also decided to be considered out of scope and be excluded from the search.
A content analysis was conducted to systematically assess the papers. The material collection has been already described which is by means of the literature search and the reduction mode mentioned above. For the analysis itself, a set of criteria was used at first for describing the sample. The respective content analysis is outlined as the following sectors.
1.2.2. Samples and descriptive analysis
The overall sample considered in this study is 115 papers (published up to March 2018 as in the Reference section). The time distribution of the papers published is shown in figure 1.
5
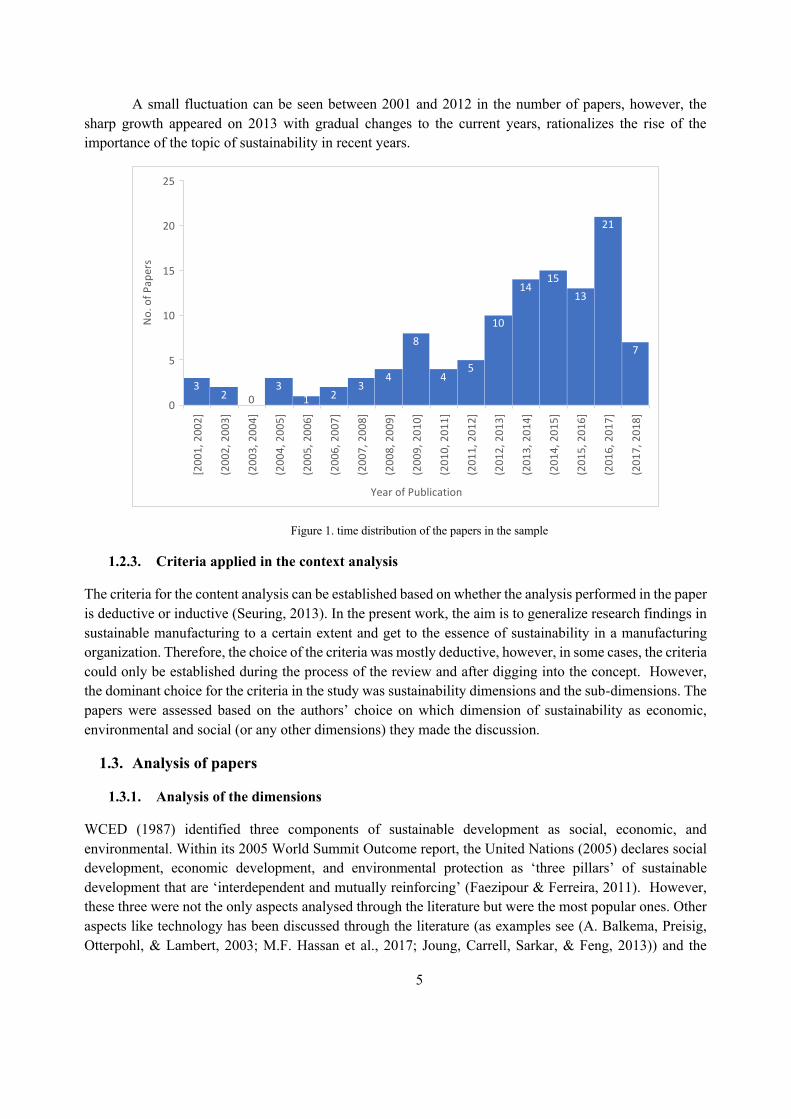
A small fluctuation can be seen between 2001 and 2012 in the number of papers, however, the sharp growth appeared on 2013 with gradual changes to the current years, rationalizes the rise of the importance of the topic of sustainability in recent years.
Figure 1. time distribution of the papers in the sample
1.2.3. Criteria applied in the context analysis
The criteria for the content analysis can be established based on whether the analysis performed in the paper is deductive or inductive (Seuring, 2013). In the present work, the aim is to generalize research findings in sustainable manufacturing to a certain extent and get to the essence of sustainability in a manufacturing organization. Therefore, the choice of the criteria was mostly deductive, however, in some cases, the criteria could only be established during the process of the review and after digging into the concept. However, the dominant choice for the criteria in the study was sustainability dimensions and the sub-dimensions. The papers were assessed based on the authors’ choice on which dimension of sustainability as economic, environmental and social (or any other dimensions) they made the discussion.
1.3. Analysis of papers
1.3.1. Analysis of the dimensions
WCED (1987) identified three components of sustainable development as social, economic, and environmental. Within its 2005 World Summit Outcome report, the United Nations (2005) declares social development, economic development, and environmental protection as ‘three pillars’ of sustainable development that are ‘interdependent and mutually reinforcing’ (Faezipour & Ferreira, 2011). However, these three were not the only aspects analysed through the literature but were the most popular ones. Other aspects like technology has been discussed through the literature (as examples see (A. Balkema, Preisig, Otterpohl, & Lambert, 2003; M.F. Hassan et al., 2017; Joung, Carrell, Sarkar, & Feng, 2013)) and the
32 0
31 2
34
8
45
10
1415
13
21
7
Year of Publication
[200
1, 2
002]
(200
2, 2
003]
(200
3, 2
004]
(200
4, 2
005]
(200
5, 2
006]
(200
6, 2
007]
(200
7, 2
008]
(200
8, 2
009]
(200
9, 2
010]
(201
0, 2
011]
(201
1, 2
012]
(201
2, 2
013]
(201
3, 2
014]
(201
4, 2
015]
(201
5, 2
016]
(201
6, 2
017]
(201
7, 2
018]
No.
of P
aper
s
0
5
10
15
20
25
6
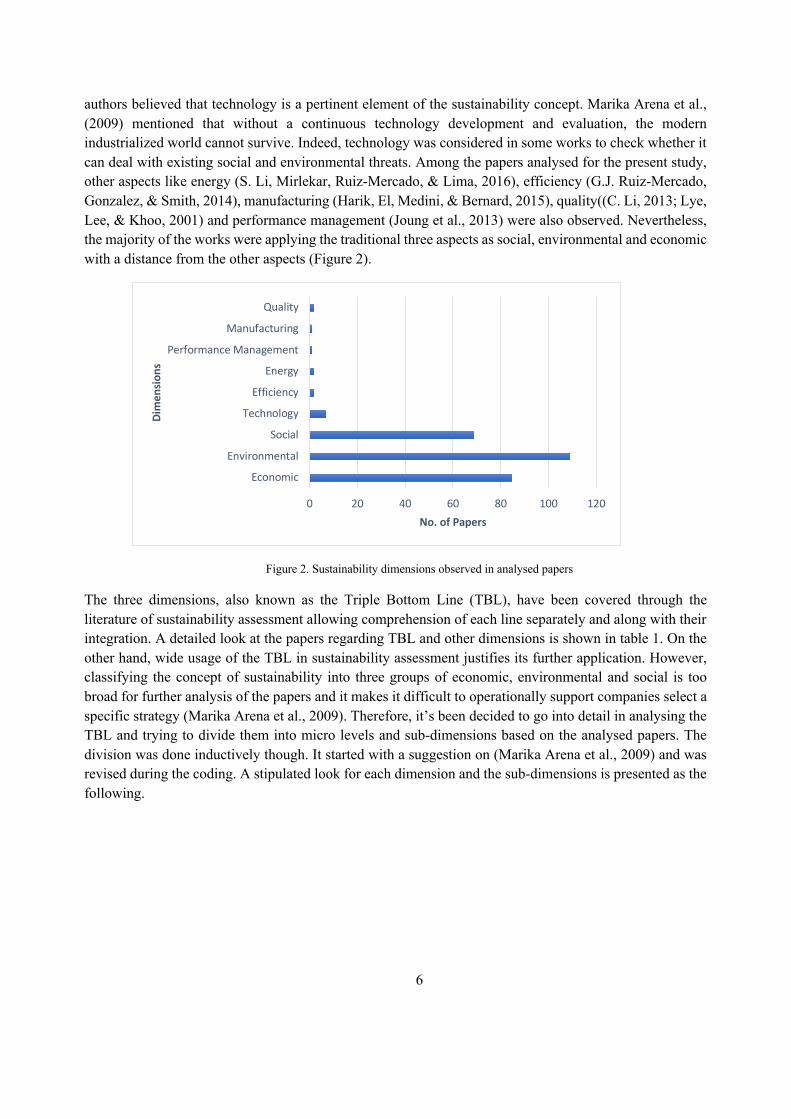
authors believed that technology is a pertinent element of the sustainability concept. Marika Arena et al., (2009) mentioned that without a continuous technology development and evaluation, the modern industrialized world cannot survive. Indeed, technology was considered in some works to check whether it can deal with existing social and environmental threats. Among the papers analysed for the present study, other aspects like energy (S. Li, Mirlekar, Ruiz-Mercado, & Lima, 2016), efficiency (G.J. Ruiz-Mercado, Gonzalez, & Smith, 2014), manufacturing (Harik, El, Medini, & Bernard, 2015), quality((C. Li, 2013; Lye, Lee, & Khoo, 2001) and performance management (Joung et al., 2013) were also observed. Nevertheless, the majority of the works were applying the traditional three aspects as social, environmental and economic with a distance from the other aspects (Figure 2).
Figure 2. Sustainability dimensions observed in analysed papers
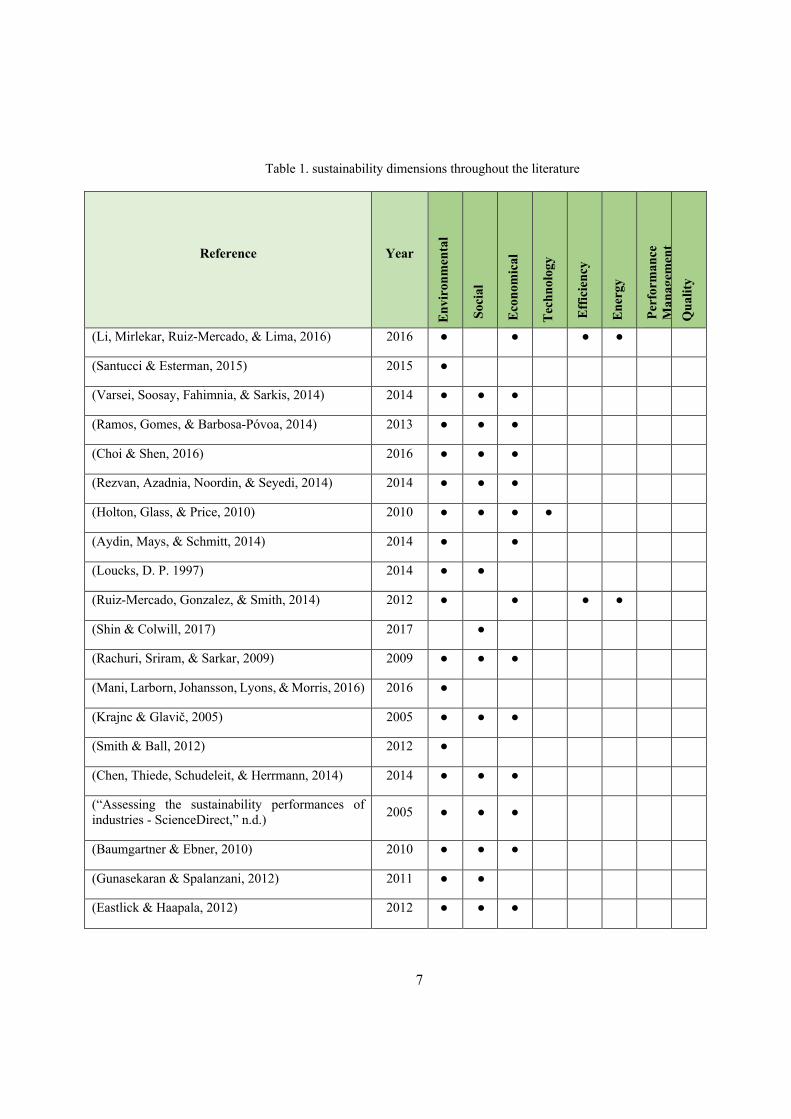
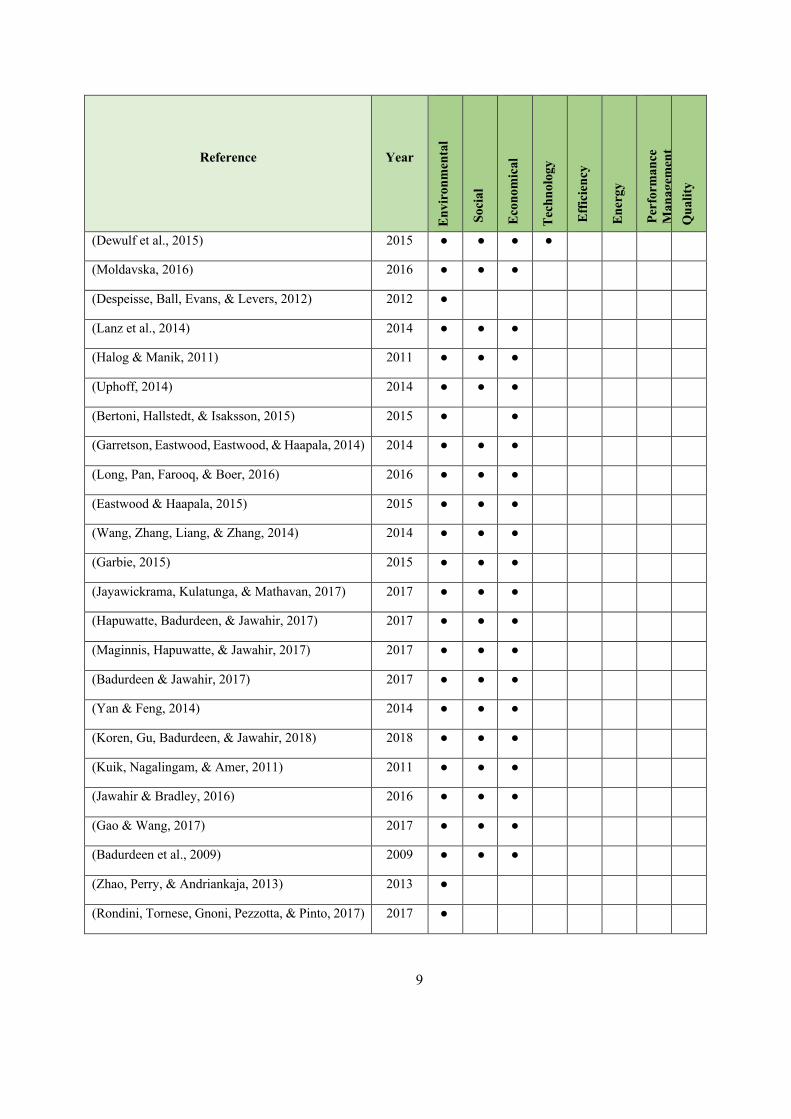
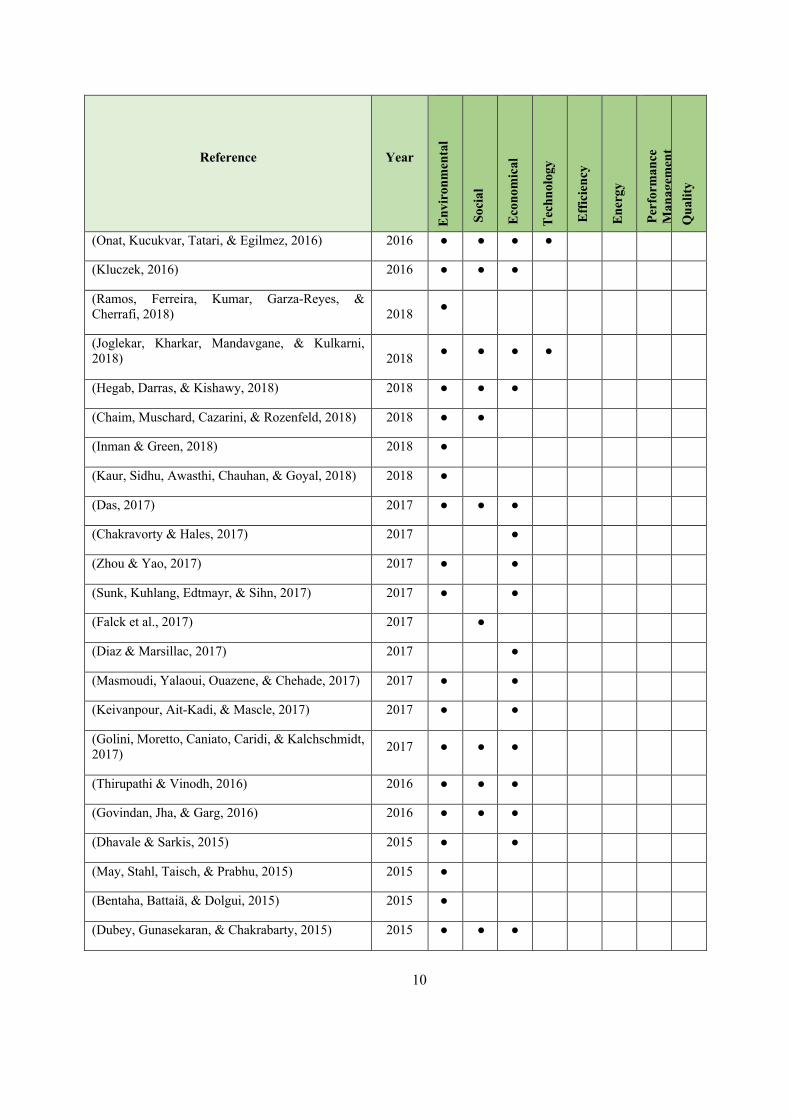
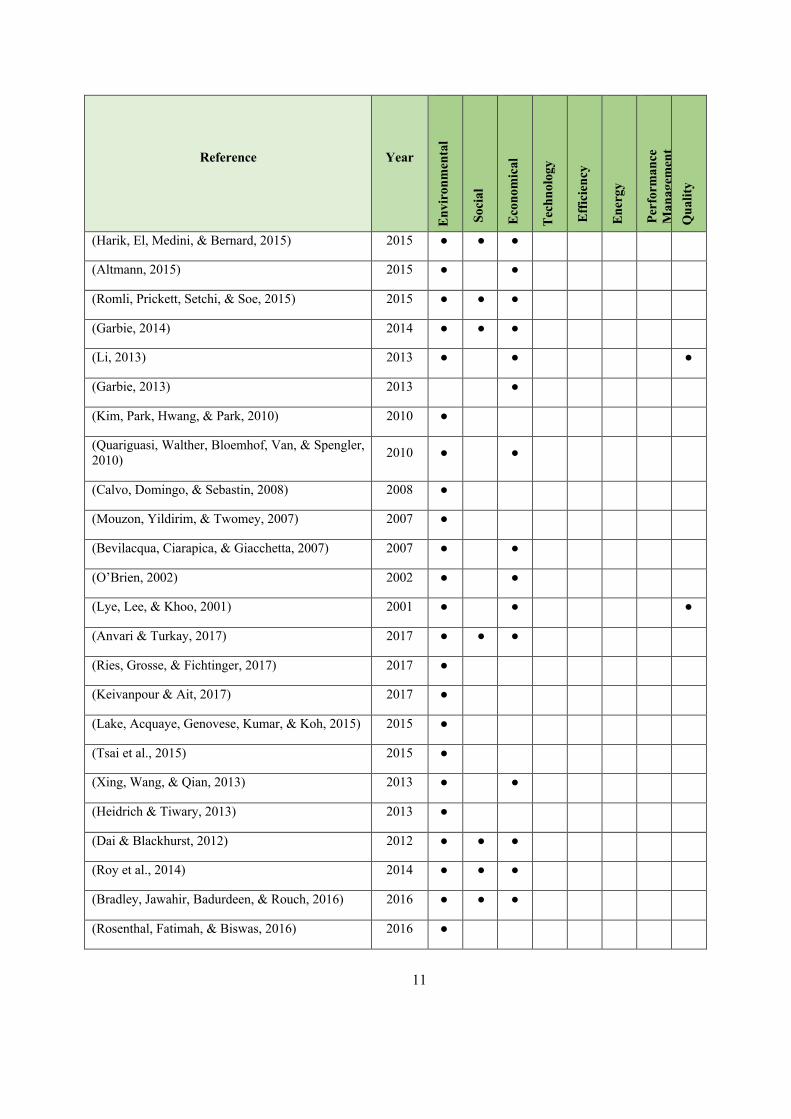
The three dimensions, also known as the Triple Bottom Line (TBL), have been covered through the literature of sustainability assessment allowing comprehension of each line separately and along with their integration. A detailed look at the papers regarding TBL and other dimensions is shown in table 1. On the other hand, wide usage of the TBL in sustainability assessment justifies its further application. However, classifying the concept of sustainability into three groups of economic, environmental and social is too broad for further analysis of the papers and it makes it difficult to operationally support companies select a specific strategy (Marika Arena et al., 2009). Therefore, it’s been decided to go into detail in analysing the TBL and trying to divide them into micro levels and sub-dimensions based on the analysed papers. The division was done inductively though. It started with a suggestion on (Marika Arena et al., 2009) and was revised during the coding. A stipulated look for each dimension and the sub-dimensions is presented as the following.
0 20 40 60 80 100 120
Economic
Environmental
Social
Technology
Efficiency
Energy
Performance Management
Manufacturing
Quality
No. of Papers
Dim
ensi
ons
7
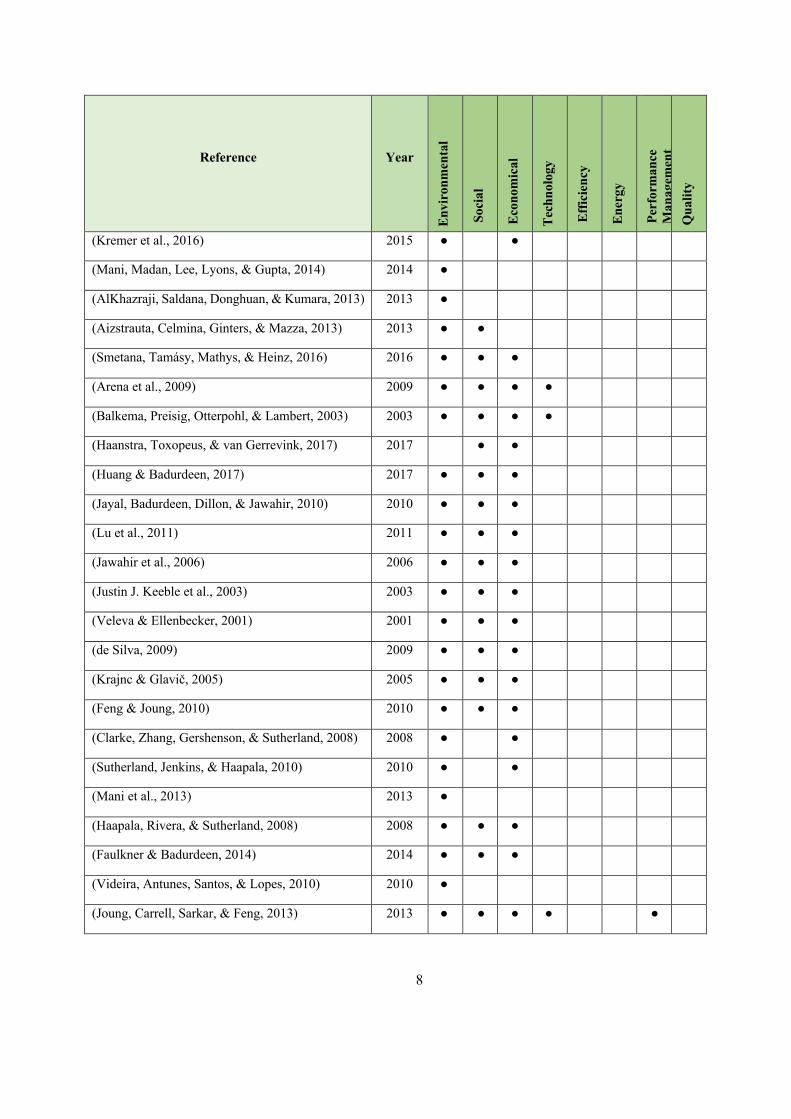
Table 1. sustainability dimensions throughout the literature
Reference Year
Envi
ronm
enta
l
Soci
al
Econ
omic
al
Tech
nolo
gy
Effic
ienc
y
Ener
gy
Perf
orm
ance
M
anag
emen
t Q
ualit
y
(Li, Mirlekar, Ruiz-Mercado, & Lima, 2016) 2016 ● ●
● ●
(Santucci & Esterman, 2015) 2015 ●
(Varsei, Soosay, Fahimnia, & Sarkis, 2014) 2014 ● ● ●
(Ramos, Gomes, & Barbosa-Póvoa, 2014) 2013 ● ● ●
(Choi & Shen, 2016) 2016 ● ● ●
(Rezvan, Azadnia, Noordin, & Seyedi, 2014) 2014 ● ● ●
(Holton, Glass, & Price, 2010) 2010 ● ● ● ●
(Aydin, Mays, & Schmitt, 2014) 2014 ● ●
(Loucks, D. P. 1997) 2014 ● ●
(Ruiz-Mercado, Gonzalez, & Smith, 2014) 2012 ● ●
● ●
(Shin & Colwill, 2017) 2017 ●
(Rachuri, Sriram, & Sarkar, 2009) 2009 ● ● ●
(Mani, Larborn, Johansson, Lyons, & Morris, 2016) 2016 ●
(Krajnc & Glavič, 2005) 2005 ● ● ●
(Smith & Ball, 2012) 2012 ●
(Chen, Thiede, Schudeleit, & Herrmann, 2014) 2014 ● ● ●
(“Assessing the sustainability performances of industries - ScienceDirect,” n.d.) 2005 ● ● ●
(Baumgartner & Ebner, 2010) 2010 ● ● ●
(Gunasekaran & Spalanzani, 2012) 2011 ● ●
(Eastlick & Haapala, 2012) 2012 ● ● ●
8
Reference Year
Envi
ronm
enta
l
Soci
al
Econ
omic
al
Tech
nolo
gy
Effic
ienc
y
Ener
gy
Perf
orm
ance
M
anag
emen
t Q
ualit
y
(Kremer et al., 2016) 2015 ● ●
(Mani, Madan, Lee, Lyons, & Gupta, 2014) 2014 ●
(AlKhazraji, Saldana, Donghuan, & Kumara, 2013) 2013 ●
(Aizstrauta, Celmina, Ginters, & Mazza, 2013) 2013 ● ●
(Smetana, Tamásy, Mathys, & Heinz, 2016) 2016 ● ● ●
(Arena et al., 2009) 2009 ● ● ● ●
(Balkema, Preisig, Otterpohl, & Lambert, 2003) 2003 ● ● ● ●
(Haanstra, Toxopeus, & van Gerrevink, 2017) 2017 ● ●
(Huang & Badurdeen, 2017) 2017 ● ● ●
(Jayal, Badurdeen, Dillon, & Jawahir, 2010) 2010 ● ● ●
(Lu et al., 2011) 2011 ● ● ●
(Jawahir et al., 2006) 2006 ● ● ●
(Justin J. Keeble et al., 2003) 2003 ● ● ●
(Veleva & Ellenbecker, 2001) 2001 ● ● ●
(de Silva, 2009) 2009 ● ● ●
(Krajnc & Glavič, 2005) 2005 ● ● ●
(Feng & Joung, 2010) 2010 ● ● ●
(Clarke, Zhang, Gershenson, & Sutherland, 2008) 2008 ●
●
(Sutherland, Jenkins, & Haapala, 2010) 2010 ● ●
(Mani et al., 2013) 2013 ●
(Haapala, Rivera, & Sutherland, 2008) 2008 ● ● ●
(Faulkner & Badurdeen, 2014) 2014 ● ● ●
(Videira, Antunes, Santos, & Lopes, 2010) 2010 ●
(Joung, Carrell, Sarkar, & Feng, 2013) 2013 ● ● ● ●
●
9
Reference Year
Envi
ronm
enta
l
Soci
al
Econ
omic
al
Tech
nolo
gy
Effic
ienc
y
Ener
gy
Perf
orm
ance
M
anag
emen
t Q
ualit
y
(Dewulf et al., 2015) 2015 ● ● ● ●
(Moldavska, 2016) 2016 ● ● ●
(Despeisse, Ball, Evans, & Levers, 2012) 2012 ●
(Lanz et al., 2014) 2014 ● ● ●
(Halog & Manik, 2011) 2011 ● ● ●
(Uphoff, 2014) 2014 ● ● ●
(Bertoni, Hallstedt, & Isaksson, 2015) 2015 ●
●
(Garretson, Eastwood, Eastwood, & Haapala, 2014) 2014 ● ● ●
(Long, Pan, Farooq, & Boer, 2016) 2016 ● ● ●
(Eastwood & Haapala, 2015) 2015 ● ● ●
(Wang, Zhang, Liang, & Zhang, 2014) 2014 ● ● ●
(Garbie, 2015) 2015 ● ● ●
(Jayawickrama, Kulatunga, & Mathavan, 2017) 2017 ● ● ●
(Hapuwatte, Badurdeen, & Jawahir, 2017) 2017 ● ● ●
(Maginnis, Hapuwatte, & Jawahir, 2017) 2017 ● ● ●
(Badurdeen & Jawahir, 2017) 2017 ● ● ●
(Yan & Feng, 2014) 2014 ● ● ●
(Koren, Gu, Badurdeen, & Jawahir, 2018) 2018 ● ● ●
(Kuik, Nagalingam, & Amer, 2011) 2011 ● ● ●
(Jawahir & Bradley, 2016) 2016 ● ● ●
(Gao & Wang, 2017) 2017 ● ● ●
(Badurdeen et al., 2009) 2009 ● ● ●
(Zhao, Perry, & Andriankaja, 2013) 2013 ●
(Rondini, Tornese, Gnoni, Pezzotta, & Pinto, 2017) 2017 ●
10
Reference Year
Envi
ronm
enta
l
Soci
al
Econ
omic
al
Tech
nolo
gy
Effic
ienc
y
Ener
gy
Perf
orm
ance
M
anag
emen
t Q
ualit
y
(Onat, Kucukvar, Tatari, & Egilmez, 2016) 2016 ● ● ● ●
(Kluczek, 2016) 2016 ● ● ●
(Ramos, Ferreira, Kumar, Garza-Reyes, & Cherrafi, 2018) 2018 ●
(Joglekar, Kharkar, Mandavgane, & Kulkarni, 2018) 2018 ● ● ● ●
(Hegab, Darras, & Kishawy, 2018) 2018 ● ● ●
(Chaim, Muschard, Cazarini, & Rozenfeld, 2018) 2018 ● ●
(Inman & Green, 2018) 2018 ●
(Kaur, Sidhu, Awasthi, Chauhan, & Goyal, 2018) 2018 ●
(Das, 2017) 2017 ● ● ●
(Chakravorty & Hales, 2017) 2017
●
(Zhou & Yao, 2017) 2017 ●
●
(Sunk, Kuhlang, Edtmayr, & Sihn, 2017) 2017 ●
●
(Falck et al., 2017) 2017
●
(Diaz & Marsillac, 2017) 2017
●
(Masmoudi, Yalaoui, Ouazene, & Chehade, 2017) 2017 ●
●
(Keivanpour, Ait-Kadi, & Mascle, 2017) 2017 ●
●
(Golini, Moretto, Caniato, Caridi, & Kalchschmidt, 2017) 2017 ● ● ●
(Thirupathi & Vinodh, 2016) 2016 ● ● ●
(Govindan, Jha, & Garg, 2016) 2016 ● ● ●
(Dhavale & Sarkis, 2015) 2015 ●
●
(May, Stahl, Taisch, & Prabhu, 2015) 2015 ●
(Bentaha, Battaiä, & Dolgui, 2015) 2015 ●
(Dubey, Gunasekaran, & Chakrabarty, 2015) 2015 ● ● ●
11
Reference Year
Envi
ronm
enta
l
Soci
al
Econ
omic
al
Tech
nolo
gy
Effic
ienc
y
Ener
gy
Perf
orm
ance
M
anag
emen
t Q
ualit
y
(Harik, El, Medini, & Bernard, 2015) 2015 ● ● ●
(Altmann, 2015) 2015 ● ●
(Romli, Prickett, Setchi, & Soe, 2015) 2015 ● ● ●
(Garbie, 2014) 2014 ● ● ●
(Li, 2013) 2013 ●
●
●
(Garbie, 2013) 2013
●
(Kim, Park, Hwang, & Park, 2010) 2010 ●
(Quariguasi, Walther, Bloemhof, Van, & Spengler, 2010) 2010 ●
●
(Calvo, Domingo, & Sebastin, 2008) 2008 ●
(Mouzon, Yildirim, & Twomey, 2007) 2007 ●
(Bevilacqua, Ciarapica, & Giacchetta, 2007) 2007 ●
●
(O’Brien, 2002) 2002 ●
●
(Lye, Lee, & Khoo, 2001) 2001 ●
●
●
(Anvari & Turkay, 2017) 2017 ● ● ●
(Ries, Grosse, & Fichtinger, 2017) 2017 ●
(Keivanpour & Ait, 2017) 2017 ●
(Lake, Acquaye, Genovese, Kumar, & Koh, 2015) 2015 ●
(Tsai et al., 2015) 2015 ●
(Xing, Wang, & Qian, 2013) 2013 ●
●
(Heidrich & Tiwary, 2013) 2013 ●
(Dai & Blackhurst, 2012) 2012 ● ● ●
(Roy et al., 2014) 2014 ● ● ●
(Bradley, Jawahir, Badurdeen, & Rouch, 2016) 2016 ● ● ●
(Rosenthal, Fatimah, & Biswas, 2016) 2016 ●
12
1.3.1.1. Environmental sub-dimensions
Environmental dimension helps companies measure the environmental aspect of sustainability performance in manufacturing and products. Concentrating on sustainability, it is obvious that the environmental dimension has been targeted the most: about 94% of the analysed papers referred to environmental dimension alone and alongside the other two; among which about 55% of the analysed papers tried to cover all the three dimensions simultaneously. However, most of the analysed papers address environmental issues in sustainability in similar categories. It was plotted that, sustainability in manufacturing processes, was the most targeted area in terms of environmental assessment and was carried on by measurement of energy, material, water and other resources used, throughout the processes involved in the life cycle of the product. Getting through the papers, studied issues from the environmental point of view can be categorized in four main groups: “Emission”, “Pollution”, “Resource Consumption” and “Biodiversity”. The first group can be described as the emissions from the manufacturing process include by-products, auxiliary materials used in the manufacturing products, waste energy, and wastewater, while “Pollution” is harmful substances released to the environment by a manufacturing process or organization, “Resources” on the other hand, can consist of raw materials, consumable tools, energy, and packaging materials used in a manufacturing process. Finally, the latter encompasses the variety of life at all levels of the organization, from genetic diversity within a species to diversity within entire regions or ecosystems (Joung et al., 2013). Acknowledging the four groups, the sub-dimensions “water”, “material”, “carbon footprint”, “emissions”, “waste”, “biodiversity”, “landfill”, “transport”, “resource” and “energy” seemed to be the dominant ones as they assess thoroughly the environmental dimension of sustainability.
However, some of the works that discussed environmental dimension of the sustainability are as the following: (Mani, Larborn, Johansson, Lyons, & Morris, 2016) used Discrete Event Simulation (DES) in combination with Life Cycle Assessment (LCA) to make more rigorous environmental decisions and to reach sustainable manufacturing processes. Material and resource usage were aggregated downstream in the product life cycle to discover, analyse and improve hotspots and bottlenecks. The E3012-16 standard was used as a guideline to collect information on the inputs, resources, products and process information that are transformed into the desired outputs. The same sub-dimensions were used by (Smith & Ball, 2012) to reach sustainable manufacturing by applying Process Flow Modelling. A suitable approach is created by mapping the life cycle of material, energy and waste process flow which are counted as the inputs of the physical resources and the outputs of the facility. A set of guidelines is also prepared to aid the analysis of the manufacturing systems with the help of the process flow through which a quantitative analysis is enabled by detailed insights within the system and assists with the identification and selection of environmental efficiency improvements. The efficiency within the manufacturing system can be measured financially and in terms of carbon emissions. Mani, Madan, Lee, Lyons, & Gupta (2014) tried to characterize sustainability in processes from the environmental point of view by addressing energy usage, emissions, water, waste and carbon footprint. On the other hand, Kremer et al. (2016) pointed both economic and environmental issues across product supply chain aiming at optimizing cost, carbon footprint, product quality and delivery reliability by considering geographical influence. Social and environmental dimensions were studied both
13
by (Loucks, 1997) to quantify trends in the sustainability of systems. Like many others, water, waste, land and other resources were the main environmental matters to be assessed by the authors. See (A. J. Balkema, Preisig, Otterpohl, & Lambert, 2003; Feng & Joung, 2010; Keeble, Topiol, & Berkeley, 2003; D. Krajnc & Glavič, 2005) as some other examples in which the same environmental sub-dimensions as the ones mentioned above alongside different ones in economic and social were studied.
1.3.1.2. Economic sub-dimensions
The economic feature will help manufacturing companies to measure the economic aspect of sustainability performance in manufacturing and products. Unlike environmental references, the economic dimension was addressed by diverse elements. The sub-dimensions by which sustainability was assessed were more dependent on how sustainable manufacturing was conceptualized and in what level it was assessed. Almost no paper targeted economic dimension alone, it was covered alongside the other two dimensions though (73% of the papers). For the papers covering the product or process level, measurements like investment, product quality, profitability, innovation, transportation, R&D were considered (see(Baumgartner & Ebner, 2010; Jayal, Badurdeen, Dillon, & Jawahir, 2010; Lu et al., 2011) as examples); while on the system level, direct and indirect cost, profit, net cash flow, economic development and penalty cost, were the main concerns (see, e.g., (Angappa Gunasekaran & Spalanzani, 2012; Huang & Badurdeen, 2017)). Nevertheless, based on the National Institute of standards and technology (NIST)(Thompson, 2011), the areas to study sustainability from an economic point of view in manufacturing can be divided to three main groups: “Profit”, “Manufacturing costs” and “Investment”. “Profit” subcategory aims at measuring revenue and profits attributable to the manufacturing of products. “Manufacturing Cost” subcategory covers the cost of manufacturing and can include costs of material, labour, tooling, equipment depreciation, energy consumption, water consumption, packaging, delivery, environmental protection (solid waste management and water treatment), and recycling. The third group, “Investment”, measures the investment performance in a manufacturing company.
However, some of the works discussed economic dimension of the sustainability are as the following: Ramos, Gomes, & Barbosa-Póvoa (2014) designed a multi-objective, multi-depot periodic Vehicle Routing Problem (VRP) with inter-depot routes to model a reverse logistic plan in order to balance costs with environmental and social issues. The model’s economic objective is to minimize the total distance travelled by vehicles which include inbound distance, outbound distance and also a possible extra distance as it is allowed to have vehicles based at one depot to perform closed routes from and to another depot. By applying the classic VRP and generating routes for vehicles, not only the total distance travelled by vehicles will be minimized but also the CO2 emissions and the working hours of the drivers will be decreased to the minimum amount possible. 33 economic indicators were introduced alongside 106 Energy, efficiency and environmental ones by Ruiz-Mercado et al. (2014) to measure the process performance. Based on the achieved performance evaluation, design modifications are suggested to reach the desired or increased sustainability goals. However, the economic indicators covered processing costs (capital cost, manufacturing cost), process input costs (raw material cost, utility costs) and process output costs (waste treatment costs). To reach the indicators, a conversion of flow and energy mass to monetary units (like raw material, product and utility cost) accompanied by the process and operating costs was needed. In addition, the equipment, operating conditions, and goods and services required for all manufacturing steps have to be reflected in terms of costs, such as manufacturing and capital costs. On the other hand, production cost,
14
initial time set, and energy saving were the economic categories (P. Rezvan, Azadnia, Noordin, & Seyedi, 2014) decide to cover to reach sustainability through a fuzzy evaluation of the process elements.
Conclusively, based on what has been observed through analysing papers and also considering groupings made by NIST and (Marika Arena et al., 2009) the sub-dimensions of “profit maximization”, “manufacturing cost optimization”, “market image”, “logistic cost”, “investment” and “indirect economic” impacts seemed the ones incapable of covering all the detailed classifications in the literature.
1.3.1.3. Social sub-dimensions
The social dimension which was studied in 60% of the papers, seemed to be the most conflicted one among all and was named the most problematic one due to its qualitative nature. Based on NIST, the social dimension has been designed for measuring employee, customer, and community well-being affected by manufacturing activities and products of a manufacturing company. It groups the dimension into three main sub-dimensions of Employee (employee well-being, such as health, safety, security, career development, and satisfaction, in a manufacturing facility), Customer (customer well-being, such as health and safety, affected by manufacturing and manufactured products) and Community (community well-being, such as health, safety, and human rights, affected by manufacturing and manufactured product).
However, the diversity of the measurements and interpretation of the social dimension in sustainable manufacturing was vast and they were pointing out a wide range of responsibilities from employment, to distribution to customer health and satisfaction. For instance, Huang & Badurdeen (2017) indicated that at the system level corporate safety, personnel health, societal impact of the product and even functional impacts need to be considered. On the other hand, Lu et al. (2011) mentioned education and training, customer satisfaction, employee safety and health are the ones to be measured. Damjan Krajnc & Glavič (2005) introduced an overall sustainability index by aggregating indices from different sustainability dimensions to make the process of decision making and comparison between companies easier. From social point of view, categories were studied that could reflect the attribute of the company to the treatment of its own employee, suppliers, contractor and customers and also its impact on society. Therefore, categories like health and safety of personnel (fatal accident rate, injury frequency, fatalities), "social and community investment and employment rate were studied to reach social sustainability. Issues like Employment (average wage) and occupational health and safety (acute injuries, lost work days and chronic illnesses) were covered by (Eastlick & Haapala, 2012) as it proposes a Design for Manufacturing (DoF) case followed by a decision-making process to support component design for sustainable manufacturing. The authors try to relate process and product design variables to selected sustainability indicators with the help of decomposing manufacturing processes and developing related mathematical expressions to assign input variable to output streams. Consequently, design choices will be related to sustainability indicators and it gives the opportunity to evaluate sustainable alternatives based on manufacturing process variations. From social perspective, the work covered employment rate along with safety and health of the personnel. To (Pouyan Rezvan, Azadnia, Noordin, & Seyedi, 2014) the most important social issue was product responsibility while some papers like (A. Balkema et al., 2003; Jayal, Badurdeen, Dillon, & Jawahir, 2010a; Lu et al., 2011) insisted on considering End of Life Management (EOL) of the products as a social issue as well.
To cover all discussed issues, and based on the scope of the study, “labour practice/working condition”, “diversity and equal opportunities”, “relations with the community”, “social policy
15
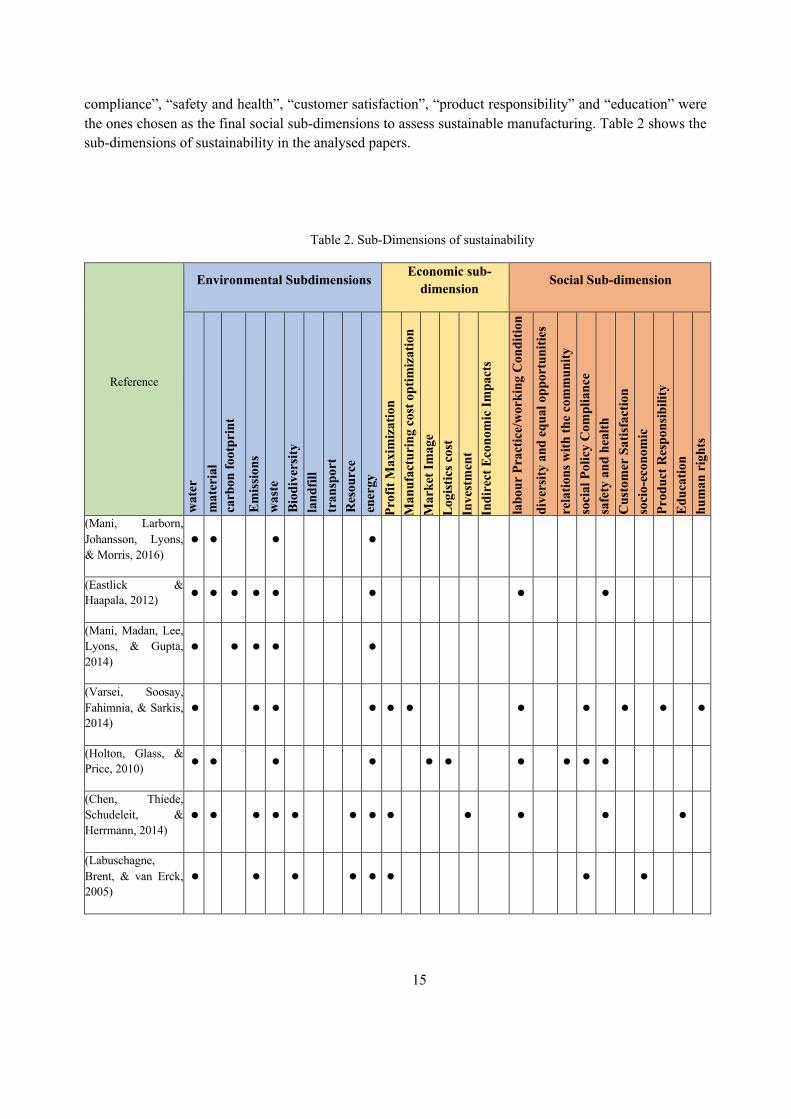
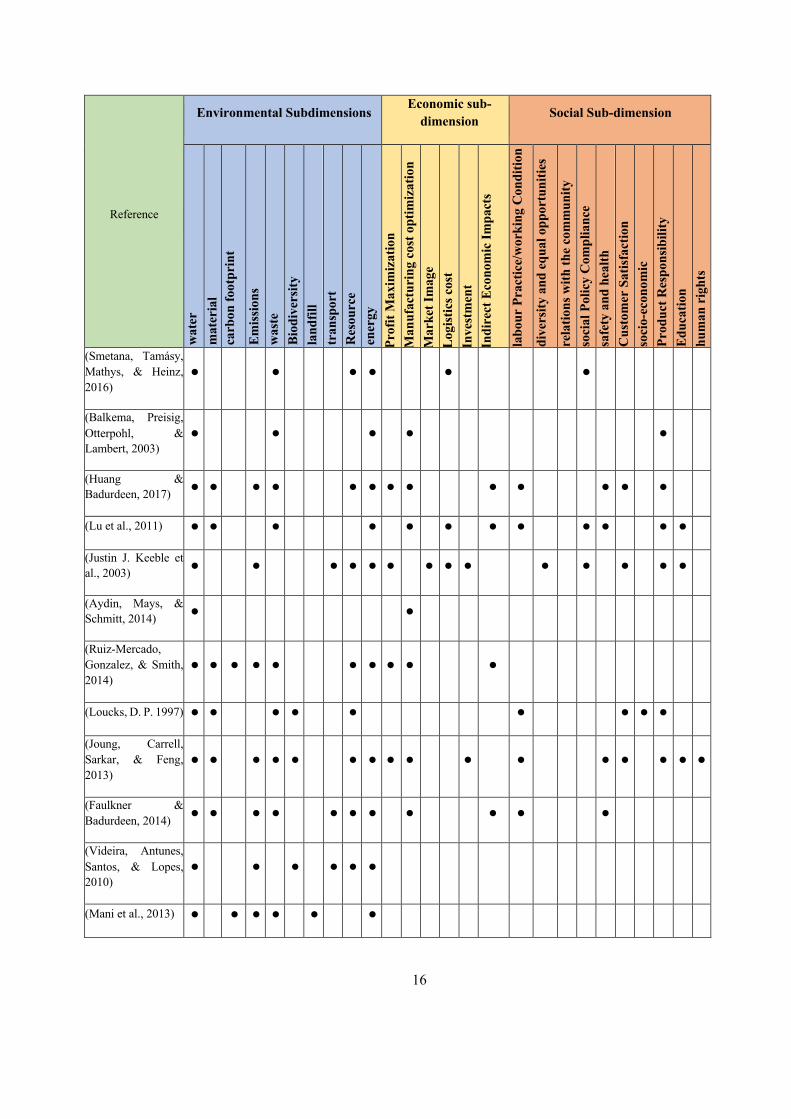
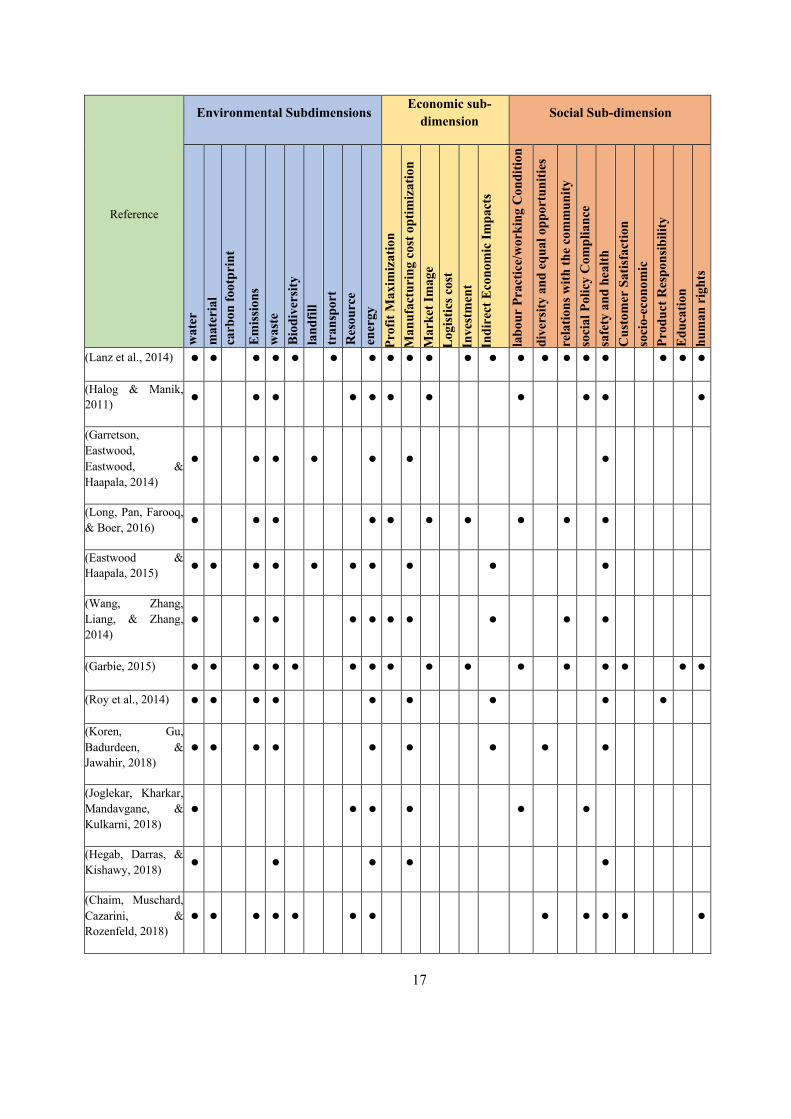
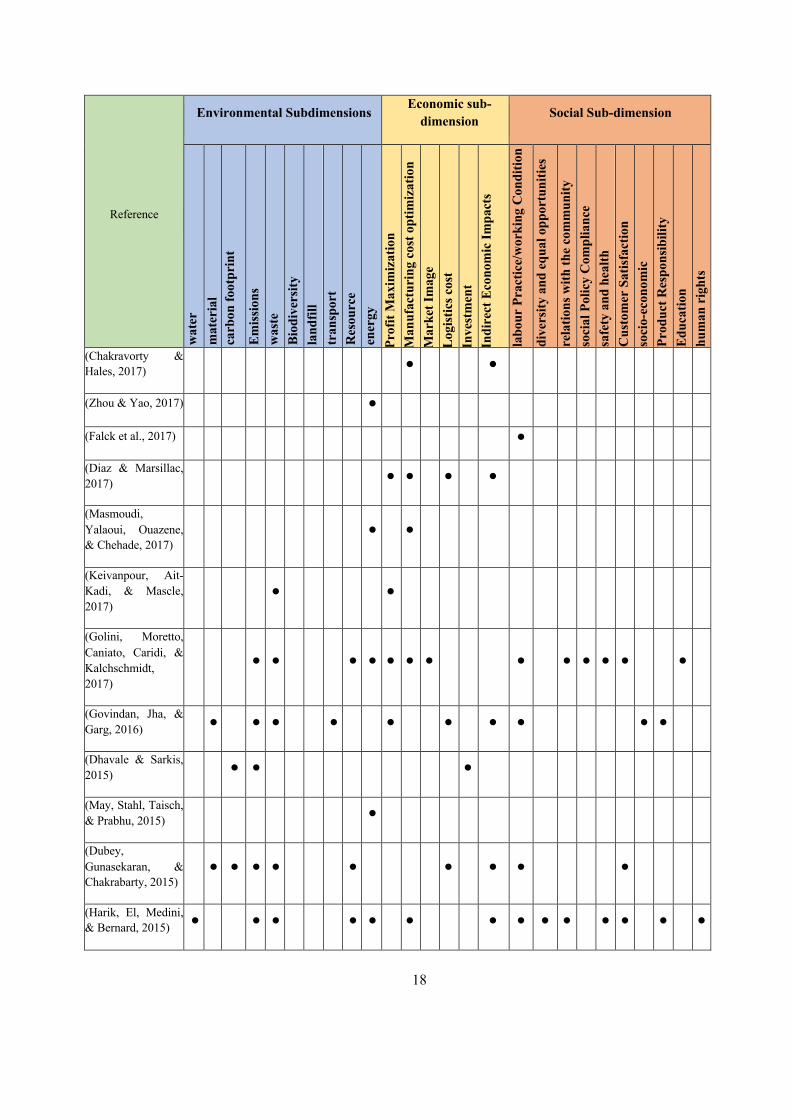
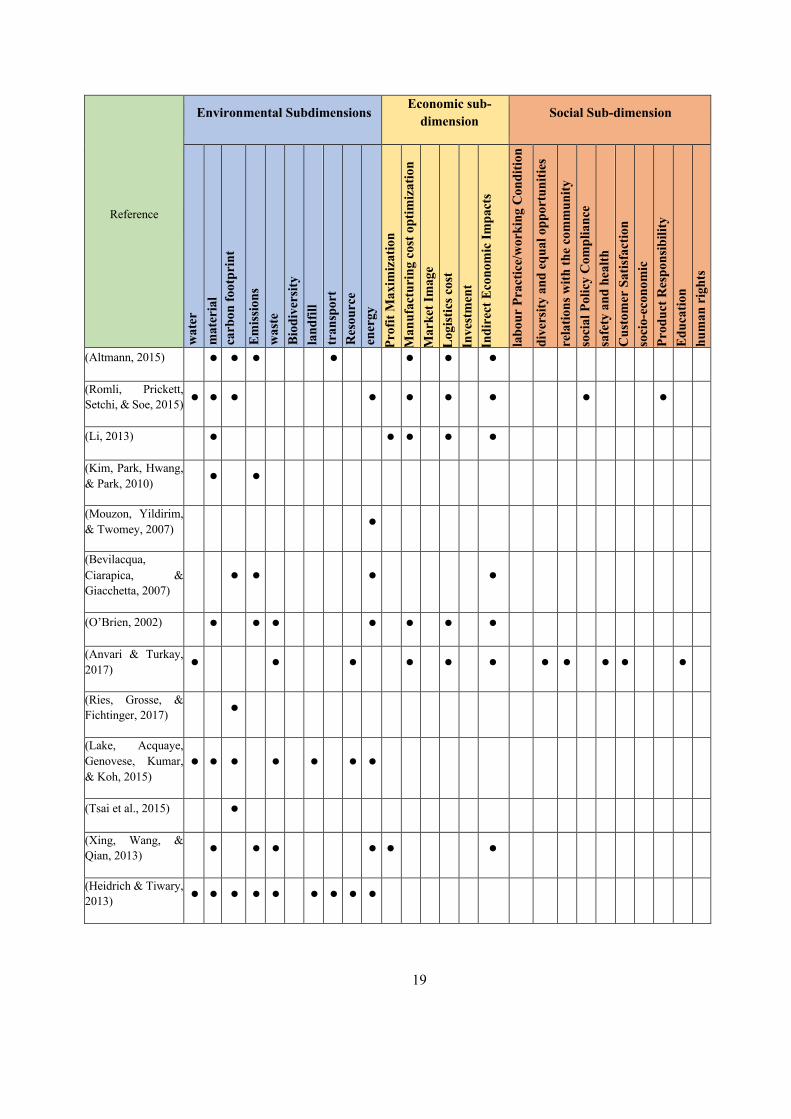
compliance”, “safety and health”, “customer satisfaction”, “product responsibility” and “education” were the ones chosen as the final social sub-dimensions to assess sustainable manufacturing. Table 2 shows the sub-dimensions of sustainability in the analysed papers.
Table 2. Sub-Dimensions of sustainability
Reference
Environmental Subdimensions Economic sub-dimension
Social Sub-dimension
wat
er
mat
eria
l ca
rbon
foot
prin
t
Emiss
ions
w
aste
Bi
odiv
ersit
y la
ndfil
l tr
ansp
ort
Res
ourc
e en
ergy
Pr
ofit
Max
imiz
atio
n M
anuf
actu
ring
cos
t opt
imiz
atio
n M
arke
t Im
age
Logi
stic
s cos
t In
vest
men
t In
dire
ct E
cono
mic
Impa
cts
labo
ur P
ract
ice/
wor
king
Con
ditio
n
dive
rsity
and
equ
al o
ppor
tuni
ties
rela
tions
with
the
com
mun
ity
soci
al P
olic
y C
ompl
ianc
e sa
fety
and
hea
lth
Cus
tom
er S
atisf
actio
n so
cio -
econ
omic
Pr
oduc
t Res
pons
ibili
ty
Educ
atio
n hu
man
rig
hts
(Mani, Larborn, Johansson, Lyons, & Morris, 2016)
● ● ● ●
(Eastlick & Haapala, 2012) ● ● ● ● ● ● ● ●
(Mani, Madan, Lee, Lyons, & Gupta, 2014)
● ● ● ● ●
(Varsei, Soosay, Fahimnia, & Sarkis, 2014)
● ● ● ● ● ● ● ● ● ● ●
(Holton, Glass, & Price, 2010) ● ● ● ● ● ● ● ● ● ●
(Chen, Thiede, Schudeleit, & Herrmann, 2014)
● ● ● ● ● ● ● ● ● ● ● ●
(Labuschagne, Brent, & van Erck, 2005)
● ● ● ● ● ● ● ●
16
Reference
Environmental Subdimensions Economic sub-
dimension Social Sub-dimension
wat
er
mat
eria
l ca
rbon
foot
prin
t
Emiss
ions
w
aste
Bi
odiv
ersit
y la
ndfil
l tr
ansp
ort
Res
ourc
e en
ergy
Pr
ofit
Max
imiz
atio
n M
anuf
actu
ring
cos
t opt
imiz
atio
n M
arke
t Im
age
Logi
stic
s cos
t In
vest
men
t In
dire
ct E
cono
mic
Impa
cts
labo
ur P
ract
ice/
wor
king
Con
ditio
n
dive
rsity
and
equ
al o
ppor
tuni
ties
rela
tions
with
the
com
mun
ity
soci
al P
olic
y C
ompl
ianc
e sa
fety
and
hea
lth
Cus
tom
er S
atisf
actio
n so
cio-
econ
omic
Pr
oduc
t Res
pons
ibili
ty
Educ
atio
n hu
man
rig
hts
(Smetana, Tamásy, Mathys, & Heinz, 2016)
● ● ● ● ● ●
(Balkema, Preisig, Otterpohl, & Lambert, 2003)
● ● ● ● ●
(Huang & Badurdeen, 2017) ● ● ● ● ● ● ● ● ● ● ● ● ●
(Lu et al., 2011) ● ● ● ● ● ● ● ● ● ● ● ●
(Justin J. Keeble et al., 2003) ● ● ● ● ● ● ● ● ● ● ● ● ● ●
(Aydin, Mays, & Schmitt, 2014) ● ●
(Ruiz-Mercado, Gonzalez, & Smith, 2014)
● ● ● ● ● ● ● ● ● ●
(Loucks, D. P. 1997) ● ● ● ● ● ● ● ● ●
(Joung, Carrell, Sarkar, & Feng, 2013)
● ● ● ● ● ● ● ● ● ● ● ● ● ● ● ●
(Faulkner & Badurdeen, 2014) ● ● ● ● ● ● ● ● ● ● ●
(Videira, Antunes, Santos, & Lopes, 2010)
● ● ● ● ● ●
(Mani et al., 2013) ● ● ● ● ● ●
17
Reference
Environmental Subdimensions Economic sub-
dimension Social Sub-dimension
wat
er
mat
eria
l ca
rbon
foot
prin
t
Emiss
ions
w
aste
Bi
odiv
ersit
y la
ndfil
l tr
ansp
ort
Res
ourc
e en
ergy
Pr
ofit
Max
imiz
atio
n M
anuf
actu
ring
cos
t opt
imiz
atio
n M
arke
t Im
age
Logi
stic
s cos
t In
vest
men
t In
dire
ct E
cono
mic
Impa
cts
labo
ur P
ract
ice/
wor
king
Con
ditio
n
dive
rsity
and
equ
al o
ppor
tuni
ties
rela
tions
with
the
com
mun
ity
soci
al P
olic
y C
ompl
ianc
e sa
fety
and
hea
lth
Cus
tom
er S
atisf
actio
n so
cio-
econ
omic
Pr
oduc
t Res
pons
ibili
ty
Educ
atio
n hu
man
rig
hts
(Lanz et al., 2014) ● ● ● ● ● ● ● ● ● ● ● ● ● ● ● ● ● ● ● ●
(Halog & Manik, 2011) ● ● ● ● ● ● ● ● ● ● ●
(Garretson, Eastwood, Eastwood, & Haapala, 2014)
● ● ● ● ● ● ●
(Long, Pan, Farooq, & Boer, 2016) ● ● ● ● ● ● ● ● ● ●
(Eastwood & Haapala, 2015) ● ● ● ● ● ● ● ● ● ●
(Wang, Zhang, Liang, & Zhang, 2014)
● ● ● ● ● ● ● ● ● ●
(Garbie, 2015) ● ● ● ● ● ● ● ● ● ● ● ● ● ● ● ●
(Roy et al., 2014) ● ● ● ● ● ● ● ● ●
(Koren, Gu, Badurdeen, & Jawahir, 2018)
● ● ● ● ● ● ● ● ●
(Joglekar, Kharkar, Mandavgane, & Kulkarni, 2018)
● ● ● ● ● ●
(Hegab, Darras, & Kishawy, 2018) ● ● ● ● ●
(Chaim, Muschard, Cazarini, & Rozenfeld, 2018)
● ● ● ● ● ● ● ● ● ● ● ●
18
Reference
Environmental Subdimensions Economic sub-
dimension Social Sub-dimension
wat
er
mat
eria
l ca
rbon
foot
prin
t
Emiss
ions
w
aste
Bi
odiv
ersit
y la
ndfil
l tr
ansp
ort
Res
ourc
e en
ergy
Pr
ofit
Max
imiz
atio
n M
anuf
actu
ring
cos
t opt
imiz
atio
n M
arke
t Im
age
Logi
stic
s cos
t In
vest
men
t In
dire
ct E
cono
mic
Impa
cts
labo
ur P
ract
ice/
wor
king
Con
ditio
n
dive
rsity
and
equ
al o
ppor
tuni
ties
rela
tions
with
the
com
mun
ity
soci
al P
olic
y C
ompl
ianc
e sa
fety
and
hea
lth
Cus
tom
er S
atisf
actio
n so
cio-
econ
omic
Pr
oduc
t Res
pons
ibili
ty
Educ
atio
n hu
man
rig
hts
(Chakravorty & Hales, 2017) ● ●
(Zhou & Yao, 2017) ●
(Falck et al., 2017) ●
(Diaz & Marsillac, 2017) ● ● ● ●
(Masmoudi, Yalaoui, Ouazene, & Chehade, 2017)
● ●
(Keivanpour, Ait-Kadi, & Mascle, 2017)
● ●
(Golini, Moretto, Caniato, Caridi, & Kalchschmidt, 2017)
● ● ● ● ● ● ● ● ● ● ● ● ●
(Govindan, Jha, & Garg, 2016) ● ● ● ● ● ● ● ● ● ●
(Dhavale & Sarkis, 2015) ● ● ●
(May, Stahl, Taisch, & Prabhu, 2015) ●
(Dubey, Gunasekaran, & Chakrabarty, 2015)
● ● ● ● ● ● ● ● ●
(Harik, El, Medini, & Bernard, 2015) ● ● ● ● ● ● ● ● ● ● ● ● ● ●
19
Reference
Environmental Subdimensions Economic sub-
dimension Social Sub-dimension
wat
er
mat
eria
l ca
rbon
foot
prin
t
Emiss
ions
w
aste
Bi
odiv
ersit
y la
ndfil
l tr
ansp
ort
Res
ourc
e en
ergy
Pr
ofit
Max
imiz
atio
n M
anuf
actu
ring
cos
t opt
imiz
atio
n M
arke
t Im
age
Logi
stic
s cos
t In
vest
men
t In
dire
ct E
cono
mic
Impa
cts
labo
ur P
ract
ice/
wor
king
Con
ditio
n
dive
rsity
and
equ
al o
ppor
tuni
ties
rela
tions
with
the
com
mun
ity
soci
al P
olic
y C
ompl
ianc
e sa
fety
and
hea
lth
Cus
tom
er S
atisf
actio
n so
cio-
econ
omic
Pr
oduc
t Res
pons
ibili
ty
Educ
atio
n hu
man
rig
hts
(Altmann, 2015) ● ● ● ● ● ● ●
(Romli, Prickett, Setchi, & Soe, 2015) ● ● ● ● ● ● ● ● ●
(Li, 2013) ● ● ● ● ●
(Kim, Park, Hwang, & Park, 2010) ● ●
(Mouzon, Yildirim, & Twomey, 2007) ●
(Bevilacqua, Ciarapica, & Giacchetta, 2007)
● ● ● ●
(O’Brien, 2002) ● ● ● ● ● ● ●
(Anvari & Turkay, 2017) ● ● ● ● ● ● ● ● ● ● ●
(Ries, Grosse, & Fichtinger, 2017) ●
(Lake, Acquaye, Genovese, Kumar, & Koh, 2015)
● ● ● ● ● ● ●
(Tsai et al., 2015) ●
(Xing, Wang, & Qian, 2013) ● ● ● ● ● ●
(Heidrich & Tiwary, 2013) ● ● ● ● ● ● ● ● ●
20
1.3.2. Analysis of the sub-dimensions
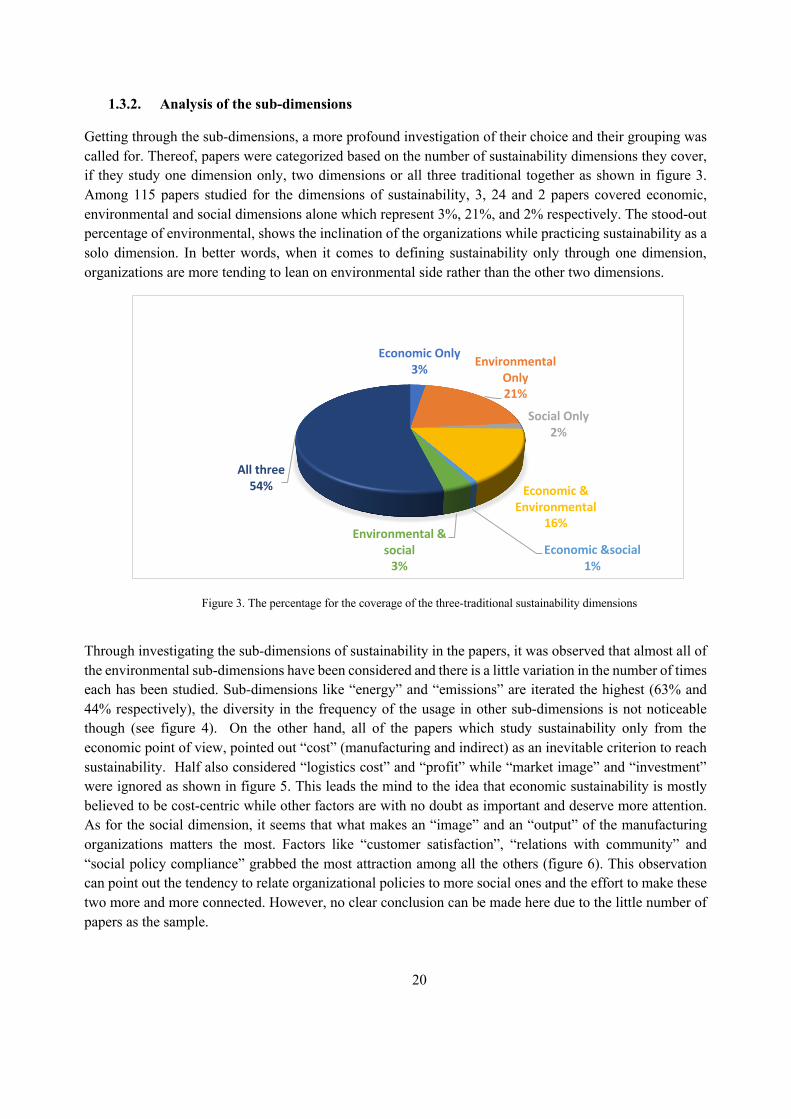
Getting through the sub-dimensions, a more profound investigation of their choice and their grouping was called for. Thereof, papers were categorized based on the number of sustainability dimensions they cover, if they study one dimension only, two dimensions or all three traditional together as shown in figure 3. Among 115 papers studied for the dimensions of sustainability, 3, 24 and 2 papers covered economic, environmental and social dimensions alone which represent 3%, 21%, and 2% respectively. The stood-out percentage of environmental, shows the inclination of the organizations while practicing sustainability as a solo dimension. In better words, when it comes to defining sustainability only through one dimension, organizations are more tending to lean on environmental side rather than the other two dimensions.
Figure 3. The percentage for the coverage of the three-traditional sustainability dimensions
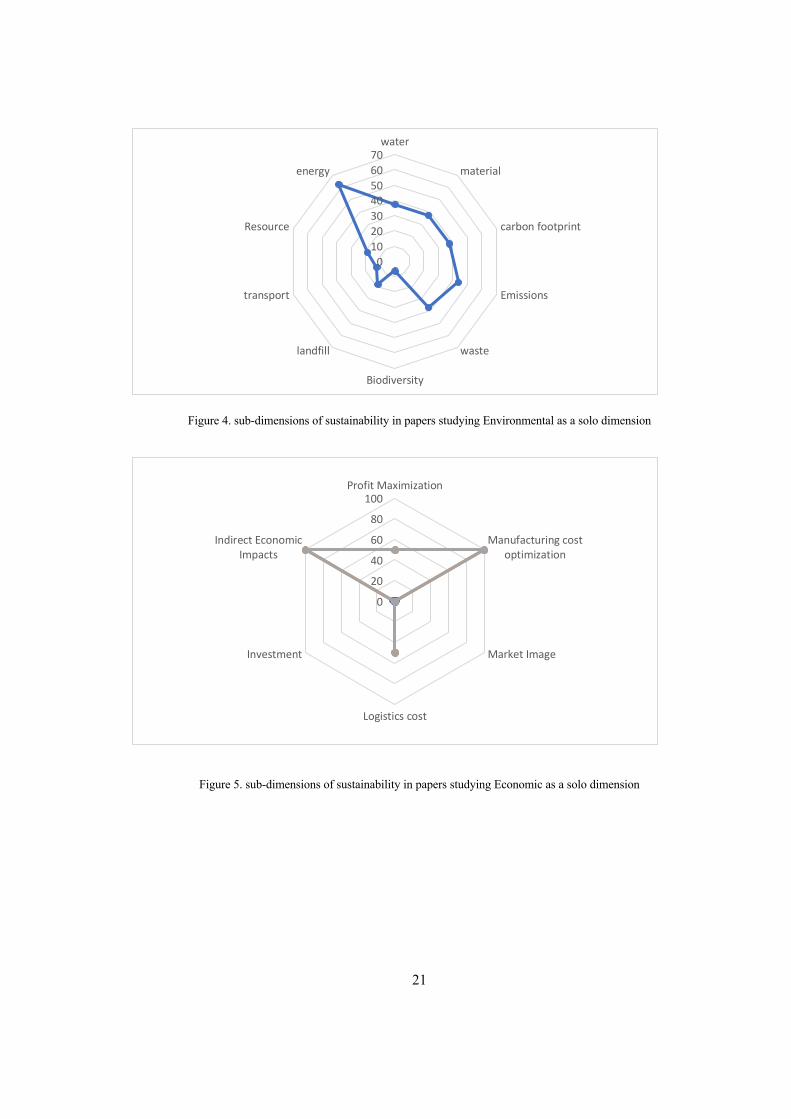
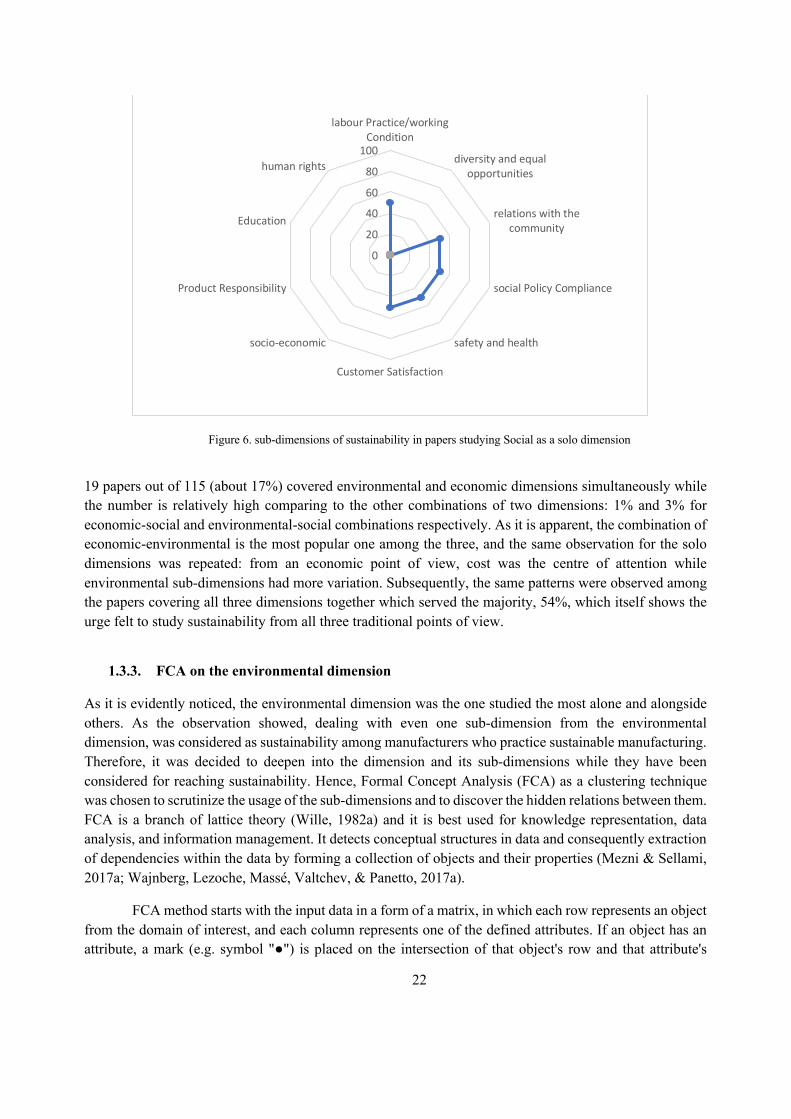
Through investigating the sub-dimensions of sustainability in the papers, it was observed that almost all of the environmental sub-dimensions have been considered and there is a little variation in the number of times each has been studied. Sub-dimensions like “energy” and “emissions” are iterated the highest (63% and 44% respectively), the diversity in the frequency of the usage in other sub-dimensions is not noticeable though (see figure 4). On the other hand, all of the papers which study sustainability only from the economic point of view, pointed out “cost” (manufacturing and indirect) as an inevitable criterion to reach sustainability. Half also considered “logistics cost” and “profit” while “market image” and “investment” were ignored as shown in figure 5. This leads the mind to the idea that economic sustainability is mostly believed to be cost-centric while other factors are with no doubt as important and deserve more attention. As for the social dimension, it seems that what makes an “image” and an “output” of the manufacturing organizations matters the most. Factors like “customer satisfaction”, “relations with community” and “social policy compliance” grabbed the most attraction among all the others (figure 6). This observation can point out the tendency to relate organizational policies to more social ones and the effort to make these two more and more connected. However, no clear conclusion can be made here due to the little number of papers as the sample.
Economic Only3% Environmental
Only21%
Social Only2%
Economic & Environmental
16%
Economic &social1%
Environmental & social
3%
All three54%
21
Figure 4. sub-dimensions of sustainability in papers studying Environmental as a solo dimension
Figure 5. sub-dimensions of sustainability in papers studying Economic as a solo dimension
010203040506070
water
material
carbon footprint
Emissions
waste
Biodiversity
landfill
transport
Resource
energy
0
20
40
60
80
100Profit Maximization
Manufacturing costoptimization
Market Image
Logistics cost
Investment
Indirect EconomicImpacts
22
Figure 6. sub-dimensions of sustainability in papers studying Social as a solo dimension
19 papers out of 115 (about 17%) covered environmental and economic dimensions simultaneously while the number is relatively high comparing to the other combinations of two dimensions: 1% and 3% for economic-social and environmental-social combinations respectively. As it is apparent, the combination of economic-environmental is the most popular one among the three, and the same observation for the solo dimensions was repeated: from an economic point of view, cost was the centre of attention while environmental sub-dimensions had more variation. Subsequently, the same patterns were observed among the papers covering all three dimensions together which served the majority, 54%, which itself shows the urge felt to study sustainability from all three traditional points of view.
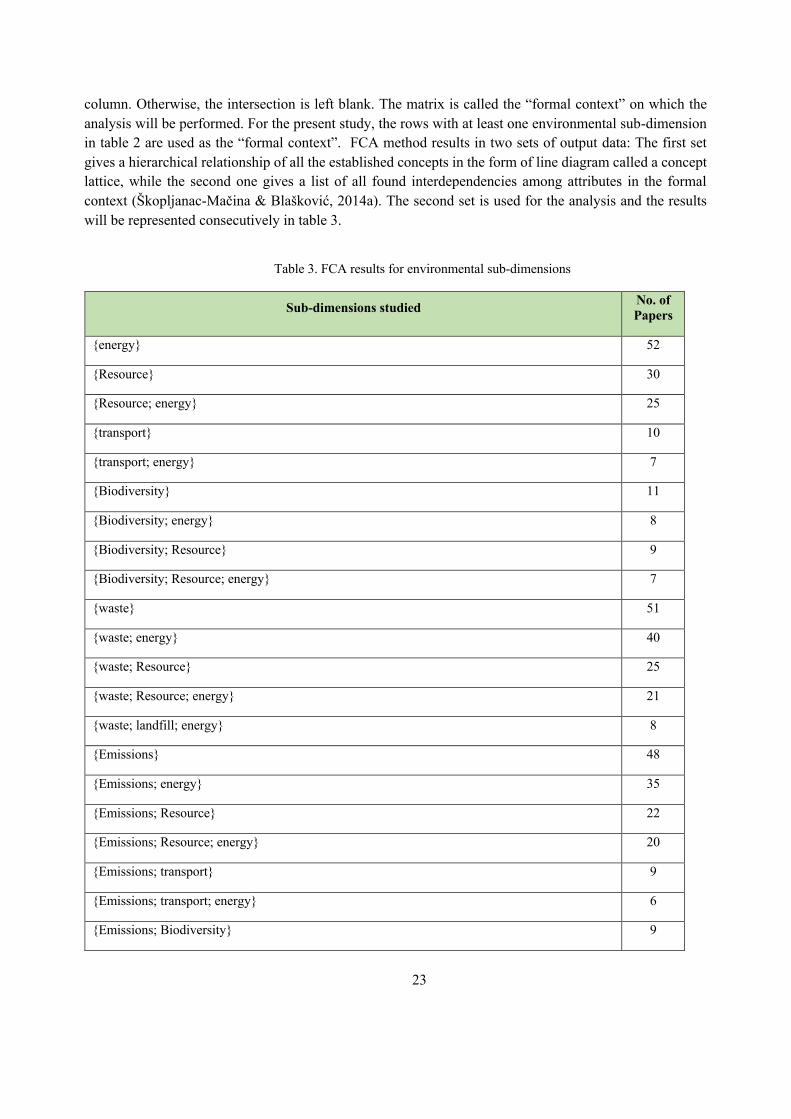
1.3.3. FCA on the environmental dimension
As it is evidently noticed, the environmental dimension was the one studied the most alone and alongside others. As the observation showed, dealing with even one sub-dimension from the environmental dimension, was considered as sustainability among manufacturers who practice sustainable manufacturing. Therefore, it was decided to deepen into the dimension and its sub-dimensions while they have been considered for reaching sustainability. Hence, Formal Concept Analysis (FCA) as a clustering technique was chosen to scrutinize the usage of the sub-dimensions and to discover the hidden relations between them. FCA is a branch of lattice theory (Wille, 1982a) and it is best used for knowledge representation, data analysis, and information management. It detects conceptual structures in data and consequently extraction of dependencies within the data by forming a collection of objects and their properties (Mezni & Sellami, 2017a; Wajnberg, Lezoche, Massé, Valtchev, & Panetto, 2017a).
FCA method starts with the input data in a form of a matrix, in which each row represents an object from the domain of interest, and each column represents one of the defined attributes. If an object has an attribute, a mark (e.g. symbol "●") is placed on the intersection of that object's row and that attribute's
0
20
40
60
80
100
labour Practice/workingCondition
diversity and equalopportunities
relations with thecommunity
social Policy Compliance
safety and health
Customer Satisfaction
socio-economic
Product Responsibility
Education
human rights
23
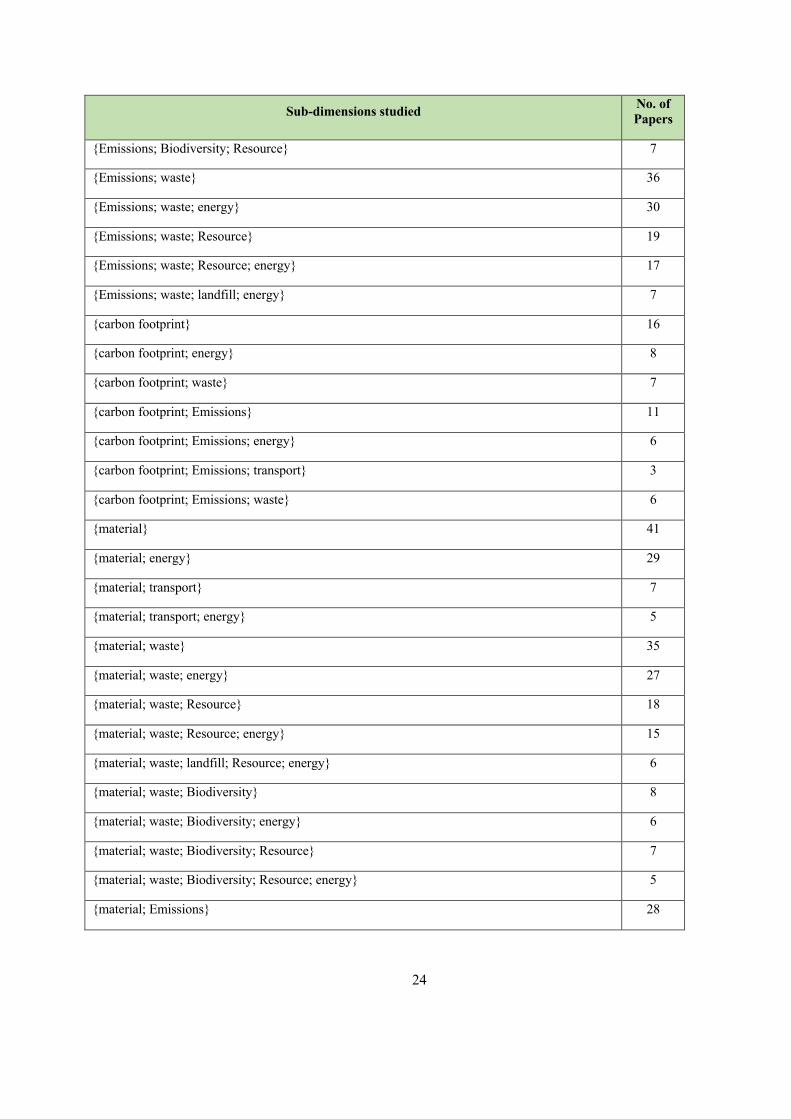
column. Otherwise, the intersection is left blank. The matrix is called the “formal context” on which the analysis will be performed. For the present study, the rows with at least one environmental sub-dimension in table 2 are used as the “formal context”. FCA method results in two sets of output data: The first set gives a hierarchical relationship of all the established concepts in the form of line diagram called a concept lattice, while the second one gives a list of all found interdependencies among attributes in the formal context (Škopljanac-Mačina & Blašković, 2014a). The second set is used for the analysis and the results will be represented consecutively in table 3.
Table 3. FCA results for environmental sub-dimensions
Sub-dimensions studied No. of Papers
{energy} 52
{Resource} 30
{Resource; energy} 25
{transport} 10
{transport; energy} 7
{Biodiversity} 11
{Biodiversity; energy} 8
{Biodiversity; Resource} 9
{Biodiversity; Resource; energy} 7
{waste} 51
{waste; energy} 40
{waste; Resource} 25
{waste; Resource; energy} 21
{waste; landfill; energy} 8
{Emissions} 48
{Emissions; energy} 35
{Emissions; Resource} 22
{Emissions; Resource; energy} 20
{Emissions; transport} 9
{Emissions; transport; energy} 6
{Emissions; Biodiversity} 9
24
Sub-dimensions studied No. of Papers
{Emissions; Biodiversity; Resource} 7
{Emissions; waste} 36
{Emissions; waste; energy} 30
{Emissions; waste; Resource} 19
{Emissions; waste; Resource; energy} 17
{Emissions; waste; landfill; energy} 7
{carbon footprint} 16
{carbon footprint; energy} 8
{carbon footprint; waste} 7
{carbon footprint; Emissions} 11
{carbon footprint; Emissions; energy} 6
{carbon footprint; Emissions; transport} 3
{carbon footprint; Emissions; waste} 6
{material} 41
{material; energy} 29
{material; transport} 7
{material; transport; energy} 5
{material; waste} 35
{material; waste; energy} 27
{material; waste; Resource} 18
{material; waste; Resource; energy} 15
{material; waste; landfill; Resource; energy} 6
{material; waste; Biodiversity} 8
{material; waste; Biodiversity; energy} 6
{material; waste; Biodiversity; Resource} 7
{material; waste; Biodiversity; Resource; energy} 5
{material; Emissions} 28
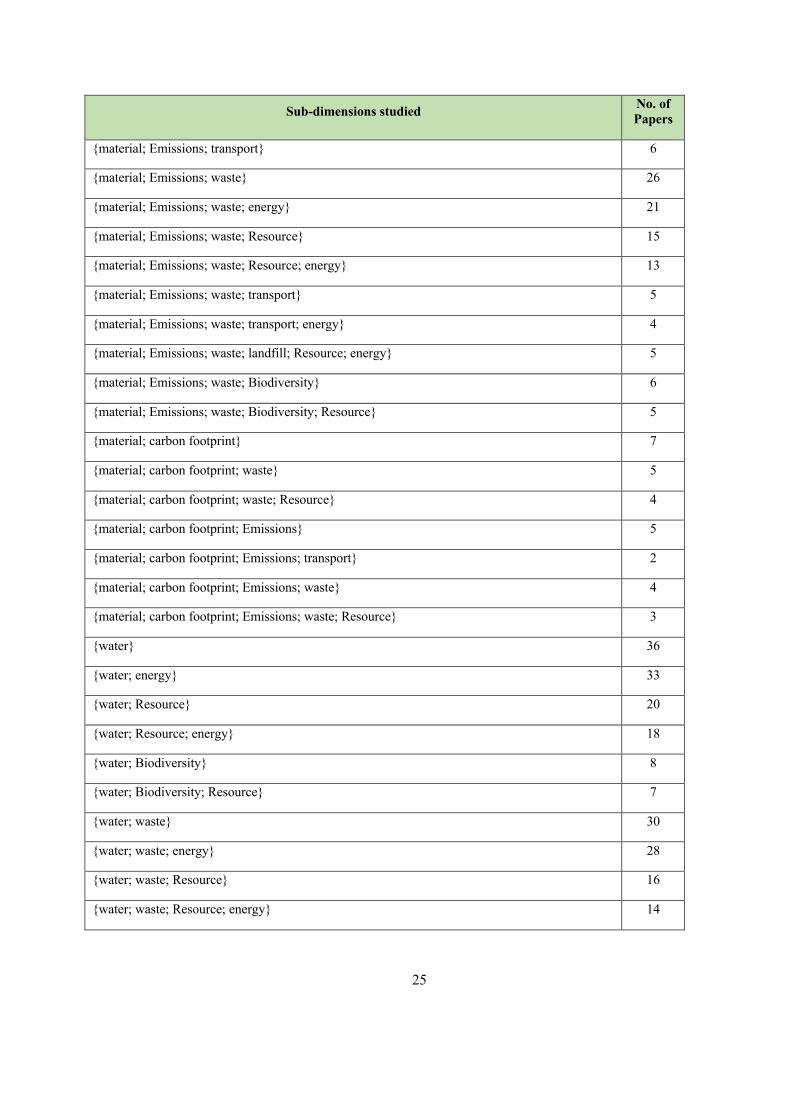
25
Sub-dimensions studied No. of Papers
{material; Emissions; transport} 6
{material; Emissions; waste} 26
{material; Emissions; waste; energy} 21
{material; Emissions; waste; Resource} 15
{material; Emissions; waste; Resource; energy} 13
{material; Emissions; waste; transport} 5
{material; Emissions; waste; transport; energy} 4
{material; Emissions; waste; landfill; Resource; energy} 5
{material; Emissions; waste; Biodiversity} 6
{material; Emissions; waste; Biodiversity; Resource} 5
{material; carbon footprint} 7
{material; carbon footprint; waste} 5
{material; carbon footprint; waste; Resource} 4
{material; carbon footprint; Emissions} 5
{material; carbon footprint; Emissions; transport} 2
{material; carbon footprint; Emissions; waste} 4
{material; carbon footprint; Emissions; waste; Resource} 3
{water} 36
{water; energy} 33
{water; Resource} 20
{water; Resource; energy} 18
{water; Biodiversity} 8
{water; Biodiversity; Resource} 7
{water; waste} 30
{water; waste; energy} 28
{water; waste; Resource} 16
{water; waste; Resource; energy} 14
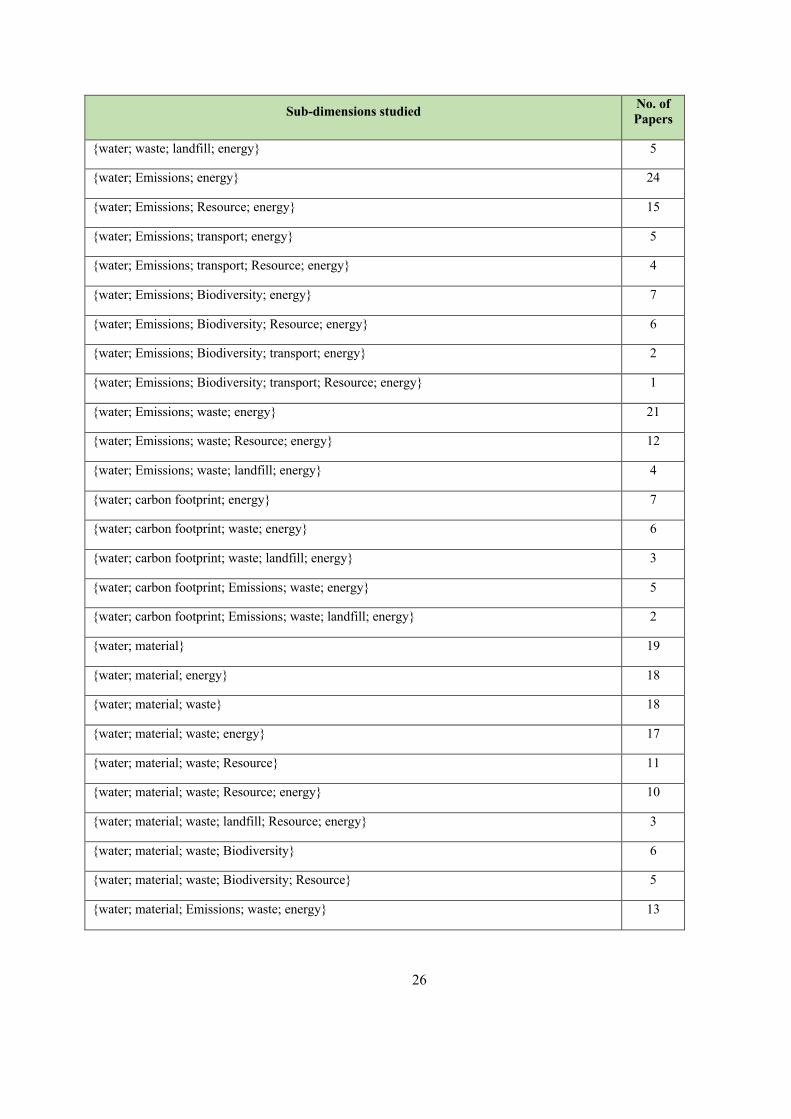
26
Sub-dimensions studied No. of Papers
{water; waste; landfill; energy} 5
{water; Emissions; energy} 24
{water; Emissions; Resource; energy} 15
{water; Emissions; transport; energy} 5
{water; Emissions; transport; Resource; energy} 4
{water; Emissions; Biodiversity; energy} 7
{water; Emissions; Biodiversity; Resource; energy} 6
{water; Emissions; Biodiversity; transport; energy} 2
{water; Emissions; Biodiversity; transport; Resource; energy} 1
{water; Emissions; waste; energy} 21
{water; Emissions; waste; Resource; energy} 12
{water; Emissions; waste; landfill; energy} 4
{water; carbon footprint; energy} 7
{water; carbon footprint; waste; energy} 6
{water; carbon footprint; waste; landfill; energy} 3
{water; carbon footprint; Emissions; waste; energy} 5
{water; carbon footprint; Emissions; waste; landfill; energy} 2
{water; material} 19
{water; material; energy} 18
{water; material; waste} 18
{water; material; waste; energy} 17
{water; material; waste; Resource} 11
{water; material; waste; Resource; energy} 10
{water; material; waste; landfill; Resource; energy} 3
{water; material; waste; Biodiversity} 6
{water; material; waste; Biodiversity; Resource} 5
{water; material; Emissions; waste; energy} 13
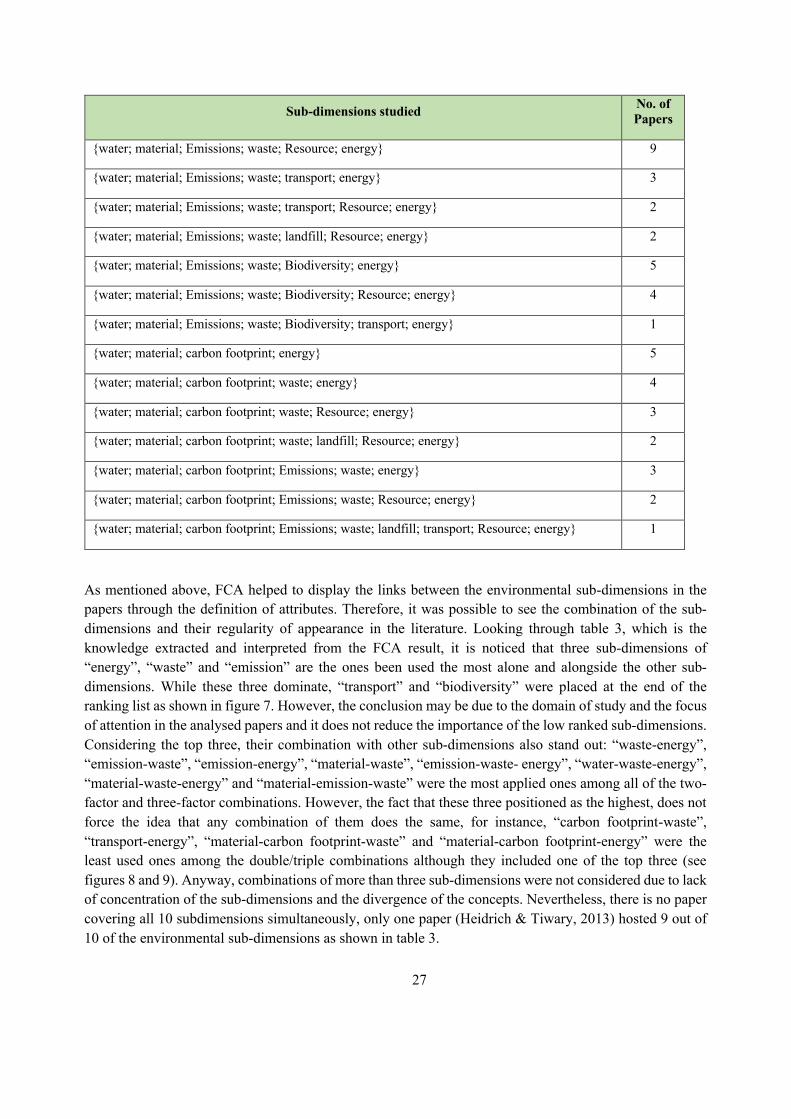
27
Sub-dimensions studied No. of Papers
{water; material; Emissions; waste; Resource; energy} 9
{water; material; Emissions; waste; transport; energy} 3
{water; material; Emissions; waste; transport; Resource; energy} 2
{water; material; Emissions; waste; landfill; Resource; energy} 2
{water; material; Emissions; waste; Biodiversity; energy} 5
{water; material; Emissions; waste; Biodiversity; Resource; energy} 4
{water; material; Emissions; waste; Biodiversity; transport; energy} 1
{water; material; carbon footprint; energy} 5
{water; material; carbon footprint; waste; energy} 4
{water; material; carbon footprint; waste; Resource; energy} 3
{water; material; carbon footprint; waste; landfill; Resource; energy} 2
{water; material; carbon footprint; Emissions; waste; energy} 3
{water; material; carbon footprint; Emissions; waste; Resource; energy} 2
{water; material; carbon footprint; Emissions; waste; landfill; transport; Resource; energy} 1
As mentioned above, FCA helped to display the links between the environmental sub-dimensions in the papers through the definition of attributes. Therefore, it was possible to see the combination of the sub-dimensions and their regularity of appearance in the literature. Looking through table 3, which is the knowledge extracted and interpreted from the FCA result, it is noticed that three sub-dimensions of “energy”, “waste” and “emission” are the ones been used the most alone and alongside the other sub-dimensions. While these three dominate, “transport” and “biodiversity” were placed at the end of the ranking list as shown in figure 7. However, the conclusion may be due to the domain of study and the focus of attention in the analysed papers and it does not reduce the importance of the low ranked sub-dimensions. Considering the top three, their combination with other sub-dimensions also stand out: “waste-energy”, “emission-waste”, “emission-energy”, “material-waste”, “emission-waste- energy”, “water-waste-energy”, “material-waste-energy” and “material-emission-waste” were the most applied ones among all of the two-factor and three-factor combinations. However, the fact that these three positioned as the highest, does not force the idea that any combination of them does the same, for instance, “carbon footprint-waste”, “transport-energy”, “material-carbon footprint-waste” and “material-carbon footprint-energy” were the least used ones among the double/triple combinations although they included one of the top three (see figures 8 and 9). Anyway, combinations of more than three sub-dimensions were not considered due to lack of concentration of the sub-dimensions and the divergence of the concepts. Nevertheless, there is no paper covering all 10 subdimensions simultaneously, only one paper (Heidrich & Tiwary, 2013) hosted 9 out of 10 of the environmental sub-dimensions as shown in table 3.
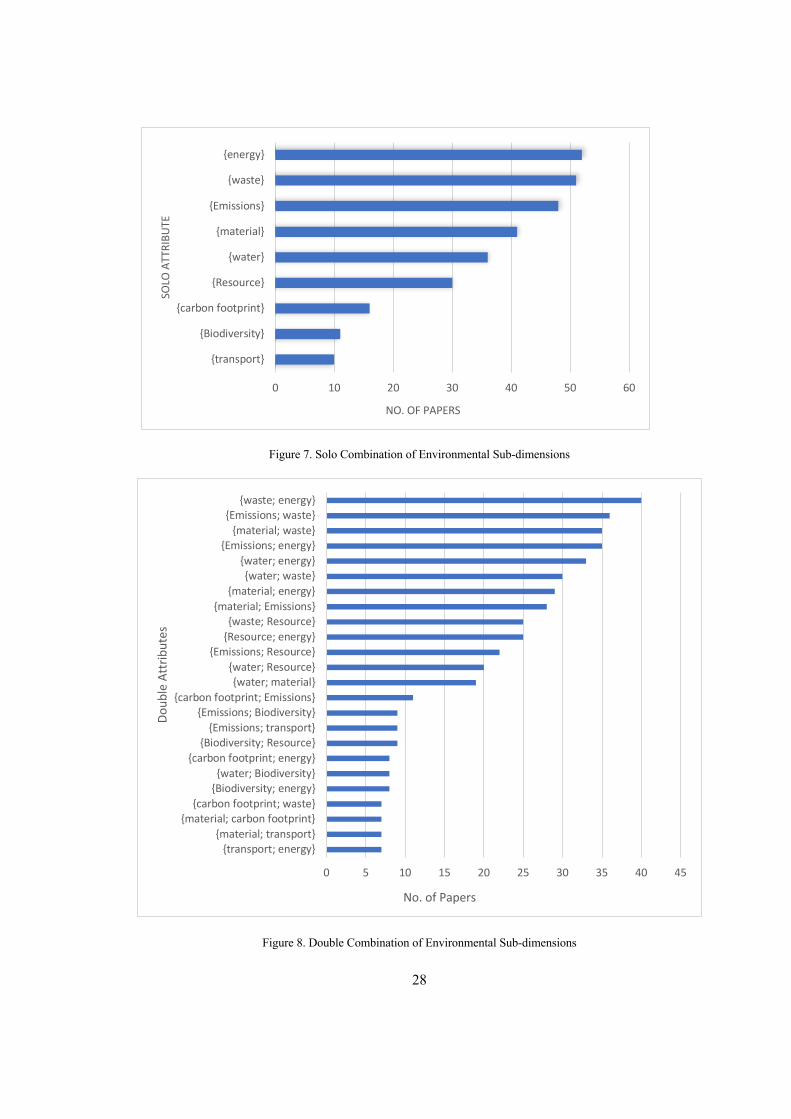
28
Figure 7. Solo Combination of Environmental Sub-dimensions
Figure 8. Double Combination of Environmental Sub-dimensions
{transport}
{Biodiversity}
{carbon footprint}
{Resource}
{water}
{material}
{Emissions}
{waste}
{energy}
0 10 20 30 40 50 60
SOLO
ATT
RIBU
TE
NO. OF PAPERS
0 5 10 15 20 25 30 35 40 45
{transport; energy}{material; transport}
{material; carbon footprint}{carbon footprint; waste}
{Biodiversity; energy}{water; Biodiversity}
{carbon footprint; energy}{Biodiversity; Resource}
{Emissions; transport}{Emissions; Biodiversity}
{carbon footprint; Emissions}{water; material}
{water; Resource}{Emissions; Resource}
{Resource; energy}{waste; Resource}
{material; Emissions}{material; energy}
{water; waste}{water; energy}
{Emissions; energy}{material; waste}
{Emissions; waste}{waste; energy}
No. of Papers
Doub
le A
ttrib
utes
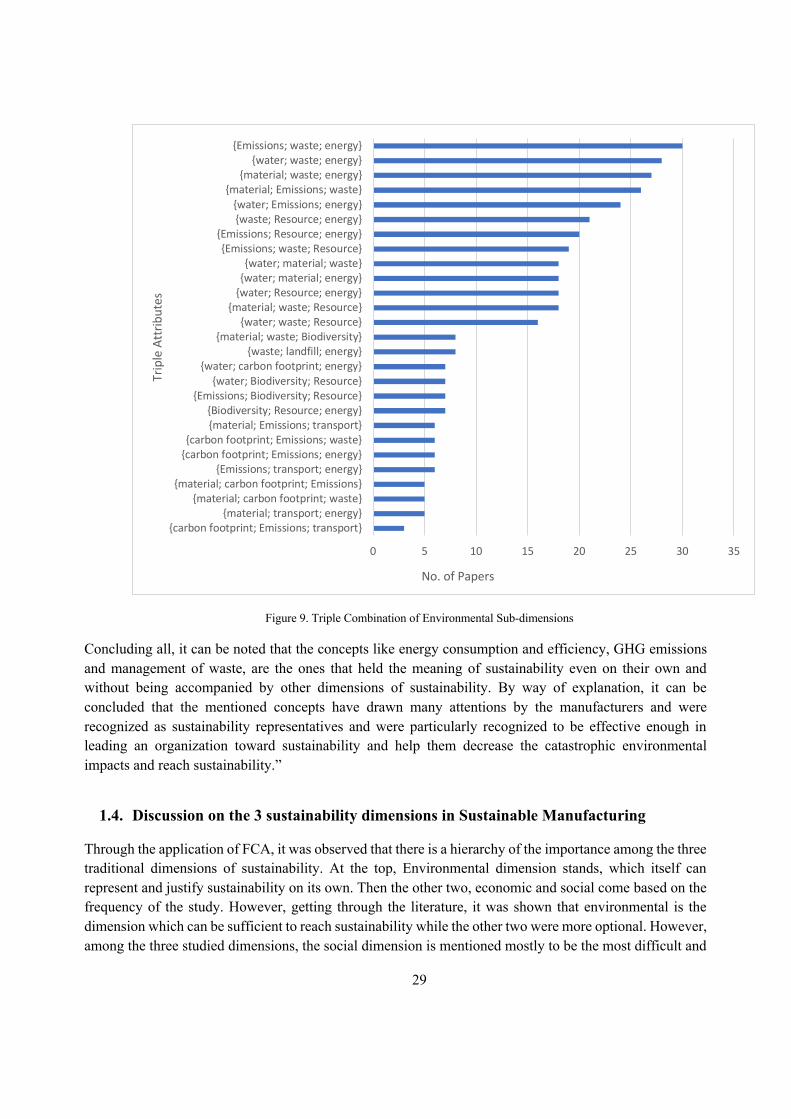
29
Figure 9. Triple Combination of Environmental Sub-dimensions
Concluding all, it can be noted that the concepts like energy consumption and efficiency, GHG emissions and management of waste, are the ones that held the meaning of sustainability even on their own and without being accompanied by other dimensions of sustainability. By way of explanation, it can be concluded that the mentioned concepts have drawn many attentions by the manufacturers and were recognized as sustainability representatives and were particularly recognized to be effective enough in leading an organization toward sustainability and help them decrease the catastrophic environmental impacts and reach sustainability.”
1.4. Discussion on the 3 sustainability dimensions in Sustainable Manufacturing
Through the application of FCA, it was observed that there is a hierarchy of the importance among the three traditional dimensions of sustainability. At the top, Environmental dimension stands, which itself can represent and justify sustainability on its own. Then the other two, economic and social come based on the frequency of the study. However, getting through the literature, it was shown that environmental is the dimension which can be sufficient to reach sustainability while the other two were more optional. However, among the three studied dimensions, the social dimension is mentioned mostly to be the most difficult and
0 5 10 15 20 25 30 35
{carbon footprint; Emissions; transport}{material; transport; energy}
{material; carbon footprint; waste}{material; carbon footprint; Emissions}
{Emissions; transport; energy}{carbon footprint; Emissions; energy}{carbon footprint; Emissions; waste}
{material; Emissions; transport}{Biodiversity; Resource; energy}
{Emissions; Biodiversity; Resource}{water; Biodiversity; Resource}
{water; carbon footprint; energy}{waste; landfill; energy}
{material; waste; Biodiversity}{water; waste; Resource}
{material; waste; Resource}{water; Resource; energy}{water; material; energy}{water; material; waste}
{Emissions; waste; Resource}{Emissions; Resource; energy}
{waste; Resource; energy}{water; Emissions; energy}
{material; Emissions; waste}{material; waste; energy}
{water; waste; energy}{Emissions; waste; energy}
No. of Papers
Trip
le A
ttrib
utes
30
also the least discussed dimension among the three. The most inconvenience though is due to the inability to accurately quantify a number of qualitative indicators (Smullin, 2016).
Exploring the sub-dimensions, the environmental dimension is mostly focusing on gas emissions, energy, water, and resource depletion. Yet, many papers stay vague about the kind of environmental impacts taken into account; they lack an explanation of what “an impact” means and how big it should be to be called “an impact”. Some specify the environmental impacts of a particular product (e.g. automotive industry, chemicals, etc) or supply chain process and mention how to deal with them, mostly by looking at the particular sub-dimensions mentioned previously (e.g. water withdrawal, emissions, waste generated, resource depletion and etc) and offering guidelines to practitioners on how to deal with them. On the other hand, and in the economic dimension, “total” cost-based or decision-related cost and revenue approaches dominate. This does not really capture how proactive manufacturing organization strives to achieve sustainable manufacturing. Therefore, widening the economic area to something more than the total cost or net profit can be a good contribution.
Based on the abovementioned, it can be concluded that dimensions like “environmental” and “economic” are mostly exercised by a defined set of sub-dimensions. In other words, sustainability in these dimensions are most likely to be reached through well-known channels of sub-dimensions like “energy”, “emission” and “profit”, the ones that stood at the top of the rankings with a noticeable difference. On the other side, social dimension of sustainability was practiced with different sub-dimensions and with scattered frequency of the application which can be related to the fact that how social sustainability is approached and defined by different manufacturers. Consequently, it can be noticed that there are sub-dimensions in “economic” and “environmental” that are recognized as the representatives of the dimension which means “economic” and “environmental” sustainability are with less diversity in definition while the same conclusion cannot be made for the social dimension since the application of the sub-dimensions were not concentrated.
As the final observation and as it was shown previously, 54% of the analysed papers insisted on considering all the three dimensions simultaneously. Seuring (2013) also mentioned that the new move is to integrate all the three rather than finding a trade-off between them. However, in the review (Mohd Fahrul Hassan et al., 2016) and (Marika Arena et al., 2009) provided 10 and 27 papers (respectively) out of 60 were dedicated to integration of the three pillars and considering them all simultaneously; which can be an endorsement to have a holistic view through sustainability by considering all the three traditional pillars.
1.5. Conclusion
The chapter focuses on a systematic literature review on sustainability dimensions and sub-dimensions in order to extract knowledge for manufacturing organizations who want to practice strategies to be more “sustainable” to stay competitive in the market today and also be responsive to the demand of both customers and the government for sustainable products and preservation of natural resources. The main question risen here is to find out “How sustainability is defined through its dimensions? and What sub-dimensions can denominate sustainable manufacturing? Going through the dimensions of sustainability in manufacturing, it was observed that among social, technological, economic, environmental, technology, efficiency and performance management, the traditional three namely: Economic, Environmental and social, also known as the Triple Bottom Line (TBL), were the ones with the most concentration on. On the other hand, this classification for the domains of sustainability seemed to be too broad and more delineation
31
was needed to help manufacturers identify more specific issues on which they can act. Therefore, a research on the sub-dimensions of sustainability was run inductively to explore the essence of sustainability in a manufacturing organization. It was observed that there is a hierarchy of the importance among the three traditional dimensions of sustainability. At the top, Environmental dimension stands, which itself can represent and justify sustainability on its own. Then the other two, economic and social come based on the frequency of study. However, getting through the literature, it was shown that environmental is the dimension which can be sufficient to reach sustainability while the other two were more optional. Additionally, it was noted that among the three studied dimensions, the social dimension is mentioned mostly to be the most difficult and also the least discussed dimension among the three. The most inconvenience though is due to the inability to accurately quantify a number of qualitative indicators. Based on the findings of the study, an FCA analysis was conducted on the environmental sub-dimensions to analyse their clustering and grouping throughout the literature and knowledge was extracted on the context of the trend in a combination of environmental sub-dimensions and their usage regularity.
Ultimately, the contribution was in the analysis of the dimensions and the environmental sub-dimensions of sustainable manufacturing focusing on the scientific domain throughout the literature. However, in chapter 3, the same concepts will be investigated in manufacturing domain in practice by means of a benchmarking to explore the possible gap(s) between industrial point of view toward sub-dimensions of sustainable manufacturing and the ones in the literature.
32
CHAPTER 2 A SURVEY ON ANALYSING SUSTAINABILITY
ASSESSMENT IN MANUFACTURING ORGANIZATIONS
2.1. Introduction
As formerly mentioned, manufacturing organizations are facing the urge to adopt new strategies like sustainability to be able to respond the market and customer’s demand for sustainable products due to scarcity of the natural resources or governmental rules. Therefore, among several strategies, sustainable manufacturing has garnished a great deal of attention since it helps the organization survive the competitive market of today and also connect to the other competitors ( Hassan, Saman, Mahmood, Nor, & Rahman, 2017). “Sustainable manufacturing” is believed to be a formal name for an exciting new way of doing business and creating value. The goal of any business today is to come up with innovative trends to raise their competitive power, increase their profit, reduce risks, gain more trust to attract investments, satisfy customers while creating a much healthier environment. Apart from the urgent need for environmental actions, all companies across the world are facing with elevated expectations of customers on one hand and increasing prices for materials, energy and compliance on the other. Therefore, Sustainability seems to become vital and has changed face from a show-off achievement to a competitive imperative and a must have in today’s market. In addition, the bottom up demand of customers for more sustainable products and the top down need to comply with the governmental rules and regulation, made the manufacturing organizations think about ways, tools and methodologies to evaluate and assess the level of sustainability in the whole manufacturing system. Various methods have been accomplished trying to find a way for companies to assess their sustainability state, choose between sustainable solutions, define and solve problems on the way to sustainability and identify potential solutions. Therefore, sustainability assessment becomes a principle focus for sustainable development and a common practice in product, policy and in institutional appraisals (Sala, Ciuffo, & Nijkamp, 2015). In other words, the concept of sustainability assessment is introduced to offer new perspectives to impact assessment geared toward planning and decision making on sustainable development (Hacking & Guthrie, 2008). However, Devuyst (2001) defined sustainability assessment as “a methodology “that can help decision makers and policy-makers decide what actions they should take and should not take in an attempt to make society more sustainable”.
As the previous chapters investigated the first two research questions, sustainability and sustainable manufacturing was stipulated, and the insights of the concepts were explored. However, the second chapter continues with the sequence of the questions and moves to the concept of sustainability assessment and tries to scrutinize its essence by searching for an answer for the third and fourth question: “How can sustainable manufacturing be achieved” and “How can sustainable manufacturing be assessed?” to this purpose a thorough analysis of sustainability assessment in manufacturing has been conducted to delineate sustainability assessment in manufacturing and explore its characteristics. The chapter is structured as follows: the literature review methodology will be described in section 2. As in the third section, previous surveys will be investigated. The samples will be introduced in section 4 and the applied criteria for the content analysis comes after in section 5. Section 6 makes a discussion on the essence of the sustainable
33
manufacturing and a short discussion on the concept “6R” at the end. Consequently, section 7 does the same for sustainability assessment and the used tool and an FCA analysis on the applied tools. Finally, conclusions are raised.
2.2. Method of the literature review
The study forms a systematic literature review on the basis of assessment of the sustainable manufacturing in manufacturing organizations. To do so, a sequence of questions must have been answered through the work: What is the meaning of sustainable manufacturing? How can it be achieved? And how can it be assessed? To that aim, papers were identified by means of a structured keyword search on major databases and publisher websites (Scopus, Elsevier ScienceDirect, Web of Science). Keywords such as “manufacturing”, “assessment”, “supply chain”, “manufacturing system”, “Product” and “process” were combined (using AND) with sustainability related ones, such as “sustainable/sustainability”, “sustainable development”, “sustainability assessment”, “sustainable manufacturing system”. All the searches were applied in “Title, Keyword, Abstract” field. The exclusion area remained the same as the one defined in chapter one. It is worth noting that the study shares major part of the papers studied in the previous chapter.
A content analysis was conducted to systematically assess the papers. Material collection has been already described which is by means of the literature search and the reduction mode mentioned above. For the analysis itself, a set of criteria was used at first for describing the sample. Then, the discussion is taken into the content analysis itself, whether the paper is in the design for sustainability mode or an assessment one. Respective content analysis is outlined as the following sectors.
2.3. Previous surveys
Due to (Chun & Bidanda, 2013), sustainability (including sustainable development, green manufacturing and green supply chain), operations research (which utilizes methodologies such as linear /integer programming, Markov decision process and multi-objective) and product life cycle analysis (cost analysis, environmental effect and intelligence) are the three main categories of research in the field of sustainable manufacturing and are used to quantify sustainability performance in industrial practices. Authors in (Seuring, 2013) did a literature review on sustainability in manufacturing through supply chain management. They first explored the works done due to the three sustainability dimensions, and then analysed the works that were on the modelling approaches. Regarding to their search, the modelling approaches can be divided into 4 main groups as life cycle assessment models, equilibrium models, multi-criteria decision making and analytical hierarchy process. They also illustrated the empirical research presented in the models and concluded that theoretical content is the most popular while such data is not linked to the formal assessment offered by quantitative models. Two parallel works have been done in (Mahesh Mani, Haapala, Smullin, & Morris, 2016) to find the gaps and barriers in process modelling and its assessment: a traditional literature review and an industry focus group investigation. The results and findings of the literature review were then compared to the findings of the 3 roundtable meetings with representatives of diverse companies. Based on the comparisons made in the paper and the analysis of the results, the urge to introduce standards for representing manufacturing processes and collecting data required for sustainability assessment is felt. (Chan, Li, Chung, & Saadat, 2017)categorized the manufacturing systems to three main groups according to the main elements of the system: production planning and control, inventory management and control and finally manufacturing network design. Furthermore, they focused on the mathematical models and optimization methods corresponding to each
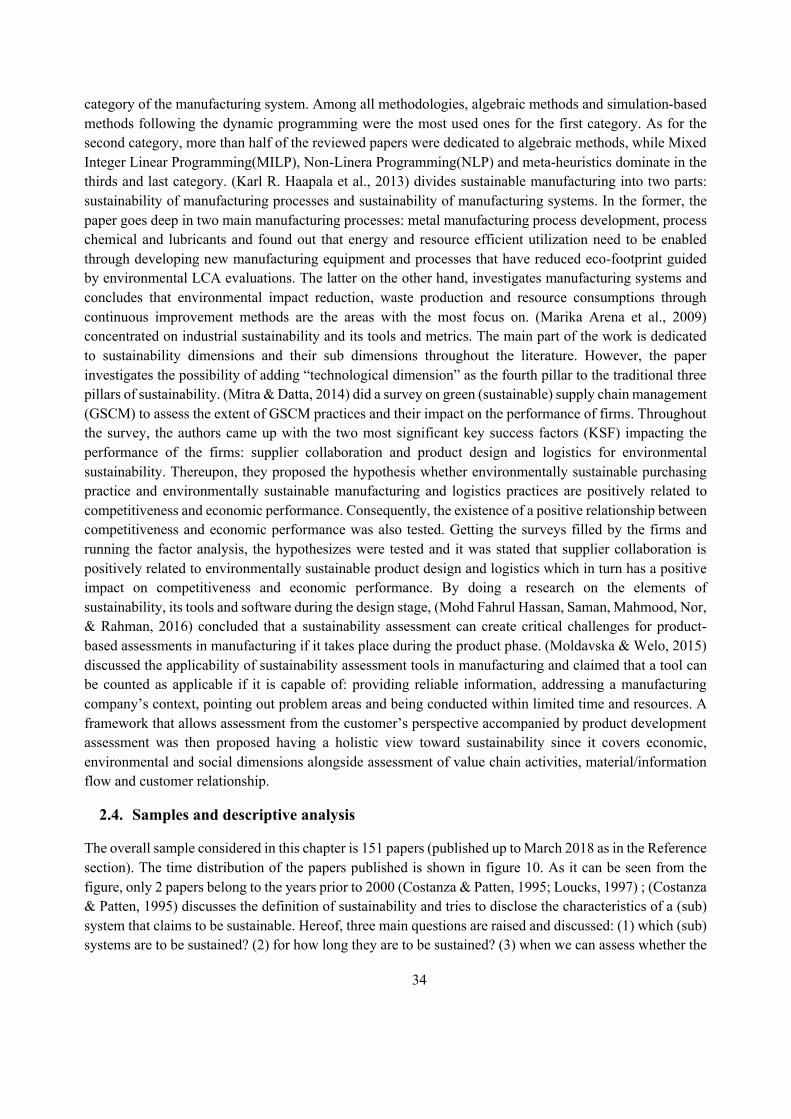
34
category of the manufacturing system. Among all methodologies, algebraic methods and simulation-based methods following the dynamic programming were the most used ones for the first category. As for the second category, more than half of the reviewed papers were dedicated to algebraic methods, while Mixed Integer Linear Programming(MILP), Non-Linera Programming(NLP) and meta-heuristics dominate in the thirds and last category. (Karl R. Haapala et al., 2013) divides sustainable manufacturing into two parts: sustainability of manufacturing processes and sustainability of manufacturing systems. In the former, the paper goes deep in two main manufacturing processes: metal manufacturing process development, process chemical and lubricants and found out that energy and resource efficient utilization need to be enabled through developing new manufacturing equipment and processes that have reduced eco-footprint guided by environmental LCA evaluations. The latter on the other hand, investigates manufacturing systems and concludes that environmental impact reduction, waste production and resource consumptions through continuous improvement methods are the areas with the most focus on. (Marika Arena et al., 2009) concentrated on industrial sustainability and its tools and metrics. The main part of the work is dedicated to sustainability dimensions and their sub dimensions throughout the literature. However, the paper investigates the possibility of adding “technological dimension” as the fourth pillar to the traditional three pillars of sustainability. (Mitra & Datta, 2014) did a survey on green (sustainable) supply chain management (GSCM) to assess the extent of GSCM practices and their impact on the performance of firms. Throughout the survey, the authors came up with the two most significant key success factors (KSF) impacting the performance of the firms: supplier collaboration and product design and logistics for environmental sustainability. Thereupon, they proposed the hypothesis whether environmentally sustainable purchasing practice and environmentally sustainable manufacturing and logistics practices are positively related to competitiveness and economic performance. Consequently, the existence of a positive relationship between competitiveness and economic performance was also tested. Getting the surveys filled by the firms and running the factor analysis, the hypothesizes were tested and it was stated that supplier collaboration is positively related to environmentally sustainable product design and logistics which in turn has a positive impact on competitiveness and economic performance. By doing a research on the elements of sustainability, its tools and software during the design stage, (Mohd Fahrul Hassan, Saman, Mahmood, Nor, & Rahman, 2016) concluded that a sustainability assessment can create critical challenges for product-based assessments in manufacturing if it takes place during the product phase. (Moldavska & Welo, 2015) discussed the applicability of sustainability assessment tools in manufacturing and claimed that a tool can be counted as applicable if it is capable of: providing reliable information, addressing a manufacturing company’s context, pointing out problem areas and being conducted within limited time and resources. A framework that allows assessment from the customer’s perspective accompanied by product development assessment was then proposed having a holistic view toward sustainability since it covers economic, environmental and social dimensions alongside assessment of value chain activities, material/information flow and customer relationship.
2.4. Samples and descriptive analysis
The overall sample considered in this chapter is 151 papers (published up to March 2018 as in the Reference section). The time distribution of the papers published is shown in figure 10. As it can be seen from the figure, only 2 papers belong to the years prior to 2000 (Costanza & Patten, 1995; Loucks, 1997) ; (Costanza & Patten, 1995) discusses the definition of sustainability and tries to disclose the characteristics of a (sub) system that claims to be sustainable. Hereof, three main questions are raised and discussed: (1) which (sub) systems are to be sustained? (2) for how long they are to be sustained? (3) when we can assess whether the
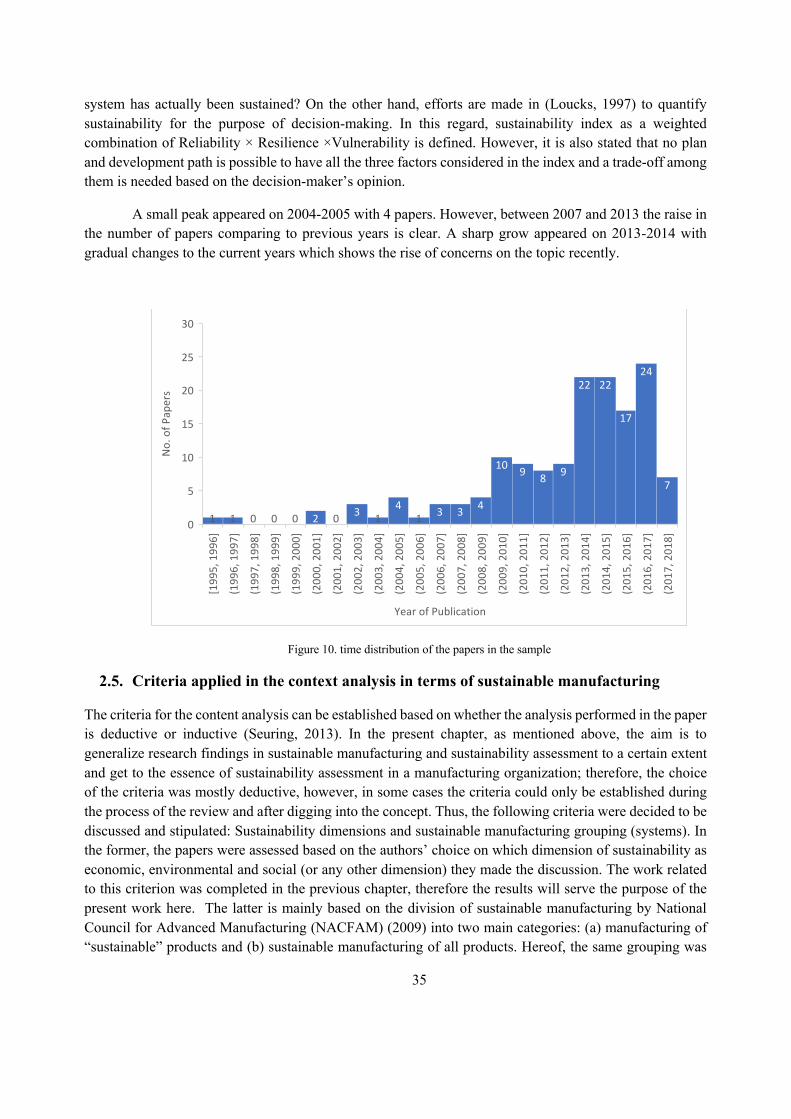
35
system has actually been sustained? On the other hand, efforts are made in (Loucks, 1997) to quantify sustainability for the purpose of decision-making. In this regard, sustainability index as a weighted combination of Reliability × Resilience ×Vulnerability is defined. However, it is also stated that no plan and development path is possible to have all the three factors considered in the index and a trade-off among them is needed based on the decision-maker’s opinion.
A small peak appeared on 2004-2005 with 4 papers. However, between 2007 and 2013 the raise in the number of papers comparing to previous years is clear. A sharp grow appeared on 2013-2014 with gradual changes to the current years which shows the rise of concerns on the topic recently.
Figure 10. time distribution of the papers in the sample
2.5. Criteria applied in the context analysis in terms of sustainable manufacturing
The criteria for the content analysis can be established based on whether the analysis performed in the paper is deductive or inductive (Seuring, 2013). In the present chapter, as mentioned above, the aim is to generalize research findings in sustainable manufacturing and sustainability assessment to a certain extent and get to the essence of sustainability assessment in a manufacturing organization; therefore, the choice of the criteria was mostly deductive, however, in some cases the criteria could only be established during the process of the review and after digging into the concept. Thus, the following criteria were decided to be discussed and stipulated: Sustainability dimensions and sustainable manufacturing grouping (systems). In the former, the papers were assessed based on the authors’ choice on which dimension of sustainability as economic, environmental and social (or any other dimension) they made the discussion. The work related to this criterion was completed in the previous chapter, therefore the results will serve the purpose of the present work here. The latter is mainly based on the division of sustainable manufacturing by National Council for Advanced Manufacturing (NACFAM) (2009) into two main categories: (a) manufacturing of “sustainable” products and (b) sustainable manufacturing of all products. Hereof, the same grouping was
1 1 0 0 0 2 0 3 14
1 3 3 4
10 9 8 9
22 22
17
24
7
Year of Publication
[199
5, 1
996]
(199
6, 1
997]
(199
7, 1
998]
(199
8, 1
999]
(199
9, 2
000]
(200
0, 2
001]
(200
1, 2
002]
(200
2, 2
003]
(200
3, 2
004]
(200
4, 2
005]
(200
5, 2
006]
(200
6, 2
007]
(200
7, 2
008]
(200
8, 2
009]
(200
9, 2
010]
(201
0, 2
011]
(201
1, 2
012]
(201
2, 2
013]
(201
3, 2
014]
(201
4, 2
015]
(201
5, 2
016]
(201
6, 2
017]
(201
7, 2
018]
No.
of P
aper
s
0
5
10
15
20
25
30
36
considered as the initial point, but they were broken into subcategories afterwards. The following will show the work done in this criterion.
2.5.1. Sustainable Manufacturing Grouping (Systems)
Haapala et al. (2013), stated that the term “sustainable manufacturing” can be carelessly used to describe the actions relating to characterizing and reducing the environmental impacts of manufacturing while it implies a much greater deal than that. National Council for Advanced Manufacturing (NACFAM) (2009) has divided sustainable manufacturing into two main categories: manufacturing of “sustainable” products and sustainable manufacturing of all products. The main criteria of the review were also these two. However, by inspiring from (Karl R. Haapala et al., 2013) and (Jayal, Badurdeen, Dillon, & Jawahir, 2010) the papers were categorized as in figure 11.
Figure 11. sustainable manufacturing categorization adopted in this study
2.5.2. Sustainable Manufacturing of Products
Based on the definition by (NACFAM) (2009) Sustainable manufacturing of products includes: manufacturing of renewable energy, energy efficiency, green building, and other “green” & social equity-related products. However, to reach sustainable manufacturing of products, it is needed to consider two key issues: which manufacturing processes are performed and where they are performed. The former is important from the economic dimension of sustainability as nations have a strategic interest in manufacturing activities as a key to raising standards of living and sustaining quality of life. Examples of these processes can be named as: metals manufacturing processes (like casting, forming, machining, grinding, …), electronics manufacturing processes (like semiconductor manufacturing) and process chemicals and lubricants (considering solvents, lubricants, etchants and, …). The latter on the other hand, is crucial from the environmental dimension since rules and regulations, values and workplace practices
Sustainable Manufacturing
Sustainable Manufacturing
of Products
Sustainability of Manufacturing
Processes
Metal Manufacturing
ProcessesElectronics
Manufacturing Process
Chemicals and Lubricants
Manufacturing of Sustainable
Products
Sustainability of Manufacturing
Systems
Facility Design and Operations
Facility Size and Unit Cost
Production Planning and
Control
Sustainability in Product/Process
Design and Development
Supply Chain Network Design
Closed-loop Supply Chain
Network Design
37
differ in different countries (K.R. Haapala et al., 2013). (Jayal, Badurdeen, Dillon, et al., 2010) presented the applications of sustainability principles in manufacturing processes using machining as an example and stated that: “Machining is one of the most important and major manufacturing processes, and it is estimated that machining processes contribute about 5% of the GDP in the developed world. The indirect impact of machining, due to its effect on surface integrity, and hence on product life, is even greater. Moreover, as economic factors induce shorter product cycles, and more flexible manufacturing systems, the importance of machining is expected to increase even further”. Consequently, they analysed the sustainability of the processes considering sustainable machining technologies namely: dry machining, near-dry machining and cryogenic machining and. Conclusively, this group of the classification mostly focuses on the renewable energy and manufacturing processes and the technologies which are outside the defined scope; therefore, it was excluded from the search, the importance is not negligible though.
2.5.3. Manufacturing of sustainable products
As (NACFAM) (2009) defined Manufacturing of sustainable products as sustainable manufacturing of all products considering the full sustainability issues related to the products manufactured. In other words, it can be about what manufacturing systems contribute to sustainability. Haapala et al. (2013) and (Jayal, Badurdeen, Dillon, et al., 2010) divided this group of sustainable manufacturing into three main categories: facility design and operations, production planning and control and supply chain network design. A brief description of the three categories is shown in table 4 and figure 12.
Facility Design and Operations
The urge to incorporate sustainability principles into decisions regarding to planning, design, construction, operation, maintenance and decommissioning of facilities, has imposed increasing pressure to engineers and decision makers. Thus, allocating resources to facilities and infrastructures targeting sustainability is critical especially within the constrained budget. Sutherland et al. (2008) challenged a size-selection problem for a remanufacturing facility; in which various aspects naming production, transportation and inventory-related costs and explained economy of scale effects were considered. The model resulted in optimal unit cost and facility size as a function of remanufacturing efficiency, product yield, and transportation cost rate. Clarke et al. (2008) discussed the problem of the identification of suitable sites for remanufacturing facilities with a shoe manufacturing case study, they derived a solution by introducing a p-median formulation and a set of economic and environmental factors. As another approach, (Cochran, Jafri, Chu, & Bi, 2016) employed a manufacturing system design decomposition (MSDD) to uncouple the elements of the manufacturing design and reflect the interaction and priorities of the system elements to reach a sustainable system. As the same approach, (Cochran, Kinard, & Bi, 2016) adopted MSDD alongside big data analytics to identify bottlenecks for system improvement and cost-justify/resource-allocation decisions for the continuous improvement and sustainability of the manufacturing enterprise.
Production planning and control
As (Karl R. Haapala et al., 2013; Hosseini, Nosratabadi, Nehzati, & Ismail, 2012) mentioned, the total energy required for direct manufacturing processes such as metal working operations, deformation or removal of materials may be not as high as the functions needed at the background for manufacturing equipment operations. Gutowski et al. (2005), stated that more than 85% of the energy in a production plant is utilized for functions related indirectly to the actual production of parts. Thus, it can be resulted that being
38
only on the basis machines and technologies to save energy is not sufficient and more efforts on the system level of the production is required to gain desirable results in the field of sustainability (Karl R. Haapala et al., 2013). Employment of Life Cycle Assessment (LCA) has been one of the most common efforts in production planning. (Srinivasan & Sheng, 1999) introduced a process modelling approach connected with LCA to make modification on product and process design to assist production planning (as in (Atwater & Uzdzinski, 2014; Garcia-Herrero et al., 2017; Pouyan Rezvan et al., 2014; Gerardo J. Ruiz-Mercado, Gonzalez, & Smith, 2014; Salama, Galal, & Elsayed, 2015; Santucci & Esterman, 2015; Tagliaferri et al., 2016) as examples). (Caruso, Dumbacher, & Grieves, 2010) employed Product Life-cycle Management (PLM) to optimize the phases of the life cycle to reach sustainability. The model considers the total life cycle costs as critical decision-making variables and it has been implemented by the Engineering Directorate at the National Aeronautics and Space Administration’s (NASA’s) Marshall Space Flight Centre. The goal of the model is to deliver quality products that meet or exceed requirements on time and within budget. (Utne, 2009) discusses the usefulness of Life Cycle Cost (LCC) as a method to enhance sustainable designs of fishing vessels for ship owners, and to improve the decision-bases for fisheries management. (Güçdemir & Selim, 2017) integrates customer relationship management (CRM) and Production Planning Control (PPC) techniques to use manufacturing resources of job shops more effectively aiming at gaining more sustainable competitive advantage by focusing on customer satisfaction.
Supply chain network design
Sustainable supply chain management was defined as “the planning and management of sourcing, procurement, conversion and logistics activities involved during premanufacturing, manufacturing, use, and post-use stages in the life cycle in closed-loop through multiple life cycles with seamless information sharing about all product life cycle stages between companies by explicitly considering the social and environmental implications to achieve a shared vision.”(Badurdeen et al., 2009). Based on the definition and as observed through the coding, that sustainable supply chain network design can be categorized as designing of a green enterprise or making a closed loop production by adding the 3R (Reduce, Reuse and Recycle) or in more innovative cases the 6R (Reduce, Reuse, Recover, Redesign, Remanufacture and Recycle) (Jawahir et al., 2006; Jayal, Badurdeen, Dillon, et al., 2010) to the conventional Production loop. (Urata, Yamada, Itsubo, & Inoue, 2017) proposed a design for a global supply chain networks in Asian countries, by which they could balance the cost of procurement and transportation alongside the material-based CO2 emissions to determine the suppliers and factory locations that should be selected to achieve reduced CO2 emissions. (Umpfenbach, Dalkiran, Chinnam, & Murat, 2017) presents a mixed-integer linear programming formulation for integrated assortment and supply chain network design models for automotive products to provide effective decision support and directional guidance to strategic product planners. (Martí, Tancrez, & Seifert, 2015)takes demand uncertainty into account in a supply chain network design model and includes decisions on supply chain responsiveness under carbon policies like supply chain carbon footprints, market carbon footprints, and carbon taxes. The suggested model supports the analysis of the effect of different policies on costs and optimal network configuration. In (Jindal & Sangwan, 2014) a multi-product, multi-facility capacitated closed-loop supply chain framework is proposed in an uncertain environment including reuse, refurbish, recycle and disposal of parts. The uncertainty related to demand, fraction of parts recovered for different product recovery processes, product acquisition cost, purchasing cost, transportation cost, processing, and set-up cost is handled with fuzzy numbers. They also propose a fuzzy mixed integer linear programming model for the decisions regarding to the location and allocation of parts at each facility and number of parts to be purchased from external suppliers, all aiming at maximizing
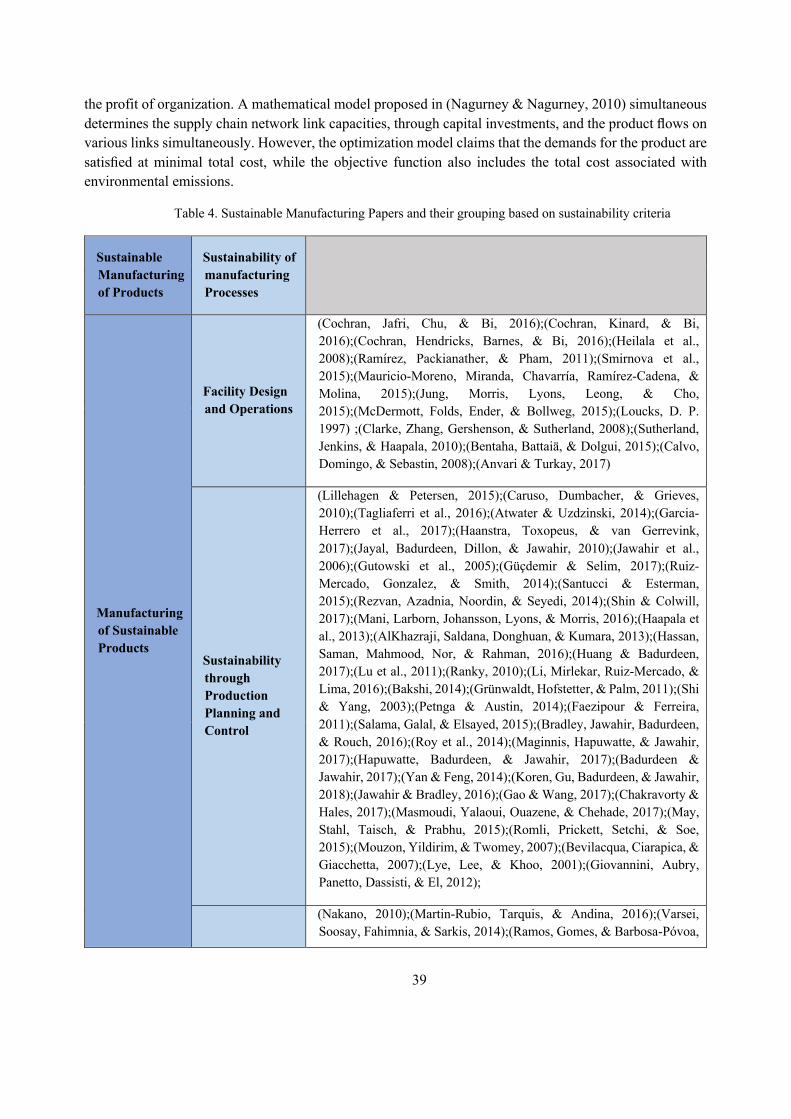
39
the profit of organization. A mathematical model proposed in (Nagurney & Nagurney, 2010) simultaneous determines the supply chain network link capacities, through capital investments, and the product flows on various links simultaneously. However, the optimization model claims that the demands for the product are satisfied at minimal total cost, while the objective function also includes the total cost associated with environmental emissions.
Table 4. Sustainable Manufacturing Papers and their grouping based on sustainability criteria
Sustainable Manufacturing of Products
Sustainability of manufacturing Processes
Manufacturing of Sustainable Products
Facility Design and Operations
(Cochran, Jafri, Chu, & Bi, 2016);(Cochran, Kinard, & Bi, 2016);(Cochran, Hendricks, Barnes, & Bi, 2016);(Heilala et al., 2008);(Ramírez, Packianather, & Pham, 2011);(Smirnova et al., 2015);(Mauricio-Moreno, Miranda, Chavarría, Ramírez-Cadena, & Molina, 2015);(Jung, Morris, Lyons, Leong, & Cho, 2015);(McDermott, Folds, Ender, & Bollweg, 2015);(Loucks, D. P. 1997) ;(Clarke, Zhang, Gershenson, & Sutherland, 2008);(Sutherland, Jenkins, & Haapala, 2010);(Bentaha, Battaiä, & Dolgui, 2015);(Calvo, Domingo, & Sebastin, 2008);(Anvari & Turkay, 2017)
Sustainability through Production Planning and Control
(Lillehagen & Petersen, 2015);(Caruso, Dumbacher, & Grieves, 2010);(Tagliaferri et al., 2016);(Atwater & Uzdzinski, 2014);(Garcia-Herrero et al., 2017);(Haanstra, Toxopeus, & van Gerrevink, 2017);(Jayal, Badurdeen, Dillon, & Jawahir, 2010);(Jawahir et al., 2006);(Gutowski et al., 2005);(Güçdemir & Selim, 2017);(Ruiz-Mercado, Gonzalez, & Smith, 2014);(Santucci & Esterman, 2015);(Rezvan, Azadnia, Noordin, & Seyedi, 2014);(Shin & Colwill, 2017);(Mani, Larborn, Johansson, Lyons, & Morris, 2016);(Haapala et al., 2013);(AlKhazraji, Saldana, Donghuan, & Kumara, 2013);(Hassan, Saman, Mahmood, Nor, & Rahman, 2016);(Huang & Badurdeen, 2017);(Lu et al., 2011);(Ranky, 2010);(Li, Mirlekar, Ruiz-Mercado, & Lima, 2016);(Bakshi, 2014);(Grünwaldt, Hofstetter, & Palm, 2011);(Shi & Yang, 2003);(Petnga & Austin, 2014);(Faezipour & Ferreira, 2011);(Salama, Galal, & Elsayed, 2015);(Bradley, Jawahir, Badurdeen, & Rouch, 2016);(Roy et al., 2014);(Maginnis, Hapuwatte, & Jawahir, 2017);(Hapuwatte, Badurdeen, & Jawahir, 2017);(Badurdeen & Jawahir, 2017);(Yan & Feng, 2014);(Koren, Gu, Badurdeen, & Jawahir, 2018);(Jawahir & Bradley, 2016);(Gao & Wang, 2017);(Chakravorty & Hales, 2017);(Masmoudi, Yalaoui, Ouazene, & Chehade, 2017);(May, Stahl, Taisch, & Prabhu, 2015);(Romli, Prickett, Setchi, & Soe, 2015);(Mouzon, Yildirim, & Twomey, 2007);(Bevilacqua, Ciarapica, & Giacchetta, 2007);(Lye, Lee, & Khoo, 2001);(Giovannini, Aubry, Panetto, Dassisti, & El, 2012);
(Nakano, 2010);(Martin-Rubio, Tarquis, & Andina, 2016);(Varsei, Soosay, Fahimnia, & Sarkis, 2014);(Ramos, Gomes, & Barbosa-Póvoa,
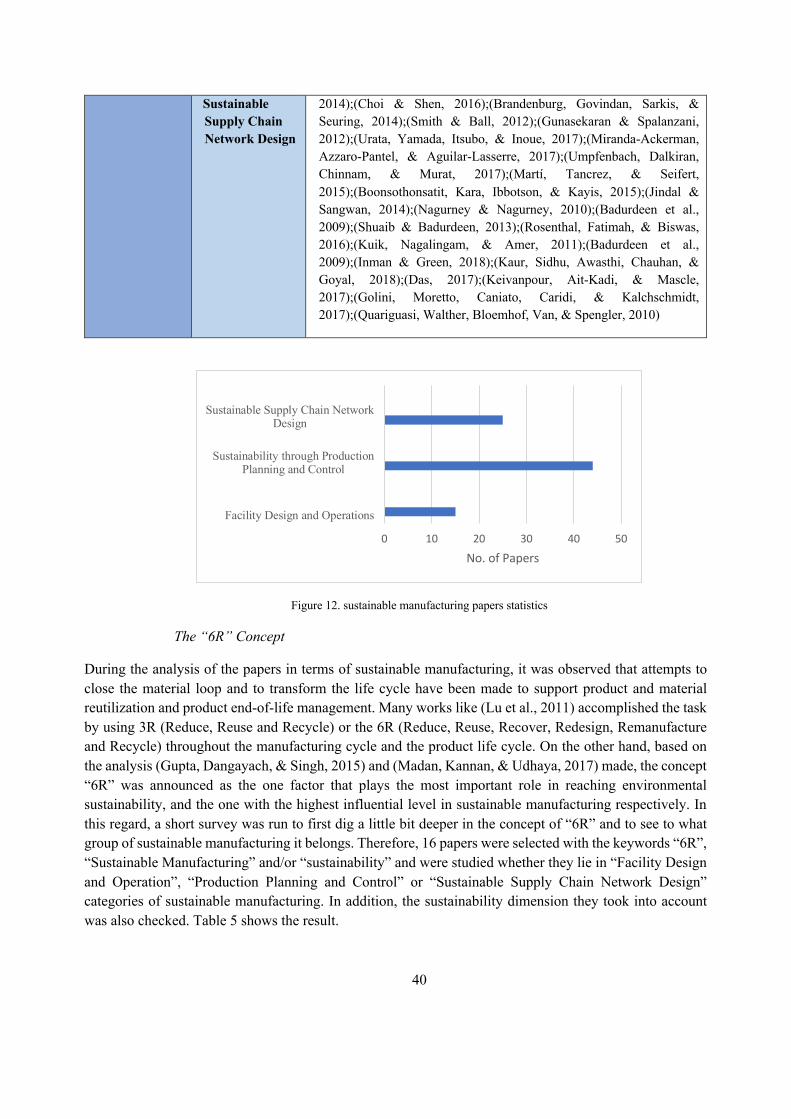
40
Sustainable Supply Chain Network Design
2014);(Choi & Shen, 2016);(Brandenburg, Govindan, Sarkis, & Seuring, 2014);(Smith & Ball, 2012);(Gunasekaran & Spalanzani, 2012);(Urata, Yamada, Itsubo, & Inoue, 2017);(Miranda-Ackerman, Azzaro-Pantel, & Aguilar-Lasserre, 2017);(Umpfenbach, Dalkiran, Chinnam, & Murat, 2017);(Martí, Tancrez, & Seifert, 2015);(Boonsothonsatit, Kara, Ibbotson, & Kayis, 2015);(Jindal & Sangwan, 2014);(Nagurney & Nagurney, 2010);(Badurdeen et al., 2009);(Shuaib & Badurdeen, 2013);(Rosenthal, Fatimah, & Biswas, 2016);(Kuik, Nagalingam, & Amer, 2011);(Badurdeen et al., 2009);(Inman & Green, 2018);(Kaur, Sidhu, Awasthi, Chauhan, & Goyal, 2018);(Das, 2017);(Keivanpour, Ait-Kadi, & Mascle, 2017);(Golini, Moretto, Caniato, Caridi, & Kalchschmidt, 2017);(Quariguasi, Walther, Bloemhof, Van, & Spengler, 2010)
Figure 12. sustainable manufacturing papers statistics
The “6R” Concept
During the analysis of the papers in terms of sustainable manufacturing, it was observed that attempts to close the material loop and to transform the life cycle have been made to support product and material reutilization and product end-of-life management. Many works like (Lu et al., 2011) accomplished the task by using 3R (Reduce, Reuse and Recycle) or the 6R (Reduce, Reuse, Recover, Redesign, Remanufacture and Recycle) throughout the manufacturing cycle and the product life cycle. On the other hand, based on the analysis (Gupta, Dangayach, & Singh, 2015) and (Madan, Kannan, & Udhaya, 2017) made, the concept “6R” was announced as the one factor that plays the most important role in reaching environmental sustainability, and the one with the highest influential level in sustainable manufacturing respectively. In this regard, a short survey was run to first dig a little bit deeper in the concept of “6R” and to see to what group of sustainable manufacturing it belongs. Therefore, 16 papers were selected with the keywords “6R”, “Sustainable Manufacturing” and/or “sustainability” and were studied whether they lie in “Facility Design and Operation”, “Production Planning and Control” or “Sustainable Supply Chain Network Design” categories of sustainable manufacturing. In addition, the sustainability dimension they took into account was also checked. Table 5 shows the result.
0 10 20 30 40 50
Facility Design and Operations
Sustainability through ProductionPlanning and Control
Sustainable Supply Chain NetworkDesign
No. of Papers
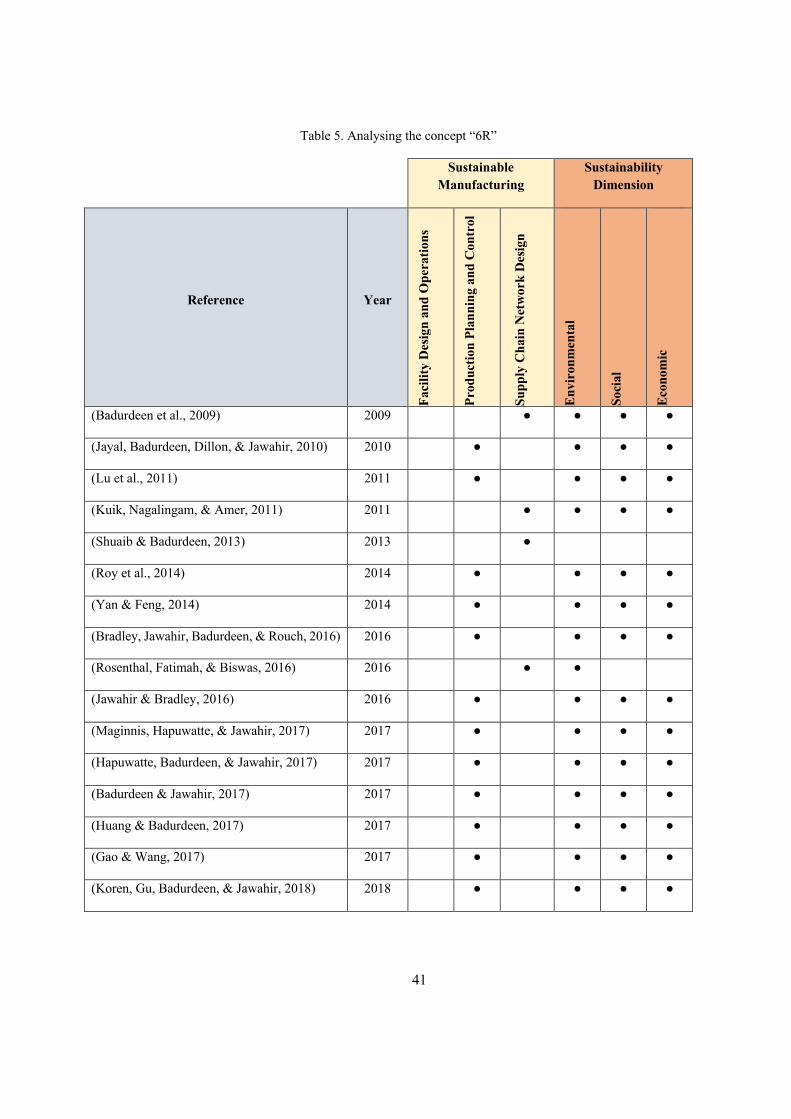
41
Table 5. Analysing the concept “6R”
Sustainable Manufacturing
Sustainability Dimension
Reference Year
Faci
lity
Des
ign
and
Ope
ratio
ns
Prod
uctio
n Pl
anni
ng a
nd C
ontr
ol
Supp
ly C
hain
Net
wor
k D
esig
n
Envi
ronm
enta
l
Soci
al
Econ
omic
(Badurdeen et al., 2009) 2009 ● ● ● ●
(Jayal, Badurdeen, Dillon, & Jawahir, 2010) 2010 ● ● ● ●
(Lu et al., 2011) 2011 ● ● ● ●
(Kuik, Nagalingam, & Amer, 2011) 2011 ● ● ● ●
(Shuaib & Badurdeen, 2013) 2013 ●
(Roy et al., 2014) 2014 ● ● ● ●
(Yan & Feng, 2014) 2014 ● ● ● ●
(Bradley, Jawahir, Badurdeen, & Rouch, 2016) 2016 ● ● ● ●
(Rosenthal, Fatimah, & Biswas, 2016) 2016 ● ●
(Jawahir & Bradley, 2016) 2016 ● ● ● ●
(Maginnis, Hapuwatte, & Jawahir, 2017) 2017 ● ● ● ●
(Hapuwatte, Badurdeen, & Jawahir, 2017) 2017 ● ● ● ●
(Badurdeen & Jawahir, 2017) 2017 ● ● ● ●
(Huang & Badurdeen, 2017) 2017 ● ● ● ●
(Gao & Wang, 2017) 2017 ● ● ● ●
(Koren, Gu, Badurdeen, & Jawahir, 2018) 2018 ● ● ● ●
42
As it can be seen from table 5, the very recent concept of “6R”, is more used in the group “Production Planning and Control” and was never considered in “Facility Design and Operation”. On the other hand, 15 out of 16 (about 94%) analysed papers, covered all three traditional dimensions of sustainability.
2.6. Discussion on the Essence of Sustainable Manufacturing
2.6.1. Sustainability Dimensions
It was observed in chapter 1 that among sustainability dimensions like social, technological, economic, environmental, technology, efficiency and performance management, the traditional three namely: Economic, Environmental and social, also known as the Triple Bottom Line (TBL), were the ones with the most concentration on. However, social dimension seems to be the one which was hardly discussed comparing to the other two, regarding to its qualitative nature. On the other hand, as the majority of the papers analysed insisted on considering all the three dimensions simultaneously, it endorses the urge to have a holistic view through sustainability by considering all the three traditional pillars.
2.6.2. Criteria for Sustainable Manufacturing
• The grouping of the papers analysed shows that sustainable manufacturing is occurring throughout the whole life cycle of the product, from design to manufacturing processes, production planning and the supply chain of the product.
• Areas like resource consumption including energy, water, material and external resources, waste management, managing emissions, optimizing cost of operations, supply chain costs, customer satisfaction and increasing health and safety of the personnel were the most studied ones.
• The concept of “6R” (Redesign, Remanufacture, Reuse, Recover, Recycle and Reduce) and its usage in sustainable manufacturing was also studied. It is proved that 6R can be a very effective factor in terms of sustainable manufacturing especially in the category of production planning and control, and it can cover all the three traditional dimensions of sustainability.
• Concluding the points above, bolds the urge for companies to leave the traditional approach behind and go beyond to reach sustainability. Traditionally, the whole focus was on the two stages of manufacturing and logistics while now it is needed to be concentrated on all the stages. On the other hand, the elements of the 6R, which are known as the innovative elements by (Jayal, Badurdeen, Dillon Jr., & Jawahir, 2010) must be integrated in the Life cycle of the product to pave the path to sustainable manufacturing.
2.7. Sustainability Assessment
The need for assessment was recognized more than forty years ago. As the pressure of the demand for sustainability increases on the manufacturing companies, the urge for assessing their performance has been reinforced. However, at the time the concept appeared, the most focus was on environmental impacts only, which was gradually expanded to the other pillar of sustainability (social) (Pope, Annandale, & Morrison-Saunders, 2004) while economic dimension was a typical approach followed. (Devuyst, 2001, p.9) defined sustainability assessment as a methodology “that can help decision makers and policy-makers decide what actions they should take and should not take in an attempt to make society more sustainable”. On the other hand, the goal of Sustainability Assessment (SA) is defined by (Verheem, 2002) to pursue “plans and
43
activities that make an optimal contribution to sustainable development”. Sustainability Assessment (SA) is known to be a complex appraisal method and conducted for supporting decision making and policy in a broad environmental, economic and social context(Sala, Ciuffo, & Nijkamp, 2015). Various methods and assessment have been accomplished through the literature so far, trying to find a way for companies to assess their sustainability state, help the companies choose between sustainable solutions, define and solve problems on the way to sustainability and identify potential solutions.
2.7.1. Methodologies and Tools
Tools and methodologies for sustainability assessment have been studied and categorized throughout the literature. Moldavska & Welo (2015) did a review on the tools employed for sustainability assessment and categorized them (as shown in table 3), they also claimed that the tools that address all three aspects of sustainability are of the greatest interest among all and can be applied at the company level. With a different view, (Hacking & Guthrie, 2008) categorized the assessment features to the three categories of Context features (features that characterize the planning and decision-making context and describe the relationship between the assessment and its context), Process features (including when and by whom, the assessment is undertaken) and features within the assessment (the type and level of analysis used, and what the output of the assessment process contains). (Konys, 2018) categorized the several groups of sustainable measurements to 3 main ones as frameworks, indicators and measures. However, they state that although these groups and methods differentiate from each other as the application for these approaches are vast and the result of impact assessment can vary considerably based on the sustainability dimension, they still share some features with each other. For example, frameworks provide the guidelines for a given domain of interest or considered problem about the sustainability dimensions, while metrics and indicators are used to assess the sustainability performance of a process or a system, to evaluate the process toward enhancing sustainability and to assist decision-makers in evaluating alternatives. Other categorizations observed through the literature are shown in Table 6.
Considering the tools used to assess sustainability, the one that has been used the most was the assessment through sets of indicators and metrics which can be confirmed by KEI (2005): “Indicators and composite indicators are increasingly recognized as a useful tool for policy making public communication in conveying performance information on countries’ in fields such as environment, technological economy, society, or development”. Indicators can summarize, quantify, condense and analyse enormous and complicated concepts and transform them to manageable and applicable information for the corporate (Godfrey and Todd, 2001; Warhurst, 2002). Sustainable development indicators in general, can assess and evaluate the performance, provide trends on improvements plus warnings in case the corporate is facing a drop off in dimensions of sustainability and provide information to decision makers (Lundin, 1999; Spohn, 2004). (M.F. Hassan, Saman, Mahmood, Nor, & Rahman, 2017) did an environmental and technical sustainability assessment methodology on an existing water distribution system, when reclaimed water is used for non-potable water demand and fire flow. The authors provided scenario-based solutions for decision makers to illustrate the trade-off between the environmental and technical sustainability. Considering reliability, resiliency, and vulnerability performance criteria a sustainability Index has been defined to measure the sustainability performance of the water system. (Krajnc & Glavič, 2005) focused on the difficulties existing on the way of comparing companies in terms of sustainability due to a large number of performance measurements. Therefore, they proposed model for designing a composite sustainable development index (ICSD) that depicts performance of companies along all the three
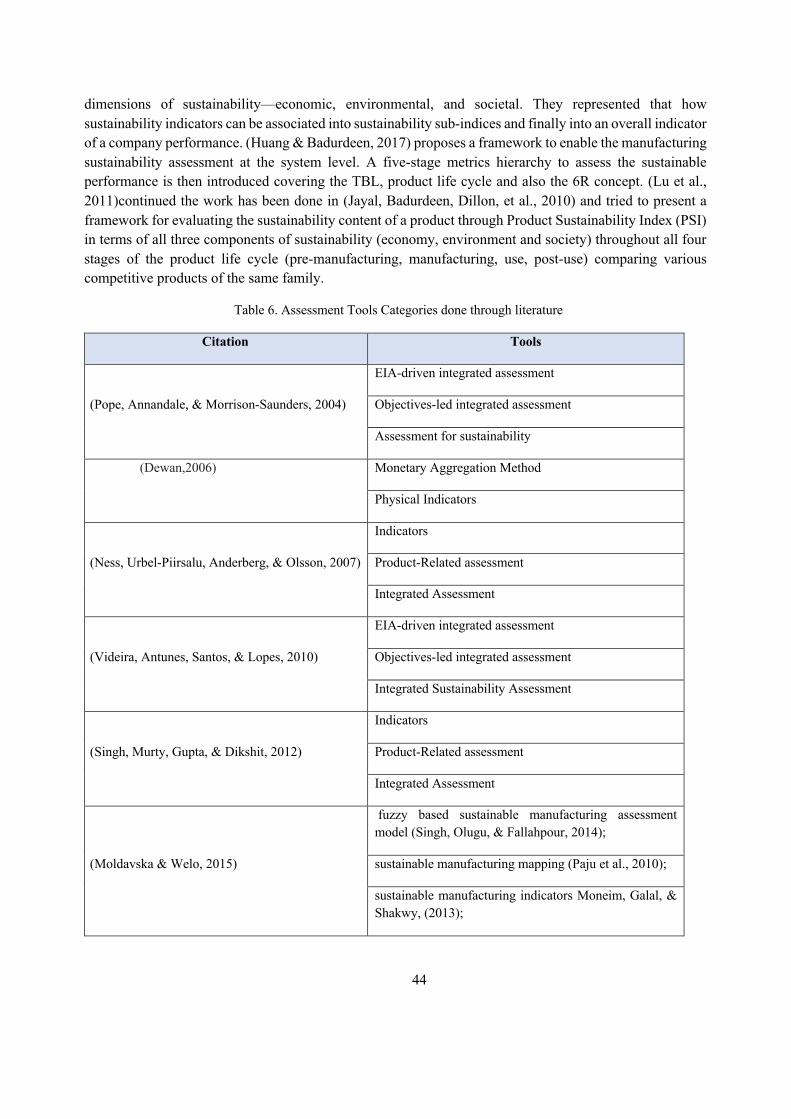
44
dimensions of sustainability—economic, environmental, and societal. They represented that how sustainability indicators can be associated into sustainability sub-indices and finally into an overall indicator of a company performance. (Huang & Badurdeen, 2017) proposes a framework to enable the manufacturing sustainability assessment at the system level. A five-stage metrics hierarchy to assess the sustainable performance is then introduced covering the TBL, product life cycle and also the 6R concept. (Lu et al., 2011)continued the work has been done in (Jayal, Badurdeen, Dillon, et al., 2010) and tried to present a framework for evaluating the sustainability content of a product through Product Sustainability Index (PSI) in terms of all three components of sustainability (economy, environment and society) throughout all four stages of the product life cycle (pre-manufacturing, manufacturing, use, post-use) comparing various competitive products of the same family.
Table 6. Assessment Tools Categories done through literature
Citation Tools
(Pope, Annandale, & Morrison-Saunders, 2004)
EIA-driven integrated assessment
Objectives-led integrated assessment
Assessment for sustainability
(Dewan,2006) Monetary Aggregation Method
Physical Indicators
(Ness, Urbel-Piirsalu, Anderberg, & Olsson, 2007)
Indicators
Product-Related assessment
Integrated Assessment
(Videira, Antunes, Santos, & Lopes, 2010)
EIA-driven integrated assessment
Objectives-led integrated assessment
Integrated Sustainability Assessment
(Singh, Murty, Gupta, & Dikshit, 2012)
Indicators
Product-Related assessment
Integrated Assessment
(Moldavska & Welo, 2015)
fuzzy based sustainable manufacturing assessment model (Singh, Olugu, & Fallahpour, 2014);
sustainable manufacturing mapping (Paju et al., 2010);
sustainable manufacturing indicators Moneim, Galal, & Shakwy, (2013);
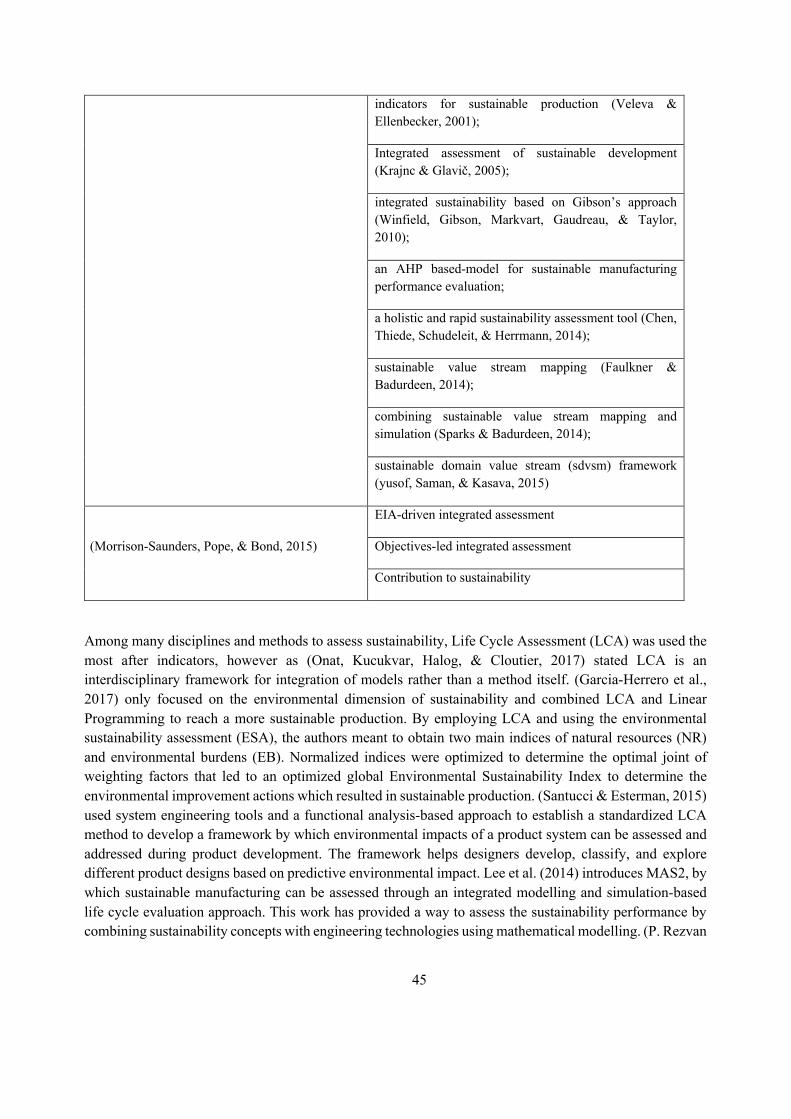
45
indicators for sustainable production (Veleva & Ellenbecker, 2001);
Integrated assessment of sustainable development (Krajnc & Glavič, 2005);
integrated sustainability based on Gibson’s approach (Winfield, Gibson, Markvart, Gaudreau, & Taylor, 2010);
an AHP based-model for sustainable manufacturing performance evaluation;
a holistic and rapid sustainability assessment tool (Chen, Thiede, Schudeleit, & Herrmann, 2014);
sustainable value stream mapping (Faulkner & Badurdeen, 2014);
combining sustainable value stream mapping and simulation (Sparks & Badurdeen, 2014);
sustainable domain value stream (sdvsm) framework (yusof, Saman, & Kasava, 2015)
(Morrison-Saunders, Pope, & Bond, 2015)
EIA-driven integrated assessment
Objectives-led integrated assessment
Contribution to sustainability
Among many disciplines and methods to assess sustainability, Life Cycle Assessment (LCA) was used the most after indicators, however as (Onat, Kucukvar, Halog, & Cloutier, 2017) stated LCA is an interdisciplinary framework for integration of models rather than a method itself. (Garcia-Herrero et al., 2017) only focused on the environmental dimension of sustainability and combined LCA and Linear Programming to reach a more sustainable production. By employing LCA and using the environmental sustainability assessment (ESA), the authors meant to obtain two main indices of natural resources (NR) and environmental burdens (EB). Normalized indices were optimized to determine the optimal joint of weighting factors that led to an optimized global Environmental Sustainability Index to determine the environmental improvement actions which resulted in sustainable production. (Santucci & Esterman, 2015) used system engineering tools and a functional analysis-based approach to establish a standardized LCA method to develop a framework by which environmental impacts of a product system can be assessed and addressed during product development. The framework helps designers develop, classify, and explore different product designs based on predictive environmental impact. Lee et al. (2014) introduces MAS2, by which sustainable manufacturing can be assessed through an integrated modelling and simulation-based life cycle evaluation approach. This work has provided a way to assess the sustainability performance by combining sustainability concepts with engineering technologies using mathematical modelling. (P. Rezvan
46
et al., 2014) proposed a hybrid approach of fuzzy inference system and analytical hierarchy process (AHP) to evaluate the sustainability level of concrete manufacturing processes based on Life Cycle Assessment (LCA) principals.
Improving Unit Manufacturing Processes (UMP) throughout industry can be noted as another methodology to elevate the sustainability performance. As an example, (Mani, Larborn, et al., 2016) discussed the effectiveness of the E3012-16 standard regarding to assessment and improvement of the sustainability of production processes through three different case studies. The paper defines a generic representation to support structured processes and tried to link multiple unit manufacturing processes (UMPs) to support system-level analysis, such as simulation and evaluation of a series of manufacturing processes used in the manufacture and assembly of parts. Garretson et al. (2014) Used unit manufacturing process models to chain together a sequential manufacturing process flow to generate a product sustainability assessment.to perform the assessment, the method brings together upstream inventory analysis and in-house unit process modelling. In this way, cradle-to-gate assessments can support decisions made during product, process, and supply chain design. They also came up with a software is also using Visual Basic to create a graphical user interface for an MS Excel calculation engine. (Eastwood & Haapala, 2015) combines unit process modelling and life cycle inventory techniques to develop a model for sustainability assessment. The utilization of both approaches conducts product sustainability assessment at the process level. The developed methodology aggregates information from the process level and quantifies sustainability metrics.
Value Stream Mapping (VSM)-based tools were also observed to be developed to assess sustainability mostly based on applying indicators to manufacturing processes. Paju et al. (2010) did an assessment as they combined value stream mapping alongside a new methodology called sustainable manufacturing mapping (SMM), discrete event simulation (DES) and life-cycle analysis (LCA). In the proposed methodology, DES works as an add-on element and VSM is considered as a visualization technique used to implement environmental indicators. SMM carries out VSM and takes a goal-oriented approach, as defined in LCA (ISO 14040 2006) and chooses sustainability indicators according to that goal. However, they also mention that since the assessment does not use the same indicators, the cross comparison between system can be challenging. (Faulkner & Badurdeen, 2014) on the other hand, presents a methodology to develop Sustainable Value Stream Mapping (Sus-VSM) by identifying suitable metrics and methods to visually present them. The metrics are related to evaluation of environmental and societal sustainability performance of a manufacturing line. They then created visual symbols for each proposed metric to ensure visual clarity and the usefulness of the proposed method.
Nevertheless, other tools and models were developed to assess sustainability. to name a few, (Chen et al., 2014) presented a tool for assessing sustainability for small manufacturing enterprises. Based on the authors, the tool is holistic and rapid and since it is industry- independent, it can be used as a generic cross industry assessment tool. (Ciceri et al., 2010) proposed a product bill-of-material based to estimate the material and manufacturing energy in which compiling available data from material embodied figures, empirical and bill of material makes the estimation possible in the mentioned study. (Morrison-Saunders & Therivel, 2006) stated that lack of a practical definition of sustainable manufacturing, shortcomings of existing sustainability assessments to analyse sufficiently current conditions of the organization, and the uncertainty of the effect of actions proposed by decision makers based on the result of a sustainability assessment are the barriers on the way of transitioning of manufacturing organizations to sustainable ones.
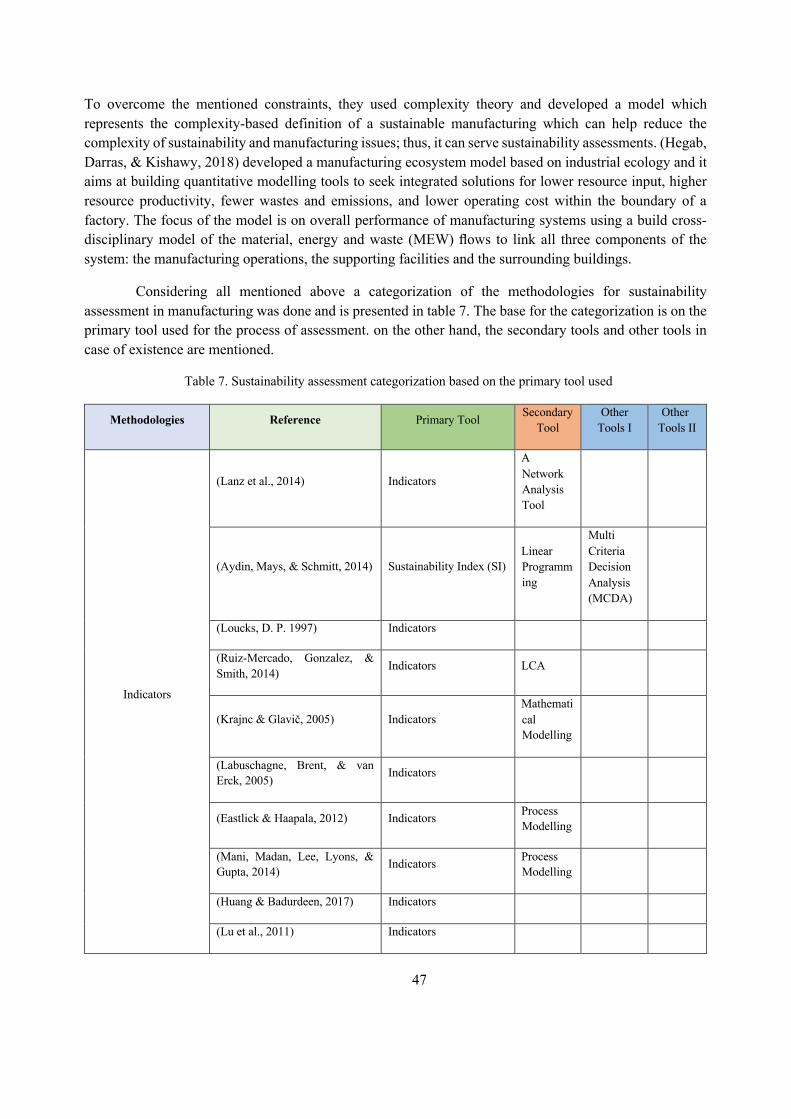
47
To overcome the mentioned constraints, they used complexity theory and developed a model which represents the complexity-based definition of a sustainable manufacturing which can help reduce the complexity of sustainability and manufacturing issues; thus, it can serve sustainability assessments. (Hegab, Darras, & Kishawy, 2018) developed a manufacturing ecosystem model based on industrial ecology and it aims at building quantitative modelling tools to seek integrated solutions for lower resource input, higher resource productivity, fewer wastes and emissions, and lower operating cost within the boundary of a factory. The focus of the model is on overall performance of manufacturing systems using a build cross-disciplinary model of the material, energy and waste (MEW) flows to link all three components of the system: the manufacturing operations, the supporting facilities and the surrounding buildings.
Considering all mentioned above a categorization of the methodologies for sustainability assessment in manufacturing was done and is presented in table 7. The base for the categorization is on the primary tool used for the process of assessment. on the other hand, the secondary tools and other tools in case of existence are mentioned.
Table 7. Sustainability assessment categorization based on the primary tool used
Methodologies Reference Primary Tool Secondary Tool
Other Tools I
Other Tools II
Indicators
(Lanz et al., 2014) Indicators
A Network Analysis Tool
(Aydin, Mays, & Schmitt, 2014) Sustainability Index (SI) Linear Programming
Multi Criteria Decision Analysis (MCDA)
(Loucks, D. P. 1997) Indicators
(Ruiz-Mercado, Gonzalez, & Smith, 2014) Indicators LCA
(Krajnc & Glavič, 2005) Indicators Mathematical Modelling
(Labuschagne, Brent, & van Erck, 2005) Indicators
(Eastlick & Haapala, 2012) Indicators Process Modelling
(Mani, Madan, Lee, Lyons, & Gupta, 2014) Indicators Process
Modelling
(Huang & Badurdeen, 2017) Indicators
(Lu et al., 2011) Indicators
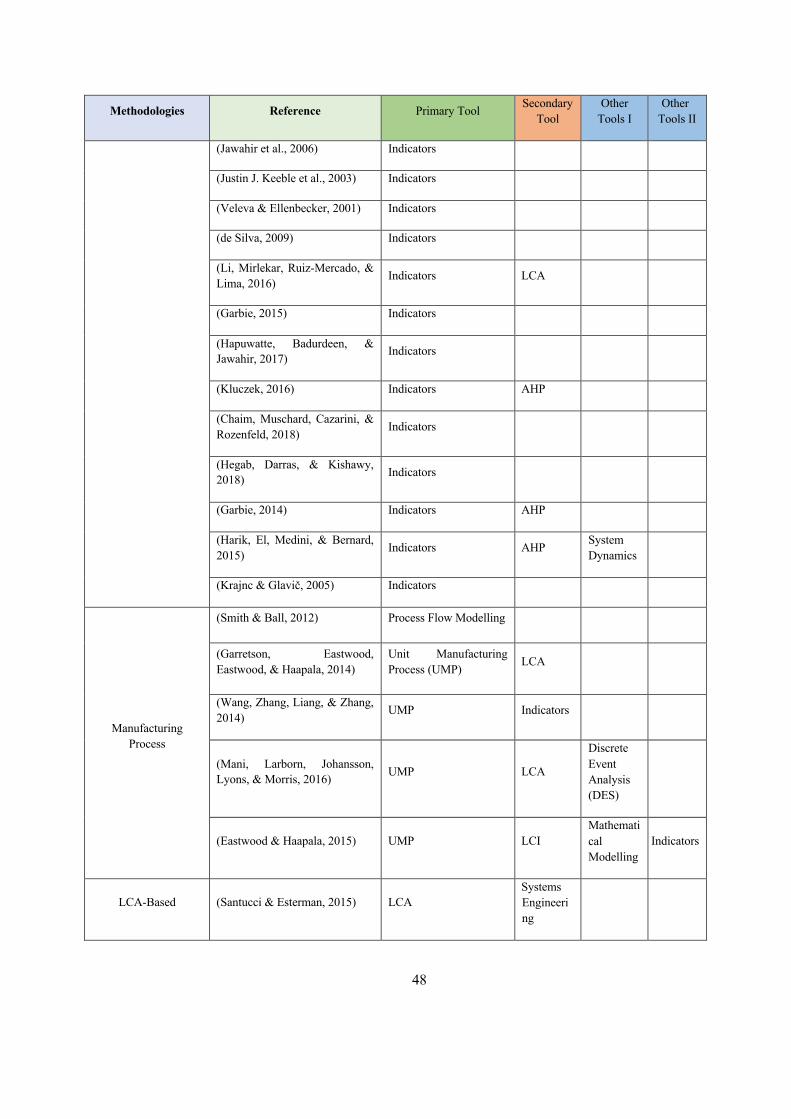
48
Methodologies Reference Primary Tool Secondary Tool
Other Tools I
Other Tools II
(Jawahir et al., 2006) Indicators
(Justin J. Keeble et al., 2003) Indicators
(Veleva & Ellenbecker, 2001) Indicators
(de Silva, 2009) Indicators
(Li, Mirlekar, Ruiz-Mercado, & Lima, 2016) Indicators LCA
(Garbie, 2015) Indicators
(Hapuwatte, Badurdeen, & Jawahir, 2017) Indicators
(Kluczek, 2016) Indicators AHP
(Chaim, Muschard, Cazarini, & Rozenfeld, 2018) Indicators
(Hegab, Darras, & Kishawy, 2018) Indicators
(Garbie, 2014) Indicators AHP
(Harik, El, Medini, & Bernard, 2015) Indicators AHP System
Dynamics
(Krajnc & Glavič, 2005) Indicators
Manufacturing Process
(Smith & Ball, 2012) Process Flow Modelling
(Garretson, Eastwood, Eastwood, & Haapala, 2014)
Unit Manufacturing Process (UMP) LCA
(Wang, Zhang, Liang, & Zhang, 2014) UMP Indicators
(Mani, Larborn, Johansson, Lyons, & Morris, 2016) UMP LCA
Discrete Event Analysis (DES)
(Eastwood & Haapala, 2015) UMP LCI Mathematical Modelling
Indicators
LCA-Based (Santucci & Esterman, 2015) LCA Systems Engineering
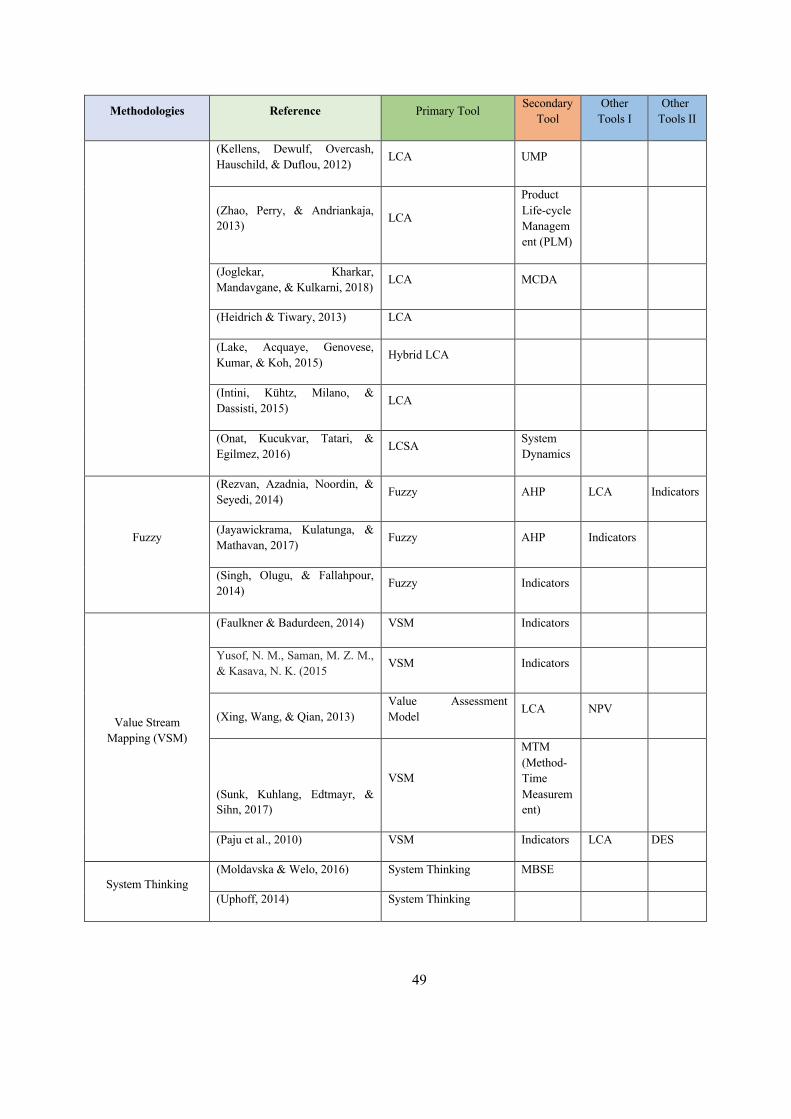
49
Methodologies Reference Primary Tool Secondary Tool
Other Tools I
Other Tools II
(Kellens, Dewulf, Overcash, Hauschild, & Duflou, 2012) LCA UMP
(Zhao, Perry, & Andriankaja, 2013) LCA
Product Life-cycle Management (PLM)
(Joglekar, Kharkar, Mandavgane, & Kulkarni, 2018) LCA MCDA
(Heidrich & Tiwary, 2013) LCA
(Lake, Acquaye, Genovese, Kumar, & Koh, 2015) Hybrid LCA
(Intini, Kühtz, Milano, & Dassisti, 2015) LCA
(Onat, Kucukvar, Tatari, & Egilmez, 2016) LCSA System
Dynamics
Fuzzy
(Rezvan, Azadnia, Noordin, & Seyedi, 2014) Fuzzy AHP LCA Indicators
(Jayawickrama, Kulatunga, & Mathavan, 2017) Fuzzy AHP Indicators
(Singh, Olugu, & Fallahpour, 2014) Fuzzy Indicators
Value Stream Mapping (VSM)
(Faulkner & Badurdeen, 2014) VSM Indicators
Yusof, N. M., Saman, M. Z. M., & Kasava, N. K. (2015 VSM Indicators
(Xing, Wang, & Qian, 2013) Value Assessment Model LCA NPV
(Sunk, Kuhlang, Edtmayr, & Sihn, 2017)
VSM
MTM (Method-Time Measurement)
(Paju et al., 2010) VSM Indicators LCA DES
System Thinking (Moldavska & Welo, 2016) System Thinking MBSE
(Uphoff, 2014) System Thinking
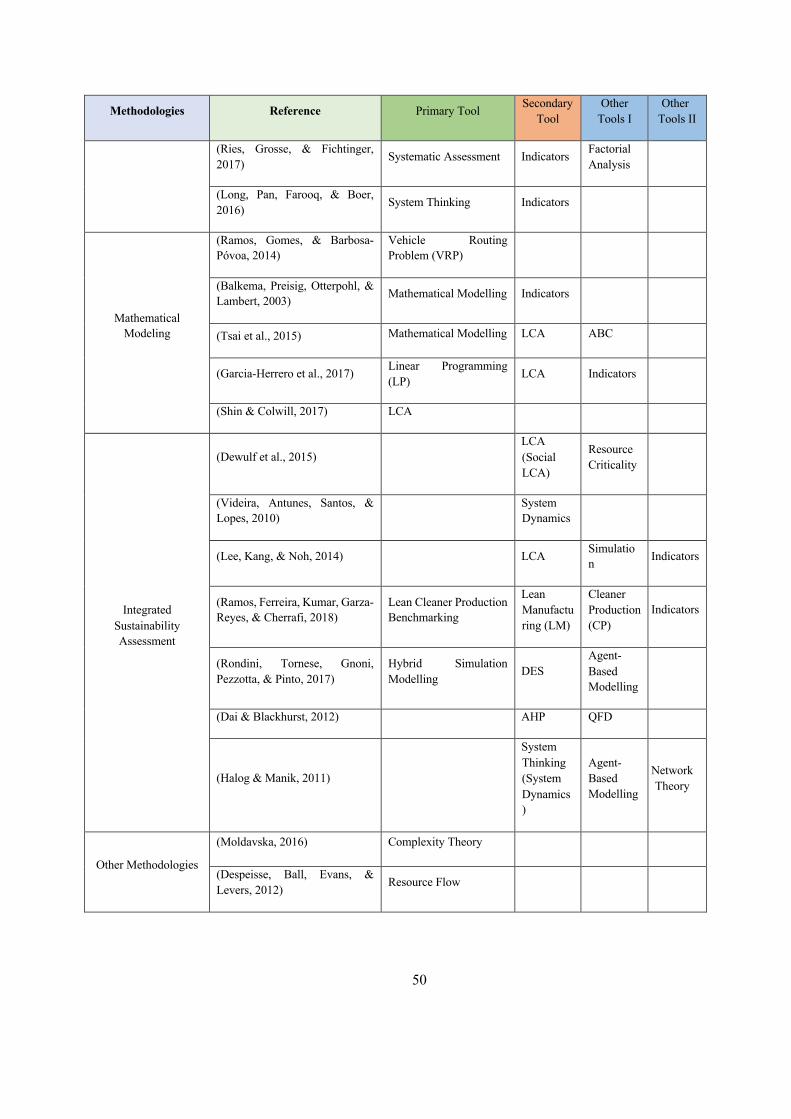
50
Methodologies Reference Primary Tool Secondary Tool
Other Tools I
Other Tools II
(Ries, Grosse, & Fichtinger, 2017) Systematic Assessment Indicators Factorial
Analysis
(Long, Pan, Farooq, & Boer, 2016) System Thinking Indicators
Mathematical Modeling
(Ramos, Gomes, & Barbosa-Póvoa, 2014)
Vehicle Routing Problem (VRP)
(Balkema, Preisig, Otterpohl, & Lambert, 2003) Mathematical Modelling Indicators
(Tsai et al., 2015) Mathematical Modelling LCA ABC
(Garcia-Herrero et al., 2017) Linear Programming (LP) LCA Indicators
(Shin & Colwill, 2017) LCA
Integrated Sustainability Assessment
(Dewulf et al., 2015) LCA (Social LCA)
Resource Criticality
(Videira, Antunes, Santos, & Lopes, 2010) System
Dynamics
(Lee, Kang, & Noh, 2014) LCA Simulation Indicators
(Ramos, Ferreira, Kumar, Garza-Reyes, & Cherrafi, 2018)
Lean Cleaner Production Benchmarking
Lean Manufacturing (LM)
Cleaner Production (CP)
Indicators
(Rondini, Tornese, Gnoni, Pezzotta, & Pinto, 2017)
Hybrid Simulation Modelling DES
Agent-Based Modelling
(Dai & Blackhurst, 2012) AHP QFD
(Halog & Manik, 2011)
System Thinking (System Dynamics)
Agent-Based Modelling
Network Theory
Other Methodologies
(Moldavska, 2016) Complexity Theory
(Despeisse, Ball, Evans, & Levers, 2012) Resource Flow
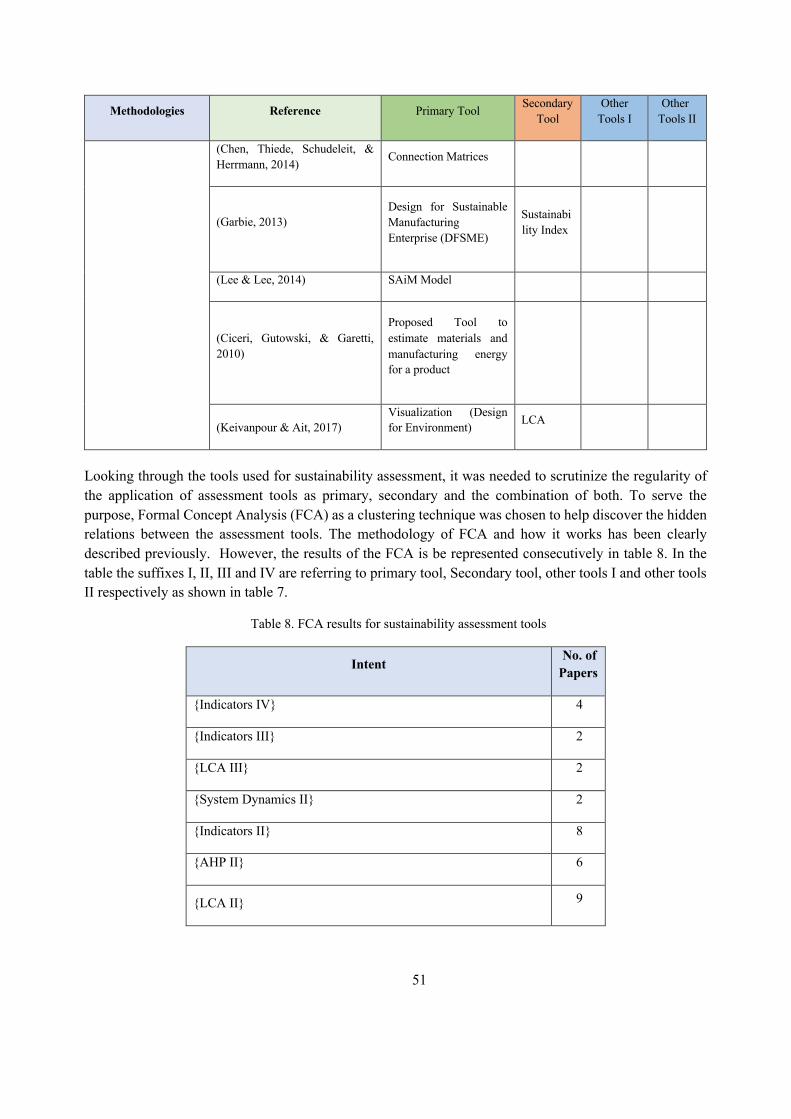
51
Methodologies Reference Primary Tool Secondary Tool
Other Tools I
Other Tools II
(Chen, Thiede, Schudeleit, & Herrmann, 2014) Connection Matrices
(Garbie, 2013) Design for Sustainable Manufacturing Enterprise (DFSME)
Sustainability Index
(Lee & Lee, 2014) SAiM Model
(Ciceri, Gutowski, & Garetti, 2010)
Proposed Tool to estimate materials and manufacturing energy for a product
(Keivanpour & Ait, 2017) Visualization (Design for Environment) LCA
Looking through the tools used for sustainability assessment, it was needed to scrutinize the regularity of the application of assessment tools as primary, secondary and the combination of both. To serve the purpose, Formal Concept Analysis (FCA) as a clustering technique was chosen to help discover the hidden relations between the assessment tools. The methodology of FCA and how it works has been clearly described previously. However, the results of the FCA is be represented consecutively in table 8. In the table the suffixes I, II, III and IV are referring to primary tool, Secondary tool, other tools I and other tools II respectively as shown in table 7.
Table 8. FCA results for sustainability assessment tools
Intent No. of
Papers
{Indicators IV} 4
{Indicators III} 2
{LCA III} 2
{System Dynamics II} 2
{Indicators II} 8
{AHP II} 6
{LCA II} 9
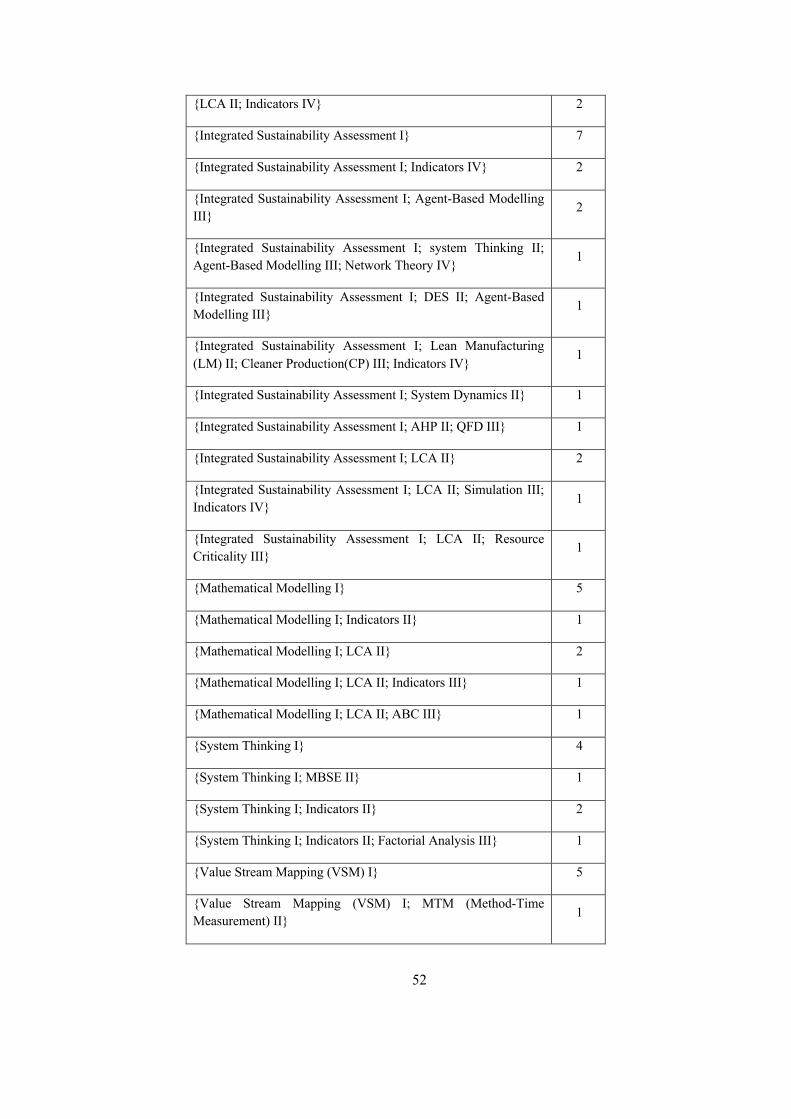
52
{LCA II; Indicators IV} 2
{Integrated Sustainability Assessment I} 7
{Integrated Sustainability Assessment I; Indicators IV} 2
{Integrated Sustainability Assessment I; Agent-Based Modelling III}
2
{Integrated Sustainability Assessment I; system Thinking II; Agent-Based Modelling III; Network Theory IV}
1
{Integrated Sustainability Assessment I; DES II; Agent-Based Modelling III}
1
{Integrated Sustainability Assessment I; Lean Manufacturing (LM) II; Cleaner Production(CP) III; Indicators IV}
1
{Integrated Sustainability Assessment I; System Dynamics II} 1
{Integrated Sustainability Assessment I; AHP II; QFD III} 1
{Integrated Sustainability Assessment I; LCA II} 2
{Integrated Sustainability Assessment I; LCA II; Simulation III; Indicators IV} 1
{Integrated Sustainability Assessment I; LCA II; Resource Criticality III}
1
{Mathematical Modelling I} 5
{Mathematical Modelling I; Indicators II} 1
{Mathematical Modelling I; LCA II} 2
{Mathematical Modelling I; LCA II; Indicators III} 1
{Mathematical Modelling I; LCA II; ABC III} 1
{System Thinking I} 4
{System Thinking I; MBSE II} 1
{System Thinking I; Indicators II} 2
{System Thinking I; Indicators II; Factorial Analysis III} 1
{Value Stream Mapping (VSM) I} 5
{Value Stream Mapping (VSM) I; MTM (Method-Time Measurement) II} 1
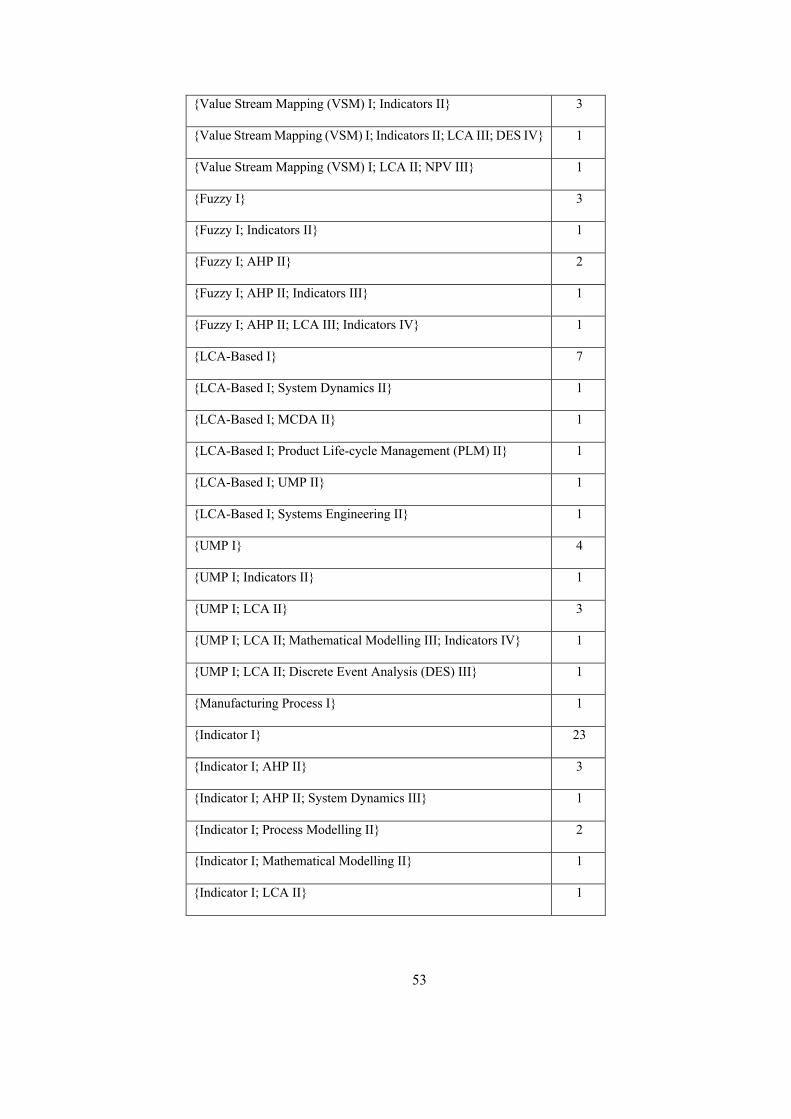
53
{Value Stream Mapping (VSM) I; Indicators II} 3
{Value Stream Mapping (VSM) I; Indicators II; LCA III; DES IV} 1
{Value Stream Mapping (VSM) I; LCA II; NPV III} 1
{Fuzzy I} 3
{Fuzzy I; Indicators II} 1
{Fuzzy I; AHP II} 2
{Fuzzy I; AHP II; Indicators III} 1
{Fuzzy I; AHP II; LCA III; Indicators IV} 1
{LCA-Based I} 7
{LCA-Based I; System Dynamics II} 1
{LCA-Based I; MCDA II} 1
{LCA-Based I; Product Life-cycle Management (PLM) II} 1
{LCA-Based I; UMP II} 1
{LCA-Based I; Systems Engineering II} 1
{UMP I} 4
{UMP I; Indicators II} 1
{UMP I; LCA II} 3
{UMP I; LCA II; Mathematical Modelling III; Indicators IV} 1
{UMP I; LCA II; Discrete Event Analysis (DES) III} 1
{Manufacturing Process I} 1
{Indicator I} 23
{Indicator I; AHP II} 3
{Indicator I; AHP II; System Dynamics III} 1
{Indicator I; Process Modelling II} 2
{Indicator I; Mathematical Modelling II} 1
{Indicator I; LCA II} 1
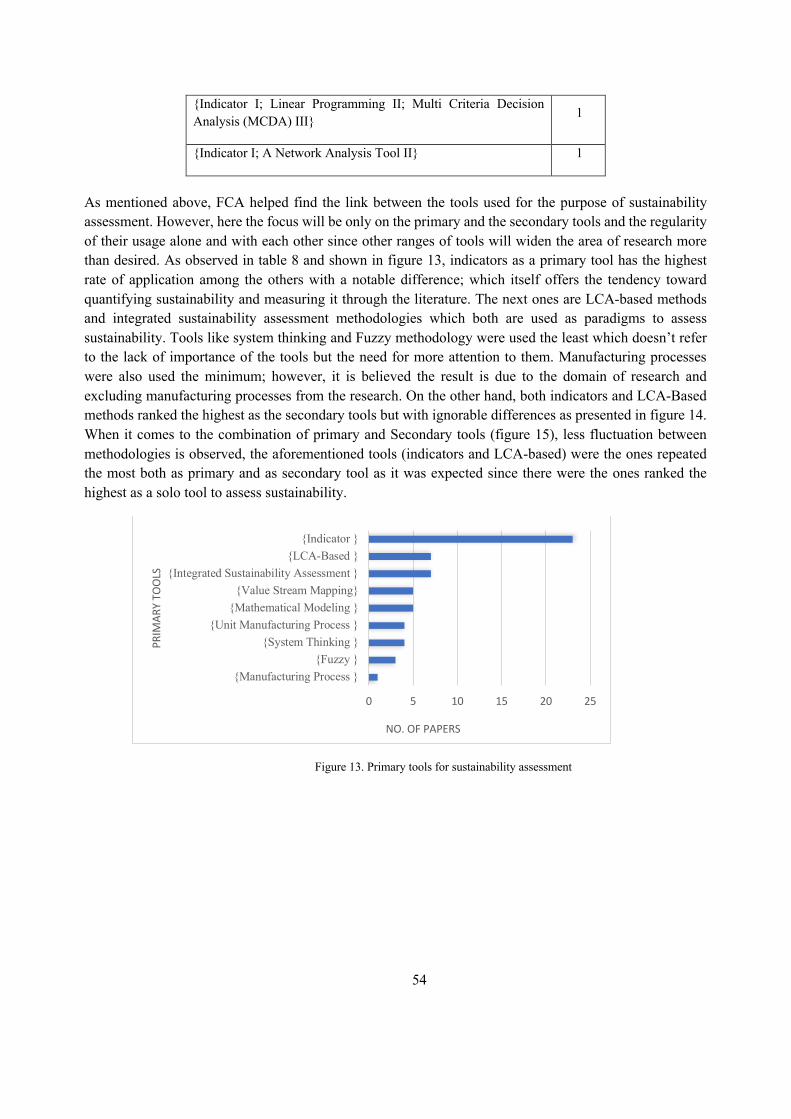
54
{Indicator I; Linear Programming II; Multi Criteria Decision Analysis (MCDA) III} 1
{Indicator I; A Network Analysis Tool II} 1
As mentioned above, FCA helped find the link between the tools used for the purpose of sustainability assessment. However, here the focus will be only on the primary and the secondary tools and the regularity of their usage alone and with each other since other ranges of tools will widen the area of research more than desired. As observed in table 8 and shown in figure 13, indicators as a primary tool has the highest rate of application among the others with a notable difference; which itself offers the tendency toward quantifying sustainability and measuring it through the literature. The next ones are LCA-based methods and integrated sustainability assessment methodologies which both are used as paradigms to assess sustainability. Tools like system thinking and Fuzzy methodology were used the least which doesn’t refer to the lack of importance of the tools but the need for more attention to them. Manufacturing processes were also used the minimum; however, it is believed the result is due to the domain of research and excluding manufacturing processes from the research. On the other hand, both indicators and LCA-Based methods ranked the highest as the secondary tools but with ignorable differences as presented in figure 14. When it comes to the combination of primary and Secondary tools (figure 15), less fluctuation between methodologies is observed, the aforementioned tools (indicators and LCA-based) were the ones repeated the most both as primary and as secondary tool as it was expected since there were the ones ranked the highest as a solo tool to assess sustainability.
Figure 13. Primary tools for sustainability assessment
{Manufacturing Process }{Fuzzy }
{System Thinking }{Unit Manufacturing Process }
{Mathematical Modeling }{Value Stream Mapping}
{Integrated Sustainability Assessment }{LCA-Based }
{Indicator }
0 5 10 15 20 25
PRIM
ARY
TOO
LS
NO. OF PAPERS
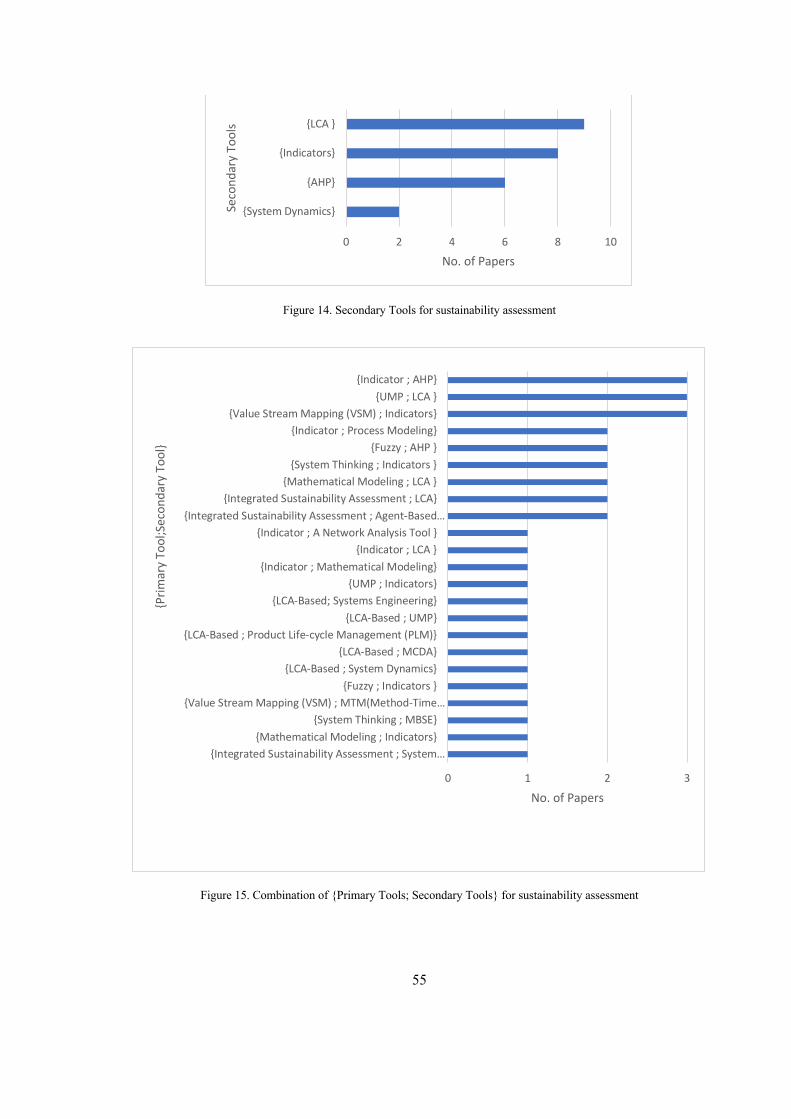
55
Figure 14. Secondary Tools for sustainability assessment
Figure 15. Combination of {Primary Tools; Secondary Tools} for sustainability assessment
0 2 4 6 8 10
{System Dynamics}
{AHP}
{Indicators}
{LCA }
No. of Papers
Seco
ndar
y To
ols
0 1 2 3
{Integrated Sustainability Assessment ; System…{Mathematical Modeling ; Indicators}
{System Thinking ; MBSE}{Value Stream Mapping (VSM) ; MTM(Method-Time…
{Fuzzy ; Indicators }{LCA-Based ; System Dynamics}
{LCA-Based ; MCDA}{LCA-Based ; Product Life-cycle Management (PLM)}
{LCA-Based ; UMP}{LCA-Based; Systems Engineering}
{UMP ; Indicators}{Indicator ; Mathematical Modeling}
{Indicator ; LCA }{Indicator ; A Network Analysis Tool }
{Integrated Sustainability Assessment ; Agent-Based…{Integrated Sustainability Assessment ; LCA}
{Mathematical Modeling ; LCA }{System Thinking ; Indicators }
{Fuzzy ; AHP }{Indicator ; Process Modeling}
{Value Stream Mapping (VSM) ; Indicators}{UMP ; LCA }
{Indicator ; AHP}
No. of Papers
{Prim
ary
Tool
;Sec
onda
ry T
ool}
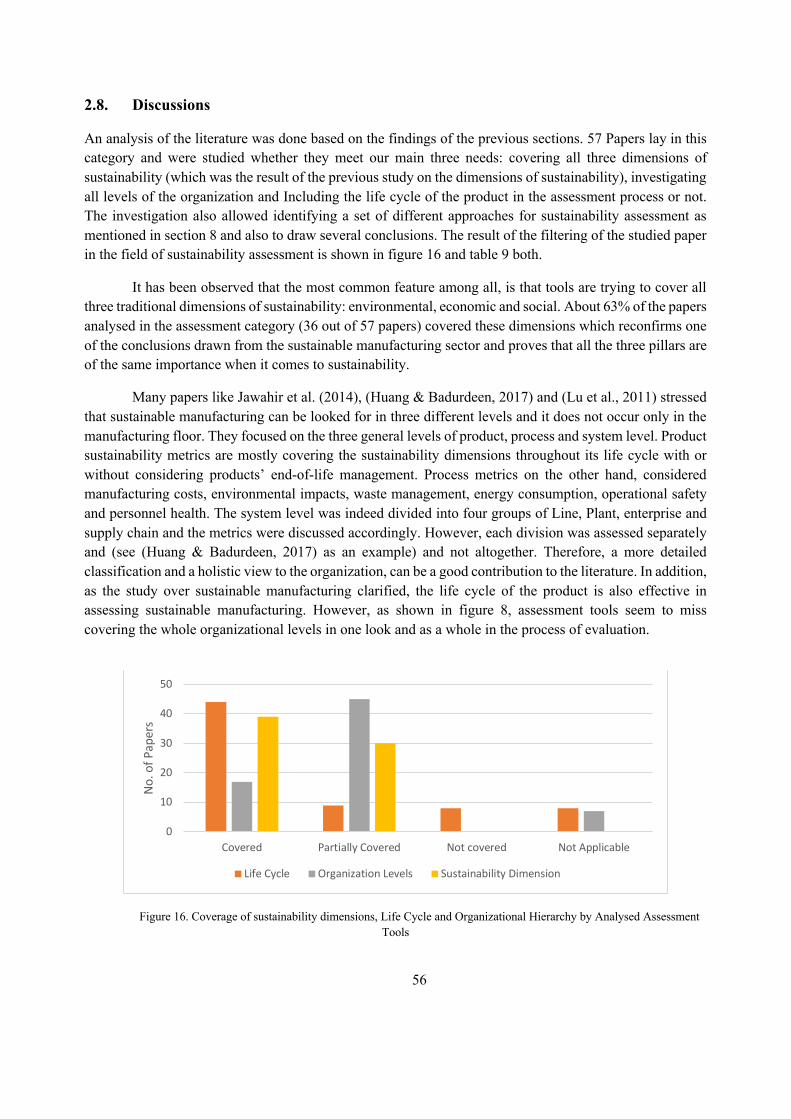
56
2.8. Discussions
An analysis of the literature was done based on the findings of the previous sections. 57 Papers lay in this category and were studied whether they meet our main three needs: covering all three dimensions of sustainability (which was the result of the previous study on the dimensions of sustainability), investigating all levels of the organization and Including the life cycle of the product in the assessment process or not. The investigation also allowed identifying a set of different approaches for sustainability assessment as mentioned in section 8 and also to draw several conclusions. The result of the filtering of the studied paper in the field of sustainability assessment is shown in figure 16 and table 9 both.
It has been observed that the most common feature among all, is that tools are trying to cover all three traditional dimensions of sustainability: environmental, economic and social. About 63% of the papers analysed in the assessment category (36 out of 57 papers) covered these dimensions which reconfirms one of the conclusions drawn from the sustainable manufacturing sector and proves that all the three pillars are of the same importance when it comes to sustainability.
Many papers like Jawahir et al. (2014), (Huang & Badurdeen, 2017) and (Lu et al., 2011) stressed that sustainable manufacturing can be looked for in three different levels and it does not occur only in the manufacturing floor. They focused on the three general levels of product, process and system level. Product sustainability metrics are mostly covering the sustainability dimensions throughout its life cycle with or without considering products’ end-of-life management. Process metrics on the other hand, considered manufacturing costs, environmental impacts, waste management, energy consumption, operational safety and personnel health. The system level was indeed divided into four groups of Line, Plant, enterprise and supply chain and the metrics were discussed accordingly. However, each division was assessed separately and (see (Huang & Badurdeen, 2017) as an example) and not altogether. Therefore, a more detailed classification and a holistic view to the organization, can be a good contribution to the literature. In addition, as the study over sustainable manufacturing clarified, the life cycle of the product is also effective in assessing sustainable manufacturing. However, as shown in figure 8, assessment tools seem to miss covering the whole organizational levels in one look and as a whole in the process of evaluation.
Figure 16. Coverage of sustainability dimensions, Life Cycle and Organizational Hierarchy by Analysed Assessment Tools
0
10
20
30
40
50
Covered Partially Covered Not covered Not Applicable
No.
of P
aper
s
Life Cycle Organization Levels Sustainability Dimension
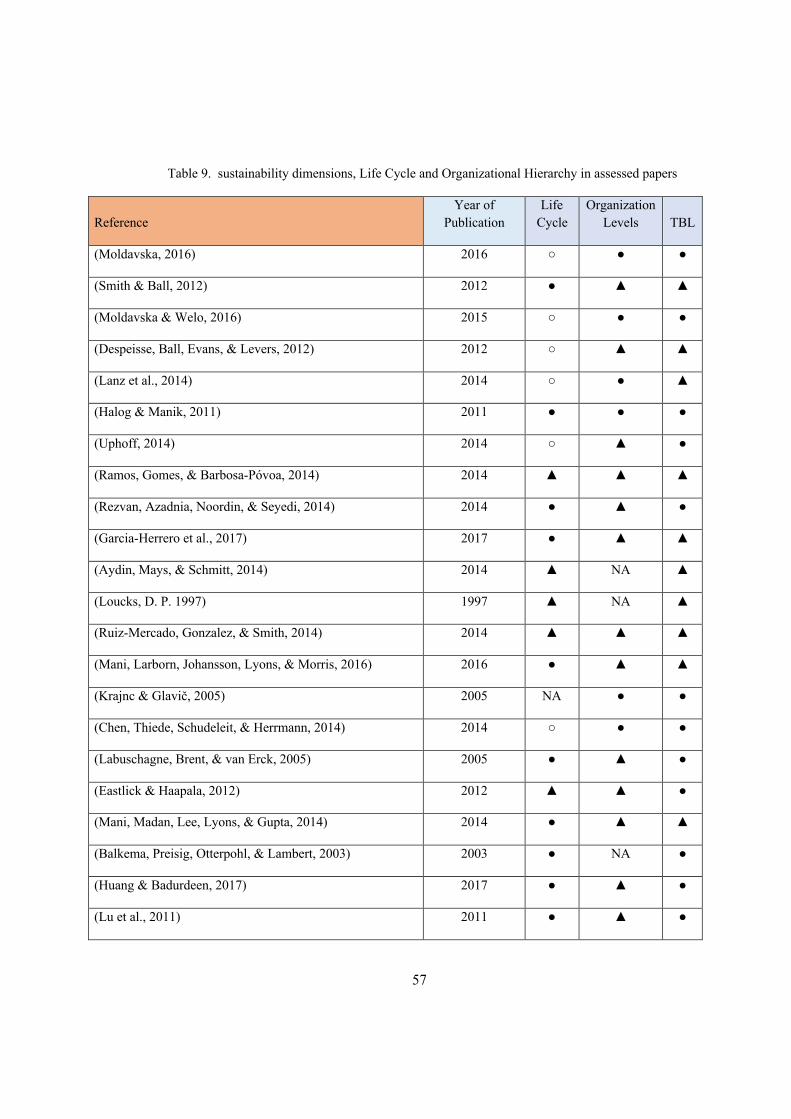
57
Table 9. sustainability dimensions, Life Cycle and Organizational Hierarchy in assessed papers
Reference Year of
Publication Life
Cycle Organization
Levels TBL
(Moldavska, 2016) 2016 ○ ● ●
(Smith & Ball, 2012) 2012 ● ▲ ▲
(Moldavska & Welo, 2016) 2015 ○ ● ●
(Despeisse, Ball, Evans, & Levers, 2012) 2012 ○ ▲ ▲
(Lanz et al., 2014) 2014 ○ ● ▲
(Halog & Manik, 2011) 2011 ● ● ●
(Uphoff, 2014) 2014 ○ ▲ ●
(Ramos, Gomes, & Barbosa-Póvoa, 2014) 2014 ▲ ▲ ▲
(Rezvan, Azadnia, Noordin, & Seyedi, 2014) 2014 ● ▲ ●
(Garcia-Herrero et al., 2017) 2017 ● ▲ ▲
(Aydin, Mays, & Schmitt, 2014) 2014 ▲ NA ▲
(Loucks, D. P. 1997) 1997 ▲ NA ▲
(Ruiz-Mercado, Gonzalez, & Smith, 2014) 2014 ▲ ▲ ▲
(Mani, Larborn, Johansson, Lyons, & Morris, 2016) 2016 ● ▲ ▲
(Krajnc & Glavič, 2005) 2005 NA ● ●
(Chen, Thiede, Schudeleit, & Herrmann, 2014) 2014 ○ ● ●
(Labuschagne, Brent, & van Erck, 2005) 2005 ● ▲ ●
(Eastlick & Haapala, 2012) 2012 ▲ ▲ ●
(Mani, Madan, Lee, Lyons, & Gupta, 2014) 2014 ● ▲ ▲
(Balkema, Preisig, Otterpohl, & Lambert, 2003) 2003 ● NA ●
(Huang & Badurdeen, 2017) 2017 ● ▲ ●
(Lu et al., 2011) 2011 ● ▲ ●
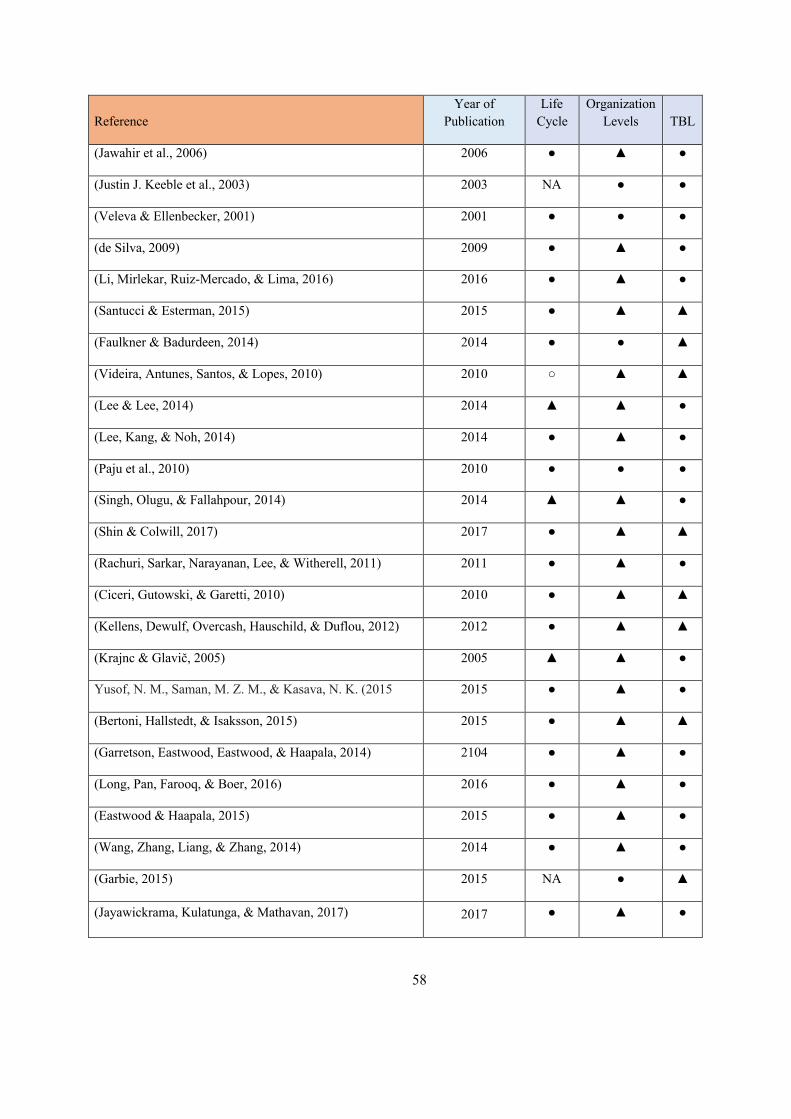
58
Reference Year of
Publication Life
Cycle Organization
Levels TBL
(Jawahir et al., 2006) 2006 ● ▲ ●
(Justin J. Keeble et al., 2003) 2003 NA ● ●
(Veleva & Ellenbecker, 2001) 2001 ● ● ●
(de Silva, 2009) 2009 ● ▲ ●
(Li, Mirlekar, Ruiz-Mercado, & Lima, 2016) 2016 ● ▲ ●
(Santucci & Esterman, 2015) 2015 ● ▲ ▲
(Faulkner & Badurdeen, 2014) 2014 ● ● ▲
(Videira, Antunes, Santos, & Lopes, 2010) 2010 ○ ▲ ▲
(Lee & Lee, 2014) 2014 ▲ ▲ ●
(Lee, Kang, & Noh, 2014) 2014 ● ▲ ●
(Paju et al., 2010) 2010 ● ● ●
(Singh, Olugu, & Fallahpour, 2014) 2014 ▲ ▲ ●
(Shin & Colwill, 2017) 2017 ● ▲ ▲
(Rachuri, Sarkar, Narayanan, Lee, & Witherell, 2011) 2011 ● ▲ ●
(Ciceri, Gutowski, & Garetti, 2010) 2010 ● ▲ ▲
(Kellens, Dewulf, Overcash, Hauschild, & Duflou, 2012) 2012 ● ▲ ▲
(Krajnc & Glavič, 2005) 2005 ▲ ▲ ●
Yusof, N. M., Saman, M. Z. M., & Kasava, N. K. (2015 2015 ● ▲ ●
(Bertoni, Hallstedt, & Isaksson, 2015) 2015 ● ▲ ▲
(Garretson, Eastwood, Eastwood, & Haapala, 2014) 2104 ● ▲ ●
(Long, Pan, Farooq, & Boer, 2016) 2016 ● ▲ ●
(Eastwood & Haapala, 2015) 2015 ● ▲ ●
(Wang, Zhang, Liang, & Zhang, 2014) 2014 ● ▲ ●
(Garbie, 2015) 2015 NA ● ▲
(Jayawickrama, Kulatunga, & Mathavan, 2017) 2017 ● ▲ ●
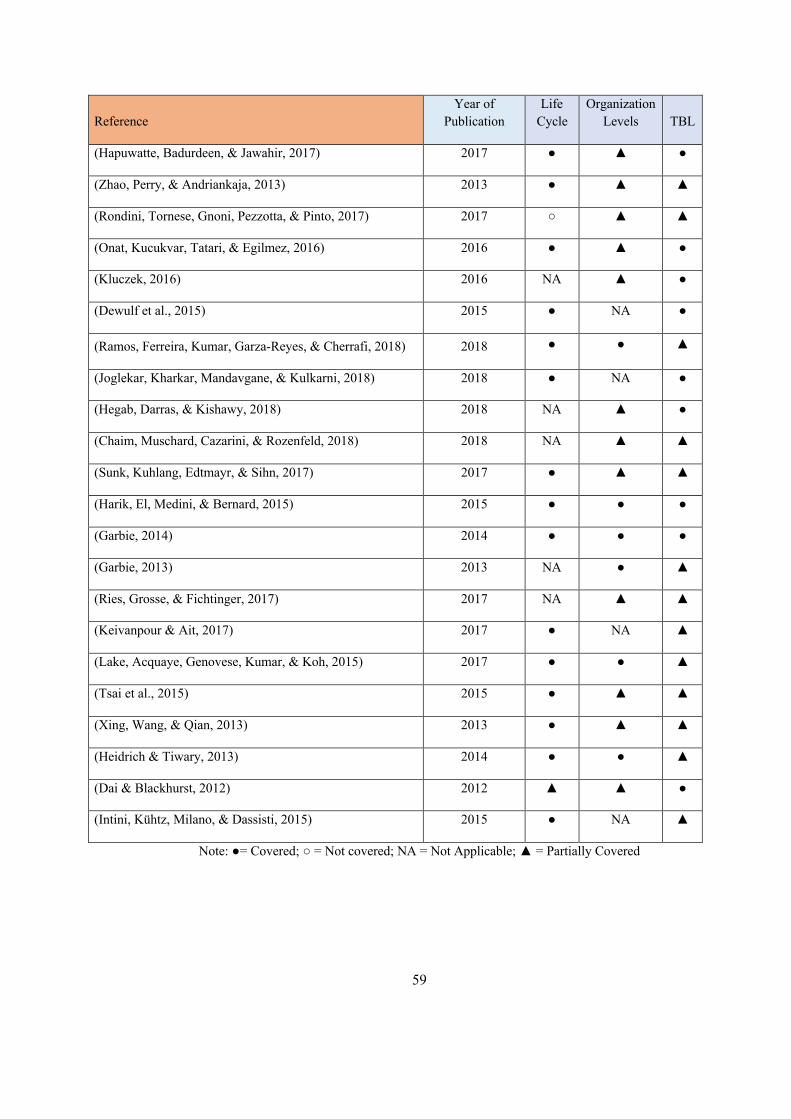
59
Reference Year of
Publication Life
Cycle Organization
Levels TBL
(Hapuwatte, Badurdeen, & Jawahir, 2017) 2017 ● ▲ ●
(Zhao, Perry, & Andriankaja, 2013) 2013 ● ▲ ▲
(Rondini, Tornese, Gnoni, Pezzotta, & Pinto, 2017) 2017 ○ ▲ ▲
(Onat, Kucukvar, Tatari, & Egilmez, 2016) 2016 ● ▲ ●
(Kluczek, 2016) 2016 NA ▲ ●
(Dewulf et al., 2015) 2015 ● NA ●
(Ramos, Ferreira, Kumar, Garza-Reyes, & Cherrafi, 2018) 2018 ● ● ▲
(Joglekar, Kharkar, Mandavgane, & Kulkarni, 2018) 2018 ● NA ●
(Hegab, Darras, & Kishawy, 2018) 2018 NA ▲ ●
(Chaim, Muschard, Cazarini, & Rozenfeld, 2018) 2018 NA ▲ ▲
(Sunk, Kuhlang, Edtmayr, & Sihn, 2017) 2017 ● ▲ ▲
(Harik, El, Medini, & Bernard, 2015) 2015 ● ● ●
(Garbie, 2014) 2014 ● ● ●
(Garbie, 2013) 2013 NA ● ▲
(Ries, Grosse, & Fichtinger, 2017) 2017 NA ▲ ▲
(Keivanpour & Ait, 2017) 2017 ● NA ▲
(Lake, Acquaye, Genovese, Kumar, & Koh, 2015) 2017 ● ● ▲
(Tsai et al., 2015) 2015 ● ▲ ▲
(Xing, Wang, & Qian, 2013) 2013 ● ▲ ▲
(Heidrich & Tiwary, 2013) 2014 ● ● ▲
(Dai & Blackhurst, 2012) 2012 ▲ ▲ ●
(Intini, Kühtz, Milano, & Dassisti, 2015) 2015 ● NA ▲
Note: ●= Covered; ○ = Not covered; NA = Not Applicable; ▲ = Partially Covered
60
2.9. Conclusion
The chapter presents a review on sustainability assessment in manufacturing organizations. To this extent, sustainable manufacturing was read through and its fundamentals were extracted in former chapter of the work. Indeed, sustainable manufacturing was analysed in different dimensions and sub-dimensions. It was observed that among dimensions like social, technological, economic, environmental, technology, efficiency and performance management, traditional three namely: Economic, Environmental and social, also known as the Triple Bottom Line (TBL), were the ones with the most concentration on. The paper continued the previous path and did investigations over the criteria in which sustainable manufacturing was employed. The inductive work was resulted in three sustainable manufacturing systems: Facility design and operations, production planning and control and sustainable supply chain network design. Through the work the tendency toward closing the material loop and to transform the life cycle of the product to support product and material reutilization and product end-of-life management was a motive to investigate the concept of 6R (Reduce, Reuse, Recover, Redesign, Remanufacture and Recycle). Exploring the aforementioned topic, deliberated the fact to consider the total life cycle of the product while exploiting sustainable manufacturing.
Moving from sustainable manufacturing to sustainability assessment, different methodologies to assess sustainability with, and also the levels in which assessment occurs were explored. Papers were divided based on the primary tool they used for assessment. The secondary and other tools in case of application were defined in the categories as well. An FCA analysis was run based on the primary or secondary tools for sustainability assessment and it was found out that the tendency in assessment is now towards quantifying sustainability by the help of indicators.
61
CHAPTER 3 SUSTAINABILITY ASSESSMENT OF
MANUFACTURING ORGANIZATIONS BASED ON INDICATOR SETS
3.1. Introduction
The goal of any business today is to come up with innovative trends to raise their competitive power, increase their profit, reduce risks, gain more trust to attract investments, satisfy customers while creating a much healthier environment. Apart from the urgent need for environmental actions, in fact, all companies across the world are facing with elevated expectations of customers on one hand and increasing prices for materials, energy and compliance on the other. Therefore, the sustainability target seems to become a vital opportunity and has changed face from a show-off achievement to a competitive imperative and a must-have in today’s market. In addition, the bottom up demand of customers for more sustainable products and the top down need to comply with the governmental rules and regulation, made the manufacturing organizations think about ways, tools and methodologies to evaluate and assess the level of sustainability in the whole manufacturing system. Therefore, it is safe to say that Sustainable Assessment of manufacturing operations is one of the essentials of sustainable development in an organization. The concept of sustainability assessment is introduced to offer new perspectives to impact assessment geared toward planning and decision making on sustainable development (Hacking & Guthrie, 2008b).
Deyvust (Hardi & Zdan, 1997) defined sustainability assessment as “a methodology” that can help decision-makers and policy-makers decide what actions they should take and should not take in an attempt to make society more sustainable. The need for assessment was recognized more than forty years ago. As the pressure of the demand for sustainability increases on the manufacturing companies, the urge for assessing their performance has been reinforced. However, at the time the concept appeared, the most focus was on environmental impacts only, which was gradually expanded to the other dimensions of sustainability (social) (Pope, Annandale, & Morrison-Saunders, 2004b) while economic dimension was a typical approach followed. Sustainability Assessment (SA) is known to be a complex task and conducted for supporting decision making and policy in a broad environmental, economic and social context (Sala et al., 2015a). Various methods of assessment have been accomplished through the literature so far, trying to find a way for companies to assess their sustainability state, help the companies choose between sustainable solutions, define and solve problems on the way to sustainability and identify potential solutions. Among all methods, assessment through adopting indicators are increasingly recognized and it is known to be a tool for policymakers to convey performance information in environmental, economic, social and development fields (M. Nardo, Saisana, Saltelli, & Tarantola, 2005) Conversely, Indicators can summarize, quantify, condense and analyse enormous and complicated concepts and transform them to manageable and applicable information for the corporate (Godfrey & Todd, 2001; Warhurst, 2002). Sustainable
62
development indicators, in general, can serve to assess and evaluate the performance, provide trends on improvements plus warnings in case the corporate is facing a drop off in features of sustainability and provide information to decision makers(Lundin, 2003; Mayer-Spohn, 2004). They can also define the state of the environmental, economic and social standing of the organizations. They set up a simultaneous qualitative and quantitative assessment in addition to forming a multi-criteria analysis which is more favourable comparing to subjective evaluation due to the (partially or completely) conflicting nature of the three traditional dimensions of sustainability (Milutinović, Stefanović, Dassisti, Marković, & Vučković, 2014). Therefore, choice of indicators inside organizations can represent priorities of the organization and to define strategic and political goals as well as its objectives (Corbire-Nicollier, Blanc, & Erkman, 2011). Accordingly, the aim of this study is to get deep into the definition of the indicators applied for sustainability assessment to pave the path to the comparison of organizations on their strategies toward assessing their sustainability status. To serve this purpose, an analysis has been conducted on the sustainability reports of 100 manufacturing organizations and a Formal Concept analysis (FCA) was run on the results to get deep into the definition and choice of indicators by the organizations. The rest of the paper will discuss the analysis procedure and its sample. Furthermore, the FCA results will be discussed and a comparison of the observed trends toward the definition of sustainability in scientific domain and the practice domain will be made. Finally, the conclusion and the future work is presented.
3.2. Analysis
According to Bellagio principles (Hardi & Zdan, 1997), the assessment process should have “practical focus” by which the assessment of progress toward sustainable development should be based on: a) an explicit set of categories or an organizing framework that links vision and goals to indicators and assessment criteria, b) a limited number of key issues for analysis, c) a limited number of indicators or indicator combinations to provide a clearer signal of progress and d) standardizing measurement wherever possible to permit comparison. However, the abundance of the sustainability indicators created a huge confusion for manufacturers when it comes to indicators selection and sustainability assessment (Joung, Carrell, Sarkar, & Feng, 2013b). In order to increase the reliability and effectiveness of the indicators, several standard sets, guidelines and frameworks have been introduced by international initiatives. To this extent, organizations’ choice of indicator can be a representative to their strategies toward sustainability. Therefore, to explore the sustainability assessment in a manufacturing organization, inspecting their decisions on indicators can be conductive. To serve the purpose, an analysis on sustainability reports of organizations which use a defined and standard set of indicators needs to be run, to pave the path toward the comparison of the sustainability definition in the organizations. Hence, prior to the analysis itself, a study of the existing sets of indicators is here performed to clarify the differences between the sets and raising the awareness on the applicability and adjustability of the indicators. The study, as represented in the following, will be led to choosing a standardized set of indicators.
3.2.1. Review on the Standard sets of indicators
In the literature standard sets of indicators are presented. They were studied and analysed according to the fulfilment of the following criteria: 1) Level of Application: As the aim of study clearly stated, the assessment needs to be done throughout the whole organization. Therefore, the tools which are not
63
applicable or adaptable for the factory levels were excluded from the study. 2) Cross-Industry Comparison: The chosen set of indicators needs to have generic applicability to enable the decision makers to make comparison between various organization without limitation. Thus, the product/process- specific sets limit the general use of the proposed study. 3) Holistic View over Sustainability: As mentioned in Bellagio principle (Hardi & Zdan, 1997), “Assessment of progress toward sustainable development should: consider the well-being of social, ecological, and economic sub-systems, their state as well as the direction and rate of change of that state, of their component parts, and the interaction between parts.” Therefore, the tools which are specified on just one feature, i.e. environmentally focused ones, might limit the assessment in the proposed study and will not be considered.
As shown in table 10, unlike OECD, RPA and DJSI, most of the tools covered all three dimensions of sustainability. Some like ITT Flyget sustainability index, General Motors, Composite Sustainable Development Index and Ford of Europe were product or process specific and were too much in details that made the general applicability of the tools limited; at the same time tools such as Barometer of Sustainability were too general that makes the assessment validity and data accuracy a bit questionable. On the other hand, SDF, UN-CSD are reasonable sets but since the base has been defined for the country level, prior adaptation is required in case of willingness to employ them on the factory level which makes the process of assessment, time and resource consuming. Nevertheless, tools like GRI, NIST and LCSP appear to meet all our needs. However, NIST seems to be not an open source set of Indicator anymore and LCSP considers a limited and generalized assessment. therefore, GRI seems to be an effective selection of standard indicators which is applicable on the organization, product and process level while it is giving a holistic look at sustainability in a reasonable amount of time and it makes cross-company comparison feasible. Indicators of GRI which are related to the three dimensions of sustainability are available through the website ( https://www.globalreporting.org/standards/gri-standards-download-center/)
3.2.2. The Sample of 100 organisations
Based on the aforementioned, the set GRI was chosen for the purposed analysis. Among the verified sustainability assessment reports available on the website of GRI (https://www.globalreporting.org/reportregistration/verifiedreports# ), the first 100 manufacturing ones related to the years 2016 and 2017 were chosen regardless of the size, country and the field of activity. The reports were all inspected for GRI indicators they encompass in three traditional sustainability dimensions: economic, environmental and social.
3.2.3. Results and Discussion
As previously indicated, the organizations reports were studied and the GRI indicators related to the three traditional sustainability dimensions were scrutinized. Then, each dimension was analysed separately with the help of Formal Concept Analysis (FCA). Formal Concept Analysis (FCA) as a clustering technique was chosen to assist the interpretation of the indicators used for sustainability assessment within the organizations. FCA is a branch of lattice theory (Wille, 1982b) and it is best used for knowledge representation, data analysis and information management. It detects conceptual structures in data and consequently extraction of dependencies within the data by forming a collection of objects and their properties (Mezni & Sellami, 2017b; Wajnberg, Lezoche, Massé, Valtchev, & Panetto, 2017b). FCA
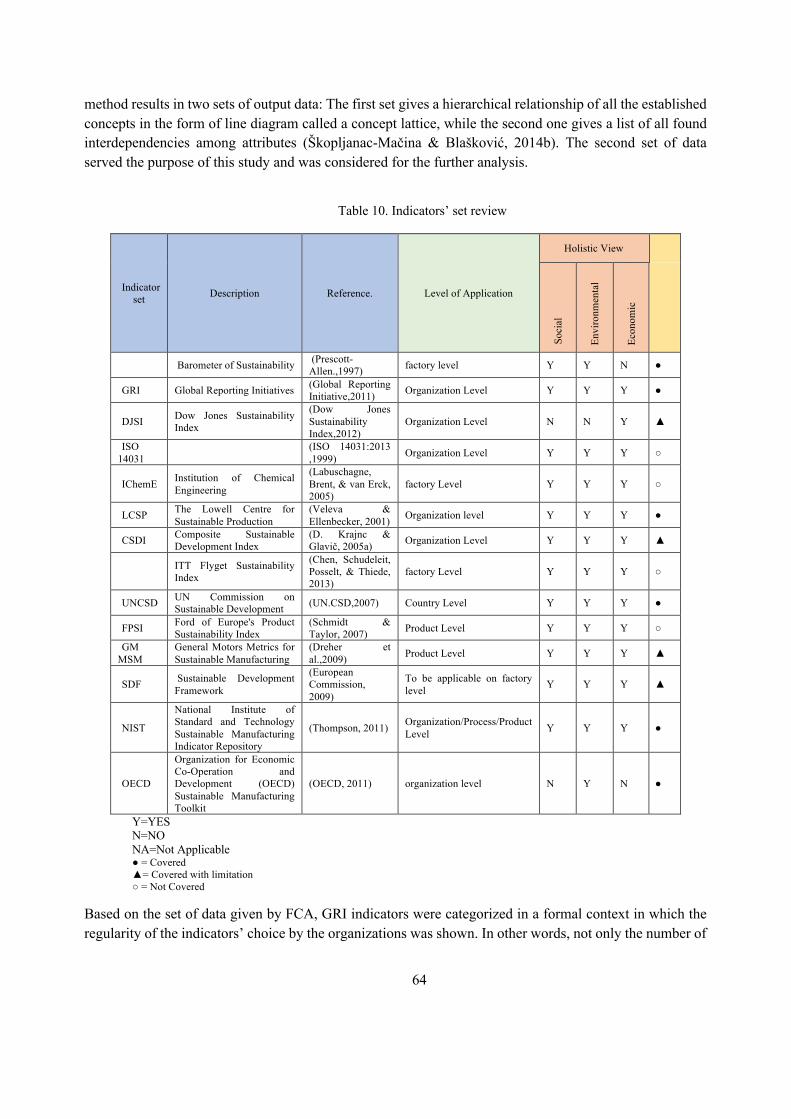
64
method results in two sets of output data: The first set gives a hierarchical relationship of all the established concepts in the form of line diagram called a concept lattice, while the second one gives a list of all found interdependencies among attributes (Škopljanac-Mačina & Blašković, 2014b). The second set of data served the purpose of this study and was considered for the further analysis.
Table 10. Indicators’ set review
Indicator set Description Reference. Level of Application
Holistic View
Cro
ss-
Indu
stry
C
ompa
rison
Soci
al
Envi
ronm
enta
l
Econ
omic
Barometer of Sustainability (Prescott-Allen.,1997) factory level Y Y N ●
GRI Global Reporting Initiatives (Global Reporting Initiative,2011) Organization Level Y Y Y ●
DJSI Dow Jones Sustainability Index
(Dow Jones Sustainability Index,2012)
Organization Level N N Y ▲
ISO 14031 (ISO 14031:2013
,1999) Organization Level Y Y Y ○
IChemE Institution of Chemical Engineering
(Labuschagne, Brent, & van Erck, 2005)
factory Level Y Y Y ○
LCSP The Lowell Centre for Sustainable Production
(Veleva & Ellenbecker, 2001) Organization level Y Y Y ●
CSDI Composite Sustainable Development Index
(D. Krajnc & Glavič, 2005a) Organization Level Y Y Y ▲
ITT Flyget Sustainability Index
(Chen, Schudeleit, Posselt, & Thiede, 2013)
factory Level Y Y Y ○
UNCSD UN Commission on Sustainable Development (UN.CSD,2007) Country Level Y Y Y ●
FPSI Ford of Europe's Product Sustainability Index
(Schmidt & Taylor, 2007) Product Level Y Y Y ○
GM MSM
General Motors Metrics for Sustainable Manufacturing
(Dreher et al.,2009) Product Level Y Y Y ▲
SDF Sustainable Development Framework
(European Commission, 2009)
To be applicable on factory level Y Y Y ▲
NIST
National Institute of Standard and Technology Sustainable Manufacturing Indicator Repository
(Thompson, 2011) Organization/Process/Product Level Y Y Y ●
OECD
Organization for Economic Co-Operation and Development (OECD) Sustainable Manufacturing Toolkit
(OECD, 2011) organization level N Y N ●
Y=YES N=NO NA=Not Applicable ● = Covered ▲= Covered with limitation ○ = Not Covered
Based on the set of data given by FCA, GRI indicators were categorized in a formal context in which the regularity of the indicators’ choice by the organizations was shown. In other words, not only the number of
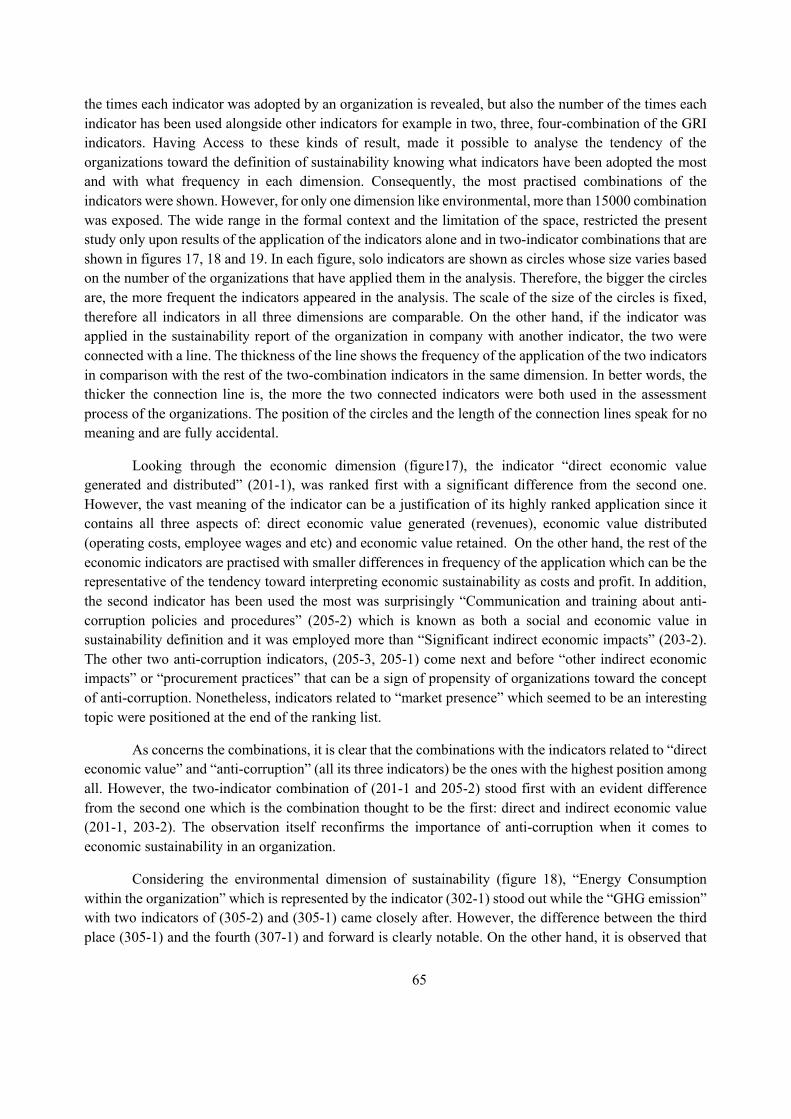
65
the times each indicator was adopted by an organization is revealed, but also the number of the times each indicator has been used alongside other indicators for example in two, three, four-combination of the GRI indicators. Having Access to these kinds of result, made it possible to analyse the tendency of the organizations toward the definition of sustainability knowing what indicators have been adopted the most and with what frequency in each dimension. Consequently, the most practised combinations of the indicators were shown. However, for only one dimension like environmental, more than 15000 combination was exposed. The wide range in the formal context and the limitation of the space, restricted the present study only upon results of the application of the indicators alone and in two-indicator combinations that are shown in figures 17, 18 and 19. In each figure, solo indicators are shown as circles whose size varies based on the number of the organizations that have applied them in the analysis. Therefore, the bigger the circles are, the more frequent the indicators appeared in the analysis. The scale of the size of the circles is fixed, therefore all indicators in all three dimensions are comparable. On the other hand, if the indicator was applied in the sustainability report of the organization in company with another indicator, the two were connected with a line. The thickness of the line shows the frequency of the application of the two indicators in comparison with the rest of the two-combination indicators in the same dimension. In better words, the thicker the connection line is, the more the two connected indicators were both used in the assessment process of the organizations. The position of the circles and the length of the connection lines speak for no meaning and are fully accidental.
Looking through the economic dimension (figure17), the indicator “direct economic value generated and distributed” (201-1), was ranked first with a significant difference from the second one. However, the vast meaning of the indicator can be a justification of its highly ranked application since it contains all three aspects of: direct economic value generated (revenues), economic value distributed (operating costs, employee wages and etc) and economic value retained. On the other hand, the rest of the economic indicators are practised with smaller differences in frequency of the application which can be the representative of the tendency toward interpreting economic sustainability as costs and profit. In addition, the second indicator has been used the most was surprisingly “Communication and training about anti-corruption policies and procedures” (205-2) which is known as both a social and economic value in sustainability definition and it was employed more than “Significant indirect economic impacts” (203-2). The other two anti-corruption indicators, (205-3, 205-1) come next and before “other indirect economic impacts” or “procurement practices” that can be a sign of propensity of organizations toward the concept of anti-corruption. Nonetheless, indicators related to “market presence” which seemed to be an interesting topic were positioned at the end of the ranking list.
As concerns the combinations, it is clear that the combinations with the indicators related to “direct economic value” and “anti-corruption” (all its three indicators) be the ones with the highest position among all. However, the two-indicator combination of (201-1 and 205-2) stood first with an evident difference from the second one which is the combination thought to be the first: direct and indirect economic value (201-1, 203-2). The observation itself reconfirms the importance of anti-corruption when it comes to economic sustainability in an organization.
Considering the environmental dimension of sustainability (figure 18), “Energy Consumption within the organization” which is represented by the indicator (302-1) stood out while the “GHG emission” with two indicators of (305-2) and (305-1) came closely after. However, the difference between the third place (305-1) and the fourth (307-1) and forward is clearly notable. On the other hand, it is observed that
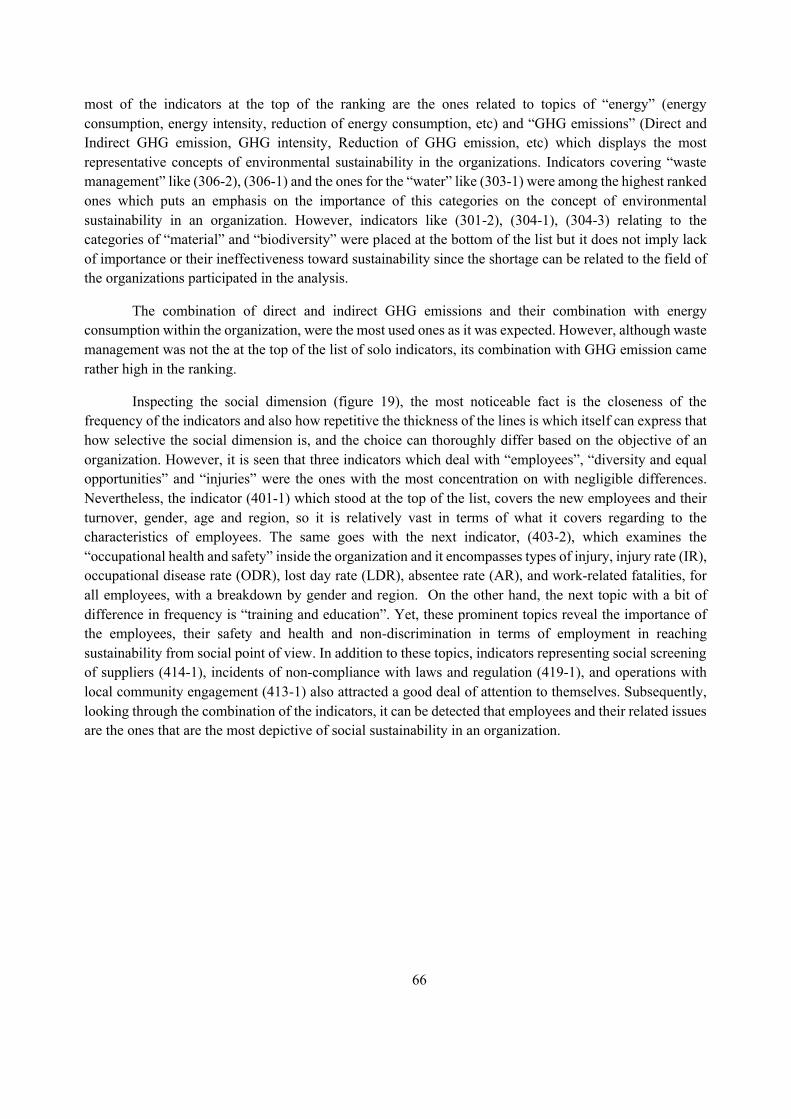
66
most of the indicators at the top of the ranking are the ones related to topics of “energy” (energy consumption, energy intensity, reduction of energy consumption, etc) and “GHG emissions” (Direct and Indirect GHG emission, GHG intensity, Reduction of GHG emission, etc) which displays the most representative concepts of environmental sustainability in the organizations. Indicators covering “waste management” like (306-2), (306-1) and the ones for the “water” like (303-1) were among the highest ranked ones which puts an emphasis on the importance of this categories on the concept of environmental sustainability in an organization. However, indicators like (301-2), (304-1), (304-3) relating to the categories of “material” and “biodiversity” were placed at the bottom of the list but it does not imply lack of importance or their ineffectiveness toward sustainability since the shortage can be related to the field of the organizations participated in the analysis.
The combination of direct and indirect GHG emissions and their combination with energy consumption within the organization, were the most used ones as it was expected. However, although waste management was not the at the top of the list of solo indicators, its combination with GHG emission came rather high in the ranking.
Inspecting the social dimension (figure 19), the most noticeable fact is the closeness of the frequency of the indicators and also how repetitive the thickness of the lines is which itself can express that how selective the social dimension is, and the choice can thoroughly differ based on the objective of an organization. However, it is seen that three indicators which deal with “employees”, “diversity and equal opportunities” and “injuries” were the ones with the most concentration on with negligible differences. Nevertheless, the indicator (401-1) which stood at the top of the list, covers the new employees and their turnover, gender, age and region, so it is relatively vast in terms of what it covers regarding to the characteristics of employees. The same goes with the next indicator, (403-2), which examines the “occupational health and safety” inside the organization and it encompasses types of injury, injury rate (IR), occupational disease rate (ODR), lost day rate (LDR), absentee rate (AR), and work-related fatalities, for all employees, with a breakdown by gender and region. On the other hand, the next topic with a bit of difference in frequency is “training and education”. Yet, these prominent topics reveal the importance of the employees, their safety and health and non-discrimination in terms of employment in reaching sustainability from social point of view. In addition to these topics, indicators representing social screening of suppliers (414-1), incidents of non-compliance with laws and regulation (419-1), and operations with local community engagement (413-1) also attracted a good deal of attention to themselves. Subsequently, looking through the combination of the indicators, it can be detected that employees and their related issues are the ones that are the most depictive of social sustainability in an organization.
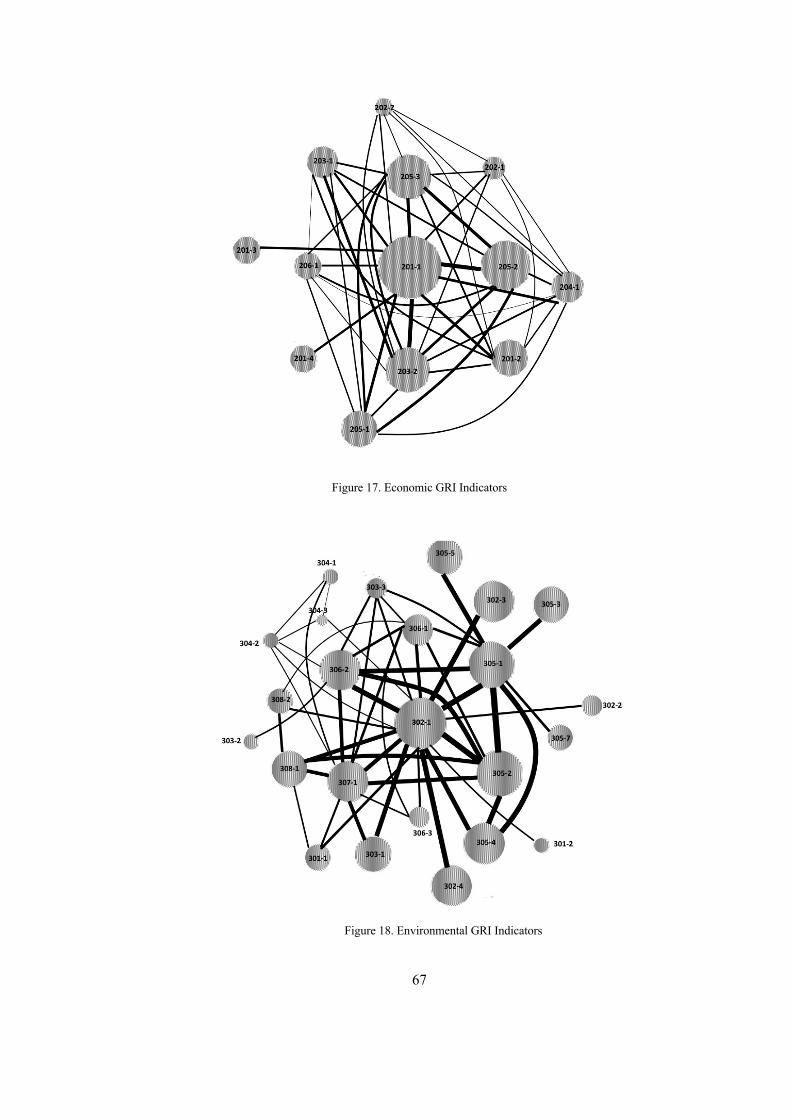
67
Figure 17. Economic GRI Indicators
Figure 18. Environmental GRI Indicators
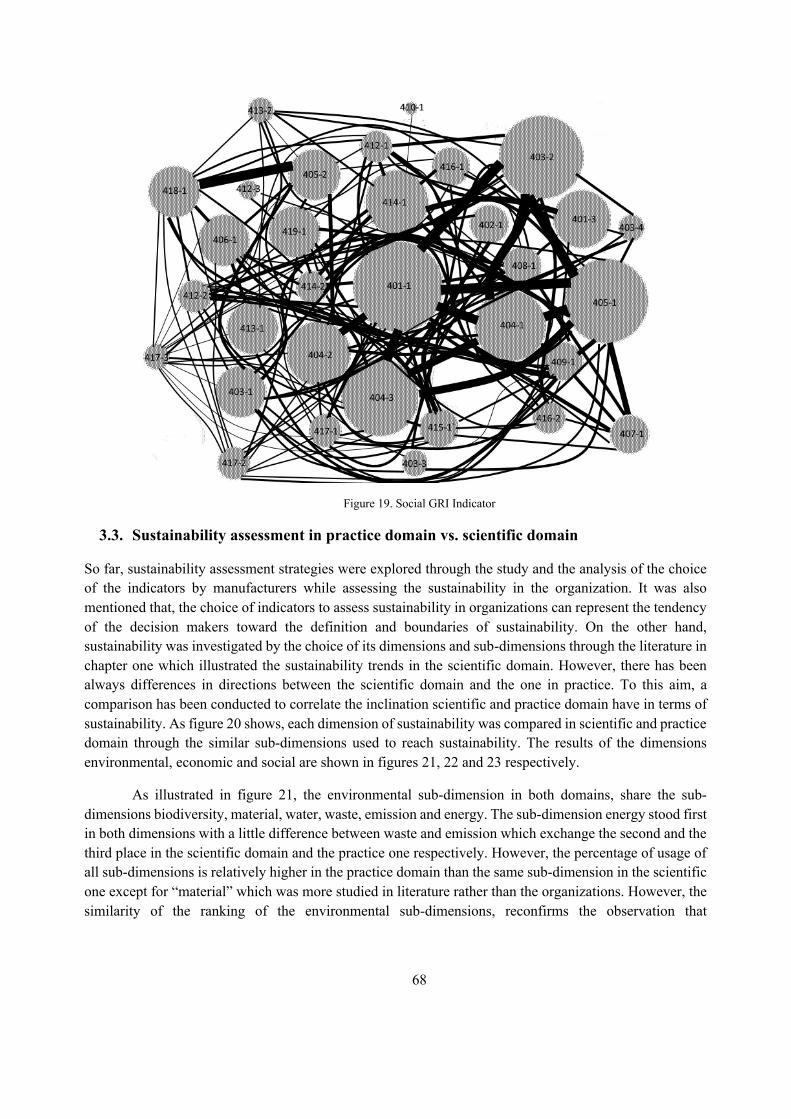
68
Figure 19. Social GRI Indicator
3.3. Sustainability assessment in practice domain vs. scientific domain
So far, sustainability assessment strategies were explored through the study and the analysis of the choice of the indicators by manufacturers while assessing the sustainability in the organization. It was also mentioned that, the choice of indicators to assess sustainability in organizations can represent the tendency of the decision makers toward the definition and boundaries of sustainability. On the other hand, sustainability was investigated by the choice of its dimensions and sub-dimensions through the literature in chapter one which illustrated the sustainability trends in the scientific domain. However, there has been always differences in directions between the scientific domain and the one in practice. To this aim, a comparison has been conducted to correlate the inclination scientific and practice domain have in terms of sustainability. As figure 20 shows, each dimension of sustainability was compared in scientific and practice domain through the similar sub-dimensions used to reach sustainability. The results of the dimensions environmental, economic and social are shown in figures 21, 22 and 23 respectively.
As illustrated in figure 21, the environmental sub-dimension in both domains, share the sub-dimensions biodiversity, material, water, waste, emission and energy. The sub-dimension energy stood first in both dimensions with a little difference between waste and emission which exchange the second and the third place in the scientific domain and the practice one respectively. However, the percentage of usage of all sub-dimensions is relatively higher in the practice domain than the same sub-dimension in the scientific one except for “material” which was more studied in literature rather than the organizations. However, the similarity of the ranking of the environmental sub-dimensions, reconfirms the observation that
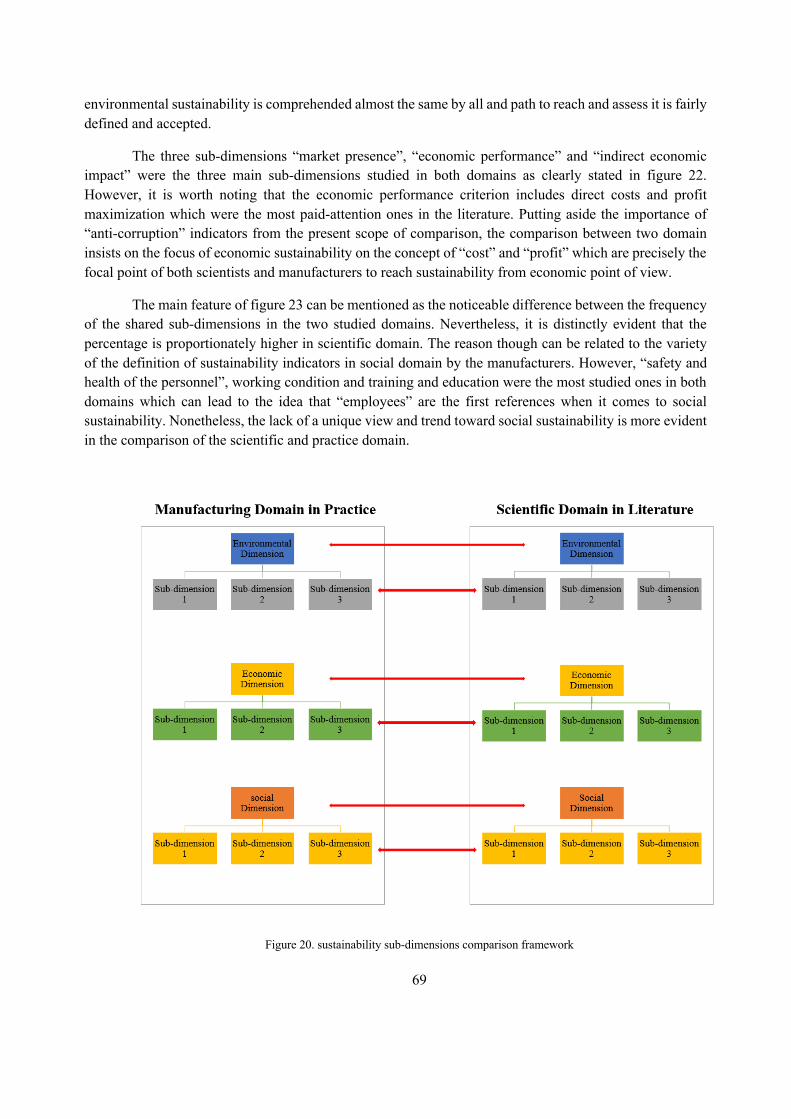
69
environmental sustainability is comprehended almost the same by all and path to reach and assess it is fairly defined and accepted.
The three sub-dimensions “market presence”, “economic performance” and “indirect economic impact” were the three main sub-dimensions studied in both domains as clearly stated in figure 22. However, it is worth noting that the economic performance criterion includes direct costs and profit maximization which were the most paid-attention ones in the literature. Putting aside the importance of “anti-corruption” indicators from the present scope of comparison, the comparison between two domain insists on the focus of economic sustainability on the concept of “cost” and “profit” which are precisely the focal point of both scientists and manufacturers to reach sustainability from economic point of view.
The main feature of figure 23 can be mentioned as the noticeable difference between the frequency of the shared sub-dimensions in the two studied domains. Nevertheless, it is distinctly evident that the percentage is proportionately higher in scientific domain. The reason though can be related to the variety of the definition of sustainability indicators in social domain by the manufacturers. However, “safety and health of the personnel”, working condition and training and education were the most studied ones in both domains which can lead to the idea that “employees” are the first references when it comes to social sustainability. Nonetheless, the lack of a unique view and trend toward social sustainability is more evident in the comparison of the scientific and practice domain.
Figure 20. sustainability sub-dimensions comparison framework
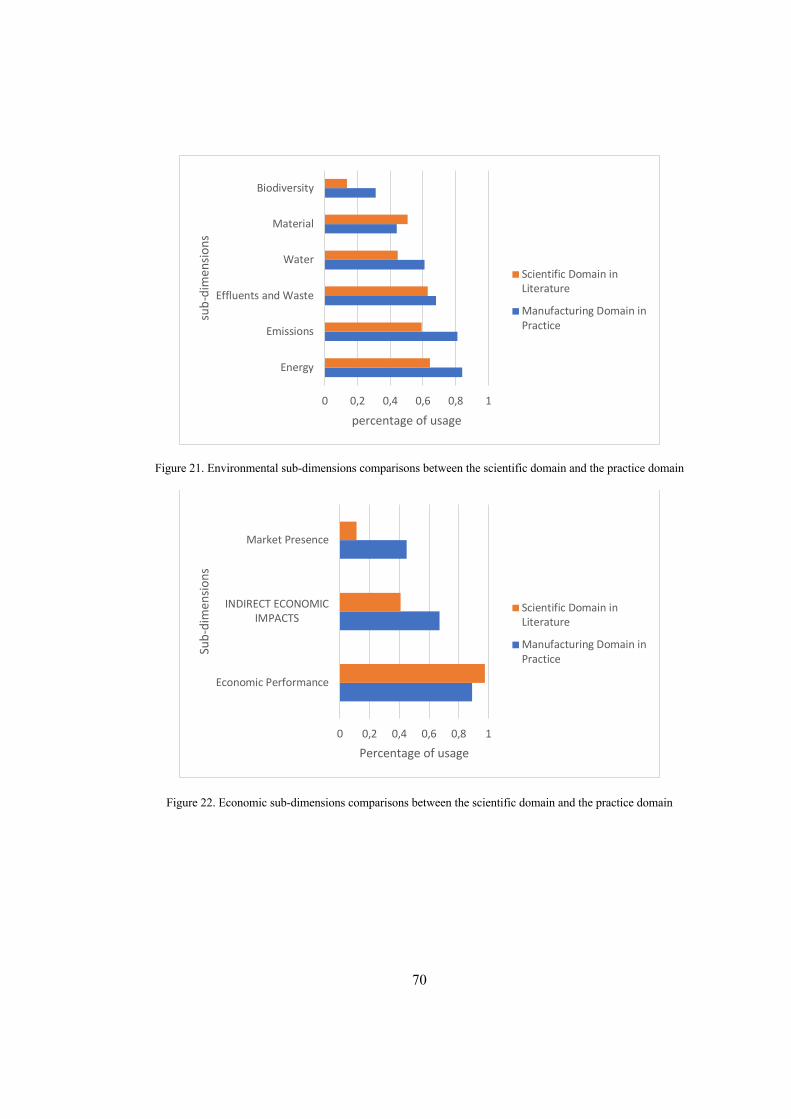
70
Figure 21. Environmental sub-dimensions comparisons between the scientific domain and the practice domain
Figure 22. Economic sub-dimensions comparisons between the scientific domain and the practice domain
0 0,2 0,4 0,6 0,8 1
Energy
Emissions
Effluents and Waste
Water
Material
Biodiversity
percentage of usage
sub-
dim
ensio
ns
Scientific Domain inLiterature
Manufacturing Domain inPractice
0 0,2 0,4 0,6 0,8 1
Economic Performance
INDIRECT ECONOMICIMPACTS
Market Presence
Percentage of usage
Sub-
dim
ensio
ns
Scientific Domain inLiterature
Manufacturing Domain inPractice
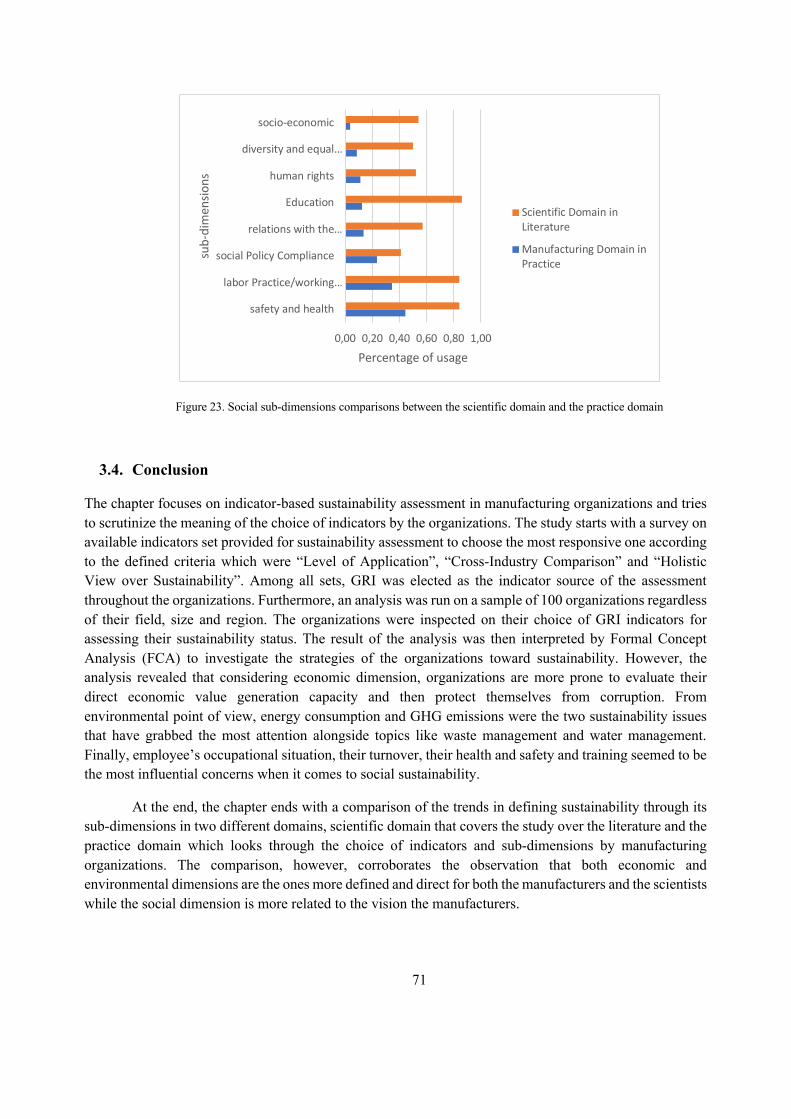
71
Figure 23. Social sub-dimensions comparisons between the scientific domain and the practice domain
3.4. Conclusion
The chapter focuses on indicator-based sustainability assessment in manufacturing organizations and tries to scrutinize the meaning of the choice of indicators by the organizations. The study starts with a survey on available indicators set provided for sustainability assessment to choose the most responsive one according to the defined criteria which were “Level of Application”, “Cross-Industry Comparison” and “Holistic View over Sustainability”. Among all sets, GRI was elected as the indicator source of the assessment throughout the organizations. Furthermore, an analysis was run on a sample of 100 organizations regardless of their field, size and region. The organizations were inspected on their choice of GRI indicators for assessing their sustainability status. The result of the analysis was then interpreted by Formal Concept Analysis (FCA) to investigate the strategies of the organizations toward sustainability. However, the analysis revealed that considering economic dimension, organizations are more prone to evaluate their direct economic value generation capacity and then protect themselves from corruption. From environmental point of view, energy consumption and GHG emissions were the two sustainability issues that have grabbed the most attention alongside topics like waste management and water management. Finally, employee’s occupational situation, their turnover, their health and safety and training seemed to be the most influential concerns when it comes to social sustainability.
At the end, the chapter ends with a comparison of the trends in defining sustainability through its sub-dimensions in two different domains, scientific domain that covers the study over the literature and the practice domain which looks through the choice of indicators and sub-dimensions by manufacturing organizations. The comparison, however, corroborates the observation that both economic and environmental dimensions are the ones more defined and direct for both the manufacturers and the scientists while the social dimension is more related to the vision the manufacturers.
0,00 0,20 0,40 0,60 0,80 1,00
safety and health
labor Practice/working…
social Policy Compliance
relations with the…
Education
human rights
diversity and equal…
socio-economic
Percentage of usage
sub-
dim
ensio
nsScientific Domain inLiterature
Manufacturing Domain inPractice
72
CHAPTER 4 MODEL DEVELOPMENT: AN INDICATOR-BASED
SUSTAINABILITY ASSESSMENT
4.1. Introduction
Iindicator-based sustainability assessment, As fully described in chapter 3, has been recognized as one of the most applicable methodologies for sustainability assessment of an organization. Therefore, there is a strong tendency toward introducing composite indicators by aggregating different indices related to different aspects of sustainability. Based on (Karnib, 2016) introducing an aggregated sustainability index, makes it possible to summarize the relationship among different indicators; facilitates the communication to the concerned sustainable system manager; paves the path to monitoring and reporting sustainability and finally allows the comparison of sustainable progress in different systems through different years. In addition to that, system thinking ideas and approaches may assist explicit identification of linkage among the indicators and an understanding of the behaviour of the system over time (Moldavska & Welo, 2016). Reckoning system thinking is beneficial in different ways: it identifies the link among the indicators and provides and understanding of system behaviour overtime; it specifies poorly understood relationships; it supports; earning about systems and make changes in the mental models of decision makers and finally it provides a language for communication across disciplines (Kelly, 1998).
Taking into account the challenges identified above and in previous chapters, the main question emerged here is “how we can help manufacturing organizations in terms of assessing sustainability” and “how we can help manufacturing organizations discover opportunities to reach a better state of sustainability”. To this aim, a model-based sustainability assessment tool based on indicator is presented in this chapter to help assess sustainability in a manufacturing organization. The model here tries to address manufacturing needs as discussed above and cope with the challenges manufacturing organizations are imposed to in terms of sustainability assessment. The model is aiming at grouping highly divers aspects in a common model to assess sustainability in a manufacturing organization in a holistic way. Figure 24 shows a generic schematic of composite sustainability assessment index which is the focal point of the rest of the chapter. However, the chapter will continue with the representation of the model and its components. After that the proposed selection procedure of the indicators is described. Following the selection and allocation of the indicators, the path to create a composite indicator in scrutinized. A real case company will be examined to examine the effectiveness of the proposed model. Finally, conclusion and limitation of the work are presented.
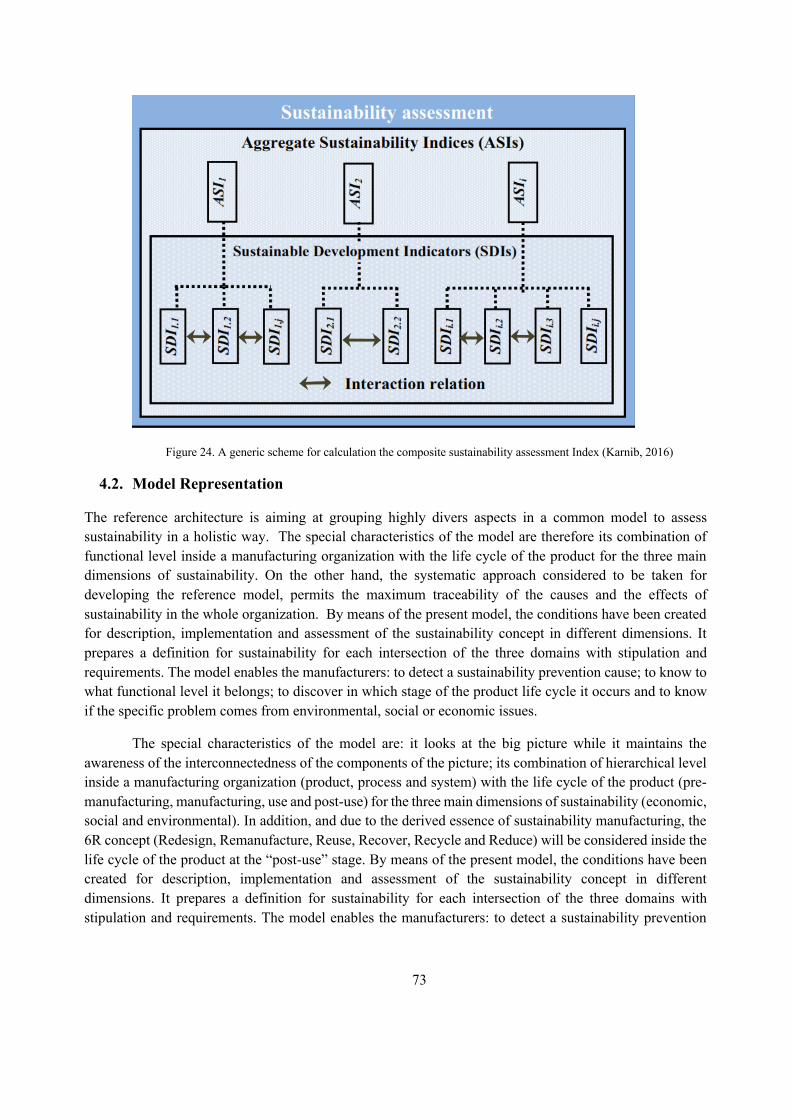
73
Figure 24. A generic scheme for calculation the composite sustainability assessment Index (Karnib, 2016)
4.2. Model Representation
The reference architecture is aiming at grouping highly divers aspects in a common model to assess sustainability in a holistic way. The special characteristics of the model are therefore its combination of functional level inside a manufacturing organization with the life cycle of the product for the three main dimensions of sustainability. On the other hand, the systematic approach considered to be taken for developing the reference model, permits the maximum traceability of the causes and the effects of sustainability in the whole organization. By means of the present model, the conditions have been created for description, implementation and assessment of the sustainability concept in different dimensions. It prepares a definition for sustainability for each intersection of the three domains with stipulation and requirements. The model enables the manufacturers: to detect a sustainability prevention cause; to know to what functional level it belongs; to discover in which stage of the product life cycle it occurs and to know if the specific problem comes from environmental, social or economic issues.
The special characteristics of the model are: it looks at the big picture while it maintains the awareness of the interconnectedness of the components of the picture; its combination of hierarchical level inside a manufacturing organization (product, process and system) with the life cycle of the product (pre-manufacturing, manufacturing, use and post-use) for the three main dimensions of sustainability (economic, social and environmental). In addition, and due to the derived essence of sustainability manufacturing, the 6R concept (Redesign, Remanufacture, Reuse, Recover, Recycle and Reduce) will be considered inside the life cycle of the product at the “post-use” stage. By means of the present model, the conditions have been created for description, implementation and assessment of the sustainability concept in different dimensions. It prepares a definition for sustainability for each intersection of the three domains with stipulation and requirements. The model enables the manufacturers: to detect a sustainability prevention
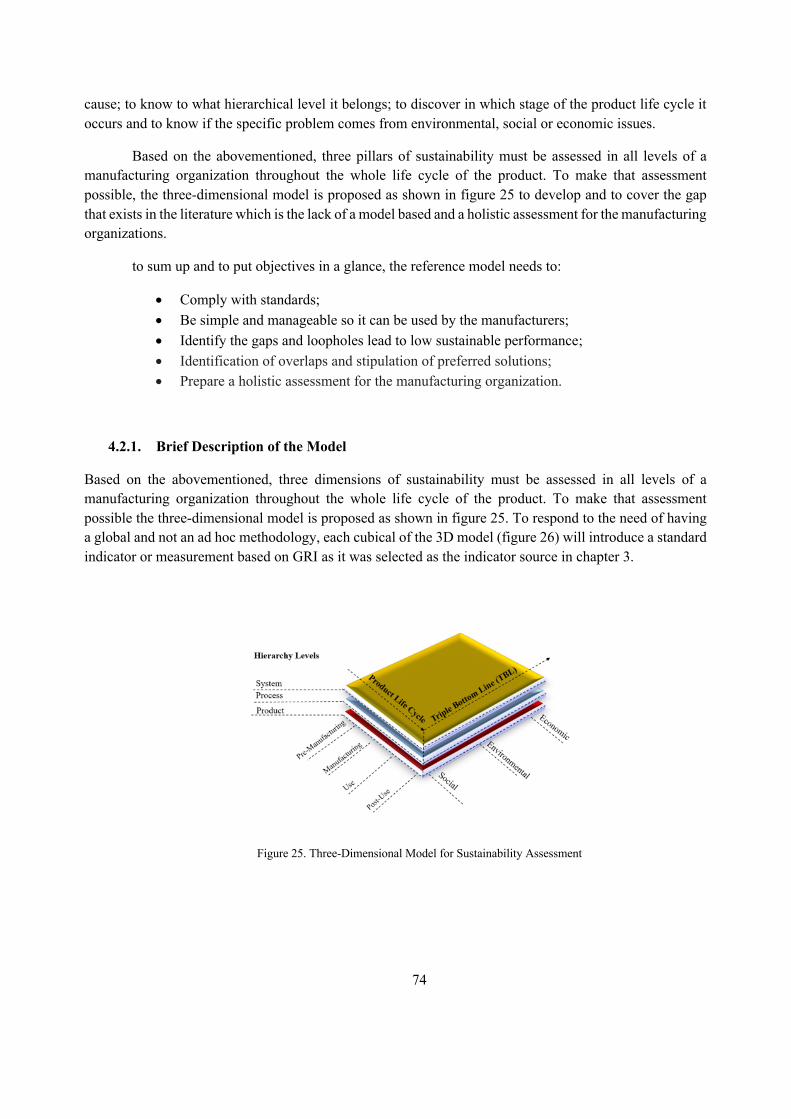
74
cause; to know to what hierarchical level it belongs; to discover in which stage of the product life cycle it occurs and to know if the specific problem comes from environmental, social or economic issues.
Based on the abovementioned, three pillars of sustainability must be assessed in all levels of a manufacturing organization throughout the whole life cycle of the product. To make that assessment possible, the three-dimensional model is proposed as shown in figure 25 to develop and to cover the gap that exists in the literature which is the lack of a model based and a holistic assessment for the manufacturing organizations.
to sum up and to put objectives in a glance, the reference model needs to:
• Comply with standards; • Be simple and manageable so it can be used by the manufacturers; • Identify the gaps and loopholes lead to low sustainable performance; • Identification of overlaps and stipulation of preferred solutions; • Prepare a holistic assessment for the manufacturing organization.
4.2.1. Brief Description of the Model
Based on the abovementioned, three dimensions of sustainability must be assessed in all levels of a manufacturing organization throughout the whole life cycle of the product. To make that assessment possible the three-dimensional model is proposed as shown in figure 25. To respond to the need of having a global and not an ad hoc methodology, each cubical of the 3D model (figure 26) will introduce a standard indicator or measurement based on GRI as it was selected as the indicator source in chapter 3.
Figure 25. Three-Dimensional Model for Sustainability Assessment
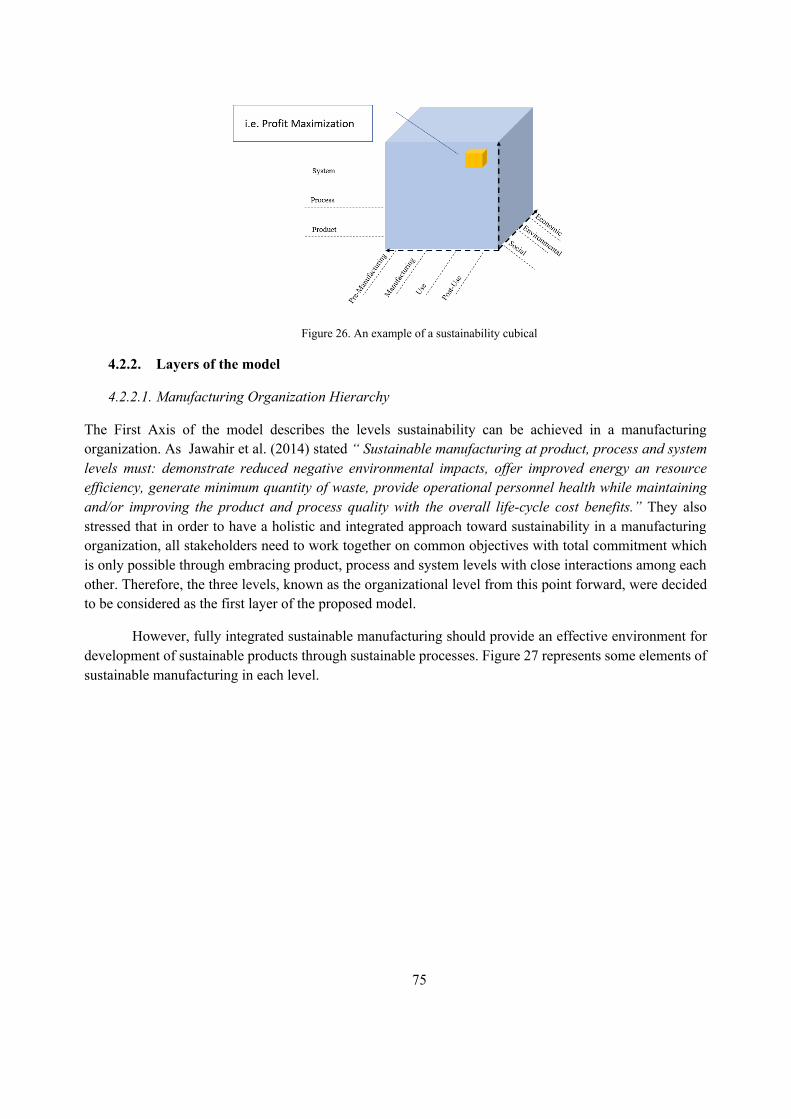
75
Figure 26. An example of a sustainability cubical
4.2.2. Layers of the model
4.2.2.1. Manufacturing Organization Hierarchy
The First Axis of the model describes the levels sustainability can be achieved in a manufacturing organization. As Jawahir et al. (2014) stated “ Sustainable manufacturing at product, process and system levels must: demonstrate reduced negative environmental impacts, offer improved energy an resource efficiency, generate minimum quantity of waste, provide operational personnel health while maintaining and/or improving the product and process quality with the overall life-cycle cost benefits.” They also stressed that in order to have a holistic and integrated approach toward sustainability in a manufacturing organization, all stakeholders need to work together on common objectives with total commitment which is only possible through embracing product, process and system levels with close interactions among each other. Therefore, the three levels, known as the organizational level from this point forward, were decided to be considered as the first layer of the proposed model.
However, fully integrated sustainable manufacturing should provide an effective environment for development of sustainable products through sustainable processes. Figure 27 represents some elements of sustainable manufacturing in each level.
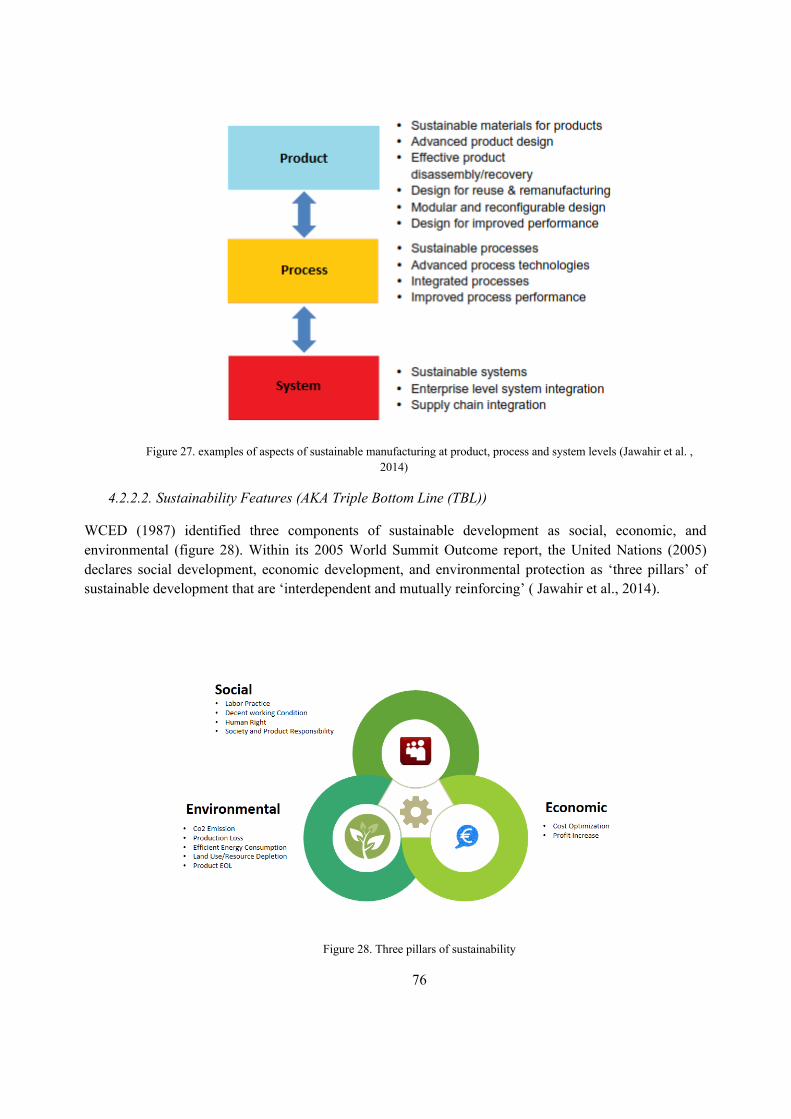
76
Figure 27. examples of aspects of sustainable manufacturing at product, process and system levels (Jawahir et al. , 2014)
4.2.2.2. Sustainability Features (AKA Triple Bottom Line (TBL))
WCED (1987) identified three components of sustainable development as social, economic, and environmental (figure 28). Within its 2005 World Summit Outcome report, the United Nations (2005) declares social development, economic development, and environmental protection as ‘three pillars’ of sustainable development that are ‘interdependent and mutually reinforcing’ ( Jawahir et al., 2014).
Figure 28. Three pillars of sustainability
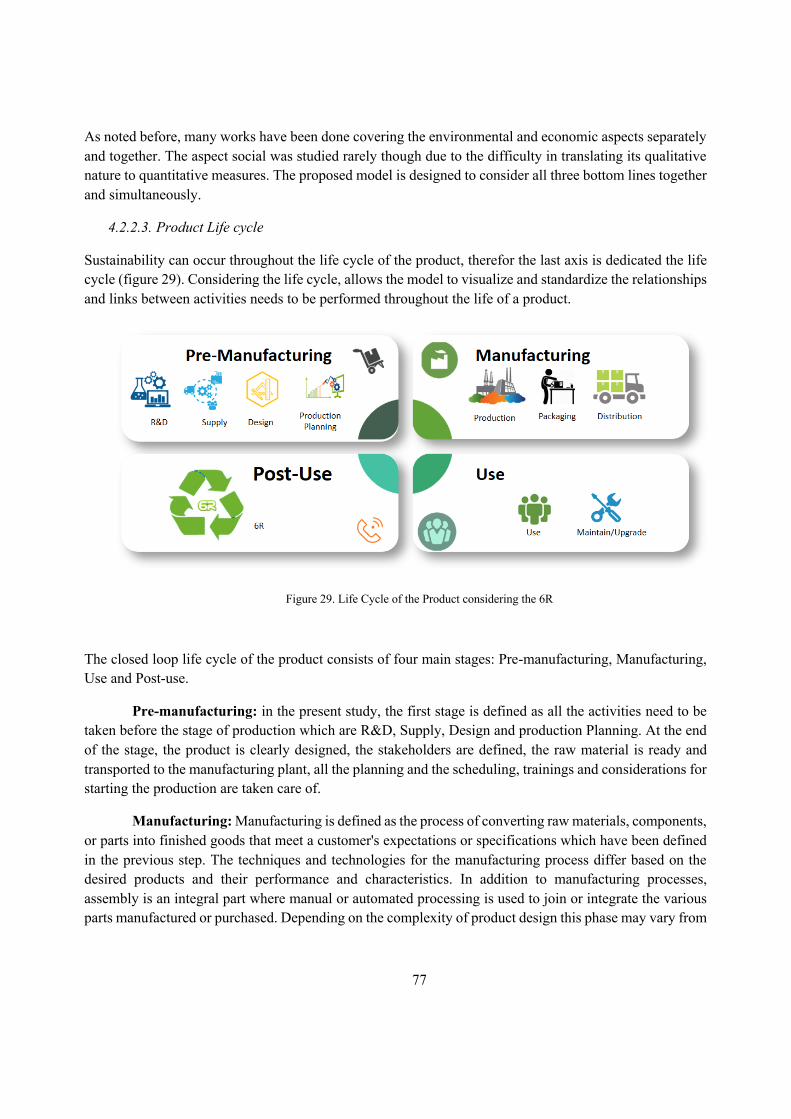
77
As noted before, many works have been done covering the environmental and economic aspects separately and together. The aspect social was studied rarely though due to the difficulty in translating its qualitative nature to quantitative measures. The proposed model is designed to consider all three bottom lines together and simultaneously.
4.2.2.3. Product Life cycle
Sustainability can occur throughout the life cycle of the product, therefor the last axis is dedicated the life cycle (figure 29). Considering the life cycle, allows the model to visualize and standardize the relationships and links between activities needs to be performed throughout the life of a product.
Figure 29. Life Cycle of the Product considering the 6R
The closed loop life cycle of the product consists of four main stages: Pre-manufacturing, Manufacturing, Use and Post-use.
Pre-manufacturing: in the present study, the first stage is defined as all the activities need to be taken before the stage of production which are R&D, Supply, Design and production Planning. At the end of the stage, the product is clearly designed, the stakeholders are defined, the raw material is ready and transported to the manufacturing plant, all the planning and the scheduling, trainings and considerations for starting the production are taken care of.
Manufacturing: Manufacturing is defined as the process of converting raw materials, components, or parts into finished goods that meet a customer's expectations or specifications which have been defined in the previous step. The techniques and technologies for the manufacturing process differ based on the desired products and their performance and characteristics. In addition to manufacturing processes, assembly is an integral part where manual or automated processing is used to join or integrate the various parts manufactured or purchased. Depending on the complexity of product design this phase may vary from
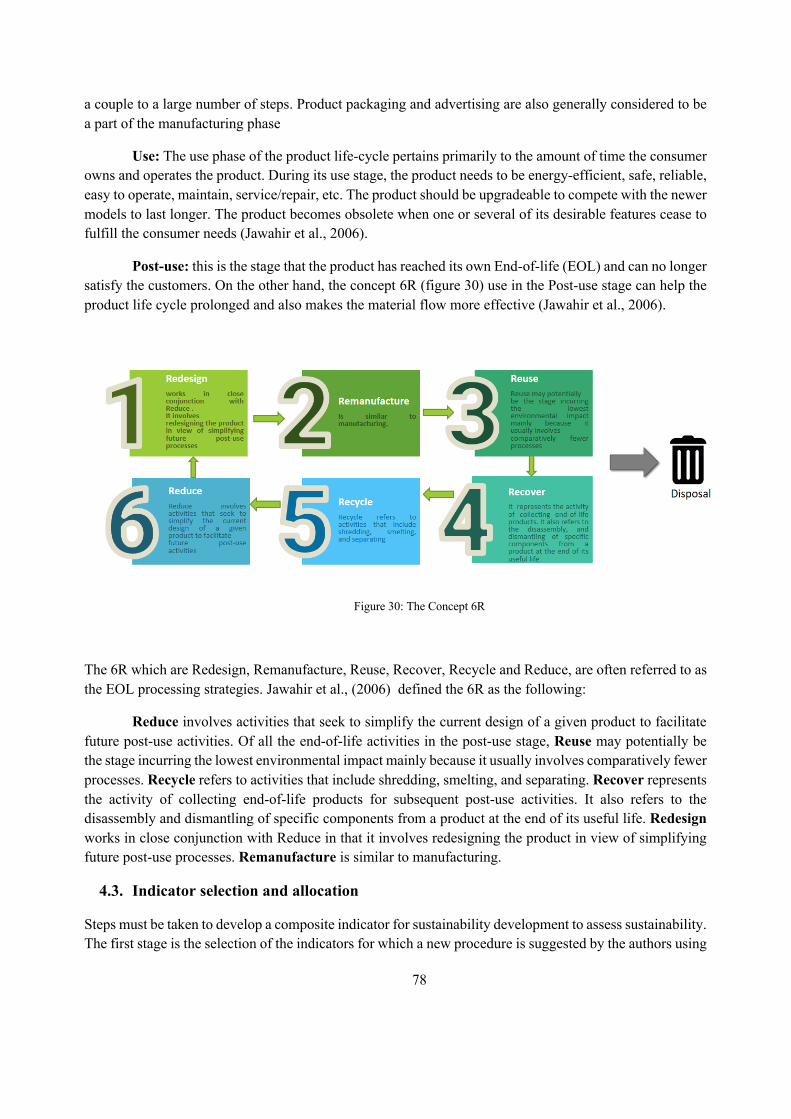
78
a couple to a large number of steps. Product packaging and advertising are also generally considered to be a part of the manufacturing phase
Use: The use phase of the product life-cycle pertains primarily to the amount of time the consumer owns and operates the product. During its use stage, the product needs to be energy-efficient, safe, reliable, easy to operate, maintain, service/repair, etc. The product should be upgradeable to compete with the newer models to last longer. The product becomes obsolete when one or several of its desirable features cease to fulfill the consumer needs (Jawahir et al., 2006).
Post-use: this is the stage that the product has reached its own End-of-life (EOL) and can no longer satisfy the customers. On the other hand, the concept 6R (figure 30) use in the Post-use stage can help the product life cycle prolonged and also makes the material flow more effective (Jawahir et al., 2006).
Figure 30: The Concept 6R
The 6R which are Redesign, Remanufacture, Reuse, Recover, Recycle and Reduce, are often referred to as the EOL processing strategies. Jawahir et al., (2006) defined the 6R as the following:
Reduce involves activities that seek to simplify the current design of a given product to facilitate future post-use activities. Of all the end-of-life activities in the post-use stage, Reuse may potentially be the stage incurring the lowest environmental impact mainly because it usually involves comparatively fewer processes. Recycle refers to activities that include shredding, smelting, and separating. Recover represents the activity of collecting end-of-life products for subsequent post-use activities. It also refers to the disassembly and dismantling of specific components from a product at the end of its useful life. Redesign works in close conjunction with Reduce in that it involves redesigning the product in view of simplifying future post-use processes. Remanufacture is similar to manufacturing.
4.3. Indicator selection and allocation
Steps must be taken to develop a composite indicator for sustainability development to assess sustainability. The first stage is the selection of the indicators for which a new procedure is suggested by the authors using
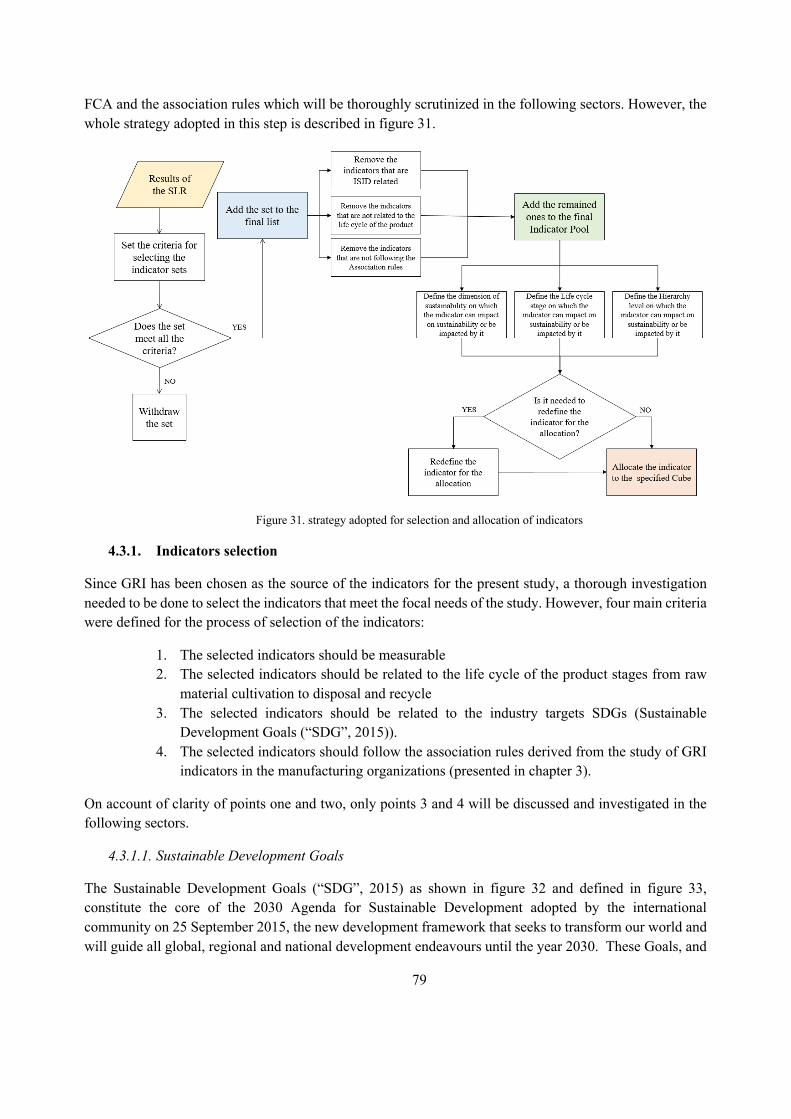
79
FCA and the association rules which will be thoroughly scrutinized in the following sectors. However, the whole strategy adopted in this step is described in figure 31.
Figure 31. strategy adopted for selection and allocation of indicators
4.3.1. Indicators selection
Since GRI has been chosen as the source of the indicators for the present study, a thorough investigation needed to be done to select the indicators that meet the focal needs of the study. However, four main criteria were defined for the process of selection of the indicators:
1. The selected indicators should be measurable 2. The selected indicators should be related to the life cycle of the product stages from raw
material cultivation to disposal and recycle 3. The selected indicators should be related to the industry targets SDGs (Sustainable
Development Goals (“SDG”, 2015)). 4. The selected indicators should follow the association rules derived from the study of GRI
indicators in the manufacturing organizations (presented in chapter 3).
On account of clarity of points one and two, only points 3 and 4 will be discussed and investigated in the following sectors.
4.3.1.1. Sustainable Development Goals
The Sustainable Development Goals (“SDG”, 2015) as shown in figure 32 and defined in figure 33, constitute the core of the 2030 Agenda for Sustainable Development adopted by the international community on 25 September 2015, the new development framework that seeks to transform our world and will guide all global, regional and national development endeavours until the year 2030. These Goals, and
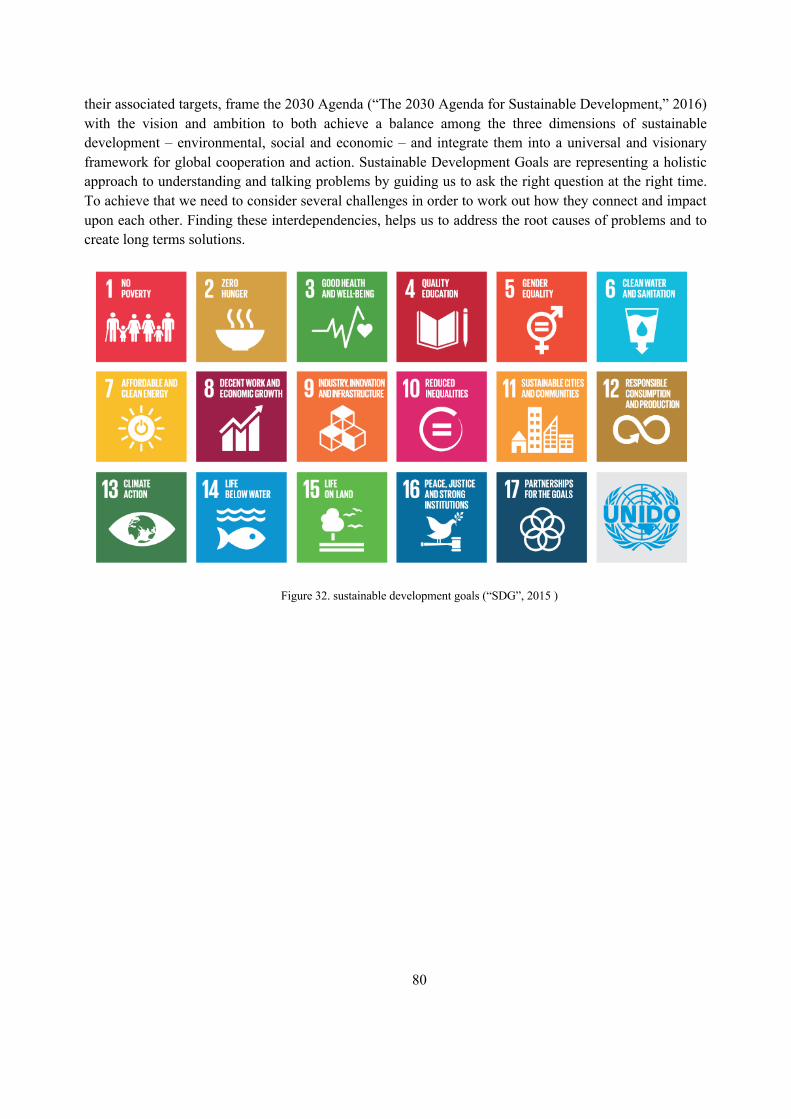
80
their associated targets, frame the 2030 Agenda (“The 2030 Agenda for Sustainable Development,” 2016) with the vision and ambition to both achieve a balance among the three dimensions of sustainable development – environmental, social and economic – and integrate them into a universal and visionary framework for global cooperation and action. Sustainable Development Goals are representing a holistic approach to understanding and talking problems by guiding us to ask the right question at the right time. To achieve that we need to consider several challenges in order to work out how they connect and impact upon each other. Finding these interdependencies, helps us to address the root causes of problems and to create long terms solutions.
Figure 32. sustainable development goals (“SDG”, 2015 )
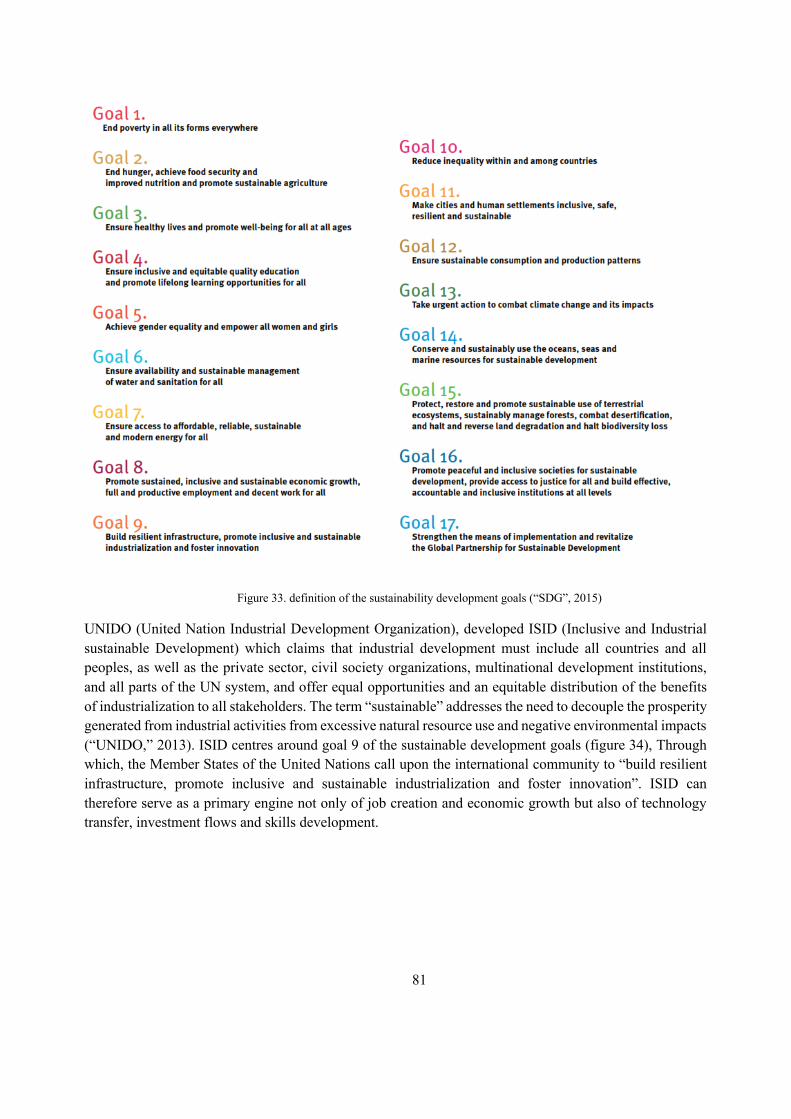
81
Figure 33. definition of the sustainability development goals (“SDG”, 2015)
UNIDO (United Nation Industrial Development Organization), developed ISID (Inclusive and Industrial sustainable Development) which claims that industrial development must include all countries and all peoples, as well as the private sector, civil society organizations, multinational development institutions, and all parts of the UN system, and offer equal opportunities and an equitable distribution of the benefits of industrialization to all stakeholders. The term “sustainable” addresses the need to decouple the prosperity generated from industrial activities from excessive natural resource use and negative environmental impacts (“UNIDO,” 2013). ISID centres around goal 9 of the sustainable development goals (figure 34), Through which, the Member States of the United Nations call upon the international community to “build resilient infrastructure, promote inclusive and sustainable industrialization and foster innovation”. ISID can therefore serve as a primary engine not only of job creation and economic growth but also of technology transfer, investment flows and skills development.
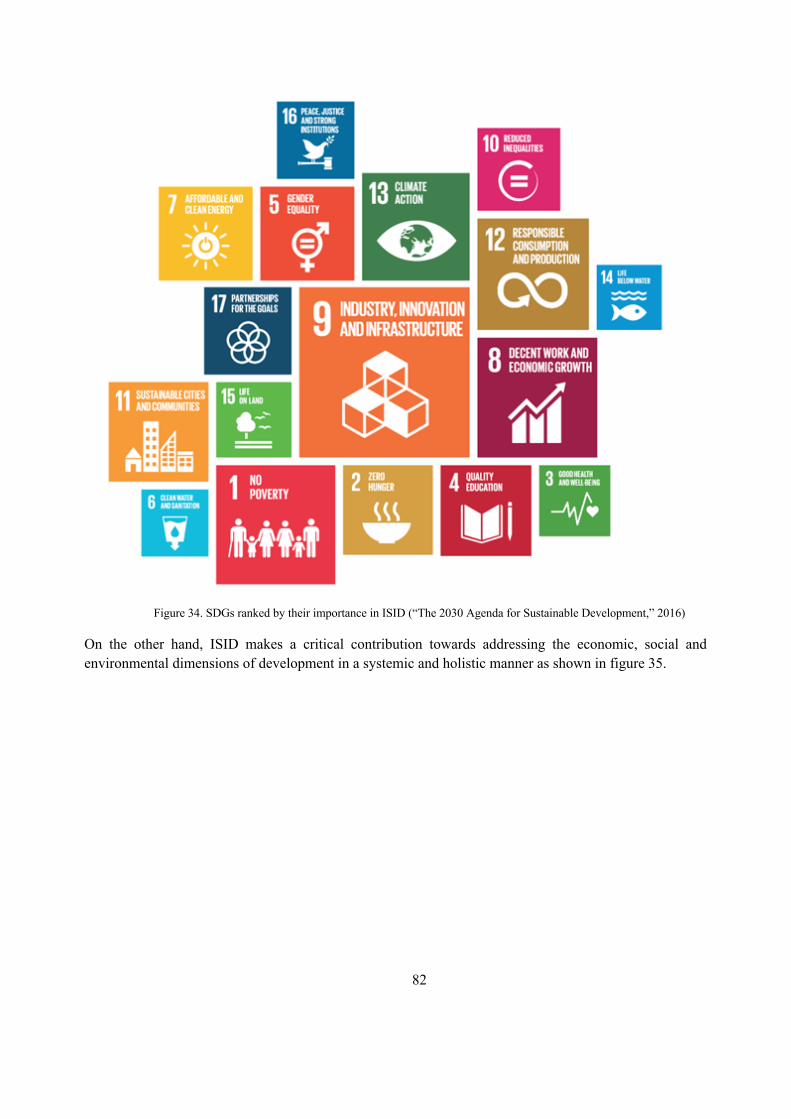
82
Figure 34. SDGs ranked by their importance in ISID (“The 2030 Agenda for Sustainable Development,” 2016)
On the other hand, ISID makes a critical contribution towards addressing the economic, social and environmental dimensions of development in a systemic and holistic manner as shown in figure 35.
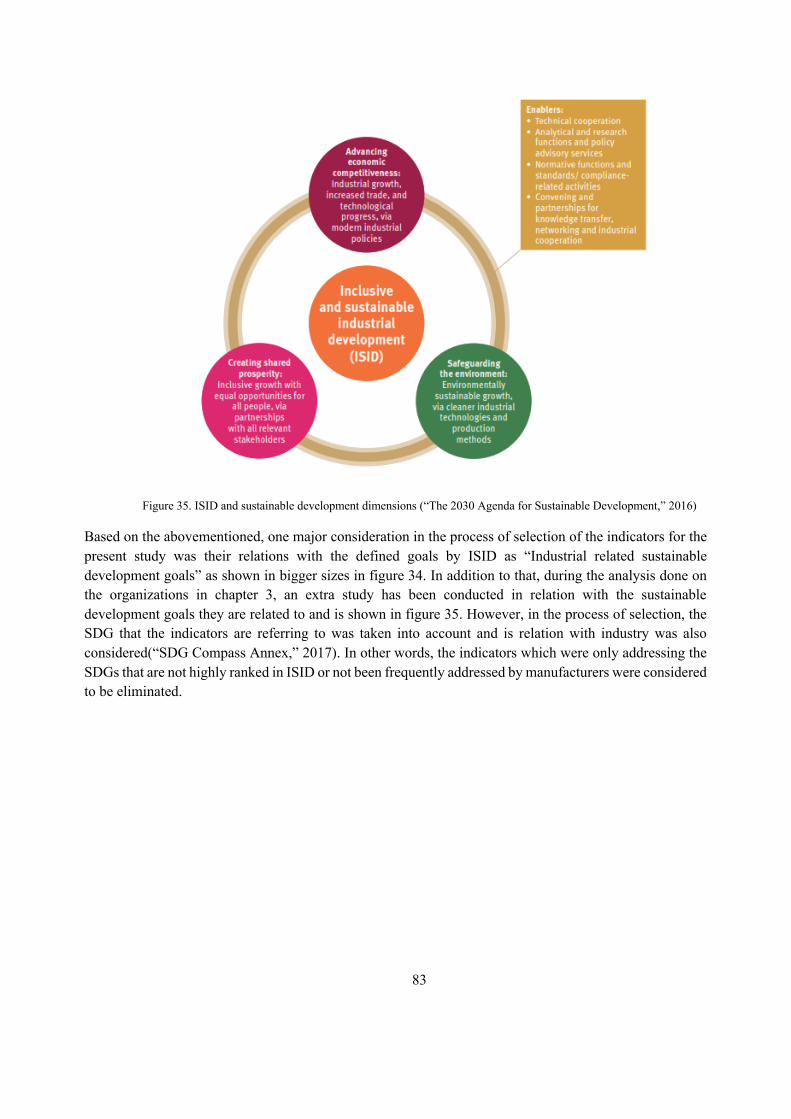
83
Figure 35. ISID and sustainable development dimensions (“The 2030 Agenda for Sustainable Development,” 2016)
Based on the abovementioned, one major consideration in the process of selection of the indicators for the present study was their relations with the defined goals by ISID as “Industrial related sustainable development goals” as shown in bigger sizes in figure 34. In addition to that, during the analysis done on the organizations in chapter 3, an extra study has been conducted in relation with the sustainable development goals they are related to and is shown in figure 35. However, in the process of selection, the SDG that the indicators are referring to was taken into account and is relation with industry was also considered(“SDG Compass Annex,” 2017). In other words, the indicators which were only addressing the SDGs that are not highly ranked in ISID or not been frequently addressed by manufacturers were considered to be eliminated.
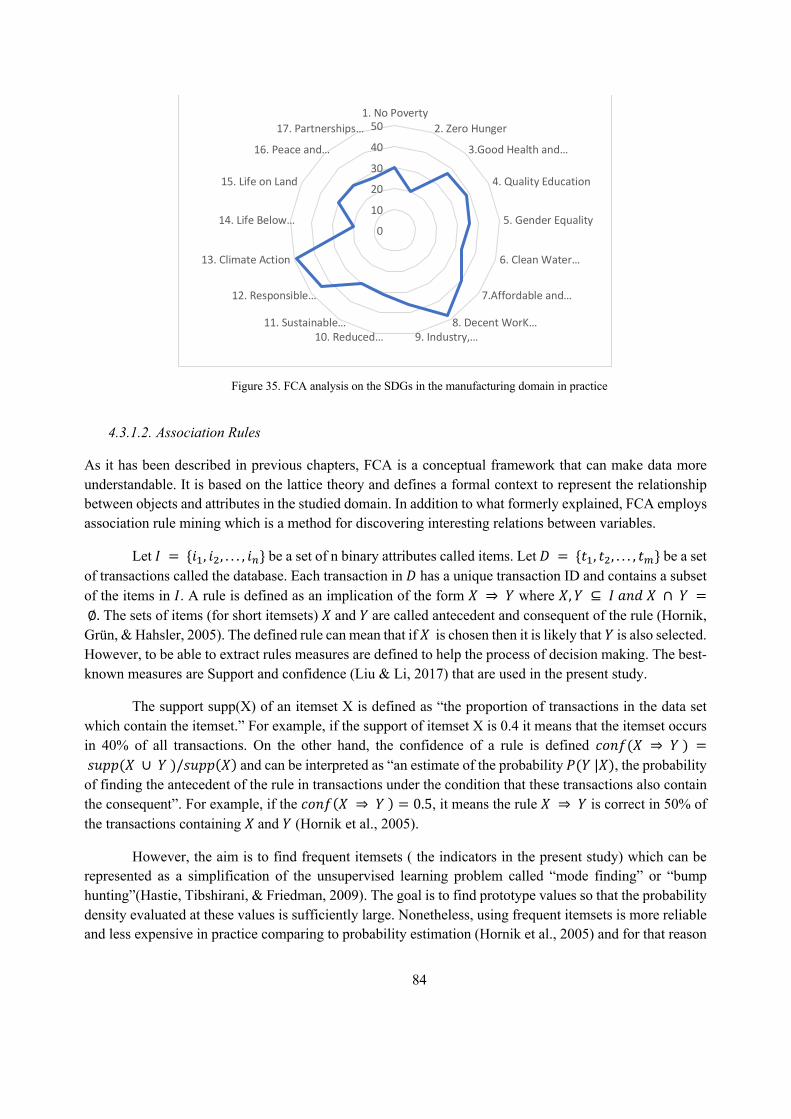
84
Figure 35. FCA analysis on the SDGs in the manufacturing domain in practice
4.3.1.2. Association Rules
As it has been described in previous chapters, FCA is a conceptual framework that can make data more understandable. It is based on the lattice theory and defines a formal context to represent the relationship between objects and attributes in the studied domain. In addition to what formerly explained, FCA employs association rule mining which is a method for discovering interesting relations between variables.
Let 𝐼 = {𝑖!, 𝑖", . . . , 𝑖#} be a set of n binary attributes called items. Let 𝐷 = {𝑡!, 𝑡", . . . , 𝑡$} be a set of transactions called the database. Each transaction in 𝐷 has a unique transaction ID and contains a subset of the items in 𝐼. A rule is defined as an implication of the form 𝑋 ⇒ 𝑌 where 𝑋, 𝑌 ⊆ 𝐼𝑎𝑛𝑑𝑋 ∩ 𝑌 =∅. The sets of items (for short itemsets) 𝑋and 𝑌are called antecedent and consequent of the rule (Hornik, Grün, & Hahsler, 2005). The defined rule can mean that if 𝑋 is chosen then it is likely that𝑌 is also selected. However, to be able to extract rules measures are defined to help the process of decision making. The best-known measures are Support and confidence (Liu & Li, 2017) that are used in the present study.
The support supp(X) of an itemset X is defined as “the proportion of transactions in the data set which contain the itemset.” For example, if the support of itemset X is 0.4 it means that the itemset occurs in 40% of all transactions. On the other hand, the confidence of a rule is defined 𝑐𝑜𝑛𝑓(𝑋 ⇒ 𝑌) =𝑠𝑢𝑝𝑝(𝑋 ∪ 𝑌)/𝑠𝑢𝑝𝑝(𝑋) and can be interpreted as “an estimate of the probability 𝑃(𝑌|𝑋), the probability of finding the antecedent of the rule in transactions under the condition that these transactions also contain the consequent”. For example, if the 𝑐𝑜𝑛𝑓(𝑋 ⇒ 𝑌) = 0.5, it means the rule 𝑋 ⇒ 𝑌 is correct in 50% of the transactions containing 𝑋and 𝑌 (Hornik et al., 2005).
However, the aim is to find frequent itemsets ( the indicators in the present study) which can be represented as a simplification of the unsupervised learning problem called “mode finding” or “bump hunting”(Hastie, Tibshirani, & Friedman, 2009). The goal is to find prototype values so that the probability density evaluated at these values is sufficiently large. Nonetheless, using frequent itemsets is more reliable and less expensive in practice comparing to probability estimation (Hornik et al., 2005) and for that reason
0
10
20
30
40
501. No Poverty
2. Zero Hunger
3.Good Health and…
4. Quality Education
5. Gender Equality
6. Clean Water…
7.Affordable and…
8. Decent WorK…9. Industry,…10. Reduced…
11. Sustainable…
12. Responsible…
13. Climate Action
14. Life Below…
15. Life on Land
16. Peace and…
17. Partnerships…
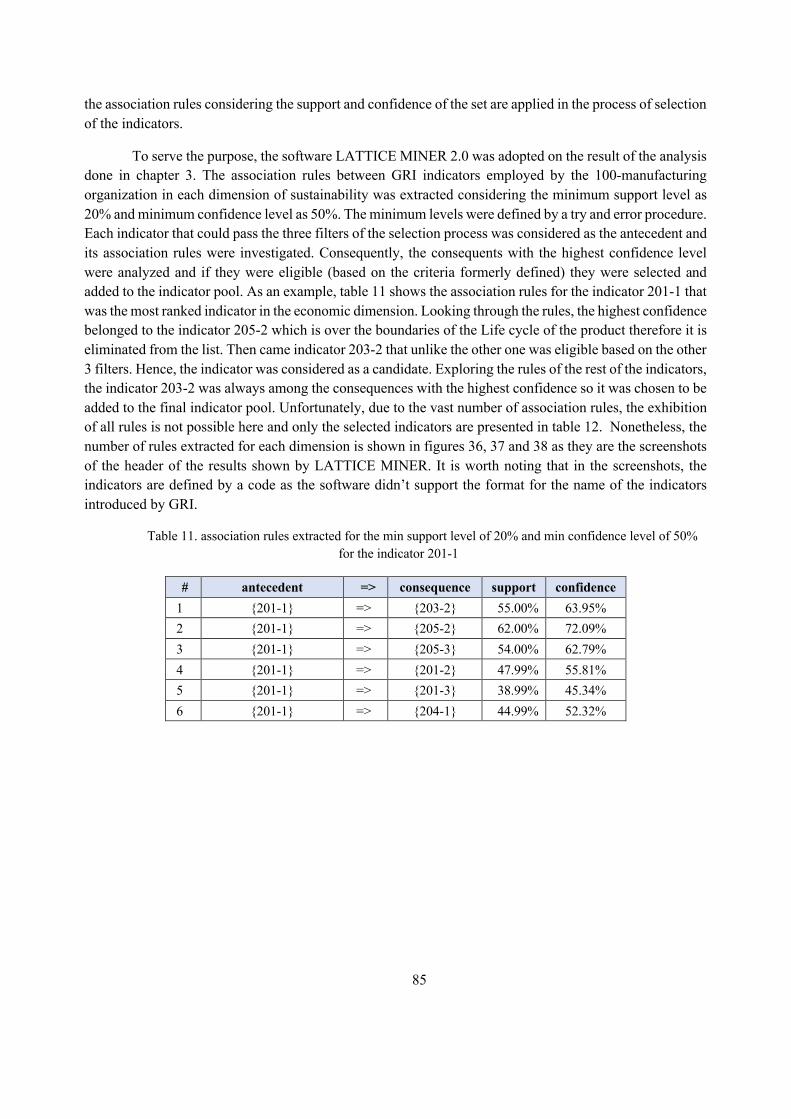
85
the association rules considering the support and confidence of the set are applied in the process of selection of the indicators.
To serve the purpose, the software LATTICE MINER 2.0 was adopted on the result of the analysis done in chapter 3. The association rules between GRI indicators employed by the 100-manufacturing organization in each dimension of sustainability was extracted considering the minimum support level as 20% and minimum confidence level as 50%. The minimum levels were defined by a try and error procedure. Each indicator that could pass the three filters of the selection process was considered as the antecedent and its association rules were investigated. Consequently, the consequents with the highest confidence level were analyzed and if they were eligible (based on the criteria formerly defined) they were selected and added to the indicator pool. As an example, table 11 shows the association rules for the indicator 201-1 that was the most ranked indicator in the economic dimension. Looking through the rules, the highest confidence belonged to the indicator 205-2 which is over the boundaries of the Life cycle of the product therefore it is eliminated from the list. Then came indicator 203-2 that unlike the other one was eligible based on the other 3 filters. Hence, the indicator was considered as a candidate. Exploring the rules of the rest of the indicators, the indicator 203-2 was always among the consequences with the highest confidence so it was chosen to be added to the final indicator pool. Unfortunately, due to the vast number of association rules, the exhibition of all rules is not possible here and only the selected indicators are presented in table 12. Nonetheless, the number of rules extracted for each dimension is shown in figures 36, 37 and 38 as they are the screenshots of the header of the results shown by LATTICE MINER. It is worth noting that in the screenshots, the indicators are defined by a code as the software didn’t support the format for the name of the indicators introduced by GRI.
Table 11. association rules extracted for the min support level of 20% and min confidence level of 50% for the indicator 201-1
# antecedent => consequence support confidence 1 {201-1} => {203-2} 55.00% 63.95% 2 {201-1} => {205-2} 62.00% 72.09% 3 {201-1} => {205-3} 54.00% 62.79% 4 {201-1} => {201-2} 47.99% 55.81% 5 {201-1} => {201-3} 38.99% 45.34% 6 {201-1} => {204-1} 44.99% 52.32%
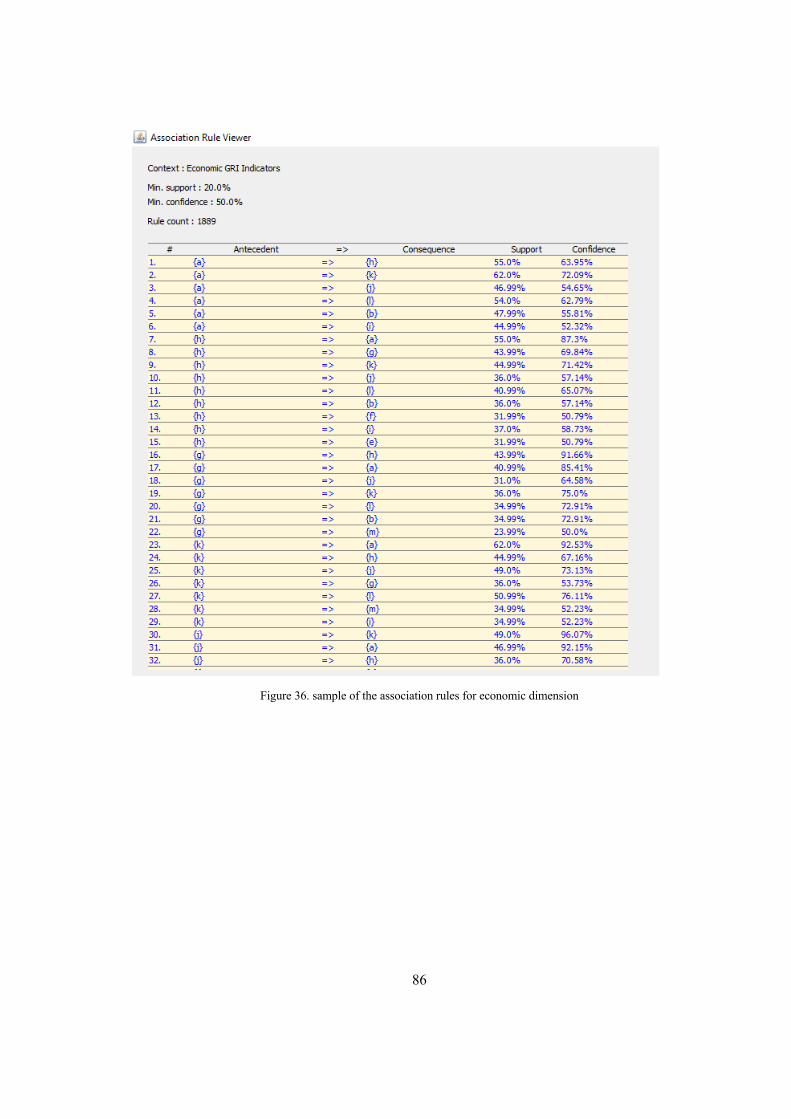
86
Figure 36. sample of the association rules for economic dimension
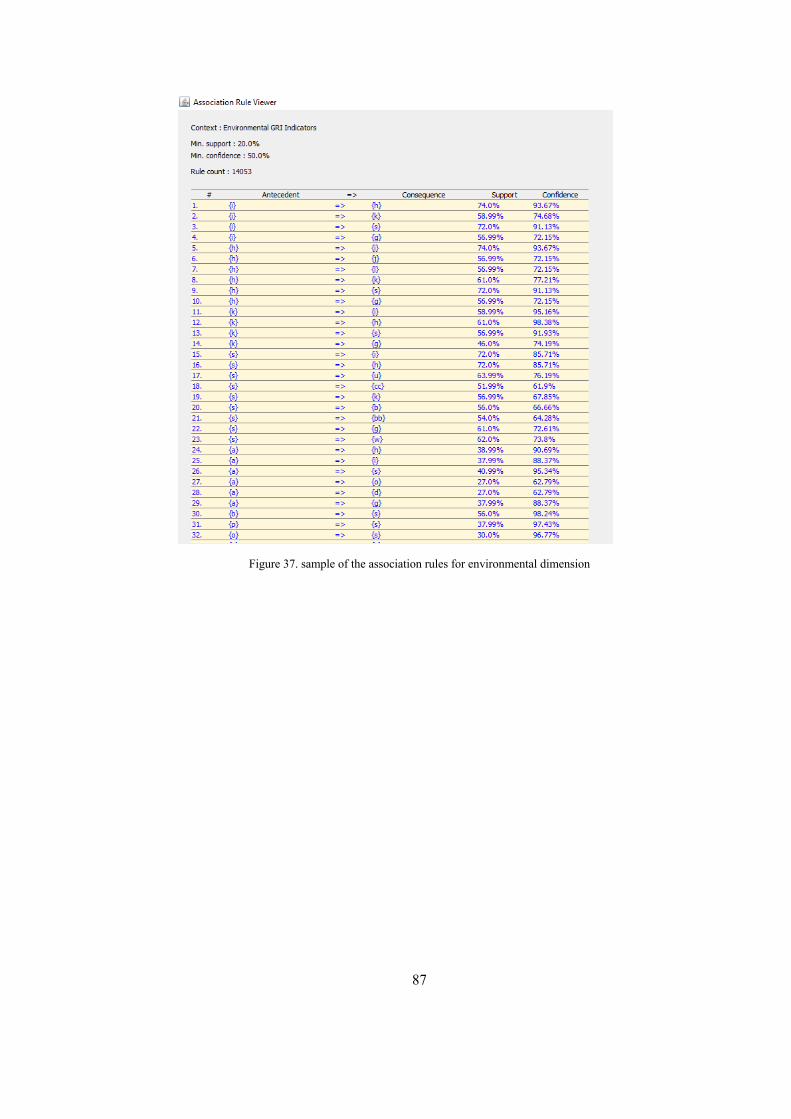
87
Figure 37. sample of the association rules for environmental dimension
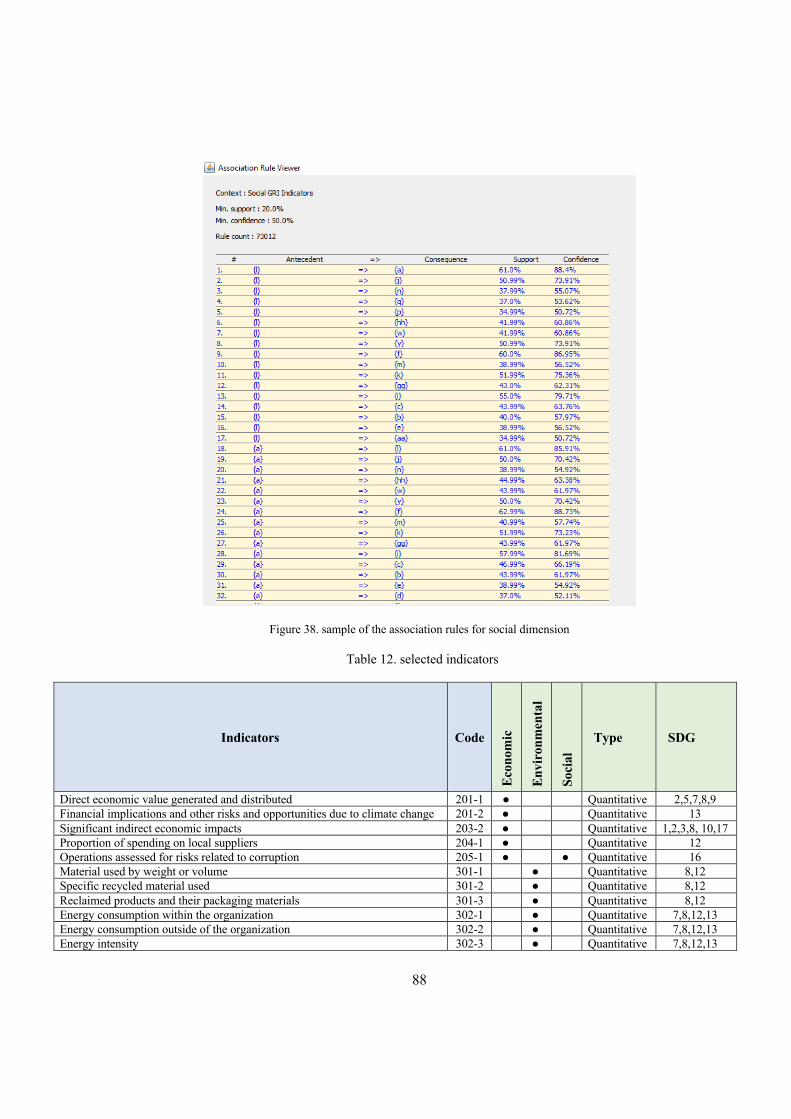
88
Figure 38. sample of the association rules for social dimension
Table 12. selected indicators
Indicators Code
Econ
omic
Envi
ronm
enta
l
Soci
al
Type SDG
Direct economic value generated and distributed 201-1 ● Quantitative 2,5,7,8,9 Financial implications and other risks and opportunities due to climate change 201-2 ● Quantitative 13 Significant indirect economic impacts 203-2 ● Quantitative 1,2,3,8, 10,17 Proportion of spending on local suppliers 204-1 ● Quantitative 12 Operations assessed for risks related to corruption 205-1 ● ● Quantitative 16 Material used by weight or volume 301-1 ● Quantitative 8,12 Specific recycled material used 301-2 ● Quantitative 8,12 Reclaimed products and their packaging materials 301-3 ● Quantitative 8,12 Energy consumption within the organization 302-1 ● Quantitative 7,8,12,13 Energy consumption outside of the organization 302-2 ● Quantitative 7,8,12,13 Energy intensity 302-3 ● Quantitative 7,8,12,13
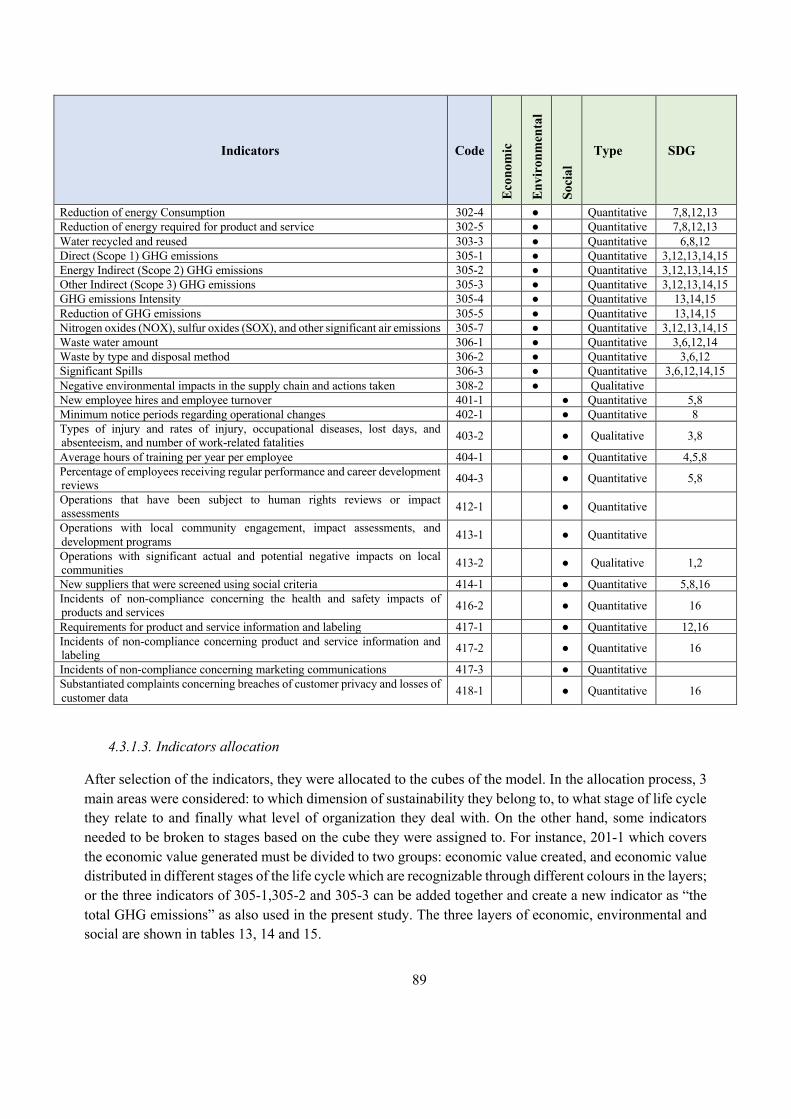
89
Indicators Code
Econ
omic
Envi
ronm
enta
l
Soci
al
Type SDG
Reduction of energy Consumption 302-4 ● Quantitative 7,8,12,13 Reduction of energy required for product and service 302-5 ● Quantitative 7,8,12,13 Water recycled and reused 303-3 ● Quantitative 6,8,12 Direct (Scope 1) GHG emissions 305-1 ● Quantitative 3,12,13,14,15 Energy Indirect (Scope 2) GHG emissions 305-2 ● Quantitative 3,12,13,14,15 Other Indirect (Scope 3) GHG emissions 305-3 ● Quantitative 3,12,13,14,15 GHG emissions Intensity 305-4 ● Quantitative 13,14,15 Reduction of GHG emissions 305-5 ● Quantitative 13,14,15 Nitrogen oxides (NOX), sulfur oxides (SOX), and other significant air emissions 305-7 ● Quantitative 3,12,13,14,15 Waste water amount 306-1 ● Quantitative 3,6,12,14 Waste by type and disposal method 306-2 ● Quantitative 3,6,12 Significant Spills 306-3 ● Quantitative 3,6,12,14,15 Negative environmental impacts in the supply chain and actions taken 308-2 ● Qualitative New employee hires and employee turnover 401-1 ● Quantitative 5,8 Minimum notice periods regarding operational changes 402-1 ● Quantitative 8 Types of injury and rates of injury, occupational diseases, lost days, and absenteeism, and number of work-related fatalities 403-2 ● Qualitative 3,8
Average hours of training per year per employee 404-1 ● Quantitative 4,5,8 Percentage of employees receiving regular performance and career development reviews 404-3 ● Quantitative 5,8
Operations that have been subject to human rights reviews or impact assessments 412-1 ● Quantitative
Operations with local community engagement, impact assessments, and development programs 413-1 ● Quantitative
Operations with significant actual and potential negative impacts on local communities 413-2 ● Qualitative 1,2
New suppliers that were screened using social criteria 414-1 ● Quantitative 5,8,16 Incidents of non-compliance concerning the health and safety impacts of products and services 416-2 ● Quantitative 16
Requirements for product and service information and labeling 417-1 ● Quantitative 12,16 Incidents of non-compliance concerning product and service information and labeling 417-2 ● Quantitative 16
Incidents of non-compliance concerning marketing communications 417-3 ● Quantitative Substantiated complaints concerning breaches of customer privacy and losses of customer data 418-1 ● Quantitative 16
4.3.1.3. Indicators allocation
After selection of the indicators, they were allocated to the cubes of the model. In the allocation process, 3 main areas were considered: to which dimension of sustainability they belong to, to what stage of life cycle they relate to and finally what level of organization they deal with. On the other hand, some indicators needed to be broken to stages based on the cube they were assigned to. For instance, 201-1 which covers the economic value generated must be divided to two groups: economic value created, and economic value distributed in different stages of the life cycle which are recognizable through different colours in the layers; or the three indicators of 305-1,305-2 and 305-3 can be added together and create a new indicator as “the total GHG emissions” as also used in the present study. The three layers of economic, environmental and social are shown in tables 13, 14 and 15.
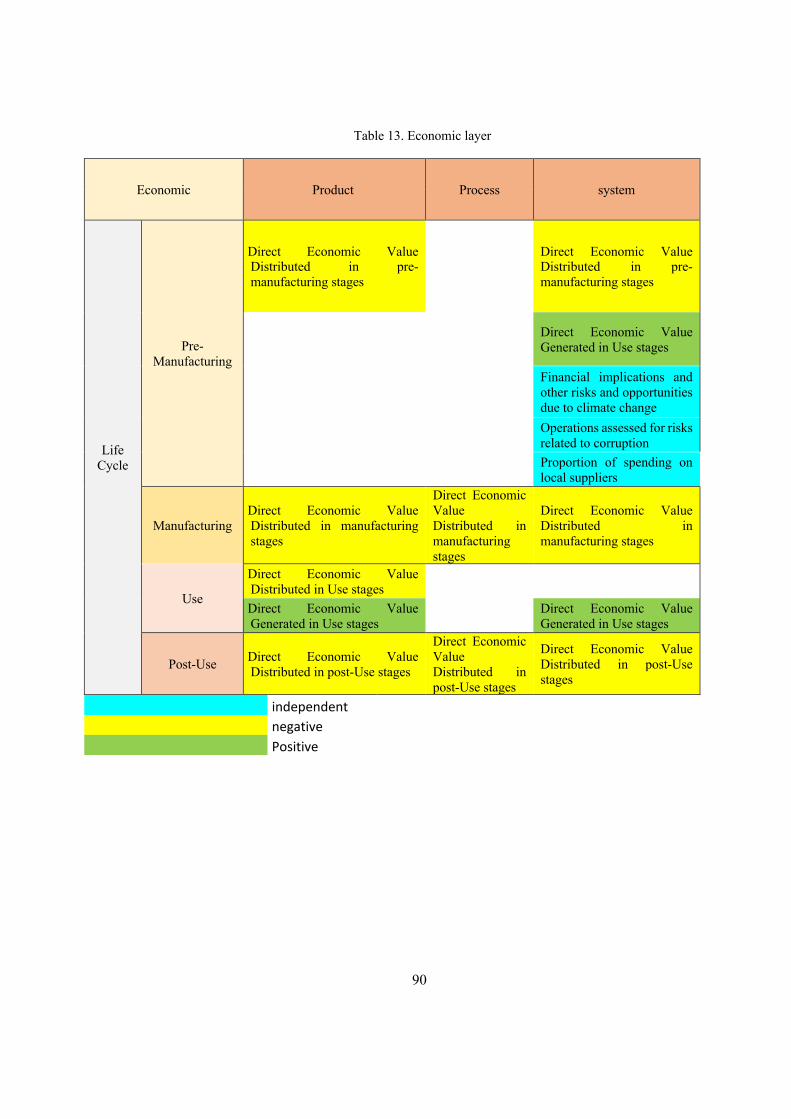
90
Table 13. Economic layer
Economic Product Process system
Life Cycle
Pre-Manufacturing
Direct Economic Value Distributed in pre-manufacturing stages
Direct Economic Value Distributed in pre-manufacturing stages
Direct Economic Value Generated in Use stages
Financial implications and other risks and opportunities due to climate change
Operations assessed for risks related to corruption
Proportion of spending on local suppliers
Manufacturing Direct Economic Value Distributed in manufacturing stages
Direct Economic Value Distributed in manufacturing stages
Direct Economic Value Distributed in manufacturing stages
Use
Direct Economic Value Distributed in Use stages
Direct Economic Value Generated in Use stages
Direct Economic Value Generated in Use stages
Post-Use Direct Economic Value Distributed in post-Use stages
Direct Economic Value Distributed in post-Use stages
Direct Economic Value Distributed in post-Use stages
independent negative Positive
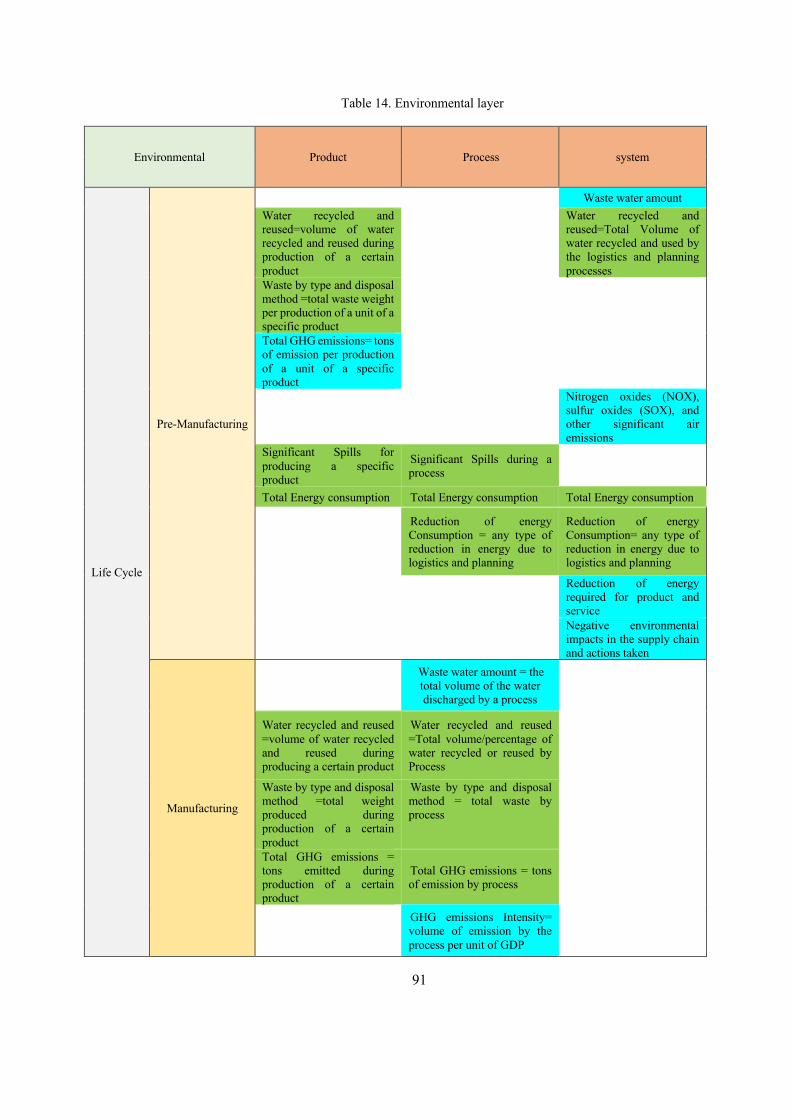
91
Table 14. Environmental layer
Environmental Product Process system
Life Cycle
Pre-Manufacturing
Waste water amount Water recycled and reused=volume of water recycled and reused during production of a certain product
Water recycled and reused=Total Volume of water recycled and used by the logistics and planning processes
Waste by type and disposal method =total waste weight per production of a unit of a specific product Total GHG emissions= tons of emission per production of a unit of a specific product
Nitrogen oxides (NOX), sulfur oxides (SOX), and other significant air emissions
Significant Spills for producing a specific product
Significant Spills during a process
Total Energy consumption Total Energy consumption Total Energy consumption
Reduction of energy Consumption = any type of reduction in energy due to logistics and planning
Reduction of energy Consumption= any type of reduction in energy due to logistics and planning
Reduction of energy required for product and service
Negative environmental impacts in the supply chain and actions taken
Manufacturing
Waste water amount = the total volume of the water discharged by a process
Water recycled and reused =volume of water recycled and reused during producing a certain product
Water recycled and reused =Total volume/percentage of water recycled or reused by Process
Waste by type and disposal method =total weight produced during production of a certain product
Waste by type and disposal method = total waste by process
Total GHG emissions = tons emitted during production of a certain product
Total GHG emissions = tons of emission by process
GHG emissions Intensity= volume of emission by the process per unit of GDP
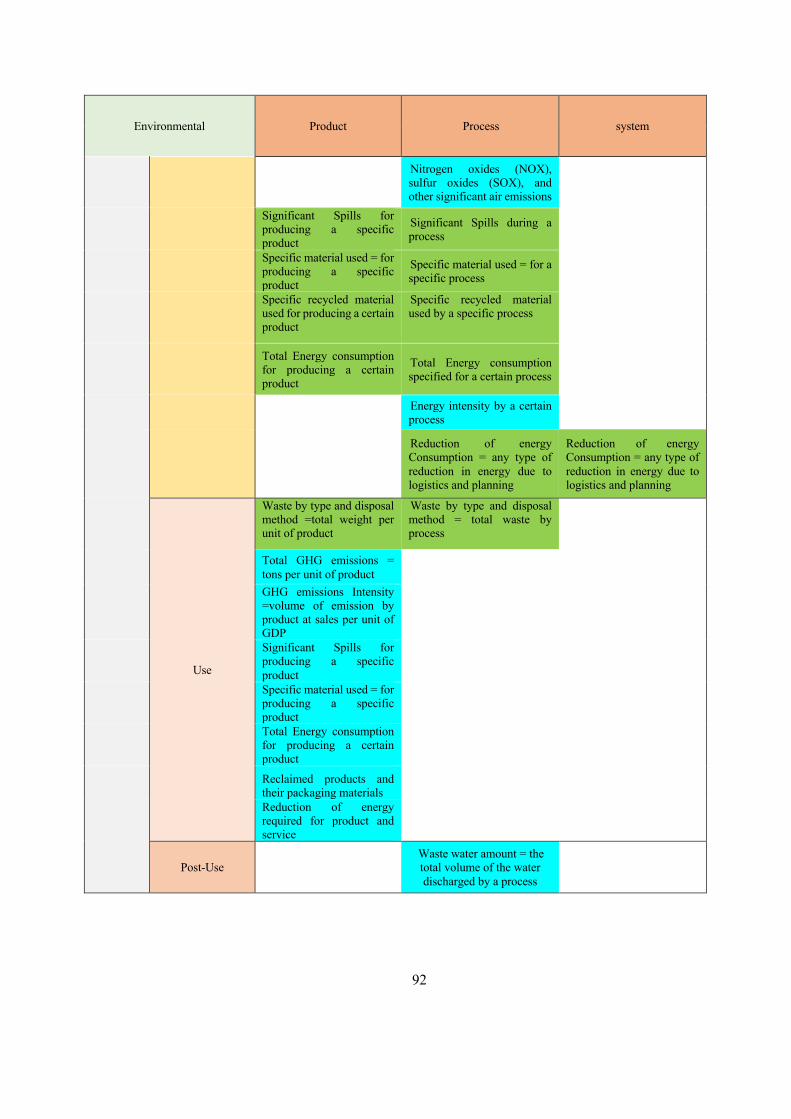
92
Environmental Product Process system
Nitrogen oxides (NOX), sulfur oxides (SOX), and other significant air emissions
Significant Spills for producing a specific product
Significant Spills during a process
Specific material used = for producing a specific product
Specific material used = for a specific process
Specific recycled material used for producing a certain product
Specific recycled material used by a specific process
Total Energy consumption for producing a certain product
Total Energy consumption specified for a certain process
Energy intensity by a certain process
Reduction of energy Consumption = any type of reduction in energy due to logistics and planning
Reduction of energy Consumption = any type of reduction in energy due to logistics and planning
Use
Waste by type and disposal method =total weight per unit of product
Waste by type and disposal method = total waste by process
Total GHG emissions = tons per unit of product GHG emissions Intensity =volume of emission by product at sales per unit of GDP Significant Spills for producing a specific product Specific material used = for producing a specific product Total Energy consumption for producing a certain product
Reclaimed products and their packaging materials Reduction of energy required for product and service
Post-Use
Waste water amount = the total volume of the water discharged by a process
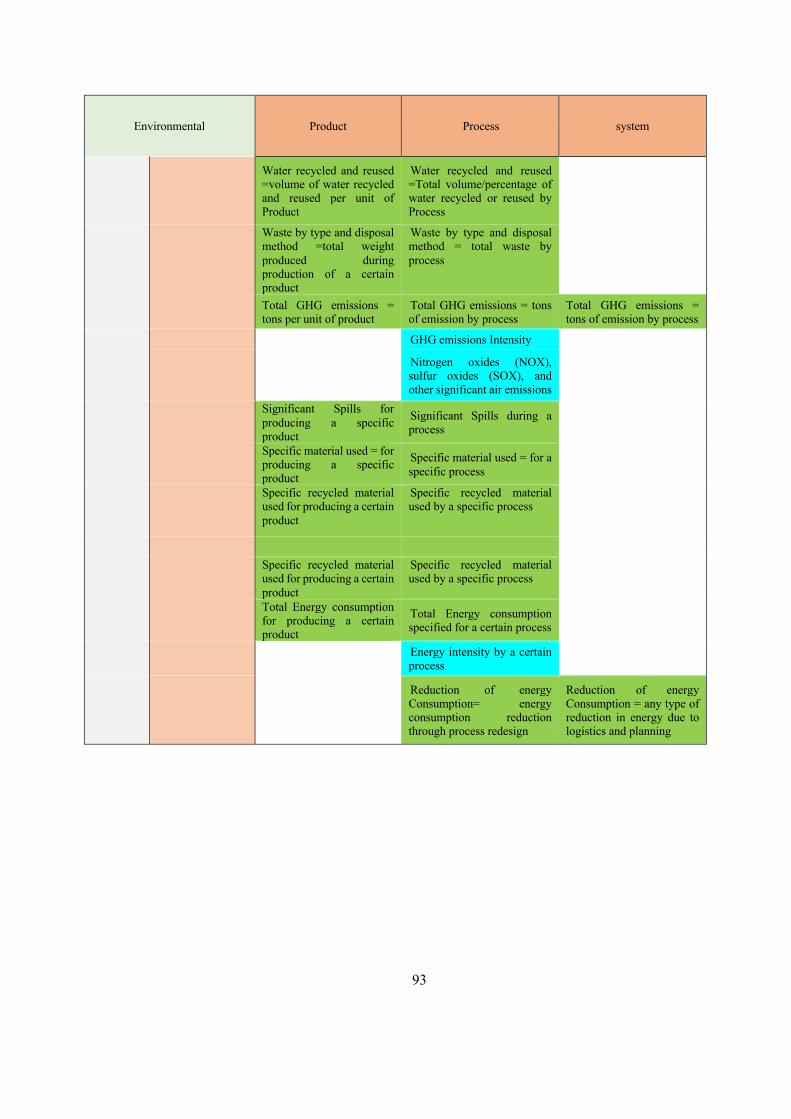
93
Environmental Product Process system
Water recycled and reused =volume of water recycled and reused per unit of Product
Water recycled and reused =Total volume/percentage of water recycled or reused by Process
Waste by type and disposal method =total weight produced during production of a certain product
Waste by type and disposal method = total waste by process
Total GHG emissions = tons per unit of product
Total GHG emissions = tons of emission by process
Total GHG emissions = tons of emission by process
GHG emissions Intensity
Nitrogen oxides (NOX), sulfur oxides (SOX), and other significant air emissions
Significant Spills for producing a specific product
Significant Spills during a process
Specific material used = for producing a specific product
Specific material used = for a specific process
Specific recycled material used for producing a certain product
Specific recycled material used by a specific process
Specific recycled material used for producing a certain product
Specific recycled material used by a specific process
Total Energy consumption for producing a certain product
Total Energy consumption specified for a certain process
Energy intensity by a certain process
Reduction of energy Consumption= energy consumption reduction through process redesign
Reduction of energy Consumption = any type of reduction in energy due to logistics and planning
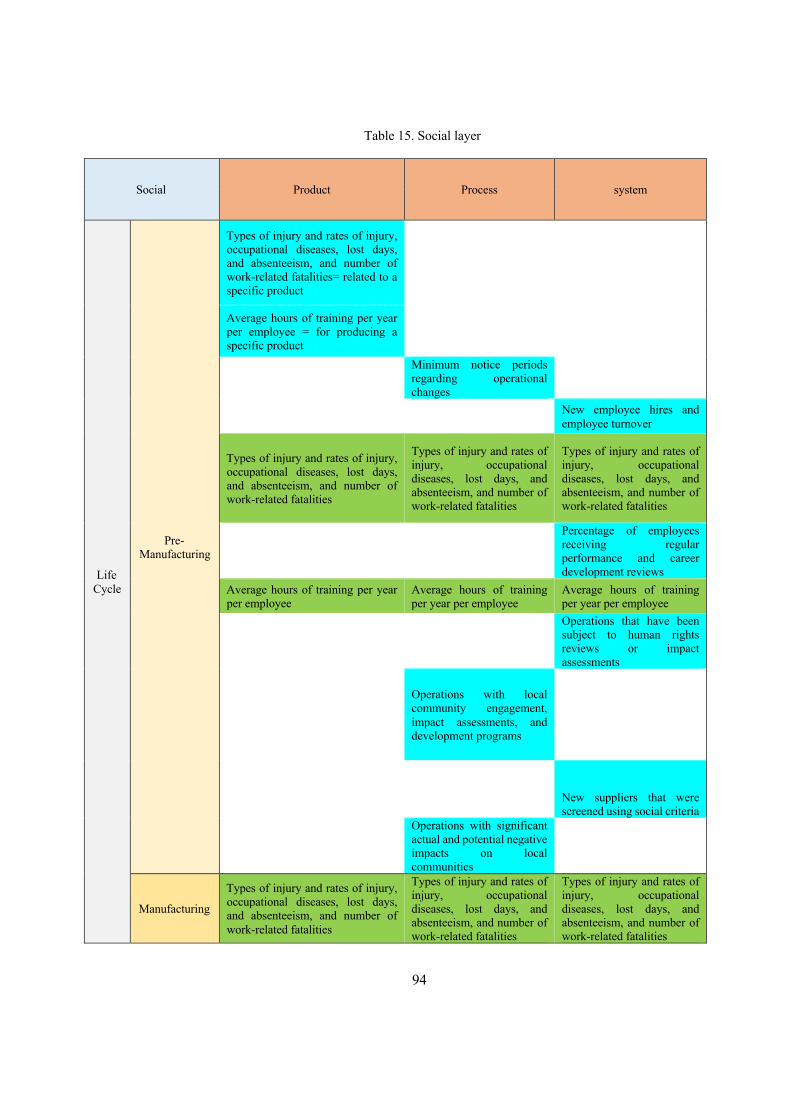
94
Table 15. Social layer
Social Product Process system
Life Cycle
Pre-Manufacturing
Types of injury and rates of injury, occupational diseases, lost days, and absenteeism, and number of work-related fatalities= related to a specific product Average hours of training per year per employee = for producing a specific product
Minimum notice periods regarding operational changes
New employee hires and employee turnover
Types of injury and rates of injury, occupational diseases, lost days, and absenteeism, and number of work-related fatalities
Types of injury and rates of injury, occupational diseases, lost days, and absenteeism, and number of work-related fatalities
Types of injury and rates of injury, occupational diseases, lost days, and absenteeism, and number of work-related fatalities
Percentage of employees receiving regular performance and career development reviews
Average hours of training per year per employee
Average hours of training per year per employee
Average hours of training per year per employee
Operations that have been subject to human rights reviews or impact assessments
Operations with local community engagement, impact assessments, and development programs
New suppliers that were screened using social criteria
Operations with significant actual and potential negative impacts on local communities
Manufacturing
Types of injury and rates of injury, occupational diseases, lost days, and absenteeism, and number of work-related fatalities
Types of injury and rates of injury, occupational diseases, lost days, and absenteeism, and number of work-related fatalities
Types of injury and rates of injury, occupational diseases, lost days, and absenteeism, and number of work-related fatalities
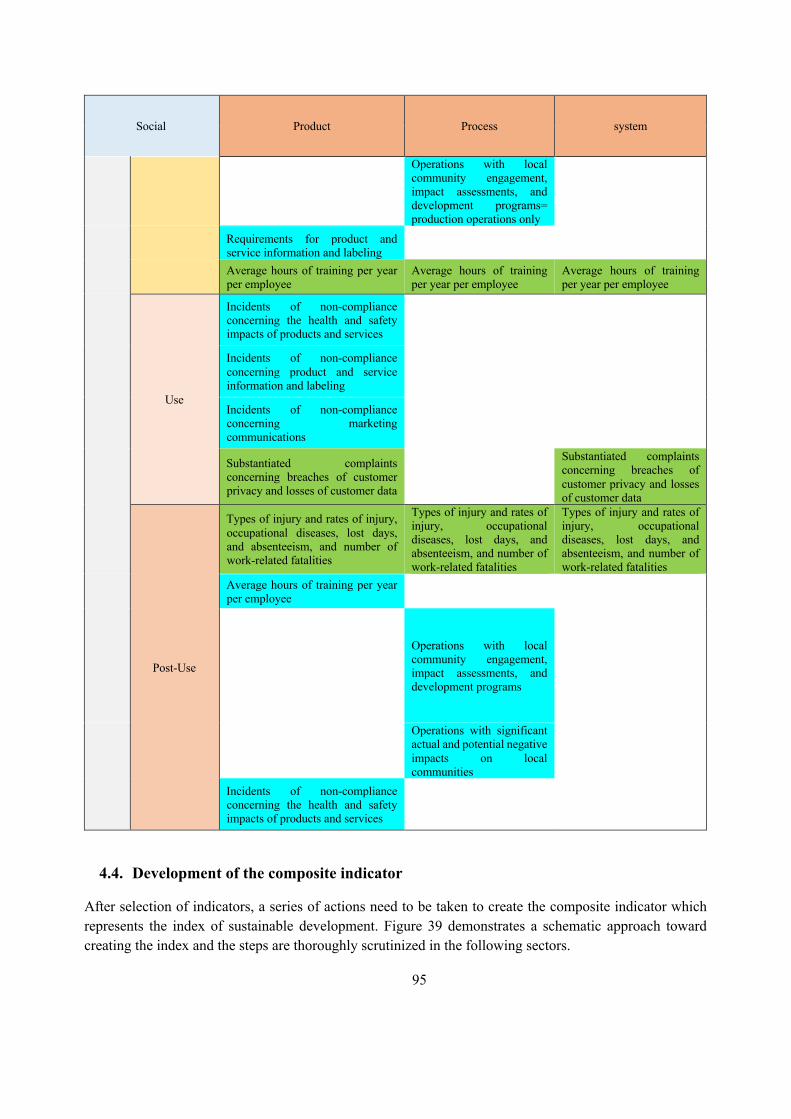
95
Social Product Process system
Operations with local community engagement, impact assessments, and development programs= production operations only
Requirements for product and service information and labeling
Average hours of training per year per employee
Average hours of training per year per employee
Average hours of training per year per employee
Use
Incidents of non-compliance concerning the health and safety impacts of products and services Incidents of non-compliance concerning product and service information and labeling Incidents of non-compliance concerning marketing communications
Substantiated complaints concerning breaches of customer privacy and losses of customer data
Substantiated complaints concerning breaches of customer privacy and losses of customer data
Post-Use
Types of injury and rates of injury, occupational diseases, lost days, and absenteeism, and number of work-related fatalities
Types of injury and rates of injury, occupational diseases, lost days, and absenteeism, and number of work-related fatalities
Types of injury and rates of injury, occupational diseases, lost days, and absenteeism, and number of work-related fatalities
Average hours of training per year per employee
Operations with local community engagement, impact assessments, and development programs
Operations with significant actual and potential negative impacts on local communities
Incidents of non-compliance concerning the health and safety impacts of products and services
4.4. Development of the composite indicator
After selection of indicators, a series of actions need to be taken to create the composite indicator which represents the index of sustainable development. Figure 39 demonstrates a schematic approach toward creating the index and the steps are thoroughly scrutinized in the following sectors.
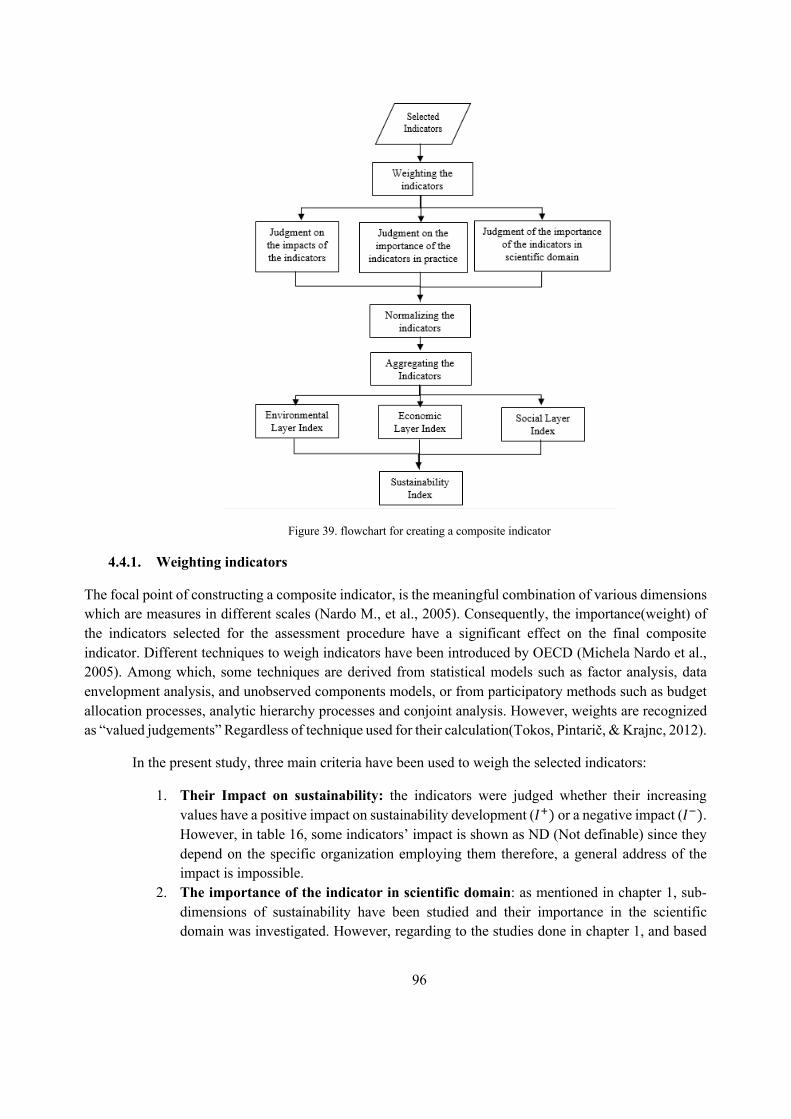
96
Figure 39. flowchart for creating a composite indicator
4.4.1. Weighting indicators
The focal point of constructing a composite indicator, is the meaningful combination of various dimensions which are measures in different scales (Nardo M., et al., 2005). Consequently, the importance(weight) of the indicators selected for the assessment procedure have a significant effect on the final composite indicator. Different techniques to weigh indicators have been introduced by OECD (Michela Nardo et al., 2005). Among which, some techniques are derived from statistical models such as factor analysis, data envelopment analysis, and unobserved components models, or from participatory methods such as budget allocation processes, analytic hierarchy processes and conjoint analysis. However, weights are recognized as “valued judgements” Regardless of technique used for their calculation(Tokos, Pintarič, & Krajnc, 2012).
In the present study, three main criteria have been used to weigh the selected indicators:
1. Their Impact on sustainability: the indicators were judged whether their increasing values have a positive impact on sustainability development (𝐼%) or a negative impact (𝐼&). However, in table 16, some indicators’ impact is shown as ND (Not definable) since they depend on the specific organization employing them therefore, a general address of the impact is impossible.
2. The importance of the indicator in scientific domain: as mentioned in chapter 1, sub-dimensions of sustainability have been studied and their importance in the scientific domain was investigated. However, regarding to the studies done in chapter 1, and based
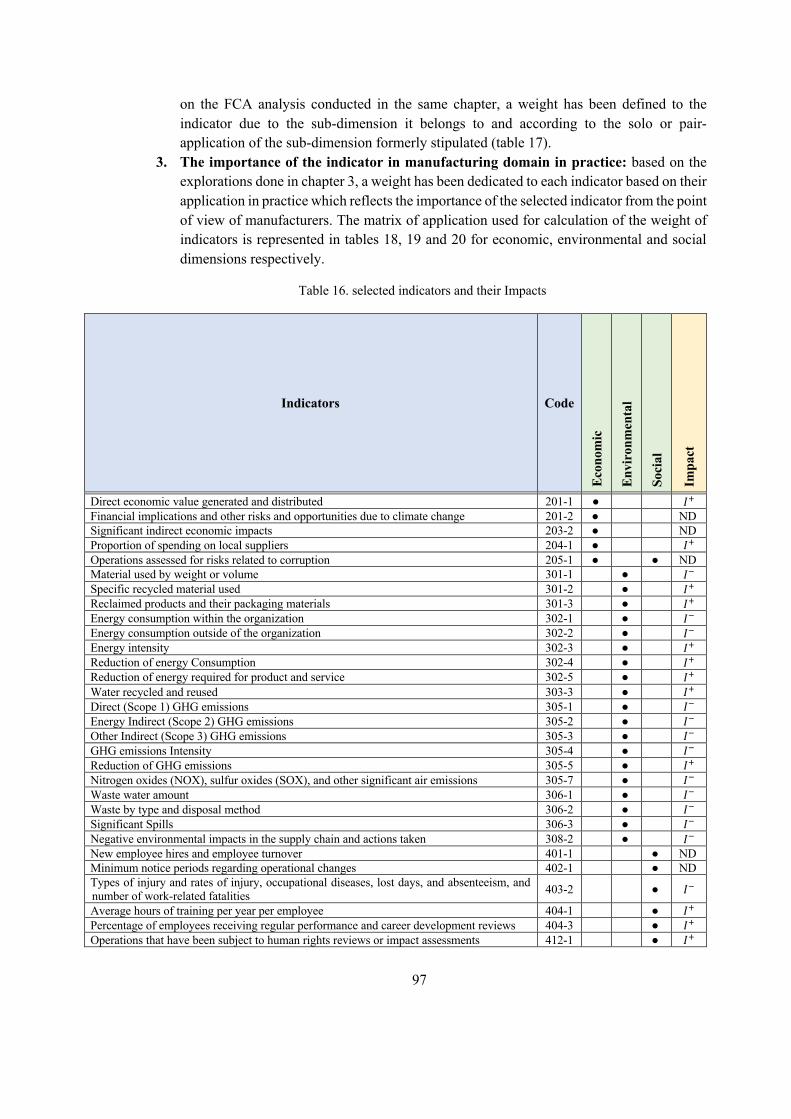
97
on the FCA analysis conducted in the same chapter, a weight has been defined to the indicator due to the sub-dimension it belongs to and according to the solo or pair-application of the sub-dimension formerly stipulated (table 17).
3. The importance of the indicator in manufacturing domain in practice: based on the explorations done in chapter 3, a weight has been dedicated to each indicator based on their application in practice which reflects the importance of the selected indicator from the point of view of manufacturers. The matrix of application used for calculation of the weight of indicators is represented in tables 18, 19 and 20 for economic, environmental and social dimensions respectively.
Table 16. selected indicators and their Impacts
Indicators Code
Econ
omic
Envi
ronm
enta
l
Soci
al
Impa
ct
Direct economic value generated and distributed 201-1 ● 𝐼! Financial implications and other risks and opportunities due to climate change 201-2 ● ND Significant indirect economic impacts 203-2 ● ND Proportion of spending on local suppliers 204-1 ● 𝐼! Operations assessed for risks related to corruption 205-1 ● ● ND Material used by weight or volume 301-1 ● 𝐼" Specific recycled material used 301-2 ● 𝐼! Reclaimed products and their packaging materials 301-3 ● 𝐼! Energy consumption within the organization 302-1 ● 𝐼" Energy consumption outside of the organization 302-2 ● 𝐼" Energy intensity 302-3 ● 𝐼! Reduction of energy Consumption 302-4 ● 𝐼! Reduction of energy required for product and service 302-5 ● 𝐼! Water recycled and reused 303-3 ● 𝐼! Direct (Scope 1) GHG emissions 305-1 ● 𝐼" Energy Indirect (Scope 2) GHG emissions 305-2 ● 𝐼" Other Indirect (Scope 3) GHG emissions 305-3 ● 𝐼" GHG emissions Intensity 305-4 ● 𝐼" Reduction of GHG emissions 305-5 ● 𝐼! Nitrogen oxides (NOX), sulfur oxides (SOX), and other significant air emissions 305-7 ● 𝐼" Waste water amount 306-1 ● 𝐼" Waste by type and disposal method 306-2 ● 𝐼" Significant Spills 306-3 ● 𝐼" Negative environmental impacts in the supply chain and actions taken 308-2 ● 𝐼" New employee hires and employee turnover 401-1 ● ND Minimum notice periods regarding operational changes 402-1 ● ND Types of injury and rates of injury, occupational diseases, lost days, and absenteeism, and number of work-related fatalities 403-2 ● 𝐼"
Average hours of training per year per employee 404-1 ● 𝐼! Percentage of employees receiving regular performance and career development reviews 404-3 ● 𝐼! Operations that have been subject to human rights reviews or impact assessments 412-1 ● 𝐼!
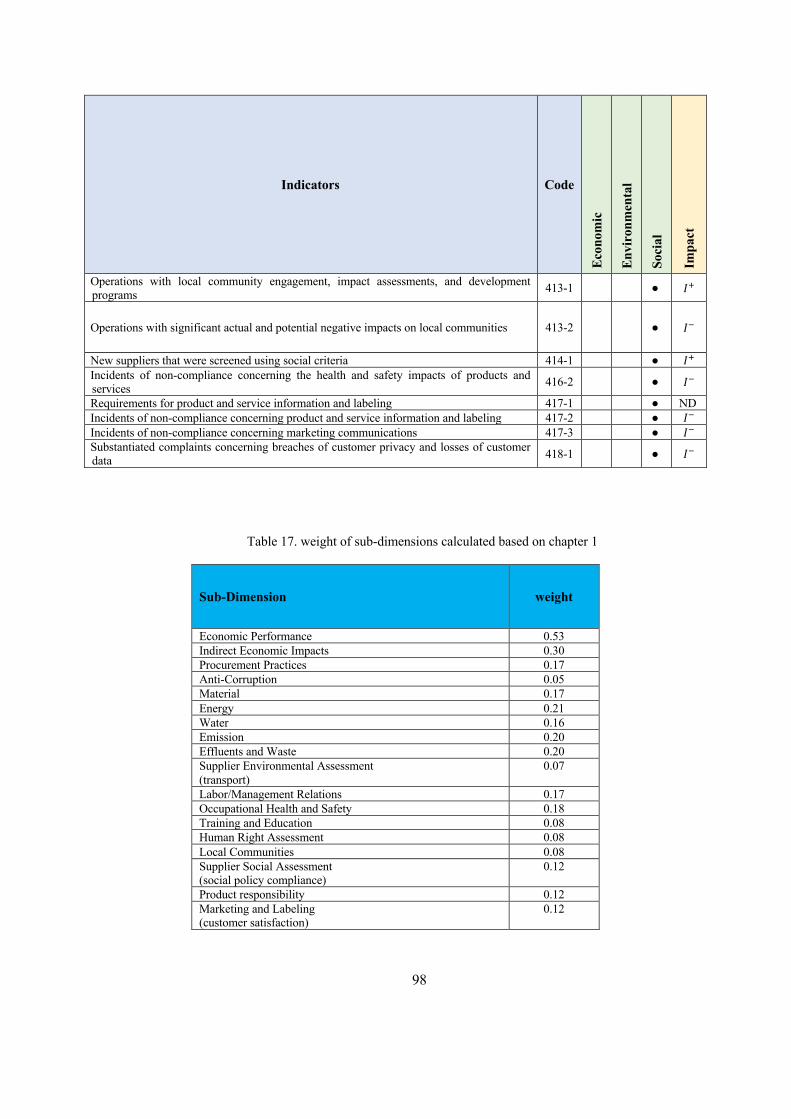
98
Indicators Code
Econ
omic
Envi
ronm
enta
l
Soci
al
Impa
ct
Operations with local community engagement, impact assessments, and development programs 413-1 ● 𝐼!
Operations with significant actual and potential negative impacts on local communities 413-2 ● 𝐼"
New suppliers that were screened using social criteria 414-1 ● 𝐼! Incidents of non-compliance concerning the health and safety impacts of products and services 416-2 ● 𝐼"
Requirements for product and service information and labeling 417-1 ● ND Incidents of non-compliance concerning product and service information and labeling 417-2 ● 𝐼" Incidents of non-compliance concerning marketing communications 417-3 ● 𝐼" Substantiated complaints concerning breaches of customer privacy and losses of customer data 418-1 ● 𝐼"
Table 17. weight of sub-dimensions calculated based on chapter 1
Sub-Dimension weight
Economic Performance 0.53 Indirect Economic Impacts 0.30 Procurement Practices 0.17 Anti-Corruption 0.05 Material 0.17 Energy 0.21 Water 0.16 Emission 0.20 Effluents and Waste 0.20 Supplier Environmental Assessment (transport)
0.07
Labor/Management Relations 0.17 Occupational Health and Safety 0.18 Training and Education 0.08 Human Right Assessment 0.08 Local Communities 0.08 Supplier Social Assessment (social policy compliance)
0.12
Product responsibility 0.12 Marketing and Labeling (customer satisfaction)
0.12
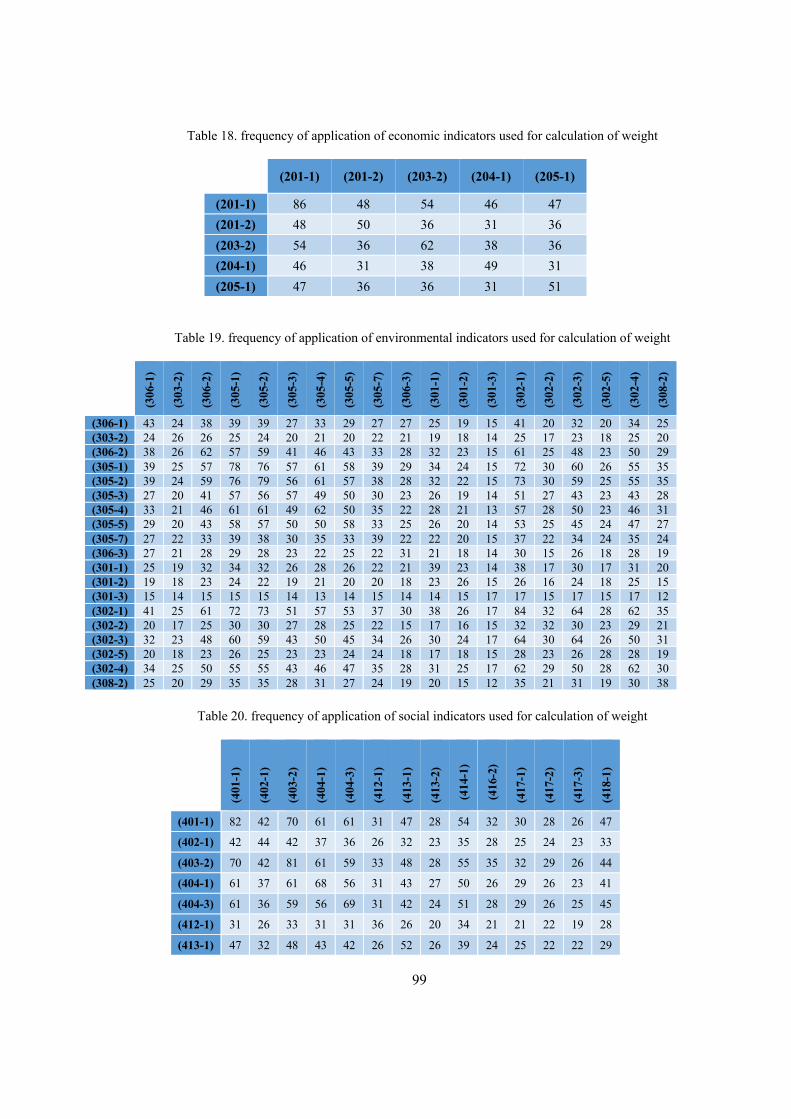
99
Table 18. frequency of application of economic indicators used for calculation of weight
(201-1) (201-2) (203-2) (204-1) (205-1)
(201-1) 86 48 54 46 47 (201-2) 48 50 36 31 36 (203-2) 54 36 62 38 36 (204-1) 46 31 38 49 31 (205-1) 47 36 36 31 51
Table 19. frequency of application of environmental indicators used for calculation of weight
(306
-1)
(303
-2)
(306
- 2)
(305
- 1)
(305
- 2)
(305
- 3)
(305
-4)
(305
-5)
(305
-7)
(306
-3)
(301
-1)
(301
- 2)
(301
- 3)
(302
-1)
(302
-2)
(302
- 3)
(302
-5)
(302
-4)
(308
- 2)
(306-1) 43 24 38 39 39 27 33 29 27 27 25 19 15 41 20 32 20 34 25 (303-2) 24 26 26 25 24 20 21 20 22 21 19 18 14 25 17 23 18 25 20 (306-2) 38 26 62 57 59 41 46 43 33 28 32 23 15 61 25 48 23 50 29 (305-1) 39 25 57 78 76 57 61 58 39 29 34 24 15 72 30 60 26 55 35 (305-2) 39 24 59 76 79 56 61 57 38 28 32 22 15 73 30 59 25 55 35 (305-3) 27 20 41 57 56 57 49 50 30 23 26 19 14 51 27 43 23 43 28 (305-4) 33 21 46 61 61 49 62 50 35 22 28 21 13 57 28 50 23 46 31 (305-5) 29 20 43 58 57 50 50 58 33 25 26 20 14 53 25 45 24 47 27 (305-7) 27 22 33 39 38 30 35 33 39 22 22 20 15 37 22 34 24 35 24 (306-3) 27 21 28 29 28 23 22 25 22 31 21 18 14 30 15 26 18 28 19 (301-1) 25 19 32 34 32 26 28 26 22 21 39 23 14 38 17 30 17 31 20 (301-2) 19 18 23 24 22 19 21 20 20 18 23 26 15 26 16 24 18 25 15 (301-3) 15 14 15 15 15 14 13 14 15 14 14 15 17 17 15 17 15 17 12 (302-1) 41 25 61 72 73 51 57 53 37 30 38 26 17 84 32 64 28 62 35 (302-2) 20 17 25 30 30 27 28 25 22 15 17 16 15 32 32 30 23 29 21 (302-3) 32 23 48 60 59 43 50 45 34 26 30 24 17 64 30 64 26 50 31 (302-5) 20 18 23 26 25 23 23 24 24 18 17 18 15 28 23 26 28 28 19 (302-4) 34 25 50 55 55 43 46 47 35 28 31 25 17 62 29 50 28 62 30 (308-2) 25 20 29 35 35 28 31 27 24 19 20 15 12 35 21 31 19 30 38
Table 20. frequency of application of social indicators used for calculation of weight
(401
-1)
(402
-1)
(403
-2)
(404
-1)
(404
-3)
(412
- 1)
(413
- 1)
(413
- 2)
(414
- 1)
(416
- 2)
(417
- 1)
(417
- 2)
(417
- 3)
(418
- 1)
(401-1) 82 42 70 61 61 31 47 28 54 32 30 28 26 47
(402-1) 42 44 42 37 36 26 32 23 35 28 25 24 23 33
(403-2) 70 42 81 61 59 33 48 28 55 35 32 29 26 44
(404-1) 61 37 61 68 56 31 43 27 50 26 29 26 23 41
(404-3) 61 36 59 56 69 31 42 24 51 28 29 26 25 45
(412-1) 31 26 33 31 31 36 26 20 34 21 21 22 19 28
(413-1) 47 32 48 43 42 26 52 26 39 24 25 22 22 29
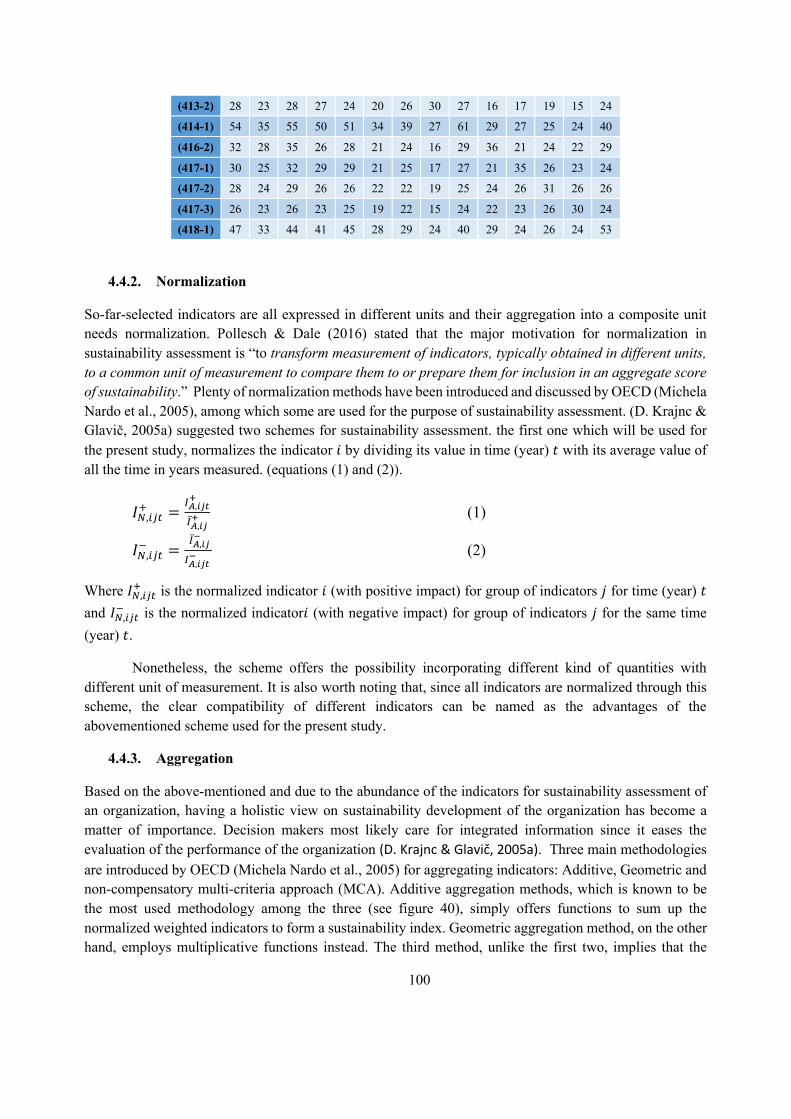
100
(413-2) 28 23 28 27 24 20 26 30 27 16 17 19 15 24
(414-1) 54 35 55 50 51 34 39 27 61 29 27 25 24 40
(416-2) 32 28 35 26 28 21 24 16 29 36 21 24 22 29
(417-1) 30 25 32 29 29 21 25 17 27 21 35 26 23 24
(417-2) 28 24 29 26 26 22 22 19 25 24 26 31 26 26
(417-3) 26 23 26 23 25 19 22 15 24 22 23 26 30 24
(418-1) 47 33 44 41 45 28 29 24 40 29 24 26 24 53
4.4.2. Normalization
So-far-selected indicators are all expressed in different units and their aggregation into a composite unit needs normalization. Pollesch & Dale (2016) stated that the major motivation for normalization in sustainability assessment is “to transform measurement of indicators, typically obtained in different units, to a common unit of measurement to compare them to or prepare them for inclusion in an aggregate score of sustainability.” Plenty of normalization methods have been introduced and discussed by OECD (Michela Nardo et al., 2005), among which some are used for the purpose of sustainability assessment. (D. Krajnc & Glavič, 2005a) suggested two schemes for sustainability assessment. the first one which will be used for the present study, normalizes the indicator 𝑖 by dividing its value in time (year) 𝑡 with its average value of all the time in years measured. (equations (1) and (2)).
𝐼!,#$%& ='!,#$%&
'!̅,#$& (1)
𝐼!,#$%) ='!̅,#$'
'!,#$%' (2)
Where 𝐼',)*+% is the normalized indicator 𝑖 (with positive impact) for group of indicators 𝑗 for time (year) 𝑡 and 𝐼',)*+& is the normalized indicator𝑖 (with negative impact) for group of indicators 𝑗 for the same time (year) 𝑡.
Nonetheless, the scheme offers the possibility incorporating different kind of quantities with different unit of measurement. It is also worth noting that, since all indicators are normalized through this scheme, the clear compatibility of different indicators can be named as the advantages of the abovementioned scheme used for the present study.
4.4.3. Aggregation
Based on the above-mentioned and due to the abundance of the indicators for sustainability assessment of an organization, having a holistic view on sustainability development of the organization has become a matter of importance. Decision makers most likely care for integrated information since it eases the evaluation of the performance of the organization (D. Krajnc & Glavič, 2005a). Three main methodologies are introduced by OECD (Michela Nardo et al., 2005) for aggregating indicators: Additive, Geometric and non-compensatory multi-criteria approach (MCA). Additive aggregation methods, which is known to be the most used methodology among the three (see figure 40), simply offers functions to sum up the normalized weighted indicators to form a sustainability index. Geometric aggregation method, on the other hand, employs multiplicative functions instead. The third method, unlike the first two, implies that the
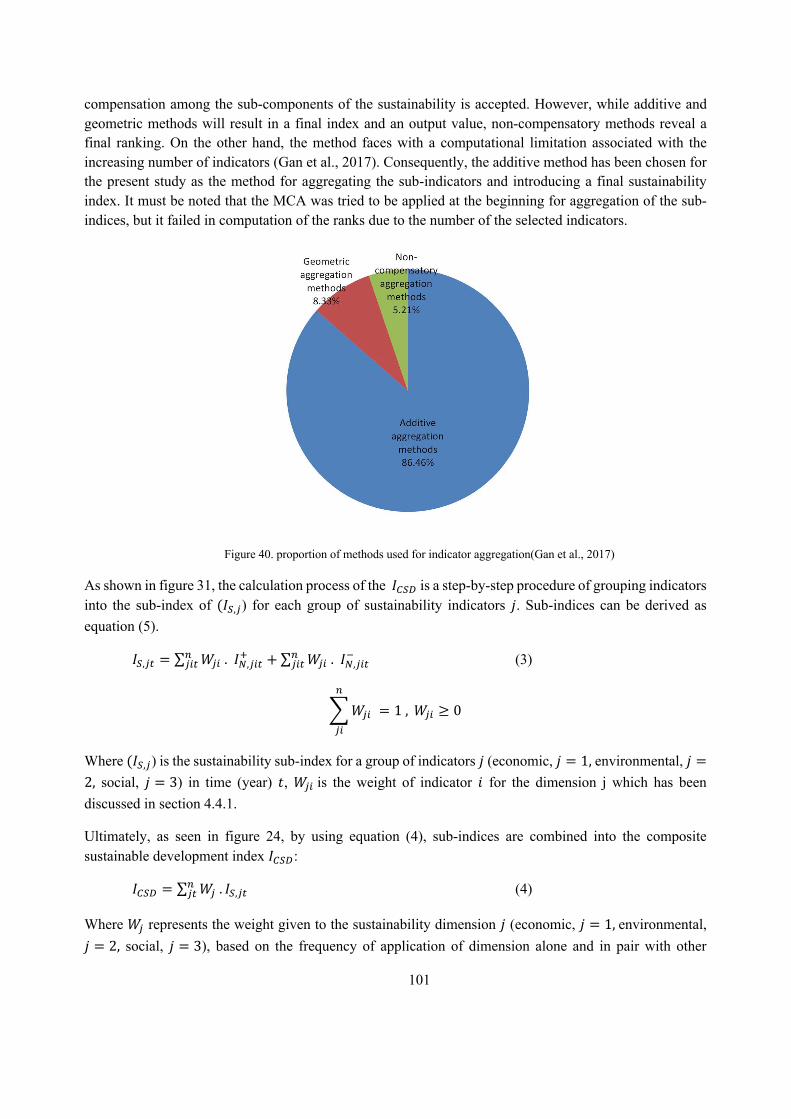
101
compensation among the sub-components of the sustainability is accepted. However, while additive and geometric methods will result in a final index and an output value, non-compensatory methods reveal a final ranking. On the other hand, the method faces with a computational limitation associated with the increasing number of indicators (Gan et al., 2017). Consequently, the additive method has been chosen for the present study as the method for aggregating the sub-indicators and introducing a final sustainability index. It must be noted that the MCA was tried to be applied at the beginning for aggregation of the sub-indices, but it failed in computation of the ranks due to the number of the selected indicators.
Figure 40. proportion of methods used for indicator aggregation(Gan et al., 2017)
As shown in figure 31, the calculation process of the 𝐼,-. is a step-by-step procedure of grouping indicators into the sub-index of (𝐼-,*) for each group of sustainability indicators 𝑗. Sub-indices can be derived as equation (5).
𝐼-,*+ = ∑ 𝑊*) .𝐼',*)+%#*)+ +∑ 𝑊*) .𝐼',*)+&#
*)+ (3)
F𝑊*) = 1,#
*)
𝑊*) ≥ 0
Where (𝐼-,*) is the sustainability sub-index for a group of indicators 𝑗 (economic, 𝑗 = 1,environmental, 𝑗 =2, social, 𝑗 = 3) in time (year) 𝑡, 𝑊*) is the weight of indicator 𝑖 for the dimension j which has been discussed in section 4.4.1.
Ultimately, as seen in figure 24, by using equation (4), sub-indices are combined into the composite sustainable development index 𝐼,-.:
𝐼,-. = ∑ 𝑊* . 𝐼-,*+#*+ (4)
Where 𝑊* represents the weight given to the sustainability dimension 𝑗 (economic, 𝑗 = 1,environmental, 𝑗 = 2, social, 𝑗 = 3), based on the frequency of application of dimension alone and in pair with other
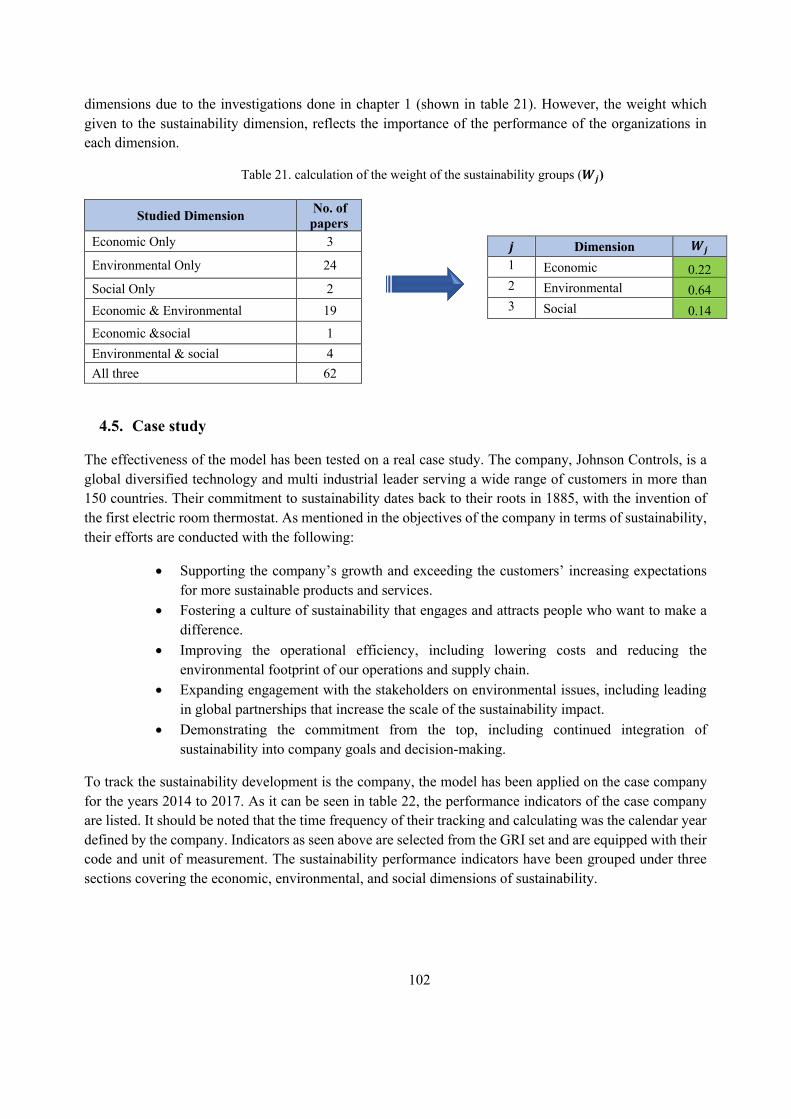
102
dimensions due to the investigations done in chapter 1 (shown in table 21). However, the weight which given to the sustainability dimension, reflects the importance of the performance of the organizations in each dimension.
Table 21. calculation of the weight of the sustainability groups (𝑾𝒋)
Studied Dimension No. of papers
Economic Only 3
Environmental Only 24
Social Only 2 Economic & Environmental 19
Economic &social 1 Environmental & social 4 All three 62
4.5. Case study
The effectiveness of the model has been tested on a real case study. The company, Johnson Controls, is a global diversified technology and multi industrial leader serving a wide range of customers in more than 150 countries. Their commitment to sustainability dates back to their roots in 1885, with the invention of the first electric room thermostat. As mentioned in the objectives of the company in terms of sustainability, their efforts are conducted with the following:
• Supporting the company’s growth and exceeding the customers’ increasing expectations for more sustainable products and services.
• Fostering a culture of sustainability that engages and attracts people who want to make a difference.
• Improving the operational efficiency, including lowering costs and reducing the environmental footprint of our operations and supply chain.
• Expanding engagement with the stakeholders on environmental issues, including leading in global partnerships that increase the scale of the sustainability impact.
• Demonstrating the commitment from the top, including continued integration of sustainability into company goals and decision-making.
To track the sustainability development is the company, the model has been applied on the case company for the years 2014 to 2017. As it can be seen in table 22, the performance indicators of the case company are listed. It should be noted that the time frequency of their tracking and calculating was the calendar year defined by the company. Indicators as seen above are selected from the GRI set and are equipped with their code and unit of measurement. The sustainability performance indicators have been grouped under three sections covering the economic, environmental, and social dimensions of sustainability.
𝒋 Dimension 𝑾𝒋 1 Economic 0.22 2 Environmental 0.64 3 Social 0.14
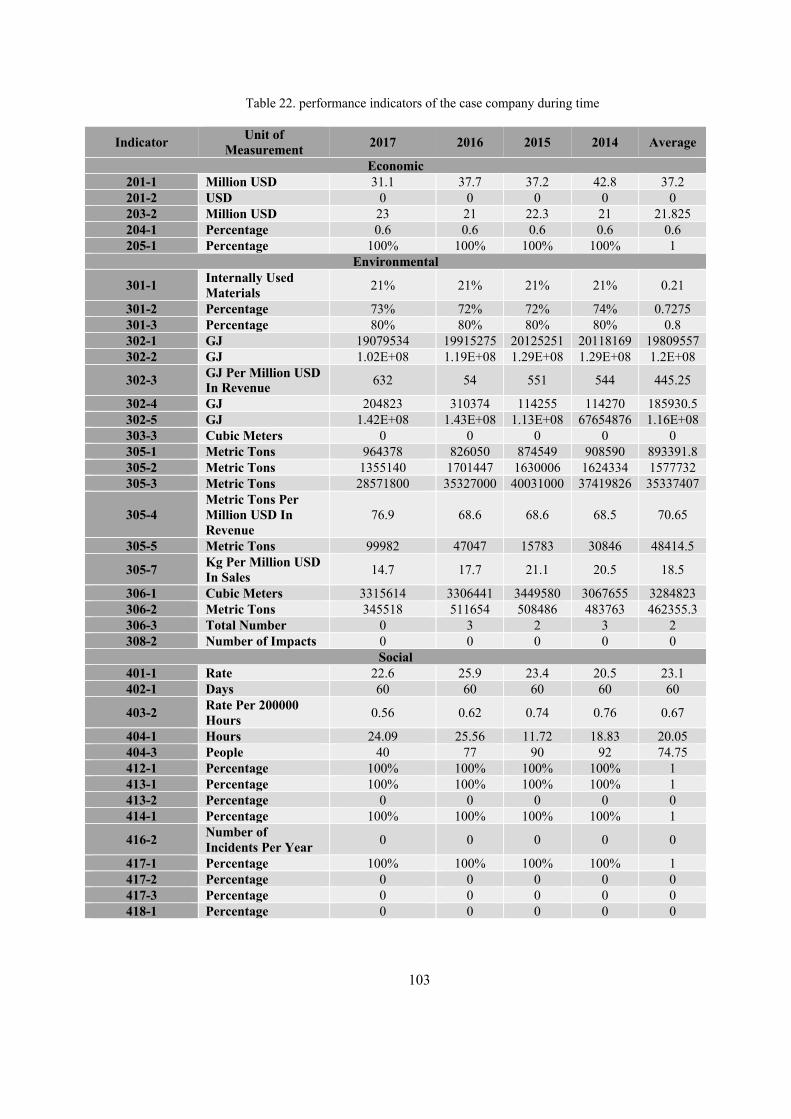
103
Table 22. performance indicators of the case company during time
Indicator Unit of Measurement 2017 2016 2015 2014 Average
Economic 201-1 Million USD 31.1 37.7 37.2 42.8 37.2 201-2 USD 0 0 0 0 0 203-2 Million USD 23 21 22.3 21 21.825 204-1 Percentage 0.6 0.6 0.6 0.6 0.6 205-1 Percentage 100% 100% 100% 100% 1
Environmental
301-1 Internally Used Materials 21% 21% 21% 21% 0.21
301-2 Percentage 73% 72% 72% 74% 0.7275 301-3 Percentage 80% 80% 80% 80% 0.8 302-1 GJ 19079534 19915275 20125251 20118169 19809557 302-2 GJ 1.02E+08 1.19E+08 1.29E+08 1.29E+08 1.2E+08
302-3 GJ Per Million USD In Revenue 632 54 551 544 445.25
302-4 GJ 204823 310374 114255 114270 185930.5 302-5 GJ 1.42E+08 1.43E+08 1.13E+08 67654876 1.16E+08 303-3 Cubic Meters 0 0 0 0 0 305-1 Metric Tons 964378 826050 874549 908590 893391.8 305-2 Metric Tons 1355140 1701447 1630006 1624334 1577732 305-3 Metric Tons 28571800 35327000 40031000 37419826 35337407
305-4 Metric Tons Per Million USD In Revenue
76.9 68.6 68.6 68.5 70.65
305-5 Metric Tons 99982 47047 15783 30846 48414.5
305-7 Kg Per Million USD In Sales 14.7 17.7 21.1 20.5 18.5
306-1 Cubic Meters 3315614 3306441 3449580 3067655 3284823 306-2 Metric Tons 345518 511654 508486 483763 462355.3 306-3 Total Number 0 3 2 3 2 308-2 Number of Impacts 0 0 0 0 0
Social 401-1 Rate 22.6 25.9 23.4 20.5 23.1 402-1 Days 60 60 60 60 60
403-2 Rate Per 200000 Hours 0.56 0.62 0.74 0.76 0.67
404-1 Hours 24.09 25.56 11.72 18.83 20.05 404-3 People 40 77 90 92 74.75 412-1 Percentage 100% 100% 100% 100% 1 413-1 Percentage 100% 100% 100% 100% 1 413-2 Percentage 0 0 0 0 0 414-1 Percentage 100% 100% 100% 100% 1
416-2 Number of Incidents Per Year 0 0 0 0 0
417-1 Percentage 100% 100% 100% 100% 1 417-2 Percentage 0 0 0 0 0 417-3 Percentage 0 0 0 0 0 418-1 Percentage 0 0 0 0 0
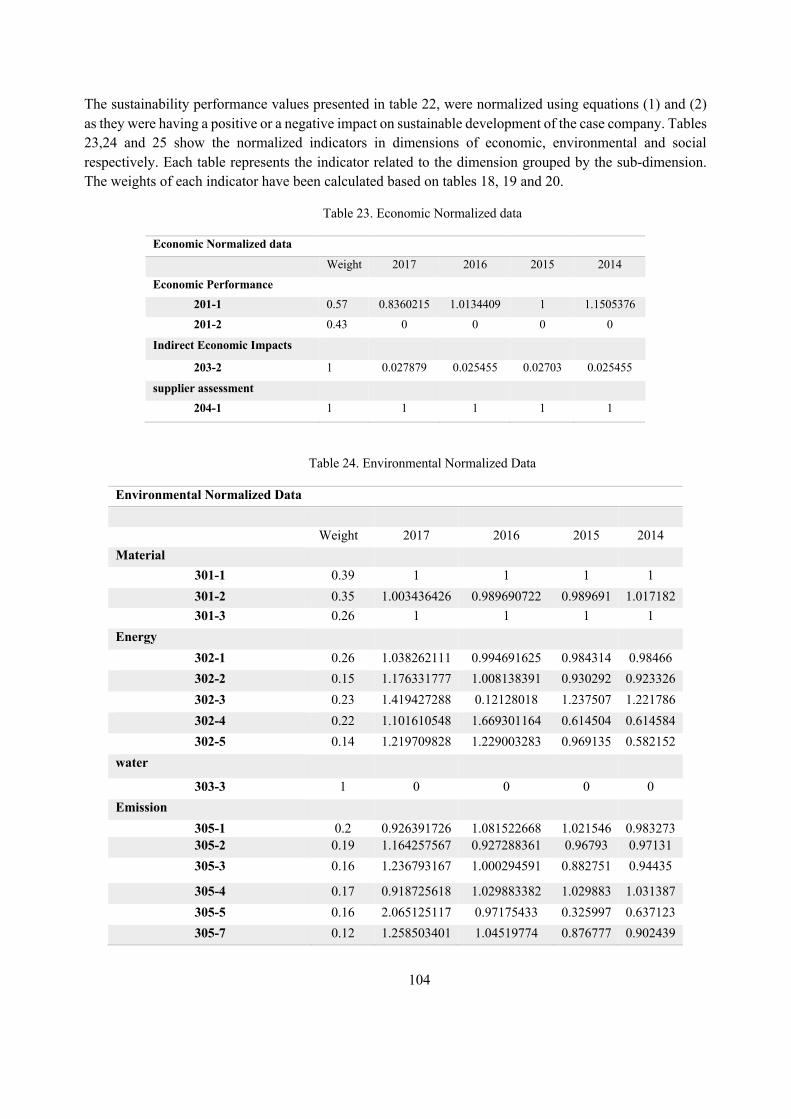
104
The sustainability performance values presented in table 22, were normalized using equations (1) and (2) as they were having a positive or a negative impact on sustainable development of the case company. Tables 23,24 and 25 show the normalized indicators in dimensions of economic, environmental and social respectively. Each table represents the indicator related to the dimension grouped by the sub-dimension. The weights of each indicator have been calculated based on tables 18, 19 and 20.
Table 23. Economic Normalized data
Economic Normalized data
Weight 2017 2016 2015 2014
Economic Performance 201-1 0.57 0.8360215 1.0134409 1 1.1505376
201-2 0.43 0 0 0 0
Indirect Economic Impacts
203-2 1 0.027879 0.025455 0.02703 0.025455
supplier assessment
204-1 1 1 1 1 1
Table 24. Environmental Normalized Data
Environmental Normalized Data
Weight 2017 2016 2015 2014 Material
301-1 0.39 1 1 1 1 301-2 0.35 1.003436426 0.989690722 0.989691 1.017182 301-3 0.26 1 1 1 1
Energy
302-1 0.26 1.038262111 0.994691625 0.984314 0.98466 302-2 0.15 1.176331777 1.008138391 0.930292 0.923326 302-3 0.23 1.419427288 0.12128018 1.237507 1.221786 302-4 0.22 1.101610548 1.669301164 0.614504 0.614584 302-5 0.14 1.219709828 1.229003283 0.969135 0.582152
water
303-3 1 0 0 0 0 Emission
305-1 0.2 0.926391726 1.081522668 1.021546 0.983273 305-2 0.19 1.164257567 0.927288361 0.96793 0.97131 305-3 0.16 1.236793167 1.000294591 0.882751 0.94435
305-4 0.17 0.918725618 1.029883382 1.029883 1.031387 305-5 0.16 2.065125117 0.97175433 0.325997 0.637123 305-7 0.12 1.258503401 1.04519774 0.876777 0.902439
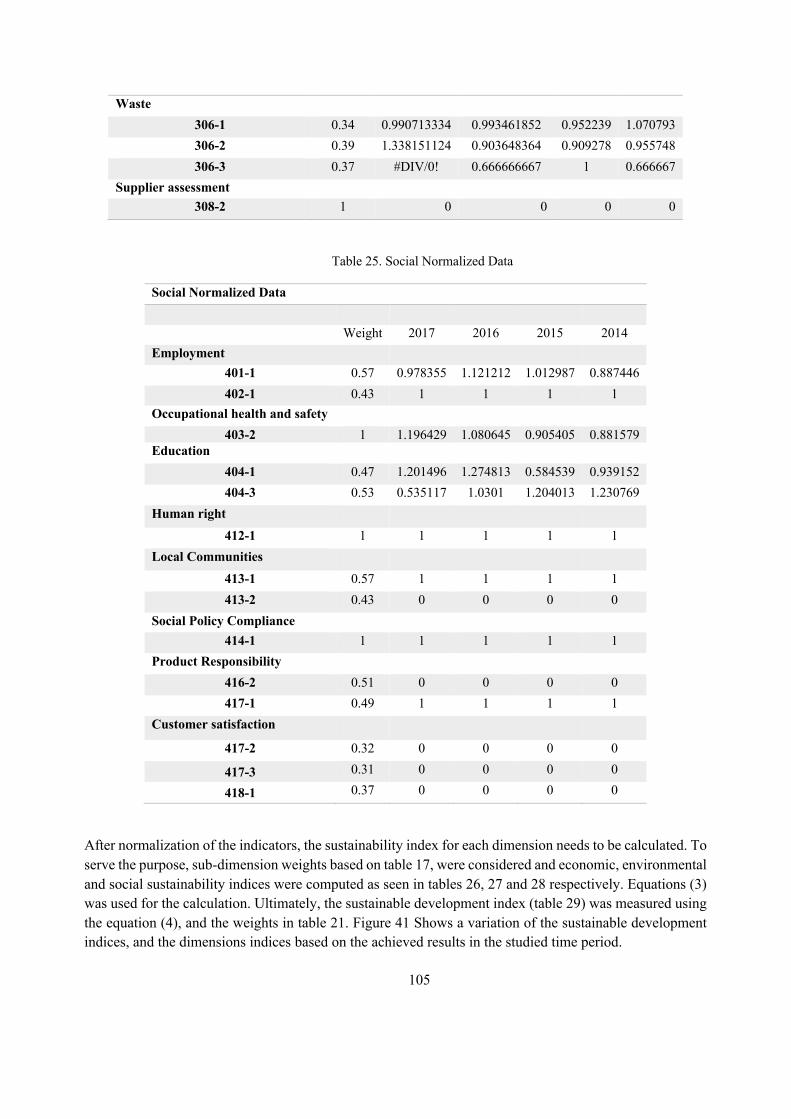
105
Waste
306-1 0.34 0.990713334 0.993461852 0.952239 1.070793 306-2 0.39 1.338151124 0.903648364 0.909278 0.955748 306-3 0.37 #DIV/0! 0.666666667 1 0.666667
Supplier assessment
308-2 1 0 0 0 0
Table 25. Social Normalized Data
Social Normalized Data
Weight 2017 2016 2015 2014 Employment
401-1 0.57 0.978355 1.121212 1.012987 0.887446 402-1 0.43 1 1 1 1
Occupational health and safety
403-2 1 1.196429 1.080645 0.905405 0.881579 Education
404-1 0.47 1.201496 1.274813 0.584539 0.939152 404-3 0.53 0.535117 1.0301 1.204013 1.230769
Human right
412-1 1 1 1 1 1 Local Communities
413-1 0.57 1 1 1 1 413-2 0.43 0 0 0 0
Social Policy Compliance
414-1 1 1 1 1 1 Product Responsibility
416-2 0.51 0 0 0 0 417-1 0.49 1 1 1 1
Customer satisfaction
417-2 0.32 0 0 0 0
417-3 0.31 0 0 0 0
418-1 0.37 0 0 0 0
After normalization of the indicators, the sustainability index for each dimension needs to be calculated. To serve the purpose, sub-dimension weights based on table 17, were considered and economic, environmental and social sustainability indices were computed as seen in tables 26, 27 and 28 respectively. Equations (3) was used for the calculation. Ultimately, the sustainable development index (table 29) was measured using the equation (4), and the weights in table 21. Figure 41 Shows a variation of the sustainable development indices, and the dimensions indices based on the achieved results in the studied time period.
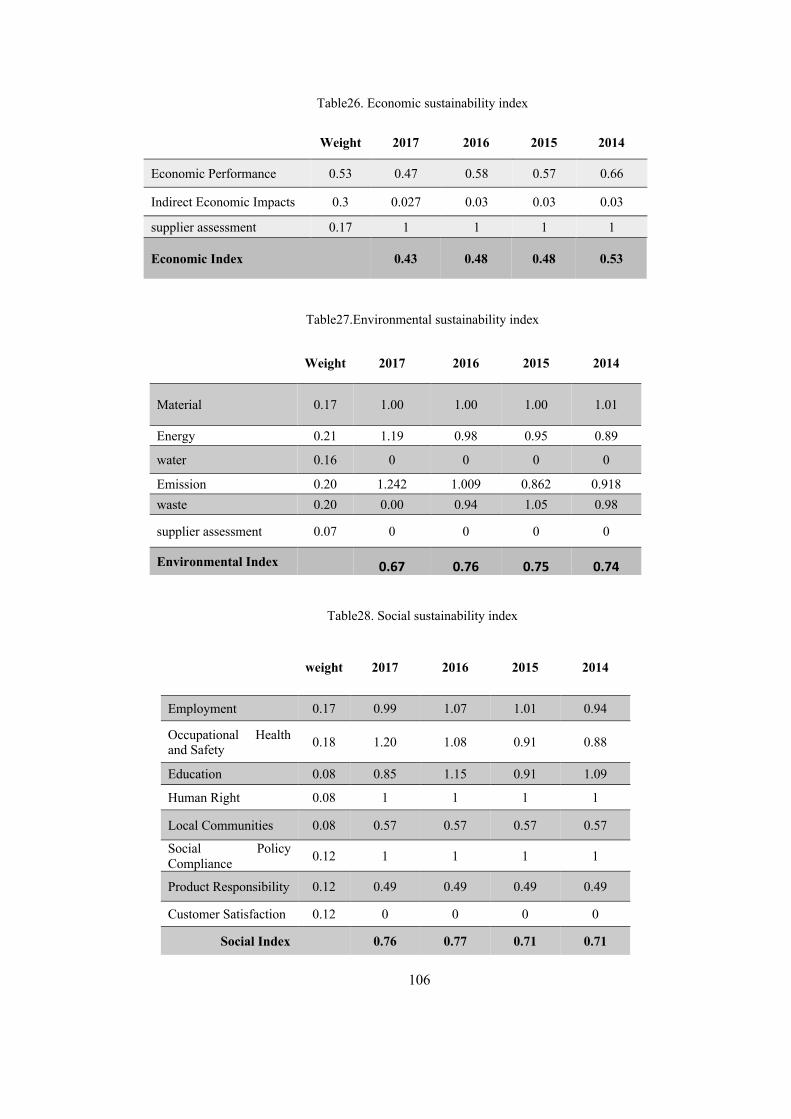
106
Table26. Economic sustainability index
Weight 2017 2016 2015 2014
Economic Performance 0.53 0.47 0.58 0.57 0.66
Indirect Economic Impacts 0.3 0.027 0.03 0.03 0.03
supplier assessment 0.17 1 1 1 1
Economic Index 0.43 0.48 0.48 0.53
Table27.Environmental sustainability index
Weight 2017 2016 2015 2014
Material 0.17 1.00 1.00 1.00 1.01
Energy 0.21 1.19 0.98 0.95 0.89
water 0.16 0 0 0 0
Emission 0.20 1.242 1.009 0.862 0.918 waste 0.20 0.00 0.94 1.05 0.98
supplier assessment 0.07 0 0 0 0
Environmental Index 0.67 0.76 0.75 0.74
Table28. Social sustainability index
weight 2017 2016 2015 2014
Employment 0.17 0.99 1.07 1.01 0.94
Occupational Health and Safety 0.18 1.20 1.08 0.91 0.88
Education 0.08 0.85 1.15 0.91 1.09
Human Right 0.08 1 1 1 1
Local Communities 0.08 0.57 0.57 0.57 0.57
Social Policy Compliance 0.12 1 1 1 1
Product Responsibility 0.12 0.49 0.49 0.49 0.49
Customer Satisfaction 0.12 0 0 0 0
Social Index 0.76 0.77 0.71 0.71
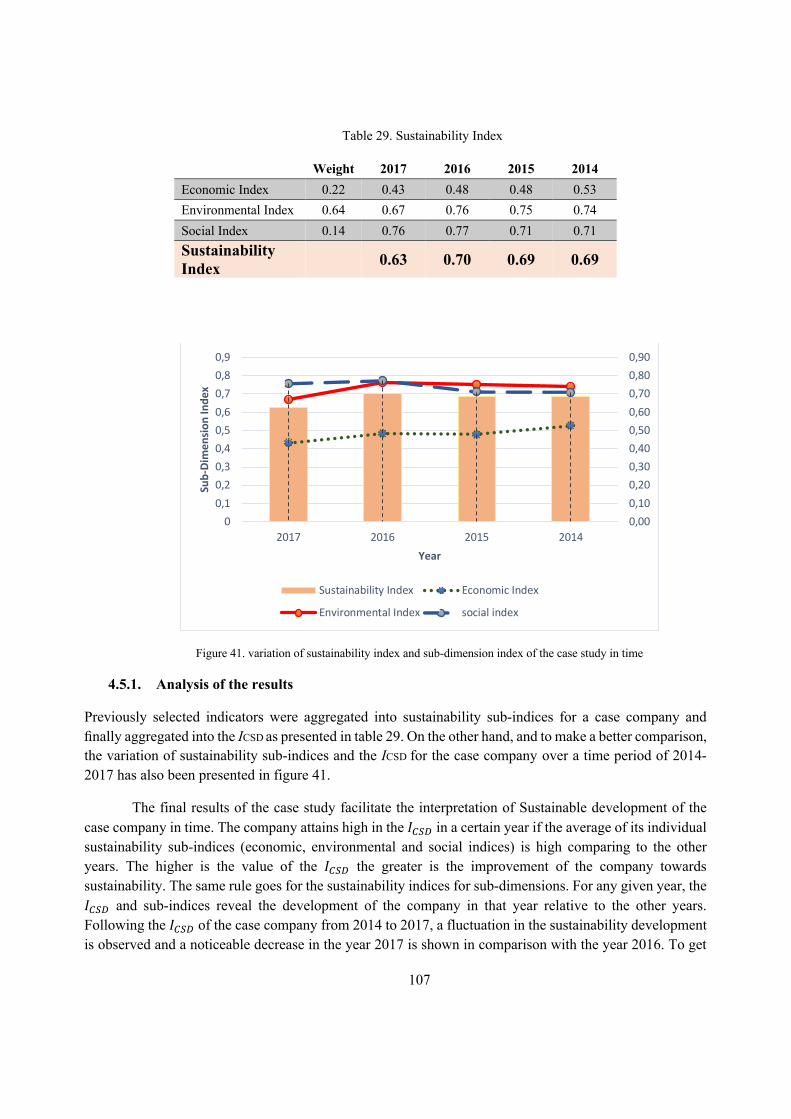
107
Table 29. Sustainability Index
Weight 2017 2016 2015 2014 Economic Index 0.22 0.43 0.48 0.48 0.53 Environmental Index 0.64 0.67 0.76 0.75 0.74 Social Index 0.14 0.76 0.77 0.71 0.71 Sustainability Index
0.63 0.70 0.69 0.69
Figure 41. variation of sustainability index and sub-dimension index of the case study in time
4.5.1. Analysis of the results
Previously selected indicators were aggregated into sustainability sub-indices for a case company and finally aggregated into the ICSD as presented in table 29. On the other hand, and to make a better comparison, the variation of sustainability sub-indices and the ICSD for the case company over a time period of 2014-2017 has also been presented in figure 41.
The final results of the case study facilitate the interpretation of Sustainable development of the case company in time. The company attains high in the 𝐼,-. in a certain year if the average of its individual sustainability sub-indices (economic, environmental and social indices) is high comparing to the other years. The higher is the value of the 𝐼,-. the greater is the improvement of the company towards sustainability. The same rule goes for the sustainability indices for sub-dimensions. For any given year, the 𝐼,-. and sub-indices reveal the development of the company in that year relative to the other years. Following the 𝐼,-. of the case company from 2014 to 2017, a fluctuation in the sustainability development is observed and a noticeable decrease in the year 2017 is shown in comparison with the year 2016. To get
00,10,20,30,40,50,60,70,80,9
2017 2016 2015 20140,000,100,200,300,400,500,600,700,800,90
Sub-
Dim
ensi
on In
dex
Year
Sustainability Index Economic Index
Environmental Index social index
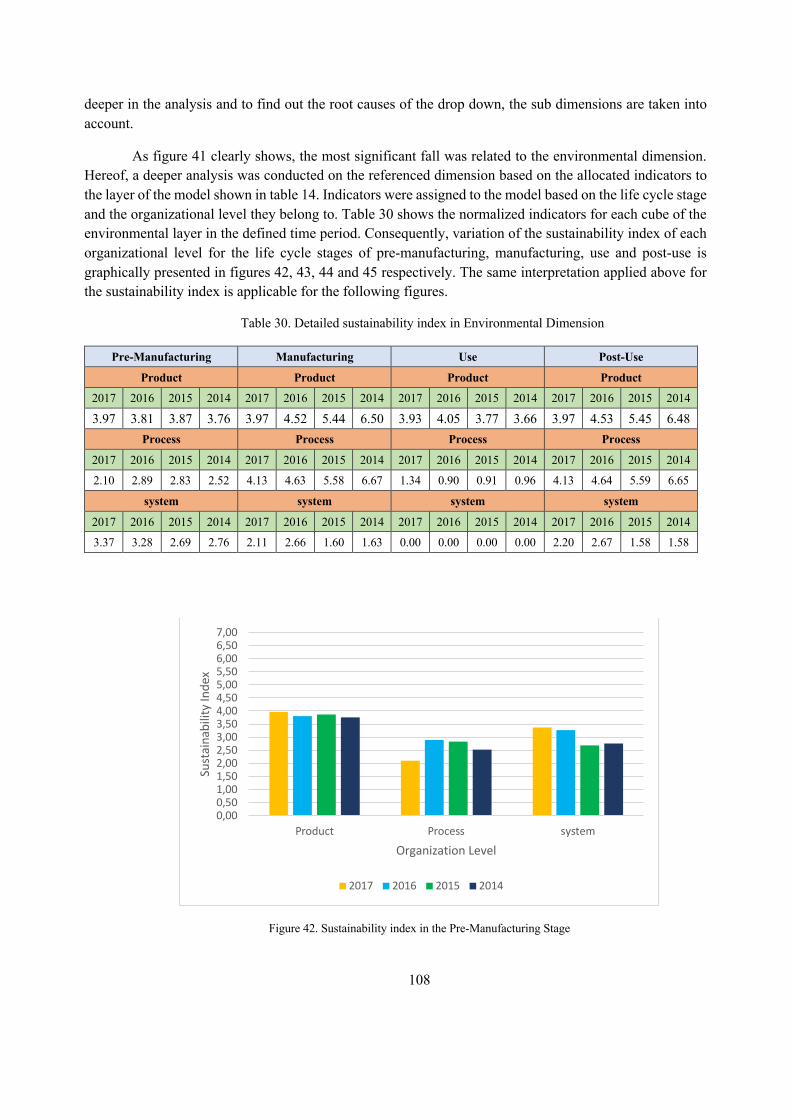
108
deeper in the analysis and to find out the root causes of the drop down, the sub dimensions are taken into account.
As figure 41 clearly shows, the most significant fall was related to the environmental dimension. Hereof, a deeper analysis was conducted on the referenced dimension based on the allocated indicators to the layer of the model shown in table 14. Indicators were assigned to the model based on the life cycle stage and the organizational level they belong to. Table 30 shows the normalized indicators for each cube of the environmental layer in the defined time period. Consequently, variation of the sustainability index of each organizational level for the life cycle stages of pre-manufacturing, manufacturing, use and post-use is graphically presented in figures 42, 43, 44 and 45 respectively. The same interpretation applied above for the sustainability index is applicable for the following figures.
Table 30. Detailed sustainability index in Environmental Dimension
Pre-Manufacturing Manufacturing Use Post-Use
Product Product Product Product
2017 2016 2015 2014 2017 2016 2015 2014 2017 2016 2015 2014 2017 2016 2015 2014
3.97 3.81 3.87 3.76 3.97 4.52 5.44 6.50 3.93 4.05 3.77 3.66 3.97 4.53 5.45 6.48 Process Process Process Process
2017 2016 2015 2014 2017 2016 2015 2014 2017 2016 2015 2014 2017 2016 2015 2014
2.10 2.89 2.83 2.52 4.13 4.63 5.58 6.67 1.34 0.90 0.91 0.96 4.13 4.64 5.59 6.65
system system system system
2017 2016 2015 2014 2017 2016 2015 2014 2017 2016 2015 2014 2017 2016 2015 2014
3.37 3.28 2.69 2.76 2.11 2.66 1.60 1.63 0.00 0.00 0.00 0.00 2.20 2.67 1.58 1.58
Figure 42. Sustainability index in the Pre-Manufacturing Stage
0,000,501,001,502,002,503,003,504,004,505,005,506,006,507,00
Product Process system
Sust
aina
bilit
y In
dex
Organization Level
2017 2016 2015 2014
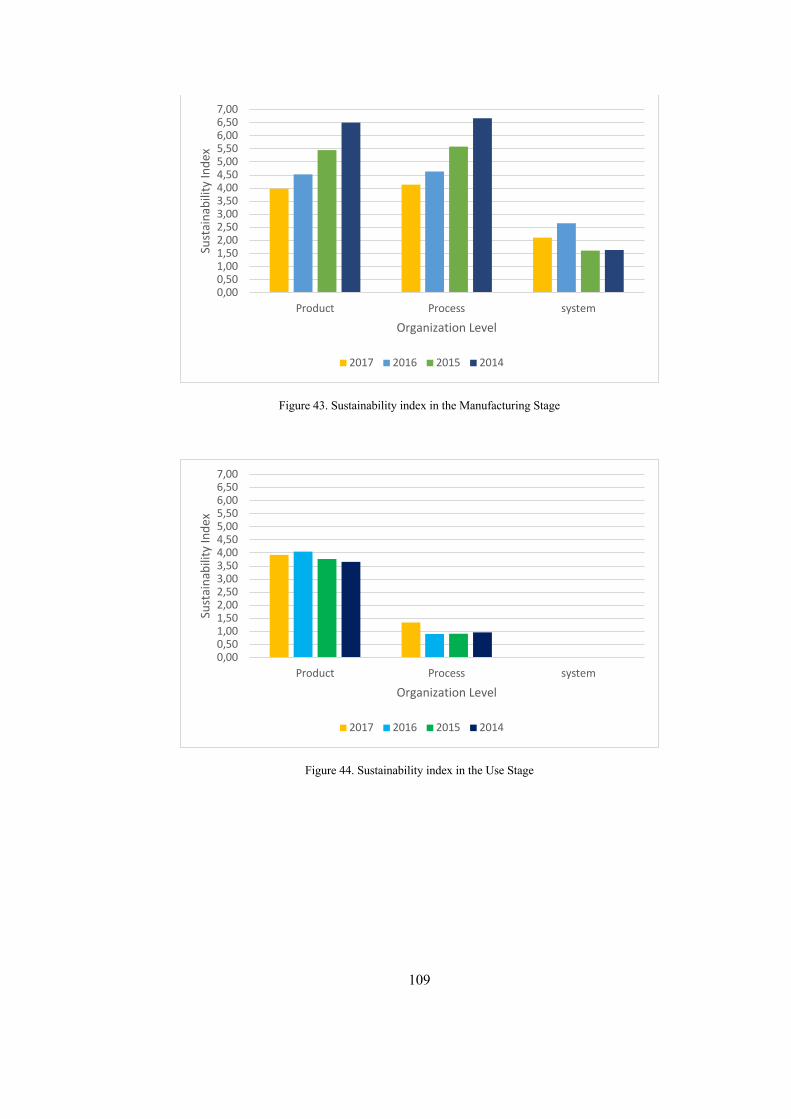
109
Figure 43. Sustainability index in the Manufacturing Stage
Figure 44. Sustainability index in the Use Stage
0,000,501,001,502,002,503,003,504,004,505,005,506,006,507,00
Product Process system
Sust
aina
bilit
y In
dex
Organization Level
2017 2016 2015 2014
0,000,501,001,502,002,503,003,504,004,505,005,506,006,507,00
Product Process system
Sust
aina
bilit
y In
dex
Organization Level
2017 2016 2015 2014
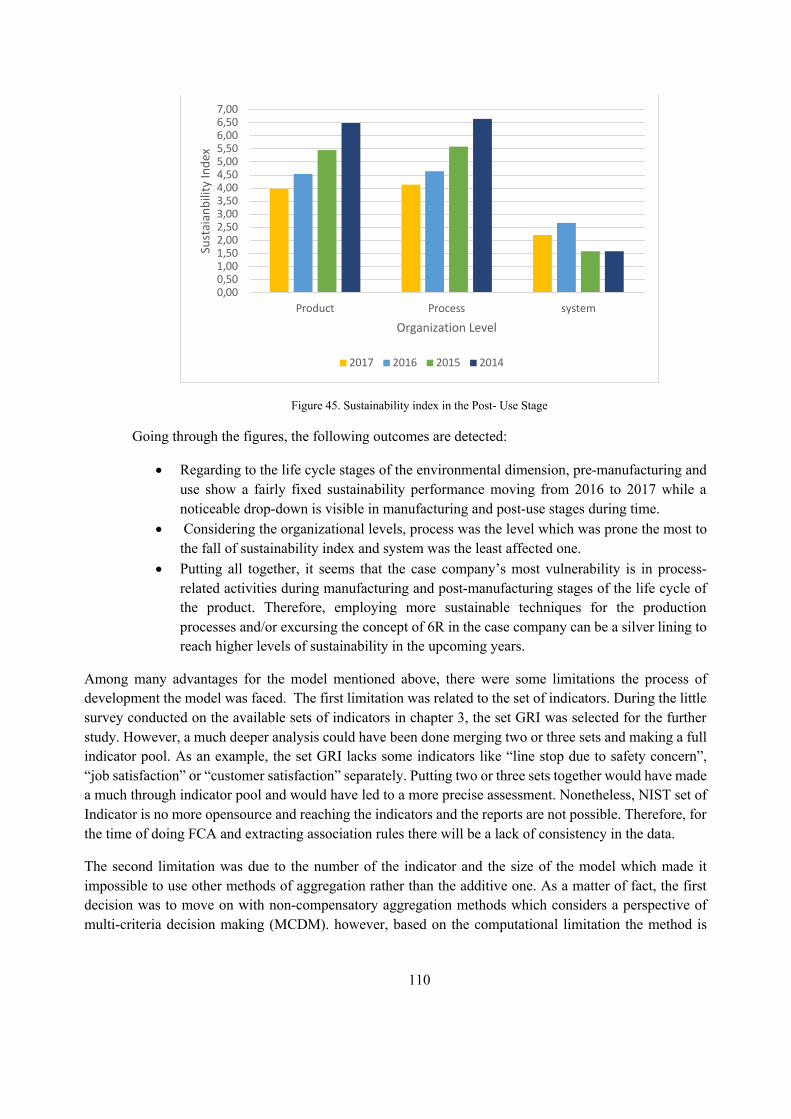
110
Figure 45. Sustainability index in the Post- Use Stage
Going through the figures, the following outcomes are detected:
• Regarding to the life cycle stages of the environmental dimension, pre-manufacturing and use show a fairly fixed sustainability performance moving from 2016 to 2017 while a noticeable drop-down is visible in manufacturing and post-use stages during time.
• Considering the organizational levels, process was the level which was prone the most to the fall of sustainability index and system was the least affected one.
• Putting all together, it seems that the case company’s most vulnerability is in process-related activities during manufacturing and post-manufacturing stages of the life cycle of the product. Therefore, employing more sustainable techniques for the production processes and/or excursing the concept of 6R in the case company can be a silver lining to reach higher levels of sustainability in the upcoming years.
Among many advantages for the model mentioned above, there were some limitations the process of development the model was faced. The first limitation was related to the set of indicators. During the little survey conducted on the available sets of indicators in chapter 3, the set GRI was selected for the further study. However, a much deeper analysis could have been done merging two or three sets and making a full indicator pool. As an example, the set GRI lacks some indicators like “line stop due to safety concern”, “job satisfaction” or “customer satisfaction” separately. Putting two or three sets together would have made a much through indicator pool and would have led to a more precise assessment. Nonetheless, NIST set of Indicator is no more opensource and reaching the indicators and the reports are not possible. Therefore, for the time of doing FCA and extracting association rules there will be a lack of consistency in the data.
The second limitation was due to the number of the indicator and the size of the model which made it impossible to use other methods of aggregation rather than the additive one. As a matter of fact, the first decision was to move on with non-compensatory aggregation methods which considers a perspective of multi-criteria decision making (MCDM). however, based on the computational limitation the method is
0,000,501,001,502,002,503,003,504,004,505,005,506,006,507,00
Product Process system
Sust
aian
bilit
y In
dex
Organization Level
2017 2016 2015 2014
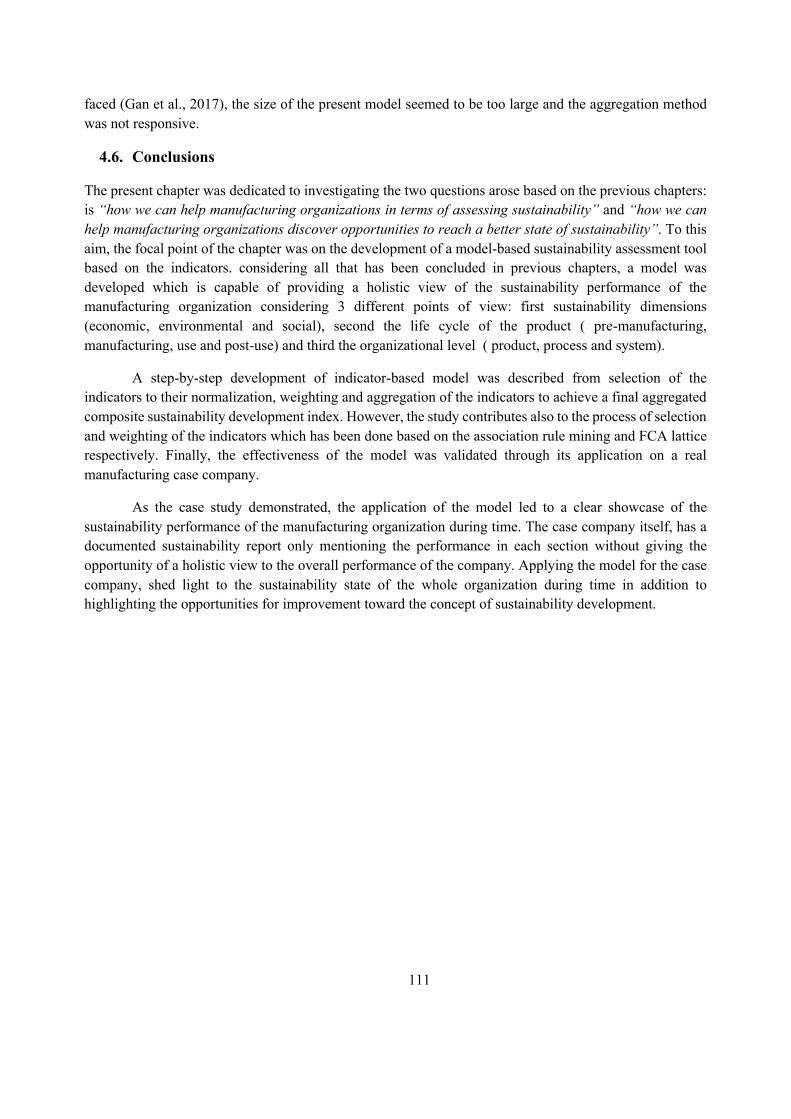
111
faced (Gan et al., 2017), the size of the present model seemed to be too large and the aggregation method was not responsive.
4.6. Conclusions
The present chapter was dedicated to investigating the two questions arose based on the previous chapters: is “how we can help manufacturing organizations in terms of assessing sustainability” and “how we can help manufacturing organizations discover opportunities to reach a better state of sustainability”. To this aim, the focal point of the chapter was on the development of a model-based sustainability assessment tool based on the indicators. considering all that has been concluded in previous chapters, a model was developed which is capable of providing a holistic view of the sustainability performance of the manufacturing organization considering 3 different points of view: first sustainability dimensions (economic, environmental and social), second the life cycle of the product ( pre-manufacturing, manufacturing, use and post-use) and third the organizational level ( product, process and system).
A step-by-step development of indicator-based model was described from selection of the indicators to their normalization, weighting and aggregation of the indicators to achieve a final aggregated composite sustainability development index. However, the study contributes also to the process of selection and weighting of the indicators which has been done based on the association rule mining and FCA lattice respectively. Finally, the effectiveness of the model was validated through its application on a real manufacturing case company.
As the case study demonstrated, the application of the model led to a clear showcase of the sustainability performance of the manufacturing organization during time. The case company itself, has a documented sustainability report only mentioning the performance in each section without giving the opportunity of a holistic view to the overall performance of the company. Applying the model for the case company, shed light to the sustainability state of the whole organization during time in addition to highlighting the opportunities for improvement toward the concept of sustainability development.
112
CONCLUSION, LIMITATIONS AND FUTURE WORK Acknowledging the urge manufacturing organizations are faced to improve their performance in terms of sustainability and the need for a systematic view in sustainability assessment tools, the doctorate thesis has been devoted to a thorough research on introducing a sustainability assessment framework with a holistic view for manufacturing organization. To this purpose, and to find out the essentials of the framework, research questions were arisen in a step-by-step study:
• How is sustainability defined through its dimensions? • What sub-dimensions can denominate sustainable manufacturing? • How can sustainable manufacturing be achieved? • How can sustainable manufacturing be assessed? • How can we help manufacturing organizations in terms of assessing sustainability? • How can we help manufacturing organizations discover opportunities to reach a better state
of sustainability?
To scrutinize the questions and to reach a proper answer for each, two sets of systematic literature reviews were conducted through which the essence of sustainable manufacturing and sustainability assessment was extracted from investigating the scientific domain. The studies were first led to a detail analysis of environmental, economic and social sub-dimensions and the concerns that stand out regarding to each dimension from the point of view of the scientists. Second, the tools and the dominant issues in terms of assessment were explored to get a step closer to the definition of the framework. On the other hand, to find out about the possible existing gap(s) between the scientific domain and the manufacturing domain in practice, 100 manufacturing organizations were studied to inspect their strategies and the trends toward the concept of sustainability and its dimensions and sub-dimensions.
Acknowledging what has been observed, the framework was defined as an indicator-based sustainability assessment model which is aimed to provide a holistic view toward the sustainability performance of the manufacturing organization. With its dimensions and its holistic view, it permits the maximum traceability of the causes and effects of sustainability in the whole organization. It is characterized in a way that it looks at the big picture while it maintains the awareness of the interconnectedness of its three axes: sustainability dimensions (environmental, economic and social), hierarchical level of the organization (system, product and process) and the life cycle stages of the product (pre-manufacturing, manufacturing, use and post use). On the other hand, with the indicator-based choice, it presents a generic-standardized assessment which impedes further confusion due to the abundance of the introduced-ad-hoc indicators for the manufacturers.
To assess the sustainability performance of the organization, a composite sustainable development index was promoted. However, what has been discovered through the inspection of both scientific domain and the manufacturing domain in practice, has become the backbone of the development of the composite indicator. The contributions though, can be defined in both selection process of indicators and the weighting procedure. where the former has been done due to the extracted association rules between the indicators used by manufacturers in the study of the organizations, and the latter benefited from the FCA analysis of both studies on scientific domain and manufacturing domain in practice.
113
Among many advantages for the model mentioned above, there were some limitations the process of development the model was faced. The first limitation was related to the set of indicators. During the little survey conducted on the available sets of indicators in chapter 3, the set GRI was selected for the further study. However, a much deeper analysis could have been done merging two or three sets and making a full indicator pool. As an example, the set GRI lacks some indicators like “line stop due to safety concern”, “job satisfaction” or “customer satisfaction” separately. Putting two or three sets together would have made a much through indicator pool and would have led to a more precise assessment. Nonetheless, NIST set of Indicator is no more opensource and reaching the indicators and the reports are not possible. Therefore, for the time of doing FCA and extracting association rules there will be a lack of consistency in the data.
The second limitation was due to the number of the indicator and the size of the model which made it impossible to use other methods of aggregation rather than the additive one. As a matter of fact, the first decision was to move on with non-compensatory aggregation methods which considers a perspective of multi-criteria decision making (MCDM). However, based on the computational limitation the method is faced (Gan et al., 2017), the size of the present model seemed to be too large and the aggregation method was not responsive.
Evidently, the framework has the potential for the improvement and further studies to be more accurate. As an example, investigations on more precise associations and relationships between indicators of each layer of the model, can help improve its effectiveness. In addition, the next step of the study can be the efforts to model the framework employing system-engineering tools to create a more complete and holistic view for the manufacturers and final users.
114
REFERENCES I.S. Jawahir, F. Badurdeen, K. Rouch, 2014. Innovation in sustainable manufacturing education. Proceedings of the
11th Global Conference_on Sustainable Manufacturing, Berlin, Germany, 9–16.
Arena, Marika, Duque Ciceri, N., Terzi, S., Bengo, I., Azzone, G., & Garetti, M. (2009). A state-of-the-art of industrial
sustainability: Definitions, tools and metrics. International Journal of Product Lifecycle Management, 4.
https://doi.org/10.1504/IJPLM.2009.031674
Atwater, B., & Uzdzinski, J. (2014). Wholistic Sustainment Maturity: The Extension of System Readiness
Methodology across all Phases of the lifecycle of a complex system (Vol. 28, pp. 601–609). Presented at the
Procedia Computer Science. https://doi.org/10.1016/j.procs.2014.03.073
Badurdeen, F., Iyengar, D., Goldsby, T. J., Metta, H., Gupta, S., & Jawahir, I. s. (2009). Extending total life-cycle
thinking to sustainable supply chain design. International Journal of Product Lifecycle Management, 4(1–
3), 49–67. https://doi.org/10.1504/IJPLM.2009.031666
Balkema, A., Preisig, H., Otterpohl, R., & Lambert, A. J. D. (2003). Augmenting design with sustainability. Computer
Aided Chemical Engineering, 15. https://doi.org/10.1016/S1570-7946(03)80390-5
Baumgartner, R. J., & Ebner, D. (2010). Corporate sustainability strategies: sustainability profiles and maturity levels.
Sustainable Development, 18(2), 76–89. https://doi.org/10.1002/sd.447
Caruso, P. W., Dumbacher, D. L., & Grieves, M. W. (2010). Product Lifecycle Management and the quest for
sustainable space exploration. Presented at the AIAA SPACE Conference and Exposition 2010.
Chan, F. T. S., Li, N., Chung, S. H., & Saadat, M. (2017). Management of sustainable manufacturing systems-a review
on mathematical problems. International Journal of Production Research, 55(4), 1210–1225.
https://doi.org/10.1080/00207543.2016.1229067
Chen, D., Schudeleit, T., Posselt, G., & Thiede, S. (2013). A state-of-the-art review and evaluation of tools for factory
sustainability assessment (Vol. 9, pp. 85–90). Presented at the Procedia CIRP.
https://doi.org/10.1016/j.procir.2013.06.173
Chen, D., Thiede, S., Schudeleit, T., & Herrmann, C. (2014). A holistic and rapid sustainability assessment tool for
manufacturing SMEs. CIRP Annals - Manufacturing Technology, 63(1), 437–440.
https://doi.org/10.1016/j.cirp.2014.03.113
115
Chun, Y., & Bidanda, B. (2013). Sustainable manufacturing and the role of the International Journal of Production
Research. International Journal of Production Research, 51(23–24), 7448–7455.
https://doi.org/10.1080/00207543.2012.762135
Ciceri, N. D., Gutowski, T. G., & Garetti, M. (2010). A tool to estimate materials and manufacturing energy for a
product. In Proceedings of the 2010 IEEE International Symposium on Sustainable Systems and Technology
(pp. 1–6). https://doi.org/10.1109/ISSST.2010.5507677
Clarke, A. R., Zhang, Q., Gershenson, J. K., & Sutherland, J. W. (2008). Selection of Remanufacturing Facility
Locations to Minimise Cost and Environmental Impact. LCE 2008: 15th CIRP International Conference on
Life Cycle Engineering: Conference Proceedings, 229. Retrieved from
http://search.informit.com.au/documentSummary;dn=561815070400277;res=IELENG
Cochran, D. S., Jafri, M. U., Chu, A. K., & Bi, Z. (2016). Incorporating design improvement with effective evaluation
using the Manufacturing System Design Decomposition (MSDD). Journal of Industrial Information
Integration, 2, 65–74. https://doi.org/10.1016/j.jii.2016.04.005
Cochran, D. S., Kinard, D., & Bi, Z. (2016). Manufacturing System Design Meets Big Data Analytics for Continuous
Improvement (Vol. 50, pp. 647–652). Presented at the Procedia CIRP.
https://doi.org/10.1016/j.procir.2016.05.004
Corbire-Nicollier, T., Blanc, I., & Erkman, S. (2011). Towards a global criteria based framework for the sustainability
assessment of bioethanol supply chains: Application to the Swiss dilemma: Is local produced bioethanol more
sustainable than bioethanol imported from Brazil? Ecological Indicators, 11(5), 1447–1458.
https://doi.org/10.1016/j.ecolind.2011.03.018
Costanza, R., & Patten, B. C. (1995). Defining and predicting sustainability. Ecological Economics, 15(3), 193–196.
https://doi.org/10.1016/0921-8009(95)00048-8
Eastlick, D. D., & Haapala, K. R. (2012). Increasing the Utility of Sustainability Assessment in Product Design, 713–
722. https://doi.org/10.1115/DETC2012-71144
Eastwood, M. D., & Haapala, K. R. (2015). A unit process model based methodology to assist product sustainability
assessment during design for manufacturing. Journal of Cleaner Production, 108, 54–64.
https://doi.org/10.1016/j.jclepro.2015.08.105
116
Dow Jones Sustainability Index (DJSI), 2012. Index Family Overview. http://www.sustainability-index.com/dow-
jonessustainability-indexes/index.jsp, Last accessed: 1.12.2018
Faezipour, M., & Ferreira, S. (2011). Applying systems thinking to assess sustainability in healthcare system of
systems. International Journal of System of Systems Engineering, 2(4), 290–308.
https://doi.org/10.1504/IJSSE.2011.043861
Faulkner, W., & Badurdeen, F. (2014). Sustainable Value Stream Mapping (Sus-VSM): methodology to visualize and
assess manufacturing sustainability performance. Journal of Cleaner Production, 85(Supplement C), 8–18.
https://doi.org/10.1016/j.jclepro.2014.05.042
Feng, S. C., & Joung, C. B. (2010). Development Overview of Sustainable Manufacturing Metrics. NIST.
https://doi.org/904931
Gan, X., Fernandez, I. C., Guo, J., Wilson, M., Zhao, Y., Zhou, B., & Wu, J. (2017). When to use what: Methods for
weighting and aggregating sustainability indicators. Ecological Indicators, 81, 491–502.
https://doi.org/10.1016/j.ecolind.2017.05.068
Garcia-Herrero, I., Laso, J., Margallo, M., Bala, A., Gazulla, C., Fullana-i-Palmer, P., … Aldaco, R. (2017).
Incorporating linear programing and life cycle thinking into environmental sustainability decision-making: a
case study on anchovy canning industry. Clean Technologies and Environmental Policy, 19(7), 1897–1912.
https://doi.org/10.1007/s10098-017-1373-6
Garretson, I. C., Eastwood, C. J., Eastwood, M. D., & Haapala, K. R. (2014). A software tool for unit process-based
sustainable manufacturing assessment of metal components and assemblies (Vol. 4). Presented at the
Proceedings of the ASME Design Engineering Technical Conference. https://doi.org/10.1115/DETC2014-
34557
Dreher, J., Lawler, M., Stewart, J., Strasorier, G., & Thorne, M. (2009). Metrics for Sustainable
Manufacturing. Project Report), Laboratory for Sustainable Business, MIT, http://actionlearning. mit.
edu/slab/files/slab_files/Projects/2009/GM,% 20report. pdf.
Global Reporting Initiative (GRI), 2011. Sustainability Reporting Guidelines,
https://www.globalreporting.org/resourcelibrary/G3.1Guidelines-Incl-Technical-Protocol.pdf, Last
accessed:15.01.2018
117
Godfrey, L., & Todd, C. (2001). Defining thresholds for freshwater sustainability indicators within the context of
South African water resource management. In 2nd WARFA/Waternet Symposium: Integrated Water Resource
Management: Theory, Practice, Cases, Cape Town, South Africa, http://www. waternetonline. ihe.
nl/aboutWN/pdf/godfrey. pdf.
Güçdemir, H., & Selim, H. (2017). Customer centric production planning and control in job shops: A simulation
optimization approach. Journal of Manufacturing Systems, 43, 100–116.
https://doi.org/10.1016/j.jmsy.2017.02.004
Gunasekaran, A., & Spalanzani, A. (2012). Sustainability of manufacturing and services: Investigations for research
and applications. International Journal of Production Economics, 140(1), 35–47.
https://doi.org/10.1016/j.ijpe.2011.05.011
Gupta, S., Dangayach, G. S., & Singh, A. K. (2015). Key determinants of sustainable product design and
manufacturing (Vol. 26, pp. 99–102). Presented at the Procedia CIRP.
https://doi.org/10.1016/j.procir.2014.07.166
Gurtu, A., Searcy, C., & Jaber, M. Y. (2016). Effects of offshore outsourcing on a nation. Sustainable Production and
Consumption, 7, 94–105. https://doi.org/10.1016/j.spc.2016.06.001
Gurtu, A., Searcy, C., & Jaber, M. Y. (2017). Emissions from international transport in global supply chains.
Management Research Review, 40(1), 53–74. https://doi.org/10.1108/MRR-09-2015-0208
Gutowski, T., Murphy, C., Allen, D., Bauer, D., Bras, B., Piwonka, T., … Wolff, E. (2005). Environmentally benign
manufacturing: Observations from Japan, Europe and the United States. Journal of Cleaner Production,
13(1), 1–17. https://doi.org/10.1016/j.jclepro.2003.10.004
Haapala, K.R., Zhao, F., Camelio, J., Sutherland, J. W., Skerlos, S. J., Dornfeld, D. A., … Rickli, J. L. (2013). A
review of engineering research in sustainable manufacturing. Journal of Manufacturing Science and
Engineering, Transactions of the ASME, 135(4). https://doi.org/10.1115/1.4024040
Hacking, T., & Guthrie, P. (2008). A framework for clarifying the meaning of Triple Bottom-Line, Integrated, and
Sustainability Assessment. Environmental Impact Assessment Review, 28(2), 73–89.
https://doi.org/10.1016/j.eiar.2007.03.002
Hardi, P., & Zdan, T. (1997). The Bellagio principles for assessment. A Ssessing Sustainable Development: Principles
in Practice.
118
Hassan, M.F., Saman, M. Z. M., Mahmood, S., Nor, N. H. M., & Rahman, M. N. A. (2017). Sustainability assessment
methodology in product design: A review and directions for future research. Jurnal Teknologi, 79(1), 37–44.
https://doi.org/10.11113/jt.v79.8697
Hastie, T., Tibshirani, R., & Friedman, J. (2009). The Elements of Statistical Learning: Data Mining, Inference, and
Prediction, Second Edition (2nd ed.). New York: Springer-Verlag. Retrieved from
//www.springer.com/it/book/9780387848570
Hegab, H. A., Darras, B., & Kishawy, H. A. (2018). Towards sustainability assessment of machining processes.
Journal of Cleaner Production, 170, 694–703. https://doi.org/10.1016/j.jclepro.2017.09.197
Hornik, K., Grün, B., & Hahsler, M. (2005). arules - A Computational Environment for Mining Association Rules and
Frequent Item Sets. Journal of Statistical Software, 14. https://doi.org/10.18637/jss.v014.i15
Hosseini, S. A., Nosratabadi, A., Nehzati, T., & Ismail, N. (2012). Trend in sustainability of facility design and
production planning in manufacturing. Applied Mechanics and Materials, 229–231, 2562–2566.
https://doi.org/10.4028/www.scientific.net/AMM.229-231.2562
Huang, A., & Badurdeen, F. (2017). Sustainable Manufacturing Performance Evaluation: Integrating Product and
Process Metrics for Systems Level Assessment. Procedia Manufacturing, 8, 563–570.
https://doi.org/10.1016/j.promfg.2017.02.072
ISO (International Organization for Standardization), 1999. EnvironmentalManagement-Environmental Performance
Evaluation-Guidelines, ISO14031:1999(E), Geneva, Switzerland.
Jawahir, I. ., Dillon, O. W., Rouch, K. E., Joshi, K. J., Venkatachalam, A., & Jaafar, I. (2006). Total life-cycle
considerations in product design for sustainability: A framework for comprehensive evaluation. Proceedings
of TMT 2006, Keynote Paper, 1–10.
Jayal, A. D., Badurdeen, F., Dillon, J., & Jawahir, I. S. (2010). Sustainable manufacturing: Modeling and optimization
challenges at the product, process and system levels. CIRP Journal of Manufacturing Science and
Technology, 2(3), 144–152. https://doi.org/10.1016/j.cirpj.2010.03.006
Jindal, A., & Sangwan, K. S. (2014). Closed loop supply chain network design and optimisation using fuzzy mixed
integer linear programming model. International Journal of Production Research, 52(14), 4156–4173.
https://doi.org/10.1080/00207543.2013.861948
119
Joung, C. B., Carrell, J., Sarkar, P., & Feng, S. C. (2013). Categorization of indicators for sustainable manufacturing.
Ecological Indicators, 24(Supplement C), 148–157. https://doi.org/10.1016/j.ecolind.2012.05.030
Karnib, A. (2016). A methodological approach for sustainability assessment: Application to the assessment of the
sustainable water resources withdrawals. International Journal of Sustainable Development, 19(4), 402–417.
https://doi.org/10.1504/IJSD.2016.080515
Keeble, J. J., Topiol, S., & Berkeley, S. (2003). Using Indicators to Measure Sustainability Performance at a Corporate
and Project Level. Journal of Business Ethics, 44(2–3), 149–158.
Kelly, K. L. (1998). A systems approach to identifying decisive information for sustainable development. European
Journal of Operational Research, 109(2), 452–464. https://doi.org/10.1016/S0377-2217(98)00070-8
Konys, A. (2018). An ontology-based knowledge modelling for a sustainability assessment domain. Sustainability
(Switzerland), 10(2). https://doi.org/10.3390/su10020300
Krajnc, D., & Glavič, P. (2005a). A model for integrated assessment of sustainable development. Resources,
Conservation and Recycling, 43(2), 189–208. https://doi.org/10.1016/j.resconrec.2004.06.002
Krajnc, Damjan, & Glavič, P. (2005). How to compare companies on relevant dimensions of sustainability. Ecological
Economics, 55(4), 551–563. https://doi.org/10.1016/j.ecolecon.2004.12.011
Kremer, G. E., Haapala, K., Murat, A., Chinnam, R. B., Kim, K., Monplaisir, L., & Lei, T. (2016). Directions for
instilling economic and environmental sustainability across product supply chains. Journal of Cleaner
Production, 112(Part 3), 2066–2078. https://doi.org/10.1016/j.jclepro.2015.07.076
Labuschagne, C., Brent, A. C., & van Erck, R. P. G. (2005). Assessing the sustainability performances of industries.
Journal of Cleaner Production, 13(4), 373–385. https://doi.org/10.1016/j.jclepro.2003.10.007
Lee, J. Y., Kang, H. S., & Noh, S. D. (2014). MAS2: an integrated modeling and simulation-based life cycle evaluation
approach for sustainable manufacturing. Journal of Cleaner Production, 66(Supplement C), 146–163.
https://doi.org/10.1016/j.jclepro.2013.11.029
Li, C. (2013). An integrated approach to evaluating the production system in closed-loop supply chains. International
Journal of Production Research, 51(13), 4045–4069. https://doi.org/10.1080/00207543.2013.774467
Li, S., Mirlekar, G., Ruiz-Mercado, G. J., & Lima, F. V. (2016). Development of Chemical Process Design and Control
for Sustainability. Processes, 4(3), 23. https://doi.org/10.3390/pr4030023
120
Liu, Y., & Li, X. (2017). Application of formal concept analysis in association rule mining (pp. 203–207). Presented
at the Proceedings - 2017 4th International Conference on Information Science and Control Engineering,
ICISCE 2017. https://doi.org/10.1109/ICISCE.2017.52
Loucks, D. P. (1997). Quantifying trends in system sustainability. Hydrological Sciences Journal, 42(4), 513–530.
https://doi.org/10.1080/02626669709492051
Lu, T., Gupta, A., Jayal, A. D., Badurdeen, F., Feng, S. C., Jr, O. W. D., & Jawahir, I. S. (2011). A Framework of
Product and Process Metrics for Sustainable Manufacturing. In Advances in Sustainable Manufacturing (pp.
333–338). Springer, Berlin, Heidelberg. https://doi.org/10.1007/978-3-642-20183-7_48
Lundin, M. (2003). Indicators for Measuring the Sustainability of Urban Water Systems - A Life Cycle Approach
(Doctoral thesis). Chalmers University of Technology. Retrieved from
http://publications.lib.chalmers.se/publication/421-indicators-for-measuring-the-sustainability-of-urban-
water-systems-a-life-cycle-approach
Lye, S. W., Lee, S. G., & Khoo, M. K. (2001). A design methodology for the strategic assessment of a product’s eco-
efficiency. International Journal of Production Research, 39(11), 2453–2474.
https://doi.org/10.1080/00207540110044598
Madan, S., Kannan, D., & Udhaya, K. (2017). Analyzing sustainable manufacturing practices – A case study in Indian
context. Journal of Cleaner Production, 164, 1332–1343. https://doi.org/10.1016/j.jclepro.2017.05.097
Mani, M., Haapala, K., Smullin, M., & Morris, K. C. (2016). USING INDUSTRY FOCUS GROUPS AND
LITERATURE REVIEW TO IDENTIFY CHALLENGES IN SUSTAINABLE ASSESSMENT THEORY
AND PRACTICE. In NIST. Retrieved from https://www.nist.gov/publications/using-industry-focus-groups-
and-literature-review-identify-challenges-sustainable
Mani, M., Larborn, J., Johansson, B., Lyons, K. W., & Morris, K. C. (2016). Standard Representations for
Sustainability Characterization of Industrial Processes. Journal of Manufacturing Science and Engineering,
138(10), 101008-101008–7. https://doi.org/10.1115/1.4033922
Mani, M., Madan, J., Lee, J. H., Lyons, K. W., & Gupta, S. K. (2014). Sustainability characterisation for
manufacturing processes. International Journal of Production Research, 52(20), 5895–5912.
https://doi.org/10.1080/00207543.2014.886788
121
Martí, J. M. C., Tancrez, J.-S., & Seifert, R. W. (2015). Carbon footprint and responsiveness trade-offs in supply chain
network design. International Journal of Production Economics, 166, 129–142.
https://doi.org/10.1016/j.ijpe.2015.04.016
Mayer-Spohn, O. (2004). Sustainable development indicators within the German water industry: a case study.
Chalmers tekniska högskola.
Mezni, H., & Sellami, M. (2017). Multi-cloud service composition using Formal Concept Analysis. Journal of Systems
and Software, 134, 138–152. https://doi.org/10.1016/j.jss.2017.08.016
Milutinović, B., Stefanović, G., Dassisti, M., Marković, D., & Vučković, G. (2014). Multi-criteria analysis as a tool
for sustainability assessment of a waste management model. Energy, 74(C), 190–201.
https://doi.org/10.1016/j.energy.2014.05.056
Mitra, S., & Datta, P. P. (2014). Adoption of green supply chain management practices and their impact on
performance: An exploratory study of Indian manufacturing firms. International Journal of Production
Research, 52(7), 2085–2107. https://doi.org/10.1080/00207543.2013.849014
Moldavska, A., & Welo, T. (2015). On the applicability of sustainability assessment tools in manufacturing (Vol. 29,
pp. 621–626). Presented at the Procedia CIRP. https://doi.org/10.1016/j.procir.2015.02.203
Moldavska, A., & Welo, T. (2016). Development of manufacturing sustainability assessment using systems thinking.
Sustainability (Switzerland), 8(1), 1–26. https://doi.org/10.3390/su8010005
Morrison-Saunders, A., & Therivel, R. (2006). Sustainability integration and assessment. Journal of Environmental
Assessment Policy and Management, 8(3), 281–298. https://doi.org/10.1142/S1464333206002529
Nagurney, A., & Nagurney, L. S. (2010). Sustainable supply chain network design: A multicriteria perspective.
International Journal of Sustainable Engineering, 3(3), 189–197.
https://doi.org/10.1080/19397038.2010.491562
Nardo, M., Saisana, M., Saltelli, A., & Tarantola, S. (2005). State-of-the-art report on simulation and indicators. D7.
Nardo, Michela, Saisana, M., Saltelli, A., Tarantola, S., Hoffman, A., & Giovannini, E. (2005). Handbook on
Constructing Composite Indicators. https://doi.org/10.1787/533411815016
OECD sustainable manufacturing indicators - OECD. (2011). Retrieved January 16, 2018, from
https://www.oecd.org/innovation/green/toolkit/oecdsustainablemanufacturingindicators.htm
122
Onat, N. C., Kucukvar, M., Halog, A., & Cloutier, S. (2017). Systems thinking for life cycle sustainability assessment:
A review of recent developments, applications, and future perspectives. Sustainability (Switzerland), 9(5).
https://doi.org/10.3390/su9050706
Paju, M., Heilala, J., Hentula, M., Heikkilä, A., Johansson, B., Leong, S., & Lyons, K. (2010). Framework and
indicators for a sustainable manufacturing mapping methodology (pp. 3411–3422). Presented at the
Proceedings - Winter Simulation Conference. https://doi.org/10.1109/WSC.2010.5679031
Pollesch, N. L., & Dale, V. H. (2016). Normalization in sustainability assessment: Methods and implications.
Ecological Economics, 130, 195–208. https://doi.org/10.1016/j.ecolecon.2016.06.018
Pope, J., Annandale, D., & Morrison-Saunders, A. (2004). Conceptualising sustainability assessment. Environmental
Impact Assessment Review, 24(6), 595–616. https://doi.org/10.1016/j.eiar.2004.03.001
Rachuri, S., Sriram, R. D., & Sarkar, P. (2009). Metrics, standards and industry best practices for sustainable
manufacturing systems (pp. 472–477). Presented at the 2009 IEEE International Conference on Automation
Science and Engineering, CASE 2009. https://doi.org/10.1109/COASE.2009.5234090
Ramos, T. R. P., Gomes, M. I., & Barbosa-Póvoa, A. P. (2014). Planning a sustainable reverse logistics system:
Balancing costs with environmental and social concerns. Omega, 48(Supplement C), 60–74.
https://doi.org/10.1016/j.omega.2013.11.006
Rezvan, P., Azadnia, A. H., Noordin, M. Y., & Seyedi, S. N. (2014). Sustainability assessment methodology for
concrete manufacturing process: A fuzzy inference system approach. Advanced Materials Research, 845,
814–818. https://doi.org/10.4028/www.scientific.net/AMR.845.814
Ruiz-Mercado, G.J., Gonzalez, M. A., & Smith, R. L. (2014). Expanding GREENSCOPE beyond the gate: A green
chemistry and life cycle perspective. Clean Technologies and Environmental Policy, 16(4), 703–717.
https://doi.org/10.1007/s10098-012-0533-y
Sala, S., Ciuffo, B., & Nijkamp, P. (2015). A systemic framework for sustainability assessment. Ecological
Economics, 119(Supplement C), 314–325. https://doi.org/10.1016/j.ecolecon.2015.09.015
Salama, H. A., Galal, N. M., & Elsayed, A. E. (2015). Eco-efficiency for sustainable manufacturing planning decisions
with applications to auto parts industry. Presented at the Proceedings - CIE 45: 2015 International Conference
on Computers and Industrial Engineering.
123
Santucci, A., & Esterman, M. (2015). Environmental impact assessment during product development: A functional
analysis based approach to life cycle assessments (Vol. 4). Presented at the Proceedings of the ASME Design
Engineering Technical Conference. https://doi.org/10.1115/DETC2015-47561
Schmidt, W.-P., & Taylor, A. (2007). Ford of Europe’s Product Sustainability Index, 6. _
SDG Compass Annex: Linking the SDGs and GRI Standards. (2015). Retrieved September 19, 2018, from
https://www.globalreporting.org/standards/resource-download-center/sdg-compass-annex-linking-the-sdgs-
and-gri-standards/
Seuring, S. (2013). A review of modeling approaches for sustainable supply chain management. Decision Support
Systems, 54(4), 1513–1520. https://doi.org/10.1016/j.dss.2012.05.053
Škopljanac-Mačina, F., & Blašković, B. (2014). Formal Concept Analysis – Overview and Applications. Procedia
Engineering, 69, 1258–1267. https://doi.org/10.1016/j.proeng.2014.03.117
Smith, L., & Ball, P. (2012). Steps towards sustainable manufacturing through modelling material, energy and waste
flows. International Journal of Production Economics, 140(1), 227–238.
https://doi.org/10.1016/j.ijpe.2012.01.036
Smullin, M. M. (2016). An Information Modeling Framework and Desktop Application to Compose Unit
Manufacturing Process Models for Sustainable Manufacturing Assessment. Retrieved from
http://ir.library.oregonstate.edu/xmlui/handle/1957/60059
Srinivasan, M., & Sheng, P. (1999). Feature-based process planning for environmentally conscious machining - Part
1: Microplanning. Robotics and Computer-Integrated Manufacturing, 15(3), 257–270.
https://doi.org/10.1016/S0736-5845(99)00017-4
Tagliaferri, C., Evangelisti, S., Acconcia, F., Domenech, T., Ekins, P., Barletta, D., & Lettieri, P. (2016). Life cycle
assessment of future electric and hybrid vehicles: A cradle-to-grave systems engineering approach. Chemical
Engineering Research and Design, 112, 298–309. https://doi.org/10.1016/j.cherd.2016.07.003
The 2030 Agenda for Sustainable Development: achieving the industry-related goals and targets. (2016, December
23). Retrieved September 16, 2018, from http://www.sdgfund.org/2030-agenda-sustainable-development-
achieving-industry-related-goals-and-targets
124
Thompson, K. D. (2011, February 17). Sustainable Manufacturing Indicator Repository (SMIR). Retrieved July 27,
2018, from https://www.nist.gov/services-resources/software/sustainable-manufacturing-indicator-
repository-smir
Tokos, H., Pintarič, Z. N., & Krajnc, D. (2012). An integrated sustainability performance assessment and
benchmarking of breweries. Clean Technologies and Environmental Policy, 14(2), 173–193.
https://doi.org/10.1007/s10098-011-0390-0
Tools for Composite Indicators Building - EU Science Hub - European Commission. (2016, July 26). Retrieved
September 14, 2018, from https://ec.europa.eu/jrc/en/publication/eur-scientific-and-technical-research-
reports/tools-composite-indicators-building
Umpfenbach, E. L., Dalkiran, E., Chinnam, R. B., & Murat, A. E. (2017). Promoting sustainability of automotive
products through strategic assortment planning. Article in Press. https://doi.org/10.1016/j.ejor.2017.08.031
UNIDO | United Nations Industrial Development Organization. (2015). Retrieved September 16, 2018, from
https://www.unido.org/
Urata, T., Yamada, T., Itsubo, N., & Inoue, M. (2017). Global supply chain network design and Asian analysis with
material-based carbon emissions and tax. Computers and Industrial Engineering, 113, 779–792.
https://doi.org/10.1016/j.cie.2017.07.032
Utne, I. B. (2009). Life cycle cost (LCC) as a tool for improving sustainability in the Norwegian fishing fleet. Journal
of Cleaner Production, 17(3), 335–344. https://doi.org/10.1016/j.jclepro.2008.08.009
Uva, G., Dassisti, M., Iannone, F., Florio, G., Maddalena, F., Ruta, M., … Leggieri, V. (2017). Modelling Framework
for Sustainable Co-management of Multi-purpose Exhibition Systems: The “fiera del Levante” Case (Vol.
180, pp. 812–821). Presented at the Procedia Engineering. https://doi.org/10.1016/j.proeng.2017.04.242
Veleva, V., & Ellenbecker, M. (2001). Indicators of sustainable production: Framework and methodology. Journal of
Cleaner Production, 9(6), 519–549. https://doi.org/10.1016/S0959-6526(01)00010-5
Voinov, A., & Farley, J. (2007). Reconciling sustainability, systems theory and discounting. Ecological Economics,
63(1), 104–113. https://doi.org/10.1016/j.ecolecon.2006.10.005
Wajnberg, M., Lezoche, M., Massé, B. A., Valtchev, P., & Panetto, H. (2017). Complex system tacit knowledge
extraction trough a formal method. INSIGHT - International Council on Systems Engineering (INCOSE),
20(4), 23–26. https://doi.org/10.1002/inst.12176
125
Warhurst, A. (2002). Sustainability indicators and sustainability performance management. Mining, Minerals and
Sustainable Development [MMSD] Project Report, 43.
Wille, R. (1982). Restructuring Lattice Theory: An Approach Based on Hierarchies of Concepts. In Ordered Sets (pp.
445–470). Springer, Dordrecht. https://doi.org/10.1007/978-94-009-7798-3_15
Related Documents