A Model Study of the Salish Sea Estuarine Circulation* DAVID A. SUTHERLAND 1 AND PARKER MACCREADY School of Oceanography, University of Washington, Seattle, Washington NEIL S. BANAS Applied Physics Laboratory, University of Washington, Seattle, Washington LUCY F. SMEDSTAD Naval Research Laboratory, Stennis Space Center, Mississippi (Manuscript received 2 August 2010, in final form 4 February 2011) ABSTRACT A realistic hindcast simulation of the Salish Sea, which encompasses the estuarine systems of Puget Sound, the Strait of Juan de Fuca, and the Strait of Georgia, is described for the year 2006. The model shows moderate skill when compared against hydrographic, velocity, and sea surface height observations over tidal and subtidal time scales. Analysis of the velocity and salinity fields allows the structure and variability of the exchange flow to be estimated for the first time from the shelf into the farthest reaches of Puget Sound. This study utilizes the total exchange flow formalism that calculates volume transports and salt fluxes in an isohaline framework, which is then compared to previous estimates of exchange flow in the region. From this analysis, residence time distri- butions are estimated for Puget Sound and its major basins and are found to be markedly shorter than previous estimates. The difference arises from the ability of the model and the isohaline method for flux calculations to more accurately estimate the exchange flow. In addition, evidence is found to support the previously observed spring–neap modulation of stratification at the Admiralty Inlet sill. However, the exchange flow calculated increases at spring tides, exactly opposite to the conclusion reached from an Eulerian average of observations. 1. Introduction This study aims to understand the processes control- ling the salt content in Puget Sound, Washington, a large fjord estuarine system located in the northeastern Pa- cific (Fig. 1). Puget Sound is connected to the coastal ocean via the Strait of Juan de Fuca (SJdF), a 200-km- long, 20-km-wide, 200-m-deep strait that collects the freshwater exported by not only Puget Sound but the Strait of Georgia (SoG) to the north as well. The region as a whole is known as the Salish Sea. Puget Sound has characteristics of a partially mixed estuary, despite its fjord-like geometry, most notably an along-estuary salinity gradient (;2 3 10 25 psu m 21 ) that drives a strong exchange flow. The exchange flow at the Admiralty Inlet (AIN) sill, located near the entrance to Puget Sound, has been estimated as 10–20 3 10 3 m 3 s 21 , about 10–20 times the average river flow into Puget Sound (Cokelet et al. 1991; Babson et al. 2006). This ex- change flow was observed to vary on spring–neap time scales because of variations in the strength of tidal mixing (Geyer and Cannon 1982), a process also observed at the entrance to the SoG (Griffin and LeBlond 1990; Masson and Cummins 2000). The amplification of transport into and out of Puget Sound decreases the residence time of waters there from 5 yr, which is the freshwater filling time based on river flow alone, to a range of 90–180 days that is based on a two-layer box model approach (Babson et al. 2006). This difference in residence times, as well as un- derstanding the processes that control the exchange and mixing of oceanic and freshwater, is critical across the Salish Sea as environmental issues such as hypoxia, * Ecology and Oceanography of Harmful Algal Blooms Pro- gram Contribution Number 635, and Pacific Northwest Toxins Program Contribution Number 4. 1 Current affiliation: NOAA/Northwest Fisheries Science Cen- ter, Seattle, Washington. Corresponding author address: David A. Sutherland, NOAA/ Northwest Fisheries Science Center, 2725 Montlake Blvd. E, Seattle, WA 98112. E-mail: [email protected] JUNE 2011 SUTHERLAND ET AL. 1125 DOI: 10.1175/2011JPO4540.1 Ó 2011 American Meteorological Society

Welcome message from author
This document is posted to help you gain knowledge. Please leave a comment to let me know what you think about it! Share it to your friends and learn new things together.
Transcript

A Model Study of the Salish Sea Estuarine Circulation*
DAVID A. SUTHERLAND1
AND PARKER MACCREADY
School of Oceanography, University of Washington, Seattle, Washington
NEIL S. BANAS
Applied Physics Laboratory, University of Washington, Seattle, Washington
LUCY F. SMEDSTAD
Naval Research Laboratory, Stennis Space Center, Mississippi
(Manuscript received 2 August 2010, in final form 4 February 2011)
ABSTRACT
A realistic hindcast simulation of the Salish Sea, which encompasses the estuarine systems of Puget Sound, the
Strait of Juan de Fuca, and the Strait of Georgia, is described for the year 2006. The model shows moderate skill
when compared against hydrographic, velocity, and sea surface height observations over tidal and subtidal time
scales. Analysis of the velocity and salinity fields allows the structure and variability of the exchange flow to be
estimated for the first time from the shelf into the farthest reaches of Puget Sound. This study utilizes the total
exchange flow formalism that calculates volume transports and salt fluxes in an isohaline framework, which is
then compared to previous estimates of exchange flow in the region. From this analysis, residence time distri-
butions are estimated for Puget Sound and its major basins and are found to be markedly shorter than previous
estimates. The difference arises from the ability of the model and the isohaline method for flux calculations to
more accurately estimate the exchange flow. In addition, evidence is found to support the previously observed
spring–neap modulation of stratification at the Admiralty Inlet sill. However, the exchange flow calculated
increases at spring tides, exactly opposite to the conclusion reached from an Eulerian average of observations.
1. Introduction
This study aims to understand the processes control-
ling the salt content in Puget Sound, Washington, a large
fjord estuarine system located in the northeastern Pa-
cific (Fig. 1). Puget Sound is connected to the coastal
ocean via the Strait of Juan de Fuca (SJdF), a 200-km-
long, 20-km-wide, 200-m-deep strait that collects the
freshwater exported by not only Puget Sound but the
Strait of Georgia (SoG) to the north as well. The region
as a whole is known as the Salish Sea.
Puget Sound has characteristics of a partially mixed
estuary, despite its fjord-like geometry, most notably an
along-estuary salinity gradient (;2 3 1025 psu m21) that
drives a strong exchange flow. The exchange flow at the
Admiralty Inlet (AIN) sill, located near the entrance to
Puget Sound, has been estimated as 10–20 3 103 m3 s21,
about 10–20 times the average river flow into Puget
Sound (Cokelet et al. 1991; Babson et al. 2006). This ex-
change flow was observed to vary on spring–neap time
scales because of variations in the strength of tidal mixing
(Geyer and Cannon 1982), a process also observed at the
entrance to the SoG (Griffin and LeBlond 1990; Masson
and Cummins 2000). The amplification of transport into
and out of Puget Sound decreases the residence time of
waters there from 5 yr, which is the freshwater filling time
based on river flow alone, to a range of 90–180 days that is
based on a two-layer box model approach (Babson et al.
2006). This difference in residence times, as well as un-
derstanding the processes that control the exchange and
mixing of oceanic and freshwater, is critical across the
Salish Sea as environmental issues such as hypoxia,
* Ecology and Oceanography of Harmful Algal Blooms Pro-
gram Contribution Number 635, and Pacific Northwest Toxins
Program Contribution Number 4.1 Current affiliation: NOAA/Northwest Fisheries Science Cen-
ter, Seattle, Washington.
Corresponding author address: David A. Sutherland, NOAA/
Northwest Fisheries Science Center, 2725 Montlake Blvd. E,
Seattle, WA 98112.
E-mail: [email protected]
JUNE 2011 S U T H E R L A N D E T A L . 1125
DOI: 10.1175/2011JPO4540.1
� 2011 American Meteorological Society

Report Documentation Page Form ApprovedOMB No. 0704-0188
Public reporting burden for the collection of information is estimated to average 1 hour per response, including the time for reviewing instructions, searching existing data sources, gathering andmaintaining the data needed, and completing and reviewing the collection of information. Send comments regarding this burden estimate or any other aspect of this collection of information,including suggestions for reducing this burden, to Washington Headquarters Services, Directorate for Information Operations and Reports, 1215 Jefferson Davis Highway, Suite 1204, ArlingtonVA 22202-4302. Respondents should be aware that notwithstanding any other provision of law, no person shall be subject to a penalty for failing to comply with a collection of information if itdoes not display a currently valid OMB control number.
1. REPORT DATE 04 FEB 2011 2. REPORT TYPE
3. DATES COVERED 00-00-2011 to 00-00-2011
4. TITLE AND SUBTITLE A Model Study of the Salish Sea Estuarine Circulation
5a. CONTRACT NUMBER
5b. GRANT NUMBER
5c. PROGRAM ELEMENT NUMBER
6. AUTHOR(S) 5d. PROJECT NUMBER
5e. TASK NUMBER
5f. WORK UNIT NUMBER
7. PERFORMING ORGANIZATION NAME(S) AND ADDRESS(ES) Naval Research Laboratory,Stennis Space Center,MS,39529
8. PERFORMING ORGANIZATIONREPORT NUMBER
9. SPONSORING/MONITORING AGENCY NAME(S) AND ADDRESS(ES) 10. SPONSOR/MONITOR’S ACRONYM(S)
11. SPONSOR/MONITOR’S REPORT NUMBER(S)
12. DISTRIBUTION/AVAILABILITY STATEMENT Approved for public release; distribution unlimited
13. SUPPLEMENTARY NOTES
14. ABSTRACT Arealistic hindcast simulation of the Salish Sea, which encompasses the estuarine systems of Puget Sound,the Strait of Juan de Fuca, and the Strait ofGeorgia, is described for the year 2006. The modelshowsmoderate skill when compared against hydrographic, velocity, and sea surface height observationsover tidal and subtidal time scales. Analysis of the velocity and salinity fields allows the structure andvariability of the exchange flow to be estimated for the first time from the shelf into the farthest reaches ofPuget Sound. This study utilizes the total exchange flow formalism that calculates volume transports andsalt fluxes in an isohaline framework, which is then compared to previous estimates of exchange flow in theregion. From this analysis, residence time distributions are estimated for Puget Sound and its major basinsand are found to bemarkedly shorter than previous estimates. The difference arises from the ability of themodel and the isohaline method for flux calculations to more accurately estimate the exchange flow. Inaddition, evidence is found to support the previously observed spring?neap modulation of stratification atthe Admiralty Inlet sill. However, the exchange flow calculated increases at spring tides, exactly opposite tothe conclusion reached from an Eulerian average of observations.
15. SUBJECT TERMS
16. SECURITY CLASSIFICATION OF: 17. LIMITATION OF ABSTRACT Same as
Report (SAR)
18. NUMBEROF PAGES
19
19a. NAME OFRESPONSIBLE PERSON
a. REPORT unclassified
b. ABSTRACT unclassified
c. THIS PAGE unclassified
Standard Form 298 (Rev. 8-98) Prescribed by ANSI Std Z39-18

pollution, and the threat of oil spills continue to be of
concern (e.g., Newton et al. 2007).
Sills also connect two of the major basins inside Puget
Sound, Hood Canal (HCN) to Main Basin (MB; Gregg and
Pratt 2010) and South Sound to Main Basin (through Ta-
coma Narrows; Seim and Gregg 1997), whereas Whidbey
Basin, the site of the largest rivers in Puget Sound, has no sill
restricting its flow to Main Basin. The numerous headlands
in the region generate internal waves and eddies that act as
a drag on the tidal flow and provide energy to mixing
processes. For example, at Three Tree Point in southern
Main Basin, the form drag due to flow past the headland is
estimated to be 10–50 times that because of bottom drag
alone (Edwards et al. 2004; McCabe et al. 2006).
Although numerous observational programs have
studied the SJdF, Puget Sound, and the coastal ocean of
the Pacific Northwest, none has attempted to cover the
entire region at once. The present study is the first to ask
how the Salish Sea as a whole functions as an estuary.
We use a newly developed numerical model of the Salish
Sea that depends heavily on previous observational
programs to validate and interpret the model results.
The next section outlines the model setup and forcing.
We then present model–data comparisons, which show
that the model has moderate skill. Observations taken
during the River Influences on Shelf Ecosystems (RISE)
project (Hickey et al. 2010) and from other sources in the
Salish Sea, such as the Ecology and Oceanography of
Harmful Algal Blooms Pacific Northwest (ECOHAB-
PNW) project, form the basis for the model–data com-
parisons. In section 4, we explore the variability in the salt
content of Puget Sound by calculating the exchange flow
and corresponding salt flux through a number of cross
sections using an isohaline framework (MacDonald 2006).
The level of detail made possible by the combination of the
new model and the isohaline exchange flow analysis leads
to markedly shorter estimates of the residence times com-
pared to previous studies. It also provides a new view of the
dynamics in this system, challenging the prevailing notion
that the exchange flow increases during neap tides at Ad-
miralty Inlet. Finally, it allows one to examine the distribu-
tion of freshwater from different river sources to the estuary,
showing that about half of the Skagit River discharge exits
through Deception Pass (DP), instead of southward through
the main passage of Whidbey Basin (WBN).
2. Model configuration
a. Model grid and parameters
We use the Regional Ocean Modeling System (ROMS;
Rutgers version 3), a free-surface, hydrostatic, primitive
equation model that has been used extensively in both
coastal (e.g., Zhang et al. 2009) and estuarine systems (e.g.,
FIG. 1. (left) A model snapshot of sea surface salinity on 21 Jun 2006, several days after the onset of coastal upwelling,
overlaid on a regional map showing the model domain and main geographical features. Black lines depict the 200-, 500-,
and 1000-m isobaths. (right) Zoom in on Puget Sound [boxed region in (left)] showing the major basins, rivers, and sill
regions mentioned in the text. Dashes along each axis show every fourth point of the stretched model grid.
1126 J O U R N A L O F P H Y S I C A L O C E A N O G R A P H Y VOLUME 41

Warner et al. 2005; MacCready et al. 2009). The horizontal
grid encompasses the Salish Sea and extends southward to
458N and offshore to 1278W, ranging in resolution from
a minimum of 280 m inside Puget Sound to a maximum of
3.1 km in the southeastern corner (Fig. 1). The model has
20 terrain-following sigma coordinate layers with stretch-
ing parameters chosen that result in twice the vertical
resolution in the upper 20% of the water column (us 5 4,
ub 5 0.5, and hc 5 0). The minimum depth was set to 4 m to
avoid drying of grid cells. Bathymetry data came from
a global 2-min gridded dataset (Smith and Sandwell
1997), which was overlaid with a 250-m resolution
Cascadia dataset where available (Haugerud 2000),
and finally a Puget Sound–only digital elevation model
(PSDEM 2005; Finlayson 2005) with a resolution of 183
m. The bathymetry was smoothed to decrease the nu-
merical errors that occur near steeply sloping bathyme-
try, a common feature of the fjords in the Salish Sea.
Maximum r0 ; 0.4 (r0 5 jDhj/h, where h is water depth;
e.g., Beckmann and Haidvogel 1993), whereas the
stiffness number (Haney 1991) r1 ; 9.
Turbulence closure is given by the k–« version of the
generic length scale (GLS) formulation (Umlauf and
Burchard 2003), using values suggested by Warner et al.
(2005) and the Canuto-A stability functions (Canuto
et al. 2001). Previous realistic hindcast simulations of the
Columbia River region showed that these choices im-
proved overall model skill (MacCready et al. 2009; Liu
et al. 2009b). Background values of the vertical viscosity
and diffusivity were set to 5 3 1026 m2 s21, a small
constant horizontal diffusion of tracers was used with
diffusivity equal to 2 m2 s21, and no explicit horizontal
diffusion of velocity was used. Bottom stress was pa-
rameterized with a quadratic drag law with a coefficient
Cd 5 3 3 1023 and a no-slip condition along the hori-
zontal boundaries. Results from sensitivity experiments
where the horizontal diffusion of tracers was varied from
1 to 5 m2 s21 and from experiments where Cd was varied
by two orders of magnitude were not significantly dif-
ferent than those presented below. ROMS was run using
the default, third-order upstream advection scheme for
velocity and a recursive 3D advection scheme [Multi-
dimensional Positive Definite Advection Transport Al-
gorithm (MPDATA)] for tracers. The model was run for
a year starting on 1 January 2006, with a baroclinic time
step of 30 s with 20 fast barotropic time steps. Output
files were written once per hour.
b. Boundary conditions and model initialization
The Salish Sea model is one-way nested inside the
global Navy Coastal Ocean Model (NCOM), a data-
assimilative model that has a nominal resolution of 1/88
(Barron et al. 2006, 2007). Initial fields for salinity S and
temperature T were taken from NCOM on 1 January
2006 and interpolated onto the model grid. Because
global NCOM does not extend into Puget Sound, we
modified the initial fields of T and S inside Puget Sound
by utilizing available CTD observations taken in De-
cember 2005 [Puget Sound Regional Synthesis Model
(PRISM) cruise; see section 3b]. At every model grid
point, the closest T and S profiles from the CTD stations
were used to extrapolate horizontally and fill the Puget
Sound initial condition. A similar method was used to
initialize the T and S fields inside the Strait of Georgia,
where, again, the global NCOM model does not cover.
In that case, initial fields were based on CTD profiles
obtained from the Canadian Institute of Ocean Sciences
(IOS) database for a week before and after 1 January
2006. Initial fields of velocity u and y and sea surface
height z were set to zero everywhere.
At the southern and western open boundaries, the
model fields (T, S, u, y, and z) are relaxed to NCOM
values (subsampled to every 2 days) over a 6-gridpoint-
wide region. Time scales for the nudging are 3 days at
each boundary, increasing to 60 days at 6 grid points in.
Radiation conditions are used on all model fields at the
boundary, whereas open boundary conditions for the
free-surface and depth-averaged momentum are given
by the Chapman (1985) and Flather (1976) formulations,
respectively. The northern boundary in the Strait of
Georgia was closed.
c. Rivers, tides, and atmospheric forcing
The model includes 16 rivers, simulated as point
sources at the end of uniform depth river channels.
Because the river channels were not explicitly resolved
in making the grid, they were carved out and set to
depths ranging from 4 to 12 m. Daily river discharge and
temperature time series for the model are taken from
corresponding U.S. Geological Survey (USGS) gauging
stations and an Environment Canada gauging station
in Hope, British Columbia, for the Fraser River. The
Columbia River was the largest source of freshwater
(Fig. 2), with a double-peaked discharge with a maximum
;13 000 m3 s21, followed by the Fraser River that peaks
in midsummer near 7000 m3 s21. The combined Skagit
and Snohomish river system dominates Puget Sound with
a maximum discharge of ;7000 m3 s21 and a mean of
1000 m3 s21.
Tidal forcing was imposed on top of the slowly varying
climatology fields at the open boundaries using eight
constituents (M2, S2, K1, O1, N2, P1, K2, and Q1) derived
from the 1/48 TPXO7.1 inverse global tidal model (Egbert
and Erofeeva 2002). Tides in the PNW are often mixed
semidiurnal, with pronounced spring–neap variability
and diurnal inequalities (e.g., Fig. 3). Tidal amplitude
JUNE 2011 S U T H E R L A N D E T A L . 1127

generally increases landward, growing to .3 m in South
Sound (Mojfeld and Larsen 1984).
Meteorological fields of surface pressure, 10-m winds,
2-m temperature, 2-m relative humidity, shortwave ra-
diation, and downward longwave radiation were derived
from two versions of the Northwest Modeling Con-
sortium fifth-generation Pennsylvania State University–
National Center for Atmospheric Research Mesoscale
Model (MM5) regional forecast model (Mass et al. 2003).
A 4-km resolution, hourly output MM5 model covers the
majority of the model domain, from 1268 to 1118W and
from 41.58 to 49.58N. Outside of that region, a 12-km
version of the MM5 model extended the spatial coverage
of the atmospheric fields. The meteorological fields are
subsampled to every 4 h for use in ROMS. The ROMS
model uses bulk flux parameterizations to derive surface
momentum and heat fluxes to the ocean from the atmo-
sphere (Fairall et al. 1996). The model wind stress cor-
relates well with the observed winds taken from a surface
buoy outside the Columbia River mouth during the
summer of 2006 (Fig. 2; Tinis et al. 2006). The wind record
shows the dominant seasonality observed in the Salish
Sea region, with upwelling favorable winds (southward)
common in the summer, whereas strong, storm-driven
winds prevail during the fall and winter months.
3. Model validation: Comparison with observations
Model validation is done by quantifying comparisons
against observations and by defining and interpreting
appropriate model skill scores (e.g., Willmott 1981;
Murphy 1988; Oke et al. 2002; Warner et al. 2005; Wilkin
2006). We choose to use a combination of two com-
monly used metrics: the first is the correlation coefficient
R2, which is the covariance between two variables and
equals
R 51
sm
1
so
1
N�N
i51(mi 2 m)(oi 2 o), (3.1)
where mi is the model variable at time or location i; oi is
the observed variable at time or location i; N is the
number of observations; sm and so are the standard
deviations of the model and observed variables, re-
spectively; and the overbar indicates an average. The
statistical significance of the correlation coefficient (at
the 95% level) is based on the effective degrees of
freedom, which is calculated as N9 2 2, where N9 is the
e-folding value of the autocovariance of the observed
variable (Emery and Thomson 1997). For records with
small N, such as the repeat CTD stations discussed
below, we use Student’s t test to determine if the cor-
relation is significant.
A skill score SS for a model is generally defined as
SS 5 1 2 X/Xref, where X is a model–data comparison
statistic and the subscript ref refers to a reference ex-
periment (e.g., Murphy 1988; Ralston et al. 2010). Posi-
tive SS means the new run performs better than the
reference run, whereas negative SS indicates worse
FIG. 2. (top) Daily time series of observed river discharge Qr
(1000 m3 s21) during 2006 for the Columbia, Fraser, and the
combined Skagit and Snohomish rivers. (bottom) North–south
wind stress ty (N m22) used in the model at the central RISE
mooring location, where ty , 0 indicates upwelling favorable
winds. The gray line shows the observed wind stress at the same
location, available only during the summer and early fall.
FIG. 3. (a)–(c) Time series of sea surface height z (m) measured
by NOAA tide gauges (gray) and simulated by the model (black)
for a month-long period in the summer of 2006. Skill scores are
listed for each location, with correlation coefficients R2 listed in
parentheses. All R2 were significant at the 95% level. (d) A year-
long record of the observed subtidal sea surface height zlp (m) re-
corded at the Seattle, Washington, tide gauge (gray) plotted against
the modeled zlp (black).
1128 J O U R N A L O F P H Y S I C A L O C E A N O G R A P H Y VOLUME 41

performance. We use a skill score with X 5 MSE as the
second validation metric. MSE is a measure of the dif-
ference between the model and observed quantities and
has dimensional units, and it equals
MSE 51
N�N
i51(mi 2 oi)
2. (3.2)
Here, SS is the combination of three terms, SS 5 R2 2
VB 2 MB, where VB is a bias error associated with the
variance (i.e., not getting the amplitude of the variable
correctly) and MB is a mean bias error. Thus, in all cases,
SS , R2.
a. Sea surface height
Observed records of z come from nine available Na-
tional Oceanic and Atmospheric Administration (NOAA)
tide gauges (http://tidesandcurrents.noaa.gov/) located
around the region (Table 1). The model captures the
amplitude, phase, and spring–neap variability of the tidal
signals (Fig. 3), with SS . 0.9 everywhere and signifi-
cant R2 at all locations (Table 1). Ratios of the modeled
to observed amplitudes of the M2, S2, and K1 constit-
uents, calculated using the T-TIDE analysis software in
MATLAB (Pawlowicz et al. 2002), show that the model
has better skill at diurnal frequencies (Table 1). At semi-
diurnal frequencies, the modeled amplitude was gen-
erally too low. No tide gauge records are available in
the farthest reaches of Puget Sound, such as South
Sound or Hood Canal. However, comparisons of z
against an empirical tide model tuned explicitly for Puget
Sound (Lavelle et al. 1988) were statistically significant
within each of these separate basins (not shown).
The range of the tidally averaged sea surface height,
zlp, was ;0.5 m inside Puget Sound, with low zlp values
during the upwelling season in the summer months. All
tidal averaging is done with a Godin-type filter of con-
secutive 24–24–25 h running averages (Godin 1991). The
modeled subtidal variability was similar at all nine tide
gauges and compared reasonably well with the observed
zlp, indicating the large spatial coherence of zlp. The largest
error was an event in February, which caused a low zlp
anomaly that was missed in the model. The model does not
include an inverse barometer effect, so these errors are
most likely caused by weather-induced pressure anomalies.
b. CTD comparisons
Profiles of T and S obtained from CTD casts are
available from a number of sources throughout the Sa-
lish Sea region, with a total of 441 casts for 2006. The
twice-yearly PRISM cruises gathered .40 profiles in
both June and December 2006, whereas the Washington
State Department of Ecology (DoE) monitors a series
of repeat CTD locations in each of the major basins of
Puget Sound (Fig. 4). In addition, the Joint Effort to
Monitor the Strait (JEMS) program conducts regular
CTD profiling at three stations south of the San Juan
Islands (Fig. 4). CTD casts on the shelf come from the
RISE project, with the majority clustered in water depths
less than 200 m but with good coverage north and south
around the RISE moorings. In the Strait of Georgia, as
well as the channels of the San Juan Islands, CTD profiles
taken in 2006 were obtained from the IOS database.
To quantitatively compare the model T and S profiles
to the synoptic CTD casts, we first interpolated the obser-
vations and model profiles vertically onto a uniform depth
grid with 1-m spacing. Next, we calculated a density profile
r(z) and defined the water column as stratified if the criteria
dr/dz , 20.1 kg m24 was met below a depth of 5 m (Moore
et al. 2008). The depth of the maximum density gradient Zs
was calculated for each stratified CTD profile. We calcu-
lated the approximate two-layer stratification DS by taking
the difference between the mean S of the lower (z . Zs)
and upper (z , Zs) layers (DS . 0 is stable). In cases cat-
egorized as unstratified, we define DS to be the water col-
umn difference in S. Figure 5 illustrates this method for
TABLE 1. Skill scores SS of sea surface height z comparisons between the model and nine NOAA tide gauges over 2006. Correlation
coefficients R2 are reported in parentheses. The remaining columns show the amplitude ratio Ar of modeled to observed amplitudes and
the difference in phase (relative to UTC) ud of the modeled minus observed phases for three select tidal constituents.
Location SS (R2)
M2 S2 K1
Ar ud Ar ud Ar ud
Astoria, OR 0.85 (0.86) 0.83 218 0.84 228 0.96 138
Garibaldi, OR 0.95 (0.95) 0.99 5.48 1.1 5.98 0.99 0.58
La Push, WA 0.90 (0.91) 0.94 128 0.91 138 0.98 4.28
Neah Bay, WA 0.94 (0.95) 0.89 7.98 0.85 108 0.97 2.98
Port Angeles, WA 0.92 (0.93) 0.69 138 0.70 128 1.0 0.68
Port Townsend, WA 0.94 (0.94) 0.75 2148 0.75 128 1.0 22.58
Friday Harbor, WA 0.92 (0.92) 0.86 258 0.83 258 1.0 23.38
Seattle, WA 0.93 (0.94) 0.75 128 0.76 9.98 1.0 23.78
Tacoma, WA 0.93 (0.94) 0.75 128 0.76 9.38 1.0 23.68
JUNE 2011 S U T H E R L A N D E T A L . 1129

the SAR003 repeat CTD station at three different times
of year. The model mean salinity Smod
was always greater
in these three cases than the observed mean salinity Sobs
.
In addition, the model Zs was always deeper than the
observed Zs, indicating that the model does not fully cap-
ture the sharp pycnoclines present in Whidbey Basin.
To evaluate the model performance in different re-
gions of the Salish Sea, we group the CTD profiles into
FIG. 4. (left) Map of the model domain with locations of moored observations from various projects that were used
in the model–data comparisons. Solid lines show the locations of the sections used to calculate salt flux, exchange
flow, and other properties. (right) Zoom in on Puget Sound, showing the available mooring observations as in the left
panel, but also indicating the repeat CTD stations (gray squares) used to analyze seasonal variability.
FIG. 5. (a)–(c) Observed (gray) and modeled (black) salinity profiles at the SAR003 location in Whidbey Basin at
three times of year. Dashed lines show the mean salinity of the observed profile Sobs
and the modeled profile Smod
,
whereas circles denote the depth of the pycnocline in the model Zmod and observations Zobs.
1130 J O U R N A L O F P H Y S I C A L O C E A N O G R A P H Y VOLUME 41

three areas: Puget Sound, coastal Washington (which
includes any cast seaward of the Strait of Juan de Fuca),
and the straits (SJdF and SoG). Histograms of the dif-
ferences in mean S (DS), stratification [D(DS)], and Zs
(DZs), reveal significant biases that differ across each
region (Fig. 6). In Puget Sound and the Straits, Smod .
Sobs by ;0.5 psu, whereas, on the shelf, the model is too
fresh (Sobs
. Smod
) by a similar magnitude, ;0.5 psu.
The model does better in capturing the salinity stratifi-
cation inside Puget Sound, with mean differences in
DS near 0 but is overstratified slightly in the straits.
Stratification is created by the influx of river water,
which decreases S in the surface layer (Figs. 5a,c), as well
as surface heating during the summer. Note that a ma-
jority of the straits’ CTD profiles were located in the
SJdF and the San Juan Islands and were unstratified
(93 out of a total 140 casts). This reduced the number of
casts in Fig. 6h, resulting in a D(DS) statistic that mostly
represents biases in top-to-bottom salinity differences
(Fig. 6e). The DZs are clustered near zero in each region,
FIG. 6. (a)–(c) Histograms (percentage of total CTD casts) of DS (psu) grouped by region, Puget Sound, the SJdF and SoG, and off of
coastal Washington and the Columbia River. Here, DS is the difference between the observed and modeled mean S. (d)–(f) As in (a)–(c),
but for D(DS) (psu), which is the mismatch between the difference of the top and bottom layer salinities of the model and observations.
(g)–(i) As in (a)–(c), but for jDZsj (m), which is the difference in pycnocline depths measured observationally and calculated by the model.
Note that the Straits region was commonly unstratified.
JUNE 2011 S U T H E R L A N D E T A L . 1131

though they are skewed toward positive values. This is
another indication that the model stratification is too
gradual and does not capture the sharp S and T gradients
observed.
To examine the model’s performance over seasonal
time scales, we use the CTD observations from the avail-
able repeat stations (Fig. 4 and Table 2). At each station,
we compare a surface (5 m deep) and deep (5 m from
the bottom) T and S value against the model (Fig. 7).
The T record clearly shows that the model captures the
seasonal cycle of warming in the surface layer at both
locations. In the deep layer, the Main Basin station
exhibits warming through the fall, lagging the surface
heating, whereas the JEMS-N deep T shows little varia-
tion. For all four T records shown, SS . 0.4, with signif-
icant R2 values.
The seasonal trends in S are more difficult to interpret
from monthly CTD casts, as freshwater input varies on
much shorter time scales. However, S generally increases
throughout the summer, in response to the prevailing
upwelling conditions at the coast and the low-discharge
conditions of local rivers (Fig. 2). The model–data com-
parisons are generally good, with SS . 0 and significant
R2, with the one exception at the deep MB station. The
model mean S is too salty there, decreasing SS to below
zero, even though the R2 value is significant.
Overall, the best model skill was located in the SJdF
(JEMS-N), with significant R2 and high SS in all vari-
ables (Table 2). The location with the worst overall
performance was inside Hood Canal, where only the
deep S showed better skill than the mean of the obser-
vations. However, the R2 values were mostly significant,
so the errors in Hood Canal came from a T/S mean bias.
Hood Canal is one of the narrowest and deepest parts
of Puget Sound, making it difficult to model accurately
after bathymetric smoothing takes place. Even though
grid resolution is on the order of 400 m there, there are
sections that have ,10 grid points across the channel.
c. Moored T/S comparisons
A more comprehensive view of the seasonal cycle, as well
as short-term variability, comes from moored time series of
T and S. Inside Puget Sound, the available mooring records
for 2006 are scarce, with the only data obtained through the
Hood Canal Dissolved Oxygen Program (HCDOP),
which maintains a series of profiling moorings at several
locations in Hood Canal. To complement the data inside
Puget Sound, we also present comparisons with obser-
vations taken by the RISE project. In summer 2006,
RISE maintained three shelf moorings that recorded
T and S at 2 and 20 m, as well as full water column
velocities from a bottom-mounted ADCP (Fig. 3).
The simulated S on the shelf at the RISE-N location
(Fig. 8 and Table 3) shows the variability in the position
of the Columbia River plume, which oscillates north-
ward and southward, depending on the wind direction
(Garcıa-Berdeal et al. 2002; Liu et al. 2009a). Low S
events occur throughout the year, even during the sum-
mertime upwelling season, and the model does fairly well
at capturing the timing and magnitude of these events.
The model is too fresh at 20 m during the late summer.
At the Hood Canal site, the S variability is smaller in
magnitude and differs from the shelf in that the two
dominant modes of variability occur at spring–neap and
seasonal time scales. The model captures this S vari-
ability well in the surface layer but is offset by ;0.5 psu in
the deep layer at 60 m.
The T comparisons (Figs. 8e–h) display a seasonal
warming superimposed on plume-induced changes at
the RISE-N site, and a small spring–neap variability in
Hood Canal. The model surface warming is too strong
in Hood Canal compared to the observations, which de-
creases SS there, despite a high R2.
d. Velocity comparisons
Accurately simulating the salinity structure of the
Salish Sea is not enough to calculate salt fluxes; one
needs the velocity field as well. Inside the SJdF, a strong
estuarine circulation exists with a fresh surface outflow
overlying a deeper, saltier inflow, with an estimated
magnitude of 0.1–0.2 Sv (1 Sv [ 106 m3 s21; Labrecque
et al. 1994; Thomson et al. 2007). Local winds drive the
flow on the inner shelf that leads to upwelling conditions
and also influence the propagation of the Columbia
River plume, often times resulting in plumes in two di-
rections of different ages (Hickey et al. 2009).
Figure 9 shows comparisons of modeled and observed
tidally averaged currents at four locations around the
region. At the mouth of the SJdF (EH1), the surface
currents are directed westward at ;0.2 m s21 above 50 m,
whereas deeper waters flow inward (Fig. 9e). Reversals
TABLE 2. Skill scores SS at repeat CTD stations (Washington
DoE or JEMS). Correlation coefficients R2 are reported in pa-
rentheses, with the difference commonly caused by the mean bias
MB. Numbers in bold are SS . 0 and significant R2 values at the
95% level. Numbers next to the station name indicate the number
of casts taken in 2006.
Station Surface S Surface T Deep S Deep T
ADM001 (7) 0.73 (0.75) 0.67 (0.92)20.13 (0.60) 0.39 (0.53)
ADM002 (9) 0.18 (0.32) 0.21 (0.37) 0.19 (0.91) 0.22 (0.37)
PSB003 (8) 0.31 (0.72)20.34 (0.95) 0.88 (0.98) 0.98 (0.99)
SAR003 (11) 0.71 (0.83) 0.80 (0.94)23.1 (0.78) 0.92 (0.93)
MB-South (12) 0.40 (0.66) 0.76 (0.95)20.99 (0.69) 0.78 (0.87)
HCN (9) 22.8 (0.51) 20.89 (0.79) 0.79 (0.88)21.0 (0.16)
SSound (12) 21.3 (0.64) 0.96 (0.98)21.1 (0.78) 0.98 (0.98)
JEMS-N (7) 0.14 (0.89) 0.86 (0.98) 0.87 (0.94) 0.42 (0.61)
1132 J O U R N A L O F P H Y S I C A L O C E A N O G R A P H Y VOLUME 41

in this estuarine like flow occur during all times of year
(e.g., Frisch et al. 1981), with the variability captured
only modestly by the model. The mean surface outflow
speed is underestimated, resulting in SS , 0, despite
a significant R2 of 0.53. Table 4 lists SS and R2 for all the
current meter records available during 2006, with sta-
tistics for tidally averaged surface velocities usurf and ysurf,
tidally averaged deep velocity ydeep (udeep for EH1), and
depth-averaged velocities uave and yave.
The structure of u(z) in the dominant east–west di-
rection at EH1 is captured well. In the deep inflowing
layer udeep, however, the model does not reflect the am-
plitude of variability observed, resulting in a low SS.
At the RISE-N location, the model captures the re-
sponse of the ysurf and ydeep currents over periods greater
than weekly, although it does a poorer job on the sub-
weekly coastally trapped wave (CTW) time scales. The
model overpredicts the mean y(z) by 0.05 m s21 (Fig. 9f),
though the vertical shear is correct. The comparisons are
similar at the RISE-S location, although the model y(z)
underpredicts the southward flow (Fig. 9g). The absence
of weekly variability is consistent with the experience of
Liu et al. (2009b) in modeling this shelf with the global
NCOM boundary conditions. This would be a clear target
for improvement to address scientific issues dependent on
CTWs but is probably less important for studying the ex-
change flow in the Salish Sea.
Inside Hood Canal, the model is less successful at rep-
resenting y(z) (Fig. 9). The tidal currents are significantly
correlated, although the variance in the model uave
FIG. 7. (a) Observed (gray) and modeled (black) salinity time series taken at two repeat CTD stations at a depth of
5 m [MB south (solid line with circles); JEMS north (dashed line with squares)]. Skill scores SS are listed with R2
correlation coefficients in parentheses (boldface if significant at the 95% level). (b) As in (a), but for deep salinity
taken at a depth of 5 m off the bottom (183 m for MB south and 160 m for JEMS north). (c) As in (a), but for surface
temperature (5 m). (d) As in (b), but for deep temperature.
JUNE 2011 S U T H E R L A N D E T A L . 1133

is too small. The model shows a strongly sheared
layer in the upper few meters that is not observed.
This shallow upper layer may be missed by the ob-
servations, which were taken by an upward-looking,
bottom-mounted ADCP, resulting in part of the error.
A compensating southward flow is observed at a depth
of ;10 m, but this inflow is spread over a greater
depth in the model, with a peak magnitude centered at
20 m.
e. Model validation summary
The model performs adequately over a wide range of
scales. It has well-developed estuarine flow in the SJdF,
so the main mechanism controlling water properties in
the Salish Sea appears to be functioning. Salinity struc-
ture in Puget Sound has roughly the right stratification
and halocline depth but is too salty by about 0.5. One
may infer from these that the exchange flow may be
FIG. 8. (a)–(d) Observed (gray) and modeled (black) tidally averaged salinity time series at two depths at the RISE
north location and two depths at the Hood Canal–Hansville mooring location. Skill scores SS are listed with R2
correlation coefficients in parentheses (bold if significant at the 95% level). (e)–(h) As in (a)–(d), but for tidally
averaged temperature time series.
1134 J O U R N A L O F P H Y S I C A L O C E A N O G R A P H Y VOLUME 41

about right but that the length of the model salt intrusion
is too great. This deficiency may be due to poor resolution
of topographic features that drive mixing (Edwards et al.
2004) and is discussed further in section 5. The annual
cycle of surface and deep temperature and salinity are
in reasonable agreement with observations. Moreover,
these patterns have substantially higher correlation co-
efficients than those in the simplified box model of
Babson et al. (2006, their Table 2). Thus it appears that
the vastly greater complexity of the present model brings
some benefits.
4. Results
The seasonal trend in salt content is similar across
Puget Sound (Fig. 10). From the end of summer through
the fall, Puget Sound gains salt with S increasing from
28.5 to 29.5 over a span of 3 months. During winter,
the sound freshens rapidly, with the fastest and largest
changes found in Whidbey Basin, where S drops from 29
to 27 in less than 2 weeks. Early spring brings an increase
in salinity, followed by a relatively steady period until
early summer, consistent with the trends seen in the
monthly DoE (Fig. 7) and HCDOP data (Fig. 8). These
three distinct time periods characterize all the Puget
Sound regions. The most landward reaches, South Sound
and Whidbey Basin, are generally the freshest throughout
the year, whereas Admiralty Inlet is the saltiest. Admiralty
Inlet and Whidbey Basin show the strongest nonseasonal
variability, with pronounced changes on spring–neap time
scales.
To characterize the estuarine nature of Puget Sound,
we need to understand what controls the gain or loss of
salt over a year. For example, when the region begins
to gain salt, is it due to decreasing river discharge or to
the increasingly saltier water in the SJdF after the onset
TABLE 3. Skill scores SS and correlation coefficients R2 for
comparisons between moored temperature and salinity records
and ROMS model output at various locations. The R2 values for
the time series that are significant at the 95% level are listed in
bold, as are SS . 0 (for all comparisons).
Station Ssurf Tsurf Sdeep Tdeep
RISE-N 0.71 (0.74) 0.04 (0.60) 20.06 (0.74) 0.47 (0.57)
RISE-C 0.01 (0.25) 0.49 (0.53) 0.10 (0.58) 20.13 (0.17)
RISE-S 0.61 (0.61) 0.39 (0.42) 0.64 (0.74) 0.54 (0.68)
HCN-Hans 0.14 (0.63) 0.67 (0.98) 21.2 (0.66) 0.96 (0.97)
HCN-Duck 23.5 (0.73) 0.71 (0.84) 21.2 (0.94) 28.6 (0.46)
HCN-Hood 20.42 (0.72) 0.85 (0.89) 20.43 (0.86) 20.67 (0.48)
FIG. 9. (a)–(d) Observed (gray) and modeled (black) tidally averaged, near-surface velocity records taken at
several mooring locations over a 3-month period in summer 2006. At EH1, usurf is shown, whereas ysurf is shown for all
others. Note the scale changes between each panel. Skill scores SS are listed with R2 correlation coefficients in
parentheses (boldface if significant at the 95% level). (e)–(h) Observed (gray) and modeled (black) mean velocity
profiles as a function of depth over the length of the observational record for the same velocity components shown in
(a)–(d). Note the depth and velocity scales change between each panel.
JUNE 2011 S U T H E R L A N D E T A L . 1135

of coastal upwelling? Babson et al. (2006) found that, for
much of the sound, SJdF salinity was of greatest im-
portance. To begin to answer these types of questions in
the model, we first examine the exchange flow and salt
flux patterns across the region.
a. Total exchange flow and salt flux
A simple way to examine the estuarine salt balance is
to combine the conservation of salt and volume into the
Knudsen relations,
2Qin 5Sout
dSQR 1
1
dS
d
dt
ðS dV and (4.1)
Qout 5Sin
dSQR 1
1
dS
d
dt
ðS dV, (4.2)
where Qin and Qout are the volume fluxes of water into and
out of the estuary, respectively, and QR is the freshwater
flux. In this study, we define these volume fluxes by cal-
culating the transport as a function of salinity Q(S). Fol-
lowing the derivation by MacCready (2011),
Q(S) 5
*ðA
S
u dA
+, (4.3)
where the velocity u across a section is integrated over
the tidally varying area AS, where the salinity is greater
than S. Angled brackets indicate a tidal average. To
calculate the volume flux over a limited salinity range,
one can find the derivative ›Q/›S, where positive ›Q/
›S indicates flow out of the estuary. In practice, this
means calculating the volume transport across a given
section at every time step, binning those transports
into a finite set of salinity classes, and then taking the
tidal average of those transports. An example of ›Q/
›S (Fig. 11) illustrates that it is akin to a histogram of
transport in discrete salinity bins and is discussed in
more detail below. Here, Qin (Qout) is then the sum of
›Q/›S over all the incoming (outgoing) water, and dS 5
Sin 2 Sout, where Sin 5 Fin/Qin and Sout 5 Fout/Qout are
the flux-weighted salinities of the in- and out-estuary
transport. The salt fluxes are equal to
Fin[
ðS
�›Q
›S
�����in
dS, Fout[
ðS
�›Q
›S
�����out
dS, (4.4)
where the integrals are only over the salinity bins with
incoming or outgoing volume transport.
The four terms Qin, Qout, Sin, and Sout will be collec-
tively called the total exchange flow (TEF), because they
intrinsically carry the full salt flux and make (4.1) and
(4.2) exactly correct (MacCready 2011). In contrast, it is
common to calculate the exchange flow using the tidally
averaged velocity organized by spatial position on the
cross section (Lerczak et al. 2006) instead of salinity. We
will refer to this method as the ‘‘Eulerian’’ exchange
flow, denoted by superscript Eu, because it depends
fundamentally on position in the water column and is
related to what fixed instruments would observe. The
Eulerian terms do not include salt fluxes due to tidal
correlations of transport and salinity, whereas the TEF
terms do. A full derivation of the TEF terms and further
comparison with the Eulerian decomposition is given in
MacCready (2011).
Comparison of the exchange flow calculated from
the two methods at AIN reveals significant differences
TABLE 4. Skill scores SS and correlation coefficients R2 for comparisons between moored ADCP records and ROMS model output at
various locations. The R2 values and SS . 0 that are significant at the 95% are listed in boldface.
Station usurf ysurf ydeep uave yave
EH1 20.37 (0.53) 20.26 (0.10) 22.4* (0.43)** 0.89 (0.90) 0.09 (0.38)
EH2 0.04 (0.20) 20.25 (0.44) 0.51 (0.58) 0.01 (0.18) 20.88 (0.37)
RISE-N 20.68* (0.05) 0.21 (0.32) 0.25 (0.27) 20.44* (0.23) 20.16* (0.25)
RISE-C 20.96* (0.02) 20.67 (0.33) 20.98 (0.16) 21.6* (0.01) 22.8 (0.24)
RISE-S 21.1* (0.01) 20.47* (0.24) 0.29 (0.38) 21.9* (0.0) 20.09* (0.24)
HCN-Hood 25.5* (0.04) 0.05 (0.22) 20.5 (0.01) 27.9* (0.48) 0.34 (0.64)
* Variance bias . mean bias in making SS , R2 (in those cases with SS , 0).
** In the case of EH1, udeep is used because the flow is primarily east–west.
FIG. 10. Tidally averaged mean salinity of Puget Sound (thick
black line) and its basins (thin colored lines), calculated from the
numerical model over the year 2006.
1136 J O U R N A L O F P H Y S I C A L O C E A N O G R A P H Y VOLUME 41

(Fig. 11). Though the magnitudes of the transports are
similar, the TEF spans a significantly wider range of sa-
linities. Here, Sin is 31.9, whereas SEuin is 31.6; Sout is similar
to SEuout (31 and 30.9, respectively) but includes contribu-
tions from both fresher and saltier salinity classes.
Figure 12 illustrates the range and variability of the
annual average TEF terms across the Salish Sea, using the
sections shown in Fig. 4. Changes in Sin and Sout between
sections reflect water mass modification, because of either
the addition of water with a different salinity or the
presence of mixing processes. The incoming water from
the coastal ocean changes little through the SJdF to the
entrances of Puget Sound and the SoG (Fig. 12). This
suggests that mixing is negligible along the SJdF, relative
to the modification that happens at AIN and SoG. The
outgoing waters from the SoG and Puget Sound have
Sout ; 30.5 but are significantly altered as they transit into
the SJdF and exit into the coastal ocean at Sout ; 31.5.
The largest modifications to Sin and Sout occur be-
tween basins. For example, Sin changes little across Main
Basin from north to south, going from 31.1 to 30.8,
whereas Sout actually increases, going from 29.4 to 30.2
because of the input of the Skagit and Snohomish River
waters exiting Whidbey Basin. In general, though, both
Sin and Sout decrease from the SJdF into Puget Sound
and the SoG (Fig. 12a). A fall off also occurs in 2Qin,
decreasing from a maximum of 130 3 103 m3 s21 at the
entrance to the SJdF to 28 3 103 m3 s21 at Admiralty
Inlet and 83 3 103 m3 s21 into the SoG.
The TEF-derived Qin and Qout have magnitudes much
greater than the river discharge alone, expressed by the
amplification factor ar 5 Qin/Qr. Here, ar ranges from
10–40, except in the far reaches of Puget Sound, where
Qr gets small, and ar ; 130 at Tacoma Narrows. These
results are qualitatively consistent with those of Cokelet
et al. (1991).
Although the annual average TEF highlights the gen-
eral structure of the estuarine circulation in Puget Sound
and the Salish Sea, it hides the rich time dependence
hinted at in Fig. 10. Both Qout and Qin at AIN pro-
gressively get saltier from later summer into the fall,
mimicking the variability in salt content (Fig. 13). When
the storm season starts in November, Qout freshens and
increases initially because of the increased river discharge
and then reverses for a short time period. On top of this
seasonal variability, the TEF at AIN is modulated on
spring–neap time scales, as can be seen from its diverging
and converging values (Fig. 13a). During neap tides, Qout
decreases in salinity class and Qin brings in saltier waters,
whereas they converge toward similar salinities during
spring tides. These patterns are explored in more detail
for AIN in Fig. 14. During spring tides the salinity dif-
ference between inflowing and outflowing water gener-
ally decreases, consistent with the observations of Geyer
and Cannon (1982). However the magnitude of the trans-
port terms generally increases during springs, contrary to
their findings. These results are not necessarily conflicting,
because our transport terms include tidal fluxes, whereas
those of Geyer and Cannon (1982) do not.
At the entrance to Whidbey Basin, Qout shows a low-
salinity maximum coincident with the peak river dis-
charges from the Skagit and Snohomish rivers, which
gradually taper off through the fall months. The fall
storms intensify and freshen Qin almost immediately,
resulting in an export of fresh waters to the Triple Junc-
tion region of Puget Sound. This sudden export is the
probable cause of the reversal seen in the exchange flow
(Qout is saltier than Qin) at Admiralty Inlet (Fig. 13a) and
Main Basin north (not shown). Babson et al. (2006) ob-
served this fall reversal in their box model study as well,
attributing it to a sign reversal of the surface salinity
gradient between the two basins.
In the lower reaches of Hood Canal (Fig. 13c), the
magnitude of the TEF decreases significantly, but many
of the same time dependent features are found. For
example, when the Skokomish River discharge increases
during the fall months, the out-estuary flow freshens and
intensifies. During the summer, though, the pattern is
FIG. 11. Exchange flow as a function of salinity, ›Q/›S, averaged
over a spring–neap cycle in September 2006 at AIN. The exchange
flow calculated using the TEF formulation (black) covers a wider
range of salinity (triangles denote Sin and Sout) than the Eulerian
estimate (gray).
JUNE 2011 S U T H E R L A N D E T A L . 1137

more complicated, with multiple layers of Qin and Qout;
the freshest waters are actually moving in estuary and
then presumably entering Hood Canal from the north.
Three-layered estuarine circulation has been observed
in other parts of the sound (Edwards et al. 2007).
b. Admiralty Inlet salt flux variability
Although the TEF analysis presented above quan-
tifies the actual flux of salt that is entering and exiting the
estuary, it does not explicitly highlight what physical
processes are controlling the salt content variability. The
temporal variability in ›Q/›S (Fig. 13) and thus the salt
flux can be correlated with various forcing mechanisms,
and this section explores those relationships at Admi-
ralty Inlet, where previous studies have investigated the
exchange flow.
Important forcing mechanisms include the Skagit
River discharge Qr, the strength of the tides UT, and
north–south wind stress t at the water surface. Here,
UT is calculated using the tidally averaged magnitude
of the depth-averaged velocity. Increasing tidal veloc-
ities increase bottom stress and can lead to enhanced
mixing in regions with intense tidal currents; this en-
hanced mixing can feedback on the exchange flow and
lead to changes in the net salt flux, Fnet 5 Fin 1 Fout.
The wind stress can directly influence the salt flux by
accelerating the surface layer flow, causing compen-
sating changes in Fin.
Decreasing UT results in less tidal mixing during neap
tides and an observed enhancement of the stratification
and exchange flow (Geyer and Cannon 1982), which is
supported by the negative correlation coefficients for
Fout (Table 5). The correlation is strongest during the
low-discharge summer months but is still significant in
the annual average. However, our TEF results presented
in Fig. 14 indicate that this correlation of high salt flux with
neap tides must be mainly due to the changing stratifica-
tion, because the volume transports are positively corre-
lated with the tides. Interestingly, the influence of the river
discharge is only significant with Fnet. Wind forcing is sig-
nificantly correlated to Fout but not Fnet, indicating the
northward winds at AIN tend to drive more exchange
flow. Correlations for Fin were similar in magnitude but the
opposite sign of the Fout results.
FIG. 12. (a) Annual average Sin (solid) and Sout (dashed) transport-weighted salinities vs distance from the mouth
of the SJdF. Colors show the different paths along each basin of Puget Sound and the SoG. (b) As in (a), but zoomed
in on the Puget Sound region. (c) As in (a), but for 2Qin, the in-estuary part of the TEF. (d) As in (c), but zoomed in
on the Puget Sound region.
1138 J O U R N A L O F P H Y S I C A L O C E A N O G R A P H Y VOLUME 41
c. Partitioning of Skagit River water
Another example of the utility of the TEF formalism
comes in looking at the partitioning of the freshwater flux
that can be used to quantify the distribution of different
river sources to an estuary. For example, in Skagit Bay,
Skagit River water can exit westward through DP or
southward through Saratoga Passage (WBN). The distri-
bution of river water here is also important, because it in-
fluences where sediment is carried and may impact how
reversals in the Main Basin exchange flow are created as
low-salinity waters exit Whidbey Basin (Babson et al. 2006).
The freshwater portion of the out-estuary transport
QFW can be calculated simply once the total exchange
flow is known by combining the Knudsen relations (4.1)
and (4.2) with volume conservation,
QFW 5
�1 2
Sout
Sin
�Qout 2
1
Sin
d
dt
ðV
S dV. (4.5)
In (4.5), Sin is the flux-weighted salinity of the total in-
coming transport between DP and WBN and S is the
mean salinity of the volume V defined between the
sections.
The annual-mean Skagit River discharge is 470
m3 s21. Over an annual average, the storage term is
negligible, and we find that 180 m3 s21 (38%) of the
freshwater exits Skagit Bay through Deception Pass and
290 m3 s21 (62%) exits southward.
The fraction of Skagit River water passing through
Deception Pass is highly variable throughout the year,
though in the winter months it is generally larger in
magnitude and positive (Fig. 15). During the summer,
southward flow through WBN carries the majority of the
freshwater out of Skagit Bay (Fig. 15b). Variability in
QFW at DP is related to wind forcing, much like south-
ward winds decreased Fout at AIN. Northward and
westward winds are correlated with increased freshwa-
ter transport at DP, with R2 of 0.65 (20.61) between
north–south wind stress (east–west wind stress) and
QFW. This wind influence is consistent with previous
detailed numerical simulations of the Skagit River Delta
(Yang and Khangaonkar 2008).
d. Residence times in Puget Sound
The concept of residence time Tres is critical to un-
derstanding the functioning of an estuary, because it
connects the physical circulation features with bio-
logically important time scales. The strength of the re-
sidual circulation, quantified by the TEF, determines
this residence time. Driven by the river flow alone, Tres
would equal the river filling time, Triv 5 V/Qr, about 5 yr,
TABLE 5. Correlation coefficients at AIN between Fout and Fnet
against three forcing mechanisms: Skagit River discharge Qr, tidal
velocity UT, and north–south wind stress t. A negative correlation
indicates that increases in Qr, UT, and t weaken the respective salt
flux term. Values significant at the 95% level are in boldface.
Qr UT t
Fout 20.25 20.41 0.41Fnet 0.70 20.21 20.15
FIG. 13. (a) Tidally averaged exchange flow, ›Q/›S (103
m3 s21 psu21), across the AIN north section. Here, ›Q/›S . 0 in-
dicates out-estuary flow. (b) As in (a), but for the Whidbey Basin
south section. The axis limits stay constant, but note that the color
scale changes. (c) As in (a), but for the Hood Canal south section.
The axis limits stay constant, but note that the color scale changes.
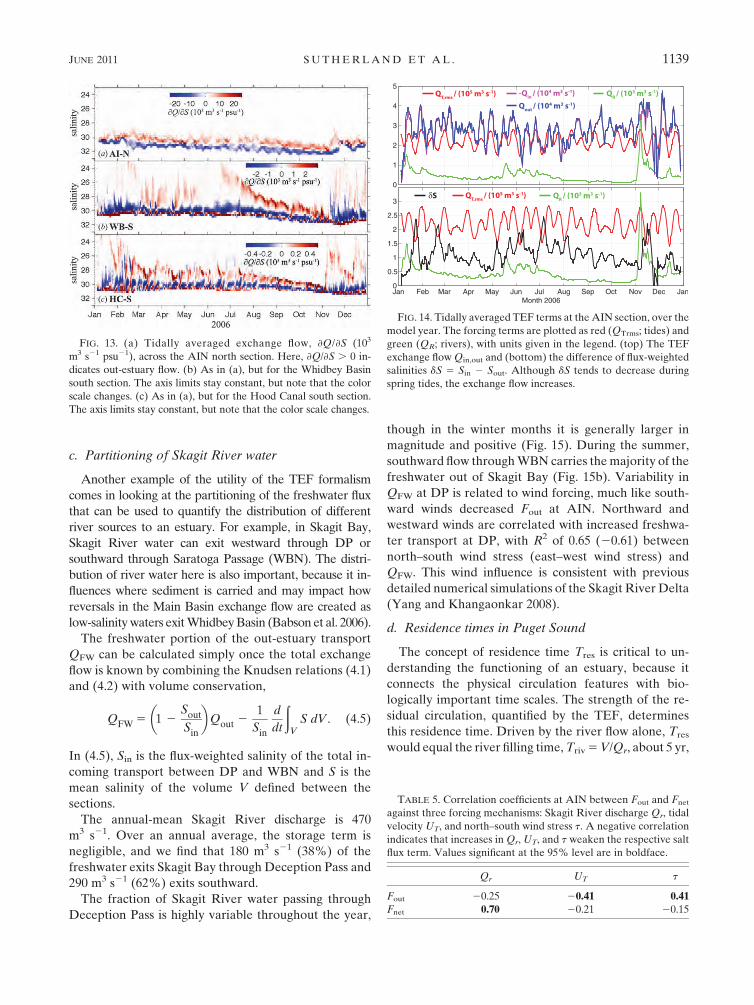
FIG. 14. Tidally averaged TEF terms at the AIN section, over the
model year. The forcing terms are plotted as red (QTrms; tides) and
green (QR; rivers), with units given in the legend. (top) The TEF
exchange flow Qin,out and (bottom) the difference of flux-weighted
salinities dS 5 Sin 2 Sout. Although dS tends to decrease during
spring tides, the exchange flow increases.
JUNE 2011 S U T H E R L A N D E T A L . 1139

where V 5 169 km3 is the volume (Lavelle et al. 1988)
and Qr 5 36.5 km3 yr21. However, the exchange flow is
amplified over the river discharge.
The simplest method to use in estimating estuarine
residence times is a box model approach, which was
done for Puget Sound in a study aimed at describing
seasonal to interannual changes (Babson et al. 2006).
More sophisticated techniques rely on high-resolution
numerical model results. These include the age tracer
method that was used, for example, in a study of Willapa
Bay, Washington (Banas and Hickey 2005), or through
repeated dye release experiments: for example, as done
in the Hudson River (Warner et al. 2010).
In this study, we calculate saltwater residence times
based on the box model approach to give order of
magnitude estimates that are useful in characterizing the
unique basins of Puget Sound. Following MacDonald
(2006), we will use the fluxes averaged in salinity classes
(TEF). The saltwater residence time is defined as
Tres 5
ðS dV/Fin, (4.6)
where the integral is over each respective volume.
Figure 16 shows Tres for Puget Sound landward of AIN
and DP and four basins defined as landward of their
most seaward section (e.g., HCN). These Tres are median
values of the distribution calculated using tidally aver-
aged values of each variable.
Puget Sound has a median Tres of 57 days (51–67 days
represent the first and third quartiles, because all the
distributions had positive skewness), much less than the
139 days estimated previously (Babson et al. 2006). To
ensure a meaningful comparison between the two-layer
box model and the present simulation, we recalculated
the Babson et al. (2006) transports at each section, and
then used those values to compute Tres for each volume
under consideration. The discrepancy in Tres may be
because the Babson et al. (2006) model appeared to
overestimate the stratification at Admiralty Inlet, which
leads to an underestimate of the exchange flow.
Hood Canal was found to have the longest Tres ;
81 days (53–125 days), in line with the previous estimates
for the region, with a high upper range that occurs pri-
marily during the low-flow summer months. Overall, the
residence times calculated here are shorter than those
found previously.
5. Discussion
The three large estuarine systems that comprise the
Salish Sea, Puget Sound, the SJdF, and the SoG are
themselves composed of smaller estuarine basins, such
as Hood Canal and Whidbey Basin, as well as individual
river systems, such as the Fraser and Skagit Rivers. This
is one of the reasons it has been difficult to classify Puget
Sound as a specific type of estuary. Our model results,
though, do support the notion that Puget Sound has
many properties characteristic of partially mixed estu-
aries, including a vigorous exchange flow with ar� 1; an
along-estuary salinity gradient; and variations in salt flux
correlated to river discharge, winds, and the strength of
the tides.
The steady Knudsen relation is a good approximation
for the salt balance in Puget Sound. The salt flux terms
are O(106 kg s21), two orders of magnitude larger than
the storage term, O(104 kg s21). The slight differences in
the salt flux terms do drive changes in the salt content of
Puget Sound, but the system is in a near steady state over
FIG. 15. (a) Components of the freshwater transport QFW
(m3 s21) in Skagit Bay including the inflowing river water (Qr;
thick black line) and outgoing transport at DP (thin black line) and
WBN north (thin gray line). (b) The outgoing freshwater transport
QFW, normalized by the river discharge Qr, at DP (thin black line)
and WBN north (thin gray line).
FIG. 16. Median saltwater residence times Tres (days) for Puget
Sound and its four major basins, where each volume is defined in
the text. The lines on each bar indicate the first and third quartile
ranges of the Tres distribution, whereas open circles denote the
Babson et al. (2006) estimates.
1140 J O U R N A L O F P H Y S I C A L O C E A N O G R A P H Y VOLUME 41

a yearly cycle. Increases in salinity are delayed in South
Sound and Whidbey Basin, relative to Admiralty Inlet,
Hood Canal, and Main Basin. This suggests that the
driver for the gain of salt is propagating in from outside
Puget Sound and is not solely driven by decreasing
river discharge, consistent with findings in Babson et al.
(2006).
Assuming one could use theoretical scales derived for
partially mixed estuaries in Puget Sound, we can esti-
mate the length of the salt intrusion, L . 1000 km, which
is much greater than the length of the sound itself
(MacCready and Geyer 2010). Here, L is sensitive to the
strength of tidal mixing, L } U21T , but only depends
weakly on river discharge, L } Q21/3r , in classic estuarine
theory (Hansen and Rattray 1965; MacCready and
Geyer 2010). In contrast, the stratification and exchange
flow theoretically vary only with changes in Qr and ba-
thymetry and do not depend upon UT.
One reason for the mean S bias found in the model
could be that L is too long because of not enough tidal
energy flux into Puget Sound. This would increase L but
not affect the stratification and exchange flow, which
were more accurately simulated. To test this hypothesis,
we calculated the flux of tidal energy, Ftidal 5 r0gzQnet, at
each section, where r0 is a constant background density
(1023 kg m23), g is the acceleration due to gravity, z is the
cross-sectionally averaged sea surface height, and Qnet 5
Qin 1 Qout with no tidal averaging. Lavelle et al. (1988)
calculated Ftidal in Puget Sound using an empirical tide
model and found that 730 MW propagated into north-
ern Admiralty Inlet. In this model, we find that Ftidal
; 310 MW at AIN, or about 42% of the observed tidal
energy flux. Most likely, this is due to not resolving the
sharpness and number of bathymetric features that act
as a drag on the tidal flow (Edwards et al. 2004; McCabe
et al. 2006). Despite this discrepancy at Admiralty Inlet,
the tidal energy fluxes calculated at the remaining Lavelle
et al. (1988) sections inside Puget Sound are in closer
agreement, differing by only 10% or less.
6. Conclusions and summary
This study examined the functioning of the estuarine
systems that constitute the Salish Sea, with particular
emphasis on Puget Sound. A numerical model has been
developed that has moderate skill in hindcasting the
circulation and water masses observed in the region. We
find that the subtidal circulation of Puget Sound, the
Strait of Juan de Fuca, and the Strait of Georgia, have
properties that resemble partially mixed estuaries
studied elsewhere. The magnitude of the total exchange
flow drops off from ;0.1 Sv at the mouth of the SJdF to
;0.03 Sv at the entrance to Puget Sound. Coincident
with the change in exchange flow is a pronounced
modification of the salinity of waters entering and exit-
ing the Salish Sea. In particular, we find that the sill re-
gions of Admiralty Inlet and the San Juan Islands are
locations of intense buoyancy flux, with salinities chang-
ing dramatically across relatively short distances.
Temporal variations in salt flux are correlated with
environmental conditions, such as river discharge, wind
stress, and the strength of tidal currents. Our results are
consistent with observed modulation of the stratification
at Admiralty Inlet on spring–neap time scales because of
variations in tidal mixing. In contrast, the strength of the
exchange flow (as calculated in isohaline coordinates)
increases during springs.
The calculation of volume fluxes in salinity classes was
found to allow simpler and more accurate calculation of
important properties of the system, including the overall
structure of the exchange flow; the saltwater residence
time; the freshwater flux out of Deception Pass; and the
response of the Admiralty Inlet exchange flow to forcing
by wind, rivers, and tides. The residence time calculation
suggested that Puget Sound has a residence time of
;2 months, which is supported by the salt content var-
iability on seasonal time scales. The model provides
some evidence that the seasonal change in salt content
within Puget Sound is driven externally via the Strait of
Juan de Fuca rather than by variability in river discharge
locally. However, a definitive answer to this question,
along with others such as how much Columbia River
water penetrates into the Salish Sea, is left to a future
study.
Acknowledgments. Funding was provided by the State
of Washington through the University of Washington
Puget Sound Regional Synthesis Model (PRISM) pro-
ject, and we thank M. Warner, J. Newton, and M. Kawase
for leading the data collection part of PRISM. Additional
support came from the National Science Foundation
Grants 0849622 and 0751683 and the Vetlesen Foun-
dation. This project benefited from many observational
programs, but we especially thank B. Hickey for leading
the RISE project and sharing the CTD data; E. Dever
for the RISE mooring data; and B. Hickey for leading
the ECOHAB PNW project, which is supported by the
Coastal Ocean Program of the National Oceanic and
Atmospheric Administration (NA09NOS4780180) and
the National Science Foundation (OCE0942675). The
Institute of Ocean Sciences in Canada and the Wash-
ington State Department of Ecology generously shared
their data, including the Joint Effort to Monitor the
Straits (JEMS) led by C. Maloy and J. Newton and
cosponsored by Ecology and PRISM. J. Newton,
M. Alford, A. Devol, and J. Mickett provided leadership
JUNE 2011 S U T H E R L A N D E T A L . 1141

for the Hood Canal Dissolved Oxygen Program (HCDOP),
funded through the U.S. Navy NAVSEA. D. Darr
provided system administration, and C. Bassin helped
archive data. Two anonymous reviewers provided
comments that greatly improved the clarity and con-
tent of this manuscript.
REFERENCES
Babson, A. L., M. Kawase, and P. MacCready, 2006: Seasonal and
interannual variability in the circulation of Puget Sound,
Washington: A box model study. Atmos.–Ocean, 44, 29–45.
Banas, N. S., and B. M. Hickey, 2005: Mapping exchange and
residence time in a model of Willapa Bay, Washington,
a branching, macrotidal estuary. J. Geophys. Res., 110,
C11011, doi:10.1029/2005JC002950.
Barron, C. N., A. B. Kara, P. J. Martin, R. C. Rhodes, and L. F.
Smedstad, 2006: Formulation, implementation and examina-
tion of vertical coordinate choices in the global Navy Coastal
Ocean Model (NCOM). Ocean Modell., 11, 347–375.
——, L. F. Smedstad, J. M. Dastugue, and O. M. Smedstad, 2007:
Evaluation of ocean models using observed and simulated
drifter trajectories: Impact of sea surface height on synthetic
profiles for data assimilation. J. Geophys. Res., 112, C07019,
doi:10.1029/2006JC003982.
Beckmann, A., and D. B. Haidvogel, 1993: Numerical simulation of
flow around a tall, isolated seamount. Part I: Problem formu-
lation and model accuracy. J. Phys. Oceanogr., 23, 1736–1753.
Canuto, V. M., A. Howard, Y. Cheng, and M. S. Dubovikov,
2001: Ocean turbulence. Part I: One-point closure model—
Momentum and heat vertical diffusivities. J. Phys. Oceanogr.,
31, 1413–1426.
Chapman, D. C., 1985: Numerical treatment of cross-shelf open
boundaries in a barotropic coastal ocean model. J. Phys.
Oceanogr., 15, 1060–1075.
Cokelet, E. D., R. J. Stewart, and C. C. Ebbesmeyer, 1991: Con-
centrations and ages of conservative pollutants in Puget
Sound. Puget Sound Research Proceedings, T. W. Ransom,
Ed., Puget Sound Water Quality Authority, 99–108.
Edwards, K. A., P. MacCready, J. N. Moum, G. Pawlak, J. M.
Klymak, and A. Perlin, 2004: Form drag and mixing due to
tidal flow past a sharp point. J. Phys. Oceanogr., 34, 1297–1312.
——, M. Kawase, and C. P. Sarason, 2007: Circulation in Carr Inlet,
Puget Sound, during spring 2003. Estuaries Coasts, 6, 945–958.
Egbert, G. D., and S. Y. Erofeeva, 2002: Efficient inverse modeling
of barotropic ocean tides. J. Atmos. Oceanic Technol., 19, 183–204.
Emery, W. J., and R. E. Thomson, 1997: Data Analysis Methods in
Physical Oceanography. Pergamon Press, 634 pp.
Fairall, C. W., E. F. Bradley, D. P. Rogers, J. B. Edson, and G. S.
Young, 1996: Bulk parameterization of air-sea fluxes for
Tropical Ocean-Global Atmosphere Coupled-Ocean Atmo-
sphere Response Experiment. J. Geophys. Res., 101, 3747–3764.
Finlayson, D. P., 2005: Combined bathymetry and topography of
the Puget Lowland, Washington State. University of Wash-
ington School of Oceanography. [Available online at http://
www.ocean.washington.edu/data/pugetsound/psdem2005.html.]
Flather, R. A., 1976: A tidal model of the northwest European
continental shelf. Mem. Soc. Roy. Sci. Liege, 10, 141–164.
Frisch, A. S., J. Holbrook, and A. B. Ages, 1981: Observations of
a summertime reversal in circulation in the Strait of Juan de
Fuca. J. Geophys. Res., 86, 2044–2048.
Garcıa-Berdeal, I., B. M. Hickey, and M. Kawase, 2002: Influence
of wind stress and ambient flow on a high discharge river
plume. J. Geophys. Res., 107, 3130, doi:10.1029/2001JC000932.
Geyer, W. R., and G. A. Cannon, 1982: Sill processes related to
deep water renewal in a fjord. J. Geophys. Res., 87, 7985–7996.
Godin, G., 1991: The analysis of tides and currents (review). Progress
in Tidal Hydrodynamics, B. B. Parker, Ed., John Wiley, 675–709.
Gregg, M. C., and L. J. Pratt, 2010: Flow and hydraulics near the sill
of Hood Canal, a strongly sheared, continuously stratified
fjord. J. Phys. Oceanogr., 40, 1087–1105.
Griffin, D. A., and P. H. LeBlond, 1990: Estuary/ocean exchange
controlled by spring-neap tidal mixing. Estuarine Coastal Shelf
Sci., 30, 275–297.
Haney, R. L., 1991: On the pressure gradient force over steep to-
pography in sigma coordinate ocean models. J. Phys. Oceano-
gr., 21, 610–619.
Hansen, D. V., and M. Rattray, 1965: Gravitational circulation in
straits and estuaries. J. Mar. Res., 23, 104–122.
Haugerud, R. A., 2000: Digital elevation model (DEM) of Casca-
dia, latitude 39N–53N, longitude 116W–133W. U.S. Geo-
logical Survey Report. [Available online at http://geopubs.wr.
usgs.gov/open-file/of99-369/.]
Hickey, B., R. McCabe, S. Geier, E. Dever, and N. Kachel, 2009:
Three interacting freshwater plumes in the northern California
Current System. J. Geophys. Res., 114, C00B03, doi:10.1029/
2008JC004907.
——, and Coauthors, 2010: River influences on shelf ecosystems:
Introduction and synthesis. J. Geophys. Res., 115, C00B17,
doi:10.1029/2009JC005452.
Labrecque, M. A., R. E. Thomson, M. Stacey, and J. Buckley, 1994:
Residual currents in Juan de Fuca Strait. Atmos.–Ocean, 37, 1–19.
Lavelle, J. W., H. O. Mojfield, E. Lempriere-Doggett, G. A. Cannon,
D. J. Pashinski, E. D. Cokelet, L. Lytle, and S. Gill, 1988: A
multiple connected channel model of tides and tidal currents in
Puget Sound, Washington, and a comparison with updated
observations. NOAA Tech. Memo. ERL PMEL-84, 108 pp.
Lerczak, J. A., W. R. Geyer, and R. J. Chant, 2006: Mechanisms
driving the time-dependent salt flux in a partially stratified
estuary. J. Phys. Oceanogr., 36, 2296–2311.
Liu, Y., P. MacCready, and B. M. Hickey, 2009a: Columbia River
plume patterns in summer 2004 as revealed by a hindcast coastal
ocean circulation model. Geophys. Res. Lett., 36, L02601,
doi:10.1029/2008GL036447.
——, ——, ——, E. P. Dever, P. M. Kosro, and N. S. Banas, 2009b:
Evaluation of coastal ocean circulation model for the Co-
lumbia River plume in summer 2004. J. Geophys. Res., 114,
C00B04, doi:10.1029/2008JC004929.
MacCready, P., 2011: Calculating estuarine exchange flow using
isohaline coordinates. J. Phys. Oceanogr., 41, 1116–1124.
——, and W. R. Geyer, 2010: Advances in estuarine physics. Annu.
Rev. Mar. Sci., 2, 35–58.
——, N. S. Banas, B. M. Hickey, E. P. Dever, and Y. Liu, 2009: A
model study of tide- and wind-induced mixing in the Columbia
River estuary and plume. Cont. Shelf Res., 29, 278–291.
MacDonald, D. G., 2006: Estimating an estuarine mixing and ex-
change ratio from boundary data with application to Mt. Hope
Bay (Massachusetts/Rhode Island). Estuarine Coastal Shelf
Sci., 70, 326–332.
Mass, C. F., and Coauthors, 2003: Regional environmental pre-
diction over the Pacific Northwest. Bull. Amer. Meteor. Soc.,
84, 1353–1366.
1142 J O U R N A L O F P H Y S I C A L O C E A N O G R A P H Y VOLUME 41

Masson, D., and P. F. Cummins, 2000: Fortnightly modulation of
the estuarine circulation in Juan de Fuca Strait. J. Mar. Res.,
58, 439–463.
McCabe, R., P. MacCready, and G. Pawlak, 2006: Form drag due to
flow separation at a headland. J. Phys. Oceanogr., 36, 2136–
2152.
Mojfeld, H. O., and L. H. Larsen, 1984: Tides and tidal currents of
the inland waters of western Washington. NOAA/Pacific Ma-
rine Environmental Laboratory Tech. Memo. ERL PMEL-56,
64 pp.
Moore, S. K., N. J. Mantua, J. P. Kellogg, and J. A. Newton, 2008:
Local and large-scale climate forcing of Puget Sound ocean-
ographic properties on seasonal to interdecadal timescales.
Limnol. Oceanogr., 53, 1746–1758.
Murphy, A. H., 1988: Skill scores based on the mean square error
and their relationships to the correlation coefficient. Mon.
Wea. Rev., 116, 2417–2424.
Newton, J., C. Bassin, A. Devol, M. Kawase, W. Ruef, M. Warner,
D. Hannafious, R. Rose, 2007: Hypoxia in Hood Canal: An
overview of status and contributing factors. Proc. Puget Sound
Georgia Basin Research Conf., Vancouver, BC, Canada, Puget
Sound Partnership, 9A.
Oke, P. R., and Coauthors, 2002: A modeling study of the three-
dimensional continental shelf circulation off Oregon. Part I:
Model–data comparisons. J. Phys. Oceanogr., 32, 1360–
1382.
Pawlowicz, R., R. Beardsley, and S. Lentz, 2002: Classical tidal
harmonic analysis including error estimates in MATLAB us-
ing T_TIDE. Comput. Geosci., 28, 929–937.
Ralston, D. K., W. R. Geyer, and J. A. Lerczak, 2010: Structure,
variability, and salt flux in a strongly forced salt wedge estuary.
J. Geophys. Res., 115, C06005, doi:10.1029/2009JC005806.
Seim, H. E., and M. C. Gregg, 1997: The importance of aspiration
and channel curvature in producing strong vertical mixing
over a sill. J. Geophys. Res., 102, 3451–3472.
Smith, W. H. F., and D. T. Sandwell, 1997: Global seafloor to-
pography from satellite altimetry and ship depth soundings.
Science, 277, 1957–1962.
Thomson, R. E., S. F. Mihaly, and E. A. Kulikov, 2007: Estuarine
versus transient flow regimes in Juan de Fuca Strait. J. Geo-
phys. Res., 112, 09022, doi:10.1029/2006JC003925.
Tinis, S. W., R. E. Thomson, C. F. Mass, and B. M. Hickey, 2006:
Comparison of MM5 and meteorological buoy winds from British
Columbia to northern California. Atmos.–Ocean, 44, 65–81.
Umlauf, L., and H. Burchard, 2003: A generic length-scale equation
for geophysical turbulence models. J. Mar. Res., 61, 235–265.
Warner, J. C., W. R. Geyer, and J. A. Lerczak, 2005: Numerical
modeling of an estuary: A comprehensive skill assessment.
J. Geophys. Res., 110, C05001, doi:10.1029/2004JC002691.
——, ——, and H. G. Arango, 2010: Using a composite grid ap-
proach in a complex coastal domain to estimate estuarine
residence time. Comput. Geosci., 36, 921–935, doi:10.1016/
j.cageo.2009.11.008.
Wilkin, J. L., 2006: The summertime heat budget and circulation of
southeast New England shelf waters. J. Phys. Oceanogr., 36,1997–2011.
Willmott, C. J., 1981: On the validation of models. Phys. Geogr., 2,
184–194.
Yang, Z., and T. Khangaonkar, 2008: Modeling tidal circulation
and stratification in Skagit River estuary using an unstructured
grid ocean model. Ocean Modell., 28, 34–49, doi:10.1016/
j.ocemod.2008.07.004.
Zhang, W. G., J. L. Wilkin, and R. J. Chant, 2009: Modeling the
pathways and mean dynamics of river plume dispersal in the
New York Bight. J. Phys. Oceanogr., 39, 1167–1183.
JUNE 2011 S U T H E R L A N D E T A L . 1143
Related Documents