Research Article - doi: 10.3832/ifor0931-008 © iForest – Biogeosciences and Forestry Introduction During the last decades, significant land use change took place in Portugal and else- where in the Mediterranean region. Many marginal agricultural or grazing lands were either abandoned or afforested. Natural suc- cession led to changes in vegetation structu- re and composition where agricultural activi- ties ceased, thus contributing to the expan- sion of shrubland, woodland and forests with a well-developed shrub understory (Fernán- dez Alés et al. 1992). These changes resulted in higher carbon stocks as well as in more flammable ecosystems prone to large and high-severity fires (Pausas 2004, Castro & Freitas 2009). Fuel dynamics refers to the structural and temporal modifications undergone by a fuel layer or fuel complex. Shrub accumulation models could assist in forecasting the dyna- mics of biomass and carbon storage. Many modeling of fuel dynamics follows the sim- ple model by Olson (1963) that describes the relationship between production and decom- position as a modified exponential function that flattens out to a plateau. Other studies describe fuel and shrub dynamics by time- dependent models of forest fire hazard (Gould et al. 2011). However, shrub biomass accumulation information for Mediterranean areas is very limited. Few studies addressed the temporal dynamics of shrub structure and/or biomass in shrublands (Baeza et al. 2006), which are expected to be different un- der a forest canopy, due to competition for resources (i.e., light, water). Hence, little at- tention has been given to understory vegeta- tion, likely due to its limited economic im- portance. Nonetheless, the ecological signifi- cance of the understory is high, since it plays an important role on nutrient cycles, carbon storage and fire hazard. Currently available carbon models still lack details on biomass dynamics, which in turn affect the calculation of these processes. A recent study by Rosa et al. (2011) to estimate pyrogenic emissions of greenhouse gases, aerosols and other trace gases from wildfires in Portugal identified shrub biomass as the variable with the greatest impact on the un- certainty inherent in such estimates. There- fore, it is essential to improve the assessment of forest biomass, including its spatial and temporal variation. In the Mediterranean region, fire is one of the most important factors affecting forest ecosystems, both ecologically and economi- cally (Pereira & Santos 2003). Higher shrub loading implies higher flammability, likeli- hood of crowning fire, and difficulty in fire control (Schmidt et al. 2002, Fernandes 2009a). Fernandes et al. (2004) observed dif- ferences in fire behavior and severity among maritime pine (Pinus pinaster) plots depen- ding on fuel age ( i.e., time since last treat- ment) and the presence or absence of surface fuel treatments. Furthermore, recent research aimed at developing wildfire occurrence models in Portugal included the understory shrubs biomass as a significant variable. In- deed, shrubs have a large impact on fire risk with obvious implications to forest planning (Garcia-Gonzalo et al. 2011, 2012, Marques et al. 2012, Botequim et al. 2013). The integration of wildfire risk in forest management planning depends on the con- tinuously changing variables related with fuel dynamics (e.g., tree and shrub growth) and stand management (González et al. 2006, Garcia-Gonzalo et al. 2014). There- fore, it is very important to obtain informa- tion as much accurate as possible on all key variables (e.g., shrub growth) affecting the likelihood and severity of fire over time. The lack of tools to project shrub growth over time has hindered its inclusion in the forest management planning (Garcia-Gonzalo et al. 2014). A broad range of growth modeling tech- niques applied to forest ecosystems has been reported in the scientific literature. However, © SISEF http://www.sisef.it/iforest/ e1 iForest (early view): e1-e12 (1) Universidade de Lisboa, Instituto Superior de Agronomia, Centro de Estudos Florestais, Tapada da Ajuda, 1349-017 Lisboa (Portugal); (2) University of Eastern Finland, School of Forest Sciences, Faculty of Science and Forestry, Joensuu (Finland); (3) Centre for the Research and Technology of Agro-Environmental and Biological Sciences (CITAB), University of Trás-os-Montes e Alto Douro, Quinta de Prados, 5001-801 Vila Real (Portugal) @ Brigite Botequim ([email protected]) Received: Dec 14, 2012 - Accepted: Apr 15, 2014 Citation: Botequim B, Zubizarreta-Gerendiain A, Garcia-Gonzalo J, Silva A, Marques S, Fernandes PM, Pereira JMC, Tomé M, 2014. A model of shrub biomass accumulation as a tool to support management of Portuguese forests. iForest (early view): e1-e12 [online 2014-07- 27] URL: http://www.sisef.it/iforest/contents/?id=ifor0931-008 Communicated by: Giorgio Matteucci A model of shrub biomass accumulation as a tool to support management of Portuguese forests Brigite Botequim (1) , Ane Zubizarreta-Gerendiain (1-2) , Jordi Garcia- Gonzalo (1) , Andreia Silva (1) , Susete Marques (1) , Paulo M Fernandes (3) , José MC Pereira (1) , Margarida Tomé (1) Assessment of forest fuel loading is a prerequisite for most fire management activities. However, the inclusion of shrub biomass in forest planning has been hindered by the inability to predict its growth and accumulation. The main ob- jective of this study was to model shrub biomass over time under a tree canopy with the aim of including shrub management in fire risk mitigation plans. To this purpose, data was obtained from the 4 th and 5 th Portuguese National Forest Inventories. Five biologically realistic models were built to describe shrub biomass accumulation in Portuguese forests. The selected model indicates that maximum biomass is affected by stand basal area and the percentage of re- sprouting shrub species in the stand. Biomass growth rate was clearly affected by the regeneration strategies of shrubs in combination with climatic condi- tions (mean annual temperature). The model can be used in the accumulation form for initialization purposes or in one of the two alternative difference forms to project observed shrub biomass. The model proposed in this study fa- cilitates the inclusion of shrub biomass in forest growth simulations, and will contribute to more accurate estimates of fire behavior characteristics and stored carbon. This is essential to improve decision-making in forest manage- ment plans that integrate fire risk, namely to schedule understory fuel treat- ments. Keywords: Shrub Growth, Understory Vegetation, Wildfire Risk, Fire Manage- ment, Forest Planning, Decision Making

Welcome message from author
This document is posted to help you gain knowledge. Please leave a comment to let me know what you think about it! Share it to your friends and learn new things together.
Transcript
Research Article - doi: 10.3832/ifor0931-008 ©iForest – Biogeosciences and Forestry
IntroductionDuring the last decades, significant land
use change took place in Portugal and else-where in the Mediterranean region. Manymarginal agricultural or grazing lands wereeither abandoned or afforested. Natural suc-cession led to changes in vegetation structu-re and composition where agricultural activi-ties ceased, thus contributing to the expan-sion of shrubland, woodland and forests witha well-developed shrub understory (Fernán-dez Alés et al. 1992). These changes resultedin higher carbon stocks as well as in more
flammable ecosystems prone to large andhigh-severity fires (Pausas 2004, Castro &Freitas 2009).
Fuel dynamics refers to the structural andtemporal modifications undergone by a fuellayer or fuel complex. Shrub accumulationmodels could assist in forecasting the dyna-mics of biomass and carbon storage. Manymodeling of fuel dynamics follows the sim-ple model by Olson (1963) that describes therelationship between production and decom-position as a modified exponential functionthat flattens out to a plateau. Other studies
describe fuel and shrub dynamics by time-dependent models of forest fire hazard(Gould et al. 2011). However, shrub biomassaccumulation information for Mediterraneanareas is very limited. Few studies addressedthe temporal dynamics of shrub structureand/or biomass in shrublands (Baeza et al.2006), which are expected to be different un-der a forest canopy, due to competition forresources (i.e., light, water). Hence, little at-tention has been given to understory vegeta-tion, likely due to its limited economic im-portance. Nonetheless, the ecological signifi-cance of the understory is high, since it playsan important role on nutrient cycles, carbonstorage and fire hazard.
Currently available carbon models still lackdetails on biomass dynamics, which in turnaffect the calculation of these processes. Arecent study by Rosa et al. (2011) to estimatepyrogenic emissions of greenhouse gases,aerosols and other trace gases from wildfiresin Portugal identified shrub biomass as thevariable with the greatest impact on the un-certainty inherent in such estimates. There-fore, it is essential to improve the assessmentof forest biomass, including its spatial andtemporal variation.
In the Mediterranean region, fire is one ofthe most important factors affecting forestecosystems, both ecologically and economi-cally (Pereira & Santos 2003). Higher shrubloading implies higher flammability, likeli-hood of crowning fire, and difficulty in firecontrol (Schmidt et al. 2002, Fernandes2009a). Fernandes et al. (2004) observed dif-ferences in fire behavior and severity amongmaritime pine (Pinus pinaster) plots depen-ding on fuel age (i.e., time since last treat-ment) and the presence or absence of surfacefuel treatments. Furthermore, recent researchaimed at developing wildfire occurrencemodels in Portugal included the understoryshrubs biomass as a significant variable. In-deed, shrubs have a large impact on fire riskwith obvious implications to forest planning(Garcia-Gonzalo et al. 2011, 2012, Marqueset al. 2012, Botequim et al. 2013).
The integration of wildfire risk in forestmanagement planning depends on the con-tinuously changing variables related withfuel dynamics (e.g., tree and shrub growth)and stand management (González et al.2006, Garcia-Gonzalo et al. 2014). There-fore, it is very important to obtain informa-tion as much accurate as possible on all keyvariables (e.g., shrub growth) affecting thelikelihood and severity of fire over time. Thelack of tools to project shrub growth overtime has hindered its inclusion in the forestmanagement planning (Garcia-Gonzalo et al.2014).
A broad range of growth modeling tech-niques applied to forest ecosystems has beenreported in the scientific literature. However,
© SISEF http://www.sisef.it/iforest/ e1 iForest (early view): e1-e12
(1) Universidade de Lisboa, Instituto Superior de Agronomia, Centro de Estudos Florestais, Tapada da Ajuda, 1349-017 Lisboa (Portugal); (2) University of Eastern Finland, School of Forest Sciences, Faculty of Science and Forestry, Joensuu (Finland); (3) Centre for the Research and Technology of Agro-Environmental and Biological Sciences (CITAB), University of Trás-os-Montes e Alto Douro, Quinta de Prados, 5001-801 Vila Real (Portugal)
@@ Brigite Botequim ([email protected])
Received: Dec 14, 2012 - Accepted: Apr 15, 2014
Citation: Botequim B, Zubizarreta-Gerendiain A, Garcia-Gonzalo J, Silva A, Marques S, Fernandes PM, Pereira JMC, Tomé M, 2014. A model of shrub biomass accumulation as a tool to support management of Portuguese forests. iForest (early view): e1-e12 [online 2014-07-27] URL: http://www.sisef.it/iforest/contents/?id=ifor0931-008
Communicated by: Giorgio Matteucci
A model of shrub biomass accumulation as a tool to support management of Portuguese forests
Brigite Botequim (1), Ane Zubizarreta-Gerendiain (1-2), Jordi Garcia-Gonzalo (1), Andreia Silva (1), Susete Marques (1), Paulo M Fernandes (3), José MC Pereira (1), Margarida Tomé (1)
Assessment of forest fuel loading is a prerequisite for most fire managementactivities. However, the inclusion of shrub biomass in forest planning has beenhindered by the inability to predict its growth and accumulation. The main ob-jective of this study was to model shrub biomass over time under a tree canopywith the aim of including shrub management in fire risk mitigation plans. Tothis purpose, data was obtained from the 4th and 5th Portuguese National ForestInventories. Five biologically realistic models were built to describe shrubbiomass accumulation in Portuguese forests. The selected model indicates thatmaximum biomass is affected by stand basal area and the percentage of re-sprouting shrub species in the stand. Biomass growth rate was clearly affectedby the regeneration strategies of shrubs in combination with climatic condi-tions (mean annual temperature). The model can be used in the accumulationform for initialization purposes or in one of the two alternative differenceforms to project observed shrub biomass. The model proposed in this study fa-cilitates the inclusion of shrub biomass in forest growth simulations, and willcontribute to more accurate estimates of fire behavior characteristics andstored carbon. This is essential to improve decision-making in forest manage-ment plans that integrate fire risk, namely to schedule understory fuel treat-ments.
Keywords: Shrub Growth, Understory Vegetation, Wildfire Risk, Fire Manage-ment, Forest Planning, Decision Making
Botequim B et al. - iForest (early view): e1-e12
biomass growth and yield information of un-derstory is scarce. The usefulness of shrubbiomass models in forest planning dependson the input information they need and whe-ther the future values of predictors can be es-timated with reasonable accuracy. Moreover,an increasing amount of information is beingcollected in forest inventories focused onsustainability and biodiversity. For example,the Portuguese National Forest Inventory(NFI) systematically collects plot-level infor-mation on the shrubs type (i.e., species andregeneration mechanism), their ground coverand mean height. This information may beused to develop a shrub biomass build-upmodel, which would contribute to more ac-curate estimates of fire behavior and mayquantify the impact of silvicultural treat-ments on the probability of wildfire occur-rence. It can also improve decision-makingin forest management, especially taking intoaccount the risk of forest fires (Ferreira et al.2012, 2014).
The aim of this study is to develop a modelto describe the temporal dynamics of shrubbiomass in the forest understory of Portu-guese forests. One hypothesis is that maxi-mum potential biomass, defined by the mo-del asymptote, is affected by stand variables(e.g., basal area) and shrub regeneration ty-pes (resprouter vs. non-resprouter). Consi-dering the biomass growth rate, our hypothe-sis is that it is affected by stand and shrub
characteristics, as well as by site conditionsand climate. This model may then be used topredict fuel accumulation as well as to up-date carbon stock inventories and may alsobe instrumental to include that informationin forest management systems aiming at re-ducing the risk of fire.
Material and Methods
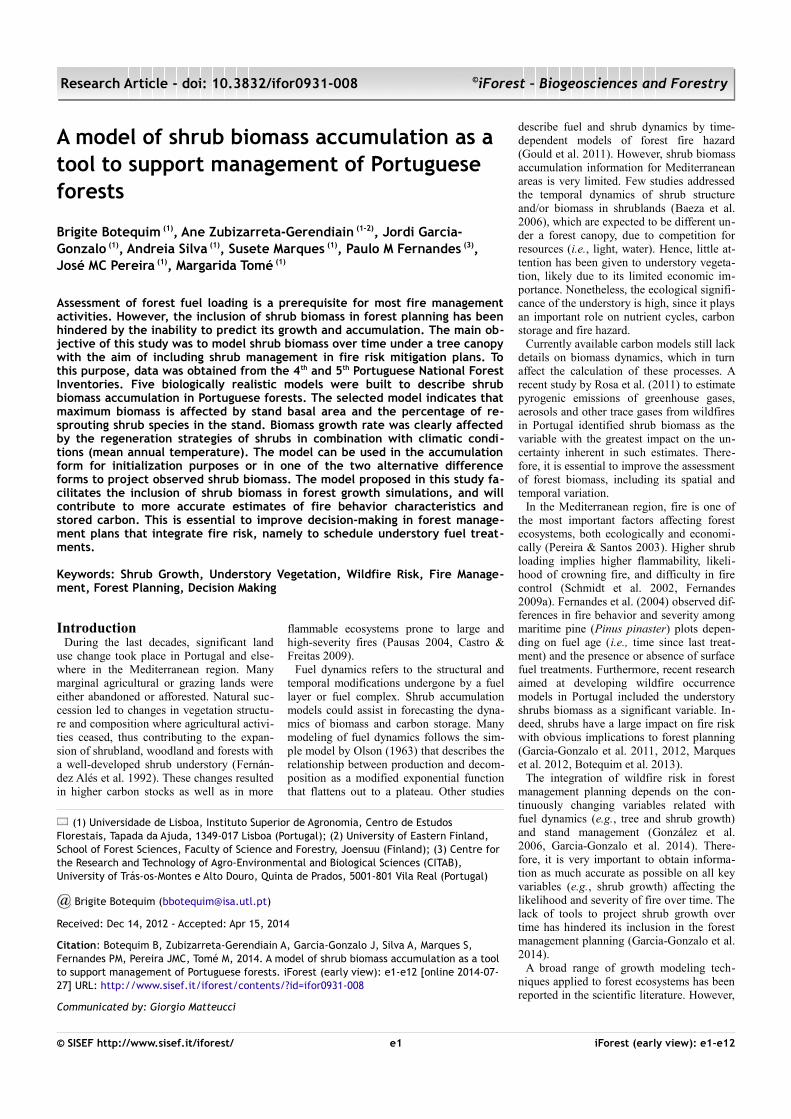
Study areaMainland Portugal (Fig. 1) is located in
southwester Europe at latitudes of 37° N to42° N and longitudes of 6° W to 10° W. Cli-mate is warm and dry during summer, andcool and wet in winter (Joffre & Rambal2002). Mean annual temperature and preci-pitation follow a gradient of increasing tem-perature and decreasing rainfall from north-west to southeast. Topography is rugged, es-pecially in the northern half of the country,and most wild-land vegetation is evergreen,drought resistant and highly flammable.Forests and woodlands are a key element inthe Portuguese landscape, covering morethan one third of the country (DGRF 2006).
The variables considered for the develop-ment of a shrub build-up model were dividedinto three main groups: (i) variables relatedto shrub properties, (ii) stand characteristics,and (iii) environmental factors, i.e., stand lo-cation and climate (Tab. 1). Most data wereobtained from the Portuguese National For-
est Inventories (NFI) carried out over thewhole country within two different and dis-continuous periods (1995-1998 and 2005-2006), corresponding to the 4th and 5th NFIs,respectively. The NFI measurements werebased on two different square grids of a sys-tematic sample of temporary circular plots(measured only once). The number of mea-sured plots varies across inventories, totaling2336 plots for the 4th NFI and 12258 plots(with 5267 plots of forest stands) for the 5th
NFI.The variable shrub age equals the elapsed
time (years) since the last fire (TSF) or sincethe stand establishment on the inventorydate. To this purpose, the NFI plots and theForest Service digital fire atlas (burned areas≥ 5 ha) obtained by semi-automated classifi-cation of high-resolution remote sensing datawere compared using the software packageArcGIS®. A total of 722 burnt plots wereidentified, ranging in TSF from 1 to 31years. However, not all plots were includedin the analysis. Shrub age could not exceedstand age since tree planting implies shrubclearing. Therefore, plots corresponding toshrub ages above 15 years were discarded, todecrease the uncertainty on the timing of sil-vicultural and fuel treatments that disturb theshrub layer. Indeed, it is difficult to find fo-rest plots with shrubs formations older than15 years with good accuracy. Overall, a totalof 420 plots were finally selected for furthermodeling purposes (Fig. 1).
The main criteria used for plot selectionwere the availability of tree biometric mea-surements and understory biomass data, in-cluding information on the date of the mostrecent disturbance (clear, planting, fire orharvesting). Direct biomass measurement islaborious and time-consuming, thus shrubbiomass is usually estimated non-destruc-tively from the respective phytovolume andbulk density. Both NFI’s field plots providedata on understory shrub species composi-tion, percent cover, and mean height, whichwere used to estimate shrub biomass. Shrubphytovolume (m3 ha-1) per species was calcu-lated as the product of shrub height (h, m)and ground cover (m2 ha-1), and combinedwith species-specific bulk density to obtainthe biomass yield of the understory shrubfuel loading (Mg ha-1). Bulk density (kg m-3)is defined as the fuel load (dry weight) perunit volume of vegetation (Brown 1971) andwas obtained from a literature review (Ap-pendix 1).
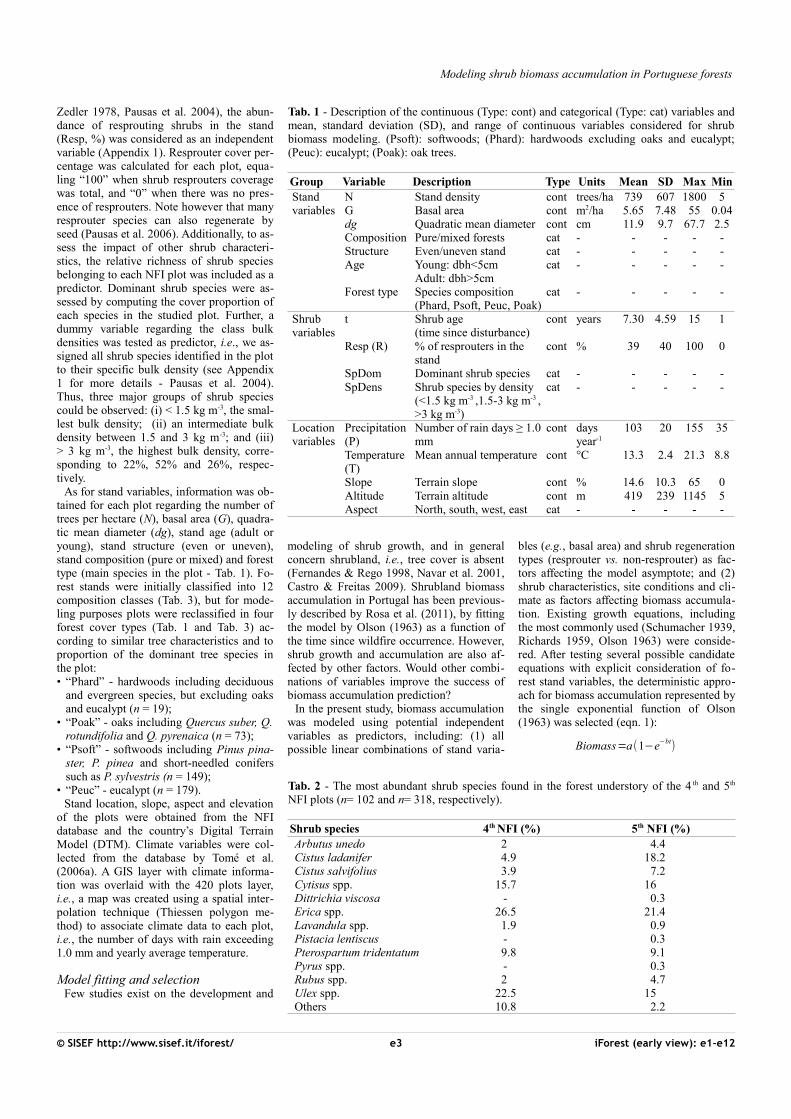
A total of 23 shrub types (defined at thespecies or genus level) were detected in theNFI plots. The most abundant understoryshrub species in the selected plots were Eri-ca spp. (26%), Ulex spp. (17%), Cytisus spp.(16%), and Cistus ladanifer (15% - Tab. 2).Since the resprouting ability is a relevanttrait affecting the rate of biomass re-accumu-lation in fire-prone environments (Keeley &
iForest (early view): e1-e12 e2 © SISEF http://www.sisef.it/iforest/
Fig. 1 - NationalForest Inventory(NFI) plots usedin the study. NFI
1995-1998(n=102): black
circles; NFI2005-2006
(n=318): greycircles.
Modeling shrub biomass accumulation in Portuguese forests
Zedler 1978, Pausas et al. 2004), the abun-dance of resprouting shrubs in the stand(Resp, %) was considered as an independentvariable (Appendix 1). Resprouter cover per-centage was calculated for each plot, equa-ling “100” when shrub resprouters coveragewas total, and “0” when there was no pres-ence of resprouters. Note however that manyresprouter species can also regenerate byseed (Pausas et al. 2006). Additionally, to as-sess the impact of other shrub characteri-stics, the relative richness of shrub speciesbelonging to each NFI plot was included as apredictor. Dominant shrub species were as-sessed by computing the cover proportion ofeach species in the studied plot. Further, adummy variable regarding the class bulkdensities was tested as predictor, i.e., we as-signed all shrub species identified in the plotto their specific bulk density (see Appendix1 for more details - Pausas et al. 2004).Thus, three major groups of shrub speciescould be observed: (i) < 1.5 kg m-3, the smal-lest bulk density; (ii) an intermediate bulkdensity between 1.5 and 3 kg m-3; and (iii)> 3 kg m-3, the highest bulk density, corre-sponding to 22%, 52% and 26%, respec-tively.
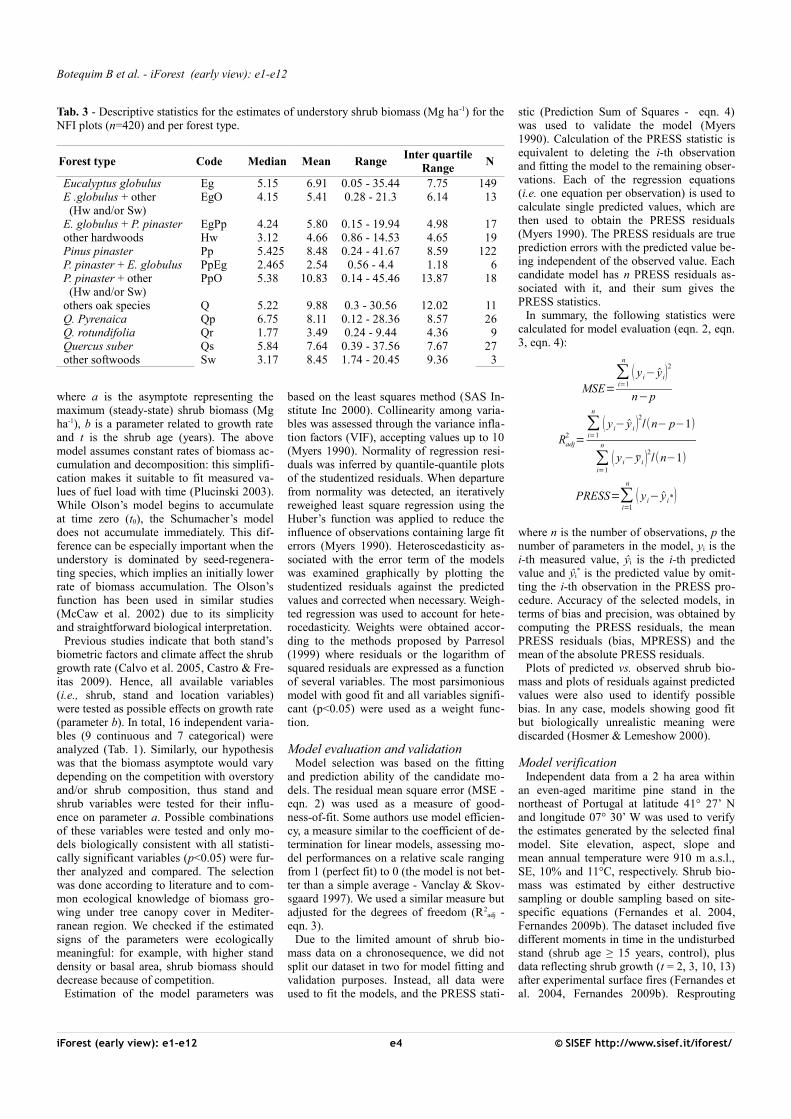
As for stand variables, information was ob-tained for each plot regarding the number oftrees per hectare (N), basal area (G), quadra-tic mean diameter (dg), stand age (adult oryoung), stand structure (even or uneven),stand composition (pure or mixed) and foresttype (main species in the plot - Tab. 1). Fo-rest stands were initially classified into 12composition classes (Tab. 3), but for mode-ling purposes plots were reclassified in fourforest cover types (Tab. 1 and Tab. 3) ac-cording to similar tree characteristics and toproportion of the dominant tree species inthe plot:• “Phard” - hardwoods including deciduous
and evergreen species, but excluding oaksand eucalypt (n = 19);
• “Poak” - oaks including Quercus suber, Q.rotundifolia and Q. pyrenaica (n = 73);
• “Psoft” - softwoods including Pinus pina-ster, P. pinea and short-needled coniferssuch as P. sylvestris (n = 149);
• “Peuc” - eucalypt (n = 179).Stand location, slope, aspect and elevation
of the plots were obtained from the NFIdatabase and the country’s Digital TerrainModel (DTM). Climate variables were col-lected from the database by Tomé et al.(2006a). A GIS layer with climate informa-tion was overlaid with the 420 plots layer,i.e., a map was created using a spatial inter-polation technique (Thiessen polygon me-thod) to associate climate data to each plot,i.e., the number of days with rain exceeding1.0 mm and yearly average temperature.
Model fitting and selectionFew studies exist on the development and
modeling of shrub growth, and in generalconcern shrubland, i.e., tree cover is absent(Fernandes & Rego 1998, Navar et al. 2001,Castro & Freitas 2009). Shrubland biomassaccumulation in Portugal has been previous-ly described by Rosa et al. (2011), by fittingthe model by Olson (1963) as a function ofthe time since wildfire occurrence. However,shrub growth and accumulation are also af-fected by other factors. Would other combi-nations of variables improve the success ofbiomass accumulation prediction?
In the present study, biomass accumulationwas modeled using potential independentvariables as predictors, including: (1) allpossible linear combinations of stand varia-
bles (e.g., basal area) and shrub regenerationtypes (resprouter vs. non-resprouter) as fac-tors affecting the model asymptote; and (2)shrub characteristics, site conditions and cli-mate as factors affecting biomass accumula-tion. Existing growth equations, includingthe most commonly used (Schumacher 1939,Richards 1959, Olson 1963) were conside-red. After testing several possible candidateequations with explicit consideration of fo-rest stand variables, the deterministic appro-ach for biomass accumulation represented bythe single exponential function of Olson(1963) was selected (eqn. 1):
© SISEF http://www.sisef.it/iforest/ e3 iForest (early view): e1-e12
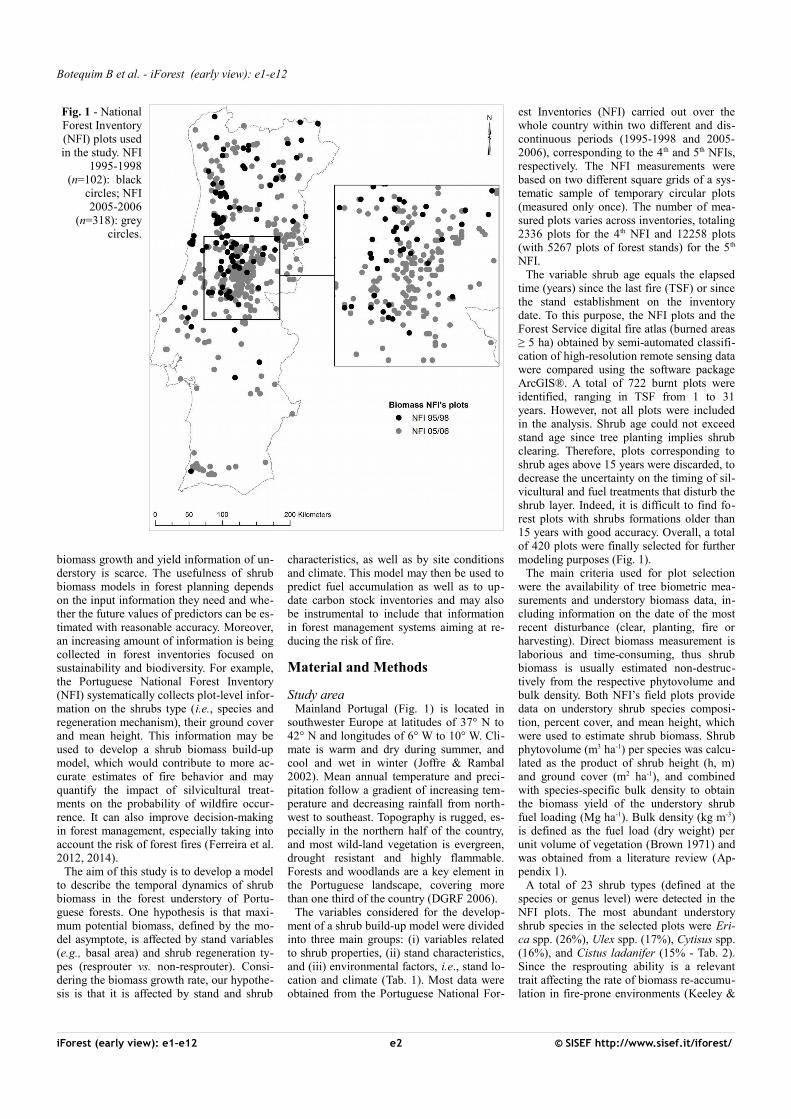
Tab. 1 - Description of the continuous (Type: cont) and categorical (Type: cat) variables andmean, standard deviation (SD), and range of continuous variables considered for shrubbiomass modeling. (Psoft): softwoods; (Phard): hardwoods excluding oaks and eucalypt;(Peuc): eucalypt; (Poak): oak trees.
Group Variable Description Type Units Mean SD Max MinStand variables
N Stand density cont trees/ha 739 607 1800 5G Basal area cont m2/ha 5.65 7.48 55 0.04dg Quadratic mean diameter cont cm 11.9 9.7 67.7 2.5Composition Pure/mixed forests cat - - - - -Structure Even/uneven stand cat - - - - -Age Young: dbh<5cm
Adult: dbh>5cmcat - - - - -
Forest type Species composition (Phard, Psoft, Peuc, Poak)
cat - - - - -
Shrub variables
t Shrub age (time since disturbance)
cont years 7.30 4.59 15 1
Resp (R) % of resprouters in the stand
cont % 39 40 100 0
SpDom Dominant shrub species cat - - - - -SpDens Shrub species by density
(<1.5 kg m-3 ,1.5-3 kg m-3 ,>3 kg m-3)
cat - - - - -
Location variables
Precipitation (P)
Number of rain days ≥ 1.0mm
cont days year-1
103 20 155 35
Temperature (T)
Mean annual temperature cont °C 13.3 2.4 21.3 8.8
Slope Terrain slope cont % 14.6 10.3 65 0Altitude Terrain altitude cont m 419 239 1145 5Aspect North, south, west, east cat - - - - -
Biomass=a(1−e−bt)
Tab. 2 - The most abundant shrub species found in the forest understory of the 4 th and 5th
NFI plots (n= 102 and n= 318, respectively).
Shrub species 4th NFI (%) 5th NFI (%)Arbutus unedo 2 4.4Cistus ladanifer 4.9 18.2Cistus salvifolius 3.9 7.2Cytisus spp. 15.7 16Dittrichia viscosa - 0.3Erica spp. 26.5 21.4Lavandula spp. 1.9 0.9Pistacia lentiscus - 0.3Pterospartum tridentatum 9.8 9.1Pyrus spp. - 0.3Rubus spp. 2 4.7Ulex spp. 22.5 15Others 10.8 2.2
Botequim B et al. - iForest (early view): e1-e12
where a is the asymptote representing themaximum (steady-state) shrub biomass (Mgha-1), b is a parameter related to growth rateand t is the shrub age (years). The abovemodel assumes constant rates of biomass ac-cumulation and decomposition: this simplifi-cation makes it suitable to fit measured va-lues of fuel load with time (Plucinski 2003).While Olson’s model begins to accumulateat time zero (t0), the Schumacher’s modeldoes not accumulate immediately. This dif-ference can be especially important when theunderstory is dominated by seed-regenera-ting species, which implies an initially lowerrate of biomass accumulation. The Olson’sfunction has been used in similar studies(McCaw et al. 2002) due to its simplicityand straightforward biological interpretation.
Previous studies indicate that both stand’sbiometric factors and climate affect the shrubgrowth rate (Calvo et al. 2005, Castro & Fre-itas 2009). Hence, all available variables(i.e., shrub, stand and location variables)were tested as possible effects on growth rate(parameter b). In total, 16 independent varia-bles (9 continuous and 7 categorical) wereanalyzed (Tab. 1). Similarly, our hypothesiswas that the biomass asymptote would varydepending on the competition with overstoryand/or shrub composition, thus stand andshrub variables were tested for their influ-ence on parameter a. Possible combinationsof these variables were tested and only mo-dels biologically consistent with all statisti-cally significant variables (p<0.05) were fur-ther analyzed and compared. The selectionwas done according to literature and to com-mon ecological knowledge of biomass gro-wing under tree canopy cover in Mediter-ranean region. We checked if the estimatedsigns of the parameters were ecologicallymeaningful: for example, with higher standdensity or basal area, shrub biomass shoulddecrease because of competition.
Estimation of the model parameters was
based on the least squares method (SAS In-stitute Inc 2000). Collinearity among varia-bles was assessed through the variance infla-tion factors (VIF), accepting values up to 10(Myers 1990). Normality of regression resi-duals was inferred by quantile-quantile plotsof the studentized residuals. When departurefrom normality was detected, an iterativelyreweighed least square regression using theHuber’s function was applied to reduce theinfluence of observations containing large fiterrors (Myers 1990). Heteroscedasticity as-sociated with the error term of the modelswas examined graphically by plotting thestudentized residuals against the predictedvalues and corrected when necessary. Weigh-ted regression was used to account for hete-rocedasticity. Weights were obtained accor-ding to the methods proposed by Parresol(1999) where residuals or the logarithm ofsquared residuals are expressed as a functionof several variables. The most parsimoniousmodel with good fit and all variables signifi-cant (p<0.05) were used as a weight func-tion.
Model evaluation and validationModel selection was based on the fitting
and prediction ability of the candidate mo-dels. The residual mean square error (MSE -eqn. 2) was used as a measure of good-ness-of-fit. Some authors use model efficien-cy, a measure similar to the coefficient of de-termination for linear models, assessing mo-del performances on a relative scale rangingfrom 1 (perfect fit) to 0 (the model is not bet-ter than a simple average - Vanclay & Skov-sgaard 1997). We used a similar measure butadjusted for the degrees of freedom (R2
adj -eqn. 3).
Due to the limited amount of shrub bio-mass data on a chronosequence, we did notsplit our dataset in two for model fitting andvalidation purposes. Instead, all data wereused to fit the models, and the PRESS stati-
stic (Prediction Sum of Squares - eqn. 4)was used to validate the model (Myers1990). Calculation of the PRESS statistic isequivalent to deleting the i-th observationand fitting the model to the remaining obser-vations. Each of the regression equations(i.e. one equation per observation) is used tocalculate single predicted values, which arethen used to obtain the PRESS residuals(Myers 1990). The PRESS residuals are trueprediction errors with the predicted value be-ing independent of the observed value. Eachcandidate model has n PRESS residuals as-sociated with it, and their sum gives thePRESS statistics.
In summary, the following statistics werecalculated for model evaluation (eqn. 2, eqn.3, eqn. 4):
where n is the number of observations, p thenumber of parameters in the model, yi is thei-th measured value, yi is the i-th predictedvalue and yi
* is the predicted value by omit-ting the i-th observation in the PRESS pro-cedure. Accuracy of the selected models, interms of bias and precision, was obtained bycomputing the PRESS residuals, the meanPRESS residuals (bias, MPRESS) and themean of the absolute PRESS residuals.
Plots of predicted vs. observed shrub bio-mass and plots of residuals against predictedvalues were also used to identify possiblebias. In any case, models showing good fitbut biologically unrealistic meaning werediscarded (Hosmer & Lemeshow 2000).
Model verificationIndependent data from a 2 ha area within
an even-aged maritime pine stand in thenortheast of Portugal at latitude 41° 27’ Nand longitude 07° 30’ W was used to verifythe estimates generated by the selected finalmodel. Site elevation, aspect, slope andmean annual temperature were 910 m a.s.l.,SE, 10% and 11°C, respectively. Shrub bio-mass was estimated by either destructivesampling or double sampling based on site-specific equations (Fernandes et al. 2004,Fernandes 2009b). The dataset included fivedifferent moments in time in the undisturbedstand (shrub age ≥ 15 years, control), plusdata reflecting shrub growth (t = 2, 3, 10, 13)after experimental surface fires (Fernandes etal. 2004, Fernandes 2009b). Resprouting
iForest (early view): e1-e12 e4 © SISEF http://www.sisef.it/iforest/
Tab. 3 - Descriptive statistics for the estimates of understory shrub biomass (Mg ha -1) for theNFI plots (n=420) and per forest type.
Forest type Code Median Mean RangeInter quartile
RangeN
Eucalyptus globulus Eg 5.15 6.91 0.05 - 35.44 7.75 149E .globulus + other (Hw and/or Sw)
EgO 4.15 5.41 0.28 - 21.3 6.14 13
E. globulus + P. pinaster EgPp 4.24 5.80 0.15 - 19.94 4.98 17other hardwoods Hw 3.12 4.66 0.86 - 14.53 4.65 19Pinus pinaster Pp 5.425 8.48 0.24 - 41.67 8.59 122P. pinaster + E. globulus PpEg 2.465 2.54 0.56 - 4.4 1.18 6P. pinaster + other (Hw and/or Sw)
PpO 5.38 10.83 0.14 - 45.46 13.87 18
others oak species Q 5.22 9.88 0.3 - 30.56 12.02 11Q. Pyrenaica Qp 6.75 8.11 0.12 - 28.36 8.57 26Q. rotundifolia Qr 1.77 3.49 0.24 - 9.44 4.36 9Quercus suber Qs 5.84 7.64 0.39 - 37.56 7.67 27other softwoods Sw 3.17 8.45 1.74 - 20.45 9.36 3
MSE=
∑i=1
n
( y i− y i)2
n−p
Radj2
=
∑i=1
n
( y i− y i)2/(n− p−1)
∑i=1
n
( y i− y i )2/(n−1)
PRESS=∑i=1
n
( y i− y i*)
Modeling shrub biomass accumulation in Portuguese forests
ability of the understory shrub communityranged from R = 13% to R= 100%. Detailsof the independent data source are reportedin Tab. 4.
Defining two alternative difference equation forms
A difference equation represents a familyof growth functions with all the parameterscommon except one, the “free” parameter(Tomé et al. 2006b). Growth functions ex-pressed as difference equations are used bymany authors as a very powerful way ofmodeling tree and stand growth (Amaro etal. 1998, Cieszewski & Bailey 2000, Palahíet al. 2004).
Once the best biological and statisticalmodel was chosen, a difference equation wasderived through the guide curve method(Clutter et al. 1983). This method is used togenerate anamorphic equations, which arecommonly used with temporary plot data. Itconsists on the transformation of a singleequation for specific conditions to be rear-ranged to a difference equation where thebiomass at the initial measurement age (t1) istaken as the basis to predict biomass at timet2. The difference equation originates a fami-ly of curves differing by the value of one ofthe parameters which depends on the initialvalue (y1, t1 - Burkhart & Tomé 2012).
Suppose a function yt = ƒ(t, β1, β2). In orderto express such function as a differenceequation, the expression for one of the pa-rameters, say β1, may be obtained as (eqn. 5):
The expression for yt+i can then be derivedas follows (eqn. 6):
In this way, yt+i can be estimated from aninitial value yt. Thus the above equation maybe used to predict the unknown future bio-mass based on an initial known biomassquantity. The use of the difference equation
is illustrated by using a small independentdata set (Tab. 4).
Moreover, a second differential equationform was obtained from the selected finalmodel. This difference equation form wasdeveloped following the methodology pro-posed by Tomé et al. (2006b) to formulategrowth functions as an age-independent dif-ference equation. This conceptual approachcan be used when age data (t1) is not avai-lable. Suppose a function yt = ƒ(t, β1, β2). Inorder to express this function without agebeing explicit, we start by transforming it asfollows (eqn. 7):
Then, yt+i may be derived as (eqn. 8):
The proposed equations have the advantageof allowing direct modeling of yield (instead
of growth) by using data not evenly spacedacross time, as it is the case for most datasets (Tomé et al. 2006b), and therefore itmay be usefully applied for modeling shrubbiomass accumulation in uneven-aged standsof unknown age.
Results
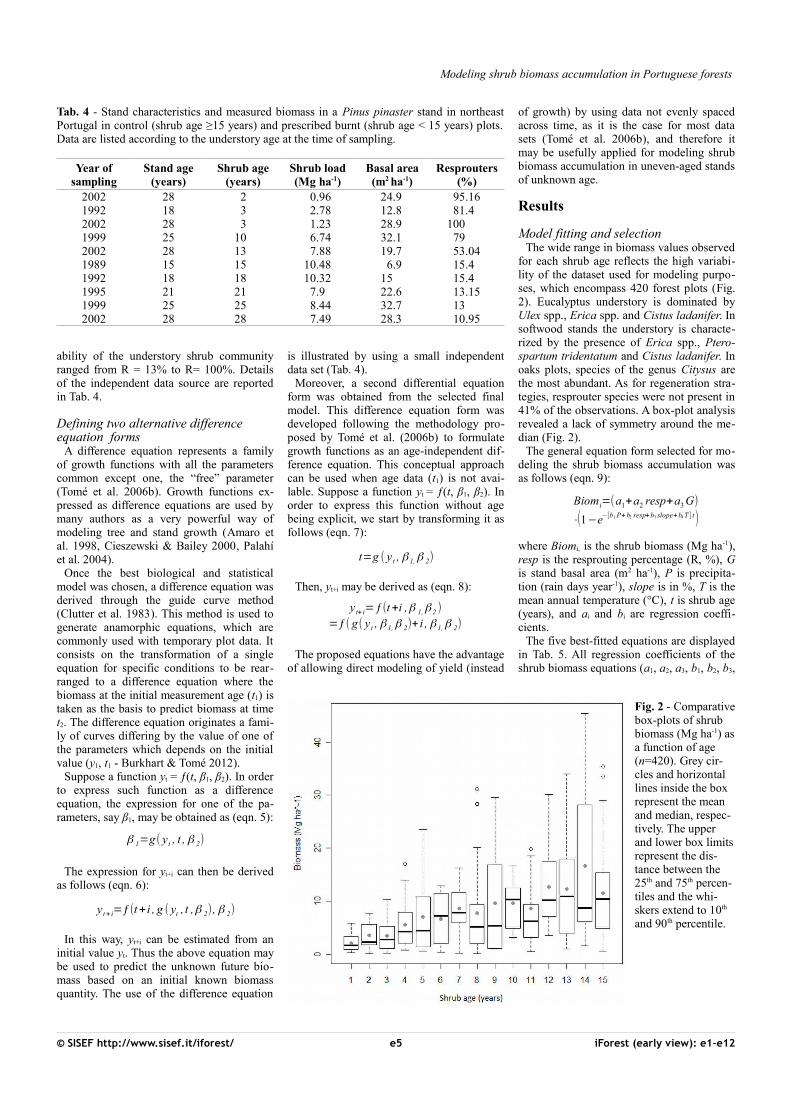
Model fitting and selectionThe wide range in biomass values observed
for each shrub age reflects the high variabi-lity of the dataset used for modeling purpo-ses, which encompass 420 forest plots (Fig.2). Eucalyptus understory is dominated byUlex spp., Erica spp. and Cistus ladanifer. Insoftwood stands the understory is characte-rized by the presence of Erica spp., Ptero-spartum tridentatum and Cistus ladanifer. Inoaks plots, species of the genus Citysus arethe most abundant. As for regeneration stra-tegies, resprouter species were not present in41% of the observations. A box-plot analysisrevealed a lack of symmetry around the me-dian (Fig. 2).
The general equation form selected for mo-deling the shrub biomass accumulation wasas follows (eqn. 9):
where Biomi, is the shrub biomass (Mg ha-1),resp is the resprouting percentage (R, %), Gis stand basal area (m2 ha-1), P is precipita-tion (rain days year-1), slope is in %, T is themean annual temperature (°C), t is shrub age(years), and ai and bi are regression coeffi-cients.
The five best-fitted equations are displayedin Tab. 5. All regression coefficients of theshrub biomass equations (a1, a2, a3, b1, b2, b3,
© SISEF http://www.sisef.it/iforest/ e5 iForest (early view): e1-e12
Fig. 2 - Comparativebox-plots of shrub biomass (Mg ha-1) asa function of age (n=420). Grey cir-cles and horizontal lines inside the box represent the mean and median, respec-tively. The upper and lower box limitsrepresent the dis-tance between the 25th and 75th percen-tiles and the whi-skers extend to 10th and 90th percentile.
β 1=g( y t , t , β 2)
t=g ( y t , β 1,β 2)
y t+ i=ƒ(t+i ,β 1,β 2 )
=ƒ( g( y t , β 1, β 2)+ i , β 1,β 2)
Tab. 4 - Stand characteristics and measured biomass in a Pinus pinaster stand in northeastPortugal in control (shrub age ≥15 years) and prescribed burnt (shrub age < 15 years) plots.Data are listed according to the understory age at the time of sampling.
Year ofsampling
Stand age(years)
Shrub age(years)
Shrub load(Mg ha-1)
Basal area(m2 ha-1)
Resprouters(%)
2002 28 2 0.96 24.9 95.161992 18 3 2.78 12.8 81.42002 28 3 1.23 28.9 1001999 25 10 6.74 32.1 792002 28 13 7.88 19.7 53.041989 15 15 10.48 6.9 15.41992 18 18 10.32 15 15.41995 21 21 7.9 22.6 13.151999 25 25 8.44 32.7 132002 28 28 7.49 28.3 10.95
Biomi=(a1+a2 resp+a3 G)
⋅(1−e−[b1 P+b2 resp+b3 slope+b4 T ] t)
y t+ i=ƒ(t+i , g ( yt , t ,β 2), β 2)
Botequim B et al. - iForest (early view): e1-e12
b4) were significant (p<0.05) and biologi-cally meaningful. Model Biom1 had the bestfit (model efficiency) and the smaller MSE,whereas models Biom4 and Biom5 showedthe lowest R2
adj as well as the highest resi-dual values (Tab. 5).
The maximum biomass accumulation, defi-ned by the model asymptote (ai parameters),is depending on stand variables, shrub rege-neration strategies and the tree cover. Noequation with a fixed asymptote was foundfor which model efficiency was acceptable.For all the five best-fitting equations, standbasal area (G, m2 ha-1) and/or the shrub bio-logical traits affected the asymptote, i.e. theamount of shrub biomass decreased as G andthe percentage of resprouters increased. Ex-cluding G as a predictor and refitting the fivemodels, the corresponding R2
adj and MSE forthe different models were 0.24 and 31.0(Biom1), 0.23 and 32.0 (Biom2), 0.21 and32.4 (Biom3), 0.17 and 35.4 (Biom4) and0.16 and 35.0 (Biom5), respectively. Thus,
the exclusion of G from the models decrea-sed the prediction accuracy (R2
adj) and in-creased the errors (MSE).
Biomass growth rate (bi parameters in eqn.9) is affected by stand and shrub characte-ristics, as well as by topography and climate.Four out of the five selected equations in-cluded the precipitation, while the fifth in-cluded the temperature. As expected, higherprecipitation and/or temperature increase theshrub growth rate, hence reaching the stea-dy-state biomass faster. Prediction ability ofthe equations was considerably improved byincluding the resprouting-related variable.Only model Biom2 included a topographicdescriptor (the slope - Tab. 5). Elevation, as-pect and the forest composition were not sta-tistically significant in any of the model te-sted (p>0.05).
Model validation and biological evaluation
All the five models described are ecologi-
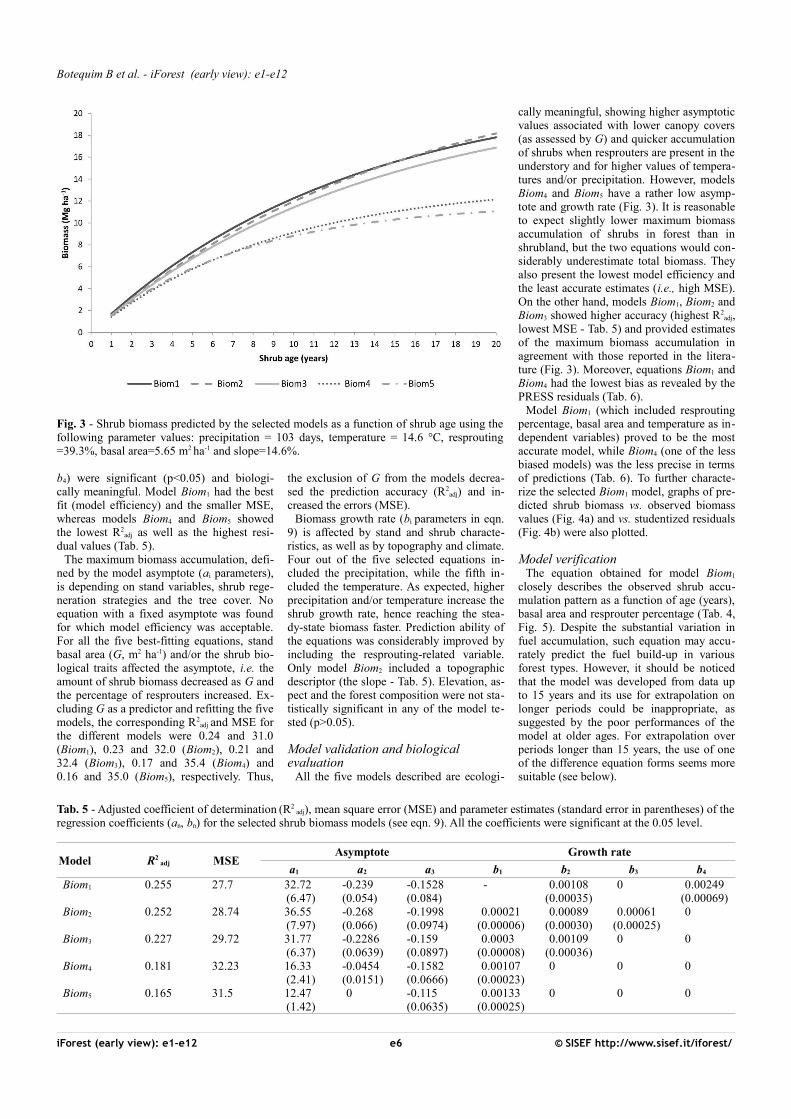
cally meaningful, showing higher asymptoticvalues associated with lower canopy covers(as assessed by G) and quicker accumulationof shrubs when resprouters are present in theunderstory and for higher values of tempera-tures and/or precipitation. However, modelsBiom4 and Biom5 have a rather low asymp-tote and growth rate (Fig. 3). It is reasonableto expect slightly lower maximum biomassaccumulation of shrubs in forest than inshrubland, but the two equations would con-siderably underestimate total biomass. Theyalso present the lowest model efficiency andthe least accurate estimates (i.e., high MSE).On the other hand, models Biom1, Biom2 andBiom3 showed higher accuracy (highest R2
adj,lowest MSE - Tab. 5) and provided estimatesof the maximum biomass accumulation inagreement with those reported in the litera-ture (Fig. 3). Moreover, equations Biom1 andBiom4 had the lowest bias as revealed by thePRESS residuals (Tab. 6).
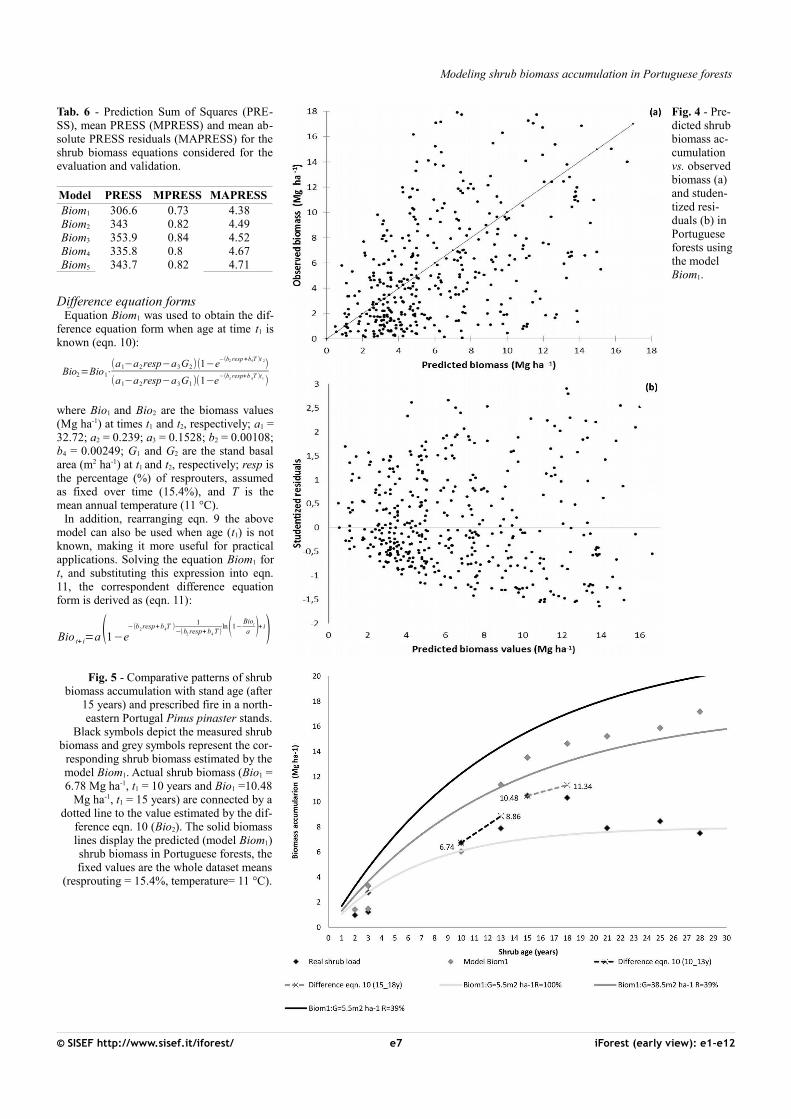
Model Biom1 (which included resproutingpercentage, basal area and temperature as in-dependent variables) proved to be the mostaccurate model, while Biom4 (one of the lessbiased models) was the less precise in termsof predictions (Tab. 6). To further characte-rize the selected Biom1 model, graphs of pre-dicted shrub biomass vs. observed biomassvalues (Fig. 4a) and vs. studentized residuals(Fig. 4b) were also plotted.
Model verificationThe equation obtained for model Biom1
closely describes the observed shrub accu-mulation pattern as a function of age (years),basal area and resprouter percentage (Tab. 4,Fig. 5). Despite the substantial variation infuel accumulation, such equation may accu-rately predict the fuel build-up in variousforest types. However, it should be noticedthat the model was developed from data upto 15 years and its use for extrapolation onlonger periods could be inappropriate, assuggested by the poor performances of themodel at older ages. For extrapolation overperiods longer than 15 years, the use of oneof the difference equation forms seems moresuitable (see below).
iForest (early view): e1-e12 e6 © SISEF http://www.sisef.it/iforest/
Fig. 3 - Shrub biomass predicted by the selected models as a function of shrub age using thefollowing parameter values: precipitation = 103 days, temperature = 14.6 °C, resprouting=39.3%, basal area=5.65 m2 ha-1 and slope=14.6%.
Tab. 5 - Adjusted coefficient of determination (R2 adj), mean square error (MSE) and parameter estimates (standard error in parentheses) of the
regression coefficients (an, bn) for the selected shrub biomass models (see eqn. 9). All the coefficients were significant at the 0.05 level.
Model R2 adj MSE
Asymptote Growth rate
a1 a2 a3 b1 b2 b3 b4
Biom1 0.255 27.7 32.72(6.47)
-0.239(0.054)
-0.1528(0.084)
- 0.00108(0.00035)
0 0.00249(0.00069)
Biom2 0.252 28.74 36.55(7.97)
-0.268(0.066)
-0.1998(0.0974)
0.00021(0.00006)
0.00089(0.00030)
0.00061(0.00025)
0
Biom3 0.227 29.72 31.77(6.37)
-0.2286(0.0639)
-0.159(0.0897)
0.0003(0.00008)
0.00109(0.00036)
0 0
Biom4 0.181 32.23 16.33(2.41)
-0.0454(0.0151)
-0.1582(0.0666)
0.00107(0.00023)
0 0 0
Biom5 0.165 31.5 12.47(1.42)
0 -0.115(0.0635)
0.00133(0.00025)
0 0 0
Modeling shrub biomass accumulation in Portuguese forests
Difference equation formsEquation Biom1 was used to obtain the dif-
ference equation form when age at time t1 isknown (eqn. 10):
where Bio1 and Bio2 are the biomass values(Mg ha-1) at times t1 and t2, respectively; a1 =32.72; a2 = 0.239; a3 = 0.1528; b2 = 0.00108;b4 = 0.00249; G1 and G2 are the stand basalarea (m2 ha-1) at t1 and t2, respectively; resp isthe percentage (%) of resprouters, assumedas fixed over time (15.4%), and T is themean annual temperature (11 °C).
In addition, rearranging eqn. 9 the abovemodel can also be used when age (t1) is notknown, making it more useful for practicalapplications. Solving the equation Biom1 fort, and substituting this expression into eqn.11, the correspondent difference equationform is derived as (eqn. 11):
© SISEF http://www.sisef.it/iforest/ e7 iForest (early view): e1-e12
Fig. 4 - Pre-dicted shrub biomass ac-cumulation vs. observed biomass (a) and studen-tized resi-duals (b) in Portuguese forests usingthe model Biom1.
Fig. 5 - Comparative patterns of shrubbiomass accumulation with stand age (after
15 years) and prescribed fire in a north-eastern Portugal Pinus pinaster stands.
Black symbols depict the measured shrubbiomass and grey symbols represent the cor-
responding shrub biomass estimated by themodel Biom1. Actual shrub biomass (Bio1 =6.78 Mg ha-1, t1 = 10 years and Bio1 =10.48
Mg ha-1, t1 = 15 years) are connected by adotted line to the value estimated by the dif-
ference eqn. 10 (Bio2). The solid biomasslines display the predicted (model Biom1)shrub biomass in Portuguese forests, thefixed values are the whole dataset means
(resprouting = 15.4%, temperature= 11 °C).
Tab. 6 - Prediction Sum of Squares (PRE-SS), mean PRESS (MPRESS) and mean ab-solute PRESS residuals (MAPRESS) for theshrub biomass equations considered for theevaluation and validation.
Model PRESS MPRESS MAPRESSBiom1 306.6 0.73 4.38Biom2 343 0.82 4.49Biom3 353.9 0.84 4.52Biom4 335.8 0.8 4.67Biom5 343.7 0.82 4.71
Bio2=Bio1⋅(a1−a2resp−a3G2)(1−e
−(b2 resp +b4T )t 2)
(a1−a2resp−a3G1)(1−e−(b2 resp+b 4T )t1)
Bio t+ i=a(1−e−(b2 resp+b4T )
1−(b2 resp+b4 T )
ln(1−Biot
a )+ i)
Botequim B et al. - iForest (early view): e1-e12
where Biot and Biot+í are the biomass (Mgha-1) at ages t and t+i, respectively; a =32.72 - 0.239 resp - 0.1528 G; b2 = 0.00108;b4 = 0.00249; i is the projection length; G isthe stand basal area (m2 ha-1) at t; resp is thepercentage (%) of resprouters assumed as in-variable over time, and T is the mean annualtemperature.
Biomass accumulation may vary for severalreasons (e.g., differences in site productivity,fire severity, climate, and competition) andpart of the relevant factors may be unknown.The difference equation (eqn. 10) allows theestimation of future biomass at time t2 whenbiomass at time t1 is known (i.e., informationon the age and the shrub biomass at t1). Fordemonstration purposes, based on the infor-mation displayed in Fig. 5, the actual shrubload from the maritime pine stand chronose-quence was used to estimate the biomassBio2 at time t2, i.e., the initial shrub load(Bio1 =6.74 Mg ha-1 and 10.48 Mg ha-1) attime t1 (10 and 15 years) was taken as the ba-sis to predict biomass Bio2 at time t2 (13 and18 years), with a stand basal area G1 (32.1and 6.9 m2 ha-1) and G2 (19.7 and 15 m2 ha-
1), respectively. For more details, the valuesof parameters describing the Fig. 5 are listedin Tab. 4. The applicability of the eqn. 10 isclearly depicted in Fig. 5 (black dotted linesfor the range t1 = 10 years to t2 = 13 years andgrey dotted lines for the range t1 = 15 yearsto t2 = 18 years). Indeed, the estimated valuesBio2 (8.86 Mg ha-1 and 11.34 Mg ha-1, eqn.10) are similar to the measured biomass(black symbol in Fig. 5). For shrub ages be-low 15 years the predictions of Biom1 model(grey symbol in Fig. 5) closely match the ob-served shrub accumulation. Therefore, eqn.10 predicts quite well future biomass for ac-cumulation periods above 15 years.
If information about initial shrub age (t1) ismissing, the difference equation form (eqn.11) should be used to project the futureshrub biomass, for it does not use age as an
iForest (early view): e1-e12 e8 © SISEF http://www.sisef.it/iforest/
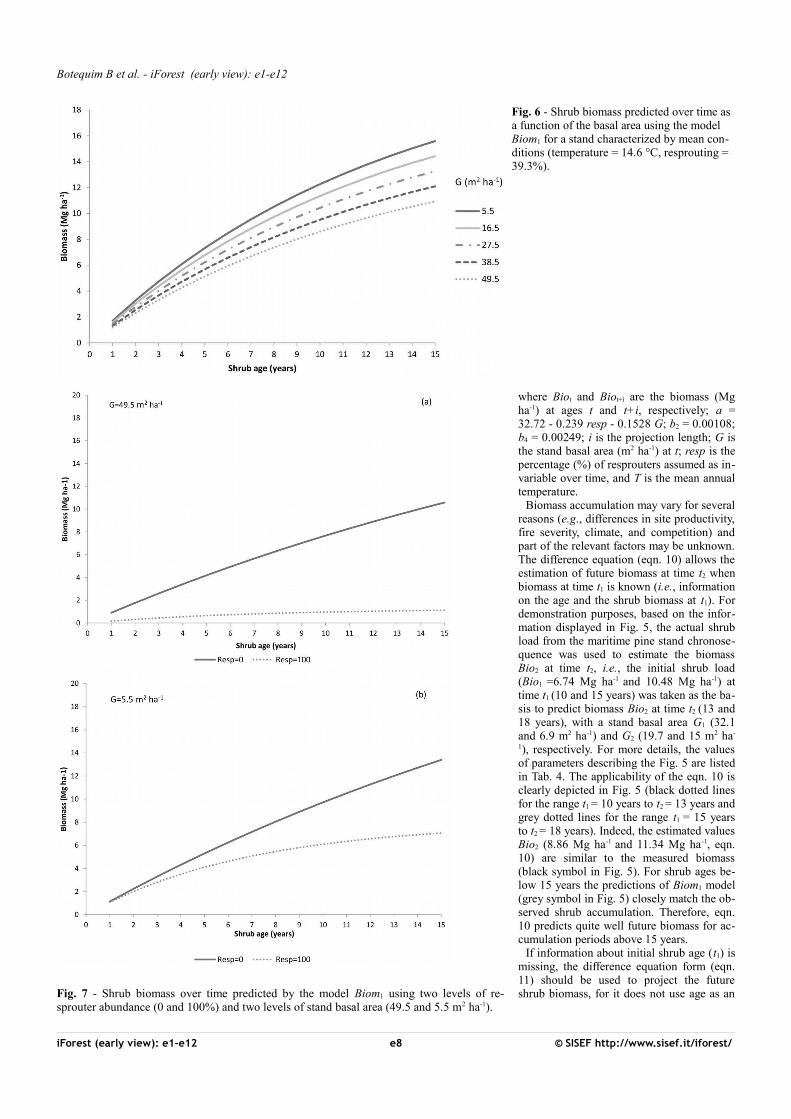
Fig. 6 - Shrub biomass predicted over time as a function of the basal area using the model Biom1 for a stand characterized by mean con-ditions (temperature = 14.6 °C, resprouting = 39.3%).
Fig. 7 - Shrub biomass over time predicted by the model Biom1 using two levels of re-sprouter abundance (0 and 100%) and two levels of stand basal area (49.5 and 5.5 m2 ha-1).
Modeling shrub biomass accumulation in Portuguese forests
explicit variable. In these cases we do not as-sume that the shrubs follow strictly the cur-ves of biomass accumulation prediction (mo-del Biom1) as it may start from a differentlevel of biomass.
Thereby, the use of the difference equationsforms implies one of the following situa-tions: (i) when only one measurement isavailable and age is known at t1, biomass canbe obtained from eqn. 10; (ii) when only onemeasurement is available and age is un-known, with no other additional information,the biomass may be estimated by eqn. 11. Ifno information on shrub load for a specificage is available, the model Biom1 should beused for initialization and prediction of fo-rest shrub accumulation.
Implications for forest management - application examples
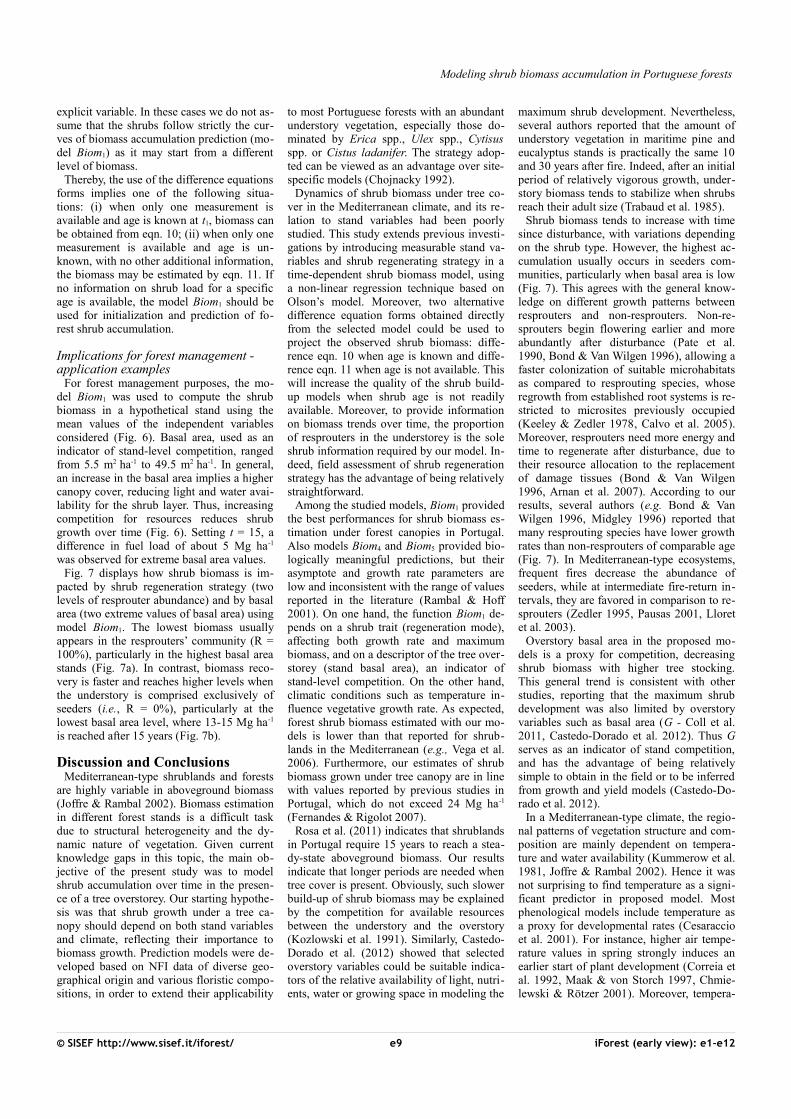
For forest management purposes, the mo-del Biom1 was used to compute the shrubbiomass in a hypothetical stand using themean values of the independent variablesconsidered (Fig. 6). Basal area, used as anindicator of stand-level competition, rangedfrom 5.5 m2 ha-1 to 49.5 m2 ha-1. In general,an increase in the basal area implies a highercanopy cover, reducing light and water avai-lability for the shrub layer. Thus, increasingcompetition for resources reduces shrubgrowth over time (Fig. 6). Setting t = 15, adifference in fuel load of about 5 Mg ha-1
was observed for extreme basal area values.Fig. 7 displays how shrub biomass is im-
pacted by shrub regeneration strategy (twolevels of resprouter abundance) and by basalarea (two extreme values of basal area) usingmodel Biom1. The lowest biomass usuallyappears in the resprouters’ community (R =100%), particularly in the highest basal areastands (Fig. 7a). In contrast, biomass reco-very is faster and reaches higher levels whenthe understory is comprised exclusively ofseeders (i.e., R = 0%), particularly at thelowest basal area level, where 13-15 Mg ha-1
is reached after 15 years (Fig. 7b).
Discussion and ConclusionsMediterranean-type shrublands and forests
are highly variable in aboveground biomass(Joffre & Rambal 2002). Biomass estimationin different forest stands is a difficult taskdue to structural heterogeneity and the dy-namic nature of vegetation. Given currentknowledge gaps in this topic, the main ob-jective of the present study was to modelshrub accumulation over time in the presen-ce of a tree overstorey. Our starting hypothe-sis was that shrub growth under a tree ca-nopy should depend on both stand variablesand climate, reflecting their importance tobiomass growth. Prediction models were de-veloped based on NFI data of diverse geo-graphical origin and various floristic compo-sitions, in order to extend their applicability
to most Portuguese forests with an abundantunderstory vegetation, especially those do-minated by Erica spp., Ulex spp., Cytisusspp. or Cistus ladanifer. The strategy adop-ted can be viewed as an advantage over site-specific models (Chojnacky 1992).
Dynamics of shrub biomass under tree co-ver in the Mediterranean climate, and its re-lation to stand variables had been poorlystudied. This study extends previous investi-gations by introducing measurable stand va-riables and shrub regenerating strategy in atime-dependent shrub biomass model, usinga non-linear regression technique based onOlson’s model. Moreover, two alternativedifference equation forms obtained directlyfrom the selected model could be used toproject the observed shrub biomass: diffe-rence eqn. 10 when age is known and diffe-rence eqn. 11 when age is not available. Thiswill increase the quality of the shrub build-up models when shrub age is not readilyavailable. Moreover, to provide informationon biomass trends over time, the proportionof resprouters in the understorey is the soleshrub information required by our model. In-deed, field assessment of shrub regenerationstrategy has the advantage of being relativelystraightforward.
Among the studied models, Biom1 providedthe best performances for shrub biomass es-timation under forest canopies in Portugal.Also models Biom4 and Biom5 provided bio-logically meaningful predictions, but theirasymptote and growth rate parameters arelow and inconsistent with the range of valuesreported in the literature (Rambal & Hoff2001). On one hand, the function Biom1 de-pends on a shrub trait (regeneration mode),affecting both growth rate and maximumbiomass, and on a descriptor of the tree over-storey (stand basal area), an indicator ofstand-level competition. On the other hand,climatic conditions such as temperature in-fluence vegetative growth rate. As expected,forest shrub biomass estimated with our mo-dels is lower than that reported for shrub-lands in the Mediterranean (e.g., Vega et al.2006). Furthermore, our estimates of shrubbiomass grown under tree canopy are in linewith values reported by previous studies inPortugal, which do not exceed 24 Mg ha-1
(Fernandes & Rigolot 2007).Rosa et al. (2011) indicates that shrublands
in Portugal require 15 years to reach a stea-dy-state aboveground biomass. Our resultsindicate that longer periods are needed whentree cover is present. Obviously, such slowerbuild-up of shrub biomass may be explainedby the competition for available resourcesbetween the understory and the overstory(Kozlowski et al. 1991). Similarly, Castedo-Dorado et al. (2012) showed that selectedoverstory variables could be suitable indica-tors of the relative availability of light, nutri-ents, water or growing space in modeling the
maximum shrub development. Nevertheless,several authors reported that the amount ofunderstory vegetation in maritime pine andeucalyptus stands is practically the same 10and 30 years after fire. Indeed, after an initialperiod of relatively vigorous growth, under-story biomass tends to stabilize when shrubsreach their adult size (Trabaud et al. 1985).
Shrub biomass tends to increase with timesince disturbance, with variations dependingon the shrub type. However, the highest ac-cumulation usually occurs in seeders com-munities, particularly when basal area is low(Fig. 7). This agrees with the general know-ledge on different growth patterns betweenresprouters and non-resprouters. Non-re-sprouters begin flowering earlier and moreabundantly after disturbance (Pate et al.1990, Bond & Van Wilgen 1996), allowing afaster colonization of suitable microhabitatsas compared to resprouting species, whoseregrowth from established root systems is re-stricted to microsites previously occupied(Keeley & Zedler 1978, Calvo et al. 2005).Moreover, resprouters need more energy andtime to regenerate after disturbance, due totheir resource allocation to the replacementof damage tissues (Bond & Van Wilgen1996, Arnan et al. 2007). According to ourresults, several authors (e.g. Bond & VanWilgen 1996, Midgley 1996) reported thatmany resprouting species have lower growthrates than non-resprouters of comparable age(Fig. 7). In Mediterranean-type ecosystems,frequent fires decrease the abundance ofseeders, while at intermediate fire-return in-tervals, they are favored in comparison to re-sprouters (Zedler 1995, Pausas 2001, Lloretet al. 2003).
Overstory basal area in the proposed mo-dels is a proxy for competition, decreasingshrub biomass with higher tree stocking.This general trend is consistent with otherstudies, reporting that the maximum shrubdevelopment was also limited by overstoryvariables such as basal area (G - Coll et al.2011, Castedo-Dorado et al. 2012). Thus Gserves as an indicator of stand competition,and has the advantage of being relativelysimple to obtain in the field or to be inferredfrom growth and yield models (Castedo-Do-rado et al. 2012).
In a Mediterranean-type climate, the regio-nal patterns of vegetation structure and com-position are mainly dependent on tempera-ture and water availability (Kummerow et al.1981, Joffre & Rambal 2002). Hence it wasnot surprising to find temperature as a signi-ficant predictor in proposed model. Mostphenological models include temperature asa proxy for developmental rates (Cesaraccioet al. 2001). For instance, higher air tempe-rature values in spring strongly induces anearlier start of plant development (Correia etal. 1992, Maak & von Storch 1997, Chmie-lewski & Rötzer 2001). Moreover, tempera-
© SISEF http://www.sisef.it/iforest/ e9 iForest (early view): e1-e12
Botequim B et al. - iForest (early view): e1-e12
ture directly affects soil moisture, which isthe main source of water for plant growth(Kummerow et al. 1981).
Forest composition did not contribute toexplain variation in shrub biomass. How-ever, post fire composition, structure andrichness of the whole plant community aredirectly related to the re-establishment of thedominant species in the canopy (Lloret et al.2003, Broncano et al. 2005). Differences inshrub biomass accumulation among the dif-ferent forest types considered in this studywere generally poor; Maritime pine plots at-tained higher values and maximum biomasswas qualitatively similar to other species. Itis important to remark that forest composi-tion in Portugal is strongly determined byhuman action and it is often decoupled fromthe potential vegetation type. The dominantshrub communities generally occur indepen-dently of overstorey composition. Conse-quently, variation in basal area and site qua-lity are likely to overwhelm the influence offorest composition on shrub biomass.
Several limitations of the proposed modelshave also to be highlighted here. The varia-bility of the initial dataset was considerablyhigh, lowering the model efficiency. Varia-tion in shrub species composition, the use ofgeneric bulk densities to estimate biomass,and site-specific factors are certainly in-volved in the modeling performance. Simi-larly, several models with low R2 values (in-dicating that some variation remains unex-plained) were considered useful to supportoptimal forest management decisions, for in-stance, mushrooms yields in pine forestplanning (Bonet et al. 2008, Palahí et al.2009). In any case, we consider this study tobe an important step forward, since similarmodels have seldom been developed for Eu-rope.
Future research would greatly benefit fromthe existence of information from permanentshrub/biomass plots measured over time, inorder to better understand biomass dynamics(e.g., shrub senescence) and carbon seque-stration rates at different spatial scales. Addi-tionally, variables such as soil type and sum-mer water deficit may contribute to improvethe model performances.
The successful management of fuel load infire-prone regions is a challenging task thatcalls for the integration of forest and firemanagement activities in order to decreasefire hazard. Several studies indicate that fueltreatments (i.e., reduction of fuels in forests)change wildfire behavior and severity andenhance the effectiveness of fire suppressionoperations (Mercer et al. 2008). Models suchthose developed in this study have practicalapplications in the assessment of fire hazardand in the definition of general prescriptionsto plan fuel treatments. In fact, such modelsallow to quantify the impact of silvicultureoperations and help to define management
options that may decrease wildfire occur-rence. For instance, a preliminary shrubbuild-up model (Botequim et al. 2009) wasintegrated with a growth and yield model toaccomplish maritime pine stand-level opti-mizations and determine optimal stand-leveltreatments (e.g., thinning, fuel treatment), soas to reduce the hazard of fire (Ferreira et al.2014). This information is very valuable as itmay effectively support the development ofadaptive management strategies (Ferreira etal. 2012, 2014).
Investigations on carbon flux implicationsof fuels reduction treatments are of increa-sing interest (Hurteau & North 2010). Fire-related climate change mitigation options in-clude decreasing emissions through fuel re-duction treatments and using the removedbiomass to replace fossil fuels for energyproduction (Canadell & Raupach 2008, Mal-msheimer et al. 2008). The shrub build-upmodel can be used by forest managers topredict fuel loads in the frame of understoryremoval to decrease fire hazard. It may alsohave practical application for ecologists, al-lowing the estimation of carbon storage inthe understory and the assessment of how fu-ture wildfire emissions will change in re-sponse to fuel treatments, helping to reducethe uncertainty in emission estimates. Thisanalysis may be done in two steps. If no in-formation on shrub biomass is available theproposed model would be used for initializa-tion (i.e. estimate initial shrub biomass) andto predict curves of forest shrub accumula-tion without previous information on shrubload over a specific time span; otherwise oneof the difference equation forms are recom-mended to estimate future biomass from theinitial biomass.
Despite disregarding site-specific condi-tions in relation to shrub composition andsome simplifications in regards to the wholefuel complex, it is reasonable to concludethat the combination of the proposed modeland the difference equation forms is able toadequately describe the typical shrubbiomass accumulation in Portuguese forests(Fig. 5). Additionally, our biomass modelsprovide sound estimates of biomass growthon the short term. For longer periods (morethan 15 years), information on regeneration,mortality, thinning and succession has to betaken into consideration in order to increasethe accuracy of biomass estimates. Thesegeneral equations are expected to help forestmanagement decision-making as a tool tosupport decisions on where and when fueltreatments are required.
AcknowledgmentsThis research was conducted in the frame
of the project PTDC/AGR-CFL/64146/2006“Decision Support Tools for Integrating Fireand Forest Management Planning” andproject FIRE-ENGINE “Flexible Design of
Forest Fire Management Systems” (MIT/FSE/ 0064/2009), funded by the PortugueseScience Foundation (FCT), and and partlyfunded by the project ForEAdapt “Know-ledge exchange between Europe and Ameri-ca on forest growth models and optimizationfor adaptive forestry”, under grant agreementno. PIRSES-GA-2010-269257 and INTE-GRAL “Future Oriented Integrated Manage-ment of European Forest Lands, both fundedby the European Union Seventh FrameworkProgramme (FP7-PEOPLE-2010 -IRSES).The FCT support for funding the doctoralprogram plan of Brigite Roxo Botequim(SFRH-BD-44830-2008) and Susete Mar-ques (SFRH/BD/62847/2009) is also ac-knowledged. JGG participated in this re-search under the framework of the ProjectPTDC/AGR-FOR/4526/2012 “Models andDecision Support Systems for AddressingRisk and Uncertainty in Forest Planning”(SADRI).
Authors also would like to thanks the fi-nancial support for a post-fellowship by theFCT (SFRH/BPD/63979/ 2009) and by theUniversity of Eastern Finland. Finally, thePortuguese Forest Service (ICNF) is ac-knowledged for supplying the NFI databa-ses.
ReferencesAmaro A, Reed D, Tomé M, Themido I (1998).
Modeling dominant height growth: eucalyptusplantation in Portugal. Forest Science 44: 37-46.[online] URL: http://www.ingentaconnect.com/content/saf/fs/1998/00000044/00000001/art00007
Arnan X, Rodrigo A, Retana J (2007). Post-fire re-generation of Mediterranean plant communitiesat a regional scales is dependent on vegetationtype and dryness. Journal of Vegetation species18: 11-122. - doi: 10.1111/j.1654-1103.2007.tb02521.x
Baeza M, Raventos J, Escarré A, Vallejo VR(2006). Fire risk and vegetation structural dy-namics in Mediterranean shrubland. Plant Ecolo-gy 187 (2): 189-201. - doi: 10.1007/s11258-005-3448-4
Brown JK (1971). A planar intersect method forsampling fuel volume and surface area. ForestScience 17 (1): 96-102. [online] URL: http://www.ingentaconnect.com/content/saf/fs/1971/00000017/00000001/art00023
Bond WJ, Van Wilgen BW (1996). Fire and plants(1st edn). Population and Community BiologySeries 14, Chapman and Hall, London, UK, pp.263. - doi: 10.1007/978-94-009-1499-5
Bonet JA, Pukkala T, Fischer CR, Palahí M, Mar-tinez de Aragón J, Colinas C (2008). Empiricalmodels for predicting the production of wildmushrooms in Scots pine (Pinus sylvestris L.)forests in the Central Pyrenées. Annals of ForestScience 65 (2): 206-206. - doi: 10.1051/forest:2007089
Botequim B, Borges P, Carreiras J, Oliveira MM,Borges J (2009). Development of a shrub growth
iForest (early view): e1-e12 e10 © SISEF http://www.sisef.it/iforest/

Modeling shrub biomass accumulation in Portuguese forests
model in understory conditions (preliminarymodel). Technical Report 7, FORCHANGE, In-stituto Superior de Agronomia, Lisboa, Portugal,pp. 12.
Botequim B, Garcia-Gonzalo J, Marques S, Ricar-do A, Borges JG, Oliveira MM, Tomé J, Tomé M(2013). Assessing wildfire risk probability in Eu-calyptus globulus Labill stands in Portugal. iFo-rest 6: 217-227. - doi: 10.3832/ifor 0821-006
Broncano MJ, Retana J, Rodrigo A (2005). Pre-dicting the recovery of Pinus halepensis andQuercus ilex forests after a large wildfire innortheastern Spain. Plant Ecology 180: 47-56. -doi: 10.1007/s11258-005-0974-z
Burkhart HE, Tomé M (2012). Modeling foresttrees and stands. Springer, Berlin, Germany, pp.457. - doi: 10.1007/978-90-481-3170-9
Calvo L, Tárrega R, Luis E, Valbuena L, Marcos E(2005). Recovery after experimental cutting andburning in three shrub communities with differ-ent dominant species. Plant Ecology 175-185. -doi: 10.1007/s11258-005-0200-z
Canadell J, Zedler PH (1995). Underground struc-tures of woody plants in Mediterranean ecosys-tems of Australia, California, and Chile. In:“Ecology and Biogeography of MediterraneanEcosystems in Chile, California and Australia”(Arroyo MTK, Zedler PH, Fox Deds M). Sprin-ger-Verlag, New York, USA, pp. 177-210. - doi:10.1007/978-1-4612-2490-7_8
Canadell JG, Raupach MR (2008). Managingforests for climate change mitigation. Science320: 1456-1457. - doi: 10.1126/science.1155458
Castedo-Dorado F, Gómez-Vásquez I, FernandesPM, Crecente-Campo F (2012). Shrub fuel cha-racteristics estimated from overstory variables inNW Spain pine stands. Forest Ecology and Ma-nagement 275: 130-141. - doi: 10.1016/j.foreco.2012.03.002
Castro H, Freitas H (2009). Above-ground bio-mass and productivity in the Montado: from her-baceous to shrub dominated communities. Jour-nal of Arid Environments 73 (4-5): 506-511. -doi: 10.1016/j.jaridenv.2008.12.009
Cesaraccio C, Spano D, Duce P, Snyder RL(2001). An improved model for determining de-gree-day values from daily temperature data. In-ternational Journal of Biometeorology 45 (4):161-169. - doi: 10.1007/s004840100104
Chmielewski FM, Rötzer T (2001). Response oftree phenology to climate change across Europe.Agricultural and Forest Meteorology 108 (2):101-112. - doi: 10.1016/S0168-1923(01)00233-7
Chojnacky DC (1992). Estimating volume andbiomass for dryland oak species. In: Proceedingsof the Conference “Ecology and Management ofoaks and Associated Woodlands: Perspectives inthe Southwestern United States and NorthernMexico”. Sierra Vista (Arizona, USA) 27-30April 1992. Rocky Mountain Forest and RangeExperiment Station, USDA Forest Service, FortCollins, CO, USA, pp. 151-161. [online] URL:http://books.google.it/books/?id=zP4TAAAAYAAJ
Cieszewski CJ, Bailey RL (2000). Generalized al-
gebraic difference approach: theory based deri-vation of dynamic equations with polymorphismand variable asymptotes. Forest Science 46: 116-126.
Clutter JL, Fortson JC, Pienaar LV, Brister GH,Bailey RL (1983). Timber management: a quan-titative approach. John Wiley and Sons, Inc, NewYork, USA, pp. 333.
Coll L, González-Olabarria JR, Mola-Yudego B,Pukkala T, Messier C (2011). Predicting under-story maximum shrubs cover using altitude andoverstory basal area indifferent Mediterraneanforests. European Journal of Forest Research130: 55-65 - doi: 10.1007/s10342-010-0395-y
Correia OA, Martins AC, Catarino FM (1992).Comparative phenology and seasonal foliar ni-trogen variation in Mediterranean species of Por-tugal. Ecologia Mediterranea 18: 7-18. [online]URL: http://ecologia-mediterranea.univ-avignon.fr/uploads/media/Ecologia_mediterranea_1992-18_01.pdf#page=10
DGF (2001). Inventário Florestal Nacional: Portu-gal Continental (3ª Revisão) [Forest National In-ventory: Portugal (3rd revision)]. Direcção Geraldas Florestas, Lisboa, Portugal, pp. 233. [in Por-tuguese]
DGRF (2006). Resultados do Inventário FlorestalNacional 2005/2006 (5ª Revisão) [Results fromthe National Forest Inventory 2005/2006 (5th
Revision)]. Direcção Geral dos Recursos Flo-restais, Lisboa, Portugal, pp. 70. [in Portuguese]
Fernandes P, Rego FC (1998). Equations for esti-mating fuel load in shrub communities domina-ted by Chamaespartium tridentatum and Ericaumbellata. In: Proceedings of the “3rd Interna-tional Conference on Forest Fire Research & 14th
Fire and Forest Meteorology Conference” (Vie-gas DX ed). Luso (Portugal) 16-20 Nov 1998.ADAI, University of Coimbra, Coimbra, Portu-gal, pp. 2553-2564.
Fernandes PA, Loureiro CA, Botelho HS (2004).Fire behaviour and severity in a maritime pinestand under differing fuel conditions. Annals ofForest Science 61 (6): 537-544. - doi: 10.1051/forest:2004048
Fernandes PM, Rigolot E (2007). The fire ecologyand management of maritime pine (Pinuspinaster Ait.). Forest Ecology and Management241 (1-3): 1-13. - doi: 10.1016/j.foreco.2007.01.010
Fernandes PM (2009a). Combining forest struc-ture data and fuel modelling to classify fire ha-zard in Portugal. Annals of Forest Science 66 (4):415-415. - doi: 10.1051/forest/2009013
Fernandes PM (2009b). Examining fuel treatmentlongevity through experimental and simulatedsurface fire behaviour: a maritime pine casestudy. Canadian Journal of Forest Research 39(12): 2529-2535. - doi: 10.1139/X09-145
Fernández Alés R, Martín A, Ortega F, Alés EE(1992). Recent changes in landscape structureand function in a Mediterranean region of Spain(1950-1984). Landscape Ecology 7: 3-18. - doi:10.1007/BF02573953
Ferreira L, Constantino M, Borges J, Garcia-Gon-zalo J (2012). A stochastic dynamic program-
ming approach to optimize short-rotation cop-pice systems management scheduling: an appli-cation to eucalypt plantations under wildfire riskin Portugal. Forest Science 58 (4): 353-365. -doi: 10.5849/forsci.10-084
Ferreira L, Constantino M, Borges JG (2014). Astochastic approach to optimize Maritime pine(Pinus pinaster Ait.) stand management sche-duling under fire risk: an application in Portugal.Annals of Operations Research 219 (1): 359-377. - doi: 10.1007/s10479-011-0845-z
Garcia-Gonzalo J, Marques S, Borges JG, Bote-quim B, Oliveira MM, Tomé J, Tomé M (2011).A three-step approach to post-fire mortality mo-delling in Maritime pine (Pinus pinaster Ait)stands for enhanced forest planning in Portugal.Forestry 84 (2): 197-206.1 - doi: 10.1093/forestry/cpr006
Garcia-Gonzalo J, Zubizarreta-Gerendiain A, Ri-cardo A, Marques S, Botequim B, Borges J. G,Oliveira MM, Tomé M, Pereira JMC (2012).Modelling wildfire risk in pure and mixed foreststands in Portugal. Allgemeine Forst undJagdzeitung (AFJZ) - German Journal of ForestResearch 183 (11/12): 238-248.
Garcia-Gonzalo J, Pukkala T, Borges J (2014). In-tegrating fire risk in stand management schedul-ing. An application to Maritime pine stands inPortugal. Annals of Operations Research 219 (1):379-395. - doi: 10.1007/s10479-011-0908-1
González JR, Palahi M, Pukkala T (2006). A fireprobability model for forest stands in Catalonia(north-east Spain). Annals of Forest Science 63:1-8. - doi: 10.1051/forest:2005109
Gould JS, McCaw WL, Cheney NP (2011). Quan-tifying fine fuel dynamics and structure in dryeucalypt forest (Eucalyptus marginata) in West-ern Australia for fire management. Forest Ecolo-gy and Management 262 (3): 531-546. - doi:10.1016/j.foreco.2011.04.022
Hosmer DW, Lemeshow S (2000). Applied logi-stic regression (2nd edn). Series “Probability andMathematical Statistics”, no. 452, Wiley, NewYork, USA, pp. 307.
Hurteau MD, North M (2010). Carbon recoveryrates following different wildfire risk mitigationtreatments. Forest Ecology and Management260: 930-937. - doi: 10.1016/j.foreco.2010.06.015
Joffre R, Rambal S (2002). Mediterranean Eco-systems. In: “Encyclopedia of Life Science” (ednM.P. Ltd). Nature Publishing Group, London,UK, pp. 1-7.
Keeley JE, Zedler PH (1978). Reproduction ofChaparral shrubs after fire: a comparison ofsprouting and seeding strategies. American Mid-land Naturalist 99: 142-161. - doi: 10.2307/2424939
Keeley JE (1986). Resilience of Mediterraneanshrub communities to fire. In: “Resilience in Me-diterranean-type ecosystems” (Dell B, HopkinsAJM, Lamont Beds B). Dr W Junk Publishers,Dordrecht, The Netherlands, pp. 95-112.
Kozlowski TT, Kramer PJ, Pallardy SG (1991).The physiological ecology of woody plants. Aca-demic Press Inc, San Diego, CA, USA, pp. 30.
© SISEF http://www.sisef.it/iforest/ e11 iForest (early view): e1-e12

Botequim B et al. - iForest (early view): e1-e12
Kummerow J, Montenegro G, Krause D (1981).Biomass, phenology and growth. In: “ResourceUse by Chaparral and Matorral” (Miller PC ed).Ecological studies, vol. 39, Springer-Verlag, NewYork, USA, pp. 69-96. - doi: 10.1007/978-1-4612-5896-4_4
Lloret F, Pausas J G, Vila M (2003). Responses ofMediterranean plant species to different fire fre-quencies in Garraf Natural Park (Catalonia,Spain): field observations and modelling predic-tions. Plant Ecology 167: 223-235. - doi: 10.1023/A:1023911031155
Maak K, von Storch H (1997). Statistical down-scaling of monthly mean air temperature to thebeginning of flowering of Galanthus nivalis L.in northern Germany. International Journal ofBiometeorology 41 (1): 5-12. - doi: 10.1007/s004840050046
Malmsheimer RW, Heffernan P, Brink S, CrandallD, Deneke F, Galik C, Gee E, Helms JA, Mc-Clure N, Mortimer M, Ruddell S, Smith M,Stewart J (2008). Forest management solutionsfor mitigating climate change in the UnitedStates. Journal of Forestry 106 (3): 115-171.
Marques S, Garcia-Gonzalo J, Botequim B, Ricar-do A, Borges JG, Tomé M, Oliveira MM (2012).Assessing wildfire risk probability in Pinuspinaster Ait. stands in Portugal. Forest Systems21 (1): 111-120. - doi: 10.5424/fs/2112211-11374
McCaw L, Neal J, Smith R (2002). Stand charac-teristics and fuel accumulation in a sequence ofeven-aged karri (Eucalyptus diversicolor) standsin south-west Western Australia. Forest Ecologyand Management 158: 263-271. - doi: 10.1016/S0378-1127(00)00719-2
Mercer DE, Haigth RG, Prestemon JP (2008). An-alyzing trade-offs between fuels management,suppression, and damages from wildfire. In:“The Economics of Forest Disturbances: Mana-gement, Suppression, and Damages from Wild-fire” (Holmes TP, Prestemon JP, Abt KL eds). Se-ries “Forestry Sciences”, vol. 79, Springer, TheNetherlands, pp. 247-272. - doi: 10.1007/ 978-1-4020-4370-3_13
Midgley JJ (1996). Why the world’s vegetation isnot totally dominated by resprouting plants; be-cause reprouters are shorter than reseeders. Eco-graphy 19: 92-95. - doi: 10.1111/j.1600-0587.1996.tb00159.x
Myers RH (1990). Classical and modern regres-sion with applications. PWS-Kent Publishing,Boston, USA, pp. 488.
Navar J, Nájera J, Jurado E (2001). Preliminaryestimates of biomass growth in the Tamaulipanthornscrub in north-eastern Mexico. Journal ofArid Environments 47: 281-290. - doi: 10.1006/jare.2000.0708
Olson JS (1963). Energy storage and the balanceof producers and decomposers in ecological sys-
tems. Ecology 44: 322-331. - doi: 10.2307/1932179
Palahí M, Tomé M, Pukkala T, Trasobares A(2004). Site index model for Pinus sylvestris innorth-east Spain. Forest Ecology and Manage-ment 187: 34-47. - doi: 10.1016/S0378-1127(03)00312-8
Palahí M, Pukkala T, Bonet JA, Colinas C, Fi-scher CR, Martínez de Aragón JR (2009). Effectof the inclusion of mushroom values on the opti-mal management of even-aged Pine stands ofCatalonia. Forest Science 55 (60): 503-511(9).[online] URL: http://www.ingentaconnect.com/content/saf/fs/2009/00000055/00000006/art00004
Parresol BR (1999). Assessing tree and standbiomass: a review with examples and criticalcomparisons. Forest Science 45 (4): 573-593.[online] URL: http://www.ingentaconnect.com/content/saf/fs/1999/00000045/00000004/art00014
Pate JS, Froend RH, Bowen BJ, Hansen A, Kuo J(1990). Seedling growth and storage characteri-stics of seeder and resprouter species of Mediter-ranean-Type ecosystems of SW Australia. Annalsof Botany 65: 585-601. [online] URL: http://aob.oxfordjournals.org/content/65/6/585.short
Pausas JG (2001). Resprouting vs. seeding - a Me-diterranean perspective. Oikos 94: 193-194. -doi: 10.1034/j.1600-0706.2001.t01-1-10979.x
Pausas JG (2004). Changes in fire and climate inthe eastern Iberian Peninsula (Mediterraneanbasin). Climatic Change 63: 337-350. - doi:10.1023/B:CLIM.0000018508.94901.9c
Pausas JG, Bradstock RA, Keith DA, Keeley JE(2004). The GCTE Network. Plant functionaltraits in relation to fire in crown-fire ecosystems.Ecology 85: 1085-1100. - doi: 10.1890/02-4094
Pausas JG, Keeley JE, Verdú M (2006). Inferringdifferential evolutionary processes of plant per-sistence traits in Northern Hemisphere Mediter-ranean fire-prone ecosystems. Journal of Ecology94: 31-39. - doi: 10.1111/j.1365-2745.2005.01092.x
Pereira JMC, Santos TN (2003). Fire risk andburned area mapping in Portugal. Direcção Geraldas Florestas, Lisboa, Portugal. [in Portuguese]
Plucinski MP (2003). The investigation of factorsgoverning ignition and development of fires inheathland vegetation. PhD thesis, University ofNew South Wales - Australian Defence ForceAcademy, School of Mathematics and Statistics,Sidney, Australia, pp. 366.
Rambal S, Hoff C (2001). Mediterranean ecosys-tems and fire: the threats of global change. In:“Large Forest Fires” (Moreno JM ed). BackbuysPublishers, Leiden, The Netherlands, pp. 187-213.
Richards FJ (1959). A flexible growth function forempirical use. Journal of Experimental Botany
10 (2): 290-301. - doi: 10.1093/jxb/10.2.290Rosa IM, Pereira JM, Tarantola S (2011). Atmo-
spheric emissions from vegetation fires in Portu-gal (1990-2008): estimates, uncertainty analysis,and sensitivity analysis. Atmospheric Chemistryand Physics 11: 2625-2640. - doi: 10.51 94/acp-11-2625-2011
SAS Institute Inc (2000). SAS/STAT user’s guide(v. 8 edn). SAS Institute Inc, Cary, NC, USA.
Schmidt KM, Menakis JP, Hardy CC, Hann WJ,Bunnell DL (2002). Development of coarse-scalespatial data for wildland fire and fuel manage-ment. Gen. Tech. Rep. RMRS-GTR-87, RockyMountain Research Station, USDA Forest Ser-vice, Fort Collins, CO, USA, pp. 41.
Schumacher FX (1939). A new growth curve andits application to timber-yield studies. Journal ofForestry 37: 819-820.
Tomé M, Oliveira T, Soares P (2006a).O modeloGlobulus 3.0. [The Globulus model 3.0.] Publi-cações GIMREF-RC2/2006, Universidade Téc-nica de Lisboa. Instituto Superior de Agronomia.Centro de Estudos Florestais. Lisboa, Portugal,pp. 23.
Tomé J, Tomé M, Barreiro S, Paulo JA (2006b).Age-independent difference equations for model-ling tree and growth. Canadian Journal of ForestResearch 36: 1621-1630. - doi: 10.1139/x06-065
Trabaud L, Grosman J, Walter T (1985). Recoveryof burnt Pinus halepensis Mill. Forest. I. Under-storey and litter phytomass development afterwildfire. Forest Ecology and Management 12 (3-4): 269-277. - doi: 10.1016/0378-1127(85)90032-5
Vanclay JK, Skovsgaard JP (1997). Evaluatingforest growth models. Ecological Modelling98:1-12. - doi: 10.1016/S0304-3800(96)01932-1
Vega JA, Fernandes P, Cuinas P, Fonturbel M,Perez J, Loureiro C (2006). Fire spread analysisof early summer field experiments in shrublandfuel types of northwestern Iberia. Forest Ecologyand Management 234: S102.
Zedler PH (1995). Fire frequency in southern Cal-ifornia shrublands: biological effects and man-agement options. In: “Brushfires in Californiawildlands: ecology and resource management”(Keeley JE, Scott T). International Association ofWildland Fire, Fairfield, Washington, DC, USA,pp. 101-112.
Supplementary Material
Appendix 1 - Species-specific bulk densityvalues and the regeneration strategies as-signed to the different shrub species presentin the selected National Forest Inventoryplots (DGF 2001, DGRF 2006).
Link: [email protected]
iForest (early view): e1-e12 e12 © SISEF http://www.sisef.it/iforest/
Related Documents