PERTANIKA14(3),383-391 (1991) A Model for the Rice and Wheat Economy in Malaysia: An Empirical Assessment of Alternative Specifications AHMAD ZUBAIDI BAHARUMSHAH Department ofEconomics Faculty ofEconomics and Management Universiti Pertanian Malaysia 43400 UPM Serdang, Selangor Darul Ehsan, Malaysia. Key words: elasticities, specifications, partial adjustment-adaptive expectation, log-linear, linear, autocorrelation, normal and inferior goods. ABSTRAK Satu model bagi ekonomi beras dan gandum Malaysia ditentu dan disesuaikan untuk data daripada 1960-87. Beberapa ujian diagnostik digunakan dalam analisis ini untuk menentukan spesifikasi model tersebut. Penyelidikan ini menggabungkan interaksi di antara beras dan gandum.. Anggaran keanjalan harga penawaran untuk jangkamasa pendek·adalah 0.03 sementara keanjalan harga penawaran untuk jangkamasa panjang ditentukan pada 0.11. Keanjalan metrik harga dan pendapatan yang diperolehi daripada analisis permintaan menunjukkan bahawa keanjalan harga sendiri adalah kurang daripada unitan. Hasil kajian ini menyokong hipotisis bahawa beras adalah barangan bawahan sementara gandum adalah normal. Paras import bergantung kepada penawaran tempatan, tingkat pendapatan dan harga-harga tempatan bagi beras dan gandum. ABSTRACT A model of the Malaysian rice and wheat economy is specified and fitted to data from 1960-87. Several diagnostic tests were empfnyed in the analysis to determine the specification of the model. The present work incorporates the interaction between rice and wheat. The estimate for the short-run supply price elasticity is 0.03 while the long-run price elasticity is estimated at 0.11. The matrix ofprice and income elasticities obtained from the demand analysis indicates that the own-price elasticities are less than unity. Thepresent work supports the hypothesis that rice is an inferiorgood while wheat is normal. The leVel of imports depends on domestic supply, income level and domestic prices of rice and wheat. INTRODUCTION The openness of the economy has allowed Malaysia greater flexibility in adjusting to the changing world economic environment. The availabilty of ample foreign exchange receipts has made it possible for Malaysia to import rice (a food commodity) with minimum restrictions, except in the past two years with the collapse of commodity prices. The economy depends on the world market for its supply of many food items such as rice, wheat, fruits, mutton and beef. Malaysia is 100 per cent self-sufficient in pork, poultry, eggs and fish. The country produces 5 per cent of its needs for milk, 50 per cent for beef and 20 per cent for mutton. In 1985, food imports accounted for 28 per cent of the nation's total imports. In Malaysia, the imports of rice are restricted through tariffs/quotas, and domestic rice prices are maintained above world prices. To ensure adequate supply to the consumers, the Malaysian government has been directly involved in rice imports since 1967. Government - to-government imports are based on contracts by the Malaysian government and foreign governments with terms and agreements varying among contracts. Malay- sia imports rice from 15 countries with about 90 per cent of all imports coming from Thailand, China, and Burma. (Tan 1987; Ahmad Zubaidi Baharumshah 1990).1 lFor more detailed discussion on government policy and rice production in Malaysia, see Tan (1987) and Ahmad Zubaidi Baharumshah (1990).

Welcome message from author
This document is posted to help you gain knowledge. Please leave a comment to let me know what you think about it! Share it to your friends and learn new things together.
Transcript
PERTANIKA14(3),383-391 (1991)
A Model for the Rice and Wheat Economy in Malaysia: AnEmpirical Assessment of Alternative Specifications
AHMAD ZUBAIDI BAHARUMSHAHDepartment ofEconomics
Faculty ofEconomics and ManagementUniversiti Pertanian Malaysia
43400 UPM Serdang, Selangor Darul Ehsan, Malaysia.
Key words: elasticities, specifications, partial adjustment-adaptive expectation, log-linear, linear,autocorrelation, normal and inferior goods.
ABSTRAK
Satu model bagi ekonomi beras dan gandum Malaysia ditentu dan disesuaikan untuk data daripada 1960-87.Beberapa ujian diagnostik digunakan dalam analisis ini untuk menentukan spesifikasi model tersebut. Penyelidikanini menggabungkan interaksi di antara beras dan gandum.. Anggaran keanjalan harga penawaran untukjangkamasa pendek· adalah 0.03 sementara keanjalan harga penawaran untuk jangkamasa panjang ditentukanpada 0.11. Keanjalan metrik harga dan pendapatan yang diperolehi daripada analisis permintaan menunjukkanbahawa keanjalan harga sendiri adalah kurang daripada unitan. Hasil kajian ini menyokonghipotisis bahawa berasadalah barangan bawahan sementara gandum adalah normal. Paras import bergantung kepada penawarantempatan, tingkat pendapatan dan harga-harga tempatan bagi beras dan gandum.
ABSTRACT
A model ofthe Malaysian rice and wheat economy is specified andfitted to datafrom 1960-87. Several diagnostic testswere empfnyed in the analysis to determine the specification ofthe model. The present work incorporates the interactionbetween rice and wheat. The estimate for the short-run supply price elasticity is 0.03 while the long-run price elasticityis estimated at 0.11. The matrix ofprice and income elasticities obtained from the demand analysis indicates that theown-price elasticities are less than unity. Thepresent work supports the hypothesis that rice is an inferiorgood while wheatis normal. The leVel of imports depends on domestic supply, income level and domestic prices ofrice and wheat.
INTRODUCTION
The openness of the economy has allowed Malaysiagreater flexibility in adjusting to the changing worldeconomic environment. The availabilty of ampleforeign exchange receipts has made it possible forMalaysia to import rice (a food commodity) withminimum restrictions, except in the past two yearswith the collapse of commodity prices. Theeconomy depends on the world market for itssupply of many food items such as rice, wheat,fruits, mutton and beef. Malaysia is 100 per centself-sufficient in pork, poultry, eggs and fish. Thecountry produces 5 per cent of its needs for milk, 50per cent for beef and 20 per cent for mutton. In
1985, food imports accounted for 28 per cent ofthe nation's total imports.
In Malaysia, the imports of rice are restrictedthrough tariffs/quotas, and domestic rice pricesare maintained above world prices. To ensureadequate supply to the consumers, the Malaysiangovernment has been directly involved in riceimports since 1967. Government - to-governmentimports are based on contracts by the Malaysiangovernment and foreign governments with termsand agreements varying among contracts. Malaysia imports rice from 15 countries with about 90per cent of all imports coming from Thailand,China, and Burma. (Tan 1987; Ahmad ZubaidiBaharumshah 1990).1
lFor more detailed discussion on government policy and rice production in Malaysia, see Tan (1987) and Ahmad ZubaidiBaharumshah (1990).
AHMAD ZUBAIDI BAHARUMSHAH
The objective of this paper is to formulate andestimate an econometric model for the supply anddemand for rice in Malaysia. The complete modelincludes the demand for wheat as well as an importequation for rice. The wheat equation is added tothe model to account for the interaction betweenrice and wheat on the demand side. In additon, thepresent work, unlike previous studies, employsseveral specification tests to diagnose theappropriate specifications.
Review ofPrevious ResearchPast research on the supply and demand analysishas been conducted for the Malaysian rice sectorusing both time series and cross sectional data.Aromdee (1969) using a Nerlovian model estimatedthe short run supply elasticity of 0.22 for Malaysia.Squire and Barnum (1980) found it to be 0.61 butthis was for the Muda area which is the mostproductive rice-growing area in Malaysia.Haughton (1983) found the supply elasticity for asingle crop area to be 0.25. Nik Fuad (1985), usingmore recent data and disaggregating domesticmarket for the demand and producing regions forthe supply, found that the elasticities differ fromone area to another but the general finding is thatrice producers are unresponsive to price changesin all growing regions. Supply elasticity estimatesare generally positive and small. Most studiesfound the elasticity estimates to be smaller (inabsolute value) than 0.25.
On the demand side, these studies indicatedthat elasticities ranged from -0.2 to -0.5 and -0.31to 0.47 for price and income respectively. Aromdeereported a price elasticity ranging from -0.35 to-0.46. Goldman (1975) also found that consumersare unresponsive to price change (-0.47). Nik Fuadfound the elasticity to be -0.5. A surveyconducted by the Ministry of Agriculture in 1980reported income elasticity to be 0.47. Cheam(1984), using a time series data, however,estimated it at -0.12. Similarly, Nik Fuad, using atime series data, estimated demand elasticity withrespect to income at -0.31. Thus, both price andincome elasticities appear to be low.
Islam (1978), with annual data from 1953-72,had derived an import demand function whichhad foreign reserves, price, income and domesticproduction as independent variables for six Asianrice deficit countries. The hypothesis thatgovernments interfere in rice imports in order toconserve foreign exchange was rejected for
countries like Malaysia and Sri Lanka. Islamreported that elasticity of imports with respect toforeign exchange reserves for Malaysia is close tozero (-0.01).2 However, imports were foundresponsive to changes in foreign reserves forcountries like India (2.48) and Pakistan (4.24).Islam also computed the elasticity of imports withrespect to price and income for Malaysia andfound them to beO.32 and 0.34 respectively. This issmall in absolute terms compared to other Asianimporting countries like India, Pakistan, Korea andthe Philippines
Obviously there is some variation in theestimates ofprice and income elasticity from thesestudies, perhaps due to different types of data andthe treatment of price structure in the estimationprocedure. However, these estimates will provide abenchmark for comparison with the model to beemployed in the present work.
MODELAND ESTIMATION
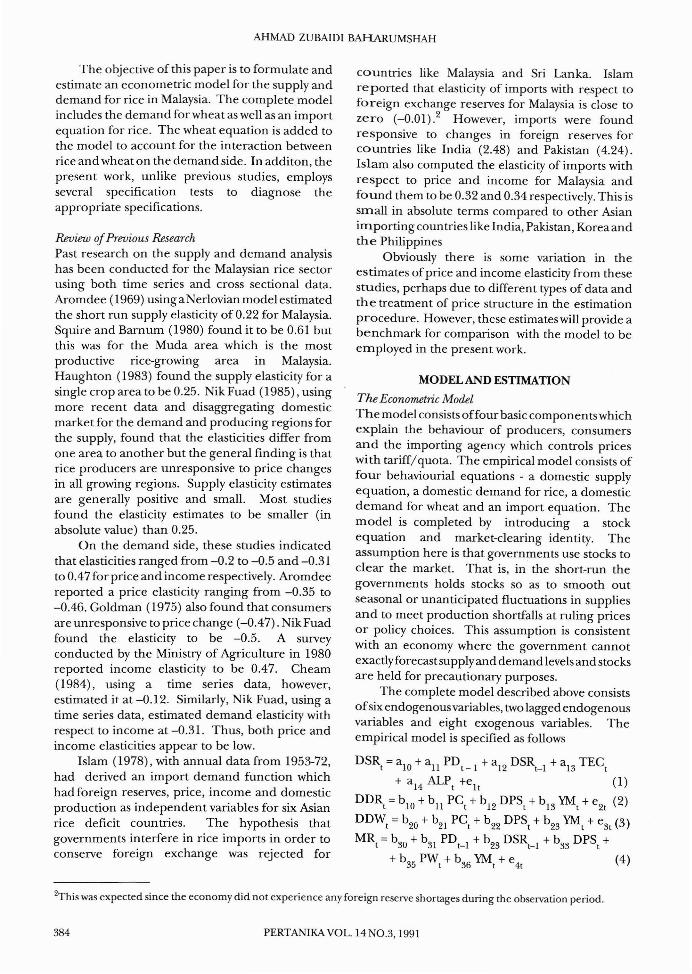
The Econometric ModelThe model consists offour basic components whichexplain the behaviour of producers, consumersand the importing agency which controls priceswi th tariff/quota. The empirical model consists offour behaviourial equations - a domestic supplyequation, a domestic demand for rice, a domesticdemand for wheat and an import equation. Themodel is completed by introducing a stockequation and market-clearing identity. Theassumption here is that governments use stocks toclear the market. That is, in the short-run thegovernments holds stocks so as to smooth outseasonal or unanticipated fluctuations in suppliesand to meet production shortfalls at ruling pricesor policy choices. This assumption is consistentwith an economy where the government cannotexactlyforecast supply and demand levels and stocksare held for precautionary purposes.
The complete model described above consistsofsix endogenous variables, two lagged endogenousvariables and eight exogenous variables. Theempirical model is specified as follows
DSRt = aIO + all PDt -1 + aI2 DSRt_I + aI3 TECt+ a
14ALPt +eIt (I)
DDRt = b IO + bll
PCt + bI2 DPSt + b 13 YMt+ e2t (2)
DDWt = b20 + b21 PCt
+ b22 DPSt + b23 YMt
+ e3t (3)
MRt =b30 + b31 PDt_ I + b23 DSRt_1 + b33 DPSt +
+ b35 PWt + b36 YMt + e4t (4)
2T his was expected since the economy did not experience any foreign reserve shortages during the observation period.
384 PERTANlKA VOL. 14NO.3, 1991

AMODELFORTHE RICE AND WHEAT ECONOMY IN MALAYSIA
Lagged Endogenous variables:
DSRt_1= Malaysian rice production in period t-1.
STOt_1=Malaysian stocks ofrice (MT) in period t-1.
The supply equation in (1) is the Nerloviantype of model where the quantity of rice producedis regarded as a function of the lagged quantity(DSRt_1
), lagged price of rice (PDt_I)' price of acompetitive crop (ALPt) and technology (TEe).The guaranteed minimum price is assumed to beexogenous in the supply equation. Thisassumption is consistent with the government'spolicy of setting the guaranteed minimum price.3
Thus the supply equation has one endogenous
Where
Endogenous variables:
DSR, = Malaysian production of rice (MT) in period t.
DDR = Domestic demand for rice (MT) in period t.t
DDW = Domestic demand for wheat (MT) in period t.t
MR = Malaysian net import of rice from ROW (M$/t
MT) in period t.
STO = Malaysian stocks of rice (MT) in period t.t
MW = Malaysian imports of wheat from the ROWt
(M$/MT) in period t.
Exogenousvariables:
PDt =Guaranteed minimum price for producer (M$/
MT) in period t.
PD = Guaranteed minimum price for producer in~I .
period t-1.ALP =Price ofnatural rubber (M$/MT) in the period
t
t.
TEC = Time trend (technological change) for thet
period t.
DPS = Domestic retail price of wheat (M$/MT) int
period t.
YMt
= Malaysian per-eapita income (M$) in period t.
PW = World price of rice (M$/MT) in period t.t
PCt =Do~esticretail price ofrice (M$/MT) in period
t.
variable and four predetermined variables. Quantities are adjusted in each period by a fraction ofthediscrepancy between last period's observed valueand the desired value. This partial adjustmenthypothesis is consistent with an economy wherethere are rigidities which prevent complete adjustment in each period. In Malaysia, paddy farmersare guaranteed a minimum price (PDt) and thisprice is maintained above world price. The variableALP
t, the price ofrubber in Equation 1, is added as
a supply shifter to represent the expected opportunity cost of resources. Alternatively, thevariable can be interpreted as the influence oftheMalaysian rubber policy on rice production. Basedon the dynamic supply theory discussed above, it ishypothesised that both DSR
t_
1and PDt_I will be
positively related to DSRt' The variable ALPt, isexpected to have a negative sign, reflecting negative influence of rubber policy on paddy production.
Finally, technological improvements may causethe supply function to shift. The technological shiftmay be the result of adoption of new varieties,improved cultivation practices, higher fertilizerconsumption and improved water management.To account for these technological improvements,a simple time trend variable: T=1 for 1960 to T=28for 1987 is used.
Equations 2 and 3 are the consumptionequations for rice (DDRt) and wheat (DDW
t)
respectively. Both rice and wheat consumption arespecified as functions of their own prices, the priceof the other goods (substitute) and per capita income (YM
t). The consumer prices are assumed to
be exogenous, again set by the government in thedemand system, so that each equation has oneendogenous variable and three exogenousvariables. It is hypothesised that own-price will benegatively related to demand. The price of thesubstitute is expected to have a positive sign. Thecoefficient on income can either be positive (i.e.
normal good) or negative (i.e. inferior good).4
Import demand, Equation 4, is conceptuallylike any other demand model except that in thisstudy it includes the variables in the supplyequation and the government policyvariables. TheMalaysian government can meet the domesticdemand for rice by either increased domestic
(5)
(6)
STO - STO I = MR - DDR + DSRt t- t t tMW =DDW
t t
3In Malaysia, paddy farmers are guaranteed a minimum price and this price is maintained above world price.
4These staple grains are controlled items and during each marketing year, the authorities determine and announce both the
retail and wholesale prices of rice and wheat.
PERTANIKA YOL.14NO.3, 1991 385
AHMAD ZUBAIDI BAHARUMSHAH
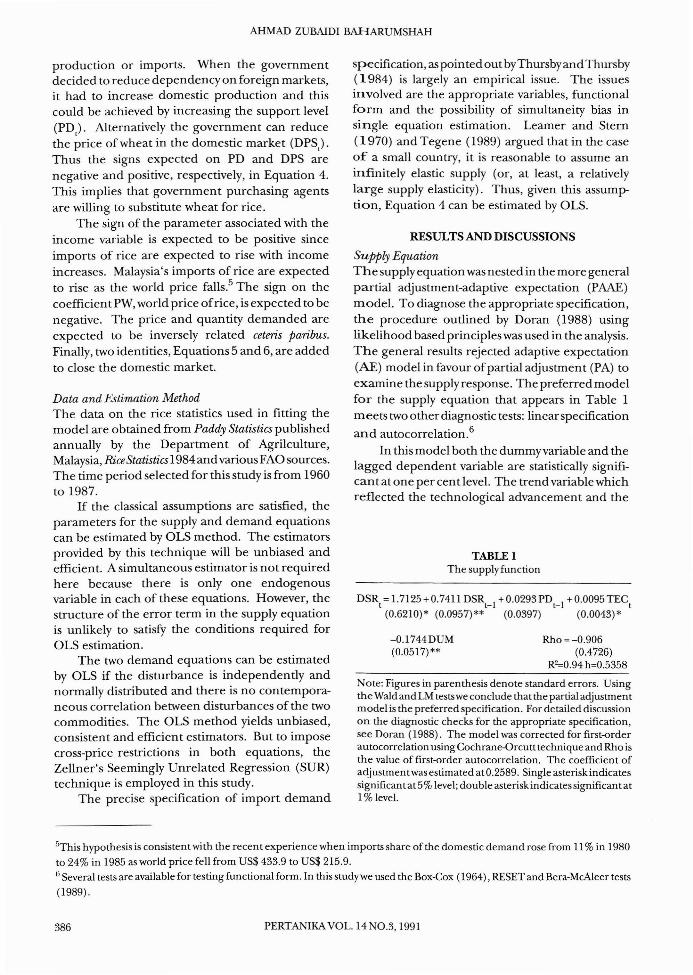
TABLE 1The supply function
DSRt= 1.7125 +0.7411 DSR
t_
1+0.0293 PD
t_ 1+ 0.0095 TEC
t(0.6210)* (0.0957)** (0.0397) (0.0043)*
Note: Figures in parenthesis denote standard errors. UsingtheWald and LM testswe conclude that the partial adjustmentmodel is the preferred specification. For detailed discussionon the diagnostic checks for the appropriate specification,see Doran (1988). The model was corrected for first-orderautocorrelation using Cochrane-Orcutt technique and Rho isthe value of first-order autocorrelation. The coefficient ofadjustmentwas estimated atO.2589. Single asterisk indicatessignificant at5% level; double asterisk indicatessignificantat1% level.
specification, as pointed outbyThursbyand Thursby(1984) is largely an empirical issue. The issuesinvolved are the appropriate variables, functionalform and the possibility of simultaneity bias insingle equation estimation. Leamer and Stern(1970) and Tegene (1989) argued that in the caseof a small country, it is reasonable to assume aninfinitely elastic supply (or, at least, a relativelylarge supply elasticity). Thus, given this assumption, Equation 4 can be estimated by OLS.
Rho =-0.906(0.4726)
R2=0.94 h=0.5358
-Q.1744DUM(0.0517)**
RESULTS AND DISCUSSIONS
Supply EquationThe supply equation was nested in the more generalpartial adjustment-adaptive expectation (PAAE)model. To diagnose the appropriate specification,the procedure outlined by Doran (1988) usinglikelihood based principleswas used in the analysis.The general results rejected adaptive expectation(AE) model in favour ofpartial adjustment (PA) toexamine the supply response. The preferred modelfor the supply equation that appears in Table 1meets two other diagnostic tests: linearspecification
and autocorrelation.6
In this model both the dummyvariable and thelagged dependent variable are statistically significant at one per cent level. The trend variable whichreflected the technological advancement and the
Data and Estimation MethodThe data on the rice statistics used in fitting themodel are obtained from Paddy Statistics publishedannually by the Department of Agrikulture,Malaysia, RiceStatistics 1984andvariousFAO sources.The time period selected for this study is from 1960to 1987.
If the classical assumptions are satisfied, theparameters for the supply and demand equationscan be estimated by OLS method. The estimatorsprovided by this technique will be unbiased andefficient. A simultaneous estimator is not requiredhere because there is only one endogenousvariable in each of these equations. However, thestructure of the error term in the supply equationis unlikely to satisfy the conditions required forOLS estimation.
The two demand equations can be estimatedby OLS if the disturbance is independently andnormally distributed and there is no contemporaneous correlation between disturbances of the twocommodities. The OLS method yields unbiased,consistent and efficient estimators. But to imposecross-price restrictions in both equations, theZellner's Seemingly Unrelated Regression (SUR)technique is employed in this study.
The precise specification of import demand
production or imports. When the governmentdecided to reduce dependency on foreign markets,it had to increase domestic production and thiscould be achieved by increasing the support level(PDJ Alternatively the government can reducethe price of wheat in the domestic market (DPS).Thus the signs expected on PD and DPS arenegative and positive, respectively, in Equation 4.This implies that government purchasing agentsare willing to substitute wheat for rice.
The sign of the parameter associated with theincome variable is expected to be positive sinceimports of rice are expected to rise with incomeincreases. Malaysia's imports of rice are expectedto rise as the world price falls.5 The sign on thecoefficientPW, world price ofrice, is expected to benegative. The price and quantity demanded areexpected to be inversely related ceteris paribus.Finally, two identities, Equations 5 and 6, are addedto close the domestic market.
S<rhis hypothesis is consistent with the recent experience when imports share of the domestic demand rose from 11 % in 1980
to 24% in 1985 as world price fen from US$ 433.9 to US$ 215.9.6 Several tests are available for testing functional form. In this studywe used the Box-Cox (1964), RESET and Bera-McAleer tests
(1989).
386 PERTANIKA VOL. 14 0.3,1991

A MODEL FOR THE RICE AND WHEAT ECONOMY IN MALAYSIA
expansion of are cultivated in 60s and 70s had theexpected positive sign and was statistically significant at the five per cent level. The estimatedcoefficient of the trend variable is small, suggestingpoor growth in yields for rice in Malaysia. Onlyminor technological changes took place during the
period under consideration.7
The dummy variable was added to the supplyequation to account for the differential intercept inthe SOs. The downward shift implies that for a givensupport price, producers supplied less as of 19S0than before. This is equivalent to a shift in supplycurve of farm products to the left. A plausiblecause for the left shift in the supply is that whenprices are supported above world prices and outputis not controlled, gross income will rise and thedemand for all factors increase accordingly andthus shift the supply function to the left. Alternatively, given that land for rice cultivation is a majorconstraint for the rice producers in Malaysia,farmers respond to the higher price supports bynon-optimal combination of non-land inputs (orput submarginal land into cultivation) and con
sequently produce at higher cost.s
The findings imply that the adjustment ofdomestic supply ofrice takes place within a year andthis is supported by the small difference betweenthe short and long run supply elasticities. Theestimates for the short run price elasticity ofsupplyis fairly low, 0.03, and is insignificant at the five percent level. The long run price elasticity isestimated at 0.11. The low own-price elasticityestimate is in general agreement With those
reported by King (19S7) and Haugton (19S3).9We conclude that Malaysian rice producers are
generally unresponsive both in the short and longrun to price change. The results suggest that highguaranteed minimum price will have little impacton domestic production. An important factorpreventing farmers' response to price change is thelack of available land for paddy cultivation. Mostland areas devoted to paddy cannot be used forother crops. In the granary areas which produce
more than 60% of the domestic supply, paddy is amono-crop. In the single cropped areas watersupply is the major constraint. This low supplyresponse implies that continuing price incentive atthe expense ofconsumers may not be a meaningfulway to increase domestic production.
The Demand EquationsThe consumption side of the model was specifiedwith per capita consumption of rice and wheat asfunctions of retail prices for rice and wheat andincome. Tht;: preliminary results of the demandequations suggest that the demand equations arenot robust under different specifications andestimation techniques. The model was firstdiagnosed for appropriate functional form usingthe RESET test and the Bera-McAleer test (1 9S9) .We conclude that the log-linear model is the"Conrect" specification for both the rice and wheatequations. 10
A further inspection of the demand equationresiduals revealed the presence of first orderautocorrelation. The model was diagnosed forautocorrelation using the test suggested by Guilkey(1974) and the computed LR statistics reject noautocorrelation in favour of diagonal ARS. 11 Theproblem of autocorrelation in the system ofdemand equations called for an alternative methodof estimation to eliminate the inconsistencies andimprove the sample efficiencies of the estimators.In most empirical work the parameters of the coefficients ofautocorrelation (autoregressive parameters) are unknown and must' be replaced by aconsistent estimator.
Several methods are available to estimate theparameter and in this study the method suggestedby Kmenta and and Gilbert (1970) was employed.Following Kmenta and Gilbert, the autoregressiveparameters were used to transform originalobservations and to retain the first observations inboth the demand equations.
Both the homogeneity and symmetry conditions were tested and imposed in the model. Theestimated coefficient for the two equations system
7The growth in paddy yields averaged about 1.2% between 1969 to 1977, declined to less than 1% in the 80s. In fact in the pastfew years growth has been negative as paddy production was plagued by pests and diseases.8See Floyd (1965) for detailed discussions on the effect of farm supports on land and labour in agriculture.9rhe variable ALP was dropped in the final estimation because it was giving wrong signs and was statistically insignificant.IOrhe model was also diagnosed for the appropriate specification using the LR test suggested by Savin and White (1978). Thespecification results of the joint test offunctional form and autocorrelation do not reject the log-linear specification.lIThe test produced an LR value of 10.713 compared to the 5% critical value of5.99.
PERTANIKAVOL.14NO.3, 1991 387

AHMAD ZUBAIDI BAHARUMSHAH
is reported in Table 2 along with some ofthe singleequation statistics. 12 The wheat equation appearsto fit the data better under the diagonal AR speci
fication. Although the R2 were fairly low, theestimated coefficients were statistically significantand of expected signs. The results in Table 2indicate that.7 out of a total of 8 estimates have tratios greater than 2. The restricted elasticitieswere obtained after 8 iterations on the transformeddata.
All the own-price, cross-price and incomeparameters in the restricted SUR model had theexpected signs. The coefficients of these variablesexcept for income in the wheat equation werefound to be statistically significant. Demands forrice and wheat are inelastic with respect to theirown-price and income.
TABLE 2Per capita demand for rice
DDRt= 0.1855 - 0.3090 PC
t_ 1 + 0.5486 DSPt-o·2396 YM
t(0.0797)* (0.1132)* (0.1120)** (0.0852)**
R2 = 0.5885 D.W. = lA503 Rho = 0.2220(0.1843)
DDW =--4.3606+ 0.2136PCt-Q.3198 DSPt+ 0.1062 YMt t(0.7699)** (0.4884)** (0.0956) (0.0956)
R2 = 0.7014 D.W. = 1.5319 Rho = 0.2674(0.1821 )
Note: Figures in parentheses denote standard errors. Allvariables were expressed in log linear form and deflated byCPI (1980 = 100). The system was estimated by SUR methodwith restrictions on cross-price and the homogeneity imposed.The modelwas corrected for autocorrelation using the methodsuggested by Kmenta and Gilbert (1970). The Rho is theestimated first-<>rder autocorrelation coefficient. Single asterikindicates significant at5% level; double asterisk significantat1% level.
The estimated Hicksian own-price elasticitiesare all negative. Generally, the elasticity estimatesseem reasonable apart from income elasticity ofwheat being insignificant. The own-price elasticities from the model were -0.309 and -0.320 for riceand wheat respectively.
Comparing the estimated parameters of theun transformed model (results not shown here)with the specification in Table 2 revealed that themagnitude of the coefficients is fairly robustunder the alternative specifications. However, thestandard errors in the model with auto-regressivetransformation are for the most part larger. A plausible explanation for this phenomenon was provided by Maeshiro (1976). Given the trended explanatory variables, the Cochrane-Orcrutt transformation reduces the sample variation in the transformed independent variables, compared with theuntransformed variable. Thus the reduction in thedispersion ofthe explanatoryvariable increases thevariance of the estimators. 13
The present work, unlike the previous effortson food grain demand for Malaysia, explicitly testedfor homogeneity and symmetry properties of theempirical model. In addition, both equations weretestedfor functional form and subjected to anumberof residual diagnostic tests before they were selected in the final analysis. The estimated priceelasticity for rice is about -0.309 which in smallerthan that of King's and Nik Fuad's but the crossprice elasticity (0.549) in the rice equation is higherthan that of Kings'S.
The income coefficients obtained were negative for rice (-0.240) and positive for wheat (0.106).The income elasticity for rice obtained from thepreferred model compares favourably with theresults obtained by Nik Fuad but not with those ofKing whose estimate was almost three times larger.Although the magnitude of the income coefficientvaries across studies, the resul ts seem to support thehypothesis that rice is an inferior good in Malaysia.Wheat is a normal good and the higher incomeelasticity of wheat reported in this study is notsurprising. Although no previous study on Malaysiahas included wheat for comparison, the result isconsistent with the declining pattern in riceconsumption and upward trend in wheatconsumption in Malaysia in the 1980s. Thus asincome increases, the demand for rice decreaseswhile the demand for wheat increases.
The matrix of price and income elasticitiesobtained in this study indicates several points withimportant policy implications. First, the presence
12The parameters of the rice equation changed little when the restrictions were imposed. However, the wheat equation'scoefficientchanged considerably. For example, the estimated income elastici tywas twice as large in the unrestricted SUR modelcompared to the restricted model.l~hemodel was also estimated using the approach suggested byJudge et at. (1985). The transformation ofthe first observationforagiven equation in this case depends on the first observation in all other equations. The results obtained cannot bejustifiedfrom the economic pointofview. Fordetaileddiscussion on the results and the source of the estimation procedure, See AhmadZubaidi (1990) pp. 120-123).
388 PERTANlKA VOL. 14NO.3, 1991
A MODEL FORTHE RlCEANOWHEATECONOMY IN MALAYSIA
of significant price effects for these two importantfood commodities indicates that price policy is animportant agricultural policy instrument. It is alsoimportant to recognise that substitution betweenthese two grains exists. The finding is important indesigning future grain policy especially when acountry like Malaysia depends on the world marketfor all ofher wheat. Second, wheat has acquired animportant position in the Malaysian diet. This isindicated by the two-fold increase in total quantityconsumed and by its higher income elasticity. Third,demand for rice is expected to decline as income. 14Increases.
Finally, the studies by King and Nik Fuad usedsingle equation methods without any restrictionson the parameters. The parameters in the presentwork are obtained using the SUR model withrestrictions imposed, producing a different matrixof price and income elasticities. Thus, theelasticities estimates are not robust to modelspecification. The choice of the specification willaffect the estimates of the welfare surplus. Forexample, researchers have recognised the centralrole of the choice of functional form plays on theestimates of consumer surplus and producersurplus. The potential errors which may arise fromthe incorrect functional form may be reducedby employing model specification test(s) .15
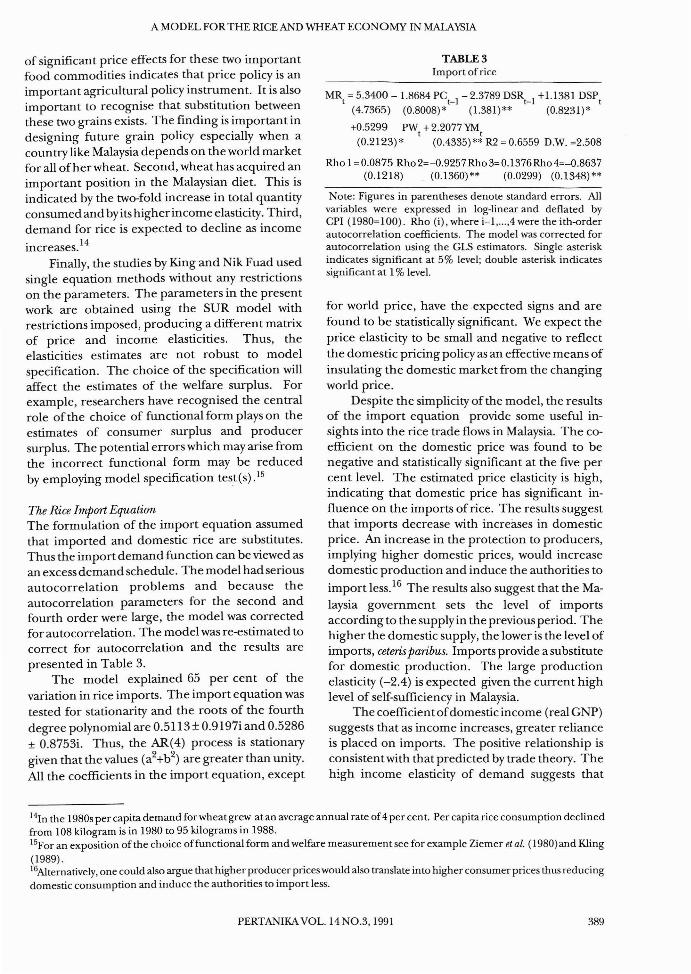
The Rice Import EquationThe formulation of the import equation assumedthat imported and domestic rice are substitutes.Thus the import demand function can be viewed asan excess demand schedule. The model had seriousautocorrelation problems and because theautocorrelation parameters for the second andfourth order were large, the model was correctedfor autocorrelation. The model was re-estimated tocorrect for autocorrelation and the results arepresented in Table 3.
The model explained 65 per cent of thevariation in rice imports. The import equation wastested for stationarity and the roots of the fourthdegree polynomial are 0.5113 ± 0.9197i and 0.5286± 0.8753i. Thus, the AR(4) process is stationarygiven that the values (a2+b2
) are greater than unity.All the coefficients in the import equation, except
TABLE 3Import of rice
MRt
= 5.3400 -1.8684 PCt_
1- 2.3789 OSR
t_
1+U381 OSP
t(4.7365) (0.8008)* (1.381)** (0.8231)*
+0.5299 PW + 2.2077 YMt t
(0.2123) * (0.4335)** R2 = 0.6559 OW. =2.508
Rho 1 =0.0875 Rho 2=-0.9257Rho 3= 0.1376 Rho 4=-0.8637(0.1218) (0.1360)** (0.0299) (0.1348)**
Note: Figures in parentheses denote standard errors. Allvariables were expressed in log-linear and deflated byCPI (1980=100). Rho (i), where i=I, ... ,4 were the ith-orderautocorrelation coefficients. The model was corrected forautocorrelation using the GLS estimators. Single asteriskindicates significant at 5% level; double asterisk indicatessignificant at 1% level.
for world price, have the expected signs and arefound to be statistically significant. We expect theprice elasticity to be small and negative to reflectthe domestic pricing policy as an effective means ofinsulating the domestic market from the changingworld price.
Despite the simplicity of the model, the resultsof the import equation provide some useful insights into the rice trade flows in Malaysia. The coefficient on the domestic price was found to benegative and statistically significant at the five percent level. The estimated price elasticity is high,indicating that domestic price has significant influence on the imports of rice. The results suggestthat imports decrease with increases in domesticprice. An increase in the protection to producers,implying higher domestic prices, would increasedomestic production and induce the authorities to
import less. 16 The results also suggest that the Malaysia government sets the level of importsaccording to the supply in the previous period. Thehigher the domestic supply, the lower is the level ofimports, ceterisparibus. Imports provide a substitutefor domestic production. The large productionelasticity (-2.4) is expected given the current highlevel of self-sufficiency in Malaysia.
The coefficientofdomestic income (real GNP)suggests that as income increases, greater relianceis placed on imports. The positive relationship isconsistent with that predicted by trade theory. Thehigh income elasticity of demand suggests that
14In the 1980s per capita demand for wheat grew at an average annual rate of4 per cent. Per capita rice consumption declinedfrom 108 kilogram is in 1980 to 95 kilograms in 1988.15For an exposition of the choice offunctional form and welfare measurement see for example Ziemer et at. (1980) and Kling
(1989).16Alternative!y, one could also argue that higher producer prices would also translate into higher consumer prices thus reducingdomestic consumption and induce the authorities to import less.
PERTANIKA VOL. 14NO.3, 1991 389

AHMADZUBNDIBAHARUMSHAH
imported rice may be considered a luxury item.This does not contradict the earlier conclusion thatthe domestic rice is an inferior good in Malaysia.Alternatively, the sign on the income coefficientsuggests that as income grows, the Malaysiangovernment depends on foreign supply to satisfythe domestic demand.
The coefficient on wheat price is positive andsignificant, suggesting that as the price ofwheat increases, more rice is imported. Alternatively, as theprice ofwheat falls relative to the price ofrice, morewheat is imported, thus reflecting the pattern thatexisted in Malaysia in the 1980s. The resultsimply that government purchasing agents are willing to substitute wheat for rice.
CONCLUSION.
The PAAE model was used to investigate the ricesupply response in Malaysia. The model wasdiagnosed for appropriate specification and theresults of the diagnostic tests suggest that the PAmodel is the preferred specification to examine thesupply response. The preferred model for thesupplyequation met two other diagnostic tests: loglinear specification and autocorrelation. Unlikethe supply equation, the demand equations are notrobust to changes in specification as reveaded bythe estimated elasticity coefficients. Demandrestrictions on these equations were tested andimposed in the model. In addition, the model wastested for functional form and was corrected forautocorrelation using the approach suggested byKmenta and Gilbert (1970).
Despite the simplicity of the model and dataproblems, an examination of the econometricmodel leads to several conclusions with possibleimportant policy implications for the rice economyin Malaysia.. The estimate for the short-run priceelasticity of supply is 0.03 while the log-run priceelasticity is estimated at 0.11. We conclude that Malaysian rice producers are generally ·unresponsiveboth in the short and long run to price change. Theguaranteed minimum price, which is the singlemost important rice policy intrument, is ineffective in boosting domestic production. Thus, theguaranteed minimum price may have beenjustified on income distributional grounds or for political reasons.
The matrix of price and income elasticitiesobtained from the demand analysis indicatesseveral points with important policy implications.
First, the presence of significant price effects forrice and wheat indicates that price policy is animportant agricultural policy instrument. It is alsoimportant to recognise that substitution betweenrice and wheat exists. This is important especiallywhen a country like Malaysia depends on the worldmarket to provide all wheat consumed domestically. Second, wheat has acquired an importantposi tion in the Malaysian diet. This is indicated bythe increase in per capita consumption and by itshigher income elasticity.
Third, the income elasticities obtained fromthe present study are negative and positive for riceand wheat, respectively. These results support thehypothesis that rice is an inferior good in Malaysiawhile wheat is normal. The hypothesis that demostic rice is an inferior good in Malaysia is consistentwith the earlier findings. Thus as income increases,the demand for rice decreases and self-sufficiency
in rice may more easily be achieved. 17
Demand for wheat and other substitutecommodities is expected to increase as incomeincreases. Unfortunately, Malaysia produces nowheat and only a small percentage ofall other grainrequirements. This would result in an increaseddependency on the international market for thedomestic food grain demand. In addition,consumers in Malaysia are likely to increase theirconsumption of meat and dairy products as incomes grow. It may be unreasonable for a middleincome country like Malaysia to adopt the narrowconcept of food security that includes only rice orcertain cereals. Instead, a broader concept offoodsecurity that includes a whole range of food itemsmay need to be considered. This suggestion isconsistent with the National Agricultural Policyobjective to broaden the concept offood securityby diverting some land to more profitable crops.
Import restrictions have protected producersfrom the cheaper world price and consumers havepaid the cost of the protection by paying a priceabove the import price. Imports were heavily influenced by governmental regulatory instruments.The results of the regression analysis suggest thatthe Malaysian government sets the level of importsaccording to the supply in the previous period,income level and domestic prices ofrice and wheat.Imports provide substitutes for domestic production. As income grows, the authority depends onforeign supply to satisfy the domestic demand. Thecoefficient on wheat price is positive, implying the
17A referee points out that wheat is normal and imported rice is superior. Thus, the imports of grains are expected to rise infuture because of improved income in Malaysia.
390 PERTANlKA VOL. 14 NO.3, 1991
A MODEL FOR THE RICE AND WHEAT ECONOMY IN MALAYSIA
willingness on the part of the importer to substitutewheat for rice.
REFERENCES
AHMAD ZUBAIDI BAHARUMSHAH. 1990. The MalaysianRicePolicy: WelfareAnalysis ofCurrent andAlternativePrograms. Ph.D. Thesis, University of Illinois.
AROMDEE, V. 1969. Can West Malaysia become Selfsufficient in Rice by 1975? Malay .Econ. Rev. 16: 7987.
BERA, A.K. and M. McALEER. 1989. Nested and Nonnested Procedures for Testing Linear and Loglinear Regression Models. Sankya: Ind. j. Stat.Series B, Pt. 1. 51: 1-13.
Box, G.E.P. and D.R Cox. 1964. An Analysis ofTransformations. j. Rny. Stat. Soc. Series B. 26:389396.
CHEAM, ST. 1984. Padi Poverty and Public Policy. Preliminary Report for Centre for Policy Research,University Sains Malaysia.
DORAN, H.E. 1988. Specification Test for PartialAdjustment and Adaptive Expectations Models.Amer.j. Agric. £Cons. 70: 713-723.
FLoYD,].E. 1965. The Effects of Farm Price Supportson the Return ofLand and LabourinAgriculture.j. Polito Econ. 73:148-158.
GoLDMAN, RH. 1975. Staple Food Self-Sufficiencyandthe Distributive Impact of Malaysia Rice Policy.Food Research Institute Studies, 14(3): 251-293.
GUILKEY, D.K. 1974. Alternative Tests for a First-OrderVector Autoregressive Error Specification. j.Economet. 2: 95-101.
HAUGHTON,]. 1983. Rural Development in PeninsularMalaysia: The Case ofSingle Crap Padi Cultivators.Ph.D. Thesis, Harvard University.
ISLAM, B. 1978. Price, Income and Foreign ExchangeReserve Elasticity for Asian Rice Imports. Amer. j.Agric. Econs. 60:532-555.
ITO, S., W.F. PETERSON and W.R GRANT. 1989. Rice inAsia: Is It Becoming an Inferior Good? Amer.j. ofAgric. Econs. 71:32-41.
JUDGE, G.G., RC. HILL, H. LUTKEPOHL and T. LEE.1985. The Theory and Practice ofEconometrics, 2nd
Edn. New York:John Wiley & Sons.
KING, R E. 1987. Malaysian AgriculturalPricingPolicies:A Dynamic Model. Ph.D. Thesis, The GeorgeWashington University.
KLING. C.L. 1989. The Importance ofFunctional Formin The Estimation ofWelfare. West). Agric. Econs.14(1): 168-174.
KMENTA, J. and R F. GILBERT. 1970. Estimation ofSeemingly Unrelated Regressions withAutoregressive Disturbances. j. Amer. Stat. Assoc.65:186-197.
LEAMER, E. and RM. STERN. 1970. QyantitativeInternationalEconomics. Boston: Allyn and Bacon,Inc.
MAEsHIRO, A. 1976. Autoregressive Transformation,Trended Independent Variable andAutocorrelated Disturbance Terms. Rev. Econs.and Stats. 58:497-500.
NIK FUAD KAMIL. 1985. Modelling the Operation ofthe Malaysia Rice Sectors. Malays. j. Agric. Econs.2:89-110.
SAVIN, N.E and K.]. White. 1978. Estimation andtesting or Functional Form and Autocorrelation:A Simultaneous Approach. j. Economet. 8: 1-12.
SQUIRE, L. and H.N. BARNUM. 1980. An EconometricModel ofan Agricultural Household. Cited fromScandizzo, P. and C. Bruce. 1980, MethodologiesfoTMeasuring Agricultural Price Intervention Effects.World Bank StaffWorking Paper # 394.
TAN,S.H. 1987. MalaysiaRiaPolicy: A CriticalAnalysis.Institute of Strategic and International Studies(ISIS), Malaysia.
TEGENE, A. 1989. On the Effects ofRelative Prices andEffective Exchange Rates on Trade Flows ofLDCs.Appl. Econs. 12:1447-1463.
THURSBY.]. and M. THURSBY. 1984. How Reliable areSimple, Single Equation Specifications oflmportDemands? Rev. Econs. and Stats. 66:120-128.
ZIEMER, R., W. MUSSERand RC. HILL. 1980. RecreationDemand Equations: Functional Form andConsumer Surplus. Amer.j. Agric.Econs. 62:136141.
(Received 29 November, 1990)
PERTANlKA VOL. 14 NO.3, 1991 391
Related Documents