Mon. Not. R. Astron. Soc. 362, 592–608 (2005) doi:10.1111/j.1365-2966.2005.09337.x A model for the infrared dust emission from forming galaxies Tsutomu T. Takeuchi, 1 † Takako T. Ishii, 2 ‡ Takaya Nozawa, 3 Takashi Kozasa 3 and Hiroyuki Hirashita 4,5,6 ‡ 1 Laboratoire d’Astrophysique de Marseille, Traverse du Siphon BP8, 13376 Marseille Cedex 12, France 2 Kwasan Observatory, Kyoto University, Yamashina-ku, Kyoto 607–8471, Japan 3 Division of Earth and Planetary Sciences, Hokkaido University, Sapporo 060–0810, Japan 4 Division of Particle and Astrophysical Sciences, Nagoya University, Nagoya 464–8602, Japan 5 SISSA-ISAS, International School for Advanced Studies, Via Beirut 4, 34014 Trieste, Italy 6 Center for Computational Sciences, University of Tsukuba, Tsukuba, Ibaraki 305–8577, Japan Accepted 2005 June 20. Received 2005 June 17; in original form 2005 February 14 ABSTRACT Dust plays various important roles in galaxy formation and evolution. In the early epoch of galaxy evolution, dust is only supplied by supernovae (SNe). With the aid of a new physical model of dust production by SNe developed by Nozawa et al. (N03), we constructed a model of dust emission from forming galaxies on the basis of the theoretical framework of Takeuchi et al. (T03). N03 showed that the produced dust species depends strongly on the mixing within SNe. We treated both unmixed and mixed cases and calculated the infrared (IR) spectral energy distribution (SED) of forming galaxies for both cases. Our model SED is less luminous than the SED of T03 model by a factor of 2–3. The difference is due to our improved treatment of the ultraviolet (UV) photon absorption cross-section, as well as the different grain size and species newly adopted in this work. The SED for the unmixed case is found to have an enhanced near to mid-IR (N–MIR) continuum radiation in its early phase of the evolution (age 10 7.25 yr) compared with that for the mixed case. The strong N–MIR continuum is due to the emission from silicon grains, which only exist in the species of the unmixed dust production. We also calculated the IR extinction curves for forming galaxies. N03 dust was found to yield a smaller extinction than that of T03 model. For the unmixed case, near-IR (NIR) extinction is dominated by large grains of silicon and amorphous carbon, and silicate features are less prominent compared to the curve given by T03. To the contrary, the extinction curve of the mixed case has a similar shape to that of T03. Then we calculated the SED of a local starbursting dwarf galaxy SBS 0335−052. Our present model SED naturally reproduced the strong N–MIR continuum and the lack of cold far-IR emission of SBS 0335−052. We found that only the SED of unmixed case can reproduce the NIR continuum of this galaxy. We then made a prediction for the SED of another typical star-forming dwarf, I Zw 18. The MIR continuum of I Zw 18 is expected to be much weaker than that of T03 SED. We also presented the evolution of the SED of Lyman-break galaxies. Finally, we discussed the possibility of observing forming galaxies at z 5. Key words: dust, extinction – Galaxy: formation – galaxies: dwarf – galaxies: ISM – infrared: galaxies. 1 INTRODUCTION In spite of the recent vast progress in both observational and theo- retical studies, our understanding of the physics of galaxy formation and evolution is still far from sufficient. E-mail: [email protected] †Postdoctoral Fellow of the Japan Society for the Promotion of Science for research abroad. ‡Postdoctoral Fellow of the Japan Society for the Promotion of Science. The cosmic star formation (SF) history, introduced by Tinsley & Danly (1980) and developed by subsequent studies (e.g. Lilly et al. 1996; Madau et al. 1996), has always drawn much attention. Now the observations reach up to ∼6–8 (e.g. Stanway, Bunker & McMahon 2003; Bouwens et al. 2004a,b). In such studies, the role of dust has been increasingly recognized when we try to understand the evolution of galaxies in the context of cosmic SF history, because dust grains absorb stellar light and re-emit it in the far-infrared (FIR). Even a small amount of dust can lead to a significant underestimation of the SF rate (SFR) (Steidel et al. 1999; Adelberger & Steidel 2000). C 2005 RAS by guest on July 7, 2015 http://mnras.oxfordjournals.org/ Downloaded from

Welcome message from author
This document is posted to help you gain knowledge. Please leave a comment to let me know what you think about it! Share it to your friends and learn new things together.
Transcript
Mon. Not. R. Astron. Soc. 362, 592–608 (2005) doi:10.1111/j.1365-2966.2005.09337.x
A model for the infrared dust emission from forming galaxies
Tsutomu T. Takeuchi,1�† Takako T. Ishii,2‡ Takaya Nozawa,3 Takashi Kozasa3
and Hiroyuki Hirashita4,5,6‡1Laboratoire d’Astrophysique de Marseille, Traverse du Siphon BP8, 13376 Marseille Cedex 12, France2Kwasan Observatory, Kyoto University, Yamashina-ku, Kyoto 607–8471, Japan3Division of Earth and Planetary Sciences, Hokkaido University, Sapporo 060–0810, Japan4Division of Particle and Astrophysical Sciences, Nagoya University, Nagoya 464–8602, Japan5SISSA-ISAS, International School for Advanced Studies, Via Beirut 4, 34014 Trieste, Italy6Center for Computational Sciences, University of Tsukuba, Tsukuba, Ibaraki 305–8577, Japan
Accepted 2005 June 20. Received 2005 June 17; in original form 2005 February 14
ABSTRACTDust plays various important roles in galaxy formation and evolution. In the early epoch ofgalaxy evolution, dust is only supplied by supernovae (SNe). With the aid of a new physicalmodel of dust production by SNe developed by Nozawa et al. (N03), we constructed a modelof dust emission from forming galaxies on the basis of the theoretical framework of Takeuchiet al. (T03). N03 showed that the produced dust species depends strongly on the mixing withinSNe. We treated both unmixed and mixed cases and calculated the infrared (IR) spectral energydistribution (SED) of forming galaxies for both cases. Our model SED is less luminous thanthe SED of T03 model by a factor of 2–3. The difference is due to our improved treatmentof the ultraviolet (UV) photon absorption cross-section, as well as the different grain sizeand species newly adopted in this work. The SED for the unmixed case is found to have anenhanced near to mid-IR (N–MIR) continuum radiation in its early phase of the evolution(age � 107.25 yr) compared with that for the mixed case. The strong N–MIR continuum isdue to the emission from silicon grains, which only exist in the species of the unmixed dustproduction. We also calculated the IR extinction curves for forming galaxies. N03 dust wasfound to yield a smaller extinction than that of T03 model. For the unmixed case, near-IR(NIR) extinction is dominated by large grains of silicon and amorphous carbon, and silicatefeatures are less prominent compared to the curve given by T03. To the contrary, the extinctioncurve of the mixed case has a similar shape to that of T03. Then we calculated the SED of alocal starbursting dwarf galaxy SBS 0335−052. Our present model SED naturally reproducedthe strong N–MIR continuum and the lack of cold far-IR emission of SBS 0335−052. Wefound that only the SED of unmixed case can reproduce the NIR continuum of this galaxy. Wethen made a prediction for the SED of another typical star-forming dwarf, I Zw 18. The MIRcontinuum of I Zw 18 is expected to be much weaker than that of T03 SED. We also presentedthe evolution of the SED of Lyman-break galaxies. Finally, we discussed the possibility ofobserving forming galaxies at z � 5.
Key words: dust, extinction – Galaxy: formation – galaxies: dwarf – galaxies: ISM – infrared:galaxies.
1 I N T RO D U C T I O N
In spite of the recent vast progress in both observational and theo-retical studies, our understanding of the physics of galaxy formationand evolution is still far from sufficient.
�E-mail: [email protected]†Postdoctoral Fellow of the Japan Society for the Promotion of Science forresearch abroad.‡Postdoctoral Fellow of the Japan Society for the Promotion of Science.
The cosmic star formation (SF) history, introduced by Tinsley& Danly (1980) and developed by subsequent studies (e.g. Lillyet al. 1996; Madau et al. 1996), has always drawn much attention.Now the observations reach up to ∼6–8 (e.g. Stanway, Bunker &McMahon 2003; Bouwens et al. 2004a,b). In such studies, the roleof dust has been increasingly recognized when we try to understandthe evolution of galaxies in the context of cosmic SF history, becausedust grains absorb stellar light and re-emit it in the far-infrared (FIR).Even a small amount of dust can lead to a significant underestimationof the SF rate (SFR) (Steidel et al. 1999; Adelberger & Steidel 2000).
C© 2005 RAS
by guest on July 7, 2015http://m
nras.oxfordjournals.org/D
ownloaded from
Dust emission from forming galaxies 593
Indeed, there is another extreme category of high-z galaxies whichhave large amount of dust and are extremely luminous in the FIRand submillimetre (submm) wavelengths (e.g. Hughes et al. 1998;Eales et al. 2003). Heavily hidden SF is suggested in these galaxies(e.g. Takeuchi et al. 2001a,b; Totani & Takeuchi 2002).
Furthermore, from a physical point of view, dust grains are one ofthe fundamental ingredients in the activity of galaxies. As they areformed in a variety of environments ranging from explosive ejectaof novae and supernovae (SNe) to the outflowing gas of evolvedlow-mass stars, the dust formation is closely related to the SF ac-tivity (Dwek 1998). Moreover, the existence of dust is crucial inthe physical process of galaxy formation and evolution through theformation of molecular hydrogen (e.g. Hirashita & Ferrara 2002).The dust itself plays a leading part in the physics of SF activity ingalaxies in the whole period of the cosmic history.
Then, how about very young galaxies in the early Universe atz � 5? It is often assumed, without deliberation, that the effect of dustis negligible for such young galaxies, because of their low metallici-ties. There is, however, a good counter-intuitive example in the localUniverse: a local dwarf star-forming galaxy SBS 0335−052 has avery young stellar age (�107 yr) and low metallicity (1/41 Z�),but has a heavily embedded active SF and strong continuum radia-tion in the near to mid-infrared (N–MIR) wavelength regime (Daleet al. 2001; Hunt, Vanzi & Thuan 2001). In addition, there are in-creasing number of observations suggesting the existence of dust inhigh-z systems such as Lyman α systems (e.g. Ledoux, Bergeron &Petitjean 2002; Ledoux, Petitjean & Srianand 2003) or quasi-stellarobjects (e.g. Bertoldi et al. 2003).
To produce dust effectively in such a young system, the dustenrichment should have occurred primarily in the ejecta of SNe,especially Type II SN (SN II) explosions,1 because the lifetimeof the progenitor is short enough (∼106 yr) (e.g. Dwek & Scalo1980; Kozasa, Hasegawa & Nomoto 1989). Recent theoretical stud-ies claim the possibility of very massive stars for the first generationstars, which end their lives as pair-instability SNe (PISNe) (Heger &Woosley 2002; Umeda & Nomoto 2002). We should also takeinto account for the PISNe to study the very early evolution ofdust. Recently, the dust formation in SNe ejecta has been observa-tionally supported (e.g. Douvion et al. 2001; Morgan et al. 2003;Dunne et al. 2003).
For investigating the properties of dust in details, theoretical pre-dictions for the amount and composition of dust are required. Sofar, some theoretical models of dust production by SNe have beendeveloped. Todini & Ferrara (2001, hereafter TF01) showed that thedust mass produced by a SN II is 0.1–0.4 M� applying the theoryof nucleation and grain growth by Kozasa & Hasegawa (1987). Inthe calculations, they assumed an adiabatic cooling in the ejectawith uniform gas density as well as elemental composition withinthe He core. They also found that SNe form amorphous carbon withsize around 300 Å and silicate grains around 10–20 Å. Schneider,Ferrara & Salvaterra (2004) extended the progenitor mass range tothe regime of PISNe (140–260 M�) and found that 10–60 M� ofdust forms per PISN. The grain radius depends on the species andis distributed from 0.001 to 0.3 µm.
Recently, (Nozawa et al. 2003) (hereafter N03) carefully took intoaccount the radial density profile and the temperature evolution inthe calculation of the dust mass in the ejecta of SNe II and PISNe.N03 showed that the produced dust species depends strongly on themixing within SNe. In particular, carbon dust is not produced in the
1 More specifically, core-collapse SNe.
mixed case, because the carbon and oxygen are mixed and combinedto form CO molecules. To the contrary, it forms in unmixed SN, asthere is a carbon-rich region at a certain location in the ejecta ofSNe. In addition, N03 predicts a dust mass larger than that of TF01for SNe II.
The amount of dust produced in SNe is thus still a matter of debate.Morgan & Edmunds (2003) adopted a dust production smaller thanthose of TF01 or N03 in their theoretical calculation, in line with IRobservations at the time. On the other hand, various observationalefforts have been devoted to constrain the dust production efficiencyof SNe (e.g. Arendt, Dwek & Moseley 1999; Dunne et al. 2003;Morgan et al. 2003; Green, Tuffs & Popescu 2004; Hines et al.2004; Krause et al. 2004; Wilson & Batrla 2005). These results rangefrom 0.003 M� to 1.0 M� per SN, and N03 dust production seemsconsistent with the upper range of these observational constraints.However, in these observational evaluations, a large uncertainty stillremains due to the uncertainties in the estimation of dust mass inCas A caused by the foreground contamination (Krause et al. 2004),although the evidence for dust in some SN remnants (SN1987Aand Kepler) is still pointing towards SN origin. Thus, further closeinteraction between theoretical and observational works is requiredto overcome the uncertainties and obtain a reasonable picture of dustproduction in SNe.
In order to examine the dust properties of such high-z galax-ies, the most direct observable is their spectral energy distribution(SED), especially at the FIR wavelengths. Hirashita, Hunt & Ferrara(2002) modelled the evolution of FIR luminosity and dust temper-ature in a young starburst on the basis of SNe II grain formationmodel of TF01. Takeuchi et al. (2003a) (T03) subsequently con-structed a model of infrared (IR) SED of galaxies starting fromthe model of Hirashita et al. (2002). T03, for the first time, prop-erly consider the dust size distribution peculiar to the very earlystage of galaxy evolution in the model of the IR SED of veryyoung galaxies, and successfully reproduced the peculiar MIR SEDof SBS 0335−052 (though their result seems to have overesti-mated the FIR continuum). Takeuchi & Ishii (2004) (T04) appliedthe T03 model to the Lyman-break galaxies (LBGs). They foundthat the suggested hot dust in the LBGs (e.g. Ouchi et al. 1999;Chapman et al. 2000; Sawicki 2001) can be naturally explained bythe T03 model.
As these works are based on TF01 conjecture, the dust formationmodel used is based on the classical nucleation theory (Feder et al.1966). Recently, however, the importance of non-equilibrium (non-steady state) effects on the dust grain formation has been recognizedin various astrophysical contexts (e.g. Gail, Keller & Sedlmayr 1984;Tanaka, Tanaka & Nakazawa 2002, N03). In addition, N03 foundthat the radial density profile of the SN progenitor and the temper-ature evolution of the ejecta also affect the dust grain formation.Hence, now is the time to take into account these concepts to furtherinvestigate the dust emission from young galaxies. In this work, weconstruct a new model of IR SED of extremely young galaxies basedon N03 SN dust formation model. Starting from the size distribu-tion and the amount of dust predicted by N03, we calculate the dustemission model by extending the T03 model to treat multiple dustspecies.
The paper is organized as follows. In Section 2 we explain theframework of our SED model. We present the basic result, theevolution of the SED of extremely young galaxies, in Section 3.Related discussions on local star-forming dwarf galaxies and high-zgalaxies will be in Section 4. Section 5 is devoted to our conclu-sions. Throughout this paper, we use a cosmological parameter set of(h, �0, λ0) = (0.7, 0.3, 0.7), where h ≡ H 0/100 [km s−1 Mpc−1].
C© 2005 RAS, MNRAS 362, 592–608
by guest on July 7, 2015http://m
nras.oxfordjournals.org/D
ownloaded from
594 T. T. Takeuchi et al.
2 S E D M O D E L F O R F O R M I N G G A L A X I E S
2.1 Species and size distribution of dust grains producedby SNe II
2.1.1 Dust production model of Nozawa et al. (2003) (N03)
N03 investigated the formation of dust grains in the ejecta of Pop-ulation III SNe (SNe II and PISNe, whose progenitors are initiallymetal free). As we mentioned already, they treat some aspects whichTF01 have not taken into account: (i) the time evolution of gas tem-perature is calculated by solving the radiative transfer equation in-cluding the energy deposition of radioactive elements; (ii) the radialdensity profile of various metals is properly considered; and (iii)unmixed and uniformly mixed cases in the He core are considered.In the unmixed case, the original onion-like structure of elementsis preserved, and in the mixed case, all the elements are uniformlymixed in the helium core.
It should be mentioned here again that TF01 assumed an adiabaticcooling in the ejecta and adjusted the adiabatic index γ to 1.25,referring to the formation episode of dust grains observed in SN1987A. As pointed out by Kozasa et al. (1989), the condensationtime as well as the resulting average size of dust grains stronglydepend on the value of γ . SN 1987A is somehow a peculiar SNin the sense that the progenitor is not a red supergiant but bluesupergiant: see Arnett et al. (1989) for details. Using SN 1987A as atemplate may not be appropriate in comparisons to SNe as a whole.Therefore in this paper, we use the result of N03 as a standard model.
We should note that N03 also assume the complete formationof CO and SiO molecules, neglecting the destruction of thosemolecules, i.e. no carbon-bearing grain condenses in the region ofC/O < 1 and no Si-bearing grain, except for oxide grains, con-denses in the region of Si/O < 1. The formation of CO and SiOmay be incomplete because of the destruction by energetic electronimpact within SNe. TF01 treat both formation and destruction ofCO and SiO, finding that both are mostly destroyed. The decreaseof CO leads to the formation of carbon grains, which could finallybe oxidized with available oxygen. The destruction of SiO coulddecrease the formation of grains composed of SiO2, MgSiO3 andMg2SiO4, and increase other oxidized grains and silicon grains.Observationally, it is still a matter of debate if CO and SiO are effi-ciently destroyed or not. For the detailed discussions on this issue,see Appendix B of N03.
2.1.2 Dust grain species produced by the N03 model
In the unmixed ejecta, a variety of grain species (Si, Fe, Mg2SiO4,MgSiO3, MgO, Al2O3, SiO2, FeS and C) condense, and in the mixedejecta, in contrast, only oxide grains (SiO2, MgSiO3, Mg2SiO4,Al2O3 and Fe3O4) form. This is because carbon atoms are consumedto form CO molecules. We summarize the species formed in SNein Table 1, where the species marked with a circle are relevant forunmixed and mixed SNe. The size of the grains spans a range ofthree orders of magnitude, depending on the grain species. The sizespectrum summed up over all the grain species has a very broaddistribution, and very roughly speaking, it might be approximatedby a power law. This size distribution is different from that of theSN II calculation of TF01, which has typical sizes of 300 Å foramorphous carbon and 10–20 Å for oxide grains.
In this work, we adopt the representative progenitor mass of SNeII as 20 M�. N03 have shown that the size distribution of eachgrain species is almost independent of the progenitor mass, if the
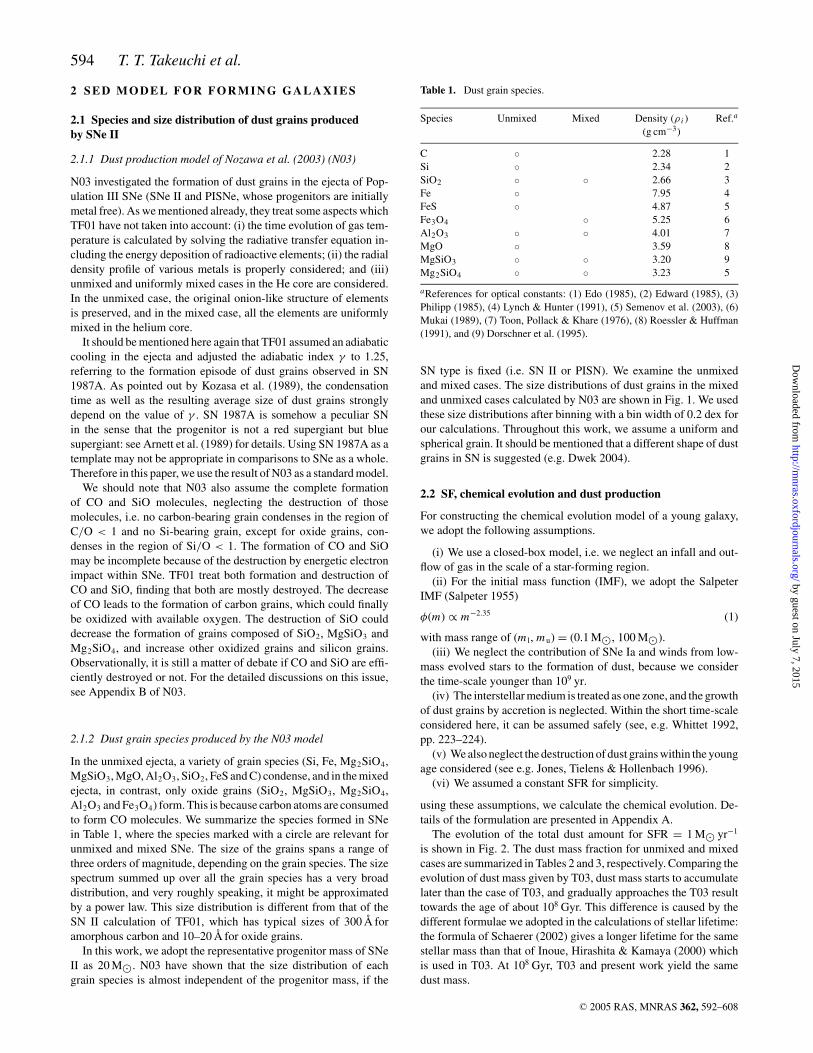
Table 1. Dust grain species.
Species Unmixed Mixed Density (ρ i ) Ref.a
(g cm−3)
C ◦ 2.28 1Si ◦ 2.34 2SiO2 ◦ ◦ 2.66 3Fe ◦ 7.95 4FeS ◦ 4.87 5Fe3O4 ◦ 5.25 6Al2O3 ◦ ◦ 4.01 7MgO ◦ 3.59 8MgSiO3 ◦ ◦ 3.20 9Mg2SiO4 ◦ ◦ 3.23 5
aReferences for optical constants: (1) Edo (1985), (2) Edward (1985), (3)Philipp (1985), (4) Lynch & Hunter (1991), (5) Semenov et al. (2003), (6)Mukai (1989), (7) Toon, Pollack & Khare (1976), (8) Roessler & Huffman(1991), and (9) Dorschner et al. (1995).
SN type is fixed (i.e. SN II or PISN). We examine the unmixedand mixed cases. The size distributions of dust grains in the mixedand unmixed cases calculated by N03 are shown in Fig. 1. We usedthese size distributions after binning with a bin width of 0.2 dex forour calculations. Throughout this work, we assume a uniform andspherical grain. It should be mentioned that a different shape of dustgrains in SN is suggested (e.g. Dwek 2004).
2.2 SF, chemical evolution and dust production
For constructing the chemical evolution model of a young galaxy,we adopt the following assumptions.
(i) We use a closed-box model, i.e. we neglect an infall and out-flow of gas in the scale of a star-forming region.
(ii) For the initial mass function (IMF), we adopt the SalpeterIMF (Salpeter 1955)
φ(m) ∝ m−2.35 (1)
with mass range of (m l, m u) = (0.1 M�, 100 M�).(iii) We neglect the contribution of SNe Ia and winds from low-
mass evolved stars to the formation of dust, because we considerthe time-scale younger than 109 yr.
(iv) The interstellar medium is treated as one zone, and the growthof dust grains by accretion is neglected. Within the short time-scaleconsidered here, it can be assumed safely (see, e.g. Whittet 1992,pp. 223–224).
(v) We also neglect the destruction of dust grains within the youngage considered (see e.g. Jones, Tielens & Hollenbach 1996).
(vi) We assumed a constant SFR for simplicity.
using these assumptions, we calculate the chemical evolution. De-tails of the formulation are presented in Appendix A.
The evolution of the total dust amount for SFR = 1 M� yr−1
is shown in Fig. 2. The dust mass fraction for unmixed and mixedcases are summarized in Tables 2 and 3, respectively. Comparing theevolution of dust mass given by T03, dust mass starts to accumulatelater than the case of T03, and gradually approaches the T03 resulttowards the age of about 108 Gyr. This difference is caused by thedifferent formulae we adopted in the calculations of stellar lifetime:the formula of Schaerer (2002) gives a longer lifetime for the samestellar mass than that of Inoue, Hirashita & Kamaya (2000) whichis used in T03. At 108 Gyr, T03 and present work yield the samedust mass.
C© 2005 RAS, MNRAS 362, 592–608
by guest on July 7, 2015http://m
nras.oxfordjournals.org/D
ownloaded from
Dust emission from forming galaxies 595
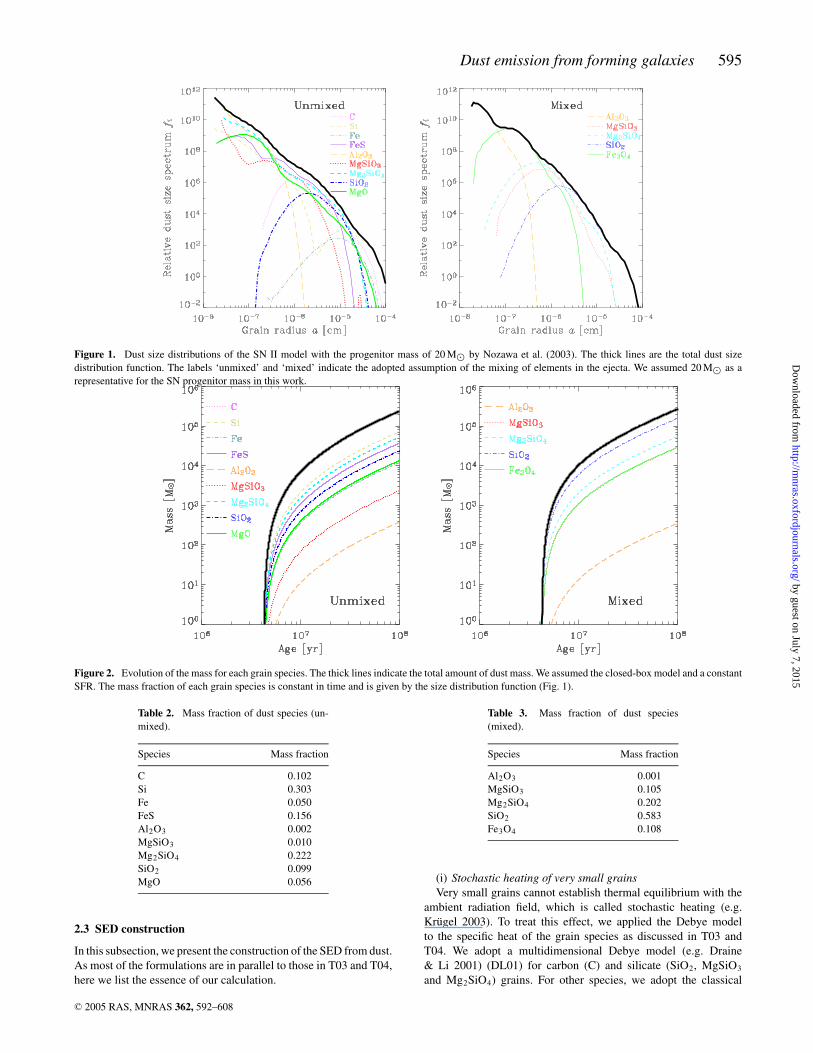
Figure 1. Dust size distributions of the SN II model with the progenitor mass of 20 M� by Nozawa et al. (2003). The thick lines are the total dust sizedistribution function. The labels ‘unmixed’ and ‘mixed’ indicate the adopted assumption of the mixing of elements in the ejecta. We assumed 20 M� as arepresentative for the SN progenitor mass in this work.
Figure 2. Evolution of the mass for each grain species. The thick lines indicate the total amount of dust mass. We assumed the closed-box model and a constantSFR. The mass fraction of each grain species is constant in time and is given by the size distribution function (Fig. 1).
Table 2. Mass fraction of dust species (un-mixed).
Species Mass fraction
C 0.102Si 0.303Fe 0.050FeS 0.156Al2O3 0.002MgSiO3 0.010Mg2SiO4 0.222SiO2 0.099MgO 0.056
2.3 SED construction
In this subsection, we present the construction of the SED from dust.As most of the formulations are in parallel to those in T03 and T04,here we list the essence of our calculation.
Table 3. Mass fraction of dust species(mixed).
Species Mass fraction
Al2O3 0.001MgSiO3 0.105Mg2SiO4 0.202SiO2 0.583Fe3O4 0.108
(i) Stochastic heating of very small grainsVery small grains cannot establish thermal equilibrium with the
ambient radiation field, which is called stochastic heating (e.g.Krugel 2003). To treat this effect, we applied the Debye modelto the specific heat of the grain species as discussed in T03 andT04. We adopt a multidimensional Debye model (e.g. Draine& Li 2001) (DL01) for carbon (C) and silicate (SiO2, MgSiO3
and Mg2SiO4) grains. For other species, we adopt the classical
C© 2005 RAS, MNRAS 362, 592–608
by guest on July 7, 2015http://m
nras.oxfordjournals.org/D
ownloaded from
596 T. T. Takeuchi et al.
Table 4. The specific heat of each species.
Species Debye temperature Refa N atom C(T) modelb
(K) (1022 cm−3)
C 863 1 11.4 Multi-DebyeSi 616 2 5.00 DebyeSiO2 — 1 7.96 Multi-DebyeFe 500 3 8.50 DebyeFeS 384 4 6.62 DebyeFe3O4 511 5 28.4 DebyeAl2O3 1030 6 23.5 DebyeMgO 762 7 10.7 DebyeMgSiO3 — 1 9.57 Multi-DebyeMg2SiO4 — 1 9.63 Multi-Debye
aReferences for Debye temperatures: (1) Draine & Li (2001), (2) Oganov,Brodhold & Price (2000), (3) Siethoff & Ahlborn (1996), (4) Grønvoldet al. (1991), (5) Shepherd et al. (1991), (6) Mezzasalma (2000), (7) Hama& Suito (1999).b‘Debye’ means that the specific heat C(T) is modelled by the classicalDebye model, while ‘Multi-Debye’ means that the multidimensional Debyemodel proposed by Draine & Li (2001) is adopted. For the species to whichwe adopt the multidimensional Debye model, we do not give the classicalDebye temperature.
three-dimensional Debye model with a single Debye temperature.The specific heat model is summarized in Table 4.
(ii) EmissionThe emission from dust is calculated in the same way as T03/T04,
basically according to Draine & Anderson (1985). Total dust emis-sion is obtained as a superposition of the emission from each grainspecies. The total mass of each grain component is given by N03.With this value and material density of each species (Table 1), wecan determine the normalization of the dust size distribution (seeAppendix B).
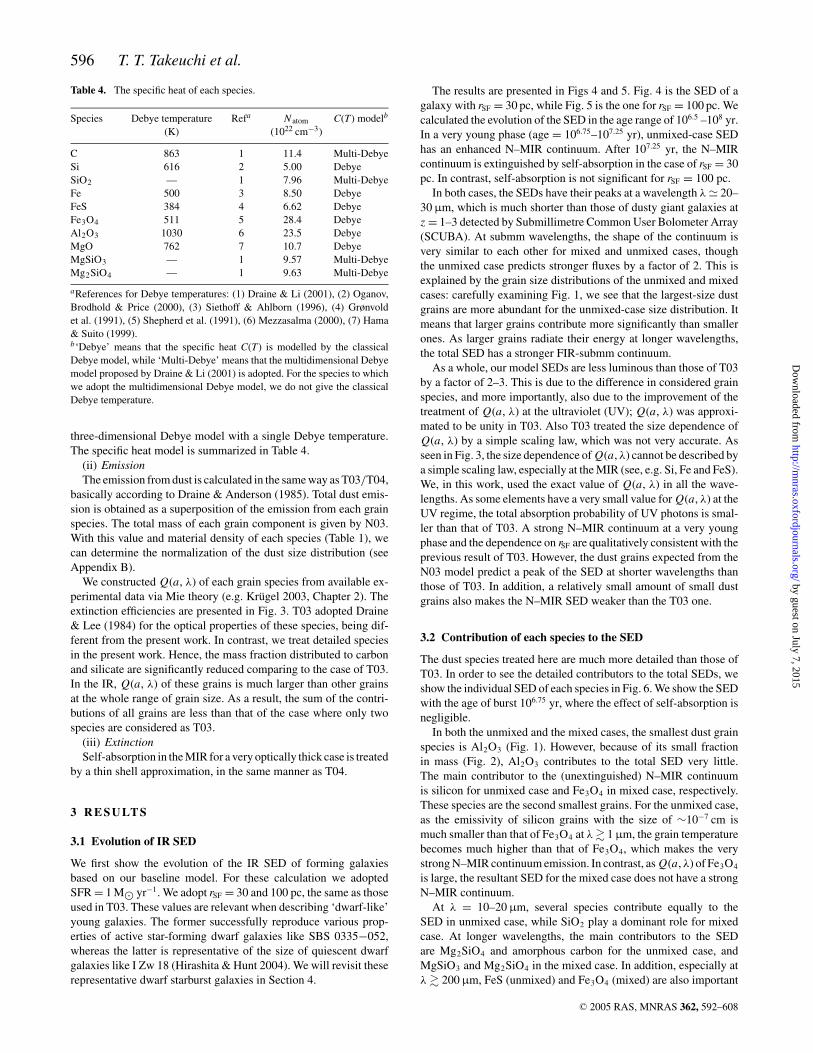
We constructed Q(a, λ) of each grain species from available ex-perimental data via Mie theory (e.g. Krugel 2003, Chapter 2). Theextinction efficiencies are presented in Fig. 3. T03 adopted Draine& Lee (1984) for the optical properties of these species, being dif-ferent from the present work. In contrast, we treat detailed speciesin the present work. Hence, the mass fraction distributed to carbonand silicate are significantly reduced comparing to the case of T03.In the IR, Q(a, λ) of these grains is much larger than other grainsat the whole range of grain size. As a result, the sum of the contri-butions of all grains are less than that of the case where only twospecies are considered as T03.
(iii) ExtinctionSelf-absorption in the MIR for a very optically thick case is treated
by a thin shell approximation, in the same manner as T04.
3 R E S U LT S
3.1 Evolution of IR SED
We first show the evolution of the IR SED of forming galaxiesbased on our baseline model. For these calculation we adoptedSFR = 1 M� yr−1. We adopt rSF = 30 and 100 pc, the same as thoseused in T03. These values are relevant when describing ‘dwarf-like’young galaxies. The former successfully reproduce various prop-erties of active star-forming dwarf galaxies like SBS 0335−052,whereas the latter is representative of the size of quiescent dwarfgalaxies like I Zw 18 (Hirashita & Hunt 2004). We will revisit theserepresentative dwarf starburst galaxies in Section 4.
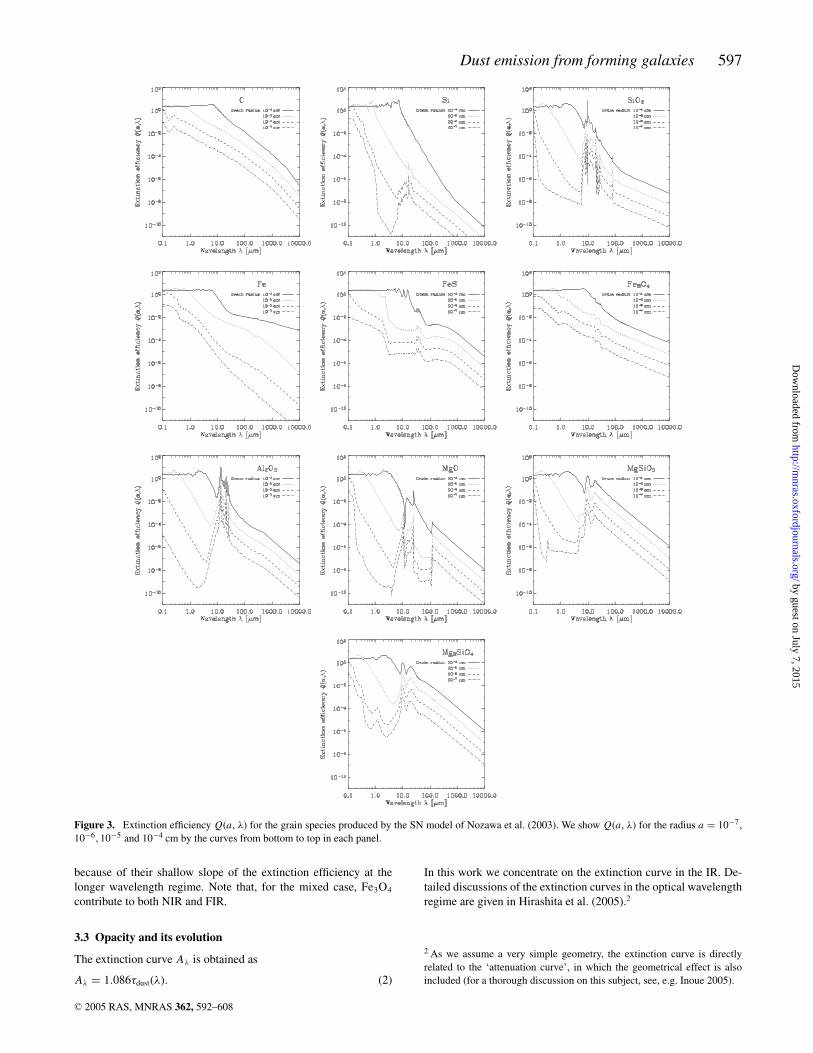
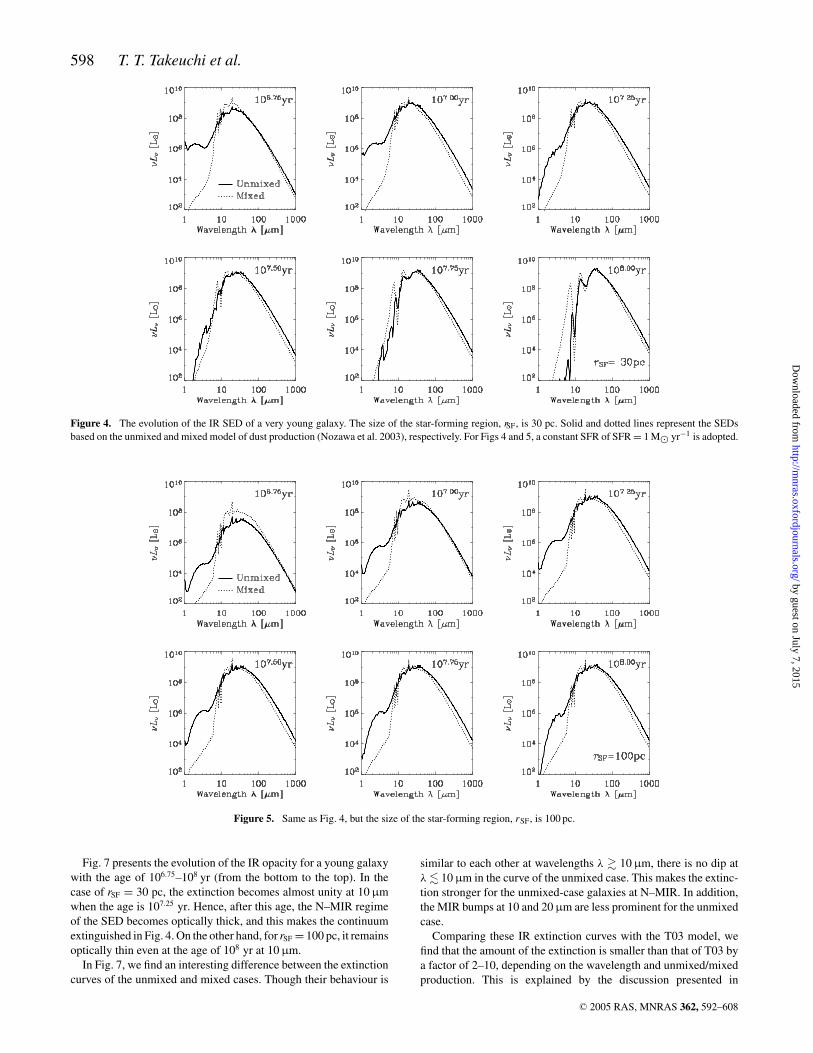
The results are presented in Figs 4 and 5. Fig. 4 is the SED of agalaxy with rSF = 30 pc, while Fig. 5 is the one for rSF = 100 pc. Wecalculated the evolution of the SED in the age range of 106.5 –108 yr.In a very young phase (age = 106.75–107.25 yr), unmixed-case SEDhas an enhanced N–MIR continuum. After 107.25 yr, the N–MIRcontinuum is extinguished by self-absorption in the case of rSF = 30pc. In contrast, self-absorption is not significant for rSF = 100 pc.
In both cases, the SEDs have their peaks at a wavelength λ � 20–30 µm, which is much shorter than those of dusty giant galaxies atz = 1–3 detected by Submillimetre Common User Bolometer Array(SCUBA). At submm wavelengths, the shape of the continuum isvery similar to each other for mixed and unmixed cases, thoughthe unmixed case predicts stronger fluxes by a factor of 2. This isexplained by the grain size distributions of the unmixed and mixedcases: carefully examining Fig. 1, we see that the largest-size dustgrains are more abundant for the unmixed-case size distribution. Itmeans that larger grains contribute more significantly than smallerones. As larger grains radiate their energy at longer wavelengths,the total SED has a stronger FIR-submm continuum.
As a whole, our model SEDs are less luminous than those of T03by a factor of 2–3. This is due to the difference in considered grainspecies, and more importantly, also due to the improvement of thetreatment of Q(a, λ) at the ultraviolet (UV); Q(a, λ) was approxi-mated to be unity in T03. Also T03 treated the size dependence ofQ(a, λ) by a simple scaling law, which was not very accurate. Asseen in Fig. 3, the size dependence of Q(a, λ) cannot be described bya simple scaling law, especially at the MIR (see, e.g. Si, Fe and FeS).We, in this work, used the exact value of Q(a, λ) in all the wave-lengths. As some elements have a very small value for Q(a, λ) at theUV regime, the total absorption probability of UV photons is smal-ler than that of T03. A strong N–MIR continuum at a very youngphase and the dependence on rSF are qualitatively consistent with theprevious result of T03. However, the dust grains expected from theN03 model predict a peak of the SED at shorter wavelengths thanthose of T03. In addition, a relatively small amount of small dustgrains also makes the N–MIR SED weaker than the T03 one.
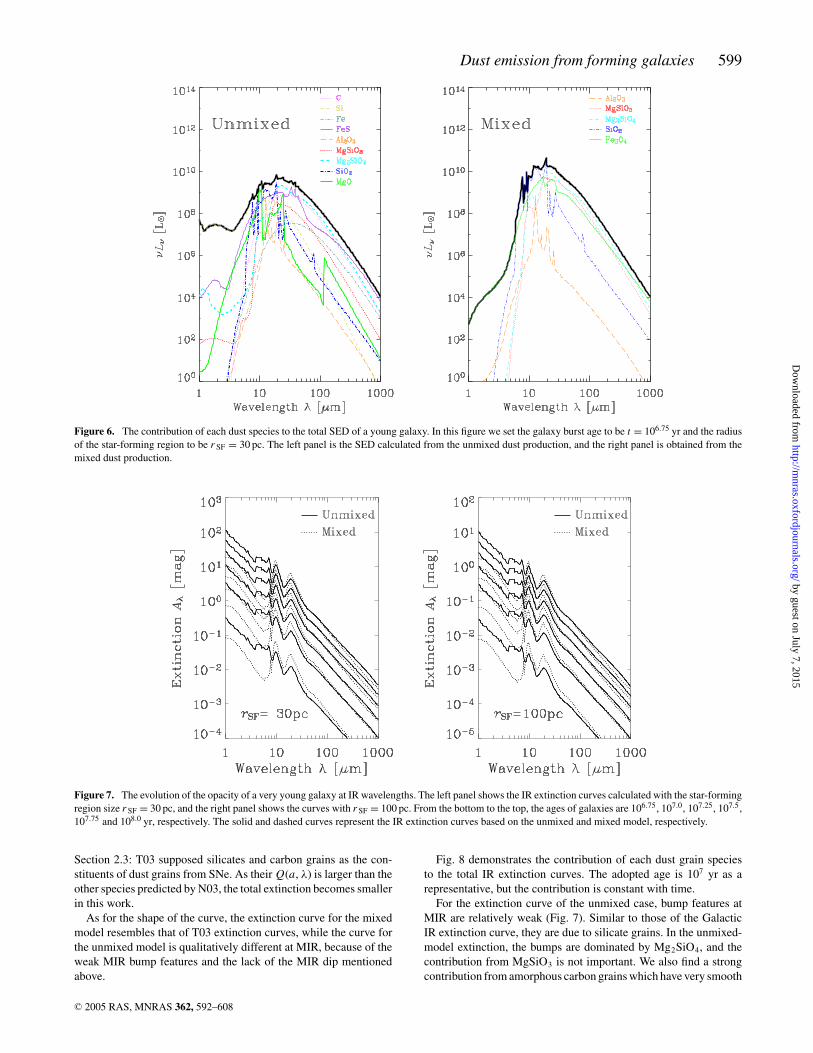
3.2 Contribution of each species to the SED
The dust species treated here are much more detailed than those ofT03. In order to see the detailed contributors to the total SEDs, weshow the individual SED of each species in Fig. 6. We show the SEDwith the age of burst 106.75 yr, where the effect of self-absorption isnegligible.
In both the unmixed and the mixed cases, the smallest dust grainspecies is Al2O3 (Fig. 1). However, because of its small fractionin mass (Fig. 2), Al2O3 contributes to the total SED very little.The main contributor to the (unextinguished) N–MIR continuumis silicon for unmixed case and Fe3O4 in mixed case, respectively.These species are the second smallest grains. For the unmixed case,as the emissivity of silicon grains with the size of ∼10−7 cm ismuch smaller than that of Fe3O4 at λ � 1 µm, the grain temperaturebecomes much higher than that of Fe3O4, which makes the verystrong N–MIR continuum emission. In contrast, as Q(a, λ) of Fe3O4
is large, the resultant SED for the mixed case does not have a strongN–MIR continuum.
At λ = 10–20 µm, several species contribute equally to theSED in unmixed case, while SiO2 play a dominant role for mixedcase. At longer wavelengths, the main contributors to the SEDare Mg2SiO4 and amorphous carbon for the unmixed case, andMgSiO3 and Mg2SiO4 in the mixed case. In addition, especially atλ � 200 µm, FeS (unmixed) and Fe3O4 (mixed) are also important
C© 2005 RAS, MNRAS 362, 592–608
by guest on July 7, 2015http://m
nras.oxfordjournals.org/D
ownloaded from
Dust emission from forming galaxies 597
Figure 3. Extinction efficiency Q(a, λ) for the grain species produced by the SN model of Nozawa et al. (2003). We show Q(a, λ) for the radius a = 10−7,10−6, 10−5 and 10−4 cm by the curves from bottom to top in each panel.
because of their shallow slope of the extinction efficiency at thelonger wavelength regime. Note that, for the mixed case, Fe3O4
contribute to both NIR and FIR.
3.3 Opacity and its evolution
The extinction curve Aλ is obtained as
Aλ = 1.086τdust(λ). (2)
In this work we concentrate on the extinction curve in the IR. De-tailed discussions of the extinction curves in the optical wavelengthregime are given in Hirashita et al. (2005).2
2 As we assume a very simple geometry, the extinction curve is directlyrelated to the ‘attenuation curve’, in which the geometrical effect is alsoincluded (for a thorough discussion on this subject, see, e.g. Inoue 2005).
C© 2005 RAS, MNRAS 362, 592–608
by guest on July 7, 2015http://m
nras.oxfordjournals.org/D
ownloaded from
598 T. T. Takeuchi et al.
Figure 4. The evolution of the IR SED of a very young galaxy. The size of the star-forming region, rSF, is 30 pc. Solid and dotted lines represent the SEDsbased on the unmixed and mixed model of dust production (Nozawa et al. 2003), respectively. For Figs 4 and 5, a constant SFR of SFR = 1 M� yr−1 is adopted.
Figure 5. Same as Fig. 4, but the size of the star-forming region, rSF, is 100 pc.
Fig. 7 presents the evolution of the IR opacity for a young galaxywith the age of 106.75–108 yr (from the bottom to the top). In thecase of rSF = 30 pc, the extinction becomes almost unity at 10 µmwhen the age is 107.25 yr. Hence, after this age, the N–MIR regimeof the SED becomes optically thick, and this makes the continuumextinguished in Fig. 4. On the other hand, for rSF = 100 pc, it remainsoptically thin even at the age of 108 yr at 10 µm.
In Fig. 7, we find an interesting difference between the extinctioncurves of the unmixed and mixed cases. Though their behaviour is
similar to each other at wavelengths λ � 10 µm, there is no dip atλ � 10 µm in the curve of the unmixed case. This makes the extinc-tion stronger for the unmixed-case galaxies at N–MIR. In addition,the MIR bumps at 10 and 20 µm are less prominent for the unmixedcase.
Comparing these IR extinction curves with the T03 model, wefind that the amount of the extinction is smaller than that of T03 bya factor of 2–10, depending on the wavelength and unmixed/mixedproduction. This is explained by the discussion presented in
C© 2005 RAS, MNRAS 362, 592–608
by guest on July 7, 2015http://m
nras.oxfordjournals.org/D
ownloaded from
Dust emission from forming galaxies 599
Figure 6. The contribution of each dust species to the total SED of a young galaxy. In this figure we set the galaxy burst age to be t = 106.75 yr and the radiusof the star-forming region to be r SF = 30 pc. The left panel is the SED calculated from the unmixed dust production, and the right panel is obtained from themixed dust production.
Figure 7. The evolution of the opacity of a very young galaxy at IR wavelengths. The left panel shows the IR extinction curves calculated with the star-formingregion size r SF = 30 pc, and the right panel shows the curves with r SF = 100 pc. From the bottom to the top, the ages of galaxies are 106.75, 107.0, 107.25, 107.5,107.75 and 108.0 yr, respectively. The solid and dashed curves represent the IR extinction curves based on the unmixed and mixed model, respectively.
Section 2.3: T03 supposed silicates and carbon grains as the con-stituents of dust grains from SNe. As their Q(a, λ) is larger than theother species predicted by N03, the total extinction becomes smallerin this work.
As for the shape of the curve, the extinction curve for the mixedmodel resembles that of T03 extinction curves, while the curve forthe unmixed model is qualitatively different at MIR, because of theweak MIR bump features and the lack of the MIR dip mentionedabove.
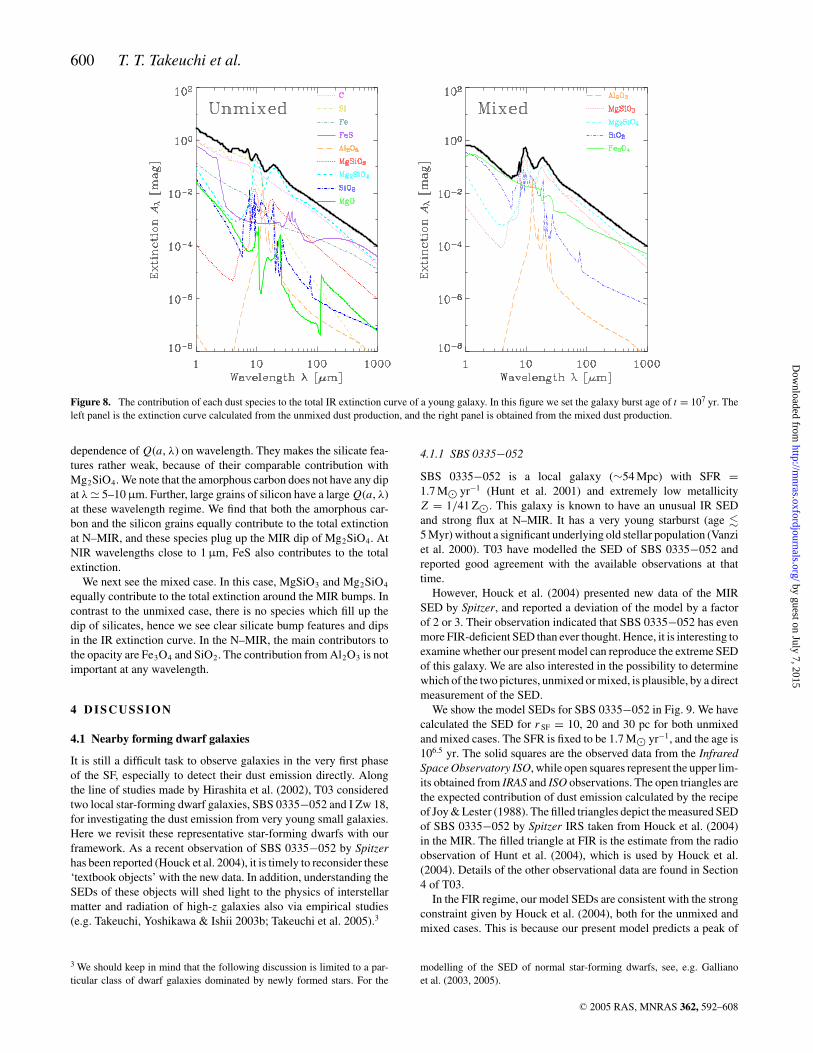
Fig. 8 demonstrates the contribution of each dust grain speciesto the total IR extinction curves. The adopted age is 107 yr as arepresentative, but the contribution is constant with time.
For the extinction curve of the unmixed case, bump features atMIR are relatively weak (Fig. 7). Similar to those of the GalacticIR extinction curve, they are due to silicate grains. In the unmixed-model extinction, the bumps are dominated by Mg2SiO4, and thecontribution from MgSiO3 is not important. We also find a strongcontribution from amorphous carbon grains which have very smooth
C© 2005 RAS, MNRAS 362, 592–608
by guest on July 7, 2015http://m
nras.oxfordjournals.org/D
ownloaded from
600 T. T. Takeuchi et al.
Figure 8. The contribution of each dust species to the total IR extinction curve of a young galaxy. In this figure we set the galaxy burst age of t = 107 yr. Theleft panel is the extinction curve calculated from the unmixed dust production, and the right panel is obtained from the mixed dust production.
dependence of Q(a, λ) on wavelength. They makes the silicate fea-tures rather weak, because of their comparable contribution withMg2SiO4. We note that the amorphous carbon does not have any dipat λ � 5–10 µm. Further, large grains of silicon have a large Q(a, λ)at these wavelength regime. We find that both the amorphous car-bon and the silicon grains equally contribute to the total extinctionat N–MIR, and these species plug up the MIR dip of Mg2SiO4. AtNIR wavelengths close to 1 µm, FeS also contributes to the totalextinction.
We next see the mixed case. In this case, MgSiO3 and Mg2SiO4
equally contribute to the total extinction around the MIR bumps. Incontrast to the unmixed case, there is no species which fill up thedip of silicates, hence we see clear silicate bump features and dipsin the IR extinction curve. In the N–MIR, the main contributors tothe opacity are Fe3O4 and SiO2. The contribution from Al2O3 is notimportant at any wavelength.
4 D I S C U S S I O N
4.1 Nearby forming dwarf galaxies
It is still a difficult task to observe galaxies in the very first phaseof the SF, especially to detect their dust emission directly. Alongthe line of studies made by Hirashita et al. (2002), T03 consideredtwo local star-forming dwarf galaxies, SBS 0335−052 and I Zw 18,for investigating the dust emission from very young small galaxies.Here we revisit these representative star-forming dwarfs with ourframework. As a recent observation of SBS 0335−052 by Spitzerhas been reported (Houck et al. 2004), it is timely to reconsider these‘textbook objects’ with the new data. In addition, understanding theSEDs of these objects will shed light to the physics of interstellarmatter and radiation of high-z galaxies also via empirical studies(e.g. Takeuchi, Yoshikawa & Ishii 2003b; Takeuchi et al. 2005).3
3 We should keep in mind that the following discussion is limited to a par-ticular class of dwarf galaxies dominated by newly formed stars. For the
4.1.1 SBS 0335−052
SBS 0335−052 is a local galaxy (∼54 Mpc) with SFR =1.7 M� yr−1 (Hunt et al. 2001) and extremely low metallicityZ = 1/41 Z�. This galaxy is known to have an unusual IR SEDand strong flux at N–MIR. It has a very young starburst (age �5 Myr) without a significant underlying old stellar population (Vanziet al. 2000). T03 have modelled the SED of SBS 0335−052 andreported good agreement with the available observations at thattime.
However, Houck et al. (2004) presented new data of the MIRSED by Spitzer, and reported a deviation of the model by a factorof 2 or 3. Their observation indicated that SBS 0335−052 has evenmore FIR-deficient SED than ever thought. Hence, it is interesting toexamine whether our present model can reproduce the extreme SEDof this galaxy. We are also interested in the possibility to determinewhich of the two pictures, unmixed or mixed, is plausible, by a directmeasurement of the SED.
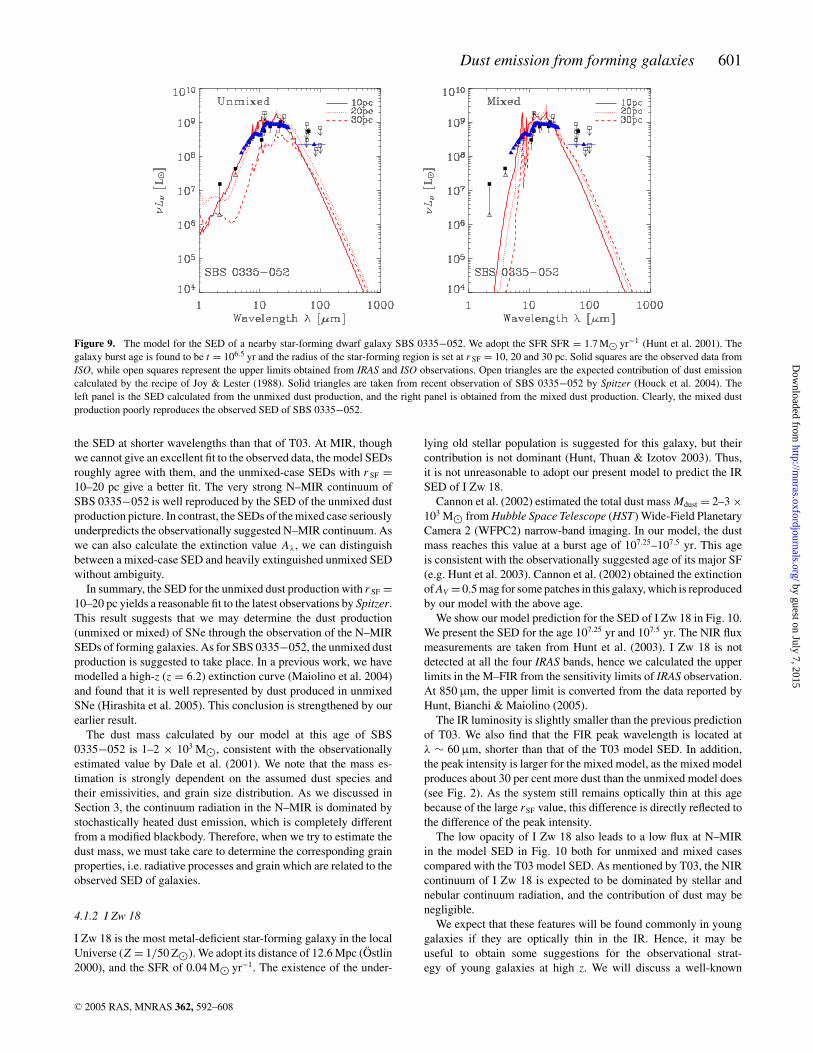
We show the model SEDs for SBS 0335−052 in Fig. 9. We havecalculated the SED for r SF = 10, 20 and 30 pc for both unmixedand mixed cases. The SFR is fixed to be 1.7 M� yr−1, and the age is106.5 yr. The solid squares are the observed data from the InfraredSpace Observatory ISO, while open squares represent the upper lim-its obtained from IRAS and ISO observations. The open triangles arethe expected contribution of dust emission calculated by the recipeof Joy & Lester (1988). The filled triangles depict the measured SEDof SBS 0335−052 by Spitzer IRS taken from Houck et al. (2004)in the MIR. The filled triangle at FIR is the estimate from the radioobservation of Hunt et al. (2004), which is used by Houck et al.(2004). Details of the other observational data are found in Section4 of T03.
In the FIR regime, our model SEDs are consistent with the strongconstraint given by Houck et al. (2004), both for the unmixed andmixed cases. This is because our present model predicts a peak of
modelling of the SED of normal star-forming dwarfs, see, e.g. Gallianoet al. (2003, 2005).
C© 2005 RAS, MNRAS 362, 592–608
by guest on July 7, 2015http://m
nras.oxfordjournals.org/D
ownloaded from
Dust emission from forming galaxies 601
Figure 9. The model for the SED of a nearby star-forming dwarf galaxy SBS 0335−052. We adopt the SFR SFR = 1.7 M� yr−1 (Hunt et al. 2001). Thegalaxy burst age is found to be t = 106.5 yr and the radius of the star-forming region is set at r SF = 10, 20 and 30 pc. Solid squares are the observed data fromISO, while open squares represent the upper limits obtained from IRAS and ISO observations. Open triangles are the expected contribution of dust emissioncalculated by the recipe of Joy & Lester (1988). Solid triangles are taken from recent observation of SBS 0335−052 by Spitzer (Houck et al. 2004). Theleft panel is the SED calculated from the unmixed dust production, and the right panel is obtained from the mixed dust production. Clearly, the mixed dustproduction poorly reproduces the observed SED of SBS 0335−052.
the SED at shorter wavelengths than that of T03. At MIR, thoughwe cannot give an excellent fit to the observed data, the model SEDsroughly agree with them, and the unmixed-case SEDs with r SF =10–20 pc give a better fit. The very strong N–MIR continuum ofSBS 0335−052 is well reproduced by the SED of the unmixed dustproduction picture. In contrast, the SEDs of the mixed case seriouslyunderpredicts the observationally suggested N–MIR continuum. Aswe can also calculate the extinction value Aλ, we can distinguishbetween a mixed-case SED and heavily extinguished unmixed SEDwithout ambiguity.
In summary, the SED for the unmixed dust production with r SF =10–20 pc yields a reasonable fit to the latest observations by Spitzer.This result suggests that we may determine the dust production(unmixed or mixed) of SNe through the observation of the N–MIRSEDs of forming galaxies. As for SBS 0335−052, the unmixed dustproduction is suggested to take place. In a previous work, we havemodelled a high-z (z = 6.2) extinction curve (Maiolino et al. 2004)and found that it is well represented by dust produced in unmixedSNe (Hirashita et al. 2005). This conclusion is strengthened by ourearlier result.
The dust mass calculated by our model at this age of SBS0335−052 is 1–2 × 10³ M�, consistent with the observationallyestimated value by Dale et al. (2001). We note that the mass es-timation is strongly dependent on the assumed dust species andtheir emissivities, and grain size distribution. As we discussed inSection 3, the continuum radiation in the N–MIR is dominated bystochastically heated dust emission, which is completely differentfrom a modified blackbody. Therefore, when we try to estimate thedust mass, we must take care to determine the corresponding grainproperties, i.e. radiative processes and grain which are related to theobserved SED of galaxies.
4.1.2 I Zw 18
I Zw 18 is the most metal-deficient star-forming galaxy in the localUniverse (Z = 1/50 Z�). We adopt its distance of 12.6 Mpc (Ostlin2000), and the SFR of 0.04 M� yr−1. The existence of the under-
lying old stellar population is suggested for this galaxy, but theircontribution is not dominant (Hunt, Thuan & Izotov 2003). Thus,it is not unreasonable to adopt our present model to predict the IRSED of I Zw 18.
Cannon et al. (2002) estimated the total dust mass Mdust = 2–3 ×10³ M� from Hubble Space Telescope (HST) Wide-Field PlanetaryCamera 2 (WFPC2) narrow-band imaging. In our model, the dustmass reaches this value at a burst age of 107.25–107.5 yr. This ageis consistent with the observationally suggested age of its major SF(e.g. Hunt et al. 2003). Cannon et al. (2002) obtained the extinctionof AV = 0.5 mag for some patches in this galaxy, which is reproducedby our model with the above age.
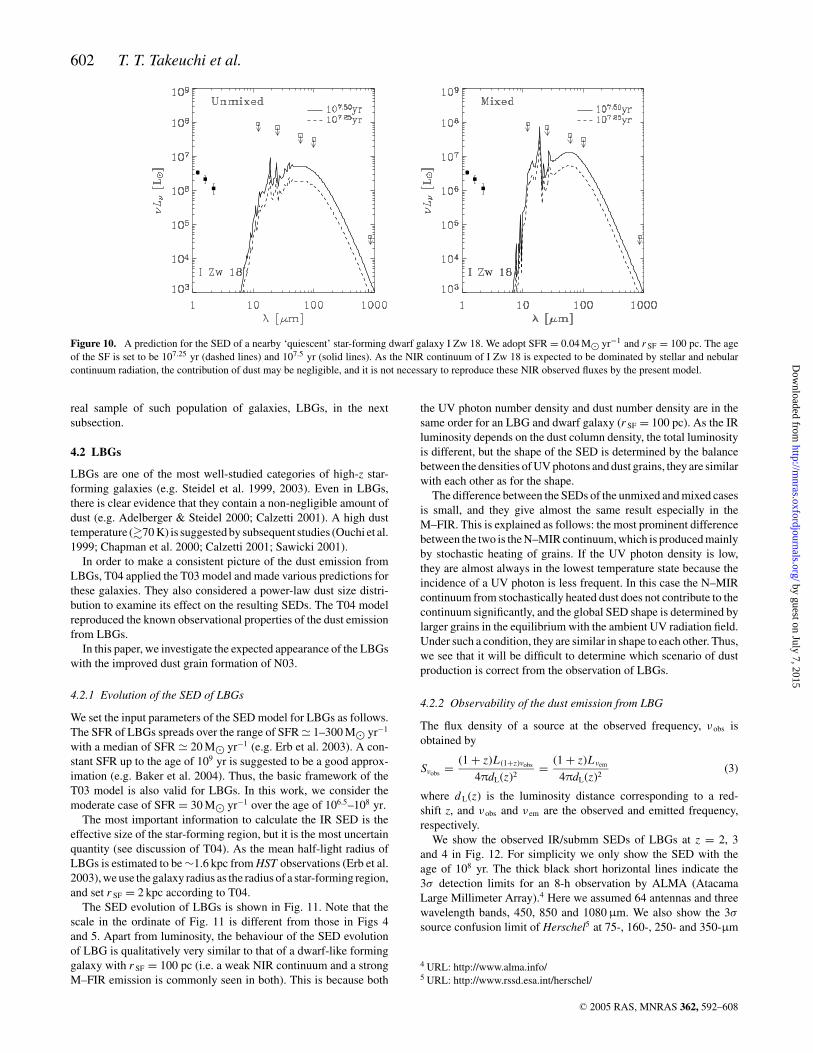
We show our model prediction for the SED of I Zw 18 in Fig. 10.We present the SED for the age 107.25 yr and 107.5 yr. The NIR fluxmeasurements are taken from Hunt et al. (2003). I Zw 18 is notdetected at all the four IRAS bands, hence we calculated the upperlimits in the M–FIR from the sensitivity limits of IRAS observation.At 850 µm, the upper limit is converted from the data reported byHunt, Bianchi & Maiolino (2005).
The IR luminosity is slightly smaller than the previous predictionof T03. We also find that the FIR peak wavelength is located atλ ∼ 60 µm, shorter than that of the T03 model SED. In addition,the peak intensity is larger for the mixed model, as the mixed modelproduces about 30 per cent more dust than the unmixed model does(see Fig. 2). As the system still remains optically thin at this agebecause of the large rSF value, this difference is directly reflected tothe difference of the peak intensity.
The low opacity of I Zw 18 also leads to a low flux at N–MIRin the model SED in Fig. 10 both for unmixed and mixed casescompared with the T03 model SED. As mentioned by T03, the NIRcontinuum of I Zw 18 is expected to be dominated by stellar andnebular continuum radiation, and the contribution of dust may benegligible.
We expect that these features will be found commonly in younggalaxies if they are optically thin in the IR. Hence, it may beuseful to obtain some suggestions for the observational strat-egy of young galaxies at high z. We will discuss a well-known
C© 2005 RAS, MNRAS 362, 592–608
by guest on July 7, 2015http://m
nras.oxfordjournals.org/D
ownloaded from
602 T. T. Takeuchi et al.
Figure 10. A prediction for the SED of a nearby ‘quiescent’ star-forming dwarf galaxy I Zw 18. We adopt SFR = 0.04 M� yr−1 and r SF = 100 pc. The ageof the SF is set to be 107.25 yr (dashed lines) and 107.5 yr (solid lines). As the NIR continuum of I Zw 18 is expected to be dominated by stellar and nebularcontinuum radiation, the contribution of dust may be negligible, and it is not necessary to reproduce these NIR observed fluxes by the present model.
real sample of such population of galaxies, LBGs, in the nextsubsection.
4.2 LBGs
LBGs are one of the most well-studied categories of high-z star-forming galaxies (e.g. Steidel et al. 1999, 2003). Even in LBGs,there is clear evidence that they contain a non-negligible amount ofdust (e.g. Adelberger & Steidel 2000; Calzetti 2001). A high dusttemperature (�70 K) is suggested by subsequent studies (Ouchi et al.1999; Chapman et al. 2000; Calzetti 2001; Sawicki 2001).
In order to make a consistent picture of the dust emission fromLBGs, T04 applied the T03 model and made various predictions forthese galaxies. They also considered a power-law dust size distri-bution to examine its effect on the resulting SEDs. The T04 modelreproduced the known observational properties of the dust emissionfrom LBGs.
In this paper, we investigate the expected appearance of the LBGswith the improved dust grain formation of N03.
4.2.1 Evolution of the SED of LBGs
We set the input parameters of the SED model for LBGs as follows.The SFR of LBGs spreads over the range of SFR � 1–300 M� yr−1
with a median of SFR � 20 M� yr−1 (e.g. Erb et al. 2003). A con-stant SFR up to the age of 109 yr is suggested to be a good approx-imation (e.g. Baker et al. 2004). Thus, the basic framework of theT03 model is also valid for LBGs. In this work, we consider themoderate case of SFR = 30 M� yr−1 over the age of 106.5–108 yr.
The most important information to calculate the IR SED is theeffective size of the star-forming region, but it is the most uncertainquantity (see discussion of T04). As the mean half-light radius ofLBGs is estimated to be ∼1.6 kpc from HST observations (Erb et al.2003), we use the galaxy radius as the radius of a star-forming region,and set r SF = 2 kpc according to T04.
The SED evolution of LBGs is shown in Fig. 11. Note that thescale in the ordinate of Fig. 11 is different from those in Figs 4and 5. Apart from luminosity, the behaviour of the SED evolutionof LBG is qualitatively very similar to that of a dwarf-like forminggalaxy with r SF = 100 pc (i.e. a weak NIR continuum and a strongM–FIR emission is commonly seen in both). This is because both
the UV photon number density and dust number density are in thesame order for an LBG and dwarf galaxy (r SF = 100 pc). As the IRluminosity depends on the dust column density, the total luminosityis different, but the shape of the SED is determined by the balancebetween the densities of UV photons and dust grains, they are similarwith each other as for the shape.
The difference between the SEDs of the unmixed and mixed casesis small, and they give almost the same result especially in theM–FIR. This is explained as follows: the most prominent differencebetween the two is the N–MIR continuum, which is produced mainlyby stochastic heating of grains. If the UV photon density is low,they are almost always in the lowest temperature state because theincidence of a UV photon is less frequent. In this case the N–MIRcontinuum from stochastically heated dust does not contribute to thecontinuum significantly, and the global SED shape is determined bylarger grains in the equilibrium with the ambient UV radiation field.Under such a condition, they are similar in shape to each other. Thus,we see that it will be difficult to determine which scenario of dustproduction is correct from the observation of LBGs.
4.2.2 Observability of the dust emission from LBG
The flux density of a source at the observed frequency, ν obs isobtained by
Sνobs = (1 + z)L (1+z)νobs
4πdL(z)2= (1 + z)Lνem
4πdL(z)2(3)
where d L(z) is the luminosity distance corresponding to a red-shift z, and ν obs and ν em are the observed and emitted frequency,respectively.
We show the observed IR/submm SEDs of LBGs at z = 2, 3and 4 in Fig. 12. For simplicity we only show the SED with theage of 108 yr. The thick black short horizontal lines indicate the3σ detection limits for an 8-h observation by ALMA (AtacamaLarge Millimeter Array).4 Here we assumed 64 antennas and threewavelength bands, 450, 850 and 1080 µm. We also show the 3σ
source confusion limit of Herschel5 at 75-, 160-, 250- and 350-µm
4 URL: http://www.alma.info/5 URL: http://www.rssd.esa.int/herschel/
C© 2005 RAS, MNRAS 362, 592–608
by guest on July 7, 2015http://m
nras.oxfordjournals.org/D
ownloaded from
Dust emission from forming galaxies 603
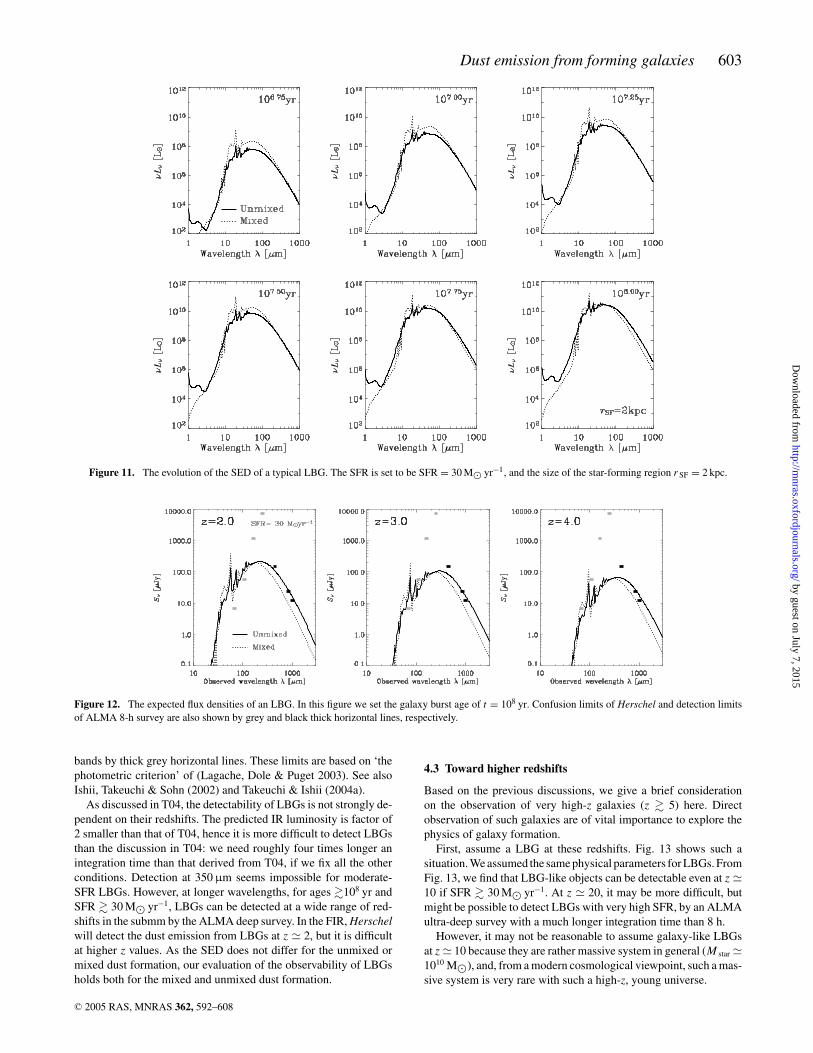
Figure 11. The evolution of the SED of a typical LBG. The SFR is set to be SFR = 30 M� yr−1, and the size of the star-forming region r SF = 2 kpc.
Figure 12. The expected flux densities of an LBG. In this figure we set the galaxy burst age of t = 108 yr. Confusion limits of Herschel and detection limitsof ALMA 8-h survey are also shown by grey and black thick horizontal lines, respectively.
bands by thick grey horizontal lines. These limits are based on ‘thephotometric criterion’ of (Lagache, Dole & Puget 2003). See alsoIshii, Takeuchi & Sohn (2002) and Takeuchi & Ishii (2004a).
As discussed in T04, the detectability of LBGs is not strongly de-pendent on their redshifts. The predicted IR luminosity is factor of2 smaller than that of T04, hence it is more difficult to detect LBGsthan the discussion in T04: we need roughly four times longer anintegration time than that derived from T04, if we fix all the otherconditions. Detection at 350 µm seems impossible for moderate-SFR LBGs. However, at longer wavelengths, for ages �108 yr andSFR � 30 M� yr−1, LBGs can be detected at a wide range of red-shifts in the submm by the ALMA deep survey. In the FIR, Herschelwill detect the dust emission from LBGs at z � 2, but it is difficultat higher z values. As the SED does not differ for the unmixed ormixed dust formation, our evaluation of the observability of LBGsholds both for the mixed and unmixed dust formation.
4.3 Toward higher redshifts
Based on the previous discussions, we give a brief considerationon the observation of very high-z galaxies (z � 5) here. Directobservation of such galaxies are of vital importance to explore thephysics of galaxy formation.
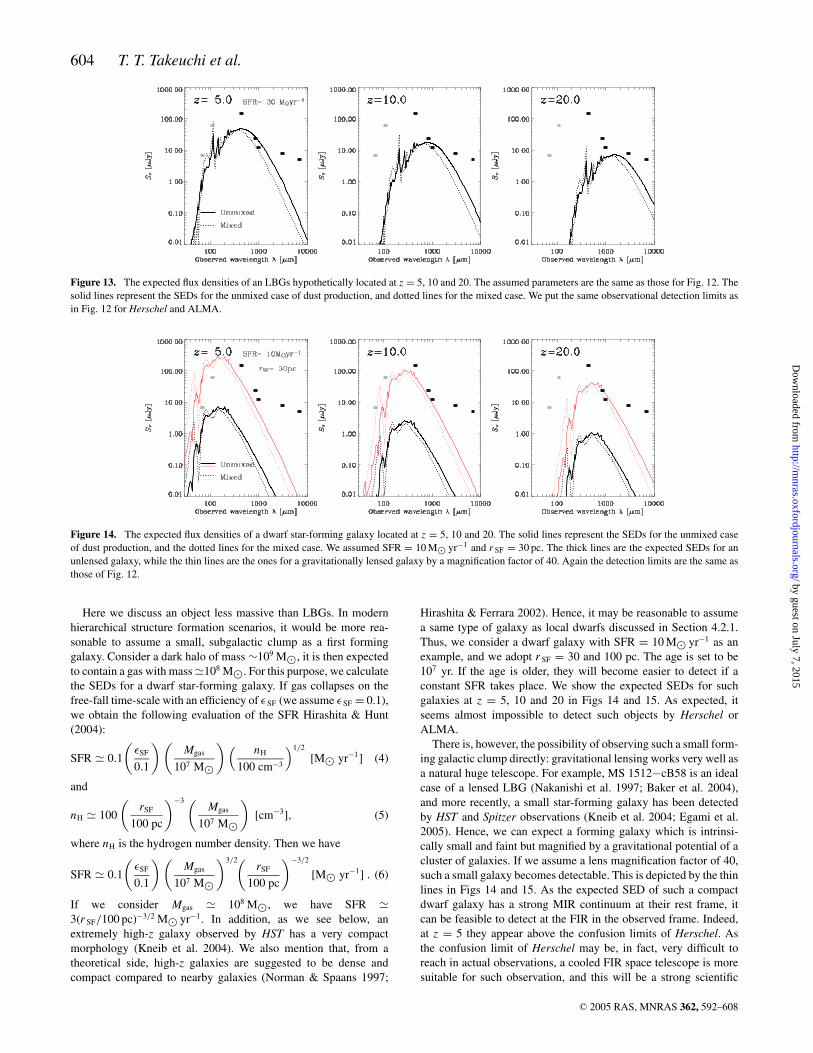
First, assume a LBG at these redshifts. Fig. 13 shows such asituation. We assumed the same physical parameters for LBGs. FromFig. 13, we find that LBG-like objects can be detectable even at z �10 if SFR � 30 M� yr−1. At z � 20, it may be more difficult, butmight be possible to detect LBGs with very high SFR, by an ALMAultra-deep survey with a much longer integration time than 8 h.
However, it may not be reasonable to assume galaxy-like LBGsat z � 10 because they are rather massive system in general (M star �1010 M�), and, from a modern cosmological viewpoint, such a mas-sive system is very rare with such a high-z, young universe.
C© 2005 RAS, MNRAS 362, 592–608
by guest on July 7, 2015http://m
nras.oxfordjournals.org/D
ownloaded from
604 T. T. Takeuchi et al.
Figure 13. The expected flux densities of an LBGs hypothetically located at z = 5, 10 and 20. The assumed parameters are the same as those for Fig. 12. Thesolid lines represent the SEDs for the unmixed case of dust production, and dotted lines for the mixed case. We put the same observational detection limits asin Fig. 12 for Herschel and ALMA.
Figure 14. The expected flux densities of a dwarf star-forming galaxy located at z = 5, 10 and 20. The solid lines represent the SEDs for the unmixed caseof dust production, and the dotted lines for the mixed case. We assumed SFR = 10 M� yr−1 and r SF = 30 pc. The thick lines are the expected SEDs for anunlensed galaxy, while the thin lines are the ones for a gravitationally lensed galaxy by a magnification factor of 40. Again the detection limits are the same asthose of Fig. 12.
Here we discuss an object less massive than LBGs. In modernhierarchical structure formation scenarios, it would be more rea-sonable to assume a small, subgalactic clump as a first forminggalaxy. Consider a dark halo of mass ∼109 M�, it is then expectedto contain a gas with mass �108 M�. For this purpose, we calculatethe SEDs for a dwarf star-forming galaxy. If gas collapses on thefree-fall time-scale with an efficiency of εSF (we assume εSF = 0.1),we obtain the following evaluation of the SFR Hirashita & Hunt(2004):
SFR � 0.1
(εSF
0.1
)(Mgas
107 M�
)( nH
100 cm−3
)1/2
[M� yr−1] (4)
and
nH � 100
(rSF
100 pc
)−3 (Mgas
107 M�
)[cm−3], (5)
where nH is the hydrogen number density. Then we have
SFR � 0.1
(εSF
0.1
)(Mgas
107 M�
)3/2(rSF
100 pc
)−3/2
[M� yr−1] . (6)
If we consider Mgas � 108 M�, we have SFR �3(r SF/100 pc)−3/2 M� yr−1. In addition, as we see below, anextremely high-z galaxy observed by HST has a very compactmorphology (Kneib et al. 2004). We also mention that, from atheoretical side, high-z galaxies are suggested to be dense andcompact compared to nearby galaxies (Norman & Spaans 1997;
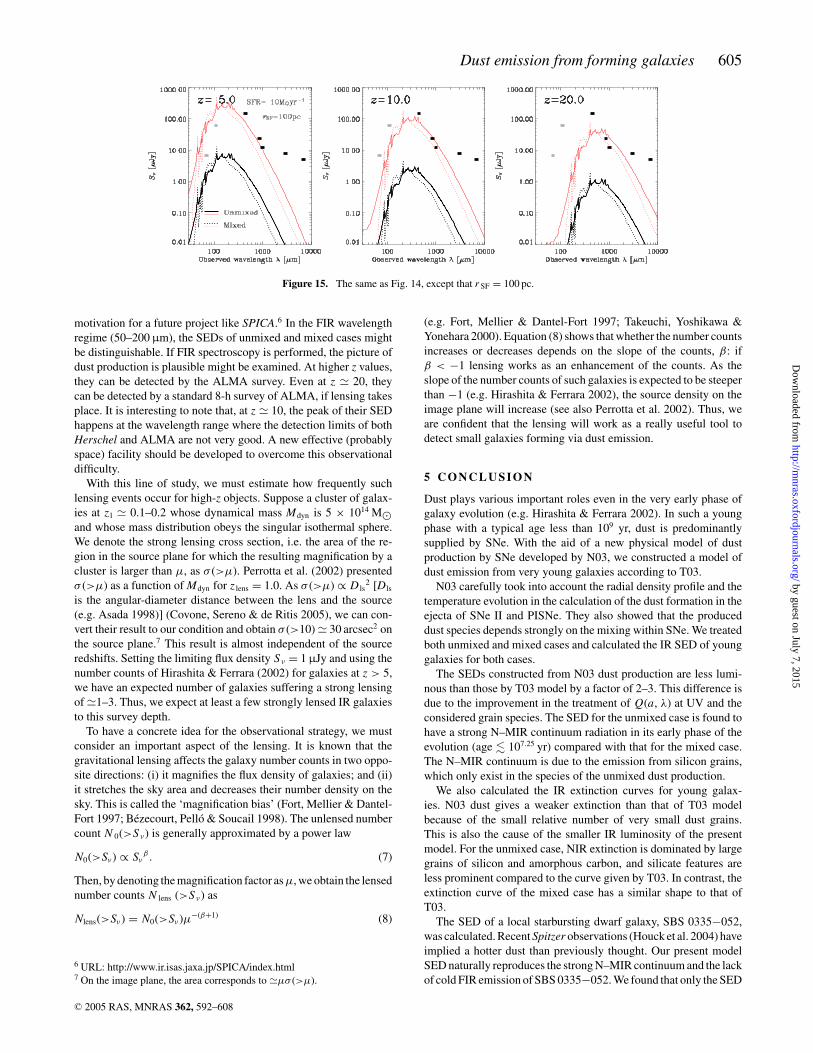
Hirashita & Ferrara 2002). Hence, it may be reasonable to assumea same type of galaxy as local dwarfs discussed in Section 4.2.1.Thus, we consider a dwarf galaxy with SFR = 10 M� yr−1 as anexample, and we adopt r SF = 30 and 100 pc. The age is set to be107 yr. If the age is older, they will become easier to detect if aconstant SFR takes place. We show the expected SEDs for suchgalaxies at z = 5, 10 and 20 in Figs 14 and 15. As expected, itseems almost impossible to detect such objects by Herschel orALMA.
There is, however, the possibility of observing such a small form-ing galactic clump directly: gravitational lensing works very well asa natural huge telescope. For example, MS 1512−cB58 is an idealcase of a lensed LBG (Nakanishi et al. 1997; Baker et al. 2004),and more recently, a small star-forming galaxy has been detectedby HST and Spitzer observations (Kneib et al. 2004; Egami et al.2005). Hence, we can expect a forming galaxy which is intrinsi-cally small and faint but magnified by a gravitational potential of acluster of galaxies. If we assume a lens magnification factor of 40,such a small galaxy becomes detectable. This is depicted by the thinlines in Figs 14 and 15. As the expected SED of such a compactdwarf galaxy has a strong MIR continuum at their rest frame, itcan be feasible to detect at the FIR in the observed frame. Indeed,at z = 5 they appear above the confusion limits of Herschel. Asthe confusion limit of Herschel may be, in fact, very difficult toreach in actual observations, a cooled FIR space telescope is moresuitable for such observation, and this will be a strong scientific
C© 2005 RAS, MNRAS 362, 592–608
by guest on July 7, 2015http://m
nras.oxfordjournals.org/D
ownloaded from
Dust emission from forming galaxies 605
Figure 15. The same as Fig. 14, except that r SF = 100 pc.
motivation for a future project like SPICA.6 In the FIR wavelengthregime (50–200 µm), the SEDs of unmixed and mixed cases mightbe distinguishable. If FIR spectroscopy is performed, the picture ofdust production is plausible might be examined. At higher z values,they can be detected by the ALMA survey. Even at z � 20, theycan be detected by a standard 8-h survey of ALMA, if lensing takesplace. It is interesting to note that, at z � 10, the peak of their SEDhappens at the wavelength range where the detection limits of bothHerschel and ALMA are not very good. A new effective (probablyspace) facility should be developed to overcome this observationaldifficulty.
With this line of study, we must estimate how frequently suchlensing events occur for high-z objects. Suppose a cluster of galax-ies at z l � 0.1–0.2 whose dynamical mass Mdyn is 5 × 10¹⁴ M�and whose mass distribution obeys the singular isothermal sphere.We denote the strong lensing cross section, i.e. the area of the re-gion in the source plane for which the resulting magnification by acluster is larger than µ, as σ (>µ). Perrotta et al. (2002) presentedσ (>µ) as a function of Mdyn for z lens = 1.0. As σ (>µ) ∝ D ls
2 [Dls
is the angular-diameter distance between the lens and the source(e.g. Asada 1998)] (Covone, Sereno & de Ritis 2005), we can con-vert their result to our condition and obtain σ (>10) � 30 arcsec2 onthe source plane.7 This result is almost independent of the sourceredshifts. Setting the limiting flux density Sν = 1 µJy and using thenumber counts of Hirashita & Ferrara (2002) for galaxies at z > 5,we have an expected number of galaxies suffering a strong lensingof �1–3. Thus, we expect at least a few strongly lensed IR galaxiesto this survey depth.
To have a concrete idea for the observational strategy, we mustconsider an important aspect of the lensing. It is known that thegravitational lensing affects the galaxy number counts in two oppo-site directions: (i) it magnifies the flux density of galaxies; and (ii)it stretches the sky area and decreases their number density on thesky. This is called the ‘magnification bias’ (Fort, Mellier & Dantel-Fort 1997; Bezecourt, Pello & Soucail 1998). The unlensed numbercount N 0(>Sν) is generally approximated by a power law
N0(>Sν) ∝ Sνβ . (7)
Then, by denoting the magnification factor as µ, we obtain the lensednumber counts N lens (>Sν) as
Nlens(>Sν) = N0(>Sν)µ−(β+1) (8)
6 URL: http://www.ir.isas.jaxa.jp/SPICA/index.html7 On the image plane, the area corresponds to �µσ (>µ).
(e.g. Fort, Mellier & Dantel-Fort 1997; Takeuchi, Yoshikawa &Yonehara 2000). Equation (8) shows that whether the number countsincreases or decreases depends on the slope of the counts, β: ifβ < −1 lensing works as an enhancement of the counts. As theslope of the number counts of such galaxies is expected to be steeperthan −1 (e.g. Hirashita & Ferrara 2002), the source density on theimage plane will increase (see also Perrotta et al. 2002). Thus, weare confident that the lensing will work as a really useful tool todetect small galaxies forming via dust emission.
5 C O N C L U S I O N
Dust plays various important roles even in the very early phase ofgalaxy evolution (e.g. Hirashita & Ferrara 2002). In such a youngphase with a typical age less than 109 yr, dust is predominantlysupplied by SNe. With the aid of a new physical model of dustproduction by SNe developed by N03, we constructed a model ofdust emission from very young galaxies according to T03.
N03 carefully took into account the radial density profile and thetemperature evolution in the calculation of the dust formation in theejecta of SNe II and PISNe. They also showed that the produceddust species depends strongly on the mixing within SNe. We treatedboth unmixed and mixed cases and calculated the IR SED of younggalaxies for both cases.
The SEDs constructed from N03 dust production are less lumi-nous than those by T03 model by a factor of 2–3. This difference isdue to the improvement in the treatment of Q(a, λ) at UV and theconsidered grain species. The SED for the unmixed case is found tohave a strong N–MIR continuum radiation in its early phase of theevolution (age � 107.25 yr) compared with that for the mixed case.The N–MIR continuum is due to the emission from silicon grains,which only exist in the species of the unmixed dust production.
We also calculated the IR extinction curves for young galax-ies. N03 dust gives a weaker extinction than that of T03 modelbecause of the small relative number of very small dust grains.This is also the cause of the smaller IR luminosity of the presentmodel. For the unmixed case, NIR extinction is dominated by largegrains of silicon and amorphous carbon, and silicate features areless prominent compared to the curve given by T03. In contrast, theextinction curve of the mixed case has a similar shape to that ofT03.
The SED of a local starbursting dwarf galaxy, SBS 0335−052,was calculated. Recent Spitzer observations (Houck et al. 2004) haveimplied a hotter dust than previously thought. Our present modelSED naturally reproduces the strong N–MIR continuum and the lackof cold FIR emission of SBS 0335−052. We found that only the SED
C© 2005 RAS, MNRAS 362, 592–608
by guest on July 7, 2015http://m
nras.oxfordjournals.org/D
ownloaded from
606 T. T. Takeuchi et al.
of the unmixed case can reproduce the N–MIR continuum of thisgalaxy. Hence, as for SBS 0335−052, the unmixed dust productionis preferred. It will be interesting to proceed this line of study forhigher-z galaxies.
A prediction for the SED of another typical nearby star-formingdwarf galaxy, I Zw 18, was then made. As I Zw 18 is dominatedby very young SF, we may adopt the model to this galaxy. Usingthe dust species from N03 with this model, we find a weaker FIRemission than that of T03. The N–MIR continuum is also expectedto be much weaker than that of T03 SED.
We also calculated the evolution of the SED of LBGs. For theparameters of LBGs, the unmixed and mixed picture does not affectthe appearance of the SED. Hence, if we combine our model withthe knowledge obtained from optical observations, the observabilityof LBGs at submm wavelengths are robust enough independent ofthe details of the SNe dust production theory.
Finally, we considered the observations of forming galaxies atz � 5. If there exist LBG-like galaxies at these redshifts, they can bedetected at z � 10 by the ALMA 8-h survey if SFR � 30 M� yr−1.For small forming galaxies or subgalactic clumps, it is almost im-possible to detect their intrinsic flux by ALMA or by Herschel.However, the gravitational lensing is found to be a very effectivetool to detect such small star-forming galaxies at z � 5. If we con-sider a compact dwarf galaxy with SFR � 10 M� yr−1 and r SF �30 pc, we can expect a few strongly magnified galaxies behind atypical cluster of galaxies at z � 0.1–0.2.
AC K N OW L E D G M E N T S
First we are grateful to the anonymous referee for many insightfulcomments which have improved the clarity of this paper so much.We deeply thank Akio K. Inoue, Jean-Paul Kneib and GiovanniCovone for illuminating discussions. We made extensive use of theNASA Astrophysics Data System. TTT, TTI and HH have beensupported by the Japan Society of the Promotion of Science. TKis supported by a Grant-in-Aid for Scientific Research from JSPS(16340051).
R E F E R E N C E S
Adelberger K. L., Steidel C. C., 2000, ApJ, 544, 218Arendt R. G., Dwek E., Moseley S. H., 1999, ApJ, 521, 234Arnett W. D., Bahcall J. N., Kirshner R. P., Woosley S. E., 1989, ARA&A,
27, 629Asada H., 1998, ApJ, 501, 473Baker A. J., Tacconi L. J., Genzel R., Lehnert M. D., Lutz D., 2004, ApJ,
604, 125Begemann B., Dorschner J., Henning T., Mutschke H., Thamm E., 1994,
ApJ, 423, L71Bertoldi F., Carilli C. L., Cox P., Fan X., Strauss M. A., Beelen A., Omont
A., Zylka R., 2003, A&A, 406, L55Bezecourt J., Pello R., Soucail G., 1998, A&A, 330, 399Bohren C. F., Huffman D. R., 1983, Absorption and Scattering of Light by
Small Particles. Wiley, New YorkBouwens R. J. et al., 2004a, ApJ, 606, L25Bouwens R. J. et al., 2004b, ApJ, 616, L79Calzetti D., 2001, PASP, 113, 1449Calzetti D., Armus L., Bohlin R. C., Kinney A. L., Koornneef J., Storchi-
Bergmann T., 2000, ApJ, 533, 682Cannon J. M., Skillman E. D., Garnett D. R., Dufour R. J., 2002, ApJ, 565,
931Chapman S. C. et al., 2000, MNRAS, 319, 318Covone G., Sereno M., de Ritis R., 2005, MNRAS, 357, 773
Dale D. A., Helou G., Neugebauer G., Soifer B. T., Frayer D. T., Condon J. J.,2001, AJ, 122, 1736
Dorschner J., Begemann B., Henning Th., Jaeger C., Mutschke H., 1995,A&A, 300, 503
Douvion T., Lagage P. O., Cesarsky C. J., Dwek E., 2001, A&A, 373, 281Draine B. T., Anderson L., 1985, ApJ, 292, 494Draine B. T., Lee H. M., 1984, ApJ, 285, 89Draine B. T., Li A., 2001, ApJ, 551, 807Dunne L., Eales S., Ivison R., Morgan H., Edmunds M., 2003, Nat, 424,
285Dwek E., 1998, ApJ, 501, 643Dwek E., 2004, ApJ, 607, 848Dwek E., Scalo J. M., 1980, ApJ, 239, 193Eales S., Bertoldi F., Ivison R., Carilli C., Dunne L., Owen F., 2003, MNRAS,
344, 169Edo O., 1983, PhD thesis, Univ. ArizonaEdward D. F., 1985, in Palik E. D., ed., Handbook of Optical Constants of
Solids. Academic Press, San Diego, p. 547Egami E. et al., 2005, ApJ, 618, L5Erb D. K., Shapley A. E., Steidel C. C., Pettini M., Adelberger K. L., Hunt
M. P., Moorwood A. F. M., Cuby J.-G., 2003, ApJ, 591, 101Feder J., Russell K. C., Lothe J., Pound M., 1966, Adv. Phys., 15, 111Fort B., Mellier Y., Dantel-Fort M., 1997, A&A, 321, 353Gail H.-P., Sedlmayr E., 1979, A&A, 77, 165Gail H.-P., Keller R., Sedlmayr E., 1984, A&A, 133, 320Galliano F., Madden S. C., Jones A. P., Wilson C. D., Bernard J.-P., Le
Peintre F., 2003, A&A, 407, 159Galliano F., Madden S. C., Jones A. P., Wilson C. D., Bernard J.-P., 2005,
A&A, 434, 867Green D. A., Tuffs R. J., Popescu C. C., 2004, MNRAS, 355, 1315Grønvold F., Stølen S., Labban A. K., Westrum E. F., Jr, 1991, J. Chem.
Thermodyn., 23, 261Hama J., Suito K., 1999, Phys. Earth Planet. Interiors, 114, 165Heger A., Woosley S. E., 2002, ApJ, 567, 532Hines D. C. et al., 2004, ApJS, 154, 290Hirashita H., Ferrara A., 2002, MNRAS, 337, 921Hirashita H., Hunt L. K., 2004, A&A, 421, 555Hirashita H., Hunt L. K., Ferrara A., 2002, MNRAS, 330, L19Hirashita H., Nozawa T., Kozasa T., Ishii T. T., Takeuchi T. T., 2005,
MNRAS, 357, 1077Houck J. R. et al., 2004, ApJS, 154, 211Hughes D. H. et al., 1998, Nat, 394, 241Hunt L. K., Vanzi L., Thuan T. X., 2001, ApJ, 377, 66Hunt L. K., Giovanardi C., Helou G., 2002, A&A, 394, 873Hunt L. K., Thuan T. X., Izotov Y. I., 2003, ApJ, 2003,588, 281Hunt L. K., Dyer K. K., Thuan T. X., Ulvestad J. S., 2004, ApJ, 606,
853Hunt L. K., Bianchi S., Maiolino R., 2005, A&A, 434, 849Inoue A. K., 2005, MNRAS, 359, 171Inoue A. K., Hirashita H., Kamaya H., 2000, PASJ, 52, 539Ishii T. T., Takeuchi T. T., Sohn J.-J., 2002, in Giard M. et al., eds, In-
frared and Submillimeter Space Astronomy: An International Collo-quium to Honor the Memory of Guy Serra., EDP Sciences, Les Wis,p. 169
Jager C., Dorschner J., Mutschke H., Posch Th., Henning Th., 2003, A&A,408, 193
Jones A. P., Tielens A. G. G. M., Hollenbach D. J., 1996, ApJ, 469, 740Joy M., Lester D. F., 1988, ApJ, 331, 1451Kneib J., Ellis R. S., Santos M. R., Richard J., 2004, ApJ, 607, 697Krause O., Birkmann S. M., Rieke G. H., Lemke D., Klaas U., Hines D. C.,
Gordon K. D., 2004, Nat, 432, 596Kozasa T., Hasegawa H., 1987, Prog. Theor. Phys., 77, 1402Kozasa T., Hasegawa H., Nomoto K., 1989, ApJ, 344, 325Krugel E., 2003, The Physics of Interstellar Dust. IOP Publishing, BristolLagache G., Dole H., Puget J.-L., 2003, MNRAS, 338, 555Ledoux C., Bergeron J., Petitjean P., 2002, A&A, 385, 802Ledoux C., Petitjean P., Srianand R., 2003, MNRAS, 346, 209Lilly S. J., Le Fevre O., Hammer F., Crampton D., 1996, ApJ, 460, L1
C© 2005 RAS, MNRAS 362, 592–608
by guest on July 7, 2015http://m
nras.oxfordjournals.org/D
ownloaded from
Dust emission from forming galaxies 607
Lynch D. W., Hunter W. R., 1991, in Palik E. D., ed., Handbook of OpticalConstants of Solids II. Academic Press, San Diego, p. 388
Madau P., Ferguson H. C., Dickinson M. E., Giavalisco M., Steidel C. C.,Fruchter A., 1996, MNRAS, 283, 1388
Maiolino R., Schneider R., Oliva E., Bianchi S., Ferrara A., Mannucci F.,Pedani M., Roca Sogorb M., 2004, Nat, 431, 533
Mezzasalma S. A., 2000, J. Phys. Chem. Solids, 61, 593Morgan H. L., Edmunds M. G., 2003, MNRAS, 343, 427Morgan H. L., Dunne L., Eales S. A., Ivison R. J., Edmunds M. G., 2003,
ApJ, 597, L33Mukai T., 1989, in Bonetti A., Greenberg J. M., Aiello S., eds, Evolution
of Interstellar Dust and Related Topics. Elsevier Science, Amsterdam,p. 397
Nakanishi K., Ohta K., Takeuchi T. T., Akiyama M., Yamada T., Shioya Y.,1997, PASJ, 49, 535
Norman C. A., Spaans M., 1997, ApJ, 480, 145Nozawa T., Kozasa T., Umeda H., Maeda K., Nomoto K., 2003, ApJ, 598,
785 (N03)Oganov A. R., Brodholt J. P., Price G. D., 2000, Phys. Earth Planet. Interiors,
122, 277Ostlin G., 2000, ApJ, 535, L99Ouchi M., Yamada T., Kawai H., Ohta K., 1999, ApJ, 517, L19Perrotta F., Baccigalupi C., Bartelmann M., De Zotti G., Granato G. L., 2002,
MNRAS, 329, 445Philipp H. R., 1985, in Palik E. D., ed., Handbook of Optical Constants of
Solids. Academic Press, San Diego, p. 719Plante S., Sauvage M., 2002, AJ, 124, 1995Roessler D. M., Huffman D. R., 1991, in Palik E. D., ed., Handbook of
Optical Constants of Solids II. Academic Press, San Diego, p. 919Salpeter E., 1955, ApJ, 121, 161Sawicki M., 2001, AJ, 121, 2405Schaerer D., 2002, A&A, 382, 28Schneider R., Ferrara A., Salvaterra R., 2004, MNRAS, 351, 1379Semenov D., Henning Th., Helling Ch., Ilgner M., Sedlmayr E., 2003, A&A,
410, 611Shepherd J. P., Koenitzer J. W., Aragon R., Spalek J., Honig J. M., 1991,
Phys. Rev. B, 43, 8461Siethoff H., Ahlborn K., 1996, J. Appl. Phys., 79, 2968Stanway E. R., Bunker A. J., McMahon G., 2003, MNRAS, 342, 439Steidel C. C., Giavalisco M., Pettini M., Dickinson M., Adelberger K. L.,
1996, ApJ, 462, L17Steidel C. C., Adelberger K. L., Giavalisco M., Dickinson M., Pettini M.,
1999, ApJ, 519, 1Takeuchi T. T., Ishii T. T., 2004a, ApJ, 604, 40Takeuchi T. T., Ishii T. T., 2004b, A&A, 426, 425 (T04)Takeuchi T. T., Yoshikawa K., Yonehara A., 2000, in Matsumoto T., Shibai
H., eds, ISAS Report SP-14, Mid- and Far-Infrared Astronomy and SpaceMissions, ISAS, Sagamihara, p. 163
Takeuchi T. T., Ishii T. T., Hirashita H., Yoshikawa K., Matsuhara H., KawaraK., Okuda H., 2001a, PASJ, 53, 37
Takeuchi T. T., Kawabe R., Kohno K., Nakanishi K., Ishii T. T., HirashitaH., Yoshikawa K., 2001b, PASP, 113, 586
Takeuchi T. T., Hirashita H., Ishii T. T., Hunt L. K., Ferrara A., 2003a,MNRAS, 343, 839 (T03)
Takeuchi T. T., Yoshikawa K., Ishii T. T., 2003b, ApJ, 587, L89Takeuchi T. T., Buat V., Iglesias-Paramo J., Boselli A., Burgarella D., 2005,
A&A, 432, 423Tanaka K. K., Tanaka H., Nakazawa K., 2002, Icarus, 160, 197Tinsley B. M., Danly L., 1980, ApJ, 242, 435Todini P., Ferrara A., 2001, MNRAS, 325, 726 (TF01)Toon O. B., Pollack J. B., Khare B. N., 1976, J. Geophys. Res., 81,
5733Totani T., Takeuchi T. T., 2002, ApJ, 570, 470Umeda H., Nomoto K., 2002, ApJ, 565, 385Vanzi L., Hunt L. K., Thuan T. X., Izotov Y. I., 2000, A&A, 363, 493Whittet D. C. B., 1992, Dust in the Galactic Environment, IOP,
New YorkWilson T. L., Batrla W., 2005, A&A, 430, 561
A P P E N D I X A : D E TA I L S O F T H E C H E M I C A LE VO L U T I O N
Here we present a detailed description of the chemical evolutionused in this work. Full treatment of the present chemical evolutionmodel including the feedback, dust destruction and more complexSF history is given elsewhere (Nozawa et al., in preparation). Withinthe framework of the closed-box model, the total baryonic mass ofa galaxy, MT, is conserved as
MT = Mgas(0) = Mgas(t) + Mdust(t) + Mstar(t) + Mrem(t), (A1)
where Mgas(t) is the gas mass, Mdust(t) is the dust mass, Mstar(t) is thestellar mass and Mrem(t) is the mass of stellar remnants in the galaxyat an age of t. We start the calculation from homogeneous pristinegas, i.e. Mdust(0) = Mstar(0) = Mrem(0) = 0. The time evolution ofthe mass of interstellar medium, M ISM(t) ≡ Mgas(t) + Mdust(t) isgiven by
dMISM
dt
∣∣∣∣t
= −ψ(t) +∫ mu
ml
[m − mrem(m)] ψ(t − τm)φ(m)dm,
(A2)
where ψ(t) is the SFR at age t , φ(m) is the IMF normalized tounity in the mass interval [m l, m u] (subscripts l and u mean lowerand upper mass limit, respectively), mrem(m) is the mass of a singlestellar remnant resulting from a progenitor star with mass m and τ m
is the lifetime of a star with mass m.For the IMF, as we mentioned in the main text, we adopt the
Salpeter IMF with mass range of (m l, m u) = (0.1 M�, 100 M�).The lifetime τ m is evaluated by a fitting formula of zero-metallicitytracks with no mass loss, given by Schaerer (2002). For SNe II(progenitor mass 8–40 M�), we approximate the remnant mass mrem
by the linear fit based on the numerical result of SN explosions givenby Umeda & Nomoto (2002)
mrem(m) = 0.06m + 0.93(8 < m < 40 M�). (A3)
For other progenitor mass ranges, we set mrem(m) = 0 at m < 8 M�(no remnants), and mrem(m) = m at 40 M� < m < 100 M� (all themass is swallowed by a black hole). In this work, we do not treatPISNe in the calculation. By equation (A3), the time evolution ofMrem(t) is expressed by
dMrem
dt
∣∣∣∣t
=∫ mu
ml
mrem(m)ψ(t − τm)φ(m)dm. (A4)
The time evolution of Mdust(t) is, then, obtained as
dMdust
dt
∣∣∣∣t
= − Mdust(t)
MISM(t)ψ(t) +
∫ mu
ml
mdust(m)ψ(t − τm)φ(m)dm(A5)
where mdust(m) denotes the dust mass produced by a progenitor withmass m. We apply the dust formation model of N03 for mdust. Aswe mentioned in Section 2.1, we used the result of progenitor mass20 M� for the fraction and the size distribution of dust grain species,hence the mass fraction and size distribution are constant in timealong with the evolution.
A P P E N D I X B : N O R M A L I Z AT I O N O F T H EN U M B E R D E N S I T Y O F G R A I N S P E C I E S
In this Appendix, we show how to obtain the normalization of thedust size distribution dNi/dai
dNi
dada ≡ A fi (a) da (B1)
C© 2005 RAS, MNRAS 362, 592–608
by guest on July 7, 2015http://m
nras.oxfordjournals.org/D
ownloaded from
608 T. T. Takeuchi et al.
where subscript i denotes the species of dust, and fi is the massfraction of dust of species i, given by N03, and A is the normalizationconstant. We denote the material density of i-species dust by ρ i , andthe SF region radius as rSF0. The total mass of dust species i , Mi, isthen written as
Mi = ρi
∫4πa3
3
dNi
dada = ρi
∫4πa3
3A fi (a) da
= 4πA
3ρi
∫a3 fi (a) da. (B2)
The total dust mass of all the species, M, is
M =∑
i
4πA
3ρi
∫fi (a)a3 da = 4πA
3
∑i
ρi
∫fi (a)a3 da . (B3)
Hence
A = 3M
4π∑
i ρi
∫fi (a)a3 da
. (B4)
Thus we can determine A from the available data. Note that only Mdepends on time t, hence the time dependence of A is given onlythrough M. The total number of grains, Ni, is expressed as
Ni =∫
dNi
daidai . (B5)
This paper has been typeset from a TEX/LATEX file prepared by the author.
C© 2005 RAS, MNRAS 362, 592–608
by guest on July 7, 2015http://m
nras.oxfordjournals.org/D
ownloaded from
Related Documents