LETTER Communicated by Joseph Murray A Model for Learning Topographically Organized Parts-Based Representations of Objects in Visual Cortex: Topographic Nonnegative Matrix Factorization Kenji Hosoda [email protected] Masataka Watanabe [email protected] Department of Quantum Engineering and Systems Science, University of Tokyo, Tokyo, Japan Heiko Wersing [email protected] Edgar K ¨ orner [email protected] HONDA Research Institute Europe GmbH, Offenbach, Germany Hiroshi Tsujino [email protected] HONDA Research Institute Japan Co., Ltd, Saitama, Japan Hiroshi Tamura [email protected] Ichiro Fujita [email protected] Graduate School of Frontier Biosciences, Osaka University, Osaka, Japan Object representation in the inferior temporal cortex (IT), an area of visual cortex critical for object recognition in the primate, exhibits two promi- nent properties: (1) objects are represented by the combined activity of columnar clusters of neurons, with each cluster representing component features or parts of objects, and (2) closely related features are continu- ously represented along the tangential direction of individual columnar clusters. Here we propose a learning model that reflects these properties of parts-based representation and topographic organization in a unified framework. This model is based on a nonnegative matrix factorization (NMF) basis decomposition method. NMF alone provides a parts-based representation where nonnegative inputs are approximated by additive combinations of nonnegative basis functions. Our proposed model of topographic NMF (TNMF) incorporates neighborhood connections be- tween NMF basis functions arranged on a topographic map and attains Neural Computation 21, 2605–2633 (2009) C 2009 Massachusetts Institute of Technology

Welcome message from author
This document is posted to help you gain knowledge. Please leave a comment to let me know what you think about it! Share it to your friends and learn new things together.
Transcript
LETTER Communicated by Joseph Murray
A Model for Learning Topographically Organized Parts-BasedRepresentations of Objects in Visual Cortex: TopographicNonnegative Matrix Factorization
Kenji [email protected] [email protected] of Quantum Engineering and Systems Science, University of Tokyo,Tokyo, Japan
Heiko [email protected] [email protected] Research Institute Europe GmbH, Offenbach, Germany
Hiroshi [email protected] Research Institute Japan Co., Ltd, Saitama, Japan
Hiroshi [email protected] [email protected] School of Frontier Biosciences, Osaka University, Osaka, Japan
Object representation in the inferior temporal cortex (IT), an area of visualcortex critical for object recognition in the primate, exhibits two promi-nent properties: (1) objects are represented by the combined activity ofcolumnar clusters of neurons, with each cluster representing componentfeatures or parts of objects, and (2) closely related features are continu-ously represented along the tangential direction of individual columnarclusters. Here we propose a learning model that reflects these propertiesof parts-based representation and topographic organization in a unifiedframework. This model is based on a nonnegative matrix factorization(NMF) basis decomposition method. NMF alone provides a parts-basedrepresentation where nonnegative inputs are approximated by additivecombinations of nonnegative basis functions. Our proposed model oftopographic NMF (TNMF) incorporates neighborhood connections be-tween NMF basis functions arranged on a topographic map and attains
Neural Computation 21, 2605–2633 (2009) C© 2009 Massachusetts Institute of Technology

2606 K. Hosoda et al.
the topographic property without losing the parts-based property of theNMF. The TNMF represents an input by multiple activity peaks to de-scribe diverse information, whereas conventional topographic models,such as the self-organizing map (SOM), represent an input by a sin-gle activity peak in a topographic map. We demonstrate the parts-basedand topographic properties of the TNMF by constructing a hierarchicalmodel for object recognition where the TNMF is at the top tier for learn-ing high-level object features. The TNMF showed better generalizationperformance over NMF for a data set of continuous view change of animage and more robustly preserving the continuity of the view change inits object representation. Comparison of the outputs of our model withactual neural responses recorded in the IT indicates that the TNMF recon-structs the neuronal responses better than the SOM, giving plausibilityto the parts-based learning of the model.
1 Introduction
In the ventral pathway of the primate visual cortex, object features are grad-ually extracted with increasing specificity and invariance by a network ofcortical areas. The inferior temporal cortex (IT) subserves a critical compo-nent of visual processing of objects at later stages of this pathway (Mishkin,Ungerleider, & Macko, 1983; Gross, 1994). How object images are repre-sented in the IT has been investigated intensively with both theoretical andexperimental approaches. Object representation in the IT has been proposedto include two distinct properties. One is the parts-based representation inwhich objects are represented by combinations of redundant componentfeatures rather than by objects themselves or by fully distributed com-ponents like Fourier descriptors (Tanaka, Saito, Fukada, & Moriya, 1991;Fujita, Tanaka, Ito, & Cheng, 1992). Optical imaging of neural populationactivity in the IT demonstrates that a single object elicits multiple patches ofactivity across cortex; these appear to represent component features of theobject (Tsunoda, Yamane, Nishizaki, & Tanifuji, 2001). Another property isthat parametrically related object features are orderly represented along thecortical surface within each cortical patch (Tanaka, 2003). When the imageof an object, such as a face, is systematically transformed (e.g., successivelyrotated in depth), activity spots gradually shift their positions on IT cortex(Wang, Tanifuji, & Tanaka, 1998). Although these two representation prop-erties have important functional implications (Fujita, 2002; Tanaka, 2003),how they are established has not been determined.
The self-organizing map (SOM) has been used widely to model thetopographic organization of cortex (Kohonen, 1988; Durbin & Mitchison,1990; Obermayer, Ritter, & Schulten, 1990; Swindale, 1991; Yu, Farley, Jin,& Sur, 2005). A SOM represents a high-dimensional input with a singlepoint in a low-dimensional network that maximizes proximity relations
Topographic Nonnegative Matrix Factorization 2607
between different inputs. If an input is parametrically changed, then theactivity peak shifts in position. A SOM does not provide the property ofparts-based representation because each of the mapped points reflects aholistic aspect of the input.
In this study, we propose a learning model that explains both of the parts-based and topographic properties of IT. This model is based on a nonnega-tive matrix factorization (NMF) basis decomposition method (Lee & Seung,1999). In general, basis decomposition methods derive basis functions andcoefficients from input data and reconstruct the inputs by weighted com-binations of these basis functions. Principal component analysis (PCA), astandard basis decomposition method, maximizes this reconstruction andderives fully distributed representations. Vector quantization (VQ), anothermethod for basis decomposition, imposes the constraint that each input isrepresented by only one basis function. While all basis functions and coef-ficients in PCA and all basis functions in VQ may take both positive andnegative values, the NMF requires all entries to be nonnegative. The NMFhas been demonstrated to yield intuitive parts-based representations fornonnegative data (Lee & Seung, 1999; Buchsbaum & Bloch, 2002; Xu, Liu,& Gong, 2003; Cho & Choi, 2005).
Our model of topographic NMF (TNMF) extends the original NMF byintroducing neighborhood functions between NMF basis functions placedevenly in a low-dimensional space. With this extension, the nonnegativeconstraint inherited from the NMF leads to an overlapping of basis functionsalong neighboring structures. Having been trained (i.e., having searched forthe best set of basis functions and coefficients), a topographic organizationor a map is formed of parts-based representation. Just as the SOM is a topo-graphic extension of VQ, the TNMF is a topographic extension of the NMF.
As a statistical model, this topographic extension involves the a prioriassumption that latent features embedded in the inputs are smoothly dis-tributed. Given this assumption, the TNMF can learn latent features thatare not apparent in training inputs by interpolation through topographicneighborhood cooperation. Especially, the TNMF can smoothly embed andinterpolate values of a variable encoded in a group of neurons by a popula-tion coding (Pouget, Dayan, & Zemel, 2000), in which neural responses arecorrelated with a gaussian function representing a value. We first demon-strate this generalizing capability of the TNMF with artificial data, whichconsisted of neural responses under a population coding.
To show the TNMF properties as a cortical learning model, we applied theTNMF to a hierarchical model of neural computation by the ventral path-way (Wersing & Korner, 2003). The hierarchical model extracts visual fea-tures with increasing specificity and invariance based on alternating featuredetection and integration processes, as in the neocognitron (Fukushima,1980) and the HMAX model (Riesenhuber & Poggio, 1999). Progressiveprocessing is biologically plausible and can explain some aspects of neuralresponses in the ventral pathway (Serre et al., 2005; Serre, 2006; Zoccolan,

2608 K. Hosoda et al.
Kouh, Poggio, & DiCarlo, 2007). In our model, the TNMF was used fortraining the highest layer of the hierarchy. The lower layers of the modelare highly competitive with other current recognition algorithms (Wersing& Korner, 2003). We show that the hierarchical model with the TNMF cap-tures the parts-based and topographic properties of object representationin IT. We first examine the topographic-induced generalizing capability ofthe TNMF for model responses to rotating views of an object. We then as-sessed the biological plausibility of this model at the single-neuron level bycomparing the model outputs with the responses of the monkey IT neu-rons we reported previously (Tamura, Kaneko, Kawasaki, & Fujita, 2004;Tamura, Kaneko, & Fujita, 2005). We also evaluated performance of modelsgenerated with SOM and the original NMF.
2 Methods
2.1 Proposed Model. The original NMF approximates a nonnegativeinput vector v by an additive combination of r nonnegative basis vectorswa (a = 1, . . . , r ):
v ≈r∑
a=1
ha wa = Wh,
where h = (h1, h2, . . . , hr )T is a nonnegative coefficient vector. The inputvector v is represented by the coefficient vector h via the basis matrixW = (w1, w2, . . . , wr ). During training, basis functions and coefficients areiteratively updated to minimize errors between inputs and approximationswith nonnegative constraints on all entries.
The TNMF incorporates neighborhood connections between NMF basisfunctions arranged on a topographic map (see Figure 1):
v ≈r∑
b=1
hb
r∑a=1
Mabwa = WMh,
where v, W, h are a nonnegative input vector, a nonnegative basis matrix,and a coefficient vector, respectively, as in the original NMF. The new termM = (Mab) is a nonnegative r × r dimensional matrix that defines neigh-borhood connections between r basis functions. Choosing M as the identitymatrix reduces the TNMF to the NMF. We arranged basis functions on a two-dimensional square-lattice topographic map and set neighborhood connec-tion weights to be normal distribution (gaussian) functions on the map:
Mab = exp(−‖pa − pb‖2/2σ 2),
where pa and pb are positions of basis functions a and b on the map,respectively. The gaussian radius σ is a user-defined variable. In training,

Topographic Nonnegative Matrix Factorization 2609
Figure 1: A diagram of the proposed TNMF model where v indicates an inputvector, W indicates basis functions, M indicates neighborhood functions, and hindicates a coefficient vector. Shading of nodes represents magnitudes of inputand coefficient entries. All the entries are restricted to be nonnegative. If M is theidentity matrix, this model reduces to the original NMF. TNMF approximates vby WMH updating W and h.
the neighborhood function M is fixed, while the basis W and coefficienth are updated to reconstruct the input v optimally under the nonnegativeconstraint.
The data approximation is achieved by maximizing the following objec-tive function:
F =n∑
i=1
m∑j=1
[Vi j log(WMH)i j − (WMH)i j ],
where V = (v1, v2, . . . , vm) = (Vi j ) indicates m input vectors and H =(h1, h2, . . . , hm) = (Hbj ) indicates corresponding m coefficient vectors. Thefunction F can be interpreted as a log likelihood in a model in which eachinput entry Vi j is generated by adding Poisson noise to the approximation(WMH)i j (Lee & Seung, 1999). The maximization of F is achieved by thefollowing multiplicative updates:
Wia = Wia
∑j (MH)a j Vi j/(WMH)i j∑
j (MH)a j

2610 K. Hosoda et al.
Hbj = Hbj
∑i (WM)ib Vi j/(WMH)i j∑
i (WM)ib.
These updates monotonically maximize the function F along with satisfyingthe nonnegative constraint (Lee & Seung, 2001). We also normalized thecoefficient matrix H together with these updates:
Hbj = Hbj
/ ∑j
Hbj .
This normalization eliminates the indefiniteness of WMH under the trans-formation W → α∗W and H → H/α, where α is scalar. The algorithmreaches a local maximum in the objective function by repeating these up-dates, and it does not always attain the global maximum. Therefore, weemployed an exhaustive search in which the optimal solution is selectedfrom sufficient multiple solutions starting from random initial conditionsand an annealing method in which the neighborhood radius σ is narrowedwith the number of iteration as in SOM algorithms (Kohonen, 1988).
2.2 Hierarchical Visual Model. The hierarchical model of the ventralpathway comprises multiple layers. The proposed TNMF algorithm is usedfor training the highest layer (see Figure 2). The lower layers (S1, C1, S2,S3) perform processing of visual form starting from edge detection, whichhas been described in detail in Wersing and Korner (2003). In this model,the S and C layers are alternately structured (Fukushima, 1980). The Slayers increase specificity, and the C layers increase invariance of inputrepresentations.
First, the image vector v is processed in the S1 layer that extracts edgecomponents through Gabor filters of four orientations in the retinotopiccoordinate:
q (1)l (x, y) = ∣∣w(1)
l (x, y) · v∣∣,
where q (1)l (x, y) is a neural response in the S1 layer and w(1)
l (x, y) is a Gaborfilter of the orientation l at the retinotopic position (x, y) vectorized in thesame way as v. The q (1)
l (x, y) is then modified by winner-take-most compe-tition, suppressing suboptimal responses, over all orientation preferencesat the position (x, y):
r (1)l (x, y) =
⎧⎪⎪⎨⎪⎪⎩
0 ifq (1)
l (x, y)M
< γ
q (1)l (x, y) − Mγ
1 − γelse
,

Topographic Nonnegative Matrix Factorization 2611
Figure 2: Architecture of the hierarchical model. In the form path, S and C layersare alternately structured. This feature increases specificity and invariance ofinput representations, respectively. The proposed TNMF was used for trainingthe S3 layer. An additional luminance layer processes white and black imagesof lower resolution.
where M = maxk(q (1)k (x, y) + ε(�1)). The response is rectified by a threshold
function with a threshold θ , which is common over the S1 layer:
s(1)l (x, y) = H(r (1)
l (x, y) − θ ),
where H(x) = 1 if x > 0 and H(x) = 0 else and s(1)l (x, y) is the final S1
response.The S1 outputs are then pooled over a range of the retinotopic coordinate
with an OR-operation in the C1 layer:
c(1)l (x, y) = tanh
(g(x, y).s(1)
l
),
where g(x, y) is a normalized gaussian kernel with radius σ that integrates alocal array of S1 outputs with the same orientation preference. The functiontanh is the hyperbolic tangent sigmoid transfer function and implementsa smooth spatial OR-operation by the saturating nonlinearity. S1 neuronsrespond selectively to edges at specific orientation and location, and C1

2612 K. Hosoda et al.
neurons respond selectively to edges with a specific orientation across alarger area of the visual field, as observed for single and complex cells inthe primary visual cortex (V1), respectively (Hubel & Wiesel, 1962).
Next, the image signals are passed through the S2 and C2 layers. TheS2 layer codes 50 types of local image features w(2)
lk (x, y) (l = 1, . . . , 50; k =1, . . . , 4) for each retinotopic position (x, y), such as corners and elongatededges. The 50 types of features are a product of sparse invariant basis de-composition (Wersing & Korner, 2003). Briefly, the “learning” by this layer isbased on sets of C1 outputs within the 4 × 4 retinotopic patch across all fourorientation preferences. The C1 data are approximated by weight-sharingbasis functions representing the 50 types of features, allowing spatial shifts.The approximation is performed under a sparse and nonnegative constraintthat yields parts-based representations. The obtained basis functions repre-sented more complex features than simple oriented edges.
The S2 layer then combines C1 outputs within local retinotopic patchesacross all orientation preferences:
q (2)l (x, y) =
∑k
w(2)lk (x, y).c(1)
k .
The S2 response q (2)l (x, y) is again modified by the winner-take-most com-
petition as in the S1 layer. The S2 outputs are then pooled over a range ofthe retinotopic coordinate with an OR-operation in the C2 layer in the sameway as in the C1 layer.
Model parameters such as the competition selectivity γ , threshold θ , andgaussian radius σ , are optimized for an object recognition task (Wersing &Korner, 2003): γ = 0.7, θ = 0.3, σ = 4.0 for the level 1 hierarchy (i.e., S1and C1); γ = 0.9, θ = 1.0, σ = 2.0 for the level 2 hierarchy. The retinotopicresolution is set to be 14 × 14 for the C1 layer and 5 × 5 for the C2 layer,starting from 64 × 64 image pixels.
Finally, the C2 outputs are fed into the S3 layer under the TNMF model.The outputs of the S3 layer are basis coefficients H. In the experiment insection 3.4, S3 neurons were trained with an image set consisting of fiveviews (0, 15, 30, 45, and 60 degrees) of 50 objects (see Figure 3). While the C2layer and below have topographic maps of a priori retinotopic coordinates(see Figure 2), the S3 layer acquires a topographic map explicitly represent-ing latent object transformation parameters in the image set. The number ofbasis functions was 32 × 32, and the gaussian radius σ in the neighborhoodfunction M was 1 (1/32 of map size).
For comparison between the model output and biological data, we alsoincorporated an additional luminance-processing layer to the hierarchicalmodel. Some IT neurons are less selective for shape but respond to manystimuli either darker or brighter than background (Ito, Fujita, Tamura, &Tanaka, 1994; Tamura et al., 2005). The aim of including the luminance layer

Topographic Nonnegative Matrix Factorization 2613
Figure 3: Examples of object images for consecutive views used to train the S3layer.
is to alleviate the influence of such IT neurons on the evaluation of shapeprocessing by the model. This layer codes luminance polarities (white andblack) at each pixel on lower-resolution images:
u1(x, y) ={
(v′(x, y) − 0.6)/0.4 if v′(x, y) ≥ 0.6
0 else
u2(x, y) ={
(0.4 − v′(x, y))/0.4 if v′(x, y) < 0.4
0 else,
where v′(x, y) indicates the intensity of the lower-resolution image at the po-sition (x, y), and u1(x, y) and u2(x, y) represent, respectively, the whitenessand blackness of v′(x, y) in a graded manner.
2.3 Neuron Data. The neuron data for comparison with the results ofour model were obtained from the experiments described in Tamura et al.(2004, 2005). Using a multiprobe electrode, we recorded extracellular spikesfrom neurons (n = 497) in the dorsal part of anterior IT (cytoarchitectonicarea TE) of the right hemisphere of four anesthetized Japanese monkeys(Macaca fuscata). Neural responses to complex shapes were examined byusing 64 visual stimuli (see Figure 4). The stimuli were individually pre-sented for 1 second at the center of the receptive field with 10 repetitionsfor each recording site. The response rate was calculated by computing themean firing rate during stimulus presentation, subtracting the spontaneousfiring rate, and truncating negative values. In this study, we consider onlyexcitatory neural responses in comparison to nonnegative model outputs.

2614 K. Hosoda et al.
Figure 4: A set of 64 stimulus images used to examine responses of IT neurons(Tamura et al., 2004, 2005).
2.4 Self-Organizing Maps. The SOM was implemented with the fol-lowing batch-learning algorithm (Kohonen, 1988):
Wia =∑
j
(MH)a j Vi j
/ ∑j
(MH)a j ,
where W = (Wia ), M = (Mab), and H = (Hbj ) are basis functions arrangedon a two-dimensional topographic map, neighborhood functions, and co-efficients (map outputs), respectively, as in the TNMF. Unlike the TNMF,H is determined by a winner-take-all mechanism, and there is no nonneg-ative constraint on W. We used the same gaussian neighborhood functionas in the TNMF analysis with an annealing method that gradually narrowsneighborhood radius. The initial state was set to a two-dimensional mapobtained by PCA (Kohonen, 1988). After training, we further modified SOMoutputs by convolving with neighborhood functions M(σ = 1) to blur theall-or-nothing (0, 1) outputs along the map.
2.5 Sparseness Measure. We measured the sparseness of the modelrepresentation. The sparseness of a data vector x with entries xi is definedas follows (Hoyer, 2004):
sparseness(x) =√
n − (∑
i |xi |)/√∑
i x2i√
n − 1,
where n is the dimensionality of x. The sparseness ranges from 0 to 1. Thevalue zero means all entries of x are equal, while the value one means only asingle entry of x is nonzero and all the other entries are zeros like a winner-take-all representation. Intermediate values represent other cases betweenthe two extremes.
3 Results
3.1 Basic Properties of TNMF. How do the added cooperation weightsin the TNMF affect the representation and coding efficiency when com-pared to the NMF? Basically the added neighborhood cooperation induces

Topographic Nonnegative Matrix Factorization 2615
a regularization condition for the set of learned basis functions. Thisregularization is useful if the number of training data is small comparedto the latent data complexity. The summation of basis functions overlocal neighbors leads the network to form new basis functions that aresuperpositions of input vectors. Therefore, if this a priori assumption onthe latent data structure is correct, the network can learn faster and bettergeneralizable representations from fewer training data.
We tested this prediction with a toy data set. We prepared input vectors,each of which was generated by a gaussian component underlying one-dimensional space as in a population coding model (Pouget et al., 2000).Specifically, 32 input neurons were arrayed on a line, and their activitydistribution on the array formed a gaussian hill with Poisson noise (seeFigure 5A):
vi = Poisson(exp(−‖qi − μ‖2 /2s2)/(√
2πs)),
where vi (i = 1, . . . , 32) is an activity of ith input neuron placed at qi = (i/32)on the linear array. The function Poisson (∗) returns a nonnegative integer(count) under Poisson noise with mean ∗ count. The variables μ and s are thepeak position and the radius of the gaussian component, respectively. Theradius s was set to 1/16 (0.0625). The position μ was random, but rangedover 0–0.4 and 0.6–1.0 for training data, and in 0.45–0.55 for test data. Thus,the test data did not contain input patterns in the training data.
The TNMF with a one-dimensional map and the NMF were first appliedto the training data (sample size = 400). The test data (sample size = 50)were then fed into the learned model and are reconstructed by the models.We evaluated similarity between the test inputs and their reconstructionsby the TNMF or NMF model, based on Pearson’s correlation coefficient.
We also evaluated similarity between gaussian components of the testinputs and the reconstructions by the TNMF or NMF model to show how themodel learns the latent input structure. These evaluations were performedwith changing the number of basis functions of each model.
The results are summarized in Figure 5B. Clearly, the TNMF resultssurpassed the NMF results in certain optimal model sizes. Moreover, theTNMF model consistently gave better reconstructions for latent gaussiancomponents than test inputs themselves, while the NMF model did notshow such a generalizing capability. The reconstructions by the NMF wereunstable. This is because the NMF model likely became trapped at a localoptimum in an ill-posed problem (note that the optimal solution is selectedfrom the same number of multiple solutions starting from random initialconditions for both TNMF and NMF).
If TNMF basis functions appropriately capture latent features, their out-puts will be sparser than when they do not (provided that the occurrencedistribution of latent features is sparse). Figure 5C plots the sparseness(see section 2) of model outputs (vectorized H) to the test data against the

2616 K. Hosoda et al.
Figure 5: A toy experiment to illustrate the computational advantage of TNMFover NMF. (A) The left graph shows an example of input data. The input neu-rons are arrayed in a line and activated by a gaussian component on the inputarray with Poisson noise. The position of the gaussian component ranged over0–0.4 and 0.6–1.0 for training data and 0.45–0.55 for test data. The map archi-tecture of the TNMF was one-dimensional, as in the right diagram. (B) Thecorrelation between test inputs and their reconstructions by the TNMF orNMF model, as a function of the number of basis functions (1:TNMF, 1:NMF),and that of between the latent gaussian components and the reconstructions(2:TNMF, 2:NMF). (C) The sparseness of model outputs (vectorized H) to testdata. (D) Examples of learned basis functions (columns of WM) by the TNMFusing 32 basis functions. Each plot shows weights of each basis function to in-put neurons, and these plots form a row in order of the one-dimensional maptopography of the TNMF.
number of basis functions. In almost every case, TNMF outputs are sparserthan those of NMF for each number of basis functions.
Figure 5D shows examples of learned basis functions (columns of WM)by the TNMF using 32 basis functions. Each basis function forms a gaussian-like hill on the input array, and its peak position is smoothly changed withthe map topography. More noteworthy is that the middle basis function onthe map is elevated around 0.5 on the linear input array coordinate, themissing area of the gaussian component in the training data.
Although in this toy problem, only a single gaussian component ap-peared in each input, the TNMF can learn proper latent features from train-ing inputs, each generated by multiple gaussian components. The TNMFcan represent such multipeaked inputs by multipeaked outputs on a map,while the SOM derives only single-peaked outputs.

Topographic Nonnegative Matrix Factorization 2617
Figure 6: (A) A PCA visualization for C2 outputs responding to successiveviews of an object and their reconstructions obtained by TNMF and NMF anal-yses for test data. The views in the 0–80 and 105–180 degrees were the trainingimages. The views in the 85–100 degrees were the test images. The map of TNMFwas constructed to form a circular ring. In the PC space, the C2 output vectorsare represented by circular points connected with thin black lines, where linesindicate view changes. The reconstruction vectors of the TNMF and NMF arerepresented by square points with thick black lines and triangle points withthick gray lines, respectively. (B) Mean of correlations between the test data andtheir reconstructions of the TNMF (black) and NMF (gray) against the numberof basis functions.
3.2 TNMF for Rotating Views. We then examined the interpolationproperty in a situation similar to the toy experiment, except for using realobject images. As an input data set, we prepared C2 outputs of the hierar-chical model responding to successive views of an object (see Figure 6A; 0to 180 degrees with an interval of 5 degrees). We used the outputs for 0 to80 degrees and those for 105 to 180 degrees as a training data set and thosefor 85 to 100 degrees as a test data set. We then applied the TNMF and NMFto the training data to let them learn basis functions and to the test datato evaluate reconstruction performance. We constructed the TNMF maptopography to be a circular ring; we set positions of basis functions to beevenly arranged in the (0, 1) interval and defined the distance between xand y in the interval as min(x − y, x − y − 1, x − y + 1).
Figure 6A shows the input data (V = [Vtraining, Vtest]) and reconstruc-tions (WMHtest) for the test data (Vtest) by the TNMF and NMF with 38basis functions, visualized by principal component analysis (PCA). In thisfigure, the input data points are circularly distributed in the PC space ascorresponding to the object rotation. Here, we show only the data points ofmodel reconstruction for the test data set, since we see a nearly completeoverlap for the training data set to the input in both models. The recon-struction data points of the TNMF are closer to the target points of the testdata than those of the NMF. In this case, the mean of Pearson’s correlations

2618 K. Hosoda et al.
between test input vectors and their reconstruction vectors was 0.893 forthe TNMF and 0.866 for the NMF. The reconstruction data points of theNMF are distributed on the straight line joining points for views of 80 and105 degrees at the ends of the view changes in the training data. On thecontrary, the TNMF reconstruction points run out of the straight line, butfollow tangential lines around the view ends of the training data points, aswith the test data points. The difference suggests that while the NMF recon-structs the test data by linear interpolation within the training data vectors,the TNMF reconstructs them with nontrivial features capturing nonlinearcontinuity underlying the object images.
Figure 6B shows the mean of correlations between test input vectorsand their reconstruction vectors of the TNMF and NMF against the num-ber of basis functions. The mean correlations for the TNMF exceed thosefor the NMF when the number of basis functions was 15 or larger. Thisresult is similar to the result for the population-coded artificial data set inthat the TNMF shows better reconstructions in certain optimal model sizesand further indicates that the unique interpolation property of the TNMFalso works in a realistic situation. Note that we choose the relative size ofsigma in matrix M as inversely changing with the number of basis func-tions. The plot in Figure 6B therefore demonstrates the dependency of thereconstruction error on the chosen value of σ . We also note that the NMFhas smaller reconstruction errors than the TNMF for the number of basisfunction smaller than 15. This is because model parameters of the NMFhave a larger degree of freedom than those of the TNMF under the samenumber of basis functions and therefore show only smaller reconstructionerrors when the TNMF does not exhibit its distinctive characteristics.
3.3 Evaluation of Topological Preservation. To evaluate the functionaladvantages of the unique interpolation property of TNMF over conven-tional NMF, we analyzed the degree of topological preservation for viewangle parameters when model inputs are affected by noise (see below fordetails). Specifically, we assessed the consistency between the order of viewangles of input images and the spatial relations of the final output vectors.It is beneficial for higher layers to acquire object representations that bestpreserve view point topology.
As in the previous analysis, the training images were views of an objectchosen from 0 to 80 and 105 to 180 degrees with an interval of 5 degrees. Thetest images were views of the same object in 90 to 95 degrees with an intervalof 1 degree (see Figure 7A). Then C2 outputs for the test images were modi-fied by adding Poisson noise with the mean of 1 in a multiplicative fashion:
v′i = vi × Poisson(1),
where vi is the response of an ith C2 neuron and v′i is the noise-added
response.
Topographic Nonnegative Matrix Factorization 2619
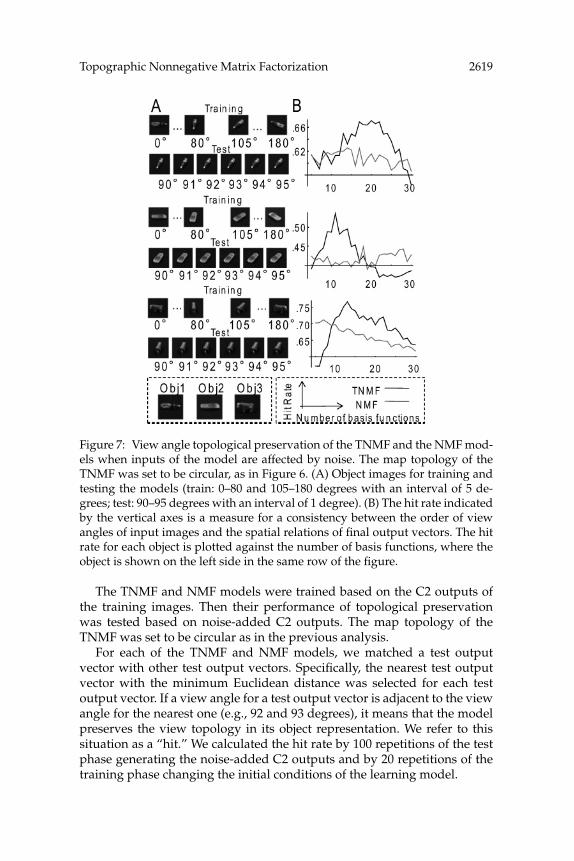
Figure 7: View angle topological preservation of the TNMF and the NMF mod-els when inputs of the model are affected by noise. The map topology of theTNMF was set to be circular, as in Figure 6. (A) Object images for training andtesting the models (train: 0–80 and 105–180 degrees with an interval of 5 de-grees; test: 90–95 degrees with an interval of 1 degree). (B) The hit rate indicatedby the vertical axes is a measure for a consistency between the order of viewangles of input images and the spatial relations of final output vectors. The hitrate for each object is plotted against the number of basis functions, where theobject is shown on the left side in the same row of the figure.
The TNMF and NMF models were trained based on the C2 outputs ofthe training images. Then their performance of topological preservationwas tested based on noise-added C2 outputs. The map topology of theTNMF was set to be circular as in the previous analysis.
For each of the TNMF and NMF models, we matched a test outputvector with other test output vectors. Specifically, the nearest test outputvector with the minimum Euclidean distance was selected for each testoutput vector. If a view angle for a test output vector is adjacent to the viewangle for the nearest one (e.g., 92 and 93 degrees), it means that the modelpreserves the view topology in its object representation. We refer to thissituation as a “hit.” We calculated the hit rate by 100 repetitions of the testphase generating the noise-added C2 outputs and by 20 repetitions of thetraining phase changing the initial conditions of the learning model.

2620 K. Hosoda et al.
The hit rate for each example object is plotted against the number ofbasis functions (see Figure 7B). The peak hit rate of the TNMF significantlysurpassed that of the NMF for objects 1, 2, and 3. The hit rates directlycalculated on the noise-added C2 outputs for objects 1, 2, and 3 were 0.42,0.38, and 0.52, respectively, all of which were lower than the peak hit ratesfor both TNMF and NMF. These results provide evidence that the TNMFcan preserve the view topology more robustly than the NMF for simplertraining conditions.
3.4 Response Properties of S3 Neurons. Next, we applied the TNMFwith a 32 × 32 square map to the hierarchical model to train the highestlayer (S3 layer). The image set for training the S3 layer consists of a set of250 gray-level photographs (50 objects × 5 views; see Figure 3 for exampleimages). Figures 8A to 8F show the map of the S3 layer responses (rows ofH) to images of three objects, each successively rotated in depth. Spots ofdifferent colors indicate the location of the strongest responses to five view-ing angles of each object (upper photographs) underlined by bars with thecorresponding colors. The distribution of response peaks exhibits severalconspicuous features. Each object image elicits multiple, spatially separatepeaks of activity. Response peaks to one view often abut response peaks toother views. Thus, an object with various viewing angles elicits activity inclustered patches. Importantly, activity peaks continuously shift their po-sition within many of these patches (e.g., regions indicated by arrows) asobjects are rotated in depth. For example in Figures 8A to 8D, the cup elicitstwo gradually shifted patches, the duck elicits one largely changing patch,and the car and the animal elicit several continuously changing patcheswith different robustness. Other patches do not show this gradual shift orcomprise responses to only one or two views.
Each response peak appears to represent a component feature or a partof the image. For example, region 1 was activated by three different viewsof a cup with an elaborate surface pattern (see Figure 8A). These responsesdisappeared when stimuli were switched to images of a cup with nearlythe same shape but a much simpler surface pattern (see Figure 8E, dashedcircle). We conclude from these results that the responses at region 1 areevoked by the texture pattern on the surface of the cup shown in Figure 8A.Similarly, masking the left half of the images in Figure 8A eliminated theactivities at region 2 evoked by the entire image of the cup (see Figure 8F,dashed circle). Even if images of the entire cup were provided to the model,region 2 did not respond when the cup was rotated and the handle wasoccluded; the patch at region 2 consists of yellow, orange, and pink, butlacks purple and indigo (see Figures 8A and 8D). Therefore, activity atregion 2 is evoked by the handle of the cup.
We then quantitatively evaluated how the active patches are distributed.First, we computed positions of activity peaks for each map response (eachrow of H). A peak is defined by the maximal element that locally dominates

Topographic Nonnegative Matrix Factorization 2621
Figure 8: Object representations (H) in the S3 layer trained with the TNMF.Active neurons defined by a common threshold are colored for a correspond-ing trigger image, but only for the highest activation. If the presented image ischanged along the arrow in the top of A or B, some active spots (e.g., regions in-dicated by arrows) continuously shift their position along the arrows in the map.These results reflect the parts-based and topographic properties of the map.
its surroundings, where we select only local maxima that are larger than1/10 of the overall global maximum. Figure 9A shows the histogram of thenumber of peaks for each map response. This figure indicates that aboutthree peaks on average are invoked by a stimulus under a Poisson-likedistribution.

2622 K. Hosoda et al.
Figure 9: (A) Histogram of the number of peaks for each map response (eachrow of H). (B) Distributions of the minimum peak distance for each set of stimu-lus pairs whose view angle distance is dθ and for other random stimulus pairs.The minimum peak distance is defined for each stimulus pair as a minimumdistance between each peak responding to one view and peaks responding toanother view.
Next, we evaluated how far the response peaks continuously shift theirposition as objects are rotated. First, we chose a set of stimulus pairs, whereeach pair consists of views of an object being different by dθ degree. Then foreach stimulus pair, the minimum distance was measured between each peakresponding to one view and peaks responding to another view. Figure 9Bshows the distributions of the minimum peak distance for each set of stim-ulus pairs whose angle distance (dθ ) is 15, 30, 45, or 60 degrees (solid, dash,dot-dash, or dot lines respectively) and for other random stimulus pairs(thick solid line). As can be seen, the peak distance distribution graduallyshifts with the angle distance for stimulus pairs. Note that the distance dis-tribution for random pairs also has a tendency to shift toward considerablyshorter distance. This is because we used object sets, each of which consistsof similar objects, for obtaining the stimulus images. These results revealthat a certain number of activity peaks continuously shift their positionwith object rotation.
3.5 Basis Functions of S3 Neurons. The response map in the S3 layeris parts based and locally topographic in a similar fashion as in IT cortex.When we look at the structure of the S3 basis functions convolved withneighborhood functions (columns of WM) (see Figure 10), adjacent S3 neu-rons have similar connection weights to C2 neurons (r = 0.89 ± 0.04 forall adjacent pairs, and r = 0.15 ± 0.15 for all pairs), indicating continuousencoding. For each S3 neuron, each of 5 × 10 arrays in Figure 10, where C2neurons with same feature type are arranged on the retinotopic location oftheir receptive fields, connection weights are spatially localized. Therefore,S3 neurons code spatially localized object features, not a holistic pattern ofobjects. Moreover, connection weights to C2 neurons were spread over awide area of the 5 × 10 arrays, consistent with S3 neurons building morecomplex features than C2 neurons.

Topographic Nonnegative Matrix Factorization 2623
Figure 10: Connection weights of example adjacent S3 neurons to C2 layer(columns of WM). For each S3 neuron, each of 5 × 10 arrays represents connec-tion weights to C2 neurons that code each of 50 feature types. The coordinatewithin each array corresponds to the retinotopy of receptive fields of C2 neu-rons. Brighter entries indicate stronger magnitudes of the connection weights.
3.6 Sparseness of S3 Representation. The original NMF has an abilityto derive a localized or sparse representation. However, the NMF sometimesderives more global representation than desirable, and some extended mod-els had been proposed to impose explicit sparseness constraints on the NMF(Li, Hou, Zhang, & Cheng, 2001; Hoyer, 2004; Heiler & Schnorr, 2006). Toclarify if additional sparsity constraints could be beneficial for our TNMFsetting, we measured the sparseness (see section 2) of the obtained mapcomponents.
In the study by Hoyer (2004), the sparseness of each row of H or eachcolumn of W was fixed to 0.75 to 0.85 for yielding a local representation. InHeiler and Schnorr (2006), the sparseness was imposed to be greater than0.6 for a strong sparseness constraint. In our experiments, the sparseness ofeach column of H was 0.84 ± 0.07 and the sparseness of each row of WMwas 0.68 ± 0.07. (The basis functions in Figure 10 show 0.83, 0.79, and 0.74

2624 K. Hosoda et al.
sparseness in order, from the top.) So at least in our data set, the TNMF canderive a comparatively sufficient sparse representation.
3.7 Comparison with IT Neurons. In order to examine the biologicalplausibility of the TNMF learning and the hierarchical model, we com-pared neuronal responses predicted by the model with those of monkeyIT neurons to the 64 object images shown in Figure 4. Importantly, the testfigures used for IT neurons (see Figure 4) were not presented to the modelduring training.
For each IT neuron, we selected a model neuron from each layer (C1, C2,and S3) that has the most similar stimulus selectivity:
Best(i, X) = arg maxj
(cor
(z(IT)
i , zXj
)),
where Best(i,X) is the index of the best-fit model neuron in the layer X to theith IT neuron, and the vectors of z(I T)
i and z(X )j are, respectively, response
patterns of the ith IT and the jth model neuron to the 64 images. The functioncor(∗,∗) calculates the Pearson’s correlation coefficient. For convenience, wedefine the best-fit correlation for each IT neuron:
BestCor(i, X) = cor(z(IT)i , zX
Best(i,X)).
Figures 11A to 11D show four examples of IT neurons, with their mostsimilar counterparts in the C1, C2, and S3 layers. In Figures 11A and 11B, theS3 model neurons display more similar selectivity to the IT neurons thanthe C2 and C1 model neurons, showing more specific selectivity to starshapes, in Figure 11A, or concentric circles, in Figure 11B. In Figure 11C,both S3 and C2 neurons show selectivity similar to that of the IT neuron,preferring shapes with vertical or horizontal lines, while the best-fitting C1shows poor similarity. In Figure 11D, all S3, C2, and C1 neurons respond se-lectively to shapes with a small protrusion and a base as a target IT neuron.This example also implies that the higher layers preserve the resolution ofcoded features despite the increasing receptive field size. Figures 11E and11F show luminance-contrast selective IT neurons, with the most similarcounterparts in the luminance layer (see section 2). Although the lumi-nance layer is strongly simplified, it provides better reconstruction to theluminance-contrast selective IT neurons than other shape-selective layers.
We then measured how well the model neurons in different layers re-construct the stimulus selectivity of IT neurons. The best-fit correlationcoefficient used to select the best model neurons is not an appropriate in-dex for comparing different layers, because the response variability acrossneurons may differ among the model layers. For example, even in cases

Topographic Nonnegative Matrix Factorization 2625
Figure 11: Examples of selected model neurons of each layer (A–D: from theC1, C2, and S3 layers; E–F: from the luminance layer) displaying the mostsimilar stimulus selectivity to two IT neurons. Each image sequence indicatesthe selectivity pattern of each neuron where image size indicates the responsemagnitude normalized by the maximum and ordered descending.
where model neurons randomly respond to stimuli, if the number of suchneurons increases, the best-fit correlation will stochastically increase.
We therefore computed a probabilistic index that measures, for each ITneuron (i), the probability of obtaining the best-fit correlation of each targetlayer (X) or higher from that layer with a random stimulus-permutation(Xpermute):
Pi =1∫
BestCor(i,X)
Pr[BestCor(i, Xpermute) = r ]dr,
where Pr[∗] is the occurrence probability of an event ∗. Random stimuluspermutation was performed by shuffling the stimulus order of the originalmodel responses. Stimulus permutation was applied at the layer level,rather than the single-neuron level, because the latter increases the responsevariability of the model layer.
Such surrogate layers were generated through many repetitions, and theprobabilistic index was calculated as the percentile of the original best-fitcorrelation for a set of surrogate best-fit correlations to each IT neuron. Alower probabilistic index indicates a better reconstruction of responses of anIT neuron. For a population comparison, we defined whether the IT neuronwas reconstructed to an arbitrary threshold level of the probabilistic index.We then counted the number of IT neurons out of 497 IT neurons that mettwo thresholds, 0.1 (strict threshold) and 0.2 (moderate threshold), of theprobabilistic index. The higher the number, the more similar object repre-sentation of the model layer is to that of IT cortex. Although the evaluation

2626 K. Hosoda et al.
Figure 12: The number of neurons among 497 IT neurons that are well recon-structed by each model layer with criteria of strict and moderate thresholds ofa probabilistic index that measures the degree of the reconstruction for each ITneuron. The gray and white bars are the number of well-reconstructed neuronsassessed with strict and moderate thresholds, respectively. Error bars indicatethe standard deviation based on population proportion. Double-headed arrowsindicate significant difference between the pointed values (p < 0.05; binomialtest).
depends on the threshold, it is sufficient and critical to select an appropriatethreshold that yields most dissociable results among different target layers.
Figure 12 shows the number of well-reconstructed neurons for differentmodel layers. First, we evaluated a random layer that is a set of IT neu-ral responses with random stimulus permutation. The performance of therandom layer was worse than the other layers with preserved stimulus in-formation. The number for the luminance layer (see section 2) was muchhigher than that for the random layer but lower than that for the otherlayers described below. The C1, C2, and S3 layers were evaluated withincorporating neurons of the luminance layer. This feature alleviates theinfluence of luminance-contrast selective IT neurons on the evaluation ofshape processing. If an IT neuron exhibits strong selectivity for luminance,the best-fit model neuron was selected from the luminance layer. The num-ber of IT neurons reconstructed by the C2 layer was significantly higher thanthat by the C1 layer under the strict threshold (see Figure 12a) (p < 0.05,binomial test). The S3 layer trained by the TNMF exhibited a significantlyhigher reconstructed number than the C2 score under the moderate thresh-old (see Figure 12b) (p < 0.05, binomial test). Thus, higher layers performedbetter in reconstructing responses of IT neurons than lower layers.
Last, we compared the performance of SOM and NMF for training the S3layer with the performance of the TNMF (see Figure 12, bottom two bars).The number of basis functions for the TNMF, SOM, or NMF analysis waschosen to have an optimal score (TNMF: 32 × 32, SOM: 24 × 24, NMF: 1000).Although no significant difference was found between the TNMF- and theNMF-trained layers in this evaluation, the SOM-trained layer displayed aconsiderably lower number of well-reconstructed neurons than the layers

Topographic Nonnegative Matrix Factorization 2627
trained by the TNMF or the NMF under both strict and moderate threshold(p < 0.01: binomial test). The results indicate the significance of the parts-based property for a biologically plausible model.
4 Discussion
In this study, we propose a learning model, TNMF, that accounts for boththe parts-based representation and the locally topographic organization ofIT in a unified framework. The initial analysis showed the generalizingcapability of the TNMF relevant to the topographic extension. Next, weconstructed a multilayer model for visual processing in the ventral path-way and applied the TNMF to training of the highest layer. The generalizingcapability of the TNMF with topographic-induced nonlinear interpolationwas also confirmed based on hierarchical model responses expressing con-tinuous change of an image. Especially, we showed that the TNMF cangeneralize objects with more robust topological preservation for a view an-gle parameter than the NMF. We then showed that the TNMF qualitativelycaptures the parts-based and topographic properties. Comparison of modelneurons with IT neurons at the single neuron level revealed that the higherlayers in the model contain more neurons with similar stimulus selectivityto IT neurons than the lower layers. In the highest layer, S3, the TNMF andNMF trained the model neurons to be similar to IT neurons equally well,whereas no positive effect was found with SOM training, indicating thesignificance of the parts-based representation.
4.1 Structural Features of TNMF. The TNMF is a generative model.A generative model is based on an assumption that observed inputs aregenerated from a latent structure with noise and refines the approximationof the latent structure to better represent the inputs. The TNMF as wellas the NMF assume that observed inputs are generated by combinationsof parts-based elements with noise. An important component in genera-tive models is backward signals used for calculating differences or errorsbetween the actual and reconstructed inputs. In the cortex, forward andbackward processing can be performed by interactions between corticalregions or between layers. Rao and Ballard (1999) have designed a genera-tive model assuming cortical interlayer interactions. In the TNMF learningrule, an operation also measures errors between inputs and reconstructions:(Vi j/(WMH )i j ). If the brain uses a learning rule similar to the TNMF, theactivity of input neuron i (Vi j ) might be suppressed by the activities ofoutput neurons (H) via the internal networks (the ith row of WM) in amultiplicative fashion to calculate residual errors.
A principal feature of the TNMF is the nonnegative constraint. In the orig-inal NMF, the nonnegative constraint prevents mutual cancellation betweenbasis functions and yields parts-based representations (Lee & Seung, 1999).The nonnegative constraint is also critical in the TNMF. If the nonnegative

2628 K. Hosoda et al.
constraint is not present, the optimal basis functions for the TNMF ob-jective function (V ← WMH) is W′M−1 where W’ are the optimal basisfunctions for the objective function without the neighborhood functionsM (V ← WH). This circumstance means that basis functions W negate thelearning effect of the neighborhood functions M, while preserving the de-gree of freedom in the data reconstruction.
Nonnegativity of the NMF has been related to the network propertiessuch as firing rate representation and signed synaptic weight (Lee & Seung,1999). However, one might argue that there are ubiquitous inhibitory inter-actions in cortex, which could be modeled as negative entries in the basisW. The NMF and TNMF algorithms provide an alternative hypothesis thatinhibitory interactions play a role in performing division processes in theiterative dynamics, while nonnegative synaptic weights build the basis W.Specifically, the division processes can be found in the operation that calcu-late residual errors (Ri j = Vi j/(WMH )i j ) and in the subsequent competitivenormalization (� j (MH )a j
∗ Ri j/� j (MH )a j ) for updating W, and that forupdating H.
Another important component of the TNMF is the set of neighborhoodfunctions M. An equivalent of the neighborhood functions in the brainmight be intra-area horizontal connections within cortex. Cortical horizon-tal connections include local recurrent axons forming a dense halo aroundthe origin and long-range horizontal axons with patchy terminal arboriza-tion (for IT, see Fujita & Fujita, 1996; Tanigawa, Wang, & Fujita, 2005). Theneighborhood functions of the model may be more closely related to lo-cal recurrent axons because these axons project in a radially symmetricfashion, similar to the circular neighborhood functions in the TNMF. Long-range horizontal axons might contribute to other functional roles in visualprocessing, although the rule that dictates their highly irregular, seeminglyspecific connections is still unknown (Fujita, 2002). The range of local recur-rent axons is larger in IT than in V1 (Tanigawa et al., 2005). In the TNMF, therange of neighborhood functions (σ ) controls the continuity and resolutionof features over the map. If inputs deviate or are more sparsely distributedfrom their latent continuous structure, it is better to use a larger neigh-borhood range for accurately capturing the latent continuous structure.Therefore, the range of local recurrent axons in each cortical region may becorrelated with the intrinsic difficulty of extracting the latent continuousstructure of the underlying inputs.
4.2 Topographic Representations by Other Learning Models. Inaddition to TNMF, computational models have been proposed to derivedistributed input representations with a topographic organization. Amongthem is a topographic extension of independent component analysis (ICA)(Hyvarinen, Hoyer, & Inki, 2001). The classic ICA approximates inputsignals by linear combinations of signal components that are independent

Topographic Nonnegative Matrix Factorization 2629
of each other. The topographic ICA relaxes the assumption of the inde-pendence among components and instead assumes that components fromadjacent basis functions on a topographic map are dependent on each otherunder the second-order correlation (correlation on squared components).However, this model still imposes a strong assumption that there should beno first-order correlation between components (normal correlation). Thisis not the case for IT neurons that display a modest degree of first-ordercorrelation between neighboring neurons (Fujita et al., 1992; Gawne &Richmond, 1993; Gochin, Colombo, Dorfman, Gerstein, & Gross, 1994;Wang, Fujita, & Murayama, 2000; Tamura et al., 2005). Another modelis a multiwinner SOM (Schulz & Reggia, 2004, 2005) that narrows thecompetition range in the SOM. In this model, a region within a competitionrange has approximately one active peak (winner neuron) regardless ofinputs, and thus the total number of active peaks on the topographic mapis almost constant across inputs. However, optical imaging of activity inIT reveals that the number of active cortical patches increases with thecomplexity of the presented stimulus (Tsunoda et al., 2001).
Experimental evidence for locally continuous representation in IT isavailable only for face-responding columns (Wang et al., 1998). Given thispaucity of evidence, Wada, Kurata, and Okada (2004) view IT as organizedin a globally continuous and locally distributed manner. They proposedan extension of the SOM and explained the patchy organization and thepositive but low first-order correlation between neighboring IT neurons.However, because the model did not consider the parts-based represen-tation of objects, activated neurons were restricted to a single columnarregion.
4.3 Role of Topographic Organization. The topographic organizationof cortex may reflect the minimization of wiring length in cortical networks(Hubel & Wiesel, 1963; Koulakov & Chklovskii, 2001). Does the topographicorganization play any computational or functional role beyond this reasonfor wiring economy? One possible role would be to allow a populationdecoding along a topographic map and handle nonnegative responses onthe map in a population-coding framework (Pouget et al., 2000). In par-ticular, pooling neural responses along a topographic map and estimatingthe response peak on the map with interpolation would provide more reli-able input information than the activity of single neurons. This estimationrequires a population-coding framework that permits multiple responsepeaks (Zemel, Dayan, & Pouget, 1998; Pasupathy & Connor, 2002; Sahani &Dayan, 2003). Another possible role would be that nonnegative responseson the topographic map can be pooled along the map with an OR-operationto yield higher response invariance, as in the C1 and C2 layers. For exam-ple, the S3 layer trained by the TNMF can be naturally extended to includea “C3” layer in which neurons will show more view-invariant responses.These postprocessing functions cannot be naturally established without

2630 K. Hosoda et al.
topographically organized representations or on representations with neg-ative values.
4.4 Biological Plausibility. Model neurons generated by the SOMpoorly reproduced the response properties of IT neurons. Their perfor-mance was worse than model neurons generated with the NMF and theC1, C2, S3 layers of the TNMF (see Figure 12). A possible reason for thisis that features emerging with the SOM were holistic patterns specializedfor individual training images. In contrast, most IT neurons respond topartial features of input images (Tanaka et al., 1991). The S3 layer trainedwith the TNMF and the NMF parallels IT neuronal responses better thanthe C1 and C2 layers. Thus, the TNMF and the NMF generate generalizedhigher-level parts-based features in a similar way as individual IT neuronsencode object features. Theoretically, the features emerging with the TNMFare different from those with the NMF in that the TNMF considers thecontinuity of the learned features over the map and extracts the latent con-tinuous structure underlying training inputs in an interpolating manner.No significant difference was found for the comparison in Figure 12. Thereis still the strong difference with regard to topography and population cod-ing. Further studies will be required for a more sensitive evaluation of thecontinuous interpolation in TNMF learning.
In conclusion, we propose a new learning rule that can successfullycapture two features of the higher object representation in primate visualcortex: parts-based representation and locally topographic organization.
Acknowledgments
This work is supported by grants from the Ministry of Education, Cul-ture, Sports, Science and Technology (MEXT) to M.W. (17022015) and I.F.(170220025) and from the Core Research of Evolutional Science and Tech-nology (CREST) of the Japan Science and Technology Agency to I.F.
References
Buchsbaum, G., & Bloch, O. (2002). Color categories revealed by non-negative matrixfactorization of Munsell color spectra. Vision Research, 42, 559–563.
Cho, Y. C., & Choi, S. J. (2005). Nonnegative features of spectro-temporal sounds forclassification. Pattern Recognition Letters, 26, 1327–1336.
Durbin, R., & Mitchison, G. (1990). A dimension reduction framework for under-standing cortical maps. Nature, 343, 644–647.
Fujita, I. (2002). The inferior temporal cortex: Architecture, computation, and repre-sentation. Journal of Neurocytology, 31, 359–371.
Fujita, I., & Fujita, T. (1996). Intrinsic connections in the macaque inferior temporalcortex. Journal of Comparative Neurology, 368, 467–486.

Topographic Nonnegative Matrix Factorization 2631
Fujita, I., Tanaka, K., Ito, M., & Cheng, K. (1992). Columns for visual features ofobjects in monkey inferotemporal cortex. Nature, 360, 343–346.
Fukushima, K. (1980). Neocognitron: A self organizing neural network model fora mechanism of pattern recognition unaffected by shift in position. BiologicalCybernetics, 36, 193–202.
Gawne, T. J., & Richmond, B. J. (1993). How independent are the messages carried byadjacent inferior temporal cortical neurons? Journal of Neuroscience, 13, 2758–2771.
Gochin, P. M., Colombo, M., Dorfman, G. A., Gerstein, G. L., & Gross, C. G. (1994).Neural ensemble coding in inferior temporal cortex. Journal of Neurophysiology,71, 2325–2337.
Gross, C. G. (1994). How inferior temporal cortex became a visual area. CerebralCortex, 5, 455–469.
Heiler, M., & Schnorr, C. (2006). Learning sparse representations by non-negativematrix factorization and sequential cone programming. Journal of Machine Learn-ing Research, 7, 1385–1407.
Hubel, D. H., & Wiesel, T. N. (1962). Receptive fields, binocular interaction andfunctional architecture in the cat’s visual cortex. Journal of Physiology, 160, 106–154.
Hubel, D. H., & Wiesel, T. N. (1963). Shape and arrangement of columns in cat’sstriate cortex. Journal of Physiology, 165, 559–568.
Hoyer, P. O. (2004). Non-negative matrix factorization with sparseness constraints.Journal of Machine Learning Research, 5, 1457–1469.
Hyvarinen, A., Hoyer, P. O., & Inki, M. (2001). Topographic independent componentanalysis. Neural Computation, 13, 1527–1558.
Ito, M., Fujita, I., Tamura, H., & Tanaka, K. (1994). Processing of contrast polarity ofvisual images in inferotemporal cortex of the macaque monkey. Cerebral Cortex,5, 499–508.
Kohonen, T. (1988). Self-organization and associative memory. Berlin: Springer-Verlag.Koulakov, A. A., & Chklovskii, D. B. (2001). Orientation preference patterns in mam-
malian visual cortex: A wire length minimization approach. Neuron, 29, 519–527.Lee, D. D., & Seung, H. S. (1999). Learning the parts of objects by non-negative matrix
factorization. Nature, 401, 788–791.Lee, D. D., & Seung, H. S. (2001). Algorithms for non-negative matrix factorization.
In T. K. Leen, T. G. Dietterich, & V. Tresp (Eds.), Advances in neural informationprocessing systems, 13 (pp. 556–562). Cambridge, MA: MIT Press.
Li, S. Z., Hou, X., Zhang, H., & Cheng, Q. (2001). Learning spatially localized parts-based representations. In Proc. IEEE Conf. on Computer Vision and Pattern Recogni-tion (CVPR), USA (Vol. 1, 207–212). Piscataway, NJ: IEEE Press.
Mishkin, M., Ungerleider, E., & Macko, K. A. (1983). Object vision and spatial vision:Two cortical pathways. Trends in Neuroscience, 6, 414–417.
Obermayer, K., Ritter, H., & Schulten, K. (1990). A principle for the formation ofthe spatial structure of cortical feature maps. Proc. Natl. Acad. Sci. USA, 87, 8345–8349.
Pasupathy, A., & Connor, C. E. (2002). Population coding of shape in area V4. NatureNeuroscience, 5, 1332–1338.
Pouget, A., Dayan, P., & Zemel, R. (2000). Information processing with populationcodes. Nature Review Neuroscience, 1, 125–132.

2632 K. Hosoda et al.
Rao, R. P. N., & Ballard, D. (1999). Predictive coding in the visual cortex: A functionalinterpretation of some extra-classical receptive-field effects. Nature Neuroscience,2, 79–87.
Riesenhuber, M., & Poggio, T. (1999). Hierarchical models of object recognition incortex. Nature Neuroscience, 2, 1019–1025.
Sahani, M., & Dayan, P. (2003). Doubly distributional population codes: Simultane-ous representation of uncertainty and multiplicity. Neural Computation, 15, 2255–2279.
Schulz, R., & Reggia, J. A. (2004). Temporally asymmetric learning supports sequenceprocessing in multi-winner self-organizing maps. Neural Computation, 16, 535–561.
Schulz, R., & Reggia, J. A. (2005). Mirror symmetric topographic maps can arise fromactivity-dependent synaptic changes. Neural Computation, 17, 1059–1083.
Serre, T. (2006). Learning a dictionary of shape components in visual cortex: Com-parison with neurons, humans and machines. Unpublished doctoral dissertation,Massachusetts Institute of Technology.
Serre, T., Kouh, M., Cadieu, C., Knoblich, U., Kreiman, G., & Poggio, T. (2005). A theoryof object recognition: Computations and circuits in the feedforward path of the ventralstream in primate visual cortex (CBCL Paper 259/AI Memo 2005–036). Cambridge,MA: Massachusetts Institute of Technology.
Swindale, N. V. (1991). Coverage and the design of striate cortex. Biological Cybernet-ics, 65, 415–424.
Tamura, H., Kaneko, H., & Fujita, I. (2005). Quantitative analysis of functional clus-tering of neurons in the macaque inferior temporal cortex. Neuroscience Research,52, 311–322.
Tamura, H., Kaneko, H., Kawasaki, K., & Fujita, I. (2004). Presumed inhibitory neu-rons in the macaque inferior temporal cortex: Visual response properties andfunctional interactions with adjacent neurons. Journal of Neurophysiology, 91, 2782–2796.
Tanaka, K. (2003). Columns for complex visual object features in the inferotemporalcortex: Clustering of cells with similar but slightly different stimulus selectivities.Cerebral Cortex, 13, 90–99.
Tanaka, K., Saito, H., Fukada, Y., & Moriya, M. (1991). Coding visual images of objectsin the inferotemporal cortex of the macaque monkey. Journal of Neurophysiology,66, 170–189.
Tanigawa, H., Wang, Q. X., & Fujita, I. (2005). Organization of horizontal axons in theinferior temporal cortex and primary visual cortex. Cerebral Cortex, 15, 1887–1899.
Tsunoda, K., Yamane, Y., Nishizaki, M., & Tanifuji, M. (2001). Complex objects arerepresented in macaque inferotemporal cortex by the combination of featurecolumns. Nature Neuroscience, 4, 832–838.
Wada, K., Kurata, K., & Okada, M. (2004). Self-organization of globally continuousand locally distributed information representation. Neural Networks, 17, 1039–1049.
Wang, G., Tanifuji, M., & Tanaka, K. (1998). Functional architecture in monkey infer-otemporal cortex revealed by in vivo optical imaging. Neuroscience Research, 32,33–46.

Topographic Nonnegative Matrix Factorization 2633
Wang, Y., Fujita, I., & Murayama, Y. (2000). Neuronal mechanisms of selectivity forobject features revealed by blocking inhibition in inferotemporal cortex. NatureNeuroscience, 3, 807–813.
Wersing, H., & Korner, E. (2003). Learning optimized features for hierarchical modelsof invariant object recognition. Neural Computation, 15, 1559–1588.
Xu, W., Liu, X., & Gong, Y. (2003). Document-clustering based on non-negativematrix factorization. In Proceedings of SIGIR 03 (pp. 267–273). New York: ACM.
Yu, H., Farley, B., Jin, D., & Sur, M. (2005). The coordinated mapping of visual spaceand response features in visual cortex. Neuron, 47, 267–280.
Zemel, R. S., Dayan, P., & Pouget, A. (1998). Probabilistic interpretation of populationcodes. Neural Computation, 10, 403–430.
Zoccolan, D., Kouh, M., Poggio, T., & DiCarlo, J. J. (2007). Trade-off between objectselectivity and tolerance in monkey inferotemporal cortex. Journal of Neuroscience,27, 12292–12307.
Received March 3, 2008; accepted January 29, 2009.
Related Documents