A model and experimental approach to the middle ear transfer function related to hearing in the humpback whale (Megaptera novaeangliae) Andrew A. Tubelli, Aleksandrs Zosuls, Darlene R. Ketten, and David C. Mountain Citation: The Journal of the Acoustical Society of America 144, 525 (2018); doi: 10.1121/1.5048421 View online: https://doi.org/10.1121/1.5048421 View Table of Contents: http://asa.scitation.org/toc/jas/144/2 Published by the Acoustical Society of America Articles you may be interested in The communication space of humpback whale social sounds in wind-dominated noise The Journal of the Acoustical Society of America 144, 540 (2018); 10.1121/1.5047744 Auditory distraction by speech: Comparison of fluctuating and steady speech-like masking sounds The Journal of the Acoustical Society of America 144, EL83 (2018); 10.1121/1.5048637 Variability of the inter-pulse interval in sperm whale clicks with implications for size estimation and individual identification The Journal of the Acoustical Society of America 144, 365 (2018); 10.1121/1.5047657 Infrasound transmission in the human ear: Implications for acoustic and vestibular responses of the normal and dehiscent inner ear The Journal of the Acoustical Society of America 144, 332 (2018); 10.1121/1.5046523 Perception of relative pitch of sentence-length utterances The Journal of the Acoustical Society of America 144, EL89 (2018); 10.1121/1.5048636 Effect of source filter interaction on isolated vowel-consonant-vowel perception The Journal of the Acoustical Society of America 144, EL95 (2018); 10.1121/1.5049510

Welcome message from author
This document is posted to help you gain knowledge. Please leave a comment to let me know what you think about it! Share it to your friends and learn new things together.
Transcript

A model and experimental approach to the middle ear transfer function related tohearing in the humpback whale (Megaptera novaeangliae)Andrew A. Tubelli, Aleksandrs Zosuls, Darlene R. Ketten, and David C. Mountain
Citation: The Journal of the Acoustical Society of America 144, 525 (2018); doi: 10.1121/1.5048421View online: https://doi.org/10.1121/1.5048421View Table of Contents: http://asa.scitation.org/toc/jas/144/2Published by the Acoustical Society of America
Articles you may be interested inThe communication space of humpback whale social sounds in wind-dominated noiseThe Journal of the Acoustical Society of America 144, 540 (2018); 10.1121/1.5047744
Auditory distraction by speech: Comparison of fluctuating and steady speech-like masking soundsThe Journal of the Acoustical Society of America 144, EL83 (2018); 10.1121/1.5048637
Variability of the inter-pulse interval in sperm whale clicks with implications for size estimation and individualidentificationThe Journal of the Acoustical Society of America 144, 365 (2018); 10.1121/1.5047657
Infrasound transmission in the human ear: Implications for acoustic and vestibular responses of the normal anddehiscent inner earThe Journal of the Acoustical Society of America 144, 332 (2018); 10.1121/1.5046523
Perception of relative pitch of sentence-length utterancesThe Journal of the Acoustical Society of America 144, EL89 (2018); 10.1121/1.5048636
Effect of source filter interaction on isolated vowel-consonant-vowel perceptionThe Journal of the Acoustical Society of America 144, EL95 (2018); 10.1121/1.5049510
A model and experimental approach to the middle ear transferfunction related to hearing in the humpback whale (Megapteranovaeangliae)
Andrew A. Tubelli,a) Aleksandrs Zosuls,b) Darlene R. Ketten, and David C. Mountainc)
Boston University Hearing Research Center and Department of Biomedical Engineering,44 Cummington Mall, Boston, Massachusetts 02215, USA
(Received 31 March 2018; revised 29 June 2018; accepted 11 July 2018; published online 1 August2018)
At present, there are no direct measures of hearing for any baleen whale (Mysticeti). The most via-
ble alternative to in vivo approaches to simulate the audiogram is through modeling outer, middle,
and inner ear functions based on the anatomy and material properties of each component. This paper
describes a finite element model of the middle ear for the humpback whale (Megaptera novaean-gliae) to calculate the middle ear transfer function (METF) to determine acoustic energy transmis-
sion to the cochlea. The model was developed based on high resolution computed tomography
imaging and direct anatomical measurements of the middle ear components for this mysticete
species. Mechanical properties for the middle ear tissues were determined from experimental mea-
surements and published values. The METF for the humpback whale predicted a better frequency
range between approximately 15 Hz and 3 kHz or between 200 Hz and 9 kHz based on two potential
stimulation locations. Experimental measures of the ossicular chain, tympanic membrane, and
tympanic bone velocities showed frequency response characteristics consistent with the model. The
predicted best sensitivity hearing ranges match well with known vocalizations of this species.VC 2018 Author(s). All article content, except where otherwise noted, is licensed under a CreativeCommons Attribution (CC BY) license (http://creativecommons.org/licenses/by/4.0/).https://doi.org/10.1121/1.5048421
[WWA] Pages: 525–535
I. INTRODUCTION
Little is known about the impact of anthropogenic noise
on baleen whales (Cetacea, suborder Mysticeti). Unlike
toothed whales (Cetacea, suborder Odontoceti), for which
there are behavioral and electrophysiological methods for
direct measures of the audiograms of multiple species, there
are currently no practical methods for reliable in vivo mea-
sures of the auditory thresholds of mysticetes.
The humpback whale (Megaptera novaeangliae) is a
species of concern because their critical habitats coincide
with ocean areas heavily used by humans for recreation,
transport, industrial, exploratory, and military purposes.
Multiple studies on the vocalizations of humpback whales
have been published (e.g., Payne et al., 1983; Silber, 1986;
Thompson et al., 1986; Clark, 1990; Au et al., 2006). While
it is expected that this species hears well at or near the peak
frequencies of these emitted sounds, vocalizations by many
vertebrate species are known to have significant features at
frequencies outside of the peak spectra of their vocalizations
(Dooling et al., 1979; Ladich and Yan, 1998; Meenderink
et al., 2010). Peak spectra are often near but not coincident
with best hearing sensitivities. Further, vocalizations
typically do not cover the entire range of hearing. For exam-
ple, the bottlenose dolphin (Tursiops truncatus) has a total
hearing range based on audiometric data of approximately
100 Hz to 160 kHz, while their whistles are typically
between 1 kHz to 24 kHz and clicks between 30 kHz and
60 kHz (see Wartzok and Ketten, 1999). It is also usual for
hearing ranges to include vocalization frequencies related to
predation and many abiotic signals in addition to the fre-
quencies of conspecific vocalizations (Ketten, 2002).
Therefore, vocalizations give us some indication but they
alone do not provide sufficient information for determining
hearing ranges or sensitivities. For this reason, we must
understand the receptor capabilities.
Given the lack of available auditory threshold measure-
ments and current inability to make direct audiometric mea-
surements, functional auditory system models derived from
anatomical and physical properties of ear tissues offer the
best insight into mysticete hearing. The audiogram can be
thought of as the synergistic response of the functional ele-
ments of each major division of the ear (external, middle,
and inner ear) to incoming acoustic signals (Dallos, 1973;
Rosowski, 1991; Ruggero and Temchin, 2002). By building
a series of models estimating the output at each functional
division of the ear, we obtain a composite estimated audio-
gram for species for which there is no experimentally mea-
sured live data counterpart. The external and middle ears
largely contribute to determining range of best sensitivity
and the bandwidth of the audiogram (Olson, 1998;
Overstreet and Ruggero, 2002; Ravicz et al., 2008), while
a)Current address: Broad Institute of MIT and Harvard, 415 Main Street,
Cambridge, MA 02142, USA. Electronic mail: [email protected])Also at: Biology Department, Woods Hole Oceanographic Institution, 266
Woods Hole Road, Woods Hole, MA 02543, USA.c)Posthumous
J. Acoust. Soc. Am. 144 (2), August 2018 VC Author(s) 2018. 5250001-4966/2018/144(2)/525/11

the basilar membrane and cochlear structure dictate total
possible hearing range and the high-frequency cutoff
(Ruggero and Temchin, 2002) as well as low-frequency cut-
offs (Manoussaki et al., 2008).
Extensive descriptions of whale ear anatomy are avail-
able (e.g., Lillie, 1910; Yamada, 1953; Fraser and Purves,
1960; Ketten, 2000; Mead and Fordyce, 2009; Ekdale et al.,2011). We provide here a brief summary of key features.
The functional elements of the inner ear and middle ear
(cochlear labyrinth and ossicular chain) have essentially the
same format as found in terrestrial mammals. The ear com-
plex of cetaceans differs in that the fundamental ear struc-
tures are housed in two dense, connected bones: the
tympanic and periotic bones that are wholly or partially
decoupled from the skull. The tympanic bone is a hollow,
shell-shaped bone that forms the middle ear cavity and con-
tains the three ossicles with associated ligaments, nerves,
and spongy mucosal tissues (corpus cavernosum). The peri-
otic bone contains the cochlear and vestibular labyrinths.
The tympanic and periotic bones are fused at their posterior
edges, forming the tympano-periotic complex, which is posi-
tioned extracranially. The complex is attached to a groove in
the skull by a bony flange of the periotic. The tympanic
membrane (referred to commonly as a “glove finger” based
on its elongated, hollow, everted shape) projects laterally
into the ear canal and has a conical wax cap at its tip (Fraser
and Purves, 1960; Ketten, 2000). The ear canal extends later-
ally and posteriorly, paralleling the bony flange and is nar-
row and largely occluded with wax and debris.
It is yet undetermined exactly how sound is conducted
to the ear in most cetaceans including mysticetes. The exten-
sive anatomical level of development of the middle ear
structures and particularly the tympanic membrane argues
against the middle ear being dysfunctional and that transmis-
sion to the cochlea is principally by bone conduction, as
argued by Cranford and Krysl (2015). We also know that
middle ear ligaments and tissues, particularly the stapedial
muscle, are well developed in baleen whales as well as in all
odontocete species that have been examined (Fleischer,
1978; McCormick et al., 1980; Pilleri et al., 1987; Ketten,
1992; Ketten, 1994). Further, as in odontocetes, specialized
elongated bundles of fats exist in mysticetes that are aligned
with the jaw and terminate on the tympano-periotic complex
on or near the tympanic membrane (Yamato et al., 2012).
In a previous study, we modeled the middle ear of the
minke whale (Balaenoptera acutorostrata) (Tubelli et al.,2012) computationally using the finite element (FE) method,
where geometries of varying complexity are broken up into
elements and solved for numerically. This method has been
used to study the middle ears of multiple species of terres-
trial mammals (Koike et al., 2002; Gan et al., 2004; Homma
et al., 2009; Homma et al., 2010; Wang and Gan, 2016; De
Greef et al., 2017). The current study builds on this prior
demonstration of the application of established FE work for
the minke whale by Tubelli et al. (2012), employing the
same methods but with higher resolution models to increase
our accuracy for assessing the hearing range in the hump-
back whale via the middle ear transfer function (METF).
Experimentally-measured data taken directly on middle ears
from this same species are also presented to further assist
with interpreting the model results.
II. FE MODEL
A. Anatomical reconstruction
A comprehensive middle ear reconstruction was created
as a composite of separate reconstructions from computed
tomography scan data sets from three different humpback
whale ear specimens of similar size (e.g., measured lengths
at the sigmoid processes and mallei were within 7% of each
other) and condition. By combining the scan data, we opti-
mized the quality of individual tissues represented in the
composite reconstruction. Specimens employed in the pro-
ject were obtained in collaboration with the Mid-Atlantic
and New England regions of the US stranding network. The
ears were collected by stranding network responders during
necropsies of beached carcasses in North Carolina, New
York, and Massachusetts. After collection, the ear tissues
were sent to Woods Hole Oceanographic Institution (WHOI)
for analysis under letters of authorization and US Fish and
Wildlife service/National Marine Fisheries Services permits
(932-1489-08, 493-1848-00, 493-1848-02, 130062, and
130062-1) issued to D. R. Ketten, WHOI. The carcasses
were designated Code 3 (moderate decomposition) by the
responders at time of necropsy. The specimens employed for
this study consisted of ears from a yearling female, subadult
female, and an adult male. Additional information on the
specimens is provided in Table I.
All ears were scanned using a Volume Zoom Spiral
Scanner (Siemens AG, Munich) with ultra-high bone and
mid soft tissue kernels. Scans were obtained using a 0.5 mm
spiral acquisition at 120 KV and 240 mA with the ears
aligned for transaxial images paralleling the cochlear mid-
modiolar plane. Baseline images were formatted at 0.1 mm
isotropic voxels throughout the entire tympano-periotic com-
plex. Secondary images were obtained as well from aniso-
tropic reformatted images with 0.2� 0.2� 0.5 mm voxels.
Multiplanar reformats were also produced in orthogonal
views with reconstructions and reformatted reslicing to pro-
vide ultra-high-resolution images of the ossicular chain
regions. Both raw acquisition data and all DICOM images
were archived for each ear.
TABLE I. Specimens used in this study.
Specimen Side Sex Age Condition of tissue Function in this study
Mnov22 Left M Adult Code 3 (moderate decomposition) Model (TM) and experimental
Mnov26 Left F Yearling Code 3 (moderate decomposition) Model (bone and interossicular joints)
Mnov31 Right F Subadult Code 3 (moderate decomposition) Model (suspensory soft tissue)
526 J. Acoust. Soc. Am. 144 (2), August 2018 Tubelli et al.

Regions and structures of interest in the DICOM image
stack were segmented using the software program AMIRA
(Mercury Computer Systems, Chelmsford, MA). The seg-
mented regions for M. novaeangliae middle ears include
bone (malleus, incus, stapes, and tympanic bone), articular
soft tissue (incudomalleolar joint and incudostapedial joint),
tympanic membrane, suspensory soft tissue (the posterior
incudal ligament that connects the incus to the periotic bone
and the stapedius tendon that connects the stapedius muscle
to the head of the stapes), and annular ligament of the oval
window (Fig. 1). Segmented regions from each of the three
reconstructed ears were selected according to the health or
integrity of the post mortem tissues. One specimen was used
for only the tympano-periotic bone reconstruction as some
soft tissues had sufficient post mortem artifacts that they
were deemed unreliable for accurate measures. Of the two
other scan data sets, one provided a well preserved, reliable
representation for the tympanic membrane reconstruction,
and the other additional data on the stapedial tendon and
posterior incudal ligament measures and insertion points.
Anatomical measurements of lengths and angles of the tis-
sues were obtained during post-scan dissections to confirm
the accuracy of the reconstructions. One suspensory tissue
that was observed in the minke whale by Tubelli et al.(2012), the tensor tympani tendon, was not observed in any
of the M. novaeangliae specimens that were dissected;
however, we cannot definitively conclude from these sam-
ples that the tensor tympani muscle is absent in the hump-
back whale.
B. FE analysis
The geometry of both reconstructions was retopologized
in Maya (Autodesk Inc., San Rafael, CA) to better fit the
contour of the models. The finalized geometry of the M.novaeangliae reconstruction contained 26615 triangular sur-
face elements.
Linear FE analysis of the middle ear model was per-
formed using COMSOL Multiphysics (COMSOL Inc.,
Stockholm). The surface geometry translated to a mesh con-
sisting of 49423 tetrahedral elements using COMSOL’s free
mesher and solved within the software to determine the fre-
quency response between 1 Hz and 100 kHz.
C. Material properties
Almost none of the material properties of interest have
been directly measured for M. novaeangliae, but using exist-
ing literature and knowledge of anatomical similarities, we
can estimate physiologically relevant values for these prop-
erties. Table II summarizes the values used for the hump-
back whale middle ear model. All materials were modeled
as linear and isotropic.
FIG. 1. Labeled mesh of the humpback whale middle ear model. (a) Lateral view, inset has the same view with tympanic membrane removed to show one of
the bony connections to the periotic bone, (b) ventral view, (c) dorsal view (tympanic membrane and tympanic bone hidden), and (d) medial view (tympanic
bone hidden). Also shown are fixed boundary conditions (distal edges of soft tissues and bony connections to periotic bone, in green), and input areas (varia-
tions of red) for the tympanic bone and gradation of input locations for the tympanic membrane used for sensitivity analysis. The middle shade of red to the tip
of the tympanic membrane indicates the area used in the base model.
J. Acoust. Soc. Am. 144 (2), August 2018 Tubelli et al. 527
1. Young’s modulus of bone
Young’s modulus, the ratio of stress to strain that
describes the stiffness of a material, of bone in the model
was based on nanoindentation measurements from Tubelli
et al. (2014). That study did not include measurements for
humpback whale ossicles; however, in considering a single
value of Young’s modulus for all bone that assumed unifor-
mity, two groups of values emerged: a higher Young’s mod-
ulus for odontocetes averaging around 60 GPa and a lower
Young’s modulus for mysticetes averaging around 35 GPa.
If we assume that these values are representative of those for
other species in the suborders, then the average of mysticete
measurements can be employed as the Young’s modulus
value for humpback whale middle ear bones.
2. Bone density
Bone densities for M. novaeangliae middle ear ossicles
measured by Nummela et al. (1999) ranged from 2.27� 103
to 2.33� 103 kg/m3 depending on the structure measured.
An average value of 2.30� 103 kg/m3 was used here across
all bony regions in the model.
To further assess whether this value is appropriate to
use for humpback whale middle ear bone, an estimate of
density was calculated by measuring the mass of each ossicle
from one humpback whale specimen and the corresponding
volume computationally measured from the reconstruction
of those same ossicles. Density was estimated to be within
11.6%, 8.3%, and 1.3% of the average value noted above for
the malleus, incus, and stapes, respectively; therefore, we
can reasonably conclude that the average M. novaeangliaemiddle ear bone density calculated from Nummela et al.(1999) is a sufficient model value.
3. Young’s modulus of soft tissue
Since there are no direct measurements of Young’s
moduli for soft tissues of the ear in any species, we must
take one of two approaches: rely on parameter values used in
other middle ear models that were based on tuning model
output data to experimental results or estimate them based
on the range of values for any directly measured mammalian
soft tissues. In previous FE studies, Young’s modulus values
used for ligaments and tendons were on the order of a mega-
pascal plus or minus one order of magnitude (e.g., Koike
et al., 2002; Gan et al., 2004; Homma et al., 2010; De Greef
et al., 2017). Experimentally measured values of soft tissue
Young’s moduli, the majority of which are for ligaments and
tendons in the knee and shoulder of humans, are generally
on the order of hundreds of megapascals (e.g., St€aubli et al.,1999; McGough et al., 1996; Provenzano et al., 2002;
Hashemi et al., 2005; Chandrashekar et al., 2006). The rea-
son for the discrepancy between experimentally measured
Young’s moduli and model-derived values is unclear.
Sensitivity analysis of soft tissue Young’s moduli was per-
formed within this range (0.1–900 MPa) of values to deter-
mine how these changes affect the middle ear frequency
response.
For the humpback whale middle ear model, a base value
of 10 MPa was used across all soft tissues, with the exception
of the annular ligament and the tympanic membrane. The
annular ligament was consistently lower in most middle ear
models and is treated separately here because of its unique
fiber orientation (Fleischer, 1978). The value used for the
base model was 0.29 MPa, an average of four other middle
ear model studies (De Greef et al., 2017; Homma et al.,2010; Koike et al., 2002; Wang and Gan, 2016). The model
value used for annular ligament is 3% of the suspensory and
articular soft tissue value. This ratio was kept for sensitivity
analysis when testing low and high values: 3 kPa and
27 MPa, respectively. The value of Young’s modulus for the
tympanic membrane was the same used for the minke whale
Tubelli et al. (2012) based on the observation that the struc-
ture is most similar to the pars flaccida of the terrestrial
mammalian tympanic membrane (Fraser and Purves, 1954).
Sensitivity analysis of Young’s modulus for the tympanic
membrane was performed within the same range as soft tis-
sue parametric analysis (0.1–900 MPa) to address effects of
parameter value uncertainty on the model.
4. Soft tissue density
To estimate soft tissue density, we similarly investigated
previous FE studies as well as directly measured density val-
ues from the literature. Most of the middle ear FE model
density values were traced back to sources that used an
assumption rather than direct measurements. Rather than
relying on assumption, we used an average value calculated
from direct measurements of tendinous tissue density from
various non-auditory terrestrial mammalian tendons in the
literature (1.32� 103 kg/m3) (Ker, 1981; Kuo et al., 2001;
Hashemi et al., 2005).
5. Poisson’s ratio
In the model, a value of 0.3 was used for Poisson’s ratio
(a ratio of transverse strain to longitudinal strain) for bone;
this value is commonly used for bone in middle ear models
(e.g., Gan et al., 2004; Homma et al., 2010). Since soft tissue
is nearly incompressible, a Poisson’s ratio value of 0.45 was
used as it is closer to that of an incompressible material, sim-
ilar to Qi et al. (2006) and Tuck-Lee et al. (2008).
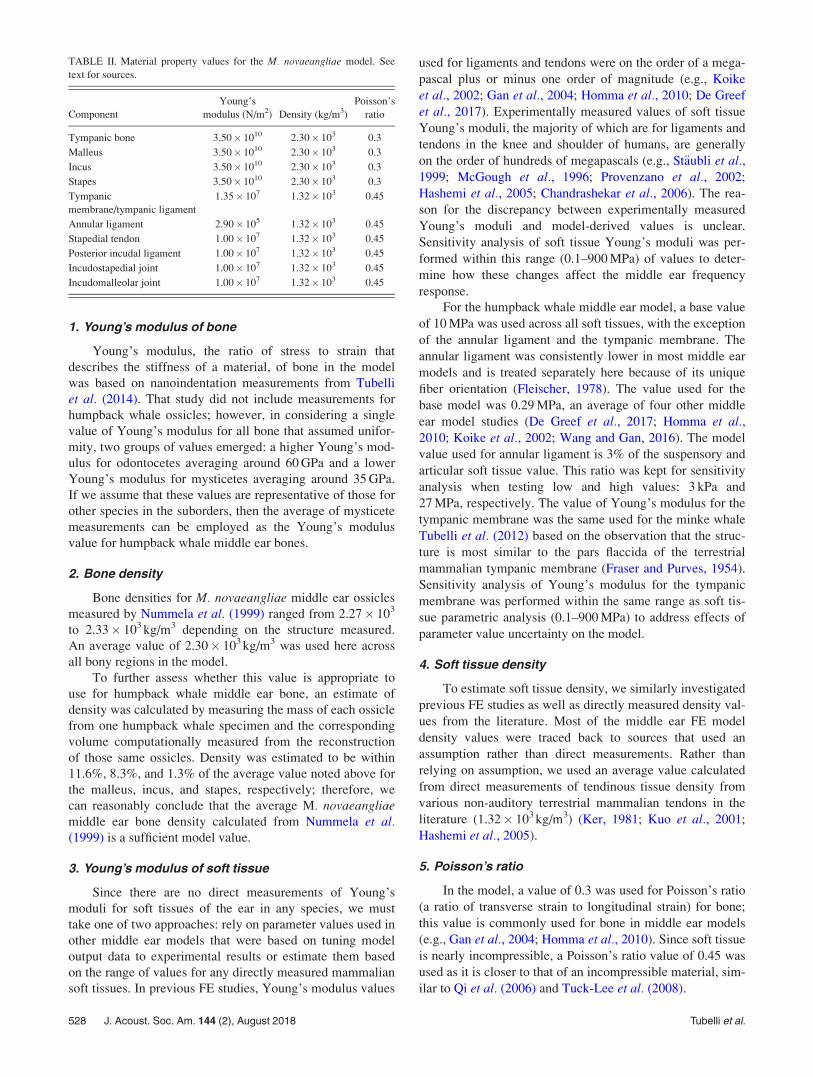
TABLE II. Material property values for the M. novaeangliae model. See
text for sources.
Component
Young’s
modulus (N/m2) Density (kg/m3)
Poisson’s
ratio
Tympanic bone 3.50� 1010 2.30� 103 0.3
Malleus 3.50� 1010 2.30� 103 0.3
Incus 3.50� 1010 2.30� 103 0.3
Stapes 3.50� 1010 2.30� 103 0.3
Tympanic
membrane/tympanic ligament
1.35� 107 1.32� 103 0.45
Annular ligament 2.90� 105 1.32� 103 0.45
Stapedial tendon 1.00� 107 1.32� 103 0.45
Posterior incudal ligament 1.00� 107 1.32� 103 0.45
Incudostapedial joint 1.00� 107 1.32� 103 0.45
Incudomalleolar joint 1.00� 107 1.32� 103 0.45
528 J. Acoust. Soc. Am. 144 (2), August 2018 Tubelli et al.

D. Boundary conditions
Because of uncertainty of how sound reaches the middle
ear, an input pressure was tested on two separate areas
resulting in two separate models. These two models are here
referred to as the tympanic bone (TB) model and the tym-
panic membrane (TM) model. For the TB model, an input
pressure was applied to a region 37.32 mm2 adjacent to the
sigmoid process, a projecting ridge on the lateral surface of
the tympanic bone. This region of bone is a region near
where specialized fats that are thought to act as a preferential
sound path to the ear contact the tympano-periotic complex
and tympanic membrane in the minke whale (Yamato et al.,2012) and odontocetes (Norris, 1968; Ketten, 2000). The
second region of input tested in the TM model was the tym-
panic membrane itself (see Fig. 1). Given the hypertrophied
“glove finger” structure of the tympanic membrane in mysti-
cetes and its firm attachment to the manubrium of the mal-
leus, it is arguable that this elaborate tympanic membrane
has some involvement in mysticete hearing. The surface
areas of stimulation of the tympanic membrane, based on
surrounding anatomy and potentially based on frequency,
could range anywhere from the membrane tip which abuts a
ceruminous or wax cap (Purves, 1955) to the entire length of
the non-ligamentous portion external to the middle ear cav-
ity. The area used for the base METF was in the middle of
these extremes, 1710 mm2. Four additional input areas, from
the small tip area to the full membrane area within the audi-
tory canal, were examined via sensitivity analysis. These
input areas are shown in Fig. 1. Their areas are as follows:
140.9 mm2, 803.8 mm2, 2491 mm2, and 3391 mm2.
The input pressure is arbitrary since the model is linear.
A constant value of 100 Pa was used for both models and
applied normal to the surface for both TB and TM models.
In both models, the distal edges of the suspensory soft
tissues (the posterior incudal ligament at its connection to
the periotic bone and the stapedius tendon at its connection
to the muscle body) were fixed. The connections to the peri-
otic bone (the outer edge of the annular ligament and the two
bony attachments of the tympanic bone on either side of the
sigmoid process) were also fixed. These regions are illus-
trated in Fig. 1.
Rayleigh damping, a type of damping that is mass- and
stiffness-proportional, was applied to all geometry within the
model. The damping parameters used were as follows:
damping coefficient a, 1� 103 s�1; and damping coefficient
b, 1� 10�5 s. Coefficient b was chosen to be on the order of
that used in other auditory FE models (e.g., Koike et al.,2002; Gan et al., 2004). Coefficient a was chosen to mini-
mize resonances in the middle ear response. Cochlear damp-
ing was applied to the stapes footplate using the same
cochlear damping constant, 0.217 N s/m, from Tubelli et al.(2012).
Output of the model was taken as the output velocity at
the central node of the stapes footplate divided by input pres-
sure, giving a frequency-dependent transfer function with
the units of nm/Pa s.
III. EXPERIMENTAL COMPARISON
In an effort to validate the model, we experimentally
measured the middle ear frequency response of a M.novaeangliae ear. The specimen employed (Mnov22, Table I)
was a left ear obtained from a code 3 (low to moderate
decomposition) stranded adult male humpback whale. The
periotic bone of the ear was fixed to an air-cushioned vibra-
tion isolation table and a mechanical transducer was used to
stimulate the ear. A vibrometer was used to measure the
velocity of several points of the ear complex. Immobilizing
the periotic bone reduces motion in the cochlear labyrinth
components, the annular ligament, and the bony symphysis
between the periotic and tympanic bones, approximating a
fixed boundary condition paralleling the model. The experi-
ment was performed in air, not underwater due to equipment
limitations. The methods used are similar to experimental
measurements on odontocete ears in Zosuls et al. (2015),
except a low-frequency transducer was implemented to
increase the signal-to-noise ratio at lower frequencies. The
bandwidth ranged from 2 Hz to 5 kHz.
Figure 2(a) shows a block diagram of the experimental
setup. MATLAB (MathWorks, Inc., Natick, MA) scripts were
used to generate stimuli and run the experiments. Forty loga-
rithmically spaced sinusoidal stimuli were synthesized with
a National Instruments PCI-6052 16-bit data acquisition card
(National Instruments, Austin, TX). A 25 kHz low-pass filter
was used to reconstruct the stimuli which were sent to a
Hafler DH200 power amplifier (Hafler, Port Coquitlam,
Canada). The transducer driven by the amplifier consisted of
a modified loudspeaker (Dayton Audio, Springboro, OH)
with a threaded aluminum coupler bonded to the voice coil.
FIG. 2. (a) Block diagram of the experimental setup. Also shown are measurement locations (red dots). (b) Photo of the sample in place on the vibration isola-
tion table coupled to loudspeaker setup.
J. Acoust. Soc. Am. 144 (2), August 2018 Tubelli et al. 529

The tympanic membrane was fixed to the coupler with
cyanoacrylate adhesive (Great Planes Model Manufacturing,
Champaign, IL) as shown in Fig. 2(b). Once the bond was
cured, the tympanic membrane was placed in tension by
retracting the loudspeaker from the ear while maintaining
the voice coil in the speaker magnet to maintain speaker lin-
earity. Cyanoacrylate adhesive and clamps were then added
to fix the sample to a custom machined ear holder that was
bolted to the vibration isolation table. During the experi-
ment, the ear was irrigated with 0.9% phosphate buffered
saline to maintain its condition.
A laser Doppler velocimeter (LDV) (Polytec OFV-511;
Polytec Inc., Hudson, MA) was used to measure velocity at
multiple locations: the manubrium of the malleus, the center
of the stapes footplate, and the loudspeaker voice coil. The
loudspeaker voice coil measurement was taken as the input to
the system given the strong bond between to the voice coil
assembly and the sample; i.e., the tip of the tympanic mem-
brane was assumed to have the same velocity as the voice coil
at the stimulus frequencies used. The output of the LDV was
conditioned with a Tucker Davis FT6 low-pass filter with a
corner frequency of 125 kHz followed by a Tektronix AM502
(Tektronix, Inc., Beaverton, OR) anti-aliasing filter and ampli-
fier before it was digitized at a sampling rate of 80.6 kHz with
the National Instruments PCI-6052. The digitized data was
fast Fourier transformed and the stimulus frequency point was
extracted to determine the magnitude and phase.
To ensure the measurements at the stapes and malleus
were not an artifact of the whole ear vibrating, reference
velocity measurements were taken in two places: on the peri-
otic bone by the oval window within 3 mm of the stapes foot-
plate and on the medial wall of the tympanic bone.
Velocity measurements were made also with the cyano-
acrylate bond from the transducer to tympanic membrane
severed in order to measure air borne acoustic stimulation of
the ear rather than coupled mechanical stimulation.
Velocities measured with the tympanic membrane decoupled
were undetectable from the noise floor.
IV. RESULTS
A. Main models
Figure 3 shows the humpback whale METF for both the
TB and TM models. The peak frequency for the TM model
occurs between 1 and 2 kHz with a high-frequency slope that
drops off sharply at 100 dB/decade after the peak. The peak
frequency of the TB METF occurs around 3 kHz, higher in
frequency than for the TM model, but one order of magni-
tude lower, with a drop-off of 80 dB/decade. The best fre-
quency ranges from both models coincide with known peak
vocalization frequencies for humpback whale songs.
B. Model sensitivity analysis
Sensitivity analysis was performed on the Young’s mod-
uli of soft tissue (posterior incudal ligament, stapedial ten-
don, and the two joints), annular ligament, and tympanic
membrane to determine their effects on the METF (Fig. 4).
For the TB model, an increase in soft tissue Young’s
modulus produces a larger bandwidth, between 200 Hz and
FIG. 3. Transfer function curves for the TM and TB models. The low and
high cutoffs for ranges of best hearing for each model, as determined by the
range of sensitivities within �40 dB of the peak values, are indicated with
circles for each METF. The dominant frequency range of vocalizations for
humpback whale songs is also given for comparison (see Wartzok and
Ketten, 1999).
FIG. 4. Sensitivity analysis of the TM and TB models to soft tissue, annular ligament, and tympanic membrane Young’s moduli.
530 J. Acoust. Soc. Am. 144 (2), August 2018 Tubelli et al.

50 kHz, whereas a decrease in soft tissue Young’s modulus
reduces the bandwidth to between 100 Hz and 4 kHz. The
peaks are also shifted up in frequency to 3.5 kHz and down
in frequency to 1 kHz when increasing and decreasing soft
tissue Young’s modulus, respectively. For the TM model, a
higher soft tissue Young’s modulus yields a peak shift to
slightly above 2 kHz, while a lower soft tissue Young’s mod-
ulus does not yield a peak shift. In both cases, increasing and
decreasing soft tissue Young’s modulus results in the METF
generally decreasing in magnitude.
In both models, decreasing the annular ligament Young’s
modulus has an insignificant effect on the METF. Increasing
the annular ligament Young’s modulus decreases the METF
by an order of magnitude for both models up to 8 kHz, above
which the METFs generally remain unchanged.
Decreasing Young’s modulus of the tympanic mem-
brane has a significant effect on the TM model METF by
attenuating mid and high frequencies, removing the peak
entirely. Increasing the tympanic membrane Young’s modu-
lus to the upper limit of 9� 108 Pa causes such a dramatic
decrease in the TM model METF magnitude that the entire
curve is below the plotted range of magnitude values.
Decreasing Young’s modulus of the tympanic membrane for
the TB model has no effect on the METF; increasing
Young’s modulus introduces some resonances between
200 Hz and 7 kHz, but the METF shape remains otherwise
unchanged.
In general, a larger input pressure area on the tympanic
membrane in the TM model results in a higher magnitude
and a shift in the peak to a higher frequency, whereas a
smaller input area has the opposite effect on the METF (Fig.
5). Within the range of tested values, from the tip of the tym-
panic membrane to the length of the tympanic membrane
external to the middle ear cavity, the peak shifted between
800 Hz to 2 kHz.
C. Experimental results
Figure 6 shows the velocity magnitude transfer func-
tions for the model and the experiment. The transfer function
outputs were the manubrium of the malleus and the stapes
footplate. The velocities measured are the result of a pres-
sure input on the tip of the tympanic membrane. In the
experiments, the tip of the tympanic membrane was coupled
to a force. The model curves in Fig. 6 were generated with
the material property values in Table II and an input surface
area at the tip of the tympanic membrane that was similar to
that of the aluminum coupler in the experiment. The experi-
ment yields a nearly perfect efficiency of the velocity trans-
fer from the tympanic membrane tip to its insertion on the
malleus at 1 kHz. The model displays a peak efficiency close
to 1 kHz corresponding to the TM model METF peak. The
magnitude differences between the two outputs are more
pronounced in the experiments than for the models.
V. DISCUSSION
We can test the validity of the humpback whale METF
by considering the resultant velocity at the stapes footplate
at estimated hearing thresholds compared to those measured
in terrestrial mammals. The hearing threshold was estimated
to be 70 dB re 1 lPa based on odontocete audiograms
(Johnson, 1968; Szymanski et al., 1999). Multiplying the
METF by the pressure at the 70 dB threshold (0.003162 Pa)
results in a stapes velocity of 24 nm/s at the most sensitive
region in the METF. This velocity is similar to other species
as shown in Tubelli et al. (2012).
Characteristic “song” vocalizations of humpback whales
range from 40 Hz up to 4 kHz for the dominant frequencies.
The best hearing range, based on �40 dB from the peak
transfer function magnitude, predicted by the TM model is
between 15 Hz and approximately 3 kHz. The TB model pre-
dicts a best hearing range of 200 Hz to approximately 9 kHz.
Thus, a composite of the two model results essentially cover
the entire range of vocalization frequencies described in the
current literature and are consistent with the peak spectra of
the vocalization data (Wartzok and Ketten, 1999).
The shapes of the METF for humpback whale from this
study and for minke whales from Tubelli et al. (2012) are
similar. The minke METF has more resonances that can be
attributed to a lower Rayleigh damping coefficient a used in
that model. Humpback best hearing range is predicted to
have an upper-frequency cutoff of 3 kHz, lower than that of
the minke whale at 7.5 kHz, with stimulation at the tympanic
membrane. Similarly, stimulation at the tympanic bone
yields an upper-frequency cutoff of 9 kHz compared to
25 kHz for the minke whale ear. This result is supported byFIG. 5. Sensitivity analysis of the TM model to input area.
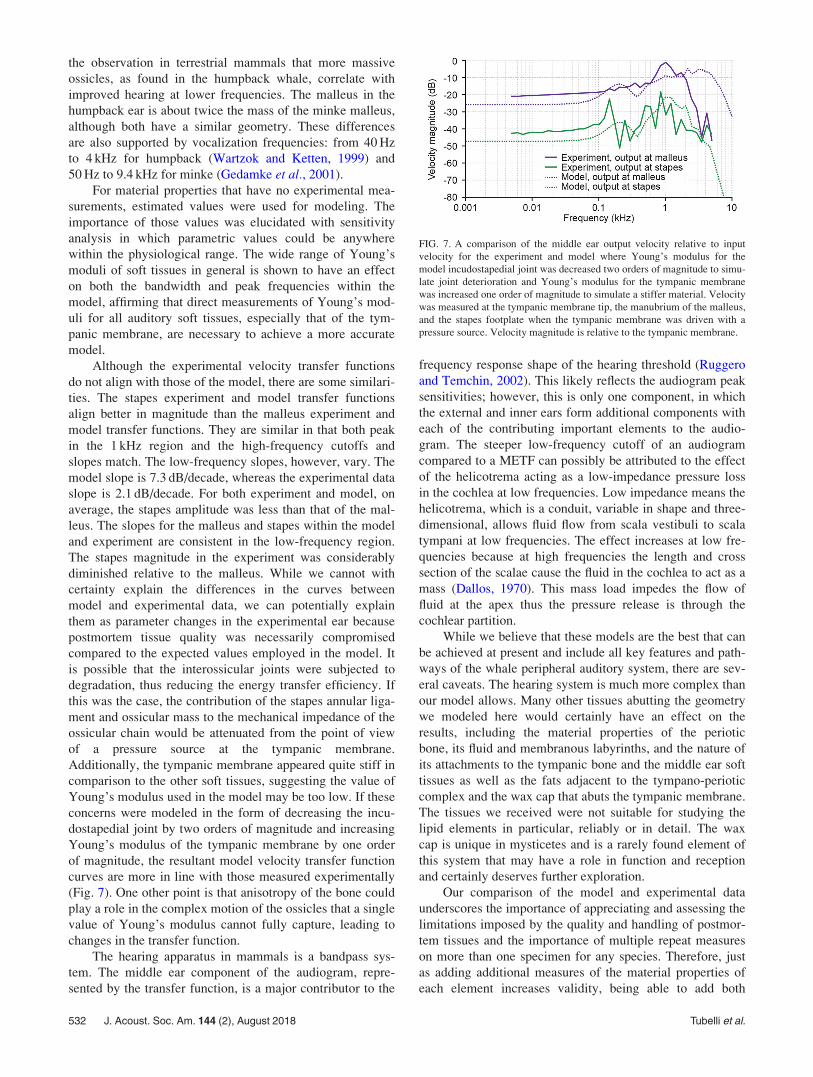
FIG. 6. A comparison of the middle ear output velocity relative to input
velocity for the experiment and model. Velocity was measured at the tym-
panic membrane tip, the manubrium of the malleus, and the stapes footplate
when the tympanic membrane was driven with a pressure source. The veloc-
ity magnitude in dB is relative to the tympanic membrane. To reproduce the
experiment more accurately, the surface area of the model pressure source
was matched to the area of the stimulator connection in the experiment.
J. Acoust. Soc. Am. 144 (2), August 2018 Tubelli et al. 531
the observation in terrestrial mammals that more massive
ossicles, as found in the humpback whale, correlate with
improved hearing at lower frequencies. The malleus in the
humpback ear is about twice the mass of the minke malleus,
although both have a similar geometry. These differences
are also supported by vocalization frequencies: from 40 Hz
to 4 kHz for humpback (Wartzok and Ketten, 1999) and
50 Hz to 9.4 kHz for minke (Gedamke et al., 2001).
For material properties that have no experimental mea-
surements, estimated values were used for modeling. The
importance of those values was elucidated with sensitivity
analysis in which parametric values could be anywhere
within the physiological range. The wide range of Young’s
moduli of soft tissues in general is shown to have an effect
on both the bandwidth and peak frequencies within the
model, affirming that direct measurements of Young’s mod-
uli for all auditory soft tissues, especially that of the tym-
panic membrane, are necessary to achieve a more accurate
model.
Although the experimental velocity transfer functions
do not align with those of the model, there are some similari-
ties. The stapes experiment and model transfer functions
align better in magnitude than the malleus experiment and
model transfer functions. They are similar in that both peak
in the 1 kHz region and the high-frequency cutoffs and
slopes match. The low-frequency slopes, however, vary. The
model slope is 7.3 dB/decade, whereas the experimental data
slope is 2.1 dB/decade. For both experiment and model, on
average, the stapes amplitude was less than that of the mal-
leus. The slopes for the malleus and stapes within the model
and experiment are consistent in the low-frequency region.
The stapes magnitude in the experiment was considerably
diminished relative to the malleus. While we cannot with
certainty explain the differences in the curves between
model and experimental data, we can potentially explain
them as parameter changes in the experimental ear because
postmortem tissue quality was necessarily compromised
compared to the expected values employed in the model. It
is possible that the interossicular joints were subjected to
degradation, thus reducing the energy transfer efficiency. If
this was the case, the contribution of the stapes annular liga-
ment and ossicular mass to the mechanical impedance of the
ossicular chain would be attenuated from the point of view
of a pressure source at the tympanic membrane.
Additionally, the tympanic membrane appeared quite stiff in
comparison to the other soft tissues, suggesting the value of
Young’s modulus used in the model may be too low. If these
concerns were modeled in the form of decreasing the incu-
dostapedial joint by two orders of magnitude and increasing
Young’s modulus of the tympanic membrane by one order
of magnitude, the resultant model velocity transfer function
curves are more in line with those measured experimentally
(Fig. 7). One other point is that anisotropy of the bone could
play a role in the complex motion of the ossicles that a single
value of Young’s modulus cannot fully capture, leading to
changes in the transfer function.
The hearing apparatus in mammals is a bandpass sys-
tem. The middle ear component of the audiogram, repre-
sented by the transfer function, is a major contributor to the
frequency response shape of the hearing threshold (Ruggero
and Temchin, 2002). This likely reflects the audiogram peak
sensitivities; however, this is only one component, in which
the external and inner ears form additional components with
each of the contributing important elements to the audio-
gram. The steeper low-frequency cutoff of an audiogram
compared to a METF can possibly be attributed to the effect
of the helicotrema acting as a low-impedance pressure loss
in the cochlea at low frequencies. Low impedance means the
helicotrema, which is a conduit, variable in shape and three-
dimensional, allows fluid flow from scala vestibuli to scala
tympani at low frequencies. The effect increases at low fre-
quencies because at high frequencies the length and cross
section of the scalae cause the fluid in the cochlea to act as a
mass (Dallos, 1970). This mass load impedes the flow of
fluid at the apex thus the pressure release is through the
cochlear partition.
While we believe that these models are the best that can
be achieved at present and include all key features and path-
ways of the whale peripheral auditory system, there are sev-
eral caveats. The hearing system is much more complex than
our model allows. Many other tissues abutting the geometry
we modeled here would certainly have an effect on the
results, including the material properties of the periotic
bone, its fluid and membranous labyrinths, and the nature of
its attachments to the tympanic bone and the middle ear soft
tissues as well as the fats adjacent to the tympano-periotic
complex and the wax cap that abuts the tympanic membrane.
The tissues we received were not suitable for studying the
lipid elements in particular, reliably or in detail. The wax
cap is unique in mysticetes and is a rarely found element of
this system that may have a role in function and reception
and certainly deserves further exploration.
Our comparison of the model and experimental data
underscores the importance of appreciating and assessing the
limitations imposed by the quality and handling of postmor-
tem tissues and the importance of multiple repeat measures
on more than one specimen for any species. Therefore, just
as adding additional measures of the material properties of
each element increases validity, being able to add both
FIG. 7. A comparison of the middle ear output velocity relative to input
velocity for the experiment and model where Young’s modulus for the
model incudostapedial joint was decreased two orders of magnitude to simu-
late joint deterioration and Young’s modulus for the tympanic membrane
was increased one order of magnitude to simulate a stiffer material. Velocity
was measured at the tympanic membrane tip, the manubrium of the malleus,
and the stapes footplate when the tympanic membrane was driven with a
pressure source. Velocity magnitude is relative to the tympanic membrane.
532 J. Acoust. Soc. Am. 144 (2), August 2018 Tubelli et al.

realistic elements through more features and properties and
in more mysticete species is a critical step for a comprehen-
sive answer to mysticete hearing. Any guesses about the
material properties and structures of elements, like the wax
cap and peribullar fats, raise associated concerns for omis-
sions or errors in model results. In parallel, drawing conclu-
sions solely from a single measure of an imperfect ear can
lead to misestimates. Performing transfer function measure-
ments on more ears in better condition will improve the con-
fidence and comparison of model and actual tissue measures.
Even more important, as the variations between minke and
humpback data show clearly, through the application of par-
allel techniques and analyses, simple extrapolations from
one species to another are inappropriate and lumping all
mysticetes into one hearing category is unlikely to be valid.
Another caveat is the uncertainty of input into the mid-
dle ear. There are two potential inputs based on the theories
put forth for cetacean hearing (conventional tympanic mem-
brane and ossicular motion vs bone conduction) (see Ketten,
2000 for discussion). Inertial movement of the tympanic rel-
ative to the periotic resulting in ossicular motion has been
proposed by previous publications (Fleischer, 1978;
McCormick et al., 1970; Hemil€a et al., 1995; Cranford and
Krysl, 2015). This mode relies on differential displacement
of the skull and the tympanic bone, which has not been dem-
onstrated for acoustic stimuli and is contrary to best stimula-
tion sites with jawphone experiments on odontocetes (Brill,
1988; Popov and Supin, 1990; Møhl et al., 1999; Brill et al.,2001; Mooney et al., 2013). No data to date have specifically
tested either input for mysticetes.
Of the two inputs tested, the highly-specialized tym-
panic membrane appears to be the more likely acoustic input
rather than tympanic bone motion, as the fibrous tissue of
the tympanic membrane is connected to and consistent with
direct motion of the ossicles.
The tympanic bone may seem to respond well here, but
we are using a mechanical pressure. Based on the theory for
odontocetes and the known anatomy, the pressure is not
mechanical but rather acoustic, propagating through special-
ized fats and into the cavity of the tympano-periotic com-
plex. Properties of these fats, including their acoustic
properties, have been explored in some cetaceans (Koopman
et al., 2006; Prasad, 2003; Yamato et al., 2012) but still
require further investigation to properly understand their
material and acoustic properties. An acoustic signal is likely
to be reflected from bone, if that were the primary input,
resulting in a substantial attenuation of any signal via bone
conduction alone. Further, we have not found an example in
which jaw fats are not connected to the tympanic membrane.
Nevertheless, we considered and tested the bone conduction
theory through stimulation of the tympanic bone alone in the
TB model as described above and found it inferior to tym-
panic membrane stimulation with respect to magnitude of
response. Further, sound speeds in the jaw fats are slower,
which is highly suggestive of a preferential water-adapted
low impedance channel to the tympanic membrane just as
the air-filled external auditory canal is the lowest impedance
channel in air-adapted mammalian ears.
No mammal is known to have bone conduction as the
primary pathway of sound to the ear. While some mammals
can sense sound via bone conduction, it is considered an
auxiliary path that in some lower animals is effective but is
superseded by ossicular paths in mammals (Manley and
Sienknecht, 2013). As Hood (1962) stated in his summary of
fundamental bone conduction research, von B�ek�esy showed
“the evolutionary development of the ossicular chain would
appear to be directed towards reducing bone conducted
sounds to a minimum.” Further, thresholds by bone conduc-
tion are diminished by as much as 75 dB (von B�ek�esy, 1948,
1949). Recent results show that while basilar membrane
vibrations can be initiated via bone conduction, cochlear
fluid pressures differ substantially based on the mode of the
excitation, consistent with von B�ek�esy’s observations (Kim
et al., 2011). There are speculations that bone conduction
may provide enhanced input for lower frequencies (Stenfelt,
2013) but there are additional concerns that such a path
would, particularly in water, hamper localization and dis-
crimination. We cannot reasonably conclude based on cur-
rently available data that bone conduction would be a
preferential pathway in whales either, given normal acoustic
source levels.
VI. CONCLUSIONS
Knowledge of the hearing of mysticetes is critical to
understanding how these aquatic animals, many of which are
seriously endangered, may be affected by anthropogenic
noise. The METF obtained by FE modeling of the humpback
whale ear and direct experimentation on a cadaveric ear that
we present are one part of a series of anatomical and direct
experiments we are pursuing to provide a composite estimate
of the hearing characteristics for this and other marine mam-
mal species.
In this study, an anatomically accurate model of the
humpback whale middle ear was created, incorporating both
bone and soft tissues. The resulting FE transfer function dis-
plays a better frequency range for the humpback whale
between approximately 15 Hz and 3 kHz when stimulated at
the tympanic membrane, and between approximately 200 Hz
and 9 kHz if stimulated at the thinner region of the tympanic
bone adjacent to the tympanic membrane.
ACKNOWLEDGMENTS
The authors acknowledge the support of the Joint
Industry Program for Sound in the Sea, the Seaver Institute,
the Hanse-Wissenschaftskollegg, the Helmholtz Association,
and Living Marine Resources Program. We thank Scott
Cramer and Julie Arruda for extensive technical assistance,
Cody Yardley for assisting with the experimental setup, and
Dr. H. Steven Colburn for his support. We also wish to thank
Kimberly Durham, Katie Moore, Misty Niemeyer, Aleta
Hohn, and Jennifer Skidmore for their assistance and
guidance in obtaining specimens and permitting processes as
well as the responders and volunteers of the Marine
Mammal Health and Stranding Response Program, the
Riverhead Foundation for Marine Research, the
International Fund for Animal Welfare (IFAW), and the
J. Acoust. Soc. Am. 144 (2), August 2018 Tubelli et al. 533

National Oceanic and Atmospheric Administration, without
which this research would not have been possible. We also
wish to acknowledge the guidance and insights of our co-
author, Dr. David Mountain, who was so very important to
all of our work and who is sorely missed by all of us as well
as his colleagues at Boston University and elsewhere.
Au, W. W., Pack, A. A., Lammers, M. O., Herman, L. M., Deakos, M. H.,
and Andrews, K. (2006). “Acoustic properties of humpback whale songs,”
J. Acoust. Soc. Am. 120(2), 1103–1110.
Brill, R. L. (1988). “The jaw-hearing dolphin: Preliminary behavioral and
acoustical evidence,” in Animal Sonar, edited by P. E. Nachtigall and P.
W. B. Moore (Springer, Boston, MA), pp. 281–287.
Brill, R. L., Moore, P. W., and Dankiewicz, L. A. (2001). “Assessment of
dolphin (Tursiops truncatus) auditory sensitivity and hearing loss using
jawphones,” J. Acoust. Soc. Am. 109(4), 1717–1722.
Chandrashekar, N., Mansouri, H., Slauterbeck, J., and Hashemi, J. (2006).
“Sex-based differences in the tensile properties of the human anterior cru-
ciate ligament,” J. Biomech. 39(16), 2943–2950.
Clark, C. W. (1990). “Acoustic behavior of mysticete whales,” in SensoryAbilities of Cetaceans, edited by J. A. Thomas and R. A. Kastelein
(Plenum, New York), pp. 571–583.
Cranford, T. W., and Krysl, P. (2015). “Fin whale sound reception mecha-
nisms: Skull vibration enables low-frequency hearing,” PloS One 10(1),
e0116222.
Dallos, P. (1970). “Low-frequency auditory characteristics: Species depend-
ence,” J. Acoust. Soc. Am. 48(2), 489–499.
Dallos, P. (1973). The Auditory Periphery: Biophysics and Physiology(Academic, New York).
De Greef, D., Pires, F., and Dirckx, J. J. (2017). “Effects of model defini-
tions and parameter values in finite element modeling of human middle
ear mechanics,” Hear. Res. 344, 195–206.
Dooling, R. J., Peters, S. S., and Searcy, M. H. (1979). “Auditory sensitivity
and vocalizations of the field sparrow (Spizella pusilla),” Bull.
Psychonom. Soc. 14(2), 106–108.
Ekdale, E. G., Berta, A., and Dem�er�e, T. A. (2011). “The comparative oste-
ology of the petrotympanic complex (ear region) of extant baleen whales
(Cetacea: Mysticeti),” PloS One 6(6), e21311.
Fleischer, G. (1978). “Evolutionary principles of the mammalian middle
ear,” Adv. Anat. Embryol. Cell Biol. 55(5), 3–70.
Fraser, F. C., and Purves, P. E. (1954). “Hearing in cetaceans,” Bull. Br.
Museum 2(5), 103–116.
Fraser, F. C., and Purves, P. E. (1960). “Anatomy and function of the ceta-
cean ear,” Proc. R. Soc. Lond. Ser. B: Biol. Sci. 152(946), 62–77.
Gan, R. Z., Feng, B., and Sun, Q. (2004). “Three-dimensional finite element
modeling of human ear for sound transmission,” Ann. Biomed. Eng.
32(6), 847–859.
Gedamke, J., Costa, D. P., and Dunstan, A. (2001). “Localization and visual
verification of a complex minke whale vocalization,” J. Acoust. Soc. Am.
109(6), 3038–3047.
Hashemi, J., Chandrashekar, N., and Slauterbeck, J. (2005). “The mechani-
cal properties of the human patellar tendon are correlated to its mass den-
sity and are independent of sex,” Clin. Biomech. 20(6), 645–652.
Hemil€a, S., Nummela, S., and Reuter, T. (1995). “What middle ear parame-
ters tell about impedance matching and high frequency hearing,” Hear.
Res. 85(1–2), 31–44.
Homma, K., Du, Y., Shimizu, Y., and Puria, S. (2009). “Ossicular resonance
modes of the human middle ear for bone and air conduction,” J. Acoust.
Soc. Am. 125(2), 968–979.
Homma, K., Shimizu, Y., Kim, N., Du, Y., and Puria, S. (2010). “Effects of
ear-canal pressurization on middle-ear bone- and air-conduction
responses,” Hear. Res. 263(1), 204–215.
Hood, J. D. (1962). “Bone conduction: A review of the present position with
especial reference to the contributions of Dr. Georg von B�ek�esy,”
J. Acoust. Soc. Am. 34, 1325–1332.
Johnson, C. S. (1968). “Sound detection thresholds in marine mammals,” in
Marine Bioacoustics, edited by W. N. Tavolga (Pergamon, New York),
Vol. 2, pp. 247–260.
Ker, R. F. (1981). “Dynamic tensile properties of the plantaris tendon of
sheep (Ovis aries),” J. Exp. Biol. 93(1), 283–302.
Ketten, D. R. (1992). “The marine mammal ear: Specializations for aquatic
audition and echolocation,” in The Evolutionary Biology of Hearing,
edited by D. B. Webster, A. N. Popper, and R. R. Fay (Springer, New
York), pp. 717–750.
Ketten, D. R. (1994). “Functional analyses of whale ears: Adaptations for
underwater hearing,” Proc. OCEANS’94 1, 264–270.
Ketten, D. R. (2000). “Cetacean ears,” in Hearing by Whales and Dolphins,
edited by W. L. Au, A. N. Popper, and R. R. Fay (Springer, New York),
pp. 43–108.
Ketten, D. R. (2002). “Marine mammal auditory systems: A summary of
audiometric and anatomical data and implications for underwater acoustic
impacts,” Polarforschung 72(2–3), 79–92.
Kim, N., Homma, K., and Puria, S. (2011). “Inertial bone conduction:
Symmetric and anti-symmetric components,” J. Assoc. Res. Otolaryngol.
12(3), 261–279.
Koike, T., Wada, H., and Kobayashi, T. (2002). “Modeling of the human
middle ear using the finite-element method,” J. Acoust. Soc. Am. 111(3),
1306–1317.
Koopman, H. N., Budge, S. M., Ketten, D. R., and Iverson, S. J. (2006).
“Topographical distribution of lipids inside the mandibular fat bodies of
odontocetes: Remarkable complexity and consistency,” IEEE J. Ocean.
Eng. 31(1), 95–106.
Kuo, P. L., Li, P. C., and Li, M. L. (2001). “Elastic properties of tendon
measured by two different approaches,” Ultrasound Med. Biol. 27(9),
1275–1284.
Ladich, F., and Yan, H. Y. (1998). “Correlation between auditory sensitivity
and vocalization in anabantoid fishes,” J. Compar. Physiol. A 182,
737–746.
Lillie, D. G. (1910). “Observations on the anatomy and general biology of
some members of the larger cetacea,” Proc. Zool. Soc. Lond. 80, 769–792.
Manley, G. A., and Sienknecht, U. (2013). “The evolution and development
of middle ears in land Vertebrates,” in The Middle Ear: Science,Otosurgery, and Technology, edited by S. Puria, R. R. Fay, and A. N.
Popper (Springer, New York), pp. 7–30.
Manoussaki, D., Chadwick, R. S., Ketten, D. R., Arruda, J., Dimitriadis, E.
K., and O’Malley, J. T. (2008). “The influence of cochlear shape on low-
frequency hearing,” PNAS 105(16), 6162–6166.
McCormick, J. G., Wever, E. G., Palin, J., and Ridgway, S. H. (1970).
“Sound conduction in the dolphin ear,” J. Acoust. Soc. Am. 48,
1418–1428.
McCormick, J. G., Wever, E. G., Ridgway, S. H., and Palin, J. (1980).
“Sound reception in the porpoise as it relates to echolocation,” in AnimalSonar Systems, edited by R.-G. Busnel and J. F. Fish (Plenum Press, New
York), pp. 449–467.
McGough, R. L., Debski, R. E., Taskiran, E., Fu, F. H., and Woo, S. L.
(1996). “Mechanical properties of the long head of the biceps tendon,”
Knee Surg. Sports Traumatol. Arthrosc. 3(4), 226–229.
Mead, J. G., and Fordyce, R. E. (2009). “The therian skull: A lexicon with
emphasis on the odontocetes,” Smithson. Contrib. Zool. 627, 1–261.
Meenderink, S. W. F., Kits, M., and Narins, P. M. (2010). “Frequency
matching of vocalizations to inner-ear sensitivity along an altitudinal gra-
dient in the coqui frog,” Biol. Lett. 6(2), 278–281.
Møhl, B., Au, W. W. L., Pawloski, J., and Nachtigall, P. E. (1999).
“Dolphin hearing: Relative sensitivity as a function of point of application
of a contact sound source in the jaw and head region,” J. Acoust. Soc. Am.
105(6), 3421–3424.
Mooney, T. A., Li, S., Ketten, D., Wang, K., and Wang, D. (2013).
“Hearing pathways in the Yangtze finless porpoise, Neophocaena asiaeor-
ientalis asiaeorientalis,” J. Exp. Biol. 217, 444–452.
Norris, K. S. (1968). “The evolution of acoustic mechanisms in odontocete
cetaceans,” in Evolution and Environment, edited by E. T. Drake (Yale
University Press, New Haven), pp. 297–324.
Nummela, S., W€agar, T., Hemil€a, S., and Reuter, T. (1999). “Scaling of the
cetacean middle ear,” Hear. Res. 133(1), 71–81.
Olson, E. S. (1998). “Observing middle and inner ear mechanics with novel
intracochlear pressure sensors,” J. Acoust. Soc. Am. 103(6), 3445–3463.
Overstreet, E. H., III, and Ruggero, M. A. (2002). “Development of wide-
band middle ear transmission in the Mongolian gerbil,” J. Acoust. Soc
Am. 111(1), 261–270.
Payne, K., Tyack, P., and Payne, R. (1983). “Progressive changes in the
songs of humpback whales (Megaptera novaeangliae): A detailed analysis
of two seasons in Hawaii,” in Communication and Behavior of Whales,edited by R. S. Payne (AAAS Selected Symposium, Boulder, CO), pp.
9–57.
Pilleri, G. C., Kraus, C., and Gihr, M. (1987). “The organ of hearing in ceta-
ceans 1: Recent species,” Invest. Cetacea 20, 43–177.
534 J. Acoust. Soc. Am. 144 (2), August 2018 Tubelli et al.
Popov, V., and Supin, A. (1990). “Localization of the acoustic window at
the dolphin’s head,” in Sensory Abilities of Cetaceans, edited by J. A.
Thomas and R. A. Kastelein (Springer, Boston, MA), pp. 417–426.
Prasad, K. (2003). “Sound speed investigation of dolphin tissue,” Master’s
thesis, University of Massachusetts, Dartmouth, MA.
Provenzano, P. P., Lakes, R. S., Corr, D. T., and Vanderby, R. (2002).
“Application of nonlinear viscoelastic models to describe ligament behav-
ior,” Biomech. Model. Mechanobiol. 1(1), 45–57.
Purves, P. E. (1955). “The wax plug in the external auditory meatus of the
Mysticeti,” Discov. Rep. 27, 293–302.
Qi, L., Liu, H., Lutfy, J., Funnell, W. R. J., and Daniel, S. J. (2006). “A non-
linear finite-element model of the newborn ear canal,” J. Acoust. Soc. Am.
120(6), 3789–3798.
Ravicz, M. E., Cooper, N. P., and Rosowski, J. J. (2008). “Gerbil middle-ear
sound transmission from 100 Hz to 60 kHz,” J. Acoust. Soc. Am. 124(1),
363–380.
Rosowski, J. J. (1991). “The effects of external- and middle-ear filtering on
auditory threshold and noise-induced hearing loss,” J. Acoust. Soc. Am.
90(1), 124–135.
Ruggero, M. A., and Temchin, A. N. (2002). “The roles of the external, mid-
dle, and inner ears in determining the bandwidth of hearing,” Proc. Natl.
Acad. Sci. 99(20), 13206–13210.
Silber, G. K. (1986). “The relationship of social vocalizations to surface
behavior and aggression in the Hawaiian humpback whale (Megaptera
novaeangliae),” Can. J. Zool. 64(10), 2075–2080.
St€aubli, H. U., Schatzmann, L., Brunner, P., Rinc�on, L., and Nolte, L. P.
(1999). “Mechanical tensile properties of the quadriceps tendon and patel-
lar ligament in young adults,” Am. J. Sports Med. 27(1), 27–34.
Stenfelt, S. (2013). “Bone conduction and the middle ear,” in The MiddleEar: Science, Otosurgery, and Technology, edited by S. Puria, R. R. Fay,
and A. N. Popper (Springer, New York), pp. 135–169.
Szymanski, M. D., Bain, D. E., Kiehl, K., Pennington, S., Wong, S., and
Henry, K. R. (1999). “Killer whale (Orcinus orca) hearing: Auditory
brainstem response and behavioral audiograms,” J. Acoust. Soc. Am.
106(2), 1134–1141.
Thompson, P. O., Cummings, W. C., and Ha, S. J. (1986). “Sounds, source
levels, and associated behavior of humpback whales, Southeast Alaska,”
J. Acoust. Soc. Am. 80(3), 735–740.
Tubelli, A. A., Zosuls, A., Ketten, D. R., and Mountain, D. C. (2014).
“Elastic modulus of cetacean auditory ossicles,” Anatom. Rec. 297(5),
892–900.
Tubelli, A. A., Zosuls, A., Ketten, D. R., Yamato, M., and Mountain, D. C.
(2012). “A prediction of the minke whale (Balaenoptera acutorostrata)
middle-ear transfer function,” J. Acoust. Soc. Am. 132(5), 3263–3272.
Tuck-Lee, J. P., Pinsky, P. M., Steele, C. R., and Puria, S. (2008). “Finite
element modeling of acousto-mechanical coupling in the cat middle ear,”
J. Acoust. Soc. Am. 124(1), 348–362.
von B�ek�esy, G. (1948). “Vibrations of the head in a sound field and its role
in hearing by bone conduction,” J. Acoust. Soc. Am. 20, 749–760.
von B�ek�esy, G. (1949). “The structure of the middle ear and the hearing of
one’s own voice by bone conduction,” J. Acoust. Soc. Am. 21(3),
217–232.
Wang, X., and Gan, R. Z. (2016). “3D finite element model of the chinchilla
ear for characterizing middle ear functions,” Biomech. Model.
Mechanobiol. 15(5), 1263–1277.
Wartzok, D., and Ketten, D. R. (1999). “Marine mammal sensory systems,”
in Biology of Marine Mammals, edited by J. Reynolds and S. Rommel
(Smithsonian Institution Press, Washington, D.C.), pp. 117–175.
Yamada, M. (1953). “Contribution to the anatomy of the organ of hearing of
whales,” Sci. Rep. Whales Res. Inst. 8, 1–79.
Yamato, M., Ketten, D. R., Arruda, J., Cramer, S., and Moore, K. (2012).
“The auditory anatomy of the minke whale (Balaenoptera acutorostrata):
A potential fatty sound reception pathway in a baleen whale,” Anatom.
Rec. 295(6), 991–998.
Zosuls, A., Mountain, D. C., and Ketten, D. R. (2015). “How is sound con-
ducted to the cochlea in toothed whales?,” AIP Conf. Proc. 1703(1), 060006.
J. Acoust. Soc. Am. 144 (2), August 2018 Tubelli et al. 535
Related Documents