A Metrics Suite for Evaluating Flexibility and Complexity in Service Oriented Architectures Mamoun Hirzalla 1 , Jane Cleland-Huang 2 , Ali Arsanjani 3 1 DePaul University and IBM, [email protected] , 2 DePaul University, [email protected] , 3 IBM, [email protected] Abstract. Service Oriented Architecture (SOA) is emerging to be the predominant architectural style of choice for many organizations due to the promised agility, flexibility and resilience benefits. However, there are currently few SOA metrics designed to evaluate complexity, effort estimates and health status of SOA solutions. This paper therefore proposes a SOA metrics framework which includes both service level and SOA-wide metrics to measure design and runtime qualities of a SOA solution. The SOA-wide metrics predict the overall complexity, agility and health status of SOA solutions, while service level metrics focus on the fundamental building blocks of SOA, i.e. services. The combined views deliver a compelling suite of SOA metrics that would benefit organizations as they consider adopting SOA. These metrics, which are based on observations of many SOA engagements, are illustrated through a case study that describes a recent ongoing project at IBM where SOA was utilized to build the solution assets. Keywords: SOA metrics, SOA complexity, agility, flexibility, SOA health 1 Introduction Service Oriented Architecture (SOA) is becoming an increasingly popular architectural style that focuses on providing the right tools and methods for building distributed applications. The fundamental building blocks of SOA are repeatable business tasks realized as services and implemented in a variety of distributed components such as CORBA, EJBs and web services [9]. From a business perspective, one of the primary objectives of SOA-based systems is the alignment between business and IT and the flexibility and business agility that SOA injects into an organization [9]. This is achieved through systematically designing and building a SOA-based solution using a method such as SOMA, invented and initially developed in IBM [7]. SOMA defines key techniques and provides prescriptive tasks and detailed normative guidance for analysis, design,

Welcome message from author
This document is posted to help you gain knowledge. Please leave a comment to let me know what you think about it! Share it to your friends and learn new things together.
Transcript
A Metrics Suite for Evaluating Flexibility and
Complexity in Service Oriented Architectures
Mamoun Hirzalla1, Jane Cleland-Huang
2, Ali Arsanjani
3
1 DePaul University and IBM, [email protected], 2 DePaul University,
[email protected], 3 IBM, [email protected]
Abstract. Service Oriented Architecture (SOA) is emerging to be the
predominant architectural style of choice for many organizations due to the
promised agility, flexibility and resilience benefits. However, there are
currently few SOA metrics designed to evaluate complexity, effort estimates
and health status of SOA solutions. This paper therefore proposes a SOA
metrics framework which includes both service level and SOA-wide metrics to
measure design and runtime qualities of a SOA solution. The SOA-wide
metrics predict the overall complexity, agility and health status of SOA
solutions, while service level metrics focus on the fundamental building blocks
of SOA, i.e. services. The combined views deliver a compelling suite of SOA
metrics that would benefit organizations as they consider adopting SOA.
These metrics, which are based on observations of many SOA engagements,
are illustrated through a case study that describes a recent ongoing project at
IBM where SOA was utilized to build the solution assets.
Keywords: SOA metrics, SOA complexity, agility, flexibility, SOA health
1 Introduction
Service Oriented Architecture (SOA) is becoming an increasingly popular
architectural style that focuses on providing the right tools and methods for building
distributed applications. The fundamental building blocks of SOA are repeatable
business tasks realized as services and implemented in a variety of distributed
components such as CORBA, EJBs and web services [9].
From a business perspective, one of the primary objectives of SOA-based systems
is the alignment between business and IT and the flexibility and business agility that
SOA injects into an organization [9]. This is achieved through systematically
designing and building a SOA-based solution using a method such as SOMA,
invented and initially developed in IBM [7]. SOMA defines key techniques and
provides prescriptive tasks and detailed normative guidance for analysis, design,
implementation, testing, and deployment of services, components, flows, information,
and policies needed to successfully design and build a robust and reusable SOA
solution in an enterprise [7]. However SOMA, like other SOA-based methodologies,
does not provide techniques or metrics for measuring underlying complexity and
flexibility qualities of a SOA-solution.
This paper therefore proposes a new suite of metrics, designed specifically to
evaluate flexibility and agility versus complexity of a SOA solution. The set of
metrics can be used to provide a diagnosis for the health of a SOA solution by
providing information about services used within a SOA solution, their composition
interfaces or provided operations, architectural decisions, flexibility, agility and
complexity. The term “health” of SOA solutions is not limited to the metrics or
characteristics identified in this paper. Obviously, there are other elements that must
be considered to determine the overall health of a SOA solution. SOA Governance
with its emphasis on security, management and testing is a major factor to consider
when evaluating such a question. This paper will focus on the architectural
considerations as they pertain to the “health” factor.
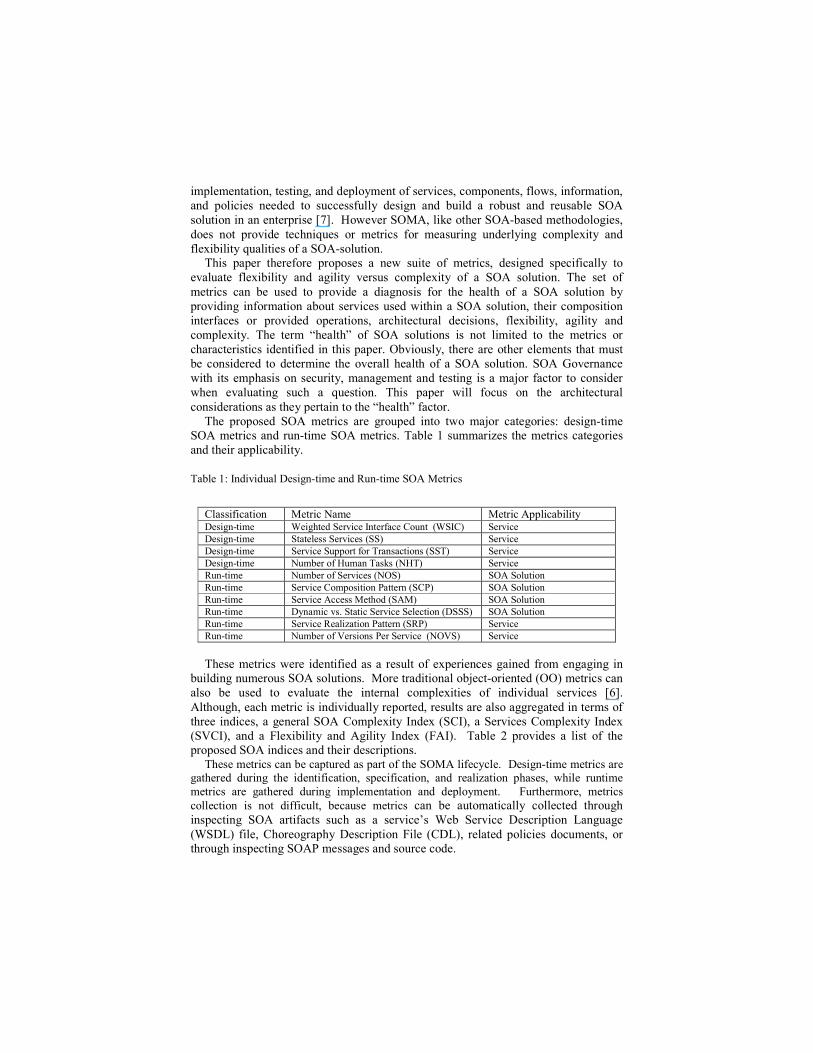
The proposed SOA metrics are grouped into two major categories: design-time
SOA metrics and run-time SOA metrics. Table 1 summarizes the metrics categories
and their applicability.
Table 1: Individual Design-time and Run-time SOA Metrics
Classification Metric Name Metric Applicability Design-time Weighted Service Interface Count (WSIC) Service
Design-time Stateless Services (SS) Service
Design-time Service Support for Transactions (SST) Service
Design-time Number of Human Tasks (NHT) Service
Run-time Number of Services (NOS) SOA Solution
Run-time Service Composition Pattern (SCP) SOA Solution
Run-time Service Access Method (SAM) SOA Solution
Run-time Dynamic vs. Static Service Selection (DSSS) SOA Solution
Run-time Service Realization Pattern (SRP) Service
Run-time Number of Versions Per Service (NOVS) Service
These metrics were identified as a result of experiences gained from engaging in
building numerous SOA solutions. More traditional object-oriented (OO) metrics can
also be used to evaluate the internal complexities of individual services [6].
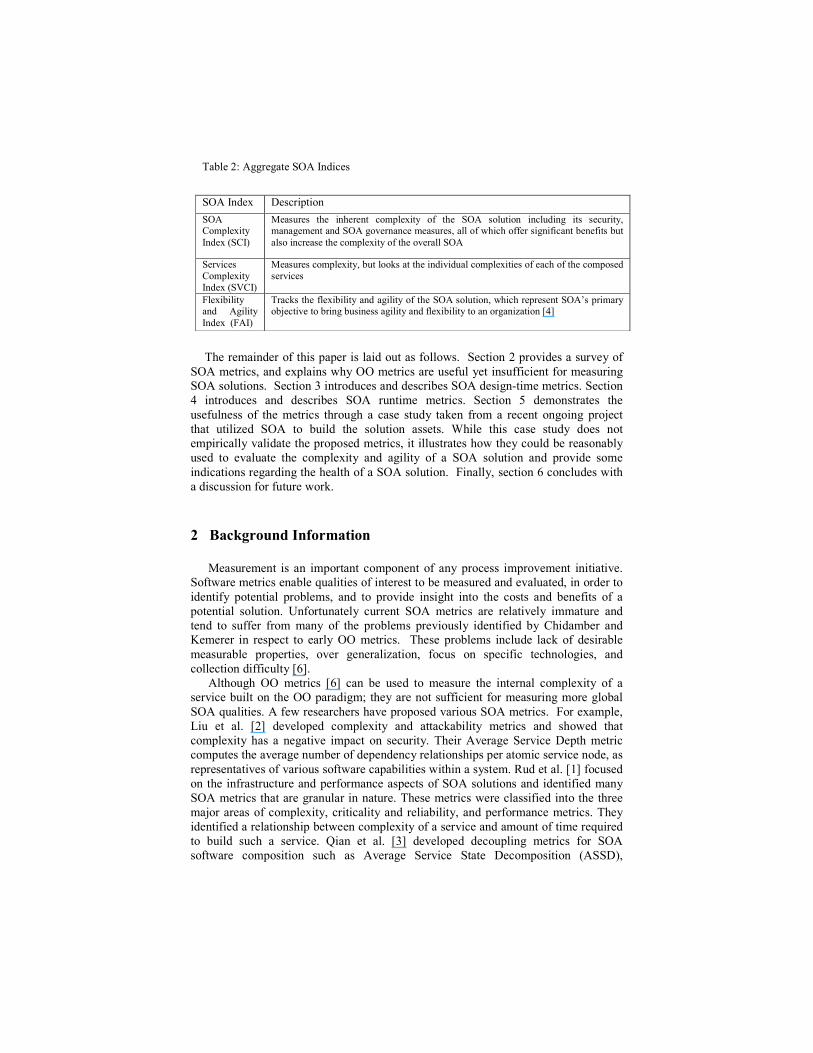
Although, each metric is individually reported, results are also aggregated in terms of
three indices, a general SOA Complexity Index (SCI), a Services Complexity Index
(SVCI), and a Flexibility and Agility Index (FAI). Table 2 provides a list of the
proposed SOA indices and their descriptions. These metrics can be captured as part of the SOMA lifecycle. Design-time metrics are
gathered during the identification, specification, and realization phases, while runtime
metrics are gathered during implementation and deployment. Furthermore, metrics
collection is not difficult, because metrics can be automatically collected through
inspecting SOA artifacts such as a service’s Web Service Description Language
(WSDL) file, Choreography Description File (CDL), related policies documents, or
through inspecting SOAP messages and source code.
The remainder of this paper is laid out as follows. Section 2 provides a survey of
SOA metrics, and explains why OO metrics are useful yet insufficient for measuring
SOA solutions. Section 3 introduces and describes SOA design-time metrics. Section
4 introduces and describes SOA runtime metrics. Section 5 demonstrates the
usefulness of the metrics through a case study taken from a recent ongoing project
that utilized SOA to build the solution assets. While this case study does not
empirically validate the proposed metrics, it illustrates how they could be reasonably
used to evaluate the complexity and agility of a SOA solution and provide some
indications regarding the health of a SOA solution. Finally, section 6 concludes with
a discussion for future work.
2 Background Information
Measurement is an important component of any process improvement initiative.
Software metrics enable qualities of interest to be measured and evaluated, in order to
identify potential problems, and to provide insight into the costs and benefits of a
potential solution. Unfortunately current SOA metrics are relatively immature and
tend to suffer from many of the problems previously identified by Chidamber and
Kemerer in respect to early OO metrics. These problems include lack of desirable
measurable properties, over generalization, focus on specific technologies, and
collection difficulty [6].
Although OO metrics [6] can be used to measure the internal complexity of a
service built on the OO paradigm; they are not sufficient for measuring more global
SOA qualities. A few researchers have proposed various SOA metrics. For example,
Liu et al. [2] developed complexity and attackability metrics and showed that
complexity has a negative impact on security. Their Average Service Depth metric
computes the average number of dependency relationships per atomic service node, as
representatives of various software capabilities within a system. Rud et al. [1] focused
on the infrastructure and performance aspects of SOA solutions and identified many
SOA metrics that are granular in nature. These metrics were classified into the three
major areas of complexity, criticality and reliability, and performance metrics. They
identified a relationship between complexity of a service and amount of time required
to build such a service. Qian et al. [3] developed decoupling metrics for SOA
software composition such as Average Service State Decomposition (ASSD),
Table 2: Aggregate SOA Indices
SOA Index Description
SOA Complexity
Index (SCI)
Measures the inherent complexity of the SOA solution including its security, management and SOA governance measures, all of which offer significant benefits but
also increase the complexity of the overall SOA
Services
Complexity
Index (SVCI)
Measures complexity, but looks at the individual complexities of each of the composed
services
Flexibility and Agility
Index (FAI)
Tracks the flexibility and agility of the SOA solution, which represent SOA’s primary objective to bring business agility and flexibility to an organization [4]
Average Service Persistent Dependency (ASPD) and Average Required Service
Dependency (ARSD), and used it to evaluate decoupling between service-oriented
components in the service composition such as Business Process Execution Language
(BPEL); a useful set of metrics that should be considered for loose coupling
considerations as part of the health status of SOA solutions.
Unfortunately, none of these metrics provide a comprehensive approach for
measuring flexibility and agility which represent significant factors in the short and
long-term success of a SOA solution. In contrast, the metrics proposed in this paper
are specifically designed to evaluate the impact of SOA architectural decisions upon
the flexibility, agility and complexity of a SOA solution.
3 SOA Design-time Metrics
The four metrics defined in this section measure the flexibility, agility, and
complexity of the solution in respect to design time decisions. The metrics are
independent of the underlying code, and could be applied to either JEE web services
or .Net services. Metrics are first computed for individual services and then compiled
into a more global metric and applied to the FAI, SVCI, and SCI indices.
Metric 1: Weighted Service Interface Count (WSIC)
Definition: WSIC = The weighted number of exposed interfaces or operations per
service as defined in the WSDL documents. The default weight is set to 1. Alternate
weighting methods, which need to be validated empirically, can take into
consideration the number and the complexity of data types of parameters in each
interface. In the default case, WSIC simply returns a count of the number of exposed
interfaces or methods defined in the WSDL documents.
Hypothesis: The higher the number of service interfaces the more complex a service
becomes and by association the more complex a SOA solution becomes. In addition,
there is a direct relationship between the complexity of the exposed interfaces and the
complexity of the data structures required per interface.
Observations: The greater the number of defined interfaces per service within a
SOA solution the more complex a service becomes due to the following factors. (i)
The amount of work required to specify, construct and test every interface on the
service increases. (ii) The amount of monitoring required to ensure that service level
agreements (SLAs) are met increases with every invocation of an interface. (iii) With
the increase in complexity of individual interfaces of the data structures for a given
service, performance and problem determination concerns may become a primary
issue. Performance and root cause issues are hard to predict and diagnose.
Impact on defined indices: Both SVCI and SCI increase as WSIC increases. There
is no impact on the FAI index.
Metric 2: Stateless Services (SS)
Definition: SS = The fraction of services which are stateless (SLS) as opposed to
stateful (SFS) as defined in the Web Services Resource Framework (WS-RF) [8] or
WS-Context [12]. SS = SLS / (SLS + SFS).
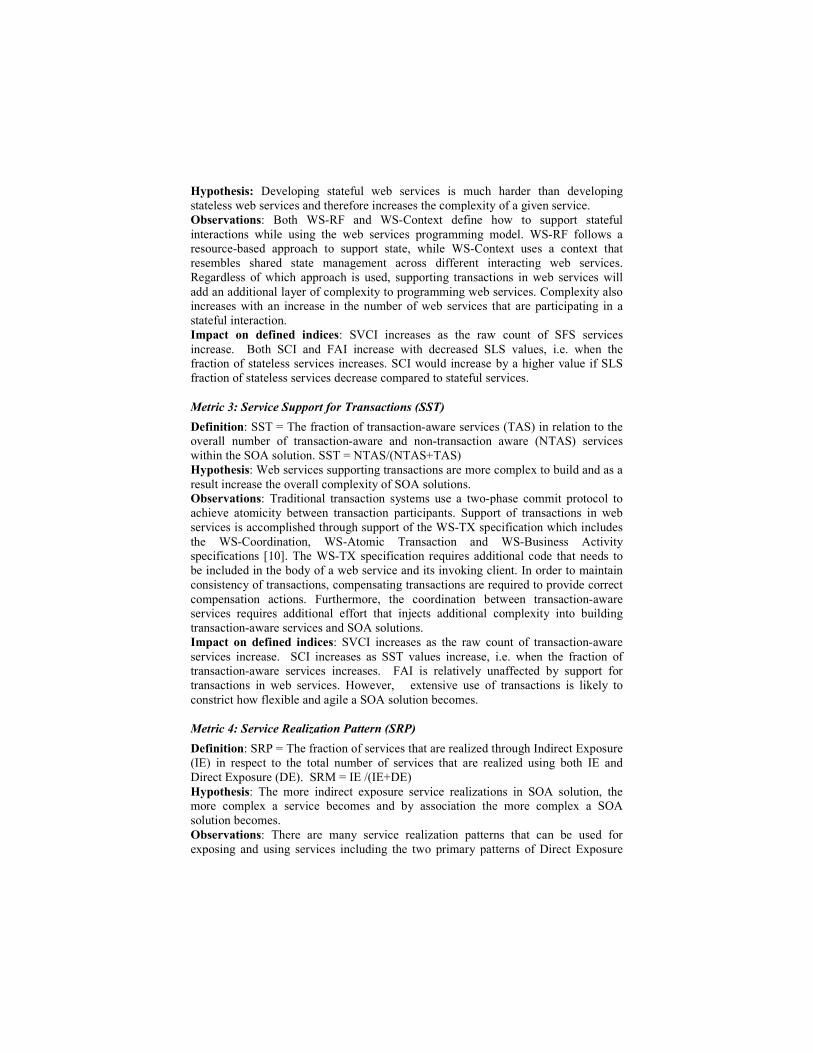
Hypothesis: Developing stateful web services is much harder than developing
stateless web services and therefore increases the complexity of a given service.
Observations: Both WS-RF and WS-Context define how to support stateful
interactions while using the web services programming model. WS-RF follows a
resource-based approach to support state, while WS-Context uses a context that
resembles shared state management across different interacting web services.
Regardless of which approach is used, supporting transactions in web services will
add an additional layer of complexity to programming web services. Complexity also
increases with an increase in the number of web services that are participating in a
stateful interaction.
Impact on defined indices: SVCI increases as the raw count of SFS services
increase. Both SCI and FAI increase with decreased SLS values, i.e. when the
fraction of stateless services increases. SCI would increase by a higher value if SLS
fraction of stateless services decrease compared to stateful services.
Metric 3: Service Support for Transactions (SST)
Definition: SST = The fraction of transaction-aware services (TAS) in relation to the
overall number of transaction-aware and non-transaction aware (NTAS) services
within the SOA solution. SST = NTAS/(NTAS+TAS)
Hypothesis: Web services supporting transactions are more complex to build and as a
result increase the overall complexity of SOA solutions.
Observations: Traditional transaction systems use a two-phase commit protocol to
achieve atomicity between transaction participants. Support of transactions in web
services is accomplished through support of the WS-TX specification which includes
the WS-Coordination, WS-Atomic Transaction and WS-Business Activity
specifications [10]. The WS-TX specification requires additional code that needs to
be included in the body of a web service and its invoking client. In order to maintain
consistency of transactions, compensating transactions are required to provide correct
compensation actions. Furthermore, the coordination between transaction-aware
services requires additional effort that injects additional complexity into building
transaction-aware services and SOA solutions.
Impact on defined indices: SVCI increases as the raw count of transaction-aware
services increase. SCI increases as SST values increase, i.e. when the fraction of
transaction-aware services increases. FAI is relatively unaffected by support for
transactions in web services. However, extensive use of transactions is likely to
constrict how flexible and agile a SOA solution becomes.
Metric 4: Service Realization Pattern (SRP)
Definition: SRP = The fraction of services that are realized through Indirect Exposure
(IE) in respect to the total number of services that are realized using both IE and
Direct Exposure (DE). SRM = IE /(IE+DE)
Hypothesis: The more indirect exposure service realizations in SOA solution, the
more complex a service becomes and by association the more complex a SOA
solution becomes.
Observations: There are many service realization patterns that can be used for
exposing and using services including the two primary patterns of Direct Exposure
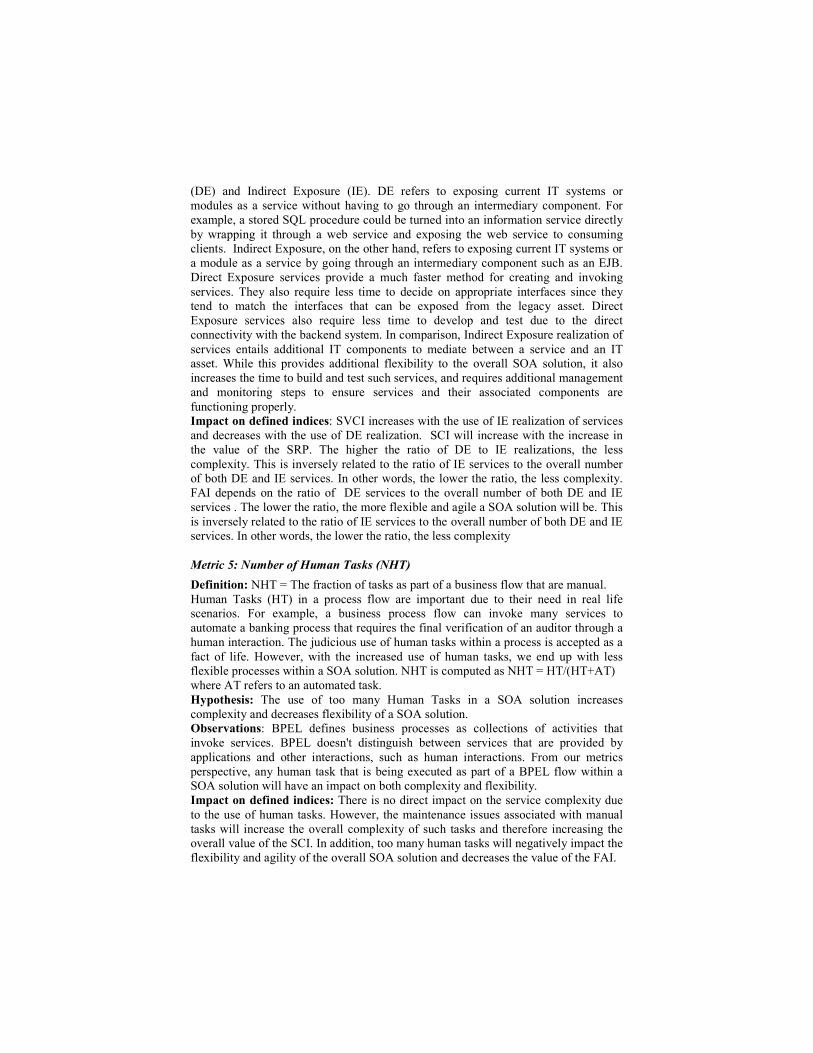
(DE) and Indirect Exposure (IE). DE refers to exposing current IT systems or
modules as a service without having to go through an intermediary component. For
example, a stored SQL procedure could be turned into an information service directly
by wrapping it through a web service and exposing the web service to consuming
clients. Indirect Exposure, on the other hand, refers to exposing current IT systems or
a module as a service by going through an intermediary component such as an EJB.
Direct Exposure services provide a much faster method for creating and invoking
services. They also require less time to decide on appropriate interfaces since they
tend to match the interfaces that can be exposed from the legacy asset. Direct
Exposure services also require less time to develop and test due to the direct
connectivity with the backend system. In comparison, Indirect Exposure realization of
services entails additional IT components to mediate between a service and an IT
asset. While this provides additional flexibility to the overall SOA solution, it also
increases the time to build and test such services, and requires additional management
and monitoring steps to ensure services and their associated components are
functioning properly.
Impact on defined indices: SVCI increases with the use of IE realization of services
and decreases with the use of DE realization. SCI will increase with the increase in
the value of the SRP. The higher the ratio of DE to IE realizations, the less
complexity. This is inversely related to the ratio of IE services to the overall number
of both DE and IE services. In other words, the lower the ratio, the less complexity.
FAI depends on the ratio of DE services to the overall number of both DE and IE
services . The lower the ratio, the more flexible and agile a SOA solution will be. This
is inversely related to the ratio of IE services to the overall number of both DE and IE
services. In other words, the lower the ratio, the less complexity
Metric 5: Number of Human Tasks (NHT)
Definition: NHT = The fraction of tasks as part of a business flow that are manual.
Human Tasks (HT) in a process flow are important due to their need in real life
scenarios. For example, a business process flow can invoke many services to
automate a banking process that requires the final verification of an auditor through a
human interaction. The judicious use of human tasks within a process is accepted as a
fact of life. However, with the increased use of human tasks, we end up with less
flexible processes within a SOA solution. NHT is computed as NHT = HT/(HT+AT)
where AT refers to an automated task.
Hypothesis: The use of too many Human Tasks in a SOA solution increases
complexity and decreases flexibility of a SOA solution.
Observations: BPEL defines business processes as collections of activities that
invoke services. BPEL doesn't distinguish between services that are provided by
applications and other interactions, such as human interactions. From our metrics
perspective, any human task that is being executed as part of a BPEL flow within a
SOA solution will have an impact on both complexity and flexibility.
Impact on defined indices: There is no direct impact on the service complexity due
to the use of human tasks. However, the maintenance issues associated with manual
tasks will increase the overall complexity of such tasks and therefore increasing the
overall value of the SCI. In addition, too many human tasks will negatively impact the
flexibility and agility of the overall SOA solution and decreases the value of the FAI.
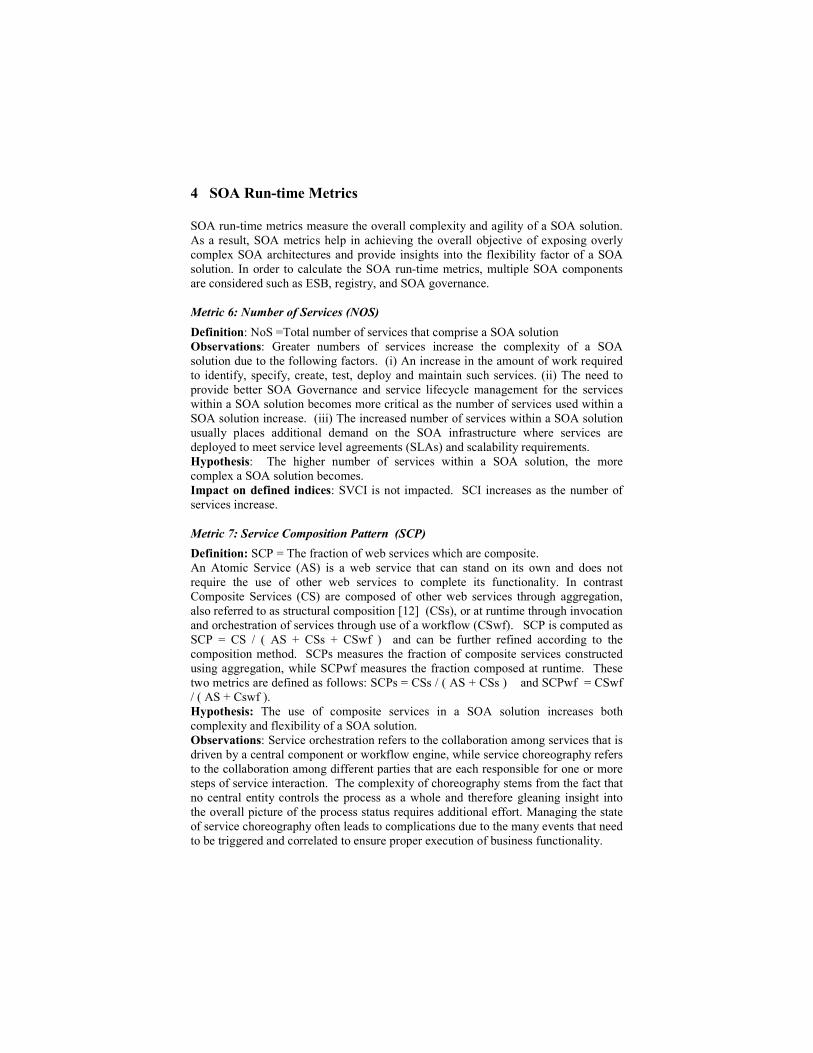
4 SOA Run-time Metrics
SOA run-time metrics measure the overall complexity and agility of a SOA solution.
As a result, SOA metrics help in achieving the overall objective of exposing overly
complex SOA architectures and provide insights into the flexibility factor of a SOA
solution. In order to calculate the SOA run-time metrics, multiple SOA components
are considered such as ESB, registry, and SOA governance.
Metric 6: Number of Services (NOS)
Definition: NoS =Total number of services that comprise a SOA solution
Observations: Greater numbers of services increase the complexity of a SOA
solution due to the following factors. (i) An increase in the amount of work required
to identify, specify, create, test, deploy and maintain such services. (ii) The need to
provide better SOA Governance and service lifecycle management for the services
within a SOA solution becomes more critical as the number of services used within a
SOA solution increase. (iii) The increased number of services within a SOA solution
usually places additional demand on the SOA infrastructure where services are
deployed to meet service level agreements (SLAs) and scalability requirements.
Hypothesis: The higher number of services within a SOA solution, the more
complex a SOA solution becomes.
Impact on defined indices: SVCI is not impacted. SCI increases as the number of
services increase.
Metric 7: Service Composition Pattern (SCP)
Definition: SCP = The fraction of web services which are composite.
An Atomic Service (AS) is a web service that can stand on its own and does not
require the use of other web services to complete its functionality. In contrast
Composite Services (CS) are composed of other web services through aggregation,
also referred to as structural composition [12] (CSs), or at runtime through invocation
and orchestration of services through use of a workflow (CSwf). SCP is computed as
SCP = CS / ( AS + CSs + CSwf ) and can be further refined according to the
composition method. SCPs measures the fraction of composite services constructed
using aggregation, while SCPwf measures the fraction composed at runtime. These
two metrics are defined as follows: SCPs = CSs / ( AS + CSs ) and SCPwf = CSwf
/ ( AS + Cswf ).
Hypothesis: The use of composite services in a SOA solution increases both
complexity and flexibility of a SOA solution.
Observations: Service orchestration refers to the collaboration among services that is
driven by a central component or workflow engine, while service choreography refers
to the collaboration among different parties that are each responsible for one or more
steps of service interaction. The complexity of choreography stems from the fact that
no central entity controls the process as a whole and therefore gleaning insight into
the overall picture of the process status requires additional effort. Managing the state
of service choreography often leads to complications due to the many events that need
to be triggered and correlated to ensure proper execution of business functionality.
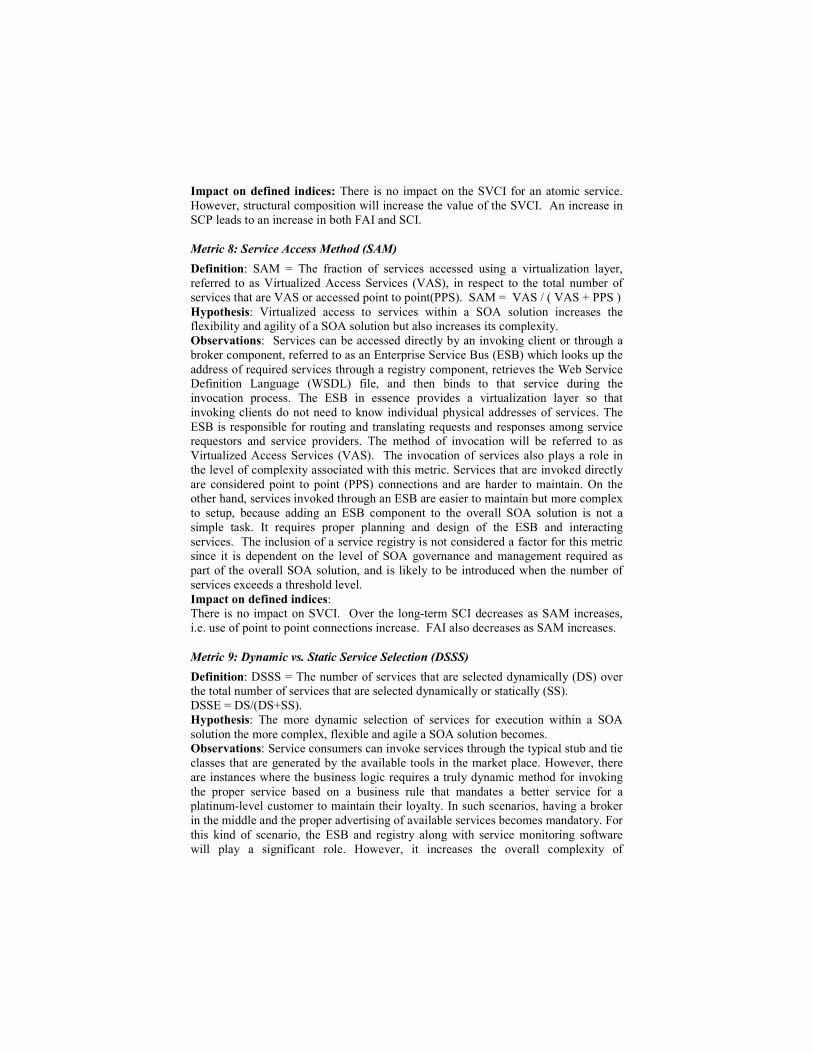
Impact on defined indices: There is no impact on the SVCI for an atomic service.
However, structural composition will increase the value of the SVCI. An increase in
SCP leads to an increase in both FAI and SCI.
Metric 8: Service Access Method (SAM)
Definition: SAM = The fraction of services accessed using a virtualization layer,
referred to as Virtualized Access Services (VAS), in respect to the total number of
services that are VAS or accessed point to point(PPS). SAM = VAS / ( VAS + PPS )
Hypothesis: Virtualized access to services within a SOA solution increases the
flexibility and agility of a SOA solution but also increases its complexity.
Observations: Services can be accessed directly by an invoking client or through a
broker component, referred to as an Enterprise Service Bus (ESB) which looks up the
address of required services through a registry component, retrieves the Web Service
Definition Language (WSDL) file, and then binds to that service during the
invocation process. The ESB in essence provides a virtualization layer so that
invoking clients do not need to know individual physical addresses of services. The
ESB is responsible for routing and translating requests and responses among service
requestors and service providers. The method of invocation will be referred to as
Virtualized Access Services (VAS). The invocation of services also plays a role in
the level of complexity associated with this metric. Services that are invoked directly
are considered point to point (PPS) connections and are harder to maintain. On the
other hand, services invoked through an ESB are easier to maintain but more complex
to setup, because adding an ESB component to the overall SOA solution is not a
simple task. It requires proper planning and design of the ESB and interacting
services. The inclusion of a service registry is not considered a factor for this metric
since it is dependent on the level of SOA governance and management required as
part of the overall SOA solution, and is likely to be introduced when the number of
services exceeds a threshold level.
Impact on defined indices:
There is no impact on SVCI. Over the long-term SCI decreases as SAM increases,
i.e. use of point to point connections increase. FAI also decreases as SAM increases.
Metric 9: Dynamic vs. Static Service Selection (DSSS)
Definition: DSSS = The number of services that are selected dynamically (DS) over
the total number of services that are selected dynamically or statically (SS).
DSSE = DS/(DS+SS).
Hypothesis: The more dynamic selection of services for execution within a SOA
solution the more complex, flexible and agile a SOA solution becomes.
Observations: Service consumers can invoke services through the typical stub and tie
classes that are generated by the available tools in the market place. However, there
are instances where the business logic requires a truly dynamic method for invoking
the proper service based on a business rule that mandates a better service for a
platinum-level customer to maintain their loyalty. In such scenarios, having a broker
in the middle and the proper advertising of available services becomes mandatory. For
this kind of scenario, the ESB and registry along with service monitoring software
will play a significant role. However, it increases the overall complexity of
maintaining a SOA solution. As Dynamic service invocation provides better
flexibility and agility since a process can adapt much quicker than a process those
hard codes static locations of services.
Impact on defined indices: There is no impact on SVCI. The higher the ratio of
SSE, the higher the complexity of a SOA solution; SCI therefore increases as SSE
increases. Moreover, the higher the ratio of SSE, the more flexible a SOA solution.
Metric 10: Number of Versions per Service (NOVS)
Definition: NOVS = The total number of versions over the total number of services
within the SOA solution. NOVS = VERSIONS / SERVICES
Hypothesis: The higher the number of service versions the more complex a service
becomes and by association the more complex a SOA solution becomes.
Observations: The number of versions available in production per service is
dependent on the level of change that services undergo while they are in production. It
may signal an unstable service interface in the first place and a situation where
services were rushed into production. The greater the number of available versions
per service within a SOA solution the more complex a service becomes due to the
following factors. (i)The amount of work required to keep track of service versions
and their associated clients. Multiple service versions may also provide different
SLAs for different consumers. The SOA Governance and management aspects of
tracking service versions will become harder with every new service version that is
maintained. (ii) The amount of regression testing required per service version
increases if a common defect is discovered in one of the service versions. Therefore,
additional time is required in order to ensure that all service versions are operating
uniformly for similar business logic. The proliferation of many versions for the same
service may point to lack of proper design that considers the level of reuse required.
Reusable services tend to be more carefully planned, designed and implemented.
Impact on defined indices: Both SVCI and SCI increase as NVS increases. There is
no impact on FAI.
5 Case Study
The metrics described in this paper still need to be empirically evaluated across
multiple SOA applications to determine if they are complete and relatively non-
redundant. In this section we briefly describe their use in a case study which is
representative of multiple internal projects developed at IBM. The customer in the
case study is a bank that is considering a SOA solution to address some of the primary
pain points related to its Account Open business process. The current process was
riddled with manual tasks that were causing the Account Open process to extend to 14
days instead of 10 minutes as offered by the bank’s primary competitors.
One of the primary business objectives of the bank’s SOA Solution was to inject
agility and flexibility into the Account Open business process while trying to
minimize complexity of the overall SOA solution. At a high level, the Account Open
business process consisted of two primary sub-processes: Account Verification and
Account Activation.
SOMA was used to model the optimized business process and identify and specify
the services needed to realize the new business process vision. Candidate services
were identified using SOMA’s top down and bottom up approaches and SOMA’s
service litmus test (SLT) was applied to rationalize and verify candidate services.
These services were developed from existing assets or else programmed from scratch.
The SOA solution was built in three iterations. The first iteration of service creation
focused on creating new services that were used to automate previous manual tasks
such as credit check and address validation. The second service connectivity iteration
focused on integrating disparate systems within the bank through the incorporation of
an ESB to virtualize access to services and enhance the overall flexibility of the
solution. Finally the Interaction and Collaboration iteration provided an enhanced
user interface to the web channel by incorporating the automated steps of the newly
optimized Account Open business process with the created services.
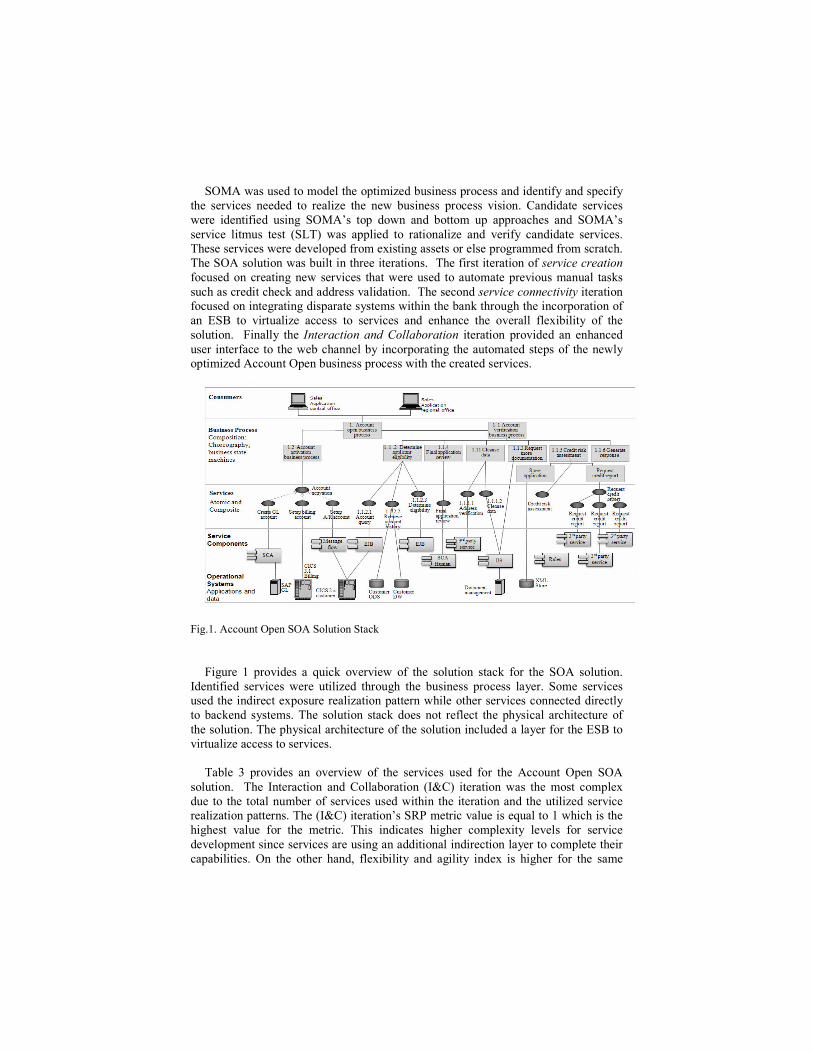
Fig.1. Account Open SOA Solution Stack
Figure 1 provides a quick overview of the solution stack for the SOA solution.
Identified services were utilized through the business process layer. Some services
used the indirect exposure realization pattern while other services connected directly
to backend systems. The solution stack does not reflect the physical architecture of
the solution. The physical architecture of the solution included a layer for the ESB to
virtualize access to services.
Table 3 provides an overview of the services used for the Account Open SOA
solution. The Interaction and Collaboration (I&C) iteration was the most complex
due to the total number of services used within the iteration and the utilized service
realization patterns. The (I&C) iteration’s SRP metric value is equal to 1 which is the
highest value for the metric. This indicates higher complexity levels for service
development since services are using an additional indirection layer to complete their
capabilities. On the other hand, flexibility and agility index is higher for the same
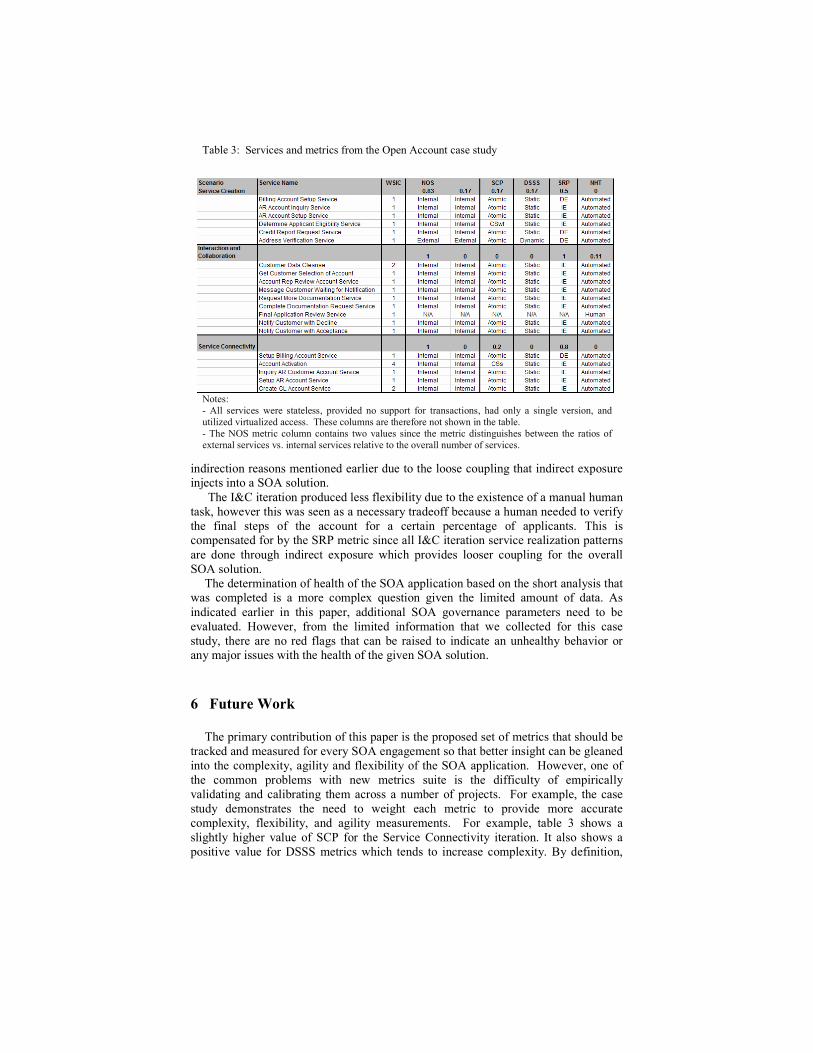
indirection reasons mentioned earlier due to the loose coupling that indirect exposure
injects into a SOA solution.
The I&C iteration produced less flexibility due to the existence of a manual human
task, however this was seen as a necessary tradeoff because a human needed to verify
the final steps of the account for a certain percentage of applicants. This is
compensated for by the SRP metric since all I&C iteration service realization patterns
are done through indirect exposure which provides looser coupling for the overall
SOA solution.
The determination of health of the SOA application based on the short analysis that
was completed is a more complex question given the limited amount of data. As
indicated earlier in this paper, additional SOA governance parameters need to be
evaluated. However, from the limited information that we collected for this case
study, there are no red flags that can be raised to indicate an unhealthy behavior or
any major issues with the health of the given SOA solution.
6 Future Work
The primary contribution of this paper is the proposed set of metrics that should be
tracked and measured for every SOA engagement so that better insight can be gleaned
into the complexity, agility and flexibility of the SOA application. However, one of
the common problems with new metrics suite is the difficulty of empirically
validating and calibrating them across a number of projects. For example, the case
study demonstrates the need to weight each metric to provide more accurate
complexity, flexibility, and agility measurements. For example, table 3 shows a
slightly higher value of SCP for the Service Connectivity iteration. It also shows a
positive value for DSSS metrics which tends to increase complexity. By definition,
Table 3: Services and metrics from the Open Account case study
Notes:
- All services were stateless, provided no support for transactions, had only a single version, and
utilized virtualized access. These columns are therefore not shown in the table.
- The NOS metric column contains two values since the metric distinguishes between the ratios of
external services vs. internal services relative to the overall number of services.
this should have resulted in more complexity for the Service Connectivity which is
true. However, from real life experience the Service Connectivity iteration took
longer to accomplish due to increased complexity as a result of other metrics in the
table such as SRP and WSIC. Despite these problems, this paper has proposed a
reasonable set of metrics, identified as a result of observing numerous SOA
deployments. Future work will include empirical assessment of these metrics and the
identification of additional ones in order to build a demonstrably useful set of SOA
metrics for predicting complexity, flexibility, and agility across a broad spectrum of
SOA applications. Additional work is also required to provide clear methods for
calculating the values of the proposed aggregate SOA indices and interpret their
implications in terms of SOA flexibility, agility and complexity.
Acknowledgments. We would like to thank our colleague Russell Hartmann from
IBM for his help in providing the data for the case study.
7 References
1. Rud, D., Schmietendorf, A., Dumke, R.R.: Product Metrics for Service-Oriented
Infrastructure. International Workshop on Software Measurement/Metrikon 2006
2. Liu, Y.M., Traore I.: Complexity Measures for Secure Service-Oriented Software
Architectures. The International Workshop on Predictor Models in Software
Engineering (PROMISE’07)
3. Qian, K., Liu, J., Tsui, F.: Decoupling Metrics for Services Composition. Proceedings
of the 5th IEEE/ACIS International Conference and Information Sciences and 1st
IEEE/ACIS International Workshop on Component-Based Software Engineering,
Software Architecture and Reuse (ICIS-COMSAR’06)
4. Arsanjani, A., Allam, A.:Service-Orineted Modeling and Architecture for Realization
of an SOA. IEEE International Conference on Services Computing (SCC’06)
5. Arsanjani, A., Zhang L., Ellis, M., Abdul Allam, and Channabasavaiah, K.: S3: A
Service-Oriented Reference Architecture. IT Pro, pp. 10—17, June (2007)
6. Chidamber, S.R., Kemerer, C.F.: A Metrics Suite for Object Oriented Design. IEEE
Transactions on Software Engineering, vol. 20, no. 6, pp. 476-493. (1994) 7. Arsanjani, A., Ghosh, S., Allam, A., Abdollah, T., Ganapathy S., Holley, K.: SOMA:
A method for developing service-oriented solutions. IBM Systems Journal, vol. 47,
no. 3, pp. 377—396. (2008)
8. Web Services Resource Framework (WSRF), http://docs.oasis-open.org/wsrf/wsrf-
primer-1.2-primer-cd-02.pdf
9. Newcomer, Eric, Lomow, Greg.: Understanding SOA with Web Services. Addison
Wesley, San Francisco (2005)
10. OASIS Web Services Transaction (WS-TX) landing page, http://www.oasis-
open.org/committees/tc_home.php?wg_abbrev=ws-tx
11. Ferguson, D.F., Stockton, M.L.: Service Oriented Architecture: Programming Model
and Product Architecture. IBM Systems Journal, vol. 44, no. 4, pp. 753--780. (2005)
12. Web Services Context Specification (WS-Context), http://xml.coverpages.org/WS-
ContextCD-9904.pdf
Related Documents


