TECHNICAL NOTE | January 2018 | 1 TECHNICAL NOTE A METHODOLOGY TO ESTIMATE WATER DEMAND FOR THERMAL POWER PLANTS IN DATA-SCARCE REGIONS USING SATELLITE IMAGES TIANYI LUO, ARJUN KRISHNASWAMI, AND XINYUE LI ABSTRACT Thermal power plants depend on and consume water for cooling. Detailed power sector water-use data can help aid in evaluating the security of water access for power plants as well the impact of their water use on downstream water users. While power generation data are widely available globally, no readily available global data exist on power plant water withdrawal and consumption. This paper proposes an innovative methodology to help close the power sector water-use data gap for data-scarce regions. The methodology uses free, easily accessible satellite images to visually identify cooling and fuel type, and empirical water-use factors to estimate water demand. The method was tested against 200 U.S. power plants and achieved 90 percent precision in cooling technology identification, 89 percent precision in fuel identification, and 69 percent precision in water demand estimation. Information gleaned from this methodology can be used by companies, investors, and the general public to better understand water risks to energy and to devise a better path forward. INTRODUCTION Most thermal power plants cannot operate without water. Power plants have been experiencing shutdowns or reduced generation due to water shortages across the globe. Depending on the specific cooling and fuel type, the water withdrawal and consumption intensity of different power plants varies greatly from almost none up to hundreds of cubic meters of water per megawatt-hour (Macknick et al. 2012), exposing operations to different levels of chronic and acute water risks. CONTENTS Abstract ........................................................... 1 Introduction ....................................................... 1 Methodology ..................................................... 2 References ....................................................... 11 Technical notes document the research or analytical methodology underpinning a publication, interactive application, or tool. Suggested Citation: Luo, T., A. Krishnaswami, and X. Li. 2018. “A Methodology to Estimate Water Demand for Thermal Power Plants in Data-Scarce Regions Using Satellite Images.” Technical Note. Washington, DC: World Resources Institute. Available online at: www.wri.org/publication/water-power-methodology.

Welcome message from author
This document is posted to help you gain knowledge. Please leave a comment to let me know what you think about it! Share it to your friends and learn new things together.
Transcript

TECHNICAL NOTE | January 2018 | 1
TECHNICAL NOTE
A METHODOLOGY TO ESTIMATE WATER DEMAND FOR THERMAL POWER PLANTS IN DATA-SCARCE REGIONS USING SATELLITE IMAGESTIANYI LUO, ARJUN KRISHNASWAMI, AND XINYUE LI
ABSTRACTThermal power plants depend on and consume water for cooling. Detailed power sector water-use data can help aid in evaluating the security of water access for power plants as well the impact of their water use on downstream water users. While power generation data are widely available globally, no readily available global data exist on power plant water withdrawal and consumption. This paper proposes an innovative methodology to help close the power sector water-use data gap for data-scarce regions. The methodology uses free, easily accessible satellite images to visually identify cooling and fuel type, and empirical water-use factors to estimate water demand. The method was tested against 200 U.S. power plants and achieved 90 percent precision in cooling technology identification, 89 percent precision in fuel identification, and 69 percent precision in water demand estimation. Information gleaned from this methodology can be used by companies, investors, and the general public to better understand water risks to energy and to devise a better path forward.
INTRODUCTIONMost thermal power plants cannot operate without water. Power plants have been experiencing shutdowns or reduced generation due to water shortages across the globe. Depending on the specific cooling and fuel type, the water withdrawal and consumption intensity of different power plants varies greatly from almost none up to hundreds of cubic meters of water per megawatt-hour (Macknick et al. 2012), exposing operations to different levels of chronic and acute water risks.
CONTENTSAbstract ...........................................................1Introduction .......................................................1Methodology ..................................................... 2References .......................................................11
Technical notes document the research or analytical methodology underpinning a publication, interactive application, or tool.
Suggested Citation: Luo, T., A. Krishnaswami, and X. Li. 2018. “A Methodology to Estimate Water Demand for Thermal Power Plants in Data-Scarce Regions Using Satellite Images.” Technical Note. Washington, DC: World Resources Institute. Available online at: www.wri.org/publication/water-power-methodology.

2 |
Thermal power generation accounted for roughly nine percent of global freshwater withdrawal in 2014 (IEA 2016), and this use competed for water with cities, other industrial users, and farmers. An integrated understanding of water and energy, as well as detailed power sector water-use data and information, is needed for more informed power sector decision-making from planning to operation and in order to provide reliable access to electricity, minimize environmental impact, and ensure business continuity.
However, for most of the world, data on power plant water withdrawal and consumption are not readily available. Most countries do not require water withdrawal or water stress disclosure. If they do, the data are not publicly available or easily accessible, leaving a significant data gap in assessing water-related electricity generation insecurity and in making science-based integrated energy and water decisions.
Leveraging the power of the vast trove of global satellite imagery, World Resources Institute (WRI) has developed an innovative methodology to help close the water-use data gap in the thermal power sector. This methodology was developed first to identify cooling technology and fuel type for individual thermal power plants using satellite images and then to estimate water withdrawal and consumption factors based on empirical water-use data collected in the United States from literature when actual power plant-level data were not readily available. We have experimented and tested the method with 200 power plants in the United States and compared our estimation results with reported data from the U.S. Energy Information Administration (EIA).
Data developed using this approach can be useful to analysts and researchers across sectors. Governments can use data on power plant water withdrawal and consumption intensity, together with local water availability information, to plan electricity generation investments and ensure equitable and reliable access to both electricity and water. Companies can use these data to better estimate their water footprint embedded in purchased electricity and to further assess their value chain exposure to water-related risks. Investors can use aggregated corporate-level water-use and risk data to benchmark power and energy companies for more comprehensive environmental screenings.
METHODOLOGYIn this section, we define the research scope of this project and the framework for analysis, before continuing in the next section to the definition of key terms used in this paper.
ScopeOur research focuses on thermoelectric power plant water use only, which accounts for 88 percent of global energy sector water withdrawal (IEA 2016) and does not cover water use in non-thermal power plants, such as hydropower or photovoltaic, or other aspects of the electricity life cycle, such as fuel extraction or refinery. Water quality issues associated with thermal power generation are also outside of our scope of work. Different fuel types generate electricity at different temperatures and thus require different amounts of water for cooling per unit of electricity generated. The fuel sources we consider as thermal include coal, natural gas, oil, biomass, geothermal, nuclear, and concentrated solar power.
The primary demand for water in a thermal power plant comes from cooling, and the rest is from other processes, such as ash handling (National Energy Technology Laboratory 2007). Cooling systems can be generally classified as dry cooling or wet cooling. Usually, little or no water is required by dry systems, whereas the water demand of different wet systems varies greatly (Macknick et al. 2012). To reflect the differences in cooling system water requirements, we group cooling systems into four categories: dry, once-through, recirculating tower, and recirculating pond. We discuss these categories in detail in the definitions section (Step 1).
We consider two aspects of water use: withdrawal and consumption. The U.S. Geological Survey (USGS) defines “withdrawal” as the water that is diverted from a water source (e.g., surface water, groundwater) and “consumption” as the portion of water evaporated or incorporated into crops or products and thus no longer available for downstream use. Both metrics are important. For example, withdrawal is more relevant when assessing a power plant’s dependency on water, whereas consumption is more useful when assessing the impact on the environment and downstream users.

TECHNICAL NOTE | January 2018 | 3
A Methodology to Estimate Water Demand for Thermal Power Plants in Data Scarce Regions Using Satellite Images
Framework for AnalysisSatellite images have been used to identify power plant cooling systems by the USGS and others (Diehl et al. 2013). Additionally, using cooling and generation types in estimating water-use factors for thermal power plants has been proven to be effective (Macknick et al. 2012). However, little research has focused on the integration of the two methods or on the development of an approach that estimates water uses for power plants for which cooling and/or generation data are not available.
We outline a three-step method to estimate power plant water withdrawal and consumption based on cooling type, fuel type, and actual generation. The types of cooling and fuel technology broadly determine a thermal power plant’s water withdrawal and consumption per unit of electricity generated. Net generation measures how many units of electricity were generated in a certain time period.
The first step is to identify the cooling and fuel type of a given power plant using satellite images (e.g., from Google Earth, Bing, or other high-resolution products). The second step is to assign the target plant with water withdrawal and consumption factors based on the cooling and fuel type identified in step 1. The third step is to calculate the total withdrawal and consumption for a specific time period with net generation during that period and water factors assigned in step 2.
Step 1: Cooling and fuel type identificationWRI used satellite images to identify not only the cooling method but also fuel types for power plants. We identified unique infrastructure characteristics of each cooling and fuel system by reviewing engineering design diagrams and by analyzing a set of satellite images of power plants with known cooling and fuel types (EIA Form 860). Key characteristics of different cooling and fuel types were identified with the image set and are used as the basis for a visual identification approach, as follows:
Cooling technologyOnce-through or open loop cooling systems withdraw water from a surface water source, run it through the condenser, and return it to the source, as shown in Figure 1. Power plants with once-through systems are usually very close to natural water bodies, such as oceans, lakes,
TurbineGenerator
HotWater
ColdWater
Steam Condenser
Steam
Steam
Water BodyHeat Source
SteamGenerator
Figure 1 | Diagram of Once-Through Systems
Source: BP 2013
Figure 2 | Satellite Images of a Once-Through System
Source: 2017 Google
Once-through system outlet
Once-through system intake
Once-through system intake pumps

4 |
and rivers. There are usually noticeable water intake structures with pumps, as well as discharge outlets that feature fast-flowing water with visible splashes. Additionally, in typical cases, no other cooling towers or structures would be found within the plant campus. In Figure 2, the satellite image above is of a nuclear power plant with a once-through cooling system. The image below is a close-up shot of the water intake pumps.
Recirculating tower cooling systems, including natural draft towers (Figure 3), mechanical induced-draft towers, and mechanical forced-draft towers, use water to cool
Steam condenser
Steam Hot water
Hot air water vapor
Coldwater
To steamgeneration
Condensedwater
Blow down
Make-upwater
Cold air
From turbine
Figure 3 | Diagram of Recirculating Systems
Source: BP 2013
Generator
Turbine
Boiler Water
High Pressure SteamLow Pressure SteamAir cooledCondenser
Air out Air out
Fan
Air inAir in
Heat Source
Boiler
Figure 6 | Diagram of Dry Cooling Systems
Source: USGAO 2009
Figure 4 | Satellite Images of Recirculating Systems
Source: 2017 Google
Flue-gas stack
Flue-gas stack
Natural draft recirculating towers with water
vapor plume
Mechanical draft recirculating towers with
water vapor plume
Figure 5 | Satellite Image of a Pond Recirculating System
Source: 2017 Google
Parts of the cooling pond
Parts of the plant

TECHNICAL NOTE | January 2018 | 5
A Methodology to Estimate Water Demand for Thermal Power Plants in Data Scarce Regions Using Satellite Images
the steam in the condenser and then dissipate heat from the cooling water using evaporative cooling through draft towers. Natural draft towers are large, tall hyperboloid structures made of concrete with distinct wide top openings that often show an existing steam plume. Mechanical draft towers are typically lines of low-lying gridded structures with fans on the top (induced) or on the side (forced), also sometimes displaying a steam plume. In Figure 4, the image above is a satellite image of a power plant with natural draft towers, and the image below shows a power plant with induced draft towers.
Recirculating pond cooling systems use ponds for evaporative cooling, rather than draft towers, as shown
in Figure 5. Power plants with pond cooling systems are usually close to relatively small man-made reservoirs. The size of those reservoirs varies but is generally three to ten times the size of the power plant campus. Usually no other cooling towers or structures are found in those plant images.
Dry cooling systems, such as direct and indirect, use air as the major heat sink for the cooling process, as shown in Figure 6. This type of system has visually distinct structures that are accordion-like, with central pipes running across the top in parallel and smaller ones branching out, as shown in Figure 7.
In some cases, power plants may have multiple cooling systems or hybrid systems, such as once-through and recirculating or recirculating and dry cooling, for different seasons during the year or for different generating units. We recommend that all identified systems be recorded when applying this method. Although it was not possible to estimate which system covers what percentage of the generation capacity based on satellite images, data on multicooling systems could be helpful in providing possible ranges in water-use factors.
When definitive information on cooling type for a plant is available from other sources, the visual identification step described above may be skipped or used as a validation exercise.
Source: 2017 Google
Figure 7 | Satellite Image of a Dry Cooling System
Source: 2017 Google
Dry cooling systems
Figure 8 | Satellite Images of a Coal-Fired Power Plant (Left) and a Biomass Power Plant (Right)
Biomass Pit
Coal Pits

6 |
Fuel typeCoal plants usually have one or several black coal fields, as shown in the image at the left in Figure 8. These are connected by a transportation mechanism, typically conveyor belts, to transport the coal to buildings where boilers are located. Coal plants also are usually equipped with flue gas stacks in the shape of tall thin cones.
Biomass plants are usually very similar to coal plants from a satellite image. They also have conveyor belts transporting the fuels to boiler buildings, as well as flue gas stacks emitting plumes of smoke. One distinction with biomass plants is the fuel storage field, which is typically a brown or a dark brown color, rather than black as in coal plants, as shown in the image at the right in Figure 8.
Natural gas and oil plants (Figure 9) have cylindrical or spherical tanks for fuel storage near or on campus. It is difficult to differentiate between gas and oil plants because the storage tanks for both fuel types often look very similar from satellite images. However, one differentiating feature can be typical and commonly used cylindrical oil tanks with flat external floating roofs, sometimes with horizontal ladders on the top, which rise and fall with the level of oil liquids inside the tank. Both types of plants usually have tall and thin cone-shaped flue gas stacks.
Nuclear plants have large domed towers, as shown in Figure 10, or rectangular buildings for the reactors. There are typically no open fields or large tanks for fuel storage.Additionally, no flue gas stack is needed in a nuclear plant.
Geothermal plants have visible pipelines that branch out for miles from the main site for pumping up and reinjecting geothermal fluids, as shown at the image at left in Figure 11. These plants are typically located in remote and mountainous areas. There are usually no open fields or large tanks for fuel storage or flue gas stacks.
Concentrated solar power plants have hundreds or thousands of arrays of mirrors, as shown in the image at right in Figure 11. These plants are typically located in remote and desert areas. There are usually no open fields or large tanks for fuel storage or flue gas stacks.
If definitive information on fuel type for a plant is available from other sources, this visual identification step may be skipped or used as a validation exercise.
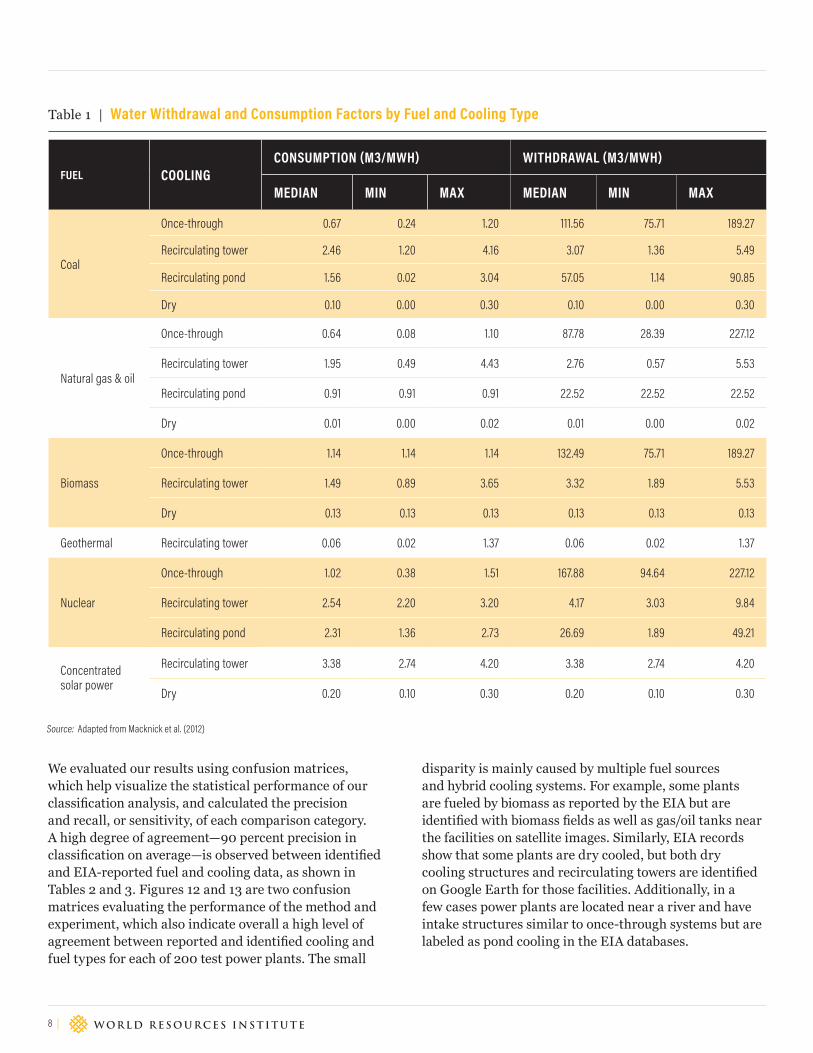
Step 2: Water withdrawal and consumption factor determinationThe cooling system and fuel type are the two dominant contributors in determining water withdrawal and consumption factors of a specific thermal power plant. With cooling and fuel types identified, a plant’s water-use factors can be estimated based on empirical power plant water-use records (Macknick et al. 2012). Table 1 presents water withdrawal and consumption factors by cooling and fuel combination, and can be used as the look-up table once the cooling system and fuel type are identified. The factors in Table 1 are collected and summarized based on U.S. power plants. Oil plants are grouped into the
Figure 9 | Satellite Images of a Natural Gas Power Plant (Left) and an Oil Power Plant (Right)
Source: 2017 Google
Natural Gas Tanks
Oil Tanks

TECHNICAL NOTE | January 2018 | 7
A Methodology to Estimate Water Demand for Thermal Power Plants in Data Scarce Regions Using Satellite Images
natural gas category because it is usually quite difficult to distinguish between oil and gas tanks with satellite imagery, and no oil plant data are available in Macknick et al. (2012). However, we acknowledge that gas plants are usually less dependent on water, compared to oil plants.
Additionally, if fuel type and generation technology information are available through other sources for the study plant, we recommend using the fuel and generation technology-specific water-use factors from Macknick et al. (2012) for higher accuracy. Also, water regulations or management practices vary among countries, and these variances could affect actual water requirements. Therefore, when possible, national-specific factors can help reduce uncertainties embedded in the methodology.
In cases where a power plant has multiple cooling systems or fuel types, how water-use factors should be aggregated is subjective. One approach, and the one we used in our test in the United States, would be to combine the water-use ranges of different systems, taking the minimum of the minimums as the new minimum and the opposite for the maximums, to create the new range for the multi system. This approach preserves the range of all possibilities by keeping the upper and lower bounds.
Step 3: Water withdrawal and consumption estimationWhen actual generation data or plant capacity factors are available, the amount of water withdrawal and consumption of power plants over a specific time period can be calculated using the water withdrawal and
consumption factors in Table 1. However, for power plants with no generation data or capacity factors available, our proposed method can only provide estimated water withdrawal and consumption factors.
Method experiment and comparisonWRI applied the methodology just described with “human learning” by two analysts on 200 thermal power plants in the United States and compared identified fuel and cooling type and estimated water uses with reported data from EIA Forms 860 and 923. Form 860 reports power plant characteristics including plant location, fuel type, and cooling technology, whereas Form 923 discloses annual generation and water usage reported by power plants.
Figure 10 | Satellite Image of a Nuclear Power Plant
Source: 2017 Google
Nuclear ReactorTowers
Source: 2017 Google
Figure 11 | Satellite Images of a Geothermal Power Plant (Left) and a Concentrated Solar Power Plant (Right)
GeothermalFluid Pipelines
Solar Concentrators(Mirrors)
8 |
We evaluated our results using confusion matrices, which help visualize the statistical performance of our classification analysis, and calculated the precision and recall, or sensitivity, of each comparison category. A high degree of agreement—90 percent precision in classification on average—is observed between identified and EIA-reported fuel and cooling data, as shown in Tables 2 and 3. Figures 12 and 13 are two confusion matrices evaluating the performance of the method and experiment, which also indicate overall a high level of agreement between reported and identified cooling and fuel types for each of 200 test power plants. The small
disparity is mainly caused by multiple fuel sources and hybrid cooling systems. For example, some plants are fueled by biomass as reported by the EIA but are identified with biomass fields as well as gas/oil tanks near the facilities on satellite images. Similarly, EIA records show that some plants are dry cooled, but both dry cooling structures and recirculating towers are identified on Google Earth for those facilities. Additionally, in a few cases power plants are located near a river and have intake structures similar to once-through systems but are labeled as pond cooling in the EIA databases.
FUEL COOLINGCONSUMPTION (M3/MWH) WITHDRAWAL (M3/MWH)
MEDIAN MIN MAX MEDIAN MIN MAX
Coal
Once-through 0.67 0.24 1.20 111.56 75.71 189.27
Recirculating tower 2.46 1.20 4.16 3.07 1.36 5.49
Recirculating pond 1.56 0.02 3.04 57.05 1.14 90.85
Dry 0.10 0.00 0.30 0.10 0.00 0.30
Natural gas & oil
Once-through 0.64 0.08 1.10 87.78 28.39 227.12
Recirculating tower 1.95 0.49 4.43 2.76 0.57 5.53
Recirculating pond 0.91 0.91 0.91 22.52 22.52 22.52
Dry 0.01 0.00 0.02 0.01 0.00 0.02
Biomass
Once-through 1.14 1.14 1.14 132.49 75.71 189.27
Recirculating tower 1.49 0.89 3.65 3.32 1.89 5.53
Dry 0.13 0.13 0.13 0.13 0.13 0.13
Geothermal Recirculating tower 0.06 0.02 1.37 0.06 0.02 1.37
Nuclear
Once-through 1.02 0.38 1.51 167.88 94.64 227.12
Recirculating tower 2.54 2.20 3.20 4.17 3.03 9.84
Recirculating pond 2.31 1.36 2.73 26.69 1.89 49.21
Concentrated solar power
Recirculating tower 3.38 2.74 4.20 3.38 2.74 4.20
Dry 0.20 0.10 0.30 0.20 0.10 0.30
Table 1 | Water Withdrawal and Consumption Factors by Fuel and Cooling Type
Source: Adapted from Macknick et al. (2012)

TECHNICAL NOTE | January 2018 | 9
A Methodology to Estimate Water Demand for Thermal Power Plants in Data Scarce Regions Using Satellite Images
With respect to comparison of water withdrawal and consumption estimates, for testing purposes we excluded from the sample plants with hybrid cooling systems as well as wet-cooled facilities that report zero water consumption. For each power plant, water withdrawal and consumption data reported in the EIA Form 860 were compared with the estimated ranges using the minimum and maximum values in Table 1 of the identified cooling and fuel type. As shown in Table 4, reported data of most dry and recirculating tower cooled plants fall within the ranges estimated by our methodology. Some large disparities occur in plants with once-through and recirculating pond cooling systems. This is likely due in large part to the inconsistency in differences in water-use definitions and measuring and reporting practices among U.S. power plant disclosures (Diehl et al. 2013).
Limitations and caveatsOur proposed method for identifying fuel and cooling systems works well for most cases where the structural features are pronounced and clearly identifiable from satellite images.
COAL GAS (NG) / OIL (OL)
BIOMASS (BIO) NUCLEAR GEOTHERMAL
(GEO) CSP (SOL) TOTAL
Number of Plants Tested 62 95 12 16 16 2 200
Number of correct tests 57 85 9 15 15 2 180
Precision 92% 89% 75% 94% 94% 100% 90%
Recall 29% 43% 5% 8% 8% 1% 90%
Table 2 | Comparison of Method: Identified Fuel Sources and Records from EIA Databases
0
0
0
0
0
0
0
0
0
1
0
0
8
0
0
0
0
0
0
0
0
0
0
1
0
1
0
0
0
0
0
0
0
0
2
0
81
0
0
2
0
0
0
1
0
0
0
0
16
0
2
0
0
0
0
0
0
0
0
0
1
2
0
0
0
0
0
0
0
3
0
0
58
0
1
0
0
0
1
0
0
0
0
0
0
0
0
0
0
0
0
6
0
0
1
0
1
0
0
0
0
0
0
0
0
0
0
1
15
0
0
0
0
0
0
0
0
0
0
0
0
NG & OL & Geo
Bio
Unidentified
NG & OL
Nuclear
Sol
Coal
Bio & NG & OL
Coal & NG & OL
Geo
NG & OL & Sol
Repo
rted
Reco
rds i
n EI
A Fr
om 86
0
NG &
OL &
Geo Bio
Unide
ntifie
d
NG &
OL
Nucle
ar Sol
Coal
Bio &
NG
& OL
Coal
& NG
& O
L
Geo
NG &
OL &
Sol
Identified Records Using WRI Method
100
90
80
70
60
50
40
30
20
10
0
Figure 12 | Confusion Matrix for Fuel Classification
ONCE-THROUGH (OT)
RECIRCULATING TOWER (RC)
RECIRCULATING POND (PD) DRY (DR) TOTAL
Number of plants tested 71 101 14 19 200
Number of correct tests 65 94 9 14 178
Precision 92% 93% 64% 74% 89%
Recall 33% 47% 5% 7% 89%
Table 3 | Comparison of Method: Identified Cooling Type and Records from EIA Databases

10 |
However, depending on the image resolution, timing of the satellite shot, and clarity of the key features, there are circumstances where one may not be able to identify the systems with high confidence using the proposed method. Another limitation of this method is that different generation technologies within the same fuel type (e.g., subcritical, supercritical, or plants with carbon capture and storage) cannot be distinguished. Water requirements can vary among these different technologies.
Additionally, when multiple fuel sources and/or hybrid cooling systems are identified for a single plant, the determination of water-use factors is more complex. There are many plausible explanations for these types of scenarios, such as plant upgrades or expansions,
operation optimizations to respond to variable water supply conditions, and so forth.
Furthermore, the water-use factors we adopted are based on published statistics for plant operations in the United States. Actual factors in other countries may vary due to differences in operations, climate, water quality, regulations, and other aspects. The method described here can still be used, but the water withdrawal and consumption factors could be further refined to account for local conditions.
Finally, if the objective is to calculate total water withdrawal and consumption to better understand a power plant’s overall vulnerability and impact, and yet generation data are not available, a capacity factor estimate of the power plant would need to be made. This would introduce additional uncertainty to water-use and consumption estimates.
DiscussionThe proposed method is designed as the first attempt one could take to fill data gaps in regions where power plant level water-use information is not available. By following the three-step approach described in the methodology, estimates on water withdrawal and consumption could be determined for individual thermal power plants. We hope to apply our method across the globe and develop the world’s first comprehensive database on power plant cooling systems and water withdrawal and consumption.
Our method offers global consistency, comparability, and scalability and would add value to macrolevel national and regional energy and environmental planning, as well as portfolio analysis for better understanding of power sector and company exposure to water risks, including the water footprint and impact on the environment and other
ONCE-THROUGH RECIRCULATING TOWER
RECIRCULATING POND DRY TOTAL
Consumption or withdrawal C W C W C W C W C W
Number of plants tested 17 17 47 47 7 7 12 12 83 83
Number of tests within range 5 10 36 34 2 1 12 12 55 57
Percentage within range 29% 58% 77% 72% 29% 14% 100% 100% 66% 69%
Table 4 | Comparison of Method-Estimated Water-Use and Consumption Ranges and Reported Data from EIA Databases
0
0
0
0
0
0
1
0
0
0
0
3
0
0
0
0
1
4
0
0
0
0
0
0
0
0
1
0
0
0
0
0
0
1
0
0
0
0
0
0
0
0
0
0
0
1
0
0
0
0
0
0
0
0
0
9
3
0
0
0
0
0
0
3
0
0
89
2
1
0
0
1
0
0
0
3
2
60
0
0
0
0
0
6
0
0
1
0
14
0
0
0
0
0
0
0
0
0
4
0
Unidentified
OT & RC
RC
RC & PD
PD & RC
PD
RC
OT
DR
DR & DC
Repo
rted
Reco
rds i
n EI
A Fr
om 86
0
Unide
ntifie
d
OT &
RC RC
RC &
PD
PD &
RC PD RC OT DR
DR &
DC
Identified Records Using WRI Method
100
90
80
70
60
50
40
30
20
10
0
Figure 13 | Confusion Matrix for Cooling Classification

TECHNICAL NOTE | January 2018 | 11
A Methodology to Estimate Water Demand for Thermal Power Plants in Data Scarce Regions Using Satellite Images
water users in a given watershed. However, due to the limitations and caveats documented in previous sections, the method should be used with caution when the study focus is a single power plant.
This method has been tried and tested for the United States, which has good satellite imagery as well as data availability. For applications elsewhere, method accuracy and identification efficiency could be improved in several ways, subject to satellite and water data availability—for example, adding empirical water-use factors from other countries and developing a machine learning algorithm for visual recognition. As new power plants are being added constantly and some old ones upgraded, automated algorithms could be very useful to track and update this type of database to help measure change and progress.
No global methods or models can fully capture everything happening on the ground. For those who think ahead and wish to better understand the water-energy nexus in places where data are scarce, our method can provide a means to overcome a critical existing information gap. Ultimately, it is our goal to leverage analyses and databases developed using our method as objective evidence to promote more accountability and transparency in measuring and disclosing water data in the power sector and to prioritize considerations of water resources in the power sector’s decision-making process. To improve these data and build a robust global dataset for the future, it will be important to move today toward standardizing reporting frameworks and consolidating the resulting data on a single data platform.
REFERENCESBP (British Petroleum). 2013. Water in the Energy Industry: An Introduction. London, United Kingdom: British Petroleum.
Diehl, T.H., M.A. Harris, J.C. Murphy, S.S. Hutson, and D.E. Ladd. 2013. Methods for Estimating Water Consumption for Thermoelectric Power Plants in the United States. Washington, DC: U.S. Geological Survey.
IEA. 2016. World Energy Outlook. Paris, France: International Energy Agency.
Macknick, J., R. Newmark, G. Heath, and K. C. Hallett. 2012. “Operational Water Consumption and Withdrawal Factors for Electricity Generating Technologies: A Review of Existing Literature.” Environmental Research Letters 7 (4). doi:10.1088/1748-9326/7/4/045802. http://iopscience.iop.org/article/10.1088/1748-9326/7/4/045802/pdf.
National Energy Technology Laboratory. 2007. Power Plant Water Usage and Loss Study. Update. Washington, DC: National Energy Technology Laboratory.
USGAO (United States Government Accountability Office). 2009. Energy-Water Nexus: Improvements to Federal Water Use Data Would Increase Understanding of Trends in Power Plant Water Use. Washington, DC: USGAO.

ABOUT WRI World Resources Institute is a global research organization that turns big ideas into action at the nexus of environment, economic opportunity and human well-being.
Our ChallengeNatural resources are at the foundation of economic opportunity and human well-being. But today, we are depleting Earth’s resources at rates that are not sustainable, endangering economies and people’s lives. People depend on clean water, fertile land, healthy forests, and a stable climate. Livable cities and clean energy are essential for a sustainable planet. We must address these urgent, global challenges this decade.
Our VisionWe envision an equitable and prosperous planet driven by the wise manage-ment of natural resources. We aspire to create a world where the actions of government, business, and communities combine to eliminate poverty and sustain the natural environment for all people.
Our ApproachCOUNT ITWe start with data. We conduct independent research and draw on the lat-est technology to develop new insights and recommendations. Our rigorous analysis identifies risks, unveils opportunities, and informs smart strategies. We focus our efforts on influential and emerging economies where the future of sustainability will be determined.
CHANGE ITWe use our research to influence government policies, business strategies, and civil society action. We test projects with communities, companies, and govern-ment agencies to build a strong evidence base. Then, we work with partners to deliver change on the ground that alleviates poverty and strengthens society. We hold ourselves accountable to ensure our outcomes will be bold and endur-ing.
SCALE ITWe don’t think small. Once tested, we work with partners to adopt and expand our efforts regionally and globally. We engage with decision-makers to carry out our ideas and elevate our impact. We measure success through government and business actions that improve people’s lives and sustain a healthy environment.
Maps are for illustrative purposes and do not imply the expression of any opinion on the part of WRI, concerning the legal status of any country or territory or concerning the delimitation of frontiers or boundaries.
Copyright 2018 World Resources Institute. This work is licensed under the Creative Commons Attribution 4.0 International License. To view a copy of the license, visit http://creativecommons.org/licenses/by/4.0/
10 G Street, NE | Washington, DC 20002 | www.WRI.org
ACKNOWLEDGMENTSWe are pleased to acknowledge our institutional strategic partners, who provide core funding to WRI: the Netherlands Ministry of Foreign Affairs, the Royal Danish Ministry of Foreign Affairs, and the Swedish International Development Cooperation Agency.
We are thankful for the many people who provided support and guidance to help shape this report. Many thanks to Alex Kovac, Rachael Petersen, Nitin Pandit, Deepak Krishnan, Vittal Boggaram, and Betsy Otto (from World Resources Insti-tute), Yoshihide Wada (International Institute for Applied Systems Analysis), and Divyam Nagpal and Verena Ommer (International Renewable Energy Agency) for reviewing this paper.
We are grateful for the administrative, editorial, and design support of Bill Dugan, Leah Schleifer, Maria Hart, Carin Hall, Naomi Slack, Emily Matthews, and Caroline Taylor.
This research is made possible with funding from the Growald Family Fund.
ABOUT THE AUTHORSTianyi Luo is a Research Associate with the Aqueduct Project and Global Water Program at the World Resources Institute.
Contact: [email protected]
Arjun Krishnaswami is a Schneider Sustainable Energy Fellow at the Natural Resources Defense Council.
Xinyue Li is a doctoral candidate at the University of California, Los Angeles.
Related Documents