eScholarship provides open access, scholarly publishing services to the University of California and delivers a dynamic research platform to scholars worldwide. Institute of Transportation Studies UC Davis Peer Reviewed Title: A Methodology to Assess the Reliability of Hydrogen-based Transportation Energy Systems Author: McCarthy, Ryan , University of California, Davis Publication Date: 12-01-2004 Series: Recent Work Publication Info: Institute of Transportation Studies Permalink: http://www.escholarship.org/uc/item/0jb3w61z Keywords: UCD-ITS-RR-04-36 Abstract: This paper introduces a method to assess the reliability of hydrogen supply systems for transportation applications. It relies on a panel of experts to rate the reliability and importance of various metrics as they pertain to selected hydrogen systems. These are aggregated to develop broad reliability scores to be compared across systems. A trial application of the methodology is presented, where a group of hydrogen researchers at the Institute of Transportation Studies at the University of California, Davis comprise the expert panel. Two hydrogen pathways supplying a hypothetical network of refueling stations in Sacramento were compared. The first uses centralized steam reforming of imported liquefied natural gas and pipeline distribution of hydrogen. The second electrolyzes water onsite from electricity produced independent of the grid, and no hydrogen transport is required. The panel determined the second pathway to be more reliable, primarily due to the lack of imports, the distributed nature of the system, and the lack of hydrogen transport. This preliminary application only intends to demonstrate how the method is applied, however, and the results presented here should not be taken as definite. Copyright Information: All rights reserved unless otherwise indicated. Contact the author or original publisher for any necessary permissions. eScholarship is not the copyright owner for deposited works. Learn more at http://www.escholarship.org/help_copyright.html#reuse

Welcome message from author
This document is posted to help you gain knowledge. Please leave a comment to let me know what you think about it! Share it to your friends and learn new things together.
Transcript
eScholarship provides open access, scholarly publishingservices to the University of California and delivers a dynamicresearch platform to scholars worldwide.
Institute of Transportation StudiesUC Davis
Peer Reviewed
Title:A Methodology to Assess the Reliability of Hydrogen-based Transportation Energy Systems
Author:McCarthy, Ryan, University of California, Davis
Publication Date:12-01-2004
Series:Recent Work
Publication Info:Institute of Transportation Studies
Permalink:http://www.escholarship.org/uc/item/0jb3w61z
Keywords:UCD-ITS-RR-04-36
Abstract:This paper introduces a method to assess the reliability of hydrogen supply systems fortransportation applications. It relies on a panel of experts to rate the reliability and importance ofvarious metrics as they pertain to selected hydrogen systems. These are aggregated to developbroad reliability scores to be compared across systems. A trial application of the methodology ispresented, where a group of hydrogen researchers at the Institute of Transportation Studies atthe University of California, Davis comprise the expert panel. Two hydrogen pathways supplying ahypothetical network of refueling stations in Sacramento were compared. The first uses centralizedsteam reforming of imported liquefied natural gas and pipeline distribution of hydrogen. Thesecond electrolyzes water onsite from electricity produced independent of the grid, and nohydrogen transport is required. The panel determined the second pathway to be more reliable,primarily due to the lack of imports, the distributed nature of the system, and the lack of hydrogentransport. This preliminary application only intends to demonstrate how the method is applied,however, and the results presented here should not be taken as definite.
Copyright Information:All rights reserved unless otherwise indicated. Contact the author or original publisher for anynecessary permissions. eScholarship is not the copyright owner for deposited works. Learn moreat http://www.escholarship.org/help_copyright.html#reuse
i
A Methodology to Assess the Reliability of Hydrogen-based Transportation Energy Systems
By
RYAN WILLIAM McCARTHY
B.S. (University of California, San Diego) 2002
THESIS
Submitted in partial satisfaction of the requirements for the degree of
MASTER OF SCIENCE
In
Civil and Environmental Engineering
In the
OFFICE OF GRADUATE STUDIES
of the
UNIVERSITY OF CALIFORNIA
DAVIS
UCD-ITS-RR-04-36
Committee in Charge:
Prof. Joan Ogden Prof. Daniel Sperling
Prof. Patricia Mokhtarian
December 2004

ii
ACKNOWLEDGEMENTS
I am in the debt of my colleagues and friends who volunteered to participate in this study: Matthew Caldwell, Anthony Eggert, David Grupp, Courtney Harter, Jonathan Hughes, Nils Johnson, Michael Nicholas, Nathan Parker, Brett Williams, and Christopher Yang; my mentors, whose wisdom has guided me throughout: Dr. Joan Ogden, Dr. Daniel Sperling, and Dr. Patricia Mokhtarian; and my family and friends, without whose love and support I would never have the opportunities I so much enjoy. My heartfelt thanks goes out to you all.
iii
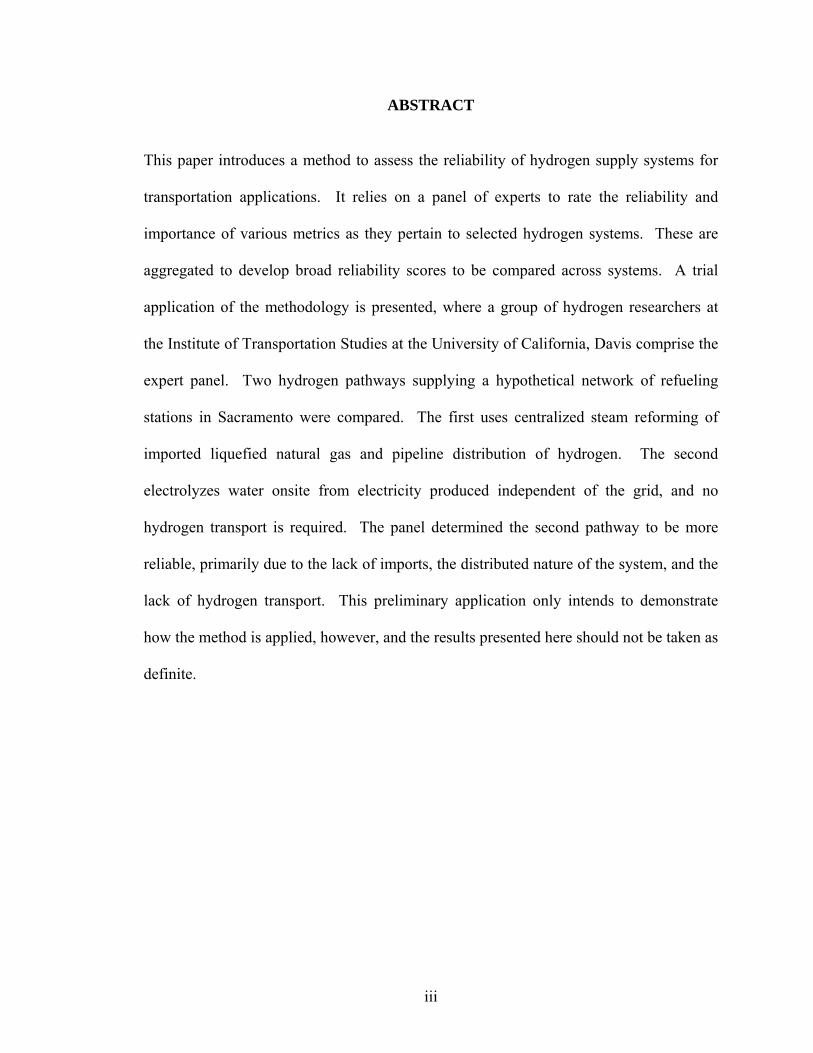
ABSTRACT
This paper introduces a method to assess the reliability of hydrogen supply systems for
transportation applications. It relies on a panel of experts to rate the reliability and
importance of various metrics as they pertain to selected hydrogen systems. These are
aggregated to develop broad reliability scores to be compared across systems. A trial
application of the methodology is presented, where a group of hydrogen researchers at
the Institute of Transportation Studies at the University of California, Davis comprise the
expert panel. Two hydrogen pathways supplying a hypothetical network of refueling
stations in Sacramento were compared. The first uses centralized steam reforming of
imported liquefied natural gas and pipeline distribution of hydrogen. The second
electrolyzes water onsite from electricity produced independent of the grid, and no
hydrogen transport is required. The panel determined the second pathway to be more
reliable, primarily due to the lack of imports, the distributed nature of the system, and the
lack of hydrogen transport. This preliminary application only intends to demonstrate
how the method is applied, however, and the results presented here should not be taken as
definite.
iv
TABLE OF CONTENTS
LIST OF TABLES........................................................................................................... vi LIST OF FIGURES........................................................................................................ vii INTRODUCTION ............................................................................................................ 1
Motivation and Background ........................................................................................ 1 BACKGROUND ............................................................................................................... 4
Statistical Approaches to Reliability Assessments ..................................................... 4 Quantitative Reliability Assessments......................................................................... 5 Qualitative Reliability Assessments ........................................................................... 6
Reliability in the Energy Sector................................................................................... 7 Electricity Sector ........................................................................................................ 9
Reliability – Adequacy ........................................................................................... 9 Applied Probabilistic Methods ......................................................................... 11
Reliability – Security ............................................................................................ 13 Security Planning.............................................................................................. 13 Governance and Oversight ............................................................................... 16 Managing Security ............................................................................................ 17
Natural Gas Sector................................................................................................... 19 Natural Gas Supply .............................................................................................. 19
Recent Trends.................................................................................................... 20 Future Projections ............................................................................................ 21 Liquefied Natural Gas (LNG) ........................................................................... 22
Infrastructure Reliability ..................................................................................... 24 Pipelines............................................................................................................ 25 LNG................................................................................................................... 27 Interdependencies ............................................................................................. 27
Summary............................................................................................................... 28 Petroleum Sector ...................................................................................................... 29
Reliability Perspectives from the Petroleum Industry ........................................ 30 The New Business Environment........................................................................ 30 Risk Management.............................................................................................. 31 Risks .................................................................................................................. 33
U.S. Petroleum Dependence and Its Economic Implications ............................ 33 Measures of Petroleum Dependence ................................................................ 34 Measures of Vulnerability to Supply Disruption .............................................. 38 Costs of Oil Dependence................................................................................... 43
Reliability of Global Supply Infrastructure ........................................................ 47 Supply Outlook.................................................................................................. 47 Geopolitics ........................................................................................................ 48 Threats .............................................................................................................. 50 Infrastructure Risks........................................................................................... 51
Summary............................................................................................................... 56 METHODOLOGY ......................................................................................................... 56
Methodology Overview............................................................................................... 56 1. Define Scope of Study and Select Participants.................................................... 57
v
2. Define Reliability in Hydrogen Energy Systems ................................................. 59 3. Select Metrics to Value Reliability in Hydrogen Energy Systems..................... 60 4. Specify Hydrogen Energy Systems to Evaluate .................................................. 61 5. Develop Evaluation Matrix ................................................................................... 63 6. Develop Rating Scales and Rating Criteria ......................................................... 65 7. Collect Expert Reliability and Importance Ratings ........................................... 67 8. Aggregate Expert Ratings to Determine Reliability Scores ............................... 68 9. Compare Reliability Scores across Pathways...................................................... 73
APPLYING THE METHODOLOGY.......................................................................... 73 1. Define Scope of Study and Select Participants.................................................... 75 2. Define Reliability in Hydrogen Energy Systems ................................................. 76 3. Select Metrics to Value Reliability in Hydrogen Energy Systems..................... 77
Adequacy .................................................................................................................. 79 Security ..................................................................................................................... 79
4. Specify Hydrogen Energy Systems to Evaluate .................................................. 82 5. Develop Evaluation Matrix ................................................................................... 83 6. Develop Rating Scales and Rating Criteria ......................................................... 85 7. Collect Expert Reliability and Importance Ratings ........................................... 87 8. Aggregate Expert Ratings to Determine Reliability Scores ............................... 91 9. Compare Reliability Scores across Pathways...................................................... 96
CONCLUSIONS ........................................................................................................... 101 Lessons Learned from Trial Application................................................................ 102 Opportunities for Future Research......................................................................... 106
BIBLIOGRAPHY......................................................................................................... 110 APPENDIX A: GEOPOLITICAL OVERVIEW OF OPEC MEMBER STATES ......................................................................................................................... 115 APPENDIX B: DESCRIPTION OF INTERNATIONAL OIL TRANSPORT CHOKEPOINTS........................................................................................................... 128 APPENDIX C: MATERIALS PROVIDED TO THE EXPERT PANEL.............. 133 APPENDIX D: AUTHOR’S RELIABILITY RATINGS......................................... 164
vi
LIST OF TABLES
Table 1. Natural gas supply projections through 2025 (adapted from: EIA, 2001b, pp.22-23)............................................................................................................ 22
Table 2. Natural gas reserves by selected country. Current LNG exporters are darkly shaded, potential LNG exporters are lightly shaded (adapted from: EIA, 2003, p.5)................................................................................................... 24
Table 3. Top five petroleum supplying nations into U.S. from 1973 to 2003 ................. 39 Table 4. Physical U.S. oil infrastructure components (adapted from: NPC, 2001,
p. 32) .................................................................................................................. 51 Table 5. Reliability and importance ratings for two hypothetical pathways ................... 71 Table 6. Reliability scores for two hypothetical hydrogen pathways using two
aggregation methods .......................................................................................... 72 Table 7. Scale used to rate the reliability of each metric as it applies to each pathway
component.......................................................................................................... 86 Table 8. Scale used to rate the importance of the metrics to reliability of the pathway
component.......................................................................................................... 87 Table 9. Sample rating criteria for the metric intermittency ............................................ 87 Table 10. Average and standard deviation of experts’ reliability ratings ........................ 94 Table 11. Average and standard deviation of experts’ aggregated reliability scores ...... 96 Table 12. Average and standard deviation of experts’ maximum possible
aggregated scores ............................................................................................. 97 Table 13. Aggregated reliability scores showing percentage of maximum score
possible ............................................................................................................ 98
vii
LIST OF FIGURES
Figure 1. Reliability networks: a) series network, b) parallel network............................. 6 Figure 2. Net U.S. imports of natural gas, 1990-2025 (EIA, 2003, from AEO 2004
reference case) .................................................................................................. 23 Figure 3. The National Petroleum Council’s assessment of physical vulnerabilities
facing natural gas infrastructure (NPC, 2001, p.34) ......................................... 25 Figure 4. Natural gas sector interdependencies (NPC, 2001, p. 29)................................ 28 Figure 5. U.S. net petroleum imports since 1970 ............................................................ 34 Figure 6. U.S. petroleum stocks and their coverage against imports and consumption .. 35 Figure 7. U.S. petroleum stocks and their coverage against imports and consumption,
minus Lower Operational Inventory Levels ..................................................... 36 Figure 8. Percentage of total energy consumption met by petroleum in the U.S. ........... 37 Figure 9. U.S. oil expenditures as a percent of GDP ....................................................... 38 Figure 10. Concentration of U.S. petroleum imports from its top five supplying
countries.......................................................................................................... 40 Figure 11. OPEC share of global crude oil production.................................................... 41 Figure 12. Persian Gulf share of global crude oil production.......................................... 42 Figure 13. World excess petroleum production capacity vs. price .................................. 43 Figure 14. U.S. expenditures on imported oil and the trade deficit, in 2003 $................ 44 Figure 15. Distribution of global crude oil reserves ........................................................ 48 Figure 16. The National Petroleum Council’s assessment of physical vulnerabilities
facing oil infrastructure (NPC, 2001, p.33) .................................................... 52 Figure 17. Structure of hydrogen reliability evaluation matrix ....................................... 63 Figure 18. Sample importance ratings: a) different importance ratings for each
pathway component, b) same importance ratings for each pathway component....................................................................................................... 65
Figure 19. Comparison of reliability scores for two hypothetical hydrogen pathways using the two aggregation methods................................................................. 72
Figure 20. Hydrogen reliability metrics considered in this study.................................... 78 Figure 21. Evaluation Matrix for Pathway #1 and Pathway #2 used in this study .......... 84 Figure 22. Sample question excerpted from survey, ascertaining expert opinions on
the importance of two metrics to the subcategory capacity............................ 90 Figure 23. Sample question excerpted from survey, ascertaining expert opinions on
the reliability of three metrics corresponding to the subcategory flexibility in Pathway #1.................................................................................................. 91
Figure 24. Aggregation steps used to determine aggregated adequacy scores ................ 93 Figure 25. Comparison of adequacy and security scores for Pathways #1 and #2
(unscaled)........................................................................................................ 99 Figure 26. Comparison of adequacy and security scores for Pathways #1 and #2
(scaled according to maximum possible reliability scores) .......................... 100 Figure 27. Chokepoints for international petroleum transport (International Institute
for Strategic Studies, 2001)........................................................................... 129
1
INTRODUCTION
A transition to hydrogen as a primary transportation fuel offers potential societal benefits
over the current paradigm. Some advocates claim that hydrogen would provide a more
reliable energy system. But reliability benefits associated with a switch to hydrogen have
not been studied. This research introduces a method to assess the reliability of hydrogen
supply systems for transportation applications. The discussion here is limited to
comparing reliability between hydrogen supply systems (“hydrogen pathways”), but the
methodology itself is not so constrained. It could be applied to compare the reliability of
other energy systems to hydrogen as well.
Motivation and Background
Existing energy infrastructures tend toward massive, highly integrated systems which can
catastrophically fail with any link. The electric grid delivers energy from large, isolated
power plants via a limited number of high-voltage transmission lines connected at a few
critical nodes. Massive blackouts, such as the one that hit the East Coast on August 14,
2003, exemplify the fragility of the electric grid. During the outage, 61,800 MW of
power serving 50 million people were lost, resulting in costs estimated between $4 billion
and $10 billion (ELCON, 2004).
Petroleum systems are similarly centralized, with pipelines reliant on a few pumping
stations delivering products from remote, aging refineries. The consequences of the
centralized delivery system were felt nationwide when gasoline prices soared to record
highs in the spring of 2004. Compounding reliability concerns is the concentration of
2
petroleum resources in the tumultuous Middle East, and several “chokepoints” along
delivery routes from the region.
As energy systems apparently grow more vulnerable, the prevailing business climate is
such that reliable energy supply is valued more than ever. A new business environment
characterized by automated operations, just-in-time logistics, and rapid changes has
emerged with the coming of information technologies. Business today is utterly
dependent on the numerous systems that support it, and cannot function without their
reliable operation. Consequences stemming from infrastructure disruptions have grown
more severe, and often no feasible manual backup processes exist (NPC, 2001).
Energy reliability has gained increased focus in political and social realms as well. Issues
dominating the news and political debate include volatile gasoline prices and
developments in the Middle East. The tragic events of September 11, 2001 prompted the
creation of a new Cabinet position, overseeing the Department of Homeland Security.
One of the Department’s five major directives is the protection of “critical
infrastructure,” including energy systems (NPC, 2001, p.1). Since the attacks, the U.S.
has gone to war and has seen anti-American sentiment rise. More attacks have been
threatened, and energy systems are perceived as high-value targets. The result is
increased public awareness and demand for reliable energy systems.
Many suggest that a switch to hydrogen as an energy carrier can relieve the
environmental and reliability problems posed by current energy systems. Since hydrogen
3
can be produced from any number of resources – including renewable electricity – and
utilized essentially pollution-free in a fuel cell, it certainly presents the potential to serve
as an environmentally sustainable fuel. But, hydrogen can also be produced and used in
ways that would significantly increase emissions over their current levels. Several
studies have considered hydrogen supply scenarios from the environmental slant, and
confirmed these findings (e.g., NRC [2004], Weiss et al. [2000], GM et al. [2002]). But
none have investigated in detail claims that hydrogen affords a more reliable system. A
systematic assessment of hydrogen reliability is needed to assess these claims and to
properly account for reliability in the potential development of a widespread hydrogen
infrastructure.
This study introduces a methodology to assess the reliability of hydrogen energy systems.
First, reliability is defined for hydrogen energy systems and metrics are selected to value
it. Next, hydrogen pathways are selected and described. Three constituent components
of the pathways are assessed by a panel of experts – the primary energy supply system,
the hydrogen production process, and the hydrogen transport process. They rate the
reliability and importance of each pathway component in terms of the metrics. Finally,
their ratings are aggregated to determine broad reliability scores that can be compared
across pathways.
The intent of this work is to provide a tool to guide decision makers to properly consider
and design reliability into hydrogen systems for the public good. Selecting and
promoting an individual pathway as the most reliable is not the goal. Indeed, results from
4
an application of the methodology to two unrelated pathways are given, but they should
not be considered definitive. The motivation of this preliminary application was to test
the methodology and demonstrate its use, not to reach definite conclusions about the most
reliable hydrogen pathways. Nevertheless, the results are interesting, and indeed telling
of hydrogen reliability.
To the best knowledge of this author, the work here represents the first effort to examine
hydrogen reliability in depth. It is that – a first attempt – and will undoubtedly benefit
from future revision and the insights of others. But the hope is that the methodology will
promote the fair consideration of reliability between hydrogen pathways, and potentially
between energy sectors. We are in the unique position of creating an entirely new energy
system where energy security, environmental awareness, safety, and infrastructure
reliability can be ingrained in the system from the onset. At a time when these concepts
have never been more highly valued in society, this opportunity should not be
overlooked.
BACKGROUND
Statistical Approaches to Reliability Assessments
Reliability assessments are well developed for systems applications in the field of
statistics. They generally define reliability in terms of the likelihood of a failure, and
determine the reliability of a system based on the known reliabilities of its elements.
Reliability assessments are usually quantitative, and results take the form of a probability,
but when data is lacking they can take on a qualitative form.
5
Quantitative Reliability Assessments
Traditional reliability assessments use probabilistic techniques to establish the likelihood
that a system will be found in some state of non-operation within a given time period. In
that context, reliability is defined as “the probability that an item (component, equipment,
or system) will operate without failure for a stated period of time under specified
conditions” (Andrews and Moss, 2002, p. 3). Reliability is measured as a probability –
that is, a value between 0 and 1 – over a given time period. So output from a
probabilistic reliability assessment might read: “the 5000-hour reliability of item x is
0.95,” meaning that item x has a 95% chance of operating without failure over the course
of 5000 hours.
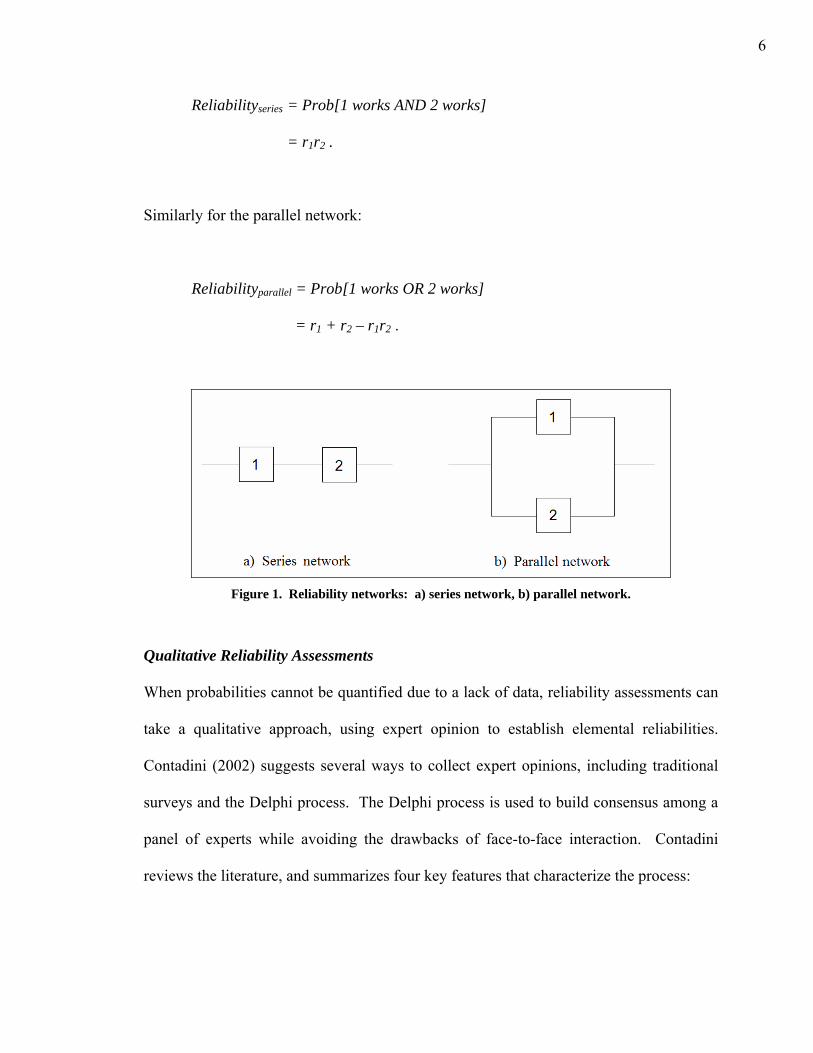
From this definition, the reliability of a simple system can be determined quantitatively.1
Reliability networks represent the dependencies between components in a system. The
simplest networks are series networks and parallel networks. A series network is a
system that cannot tolerate component failure. There is no redundancy in the system, and
if one component fails, the entire system fails. A parallel network includes redundancy,
and all parallel components must fail for the system to fail (Andrews and Moss, 2002,
pp.167-169). The two configurations are depicted in Figure 1. If the reliability of the
two components is known, reliability of the system can be determined. Let r1 be the
reliability of component 1 (i.e., probability that component 1 works over a given time
frame), and r2 be the reliability of component 2 over the same period. Then reliability
can be determined quantitatively for the series network as follows:
1 Leemis (1995) describes five ways to calculate reliability quantitatively, but that discussion is beyond the scope here.
6
Reliabilityseries = Prob[1 works AND 2 works]
= r1r2 .
Similarly for the parallel network:
Reliabilityparallel = Prob[1 works OR 2 works]
= r1 + r2 – r1r2 .
Figure 1. Reliability networks: a) series network, b) parallel network.
Qualitative Reliability Assessments
When probabilities cannot be quantified due to a lack of data, reliability assessments can
take a qualitative approach, using expert opinion to establish elemental reliabilities.
Contadini (2002) suggests several ways to collect expert opinions, including traditional
surveys and the Delphi process. The Delphi process is used to build consensus among a
panel of experts while avoiding the drawbacks of face-to-face interaction. Contadini
reviews the literature, and summarizes four key features that characterize the process:
7
• Anonymity – allows more diverse responses
• Controlled feedback – multiple rounds of surveying are conducted, to build the
experts’ knowledge of the material and the process
• Interaction – meant to promote open discussion and aid in building consensus
• Statistical aggregation – group member responses are weighted, combined, and
analyzed
When relying on expert opinion, proper selection of the expert panel is crucial. Ideally,
the panel should include members from all slants on a particular topic. But in some
cases, a more accurate analysis may result if representatives of some schools are actually
excluded, if they are thought to be biased (Bedford and Cooke, 2001, p.192). The results
of any qualitative study will be sensitive to the selection of the panel, and the level of
expertise possessed by panel members. One method to minimize error is to include a
weighting factor to account for the confidence an expert has in his or her responses. A
more rigorous method is performance based weighting (Cooke, 1991). Experts are asked
a series of questions whose responses are known to the analyst, but not the expert. Based
on their responses to these questions, a weighting factor is computed to calibrate their
responses to the survey questions.
Reliability in the Energy Sector
In Brittle Power, Amory and Hunter Lovins describe the “brittleness” of existing energy
systems, and explain how to best design energy systems to be resilient against failures.
According to the Lovins, energy systems in the U.S. are made up of complex components
8
that are prone to failure, difficult to diagnose and fix, and interact with interdependent
components in complicated ways. They also tend to be inflexible, and are unable to
easily adapt to changes in demand or primary energy supply. These characteristics make
energy systems incredibly vulnerable to potentially catastrophic failures. The Lovins
argue that failures are inevitable, but resilient energy systems can minimize the damage
by rapidly isolating and repairing disruptions. They claim that resilience can best be
achieved in an energy system with numerous small modules which each have a low
individual cost of failure.
The National Research Council (NRC) published a report following September 11th that
includes many of the same concepts as Brittle Power (NRC, 2002). The report
recognizes vulnerabilities in energy systems and describes ways in which science and
engineering can work to protect against malicious attacks. It recommends actions that
can be undertaken to reduce vulnerability in energy systems, and identifies further
research areas to reduce risks. A key recommendation throughout is to increase
cooperation with the national security and defense communities, who have dealt with
such threats for many years.
These references apply broadly throughout the energy sector, but most of the literature
reviewed focused on specific sectors. Below, background and literature reviews specific
to the electricity, natural gas, and petroleum sectors are provided. Each considers the
existing state of the sector and looks at how reliability is defined, valued, and assessed.
9
Electricity Sector
Reliability in the electricity sector is defined in terms of two components – adequacy and
security. Adequacy considers average supply and demand over the long term, while
security is concerned with dynamic operating conditions in the immediate term. The
North American Electricity Reliability Council (NERC) defines the terms as follows:
Reliability – The degree to which the performance of the elements of the system results in power being delivered to consumers within accepted standards and in the amount desired (as cited in: Kirby and Hirst, 2002, p.9).
Adequacy – The ability of the electric system to supply the aggregate electrical demand and energy requirements of customers at all times, taking into account scheduled and reasonably expected unscheduled outages and system elements (NERC, 2002, p.7). Security – The ability of the electric system to withstand sudden disturbances such as electric short circuits or unanticipated loss of system elements (NERC, 2002, p.7).
Reliability – Adequacy
The NERC produces annual assessments of the adequacy of the North American
electricity system (NERC, 2002). They reduce the electricity system into its resource,
transmission, and fuel supply components, and determine adequacy by comparing the
projected capacity of each component to projected average demands over ten years.
Resource (i.e., generation) adequacy considers the ability of projected electricity
generation facilities to supply future demand. Growth of peak demand is projected over
the time frame of the study, primarily based on the expected future economic growth of
10
the region.2 Generation supply additions are also predicted over the time period. From
these projections, the capacity margin (the percentage by which resource capacity
exceeds peak demand) is predicted. If capacity margins are within acceptable levels,
resources are deemed adequate.
Transmission adequacy considers the ability of the transmission system to handle new
load patterns resulting from increased electricity transfers and demand. Similar to
resource adequacy, demand levels are projected over the time frame of the study and
compared to projected capacity expansions.3 Another gauge of transmission adequacy is
the number and severity of transmission line relief (TLR) procedures. They are classified
according to severity, on a scale of 0 to 6 (6 being the most severe), and indicate a degree
of instability in the electric grid. Although the procedures are used to maintain security
in the system, studying their trends can shed light on its adequacy as well.
Fuel supply adequacy depends on several factors for each resource. The availability of
fuel resources can be projected in a similar fashion as generation and transmission were
above, but it also depends on characteristics far more uncertain. For example, the
availability of fossil resources is influenced by geopolitics, environmental regulations,
extraction technologies, and weather. The availability of renewable resources similarly
depends on future policy measures, conversion technologies, and weather patterns. End
2 These forecasts are probabilistic in nature, and planners usually use a 50% projection, which indicates that there is a 50% chance that demand will exceed the projection, and a 50% chance that demand will fall below the projection. 3 New capacity includes line construction, voltage upgrades to existing lines, utilization of empty tower positions, additional capacitor banks or transformers, and upgrading limiting circuitry at substations.
11
use technologies and consumer behavior affect all fuel resources, and are impossible to
predict.
Applied Probabilistic Methods
The percentage reserve method and others described above can be extended to include
the probability of future service interruptions. Probabilistic methods allow the stochastic
nature of system behavior, customer demands and component failures to be included in
analyses. Understanding the likelihood of service interruptions also allows a balance to
be reached between economics and reliability, according to a cost/benefit framework.
Probabilistic assessments consider adequacy of the electricity system on three
“hierarchical levels.” Debnath and Goel (1995) describe the assessments and outline
reliability indices at each level. Hierarchical Level I (HLI) evaluates the adequacy of
generation facilities, ignoring that of the transmission and distribution systems.4 Multiple
indices can be used to evaluate reliability at HLI. Loss of Load Expectation (LOLE)
captures the average number of days in which the daily peak load is expected to exceed
available generating capacity. It is determined from the daily peak loads and the
probability that a generating unit will be found in some state of incapacity. A benchmark
adequacy index used by many utilities is LOLE = 0.1 days/year. LOLE is the most
common index, but it does not translate to customer losses and cannot be used in a
cost/benefit analysis. Loss of Energy Expectation (LOEE), and Frequency and Duration
(F&D) extend LOLE and can be used in a cost/benefit framework, but are less common.
4 Akin to resource adequacy as defined by the NERC (2002).
12
LOEE, defined as the ratio of energy supplied to energy demanded, includes the severity
of an interruption. F&D identifies the expected frequency and duration of deficiencies.
Hierarchical Level II (HLII) considers the ability of generation and transmission together
to supply electricity at bulk supply points (Billinton, 1969). HLII assessments are usually
performed using analytical techniques or Monte Carlo simulation. Reliability indices can
be considered either at load points or on the system level. Load point indices are used to
identify weak points in the system, and include the probability, frequency and duration of
outages, unsupplied energy, and curtailed loads. System indices are used to describe the
adequacy of the complete system, without regard to specific load points. Some system
indices are system unsupplied energy, bulk power supply disturbances
(occurrences/year), bulk power interruption index (MW/MW yr), and system-minutes
(annual unavailability if all interruptions occurred at peak loads).
Hierarchical Level III (HLIII) considers the adequacy of electricity generation,
transmission, and distribution facilities altogether. This presents an enormous task, and is
rarely conducted. As in HLII, indices are determined at load points and on the system
level. Load point indices include: expected rate of failure, the average duration of
failure, and the average annual outage time. System performance indices are: system
average interruption frequency index, customer average interruption frequency index,
system average interruption duration index, customer average interruption duration index,
energy not supplied index, average service availability index, and average service
unavailability index (Billinton and Allan, 1984).
13
Reliability – Security
Security assessments look at the ability of the system to prevent disruptions of service to
end users in real time. Important to assessing security is defining normal (i.e., non-
disrupted) operating conditions. Normal operation of the electricity grid can be described
as the condition when frequency and voltage are within acceptable bounds, no component
is overloaded, and no load is involuntarily disconnected (Alvarado and Oren, 2002, p. 3).
Conditions that deviate from these suggest a security failure.
Providing security in the electricity sector is complicated by the passive nature of the
transmission network and the need to continuously balance generation and load in real
time (Kirby and Hirst, 2002). These force readiness for the next contingency, rather than
current operating conditions, to dominate the design and operation of the grid. They also
require instantaneous actions, which imposes a dependency on automatic computing,
communication, and control actions.
Security Planning
Securing the bulk electric supply system requires preparing for contingencies. A single
contingency is almost always planned for, regardless of cost. To protect against a single
contingency, the “N-1 criterion” must be satisfied. It requires systems to have sufficient
reserve capacity to withstand the loss of any (i.e., the largest) generator or transmission
line in the system. Maintaining N-1 security requires having sufficient spinning reserves
to meet demand following the loss of generation, and sufficient supplemental reserves to
14
then restore spinning reserve margins. 5 These reserves must be located so that power
may be delivered under any possible outage condition. Systems may design for N-2 or
N-3 security (i.e., multiple contingencies), but only when it is determined cost effective
to do so (Alvarado and Oren, 2002, pp.6-7).
Increasingly, security planning is also taking on the role of protecting the system against
deliberate attacks. Leading this effort are federal agencies with the intent of establishing
guidelines for industry participants to follow. The Office of Energy Assurance within the
U.S. Department of Energy (U.S. DOE) has spearheaded this effort with the development
of the Vulnerability and Risk Analysis Program. This program aims to develop and
validate vulnerability assessment methodologies in response to increased concern about
the security of the nation’s critical infrastructure. Upon its completion, the Program will
outline assessment methodologies for the electric, natural gas, and petroleum sectors.
Methods for the electricity sector exist, but are still under development for the natural gas
and petroleum sectors.
The Program uses a three-phase approach to assess the vulnerability of industry assets in
the electricity sector (U.S. DOE, 2002). First is the pre-assessment, where the scope and
objective of the assessment are defined. It involves the collaboration of individuals from
all sectors of the company to define the concept of criticality, rank assets according the
criticality definition, and determine the consequence of disruption or loss of each asset.
Next is the assessment, which addresses ten items: 5 “Spinning reserves are generators that can instantaneously increase their output when a decrease in frequency signals that load is exceeding generation” (Alvarado and Oren, 2002, p.7).
15
1. Network architecture. Evaluate existing security plans and identify concerns
with the system architecture or operating procedures.
2. Threat environment. Characterize threats, trends in threats, and mechanisms
by which threats can exploit vulnerabilities.
3. Penetration testing. Identify vulnerabilities in information systems, and test
to determine whether access can be gained.
4. Physical security. Evaluate existing or planned physical security systems.
5. Physical asset analysis. Examine physical assets for vulnerabilities.
6. Operations security. Identify and protect information pertaining to sensitive
activities.
7. Policies and procedures. Review policies and procedures, and identify areas
for improvement.
8. Impact analysis. Determine the consequences of exploitation of critical
facilities or information systems on markets and/or physical operations.
9. Infrastructure interdependencies. Examine the interdependencies and
vulnerabilities of infrastructures supporting critical facility functions.
10. Risk characterization. Provide a framework to prioritize investment and
implementation recommendations.
The final phase is the post-assessment, where recommendations from the assessment are
prioritized based on an evaluation of the costs and benefits of each, and an action plan is
developed. Lessons learned and best practices are captured here, as well.
16
Similarly, the NERC has proposed a four-tiered model to guard against physical and
cyber threats (NERC, 2001). The four tiers are avoidance, assurance, detection, and
recovery. Avoidance is the most cost effective means of action. It aims to prevent the
exploitation of threats by promoting awareness and sharing information and data through
an Electricity Sector Information Sharing and Analysis Center (ES-ISAC). Assurance
promotes reliability through the regular evaluation of physical and cyber security
measures. Detection focuses on monitoring, identifying, reporting, and analyzing
operational, physical, and cyber threats or incidents. Recovery encourages timely
investigation of incidents and rapid recovery and restoration of services.
Governance and Oversight
Governance and oversight are fundamental to the notion of security in a deregulated
electricity market, where reliability decisions have shifted from vertically-integrated
utilities to a system operator. In the past, large utilities controlled generation,
transmission, and distribution operations, and could make reliability-based decisions
relatively easily. But in the deregulated environment, assets are distributed among
several more industry players, and reliability is now under the control of an independent
system operator (ISO). Kirby and Hirst (2002, p.10) offer six questions to guide
reliability decisions in a deregulated environment:
• What risks to take?
• When to take those risks?
• How much money to spend on risk mitigation?
17
• Who pays for reliability?
• Who is exposed to any remaining risks?
• Who decides on these matters?
Managing Security
Managing security in the electricity system is mainly a real-time effort by operators to
manage transience in the system. Transmission operators have two basic ways to ensure
reliability – by deploying reserves (Kirby and Hirst, 2002), or controlling commerce
(Alvarado and Oren, 2002). Security in the electricity sector is currently managed
primarily through the deployment of reserves. Reserves insure against the sudden loss of
a generator or transmission line, and include additional generation and transmission, or
load that is willing to curtail. Most regional reliability councils set contingency reserve
requirements equal to the largest single contingency within the region (N-1 criterion), and
require at least half to be spinning (Kirby and Hirst, 2002).
Transmission operators can also ensure reliability through the control of commerce, by
redistributing generation away from the typical pattern of the free market. Generators
can indicate a price at which they are willing to increase or decrease production, creating
a market for contingency reserves. This is attractive in a deregulated environment, and
might push reliability to be increasingly managed through the control of commerce.
18
Summary
Reliability in the electricity sector encompasses two concepts – adequacy and security.
Adequacy refers to the sufficiency of system throughput to supply long-term, average
demands. Security refers to the ability of the system to withstand disruption under
dynamic conditions. Factors influencing the adequacy of the system are primary energy
resource availability, and generation and transmission capacities. Sufficiency of capacity
can be measured deterministically in terms of reserve margins, or probabilistically in
terms of expected outages.
Although security predominately involves real-time management of system operations, it
has recently taken on a long-term planning approach as well, to secure assets against
vulnerabilities. Vulnerability assessments and mitigation plans can identify threats and
vulnerable assets early, and prevent future disruptions. Another concept important to
security in the electricity sector is that of governance and oversight. Increased
competition from industry deregulation has reduced the incentive for independent
reliability assurance measures in the industry. Thus, the role of an independent authority
to assure reliability has grown significantly. This body must be independent and fair in
its directives. Two mechanisms exist to manage security in the electric grid. Most
common is the deployment of reserves. Mandatory reserve margins are set so that the
loss of any generation or transmission facility (or sometimes set of facilities) will not
cause a disruption of service. The other mechanism is to ensure reliability through
market-based principles. One example would be the creation of a reserve market, where
reserves could be brought online or taken off, according to real-time demands.
19
Natural Gas Sector
Unlike in the literature pertaining to the electricity sector, no recurring definition of
reliability was found in the natural gas sector. Perhaps the most concise definition was
found in the Infrastructure Reliability Program of the DOE. It suggests that reliability
efforts in the natural gas sector focus on securing the physical infrastructure, and are less
concerned with the concept of adequacy (U.S. DOE and NETL, 2002, pp.3-4):
Ensure Reliability – Allowing operators to prevent damage or disruption, to detect and diagnose leaks and failures more quickly, and to enhance the flexibility and responsiveness of the system in response to losses in capacity
Another important factor weighing on reliability in the natural gas sector is cost. Price
fluctuations strongly influence natural gas reliability considerations. Indeed, the Energy
Information Administration (EIA) has said that a key challenge facing the natural gas
industry over time is “moderating the recurrence and severity of ‘boom and bust’ cycles
while meeting increasing demand at reasonable prices” (EIA, 2001a, p.20).
Natural Gas Supply
Recent trends in the natural gas industry have seen significant demand increases and
price volatility, resulting in projections of future shortages. Exacerbating bleak
projections is a cyclic behavior commonly visible with commodities, and beginning to
manifest itself with natural gas. The trend sees a cycle of surpluses and shortages, and
low and high prices. These considerations have prompted calls for reviving and
20
expanding the liquefied natural gas (LNG) infrastructure in the U.S., which has been
essentially dead since the early 1980s.
Recent Trends
The recent price spikes can be partially attributed to the increase in the construction of
natural-gas-fired power plants and cogeneration that has significantly increased natural
gas demand. The expansion was initially obscured by abnormally warm winters in 1997-
1998 and 1998-1999, but in the two very cold winters that followed, demand
skyrocketed. Prices spiked in the winter of 1999-2000, and remained high through the
beginning of April 2000, the beginning of storage refill season. High prices encouraged
operators to delay injecting gas into storage, and by November, storage was at a 20-year
low. When the cold winter hit, demand soared and prices spiked. On the coldest days in
December of 2000, utilization reached 90–100% in some areas, and prices exceeded $10
per million Btu at the Henry Hub (compared to the average price for the entire year,
which was $2.40 per million Btu) (EIA, 2001b).
These price fluctuations might indicate that natural gas is entering a trend of cyclic
pricing behavior. Such trends are typical in commodity markets, but until recently, have
not affected the natural gas sector. The cycles follow periods of overinvestment or
underinvestment in production, and might develop as follows. A surge in demand during
a cold spell results in a price spike due to the inelasticity of supply. Sustained high prices
encourage producers to invest in new production. Peak demands fall during subsequent
warm winters, causing a surplus of supply and prices to fall. Sustained low prices
21
discourage investments in new production. When a cold season hits, production lags
demand causing a price spike, and the process repeats (EIA, 2001b).
Future Projections
The EIA developed a model projecting natural gas supplies in the U.S. through 2025
(EIA, 2001b). The model considers six scenarios, including cases where restrictions to
natural gas exploration in the Rocky Mountains and the Outer Continental Shelf (OCS)
are eased, and where carbon dioxide (CO2) emissions are limited. The reference case for
the model uses projections from the Annual Energy Outlook 2002, and assumes no policy
changes. Table 1 shows the results for the reference case and the limited CO2 emissions
cases. All models predict an increasing reliance on imports over levels today (about 16%
in 2003), especially the limited CO2 emissions cases.6 The model also predicts higher
prices and greater price volatility in the CO2 emissions limit cases. Similar effects as
seen in the CO2 emissions limit models might be expected with a burgeoning hydrogen
economy, as both add marginal natural gas demand.7
The reference case is based on models the EIA uses in their Annual Energy Outlook to
generate future projections of energy markets. Their most recent projections, in the
Annual Energy Outlook 2004 (AEO2004), extend from 2002 to 2025 (EIA, 2004f). They
project an increase in U.S. natural gas demand from 22.8 trillion cubic feet (tcf) in 2002
to 31.4 tcf in 2025. But domestic production is only expected to grow from 19.1 tcf in
6 Although not shown here, supply and demand both increased in the Rocky Mountain and OCS access cases, but absolute imports were about the same as the reference case 7 Policies limiting CO2 emissions increase natural gas demands because some coal-fired power plants that emit large amounts of CO2 would likely be replaced with natural gas-fired electricity generation.
22
2002 to 24.1 tcf in 2025. They conclude that “growth in U.S. natural gas supplies will be
dependent on unconventional domestic production, natural gas from Alaska, and LNG”
(EIA, 2004f, p.8).
Table 1. Natural gas supply projections through 2025 (adapted from EIA, 2001b, pp.22-23).
Liquefied Natural Gas (LNG)
LNG is projected to become a larger source of natural gas supply in the U.S. as domestic
supplies are expected to lag and the availability of Canadian imports is projected to
decline (see Figure 2). Increasing LNG import levels carries interesting implications for
reliability in the natural gas sector. They could have a positive effect by leveling costs
and supplying demands that would otherwise be met with production from higher cost
sources (EIA, 2001b, p.37). With sufficient infrastructure, seasonal price spikes could be
moderated by increasing LNG imports. Similarly, during periods of low demand, LNG
imports could be curtailed to push prices up. But reliance on imported energy supplies
creates a dependence on foreign suppliers, thus detracting from reliability. Natural gas
reserves are concentrated in a few regions of the world. Ten countries control 77% of
global natural gas reserves, and the top three over 55% (see Table 2). Conceivably, as
world natural gas demand grows and countries rely more on LNG imports, a natural gas
23
cartel could form that could control global trade with monopolistic power, similar to the
Organization of Petroleum Exporting Countries (OPEC) (EIA, 2001b, p.29).
Figure 2. Net U.S. imports of natural gas, 1990-2025 (EIA, 2003, from AEO2004 reference case).
Table 2 lists global reserves by country and current (darkly shaded) and potential (lightly
shaded) exporters (EIA, 2003, p.5). It can be seen that current and potential export
capacity resides predominantly in countries with somewhat unstable political and/or
social situations. This is similar to current conditions in the petroleum sector, and
introduces geopolitical threats into the reliability of natural gas supply.8
8 Geopolitics is discussed in greater depth in the petroleum section of the literature review.
24
Table 2. Natural gas reserves by selected country. Current LNG exporters are darkly shaded, potential LNG exporters are lightly shaded (adapted from: EIA, 2003, p.5).
Infrastructure Reliability
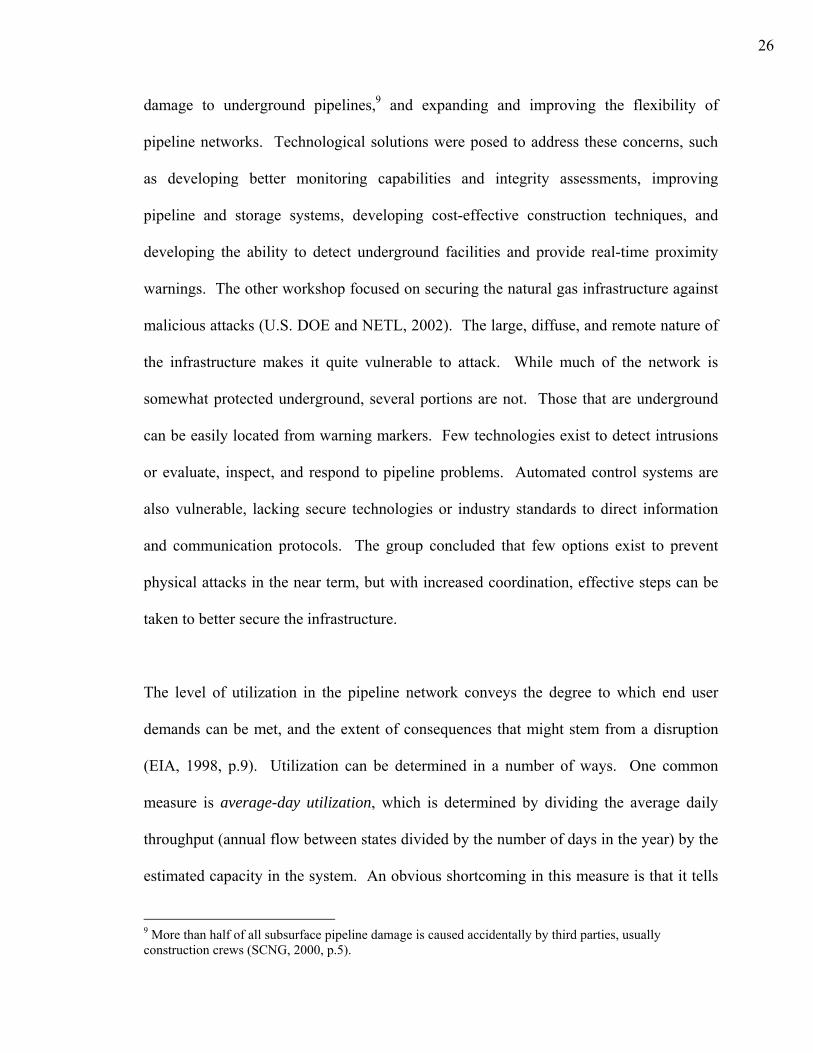
The National Petroleum Council (NPC) addresses issues of natural gas infrastructure
security in their report, Securing Oil and Natural Gas Infrastructures in the New
Economy (NPC, 2001). Part of the report investigates physical vulnerabilities facing the
natural gas infrastructure. Figure 3 outlines the natural gas infrastructure generally, and
25
presents the Council’s vulnerabilities ratings for some physical assets. The ratings are
based on the following scale (NPC, 2001, p.33):
Low – Key assets that if damaged could cause disruptions with local impacts of short duration. Medium – Key assets that if damaged could cause disruptions that would have regional impacts. These disruptions would last long enough to cause end users hardship, economic loss, and possible loss of human life. High – Key assets that if damaged could cause major disruptions that would have regional and possibly national or international impacts, and of sufficient duration to cause death and end users major hardship and economic loss.
Figure 3. The National Petroleum Council’s assessment of physical vulnerabilities facing natural gas
infrastructure (NPC, 2001, p.34).
Pipelines
The DOE and the National Energy Technology Laboratory (NETL) sponsored two
industry-based workshops focused on security concerns facing natural gas pipeline
networks. The first workshop identified security concerns and technological solutions
(SCNG, 2000). Predominant concerns included reducing the cost and incidence of
26
damage to underground pipelines,9 and expanding and improving the flexibility of
pipeline networks. Technological solutions were posed to address these concerns, such
as developing better monitoring capabilities and integrity assessments, improving
pipeline and storage systems, developing cost-effective construction techniques, and
developing the ability to detect underground facilities and provide real-time proximity
warnings. The other workshop focused on securing the natural gas infrastructure against
malicious attacks (U.S. DOE and NETL, 2002). The large, diffuse, and remote nature of
the infrastructure makes it quite vulnerable to attack. While much of the network is
somewhat protected underground, several portions are not. Those that are underground
can be easily located from warning markers. Few technologies exist to detect intrusions
or evaluate, inspect, and respond to pipeline problems. Automated control systems are
also vulnerable, lacking secure technologies or industry standards to direct information
and communication protocols. The group concluded that few options exist to prevent
physical attacks in the near term, but with increased coordination, effective steps can be
taken to better secure the infrastructure.
The level of utilization in the pipeline network conveys the degree to which end user
demands can be met, and the extent of consequences that might stem from a disruption
(EIA, 1998, p.9). Utilization can be determined in a number of ways. One common
measure is average-day utilization, which is determined by dividing the average daily
throughput (annual flow between states divided by the number of days in the year) by the
estimated capacity in the system. An obvious shortcoming in this measure is that it tells
9 More than half of all subsurface pipeline damage is caused accidentally by third parties, usually construction crews (SCNG, 2000, p.5).
27
nothing of availability during peak demand periods. The use of monthly, weekly, or
daily throughput data helps circumvent this limitation. If several measures are developed
– for example, peak-day, high month, low month, average month, and average summer
(i.e., off-peak) – one can gauge variability throughout the system.
LNG
The implications of widespread LNG infrastructure are not well known. But it is thought
that the high capital costs and fuel concentrations associated with LNG infrastructure
make it an attractive target to attack. Natural disasters, especially earthquakes, are
significant threats as well. In the case of an LNG spill, a potentially very serious
situation could ensue. If LNG pools on water and is ignited, the resulting fire would burn
uncontained until all of the gas was consumed. Experimental spills of 10,000 gallons
resulted in cylindrical fires 50 feet wide and 250 feet high. This is quite intimidating
considering that an LNG tanker may carry up to 33 million gallons (Havens, 2003).
Interdependencies
The natural gas sector is interdependent with several other infrastructures, and vulnerable
to disruptions in them. Five types of failure can occur between interdependent systems
(NPC, 2001, p.30):
• Cascading failures – failure in one infrastructure leads to failure in another
• Escalating failures – duration of outage in one infrastructure increases due to a
failure in another
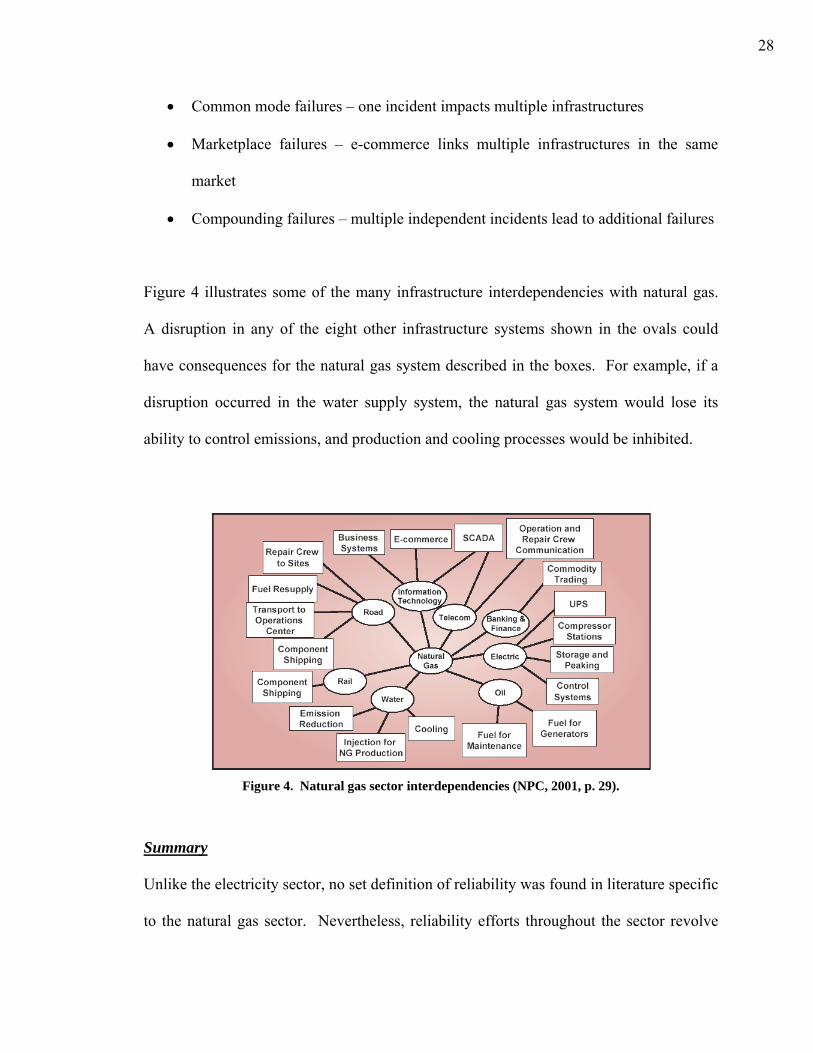
28
• Common mode failures – one incident impacts multiple infrastructures
• Marketplace failures – e-commerce links multiple infrastructures in the same
market
• Compounding failures – multiple independent incidents lead to additional failures
Figure 4 illustrates some of the many infrastructure interdependencies with natural gas.
A disruption in any of the eight other infrastructure systems shown in the ovals could
have consequences for the natural gas system described in the boxes. For example, if a
disruption occurred in the water supply system, the natural gas system would lose its
ability to control emissions, and production and cooling processes would be inhibited.
Figure 4. Natural gas sector interdependencies (NPC, 2001, p. 29).
Summary
Unlike the electricity sector, no set definition of reliability was found in literature specific
to the natural gas sector. Nevertheless, reliability efforts throughout the sector revolve
29
around common concerns: securing sufficient supplies, securing the infrastructure
(especially pipelines), and moderating prices. The U.S. and much of the developed world
will likely grow increasingly dependent on imported LNG in the mid-term. This prospect
exposes natural gas supplies to threats and vulnerabilities on the global scale,10 but may
also enhance reliability by mitigating prices. Another major concern for reliability in the
natural gas sector is securing widespread pipeline networks from accidental and
malicious attacks. Such a task is daunting, and its success may require technological
solutions which do not yet exist.
Petroleum Sector
Reliability concerns in the petroleum sector center around broad issues such as national
and international security and economic prosperity. The differences from the other
sectors reviewed stem from the global nature of petroleum supply. Petroleum importers
depend on global suppliers to feed their demand and maintain their economy. An
interruption in production from any major suppler has consequences that can ripple
through the global market, and have damaging effects on national and global economies.
Growing dependence in developed nations on petroleum links national security with
petroleum supply security. Dwindling petroleum reserves and lagging extraction rates in
those same countries exacerbate the problems, and lead to conflicts which can threaten
international security.
10 A more detailed discussion involving reliability concerns associated with global trade follows in the section covering the petroleum sector.
30
In recent years, risks facing the sector have changed substantially. The transformation is
due in large part to changing business practices, brought by increasing globalization and
the influx of information technology. Traditionally, reliability efforts focused on
protecting assets from human error and natural disasters. But in this new business
environment, the focus has shifted to securing foreign supply sources and guarding
against cyber attacks. The post-September 11th atmosphere has invigorated efforts to
secure the physical infrastructure as well, but now with a focus on malicious attacks,
rather than accidents and natural disasters.
Reliability Perspectives from the Petroleum Industry
The NPC report Securing the Oil and Natural Gas Infrastructures in the New Economy
details the petroleum industry’s perspective on reliability in the petroleum sector. Its
recommendations intend to protect companies from financial loss, which somewhat
conflicts with our efforts to develop a hydrogen reliability assessment which places
society as a whole as the stakeholder. Nevertheless, the issues addressed carry over to
the end user and provide insight for our study.
The New Business Environment
The assimilation of information technologies and telecommunications in the petroleum
sector has dramatically altered the way the industry conducts business. The business
environment today is characterized by automation, rapid changes, new business models,
new business organizations, and globalization. These trends create new markets and
make business more efficient, but also compound reliability concerns. In the new
31
environment, reliability cannot be examined or planned for from a domestic slant alone.
Increasingly, reliability in the petroleum sector depends on that of the weakest link in the
global supply system. Interdependencies between the petroleum sector and other critical
infrastructures have grown more intricate as information technologies and
telecommunications take on dominant roles. The new environment has also expanded
potential consequences of incidents. Disruptions historically resulted in primarily local
consequences. But today the potential for regional, national or even global ones exists.
Compounding matters is the fact that increased automation and retirement of individuals
with the necessary skills makes a return to manual methods of business almost impossible
(NPC, 2001).
Risk Management
The NPC recommends that companies address risk proactively through routine risk
management. Typically, risks are measured in terms of likelihood of occurrence and
expected level of financial loss. The Council offers a six-step risk management process
to mitigate risks in the new business environment (NPC, 2001, pp.40-47):
1. Identify and characterize key assets. Key assets include facilities, information,
people, processes, programs, and services. Each is assigned a value reflecting the
consequence of losing that asset.
2. Identify and characterize vulnerabilities and threats. Identify targets and
weaknesses, and review the ability of security measures to guard against them.
32
Usually covered are cyber systems, supervisory control and data acquisition
(SCADA) systems, physical assets, security measures, and interdependencies.
Threat assessments should consider ability to access an asset, ability to harm an
asset, intent to harm an asset, history (including the past targeting of an asset), and
the effectiveness of existing security measures against the threat.
3. Perform risk assessments. Risk is the product of the probability of an incident
and the consequence of the incident, and can be determined by multiplying the
value of the asset (i.e., the consequence) as determined in Step 1, with the
likelihood of an incident (i.e., the vulnerability) as determined in Step 2. Risk can
be measured qualitatively, quantitatively, or using a mixture of both methods.
4. Identify and characterize potential risk abatement options. Risk abatement
generally focuses on deterring threats, reducing vulnerabilities, reducing
consequences, reducing severity during an incident, and ensuring rapid recovery
after the incident.
5. Select cost-effective risk abatement options. The options identified in Step 4 are
analyzed and prioritized on a cost/benefit basis.
6. Implement risk management decisions. Attractive abatement options identified in
Step 5 are implemented. Implementation involves preparing plans and
procedures, training staff, and continuing to monitor the risk environment.
33
Risks
The new business environment has transformed the risks facing the petroleum industry.
Traditionally, primary risks in the petroleum sector were incidents resulting from human
error or natural disaster, and were mitigated by hardening assets (NPC, 2001, pp.2-4).
But industry operations in the new business environment face an entirely new set of risks,
against which the industry remains unprepared. The NPC ranks seven risks facing the
industry today, in decreasing order of preparedness against them (NPC, 2001, pp.17-37):
1. Information technology and telecommunications
2. Globalization
3. Business restructuring
4. Interdependencies
5. Legal and regulatory issues
6. Physical and human factors
7. Natural disasters
U.S. Petroleum Dependence and Its Economic Implications
Dependence on foreign energy sources has imposed tremendous costs on the U.S.
economy over the past 30 years. Metrics exist to gauge the level of petroleum
dependence in an economy, and its vulnerability to a supply disruption. These measures
indicate that the U.S. is more dependent on petroleum and more vulnerable to an
interruption in its supply than ever before.
34
Measures of Petroleum Dependence
Greene and Tishchishyna define U.S. petroleum dependence as “the product of (1) a non-
competitive world oil market strongly influenced by the OPEC cartel, (2) high levels of
U.S. oil imports, (3) the importance of oil to the U.S. economy (especially the
transportation sector), and (4) the absence of economical and readily available
substitutes” (Greene, 2000, p.2). It can be measured several ways. Alhajji and Williams
(2003) gauge dependence according to four metrics, which consider imports, reserve
levels, and the percentage of total energy consumption met by petroleum.
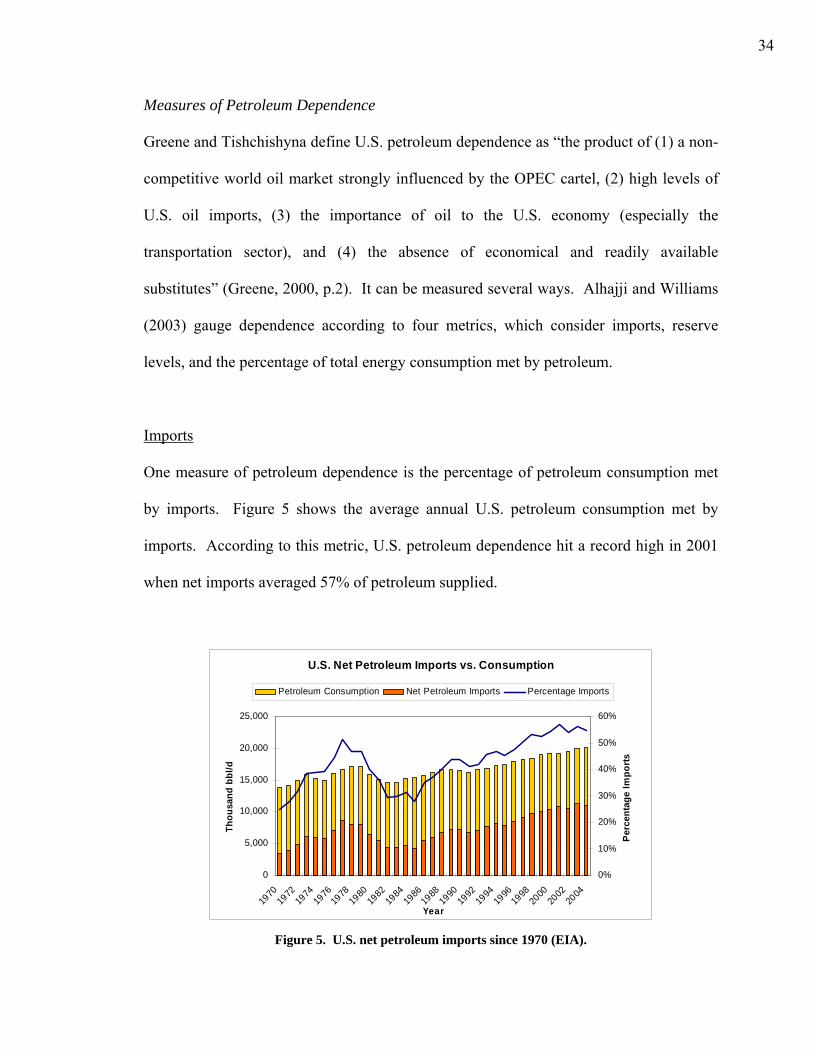
Imports
One measure of petroleum dependence is the percentage of petroleum consumption met
by imports. Figure 5 shows the average annual U.S. petroleum consumption met by
imports. According to this metric, U.S. petroleum dependence hit a record high in 2001
when net imports averaged 57% of petroleum supplied.
U.S. Net Petroleum Imports vs. Consumption
0
5,000
10,000
15,000
20,000
25,000
1970
1972
1974
1976
1978
1980
1982
1984
1986
1988
1990
1992
1994
1996
1998
2000
2002
2004
Year
Thou
sand
bbl
/d
0%
10%
20%
30%
40%
50%
60%
Perc
enta
ge Im
ports
Petroleum Consumption Net Petroleum Imports Percentage Imports
Figure 5. U.S. net petroleum imports since 1970 (EIA).
35
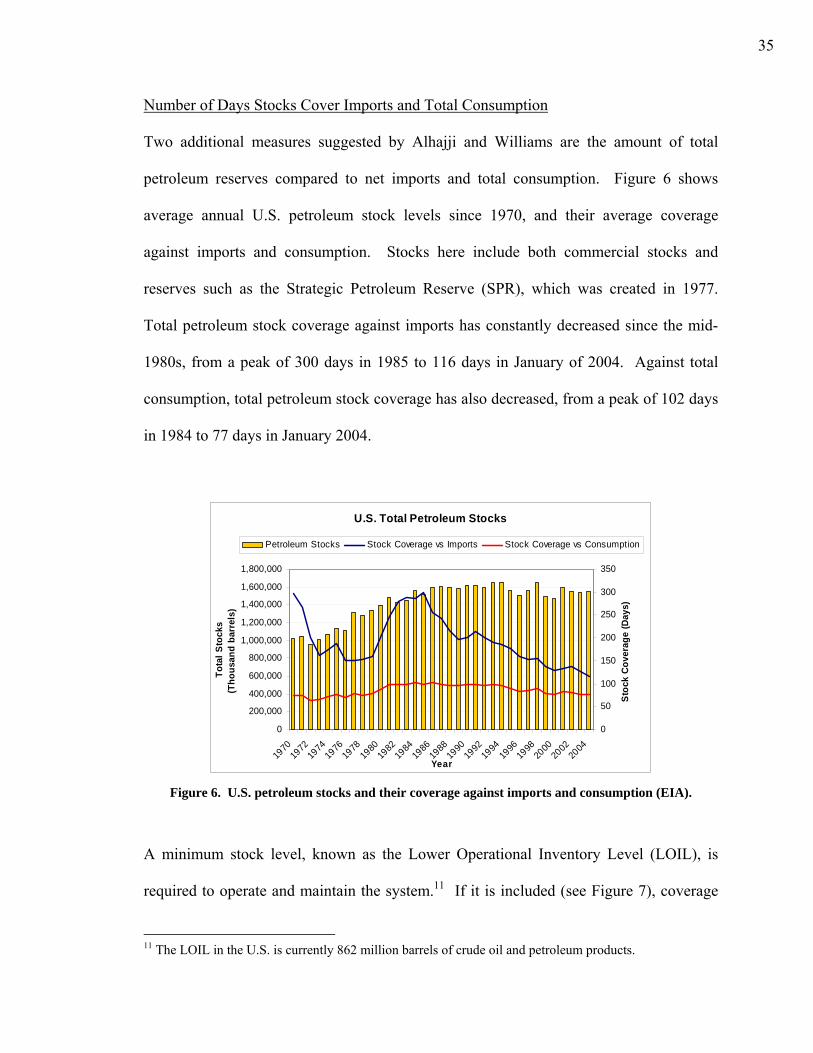
Number of Days Stocks Cover Imports and Total Consumption
Two additional measures suggested by Alhajji and Williams are the amount of total
petroleum reserves compared to net imports and total consumption. Figure 6 shows
average annual U.S. petroleum stock levels since 1970, and their average coverage
against imports and consumption. Stocks here include both commercial stocks and
reserves such as the Strategic Petroleum Reserve (SPR), which was created in 1977.
Total petroleum stock coverage against imports has constantly decreased since the mid-
1980s, from a peak of 300 days in 1985 to 116 days in January of 2004. Against total
consumption, total petroleum stock coverage has also decreased, from a peak of 102 days
in 1984 to 77 days in January 2004.
U.S. Total Petroleum Stocks
0
200,000
400,000
600,000
800,000
1,000,000
1,200,000
1,400,000
1,600,000
1,800,000
1970
1972
1974
1976
1978
1980
1982
1984
1986
1988
1990
1992
1994
1996
1998
2000
2002
2004
Year
Tota
l Sto
cks
(Tho
usan
d ba
rrel
s)
0
50
100
150
200
250
300
350
Stoc
k Co
vera
ge (D
ays)
Petroleum Stocks Stock Coverage vs Imports Stock Coverage vs Consumption
Figure 6. U.S. petroleum stocks and their coverage against imports and consumption (EIA).
A minimum stock level, known as the Lower Operational Inventory Level (LOIL), is
required to operate and maintain the system.11 If it is included (see Figure 7), coverage
11 The LOIL in the U.S. is currently 862 million barrels of crude oil and petroleum products.
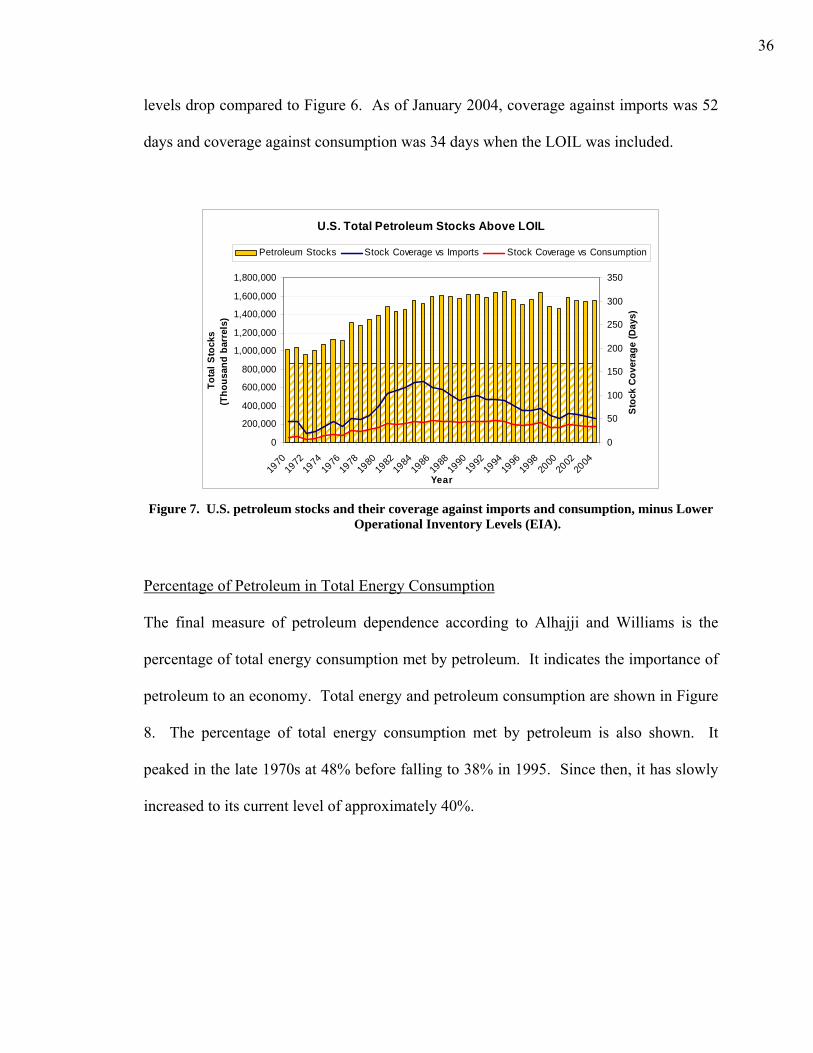
36
levels drop compared to Figure 6. As of January 2004, coverage against imports was 52
days and coverage against consumption was 34 days when the LOIL was included.
U.S. Total Petroleum Stocks Above LOIL
0
200,000
400,000
600,000
800,000
1,000,000
1,200,000
1,400,000
1,600,000
1,800,000
1970
1972
1974
1976
1978
1980
1982
1984
1986
1988
1990
1992
1994
1996
1998
2000
2002
2004
Year
Tota
l Sto
cks
(Tho
usan
d ba
rrel
s)
0
50
100
150
200
250
300
350
Stoc
k Co
vera
ge (D
ays)
Petroleum Stocks Stock Coverage vs Imports Stock Coverage vs Consumption
Figure 7. U.S. petroleum stocks and their coverage against imports and consumption, minus Lower
Operational Inventory Levels (EIA).
Percentage of Petroleum in Total Energy Consumption
The final measure of petroleum dependence according to Alhajji and Williams is the
percentage of total energy consumption met by petroleum. It indicates the importance of
petroleum to an economy. Total energy and petroleum consumption are shown in Figure
8. The percentage of total energy consumption met by petroleum is also shown. It
peaked in the late 1970s at 48% before falling to 38% in 1995. Since then, it has slowly
increased to its current level of approximately 40%.
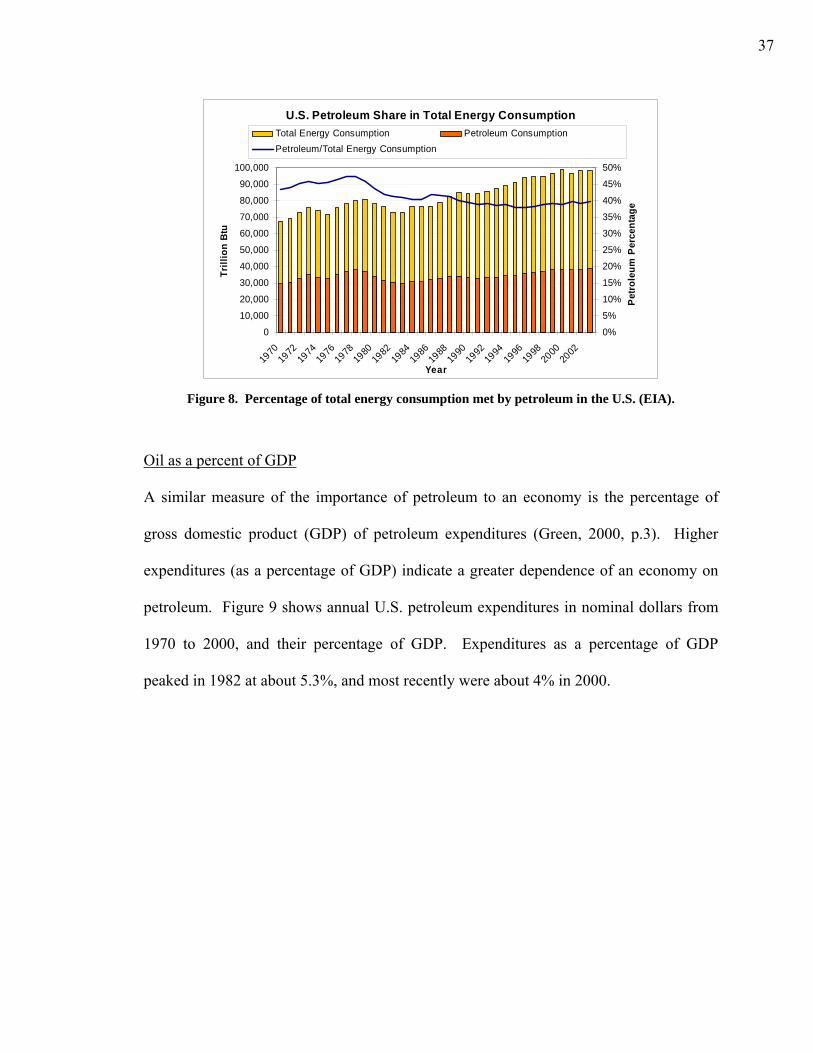
37
U.S. Petroleum Share in Total Energy Consumption
0
10,000
20,000
30,000
40,000
50,000
60,000
70,000
80,000
90,000
100,000
1970
1972
1974
1976
1978
1980
1982
1984
1986
1988
1990
1992
1994
1996
1998
2000
2002
Year
Trill
ion
Btu
0%
5%
10%
15%
20%
25%
30%
35%
40%
45%
50%
Pet
role
um P
erce
ntag
e
Total Energy Consumption Petroleum ConsumptionPetroleum/Total Energy Consumption
Figure 8. Percentage of total energy consumption met by petroleum in the U.S. (EIA).
Oil as a percent of GDP
A similar measure of the importance of petroleum to an economy is the percentage of
gross domestic product (GDP) of petroleum expenditures (Green, 2000, p.3). Higher
expenditures (as a percentage of GDP) indicate a greater dependence of an economy on
petroleum. Figure 9 shows annual U.S. petroleum expenditures in nominal dollars from
1970 to 2000, and their percentage of GDP. Expenditures as a percentage of GDP
peaked in 1982 at about 5.3%, and most recently were about 4% in 2000.
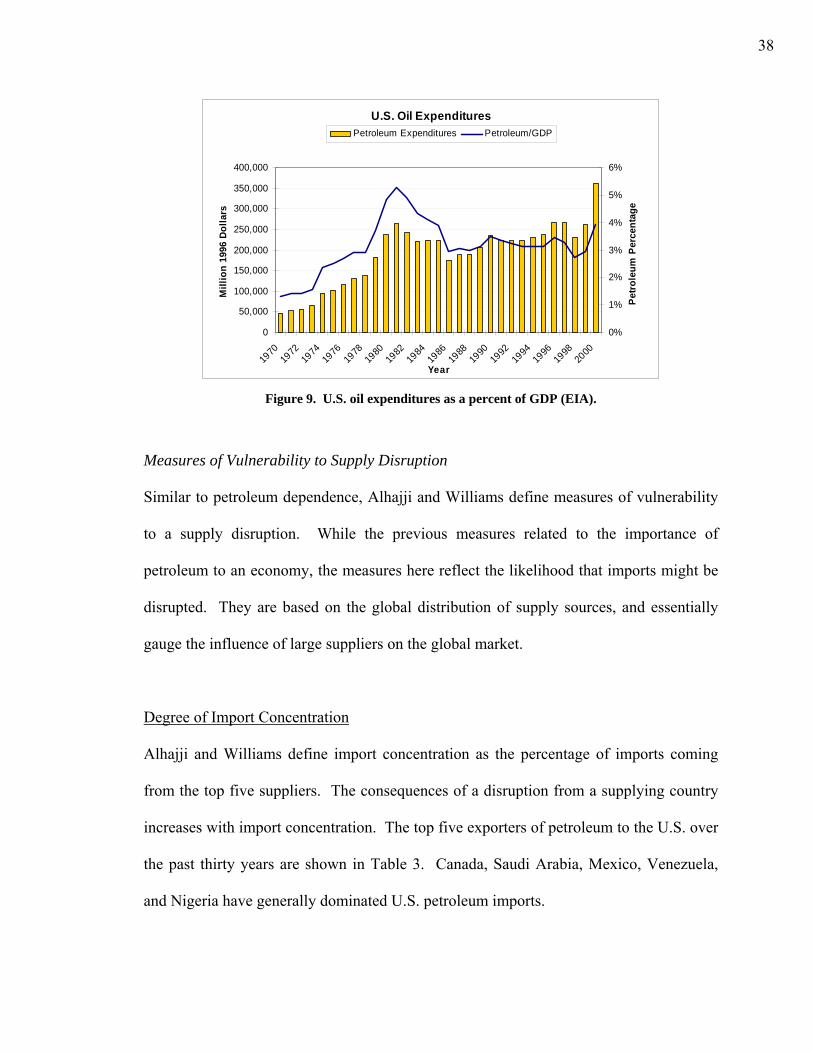
38
U.S. Oil Expenditures
0
50,000
100,000
150,000
200,000
250,000
300,000
350,000
400,000
1970
1972
1974
1976
1978
1980
1982
1984
1986
1988
1990
1992
1994
1996
1998
2000
Year
Mill
ion
1996
Dol
lars
0%
1%
2%
3%
4%
5%
6%
Petro
leum
Per
cent
age
Petroleum Expenditures Petroleum/GDP
Figure 9. U.S. oil expenditures as a percent of GDP (EIA).
Measures of Vulnerability to Supply Disruption
Similar to petroleum dependence, Alhajji and Williams define measures of vulnerability
to a supply disruption. While the previous measures related to the importance of
petroleum to an economy, the measures here reflect the likelihood that imports might be
disrupted. They are based on the global distribution of supply sources, and essentially
gauge the influence of large suppliers on the global market.
Degree of Import Concentration
Alhajji and Williams define import concentration as the percentage of imports coming
from the top five suppliers. The consequences of a disruption from a supplying country
increases with import concentration. The top five exporters of petroleum to the U.S. over
the past thirty years are shown in Table 3. Canada, Saudi Arabia, Mexico, Venezuela,
and Nigeria have generally dominated U.S. petroleum imports.
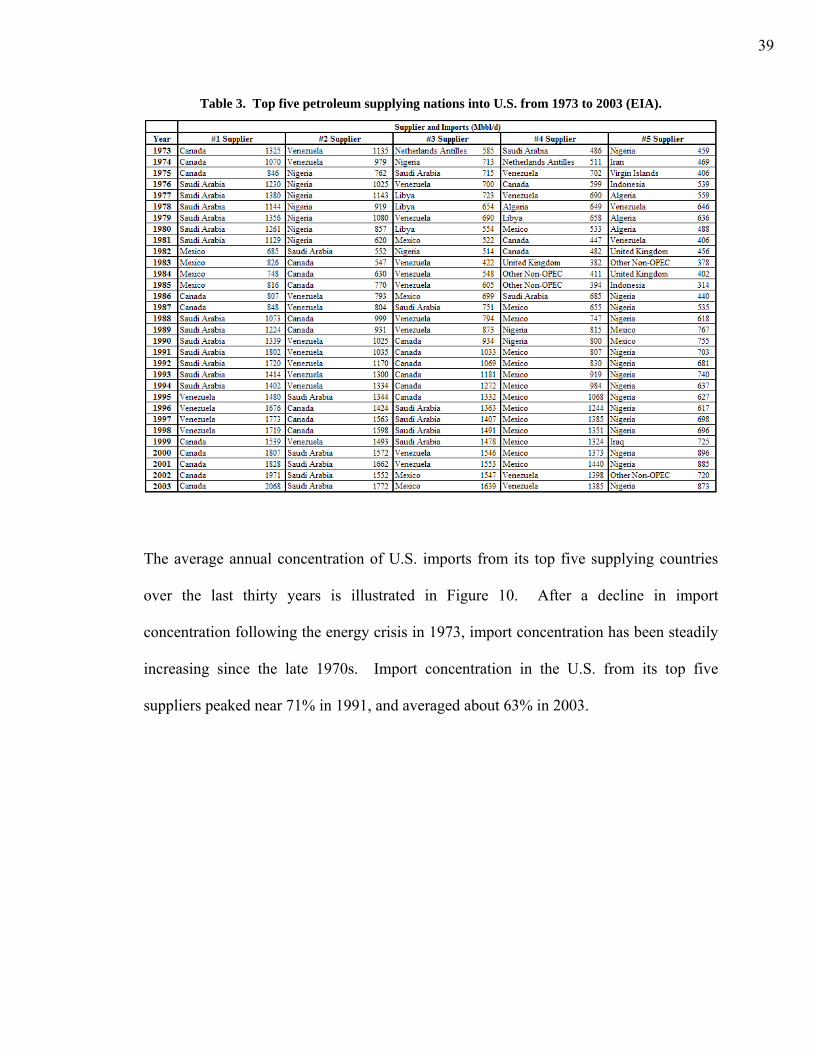
39
Table 3. Top five petroleum supplying nations into U.S. from 1973 to 2003 (EIA).
The average annual concentration of U.S. imports from its top five supplying countries
over the last thirty years is illustrated in Figure 10. After a decline in import
concentration following the energy crisis in 1973, import concentration has been steadily
increasing since the late 1970s. Import concentration in the U.S. from its top five
suppliers peaked near 71% in 1991, and averaged about 63% in 2003.
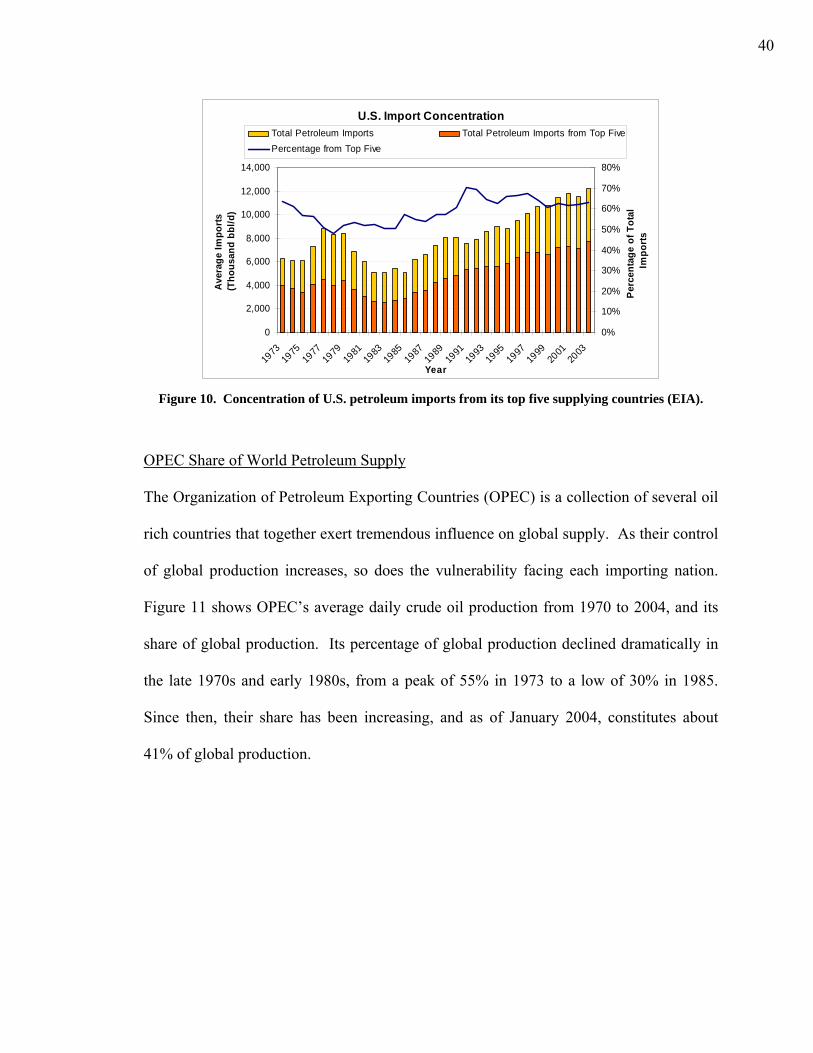
40
U.S. Import Concentration
0
2,000
4,000
6,000
8,000
10,000
12,000
14,000
1973
1975
1977
1979
1981
1983
1985
1987
1989
1991
1993
1995
1997
1999
2001
2003
Year
Ave
rage
Impo
rts
(Tho
usan
d bb
l/d)
0%
10%
20%
30%
40%
50%
60%
70%
80%
Perc
enta
ge o
f Tot
al
Impo
rts
Total Petroleum Imports Total Petroleum Imports from Top FivePercentage from Top Five
Figure 10. Concentration of U.S. petroleum imports from its top five supplying countries (EIA).
OPEC Share of World Petroleum Supply
The Organization of Petroleum Exporting Countries (OPEC) is a collection of several oil
rich countries that together exert tremendous influence on global supply. As their control
of global production increases, so does the vulnerability facing each importing nation.
Figure 11 shows OPEC’s average daily crude oil production from 1970 to 2004, and its
share of global production. Its percentage of global production declined dramatically in
the late 1970s and early 1980s, from a peak of 55% in 1973 to a low of 30% in 1985.
Since then, their share has been increasing, and as of January 2004, constitutes about
41% of global production.
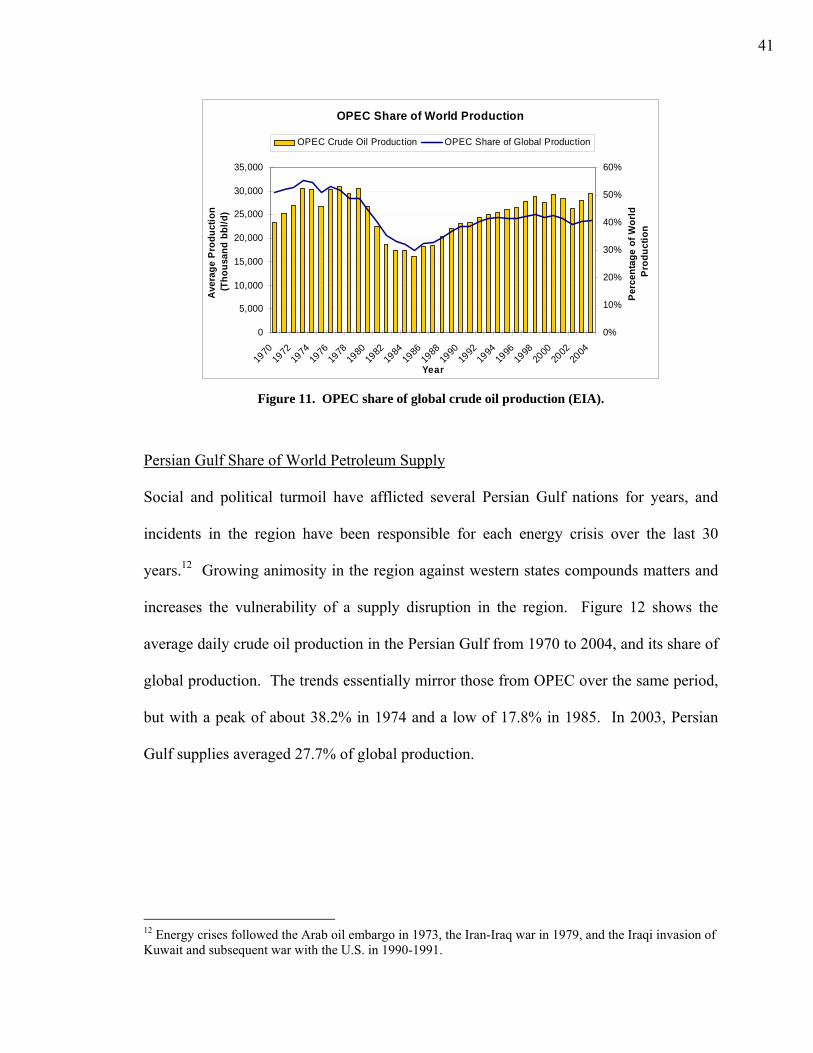
41
OPEC Share of World Production
0
5,000
10,000
15,000
20,000
25,000
30,000
35,000
1970
1972
1974
1976
1978
1980
1982
1984
1986
1988
1990
1992
1994
1996
1998
2000
2002
2004
Year
Ave
rage
Pro
duct
ion
(Tho
usan
d bb
l/d)
0%
10%
20%
30%
40%
50%
60%
Per
cent
age
of W
orld
P
rodu
ctio
n
OPEC Crude Oil Production OPEC Share of Global Production
Figure 11. OPEC share of global crude oil production (EIA).
Persian Gulf Share of World Petroleum Supply
Social and political turmoil have afflicted several Persian Gulf nations for years, and
incidents in the region have been responsible for each energy crisis over the last 30
years.12 Growing animosity in the region against western states compounds matters and
increases the vulnerability of a supply disruption in the region. Figure 12 shows the
average daily crude oil production in the Persian Gulf from 1970 to 2004, and its share of
global production. The trends essentially mirror those from OPEC over the same period,
but with a peak of about 38.2% in 1974 and a low of 17.8% in 1985. In 2003, Persian
Gulf supplies averaged 27.7% of global production.
12 Energy crises followed the Arab oil embargo in 1973, the Iran-Iraq war in 1979, and the Iraqi invasion of Kuwait and subsequent war with the U.S. in 1990-1991.
42
Persian Gulf Share of World Production
0
5,000
10,000
15,000
20,000
25,000
1970
1972
1974
1976
1978
1980
1982
1984
1986
1988
1990
1992
1994
1996
1998
2000
2002
Year
Aver
age
Prod
uctio
n (T
hous
and
bbl/d
)
0%
5%
10%
15%
20%
25%
30%
35%
40%
45%
Per
cent
age
of W
orld
P
rodu
ctio
n
Persian Gulf Crude Oil Production Persian Gulf Share of Global Production
Figure 12. Persian Gulf share of global crude oil production (EIA).
World Excess Production Capacity
Excess production capacity provides an element of flexibility in the global market to
withstand disruptions from individual suppliers. Essentially all spare production capacity
in the world is controlled by OPEC and Persian Gulf countries (Kreil, 2004). Figure 13
shows the annual average world excess production capacity versus price since 1970. It
can be seen that current excess capacity is lower than any other time during that period
except the Gulf War in 1991.
43
World Excess Production Capacity
0
2
4
6
8
10
12
1970
1972
1974
1976
1978
1980
1982
1984
1986
1988
1990
1992
1994
1996
1998
2000
2002
2004
Year
Spa
re P
rodu
ctio
n C
apac
ity (M
illio
n bb
l/d)
$0
$10
$20
$30
$40
$50
$60
$70
$80
Aver
age
Cos
t per
Bar
rel
(200
3 $)
Spare Production Capacity Crude Oil Price
Figure 13. World excess petroleum production capacity vs. price (EIA).
Costs of Oil Dependence
Dependence on oil supplies from other countries has profound consequences on the U.S.
economy. It increases the trade deficit, the costs of securing resource supply, and slows
GDP growth. Figure 14 shows annual U.S. expenditures on imported petroleum and the
U.S. trade deficit since 1970, based on real prices in 2003 dollars. Expenditures on
imported petroleum are approaching record values not seen since the second energy
crisis, when the U.S. spent approximately $145 billion on net imports in 1980. In 2004,
if the price of oil averages $40 per barrel and net imports remain close to 11 million
barrels per day, the U.S. will spend $160 billion on imported oil. Since 1975, the last
year the U.S. had a trade surplus, expenditures on net imports of petroleum have
consistently accounted for over 20% of the total trade deficit. Over the last decade,
increases in spending on imported oil have corresponded well with increases in the trade
deficit. The connection is especially apparent since 1997. In 2003, with spending on
44
imported oil supplies amounting to $128 billion and the trade deficit at $490 billion,
dependence on imported oil accounted for over 25% of the total trade deficit.
U.S. Expenditures on Imported Oil vs. Trade Deficit
$0
$20
$40
$60
$80
$100
$120
$140
$160
1970
1972
1974
1976
1978
1980
1982
1984
1986
1988
1990
1992
1994
1996
1998
2000
2002
2004
Year
Impo
rt E
xpen
ditu
res
(200
3 $,
Bill
ions
)
($100)
$0
$100
$200
$300
$400
$500
$600
Trad
e D
efic
it (2
003
$, B
illio
ns)
Expenditures on Net Petroleum Imports U.S. Trade Deficit
Figure 14. U.S. expenditures on imported oil and the trade deficit, in 2003 $ (EIA and the Bureau of
Economic Analysis).
In addition to compounding the trade deficit, oil dependence increases the burden of
securing supply. The average annual peacetime cost to the U.S. of maintaining a military
presence in the Middle East is about $50 billion (e.g., IAGS [2003a], Delucchi and
Murphy [1996]). Military conflicts add additional costs. The cost of the 1990-1991 Gulf
War to the international community totaled about $80 billion (IAGS, 2003b). Final cost
figures for current operations in Iraq will be in the hundreds of billions.13 Another cost
associated with international suppliers is insurance. Increased fear of attack on
supertankers has caused insurance rates to skyrocket. Insurance rates recently tripled for
13 The author does not intend to suggest motives for the current operations in Iraq, nor necessarily attribute their financial costs to securing oil supplies. But they certainly carry implications for the global oil market.
45
tankers passing through Yemen, adding about $0.15/barrel (bbl) to the price of petroleum
traveling through the region (IAGS, 2003c).
The EIA has established “rules of thumb” to assess the impacts of oil supply disruptions
on economic growth, specifically GDP. First, every 1 MMbbl/day of lost oil causes
world oil prices to increase by $3-$5 per barrel. Second, each 10% increase in the price
of oil lowers the real U.S. GDP growth rate by 0.05 percentage points in the first year and
0.10 percentage points in the second year. So, if 1 MMbbl/day were disrupted and
prevailing oil prices were $30 per barrel, oil prices could increase to $33-$35 per barrel.
This is equivalent to a price increase of 10%-17%, which equates to possible reduction in
the U.S. GDP growth rate of 0.05-0.08 percentage points in the first year, and 0.10-0.17
percentage points in the second year (EIA, 2004g).
Multiple studies have aggregated these and other costs to estimate the true cost of U.S. oil
dependence. Greene and Tishchishyna present a model developed by Oak Ridge
National Laboratories to estimate the costs of oil dependence to the U.S. from 1970 to
1999 (Greene, 2000). They consider three categories of cost in their study: (1) loss of
potential GDP, (2) macroeconomic adjustment losses, and (3) wealth transfer. The loss
of potential GDP results from monopolistic pricing practices by global oil suppliers, who
keep oil prices above the level which would exist in a competitive market. Higher oil
prices constrain the economy, allowing less production with the same amount of capital,
labor, and materials than if oil was less expensive. Macroeconomic adjustment costs
account for delays in adjusting prices, wages, and interest rates following oil price spikes,
46
during which there is a less than optimal use of available resources. They depend on
policy responses to price shocks, and are sensitive to the elasticity of GDP with respect to
the price of oil. Wealth transfer is equal to the quantity of imported oil times the
difference in the actual and competitive prices. Combining these costs, Greene and
Tishchishyna conclude that oil dependence cost the U.S. $3.4 trillion from 1970 to 1999.
The National Defense Council Foundation (NDCF) also studied the economic impacts of
oil dependence, and presents the costs on a per-gallon of gasoline basis to determine the
“real price” of gasoline (Copulos, 2003). The study includes three hidden imported oil
costs: (1) military expenditures in the Persian Gulf, (2) a diversion of financial resources,
and (3) periodic oil price shocks. Military expenditures are defined in terms of the
portion of the budget of U.S. Central Command (whose area of responsibility is the
Middle East and the Horn of Africa) that goes towards defending Persian Gulf oil. It
does not include the cost of the current engagement in Middle East. The diversion of
financial resources includes direct costs from the transfer of wealth, and indirect costs
from lost employment and investment. The costs stemming from the oil price shocks of
1973-74, 1979-80, and 1991 were estimated to be $2.3 trillion – $2.5 trillion, and
amortized over three decades to determine an annual cost. They conclude that the real
price of gasoline paid by the U.S. consumer, when taking oil dependence into account, is
between $5.01/gallon and $5.19/gallon.

47
Reliability of Global Supply Infrastructure
The oil supply chain is composed of a vast infrastructure of interdependent physical
assets that stretches worldwide. Supply resources tend to be centralized in tumultuous
regions far from the final demand, creating a long and complicated transportation
network of ships, trains, trucks, and pipelines. Geopolitics influence oil extraction rates,
transportation routes traverse dangerous terrain and hostile territory, refineries are aging
and are not being replaced, and global oil consumption is expected to increase by 50%
over the next twenty years (EIA, 2004f, p.2). Every asset throughout the infrastructure
faces unpredictable threats presented by the new business environment, natural disasters,
human error, and hostile attacks. This section investigates the reliability of the physical
petroleum supply infrastructure, and discusses its vulnerabilities and threats.
Supply Outlook
As world consumption continues to grow and reserves deplete, global distribution of
petroleum resources should grow more concentrated. Members of OPEC stand to gain an
even greater share of the world market, and nations dependent on imported oil will grow
increasingly vulnerable to a disruption in supply. Figure 15 shows the estimated
distribution of oil reserves as of January 1, 2001. Over half of the remaining oil in the
world is located in the Middle East.

48
World Crude Oil Reserves
0
200
400
600
800
1000
1200
1400
WorldOPEC
Persian Gulf
North America
Central & South America
Western Europe
E. Europe & Former U.S.S.R.
Middle EastAfrica
Asia & OceaniaRe
serv
es (B
illio
n ba
rrel
s)
Figure 15. Distribution of global crude oil reserves (EIA, from Oil & Gas Journal).
Geopolitics
The Oxford American Dictionary defines geopolitics as “the politics of a country as
determined by its geographical features.” Here, the geographical feature of concern is the
abundance – or lack thereof – of oil. Geopolitics weighs heavily on international energy
markets, and will impose increasing threats on global oil supply as reserves grow more
concentrated and demand continues to increase.
The Center for Strategic and International Studies (CSIS) investigated the “symbiotic
relationship” between oil and politics from 2000 to 2020 (CSIS, 2000). Four geopolitical
trends could have significant impacts on global energy demand and supply reliability
before 2020 (CSIS, 2000, pp.7-13):
• World powers and conflict. The wake of the Cold War has left the role of the world’s
major powers still somewhat undefined, and as they each pursue their national
49
interests, conflicts could disrupt world energy supplies. The politics of global and
regional powers will shape oil production from the Caspian Sea and Central Asia.
• Political instability among key energy suppliers. Several key oil producing states
face internal conflict, which could disrupt global oil supplies.
• Economic globalization. The globalization of all forms of trade is increasingly
making producers and consumers interdependent.
• The growing impact of non-state actors. Information technology has allowed non-
governmental organizations to gain greater control in the political process.
Similarly, trends in energy usage effects geopolitics (CSIS, 2000, pp.13-18):
• Swings in energy demand. The economies of oil producing states are heavily
dependent on oil revenue. A drop in revenues could cripple these countries and make
them more vulnerable to internal crises.
• Competition for energy supplies in Asia. Competition for oil imports and territorial
disputes over regions rich in oil could ignite tensions between Asian countries that
have deep, historical roots. China’s increased oil dependence could lead to strategic
relationships with Middle Eastern countries and Russia, which could be damaging to
relations with the U.S., Europe, and other Asian countries.
• Energy and regional integration. Energy can also serve to strengthen ties between
rival countries. Infrastructure projects and trade liberalization can cut through
boundaries and bring economies together, serving to ease conflicts in many regions.
50
• Energy and the environment. Debates regarding the role of the environment in
energy supply and consumption could create conflicts between nations, especially
between developed and developing countries.
A brief evaluation of the geopolitical situations in each OPEC member state is given in
Appendix A. Similar looks into the socio-political situations in other significant oil-
producing and -consuming states could provide further insights into the future reliability
of global petroleum supply.
Threats
Changes in the global business and political climates intensify threats facing oil supply
infrastructure. The new business environment has exposed the industry to great threats,
as discussed earlier. Natural disasters and human error also continue to threaten
operations. An increasing source of threats is from malicious attacks, whether from
disgruntled employees, thieves, or ideologues. Oil infrastructure provides an attractive
target because it is so vital to global economies, and the infrastructure is dispersed and
generally unprotected. One source of increasing attacks is “oil terrorism.” Most are
kidnappings, but attacks on personnel, pipelines, rigs, and wells are also included
(Adams, 2003, pp.5-12). Acts of piracy are also increasing, and have tripled in the last
decade (Luft and Korin, 2003). According to the International Maritime Bureau (IMB),
445 attacks were reported in 2003. Pirates have become better organized, and
coordinated attacks involving several boats are on the rise (ICC, 2004). Strategic
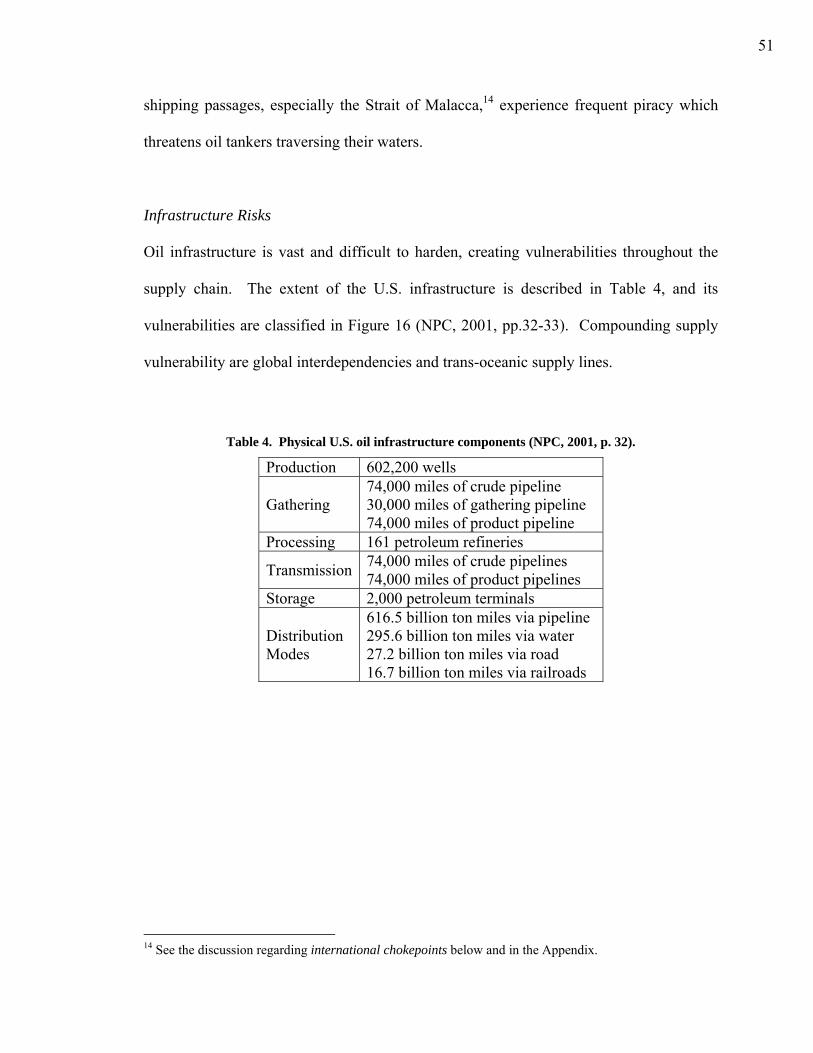
51
shipping passages, especially the Strait of Malacca,14 experience frequent piracy which
threatens oil tankers traversing their waters.
Infrastructure Risks
Oil infrastructure is vast and difficult to harden, creating vulnerabilities throughout the
supply chain. The extent of the U.S. infrastructure is described in Table 4, and its
vulnerabilities are classified in Figure 16 (NPC, 2001, pp.32-33). Compounding supply
vulnerability are global interdependencies and trans-oceanic supply lines.
Table 4. Physical U.S. oil infrastructure components (NPC, 2001, p. 32).
Production 602,200 wells
Gathering 74,000 miles of crude pipeline 30,000 miles of gathering pipeline 74,000 miles of product pipeline
Processing 161 petroleum refineries
Transmission 74,000 miles of crude pipelines 74,000 miles of product pipelines
Storage 2,000 petroleum terminals
Distribution Modes
616.5 billion ton miles via pipeline 295.6 billion ton miles via water 27.2 billion ton miles via road 16.7 billion ton miles via railroads
14 See the discussion regarding international chokepoints below and in the Appendix.
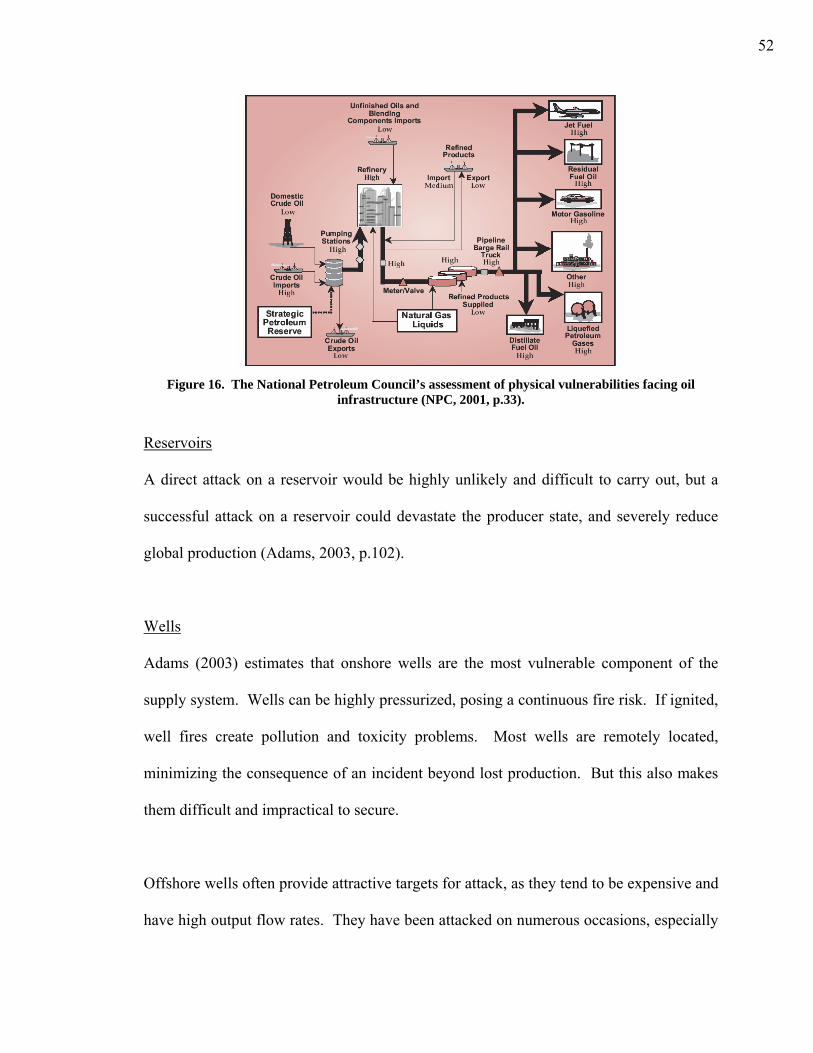
52
Figure 16. The National Petroleum Council’s assessment of physical vulnerabilities facing oil
infrastructure (NPC, 2001, p.33).
Reservoirs
A direct attack on a reservoir would be highly unlikely and difficult to carry out, but a
successful attack on a reservoir could devastate the producer state, and severely reduce
global production (Adams, 2003, p.102).
Wells
Adams (2003) estimates that onshore wells are the most vulnerable component of the
supply system. Wells can be highly pressurized, posing a continuous fire risk. If ignited,
well fires create pollution and toxicity problems. Most wells are remotely located,
minimizing the consequence of an incident beyond lost production. But this also makes
them difficult and impractical to secure.
Offshore wells often provide attractive targets for attack, as they tend to be expensive and
have high output flow rates. They have been attacked on numerous occasions, especially
53
in Africa. Higher-producing wells far offshore are more hardened and less attractive for
attack than the softer targets offered by the often unstaffed wells closer to shore. Besides
lost production, the primary consequence of an offshore attack is pollution. Some wells
are equipped to continuously ignite any released product to avoid water pollution. But
burning oil presents toxicity and air pollution problems (Adams, 2003, pp.125-127).
Transport
According to the IAGS, the “transportation system has always been the Achilles heel of
the oil industry,” and it has become even more so in recent years (IAGS, 2003c). Long
haul distances typical of the petroleum supply system increase vulnerabilities to every
hazard. Three-fifths of internationally-traded oil is transported by sea, and the rest
primarily via pipeline (EIA, 2002). Both methods face considerable vulnerabilities and
threats, and pose serious consequences. But, unlike other components of the supply
system, the transport system is somewhat flexible. Trucking capacity can easily be
expanded, and provides the most flexibility, followed by rail and waterway, and finally
pipelines (Lovins, 1982, p.40).
• Pipelines. Pipelines tend to be unsecured in remote areas and are incredibly
vulnerable. They are often buried, but are exposed at junctures and where terrain
dictates. Signage calls out the location of buried lines to warn against inadvertent
third-party damage, but similarly alerts wrongdoers. Oil pipelines often follow
the same paths as natural gas pipelines, so an incident on one line could damage
the other as well (Adams, 2003, pp.106-114). One especially vulnerable pipeline
54
in the U.S. is the Trans-Alaska Pipeline System (TAPS), which is currently the
only route to deliver Alaskan oil to the contiguous U.S. TAPS has been bombed
twice and shot more than 50 times in recent years, and cannot be repaired in the
winter (Luft and Korin, 2003).
Pump stations along pipelines are similarly vulnerable. They are located
approximately every 50 miles, and are often remote and unsecured. The loss of a
pump station would have the same effect as losing the pipeline it serves, but pump
stations take longer to repair (Adams, 2003, pp.15-16).
• Tankers and ports. Tankers are vulnerable to attack and are facing greater and
more frequent threats. They serve as large, expensive and symbolic targets, and
often travel through dangerous waters. Loading terminals are critical to supply,
and vulnerable to interruption. They are difficult to secure, and if damaged,
would disrupt infrastructure facilities served by the port. Loading terminals may
pose a greater risk than refineries or storage sites (Adams, 2003, p.124).
• International chokepoints. Chokepoints are vulnerable transportation routes
through which the flow of oil could be easily disrupted. Most only have long,
inaccessible alternate routes, if any at all. If flow through any chokepoint were
disrupted, it could carry significant consequences for the global market. About
40% of total world petroleum consumption and more than 55% of all exports flow
55
through these chokepoints daily. Descriptions of each chokepoint, and threats and
consequences facing each, are given in Appendix B.
Storage
Storage facilities can include tank farms or underground storage. Tank farms are more
vulnerable and tend to be located in oil fields, refineries, loading terminals, or even
residential areas. They are visible, and their contents highly flammable. If ignited, toxic
fumes pose health risks to proximate populations. Underground storage sites have larger
capacities, but better security (Adams, 2003).
Refineries
Refineries are probably the most vulnerable component of the supply system aside from
wells. Major damage can be done without many explosives, as refineries contain hot,
pressurized, and explosive gases and liquids. They also depend on one type of crude, and
are vulnerable to impurities (Lovins, 1982). Refineries in the U.S are aging, and are no
longer being built due to environmental constraints and financial risks (NPC, 2001, p.32).
Refineries employ a large number of workers (usually 1000-2000 people on average) and
tend to be less remote than wells. Consequences stemming from an incident may be
more likely to reach populated areas, and include significant direct financial costs
associated with rebuilding, a high loss of life potential, and possible costs associated with
lawsuits if incident damages reach surrounding communities (Adams, 2003, p.27).
56
Summary
Reliability in the petroleum sector is considered in terms of broad concerns such as
national and economic security. This designation emanates from the dependence of
developed economies on imported petroleum supplies, which often originate in volatile
regions. Reliability in the sector is measured in terms of imports, origin of imports,
storage levels, and reserve levels. Economic indicators exist as well, such as petroleum
expenditures as a fraction of GDP, wealth transfer, military expenditures, and the effects
of oil price spikes. The sector faces quickly-evolving risks as a result of automation and
globalization, and the supply infrastructure is incredibly vulnerable – due to age, location,
size, and long haul distances typical of global trade.
METHODOLOGY
Methodology Overview
This study aims to develop a methodology to assess the reliability of hydrogen energy
systems. The intention is to promote fair consideration of reliability in hydrogen
discourse by introducing methods allowing complete, ordered assessments. To the best
knowledge of the author, it represents the first systematic effort in this regard.
This study uses qualitative methods to assess the perceived reliability of hydrogen energy
systems. First, reliability is defined and metrics are selected to value it. Next, hydrogen
pathways are selected and described. Three constituent components of the pathways are
assessed by a panel of experts – the primary energy supply system, the hydrogen
57
production process, and the hydrogen transport process. They rate the reliability and
importance of each pathway component in terms of the metrics. Finally, their ratings are
aggregated to determine broad reliability scores that can be compared across pathways.
The methodology is summarized by the following steps, each detailed separately below:
1. Define scope of study, and select participants
2. Define reliability in hydrogen energy systems
3. Select metrics to value reliability in hydrogen energy systems
4. Specify hydrogen energy systems to evaluate
5. Develop evaluation matrix
6. Develop rating scales and rating criteria
7. Collect expert reliability and importance ratings
8. Aggregate expert ratings to determine reliability scores
9. Compare reliability scores across pathways
The discussion in this section introduces the method and generally describes its
application. The next section details the methodology for a specific application.
1. Define Scope of Study and Select Participants
The first step of an evaluation of a system is to define the scope of study. The scope will
depend on details of the system being considered, the objectives of the organization
conducting the study, and the motivation for the research. Some parameters of the energy
systems being evaluated will be known or postulated. These include geographical extent,
58
volume of hydrogen demand, geographical- or time-distribution of demand, and others.
The composition and reach of the systems as described by these parameters shape the
boundaries and processes of the assessment. The objectives of the organization and its
motivation for conducting the study will also influence the scope. The organization could
be a company, a governmental organization, an industry group, a non-governmental
organization (NGO), a research institution, or a university. Each holds a different slant
and motivation, and would define the scope uniquely.
The organization conducting the study also selects experts to evaluate reliability, and
determines their involvement in the assessment process. The organization may select to
use in-house experts, involve a wide group of experts comprising all stakeholders and
schools of thought, or a combination of the two. If a panel of experts representing
multiple parties is used, there are three roles it could take (Contadini, 2002, p.62). First, a
single modeler could decide on the inputs for the analysis, and involve other parties later
in the process. The modeler could define reliability and select the metrics and pathways
to consider, and the expert panel could rate reliability. This method allows the
organization to shape the study to its liking. But Contadini warns that this practice can
lead to missed information, and to large modifications late in the process.
The other two roles Contadini describes involve the experts in the entire process. In
addition to rating the reliability of the metrics, the expert panel also defines reliability and
selects the metrics and pathways to be evaluated. These options add a greater level of
consensus, but also introduce complications and could allow an overrepresented group to
59
bias the results. They could also reduce the ability of the organization conducting the
study to define reliability in line with its objectives. The two vary by the method in
which consensus is reached. In one, selections are made by majority vote. In the other,
final decisions are established via technical discussion based on information provided by
the organizations with which the experts are affiliated.
2. Define Reliability in Hydrogen Energy Systems
The participants selected to develop the inputs for the analysis begin by defining
reliability in hydrogen energy systems. A thorough definition is essential to set a
foundation for the assessment. It establishes boundaries and outlines key parameters to
include in the study. The definition could vary among organizations. Each is likely to
perceive reliability differently, to encapsulate concepts it feels are important.
Important issues of semantics emerge when defining reliability. Leemis discusses these
as they apply to defining reliability of any system, not specific to hydrogen (Leemis,
1995, pp.2-4). He emphasizes the importance of clearly specifying within the definition
the item of interest, what constitutes adequate performance (or non-failure), a time
duration, and the environmental conditions in which the item operates. The item can be a
component or an entire system. It should be clearly specified exactly what the item is,
and the boundaries that delineate components comprising the item. Adequate
performance must be clearly defined for the item as well. The simplest way is to
establish a binary criterion, that the item is either operational or has failed. An example
of a binary criterion in a hydrogen transport subsystem might be that a pipeline is either
60
able or unable to deliver hydrogen. But this model can be difficult to apply, because
performance of an item often degrades over time. In these cases, Leemis suggests setting
a threshold below which the item is considered to have failed. Here, the example above
might be modified to include a level of throughput under which the subsystem is
considered “failed”. A time period should also be clearly specified in the definition. Any
item has a finite lifespan after which it will invariably fail, so adequate performance
cannot be defined without providing a context of time. Finally, the environmental
conditions under which the item is expected to operate profoundly affect the reliability of
an item, and must be specified. Two identical items operating under different
surrounding conditions will undoubtedly fail at different times. For example, a garaged
pickup truck used as a commuter vehicle will probably demonstrate greater reliability
than the same truck kept outside and used on a farm or construction site.
3. Select Metrics to Value Reliability in Hydrogen Energy Systems
Once hydrogen reliability has been thoroughly defined, metrics to value it are selected.
They are what the experts ultimately rate for each system. The idea is to decompose the
broad reliability concepts captured in the definition into tangible elements that can be
easily evaluated. Upon measuring and rating these basic elements, they are recombined
to develop overall reliability scores. The number of metrics selected and their precision
depends on the level of specificity included in the definition, the objectives of the study,
and the resources and time available. Limiting the number of metrics reduces the burden
on the experts significantly, but can also limit the scope of the assessment. Conversely,
including superfluous elements could skew the results. Conflicting issues should be
61
balanced to develop measures which fully encompass the concepts in the reliability
definition, while accounting for real-world constraints such as time, resources, and
human cognitive ability.
Several methods can be used to select the metrics. A somewhat systematic one is
outlined in the field of hazard analysis. Hazard analysis is a qualitative method used in
risk analyses to identify components deserving detailed review. It often takes the form of
a checklist evaluation completed by industry experts. Andrews and Moss define hazard
analysis as a process used for “identifying events which lead to materialization of a
hazard, analysis of mechanisms by which these events occur, and estimation of the
likelihood and extent of harmful effects” (Andrews and Moss, 2002, pp.59-60). It
provides a formulaic method to prioritize metrics to include in the assessment given
limited time. Metrics can be selected that best capture events and mechanisms deemed
most likely to produce harmful effects. Less formal methods can be used as well. These
include literature reviews, interviews with experts, and group discussions.
4. Specify Hydrogen Energy Systems to Evaluate
The metrics developed in the previous step are used to assess the reliability of hydrogen
pathways. The pathways should be detailed to the extent possible to allow accurate and
consistent reliability ratings. Descriptions should include demand scenarios, primary
energy supply systems, hydrogen production processes, and hydrogen transport
processes. End use – including energy use associated with compression or liquefaction,
required purity and pressure, and risks at the refueling station – also affects reliability, but
62
is beyond the scope of this study. This analysis only considers hydrogen reliability
upstream from the consumer.
An important aspect of reliability is the demand scenario under which the hydrogen
systems operate. It should be defined over the entire time frame established in the
reliability definition. If the pathways are expected to operate under different demand
scenarios, each needs to be clearly specified. Items to consider when defining the
demand scenario include:
• Total volume demanded
• Demand profiles (variation of demand with time and season)
• Geographical distribution of demand
• Geographical distribution of supply sources and systems
• End use (not considered here)
The primary energy supply system must also be clearly defined. Hydrogen is similar to
electricity and gasoline in that it does not exist by itself, and must be created from
another energy resource. The primary energy supply system encompasses the entire
system used to deliver an energy product to the point of hydrogen production. It includes
the primary energy feedstocks, their extraction and transport processes, and the
production, transportation, and/or refining of the final energy product. Primary energy
feedstocks include any naturally occurring fossil or renewable energy resource. If
electricity is used as the primary energy supply system, it also has a primary energy
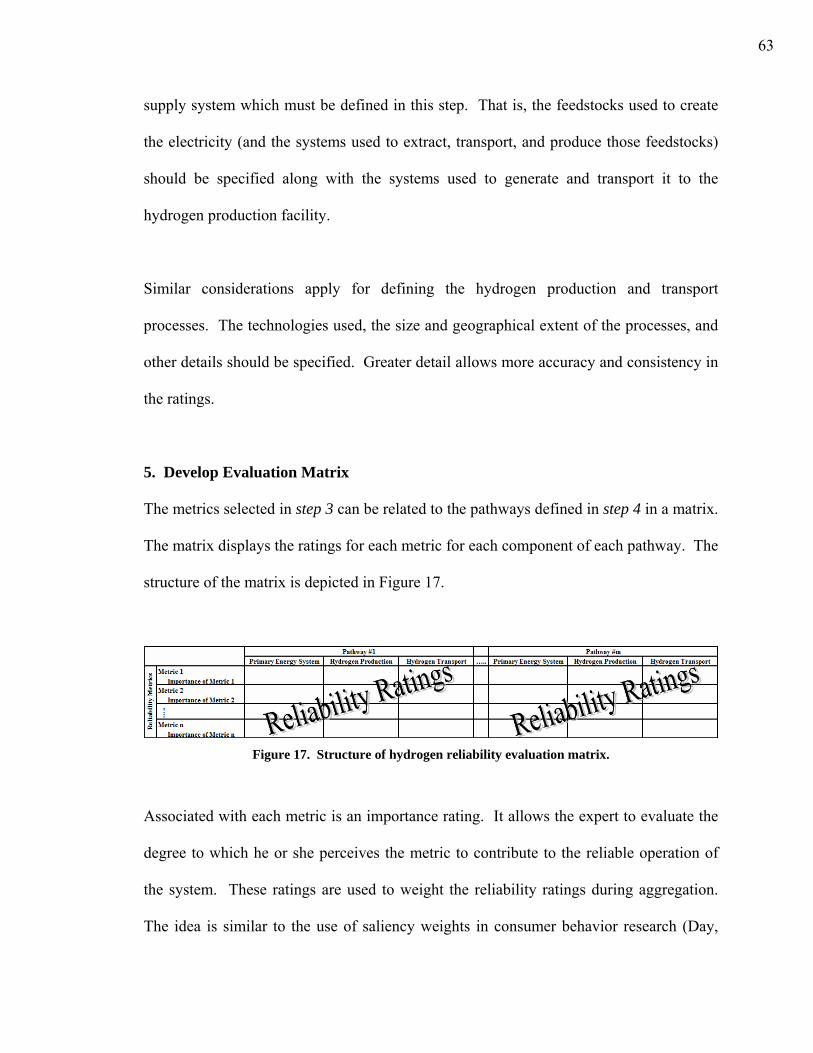
63
supply system which must be defined in this step. That is, the feedstocks used to create
the electricity (and the systems used to extract, transport, and produce those feedstocks)
should be specified along with the systems used to generate and transport it to the
hydrogen production facility.
Similar considerations apply for defining the hydrogen production and transport
processes. The technologies used, the size and geographical extent of the processes, and
other details should be specified. Greater detail allows more accuracy and consistency in
the ratings.
5. Develop Evaluation Matrix
The metrics selected in step 3 can be related to the pathways defined in step 4 in a matrix.
The matrix displays the ratings for each metric for each component of each pathway. The
structure of the matrix is depicted in Figure 17.
Figure 17. Structure of hydrogen reliability evaluation matrix.
Associated with each metric is an importance rating. It allows the expert to evaluate the
degree to which he or she perceives the metric to contribute to the reliable operation of
the system. These ratings are used to weight the reliability ratings during aggregation.
The idea is similar to the use of saliency weights in consumer behavior research (Day,
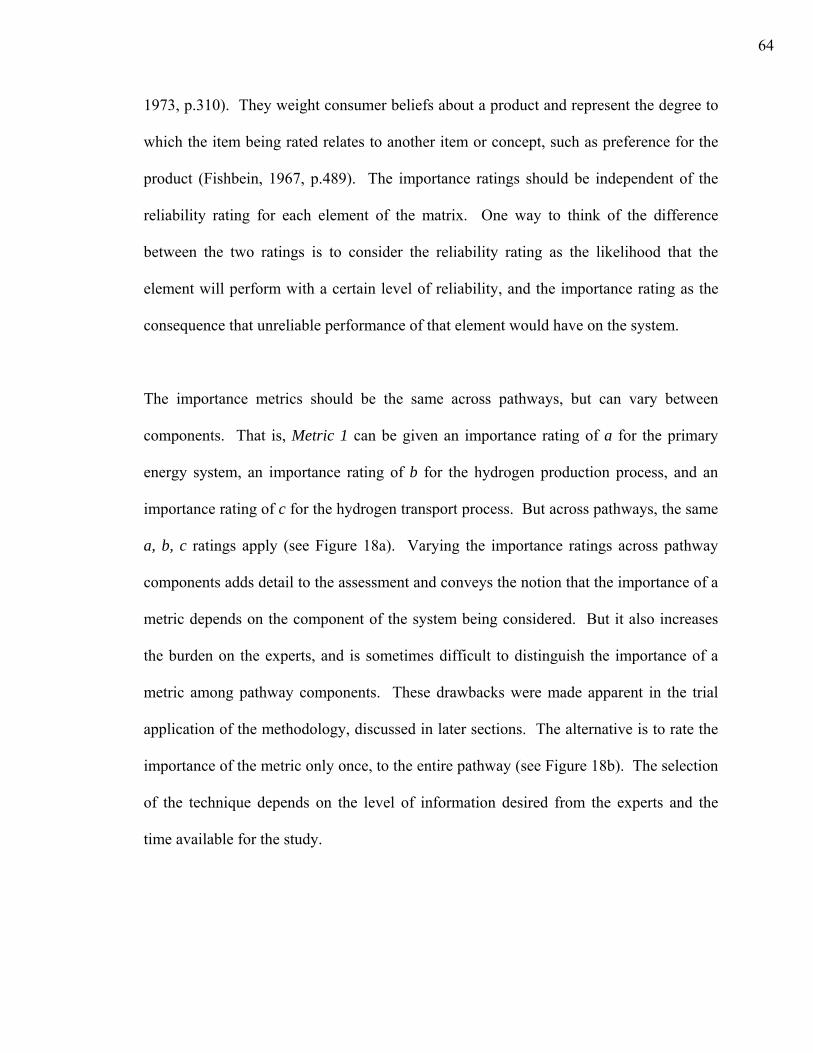
64
1973, p.310). They weight consumer beliefs about a product and represent the degree to
which the item being rated relates to another item or concept, such as preference for the
product (Fishbein, 1967, p.489). The importance ratings should be independent of the
reliability rating for each element of the matrix. One way to think of the difference
between the two ratings is to consider the reliability rating as the likelihood that the
element will perform with a certain level of reliability, and the importance rating as the
consequence that unreliable performance of that element would have on the system.
The importance metrics should be the same across pathways, but can vary between
components. That is, Metric 1 can be given an importance rating of a for the primary
energy system, an importance rating of b for the hydrogen production process, and an
importance rating of c for the hydrogen transport process. But across pathways, the same
a, b, c ratings apply (see Figure 18a). Varying the importance ratings across pathway
components adds detail to the assessment and conveys the notion that the importance of a
metric depends on the component of the system being considered. But it also increases
the burden on the experts, and is sometimes difficult to distinguish the importance of a
metric among pathway components. These drawbacks were made apparent in the trial
application of the methodology, discussed in later sections. The alternative is to rate the
importance of the metric only once, to the entire pathway (see Figure 18b). The selection
of the technique depends on the level of information desired from the experts and the
time available for the study.
65
Figure 18. Sample importance ratings: a) different importance ratings for each pathway
component, b) same importance ratings for each pathway component.
6. Develop Rating Scales and Rating Criteria
After forming the evaluation matrix, rating scales and criteria to evaluate its elements are
developed. Rating scales for both the reliability ratings and importance ratings should be
specified, though they can be the same. If more are desired, such as different scales for
different metrics, then more can be incorporated into the evaluation. While it adds
complexity and may make the evaluation more confusing for the experts, various scales
could be beneficial in some cases, such as when some metrics can be evaluated
quantitatively, and others qualitatively.
The scale used should accurately capture the degree to which the system operates reliably
according to the definition established in step 1. Several scales exist to capture different
types of measurements. The primary difference between scales is the level of
information that can be inferred from the rating. Behavioral researchers identify four
scales conveying increasing levels of information (e.g., Summers, 1970, p.11). Nominal

66
measurements are the simplest. They are categorical and simply distinguish between
responses. They are not appropriate for this study, and are not considered here. Ordinal
measures are the next most powerful and simply convey a ranking of elements. That is, a
1 comes before a 2, comes before a 3, and so on. Interval measures include an extra
degree of information – the interval between numerical ratings is meaningful. That is, the
difference between a 2 and a 3 is the same as the difference between a 3 and a 4. The
last, and most powerful, is the ratio measure. This scale includes an absolute origin, so
all mathematical operations, including multiplication and division, can be performed on
the ratings. That is, a rating of 2 implies twice as much as a rating of 1. The literature
covers the advantages, disadvantages, and semantics of each scale in depth. Here, it
suffices to say that care should be taken when developing a rating scale, to properly
capture the desired information contained in the expert opinions.
Criteria for rating the elements must also be clearly specified. This allows for consistent
ratings and reduces the subjectivity of expert opinion. The criteria may be qualitative,
quantitative, or a mixture of both. The selection of the criteria depends on the level of
knowledge among the experts and the quantity and quality of data available regarding the
metric. Quantitative criteria are often desirable to remove ambiguities that may emerge
in subjective ratings. But for somewhat abstract metrics or for those on which little data
exists, qualitative criteria may be needed. The type of criterion selected does not
necessarily depend on the type of rating scale selected. For example, although a
qualitative rating scale of good, fair, and poor might be applied to a metric weather,
supporting criteria could be quantitative. Good might correspond to a mid-day
67
temperature above 85°F, fair to temperatures between 60°F and 85°F, and poor to those
below 60°F.
7. Collect Expert Reliability and Importance Ratings
With all inputs and procedures defined and selected, the method proceeds to the experts.
They rate the reliability of each metric as it pertains to the components of each pathway,
and the importance of each. Their ratings are based on the scales previously established.
If the experts have not been involved in the process until this point, the method and their
task should be clearly described to them. This includes clearly defining the metrics,
pathways, scales, and criteria involved in the assessment. If multiple experts are
involved, the methodology should be similarly described to each.
The shape of future hydrogen energy systems remains unknown and little data exists
publicly on their reliability. Thus, expert opinions rely heavily on subjective assumptions
about future systems, taking the form of cognitive beliefs. Specific definitions of
cognitive belief vary in the literature,15 but here it is defined to encompass what an expert
thinks, knows, or believes about each metric.
Cognitive beliefs can be ascertained through the use of attitudinal surveys. Attitudinal
surveys gauge feelings, intentions, and opinions towards concepts, objects, or persons
(Mokhtarian, 2003). The process by which the survey is administered is up to the
organization, and depends on the scope of the study, the desired results, and the time and
resources available. The organization may want to bring the experts together to 15 Some examples can be found in Sudman and Bradburn (1982, p.123) and Dillman (1978, pp.80-86).
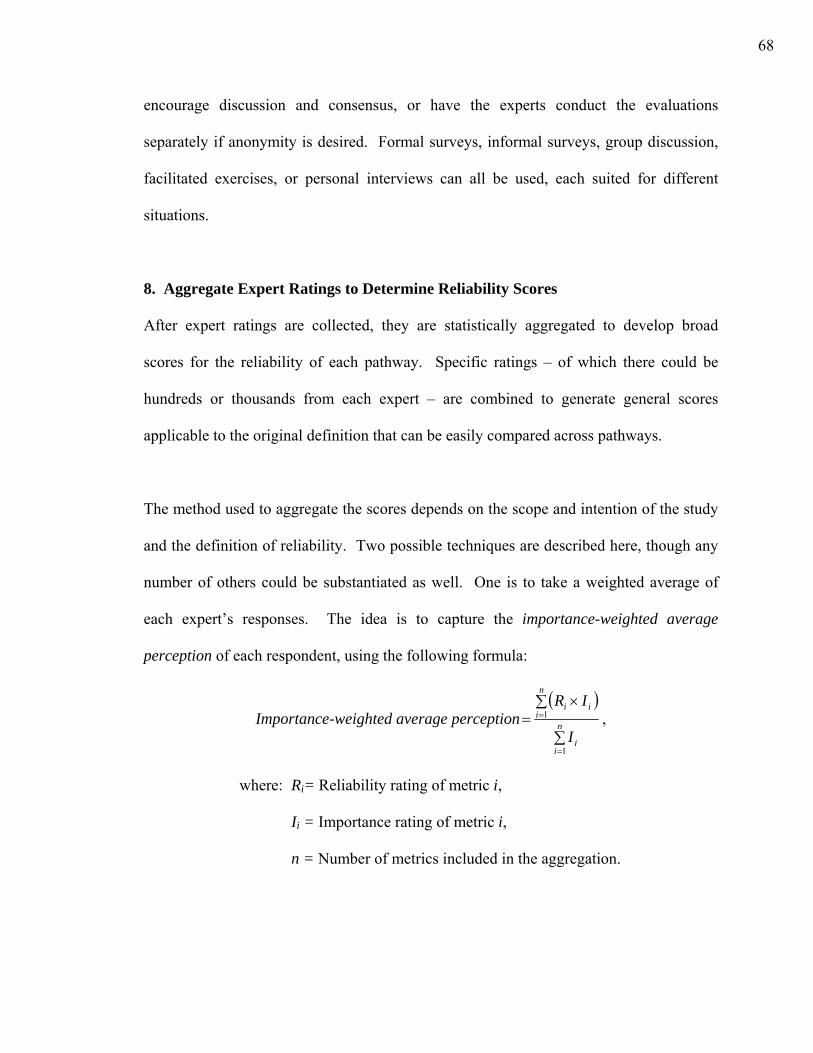
68
encourage discussion and consensus, or have the experts conduct the evaluations
separately if anonymity is desired. Formal surveys, informal surveys, group discussion,
facilitated exercises, or personal interviews can all be used, each suited for different
situations.
8. Aggregate Expert Ratings to Determine Reliability Scores
After expert ratings are collected, they are statistically aggregated to develop broad
scores for the reliability of each pathway. Specific ratings – of which there could be
hundreds or thousands from each expert – are combined to generate general scores
applicable to the original definition that can be easily compared across pathways.
The method used to aggregate the scores depends on the scope and intention of the study
and the definition of reliability. Two possible techniques are described here, though any
number of others could be substantiated as well. One is to take a weighted average of
each expert’s responses. The idea is to capture the importance-weighted average
perception of each respondent, using the following formula:
Importance-weighted average perception( )
∑
∑ ×=
=
=n
ii
n
iii
I
IR
1
1 ,
where: Ri= Reliability rating of metric i,
Ii = Importance rating of metric i,
n = Number of metrics included in the aggregation.
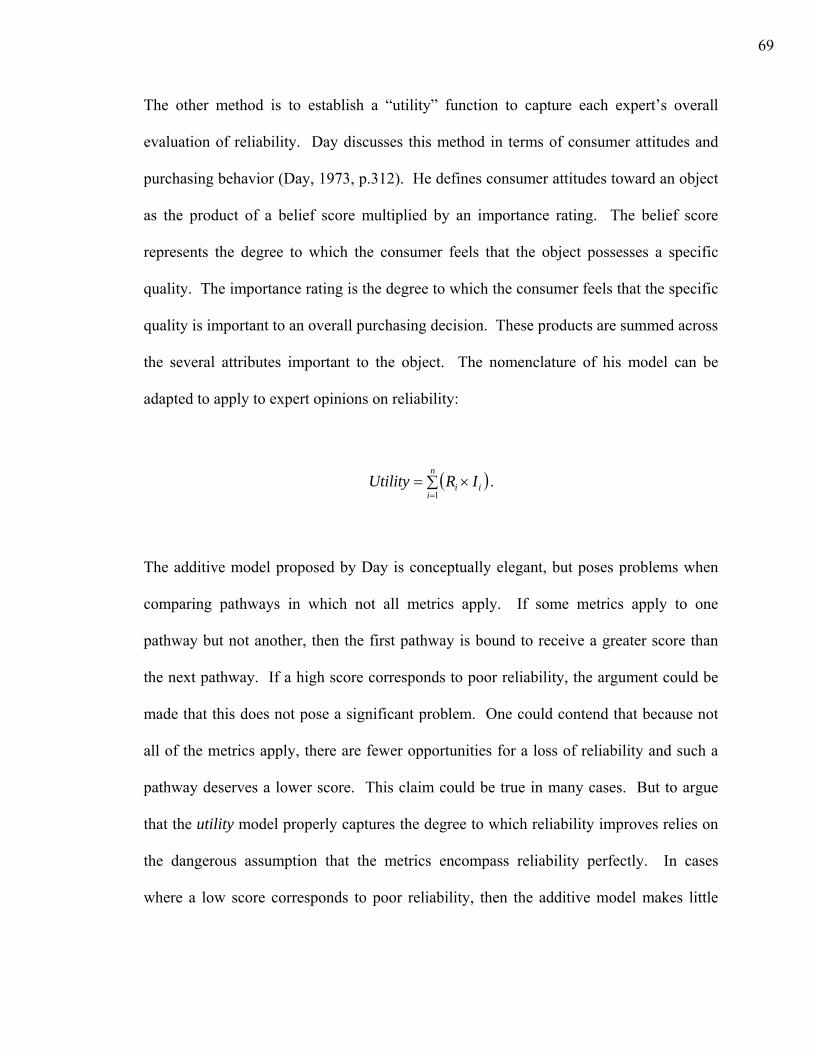
69
The other method is to establish a “utility” function to capture each expert’s overall
evaluation of reliability. Day discusses this method in terms of consumer attitudes and
purchasing behavior (Day, 1973, p.312). He defines consumer attitudes toward an object
as the product of a belief score multiplied by an importance rating. The belief score
represents the degree to which the consumer feels that the object possesses a specific
quality. The importance rating is the degree to which the consumer feels that the specific
quality is important to an overall purchasing decision. These products are summed across
the several attributes important to the object. The nomenclature of his model can be
adapted to apply to expert opinions on reliability:
( )∑ ×==
n
iii IRUtility
1.
The additive model proposed by Day is conceptually elegant, but poses problems when
comparing pathways in which not all metrics apply. If some metrics apply to one
pathway but not another, then the first pathway is bound to receive a greater score than
the next pathway. If a high score corresponds to poor reliability, the argument could be
made that this does not pose a significant problem. One could contend that because not
all of the metrics apply, there are fewer opportunities for a loss of reliability and such a
pathway deserves a lower score. This claim could be true in many cases. But to argue
that the utility model properly captures the degree to which reliability improves relies on
the dangerous assumption that the metrics encompass reliability perfectly. In cases
where a low score corresponds to poor reliability, then the additive model makes little
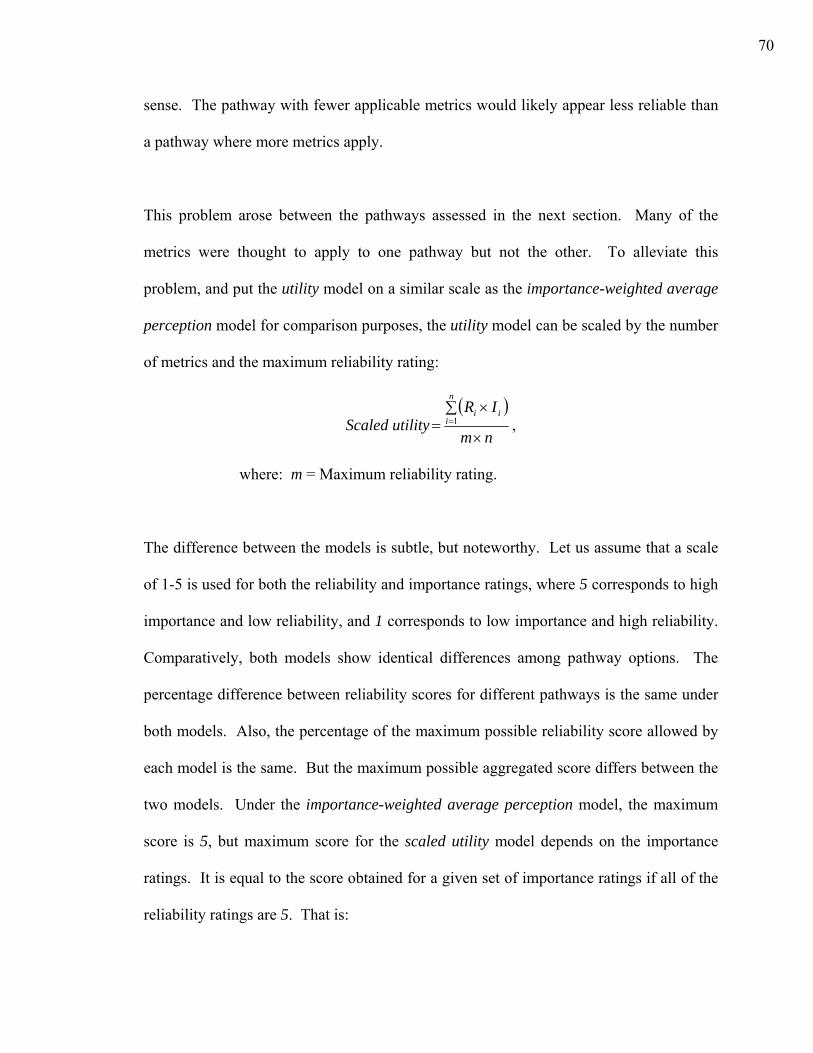
70
sense. The pathway with fewer applicable metrics would likely appear less reliable than
a pathway where more metrics apply.
This problem arose between the pathways assessed in the next section. Many of the
metrics were thought to apply to one pathway but not the other. To alleviate this
problem, and put the utility model on a similar scale as the importance-weighted average
perception model for comparison purposes, the utility model can be scaled by the number
of metrics and the maximum reliability rating:
Scaled utility( )
nm
IRn
iii
×
∑ ×= =1 ,
where: m = Maximum reliability rating.
The difference between the models is subtle, but noteworthy. Let us assume that a scale
of 1-5 is used for both the reliability and importance ratings, where 5 corresponds to high
importance and low reliability, and 1 corresponds to low importance and high reliability.
Comparatively, both models show identical differences among pathway options. The
percentage difference between reliability scores for different pathways is the same under
both models. Also, the percentage of the maximum possible reliability score allowed by
each model is the same. But the maximum possible aggregated score differs between the
two models. Under the importance-weighted average perception model, the maximum
score is 5, but maximum score for the scaled utility model depends on the importance
ratings. It is equal to the score obtained for a given set of importance ratings if all of the
reliability ratings are 5. That is:
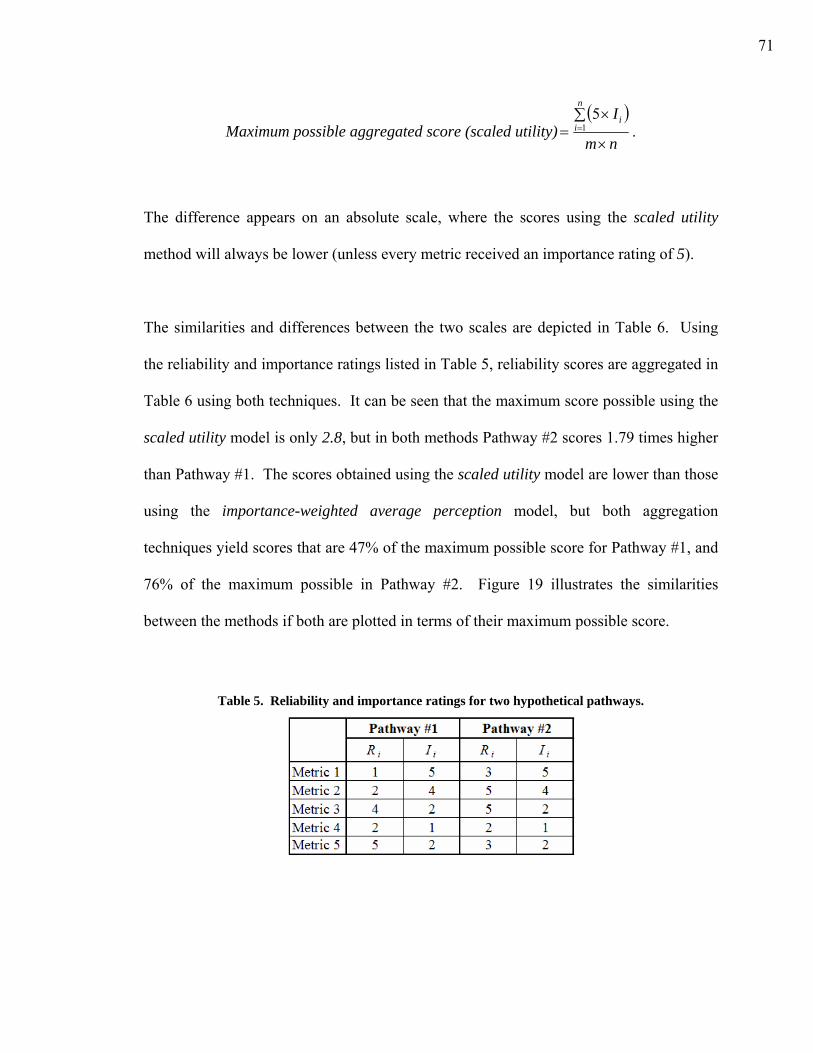
71
Maximum possible aggregated score (scaled utility)( )
nm
In
ii
×
∑ ×= =1
5.
The difference appears on an absolute scale, where the scores using the scaled utility
method will always be lower (unless every metric received an importance rating of 5).
The similarities and differences between the two scales are depicted in Table 6. Using
the reliability and importance ratings listed in Table 5, reliability scores are aggregated in
Table 6 using both techniques. It can be seen that the maximum score possible using the
scaled utility model is only 2.8, but in both methods Pathway #2 scores 1.79 times higher
than Pathway #1. The scores obtained using the scaled utility model are lower than those
using the importance-weighted average perception model, but both aggregation
techniques yield scores that are 47% of the maximum possible score for Pathway #1, and
76% of the maximum possible in Pathway #2. Figure 19 illustrates the similarities
between the methods if both are plotted in terms of their maximum possible score.
Table 5. Reliability and importance ratings for two hypothetical pathways.
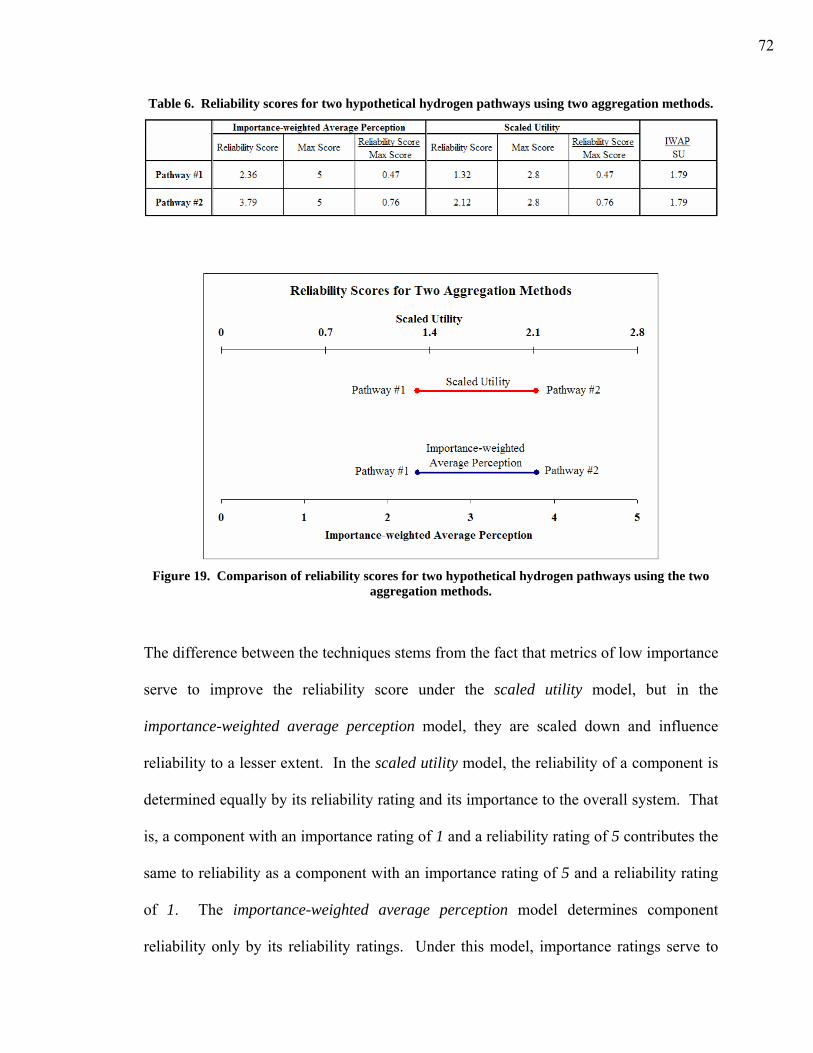
72
Table 6. Reliability scores for two hypothetical hydrogen pathways using two aggregation methods.
Figure 19. Comparison of reliability scores for two hypothetical hydrogen pathways using the two
aggregation methods.
The difference between the techniques stems from the fact that metrics of low importance
serve to improve the reliability score under the scaled utility model, but in the
importance-weighted average perception model, they are scaled down and influence
reliability to a lesser extent. In the scaled utility model, the reliability of a component is
determined equally by its reliability rating and its importance to the overall system. That
is, a component with an importance rating of 1 and a reliability rating of 5 contributes the
same to reliability as a component with an importance rating of 5 and a reliability rating
of 1. The importance-weighted average perception model determines component
reliability only by its reliability ratings. Under this model, importance ratings serve to
73
weight the reliability ratings in terms of their effect on reliability of the system. The
reliability score for the pathway can only be improved by improving the reliability rating
of the component.
The differences in the models may be negligible if the assessment looks only to compare
pathway options, since both produce the same percentage difference between pathways.
But if the reliability scores are to be put on an absolute scale, the differences are no
longer negligible. Careful consideration should be taken when selecting the aggregation
method, to assure the results are portrayed accurately.
9. Compare Reliability Scores across Pathways
Finally, the aggregated reliability scores are compared across pathways to determine
reliable or unreliable aspects. This can be done graphically, numerically, or statistically.
APPLYING THE METHODOLOGY
The methodology was tested using a group of hydrogen researchers from the Institute of
Transportation Studies at the University of California, Davis (ITS-Davis) as the expert
panel. The primary objective was to refine the methodology and identify opportunities
for improvement.
The scope of the assessment and the participation of the panel were limited by time and
logistical constraints. First, only three hours were allotted for the study. In practice,
74
vulnerability or risk assessments involving an expert panel often last multiple days at
workshops.16 Due to time limitations, the definition of hydrogen reliability, the metrics
to value it, and the specification of pathways were established prior to meeting with the
panel. The role of the expert panel was to rate the reliability metrics and provide
feedback on the method. Second, although ITS-Davis arguably boasts one of the largest
and most diverse groups of hydrogen infrastructure researchers in the world, many are
not completely familiar with reliability. An ideal panel would include reliability experts
from all relevant sectors, not just hydrogen. Despite these limitations, the test application
did serve its purpose. It further developed the methodology and brought to light
particular strengths and weaknesses.
Inputs provided to the panel in this assessment were purposefully vague. Certainly, when
considering real systems, the panel should be provided with as much information as
possible to allow an accurate assessment. But due to the limited time during which the
panel was available, descriptions and definitions of reliability, the scope of study, and the
supply and demand scenarios were not specified to the degree desired for an assessment
of real systems.17 For the developmental purposes of this application and the
hypothetical scenarios considered, specific details were not required. In fact, they would
likely not have supplied the experts with extra useful information, and could have biased
the results. Many of the researchers comprising the panel do not have a background in
reliability studies, and may have not been able to translate specific details about a system
16 For example, the U.S. DOE routinely hosts workshops of natural gas industry experts to identify issues with infrastructure reliability and R&D opportunities to address those issues (e.g., U.S. DOE and NETL [2002] and SCNG [2000]). 17 The inputs that were provided to the panel are discussed in the sections that follow, and the written materials provided to the experts appear in Appendix C.
75
into accurate reliability ratings. Consider the example of LNG as a primary energy
system and the metric utilization. If the level of utilization at the LNG import terminal
had been specified, many panel members could have had difficulty translating the
additional information into a reliability rating. It may have not been too difficult had we
specified the degree of utilization to be especially high or low, but doing so could have
biased the results to make LNG look particularly attractive or unattractive. Some
respondents expressed difficulty in rating some metrics without more information, but
providing more would likely not have changed the results significantly. Despite the
vague descriptions provided to the panel, the results from this application provide general
insights into the reliability of the two hydrogen pathways, which might be the most we
can take from the hypothetical scenarios, anyway.
The author assessed the pathways as well, independently from the expert panel. These
are not included in the aggregated results presented here, but are given in Appendix D. A
description is provided for each rating which intends to bring to light reliability issues
that go unnoticed from a simple examination of the ratings and reliability scores.
1. Define Scope of Study and Select Participants
The scope of the study as described to the panel spanned a network of hydrogen refueling
stations in Sacramento (CA), and their upstream supply systems. Participants were 11
graduate students, staff, and faculty researchers within the Hydrogen Pathways Program
at ITS-Davis who volunteered to participate. The process followed Contadini’s first
model. A single modeler (the author) defined reliability, selected metrics to value it, and
76
pathways to consider. The role of the experts was limited to rating the elements, as a
consequence of time limitations.
2. Define Reliability in Hydrogen Energy Systems
The definition of reliability in hydrogen energy systems is adapted from the definition
appearing in literature specific to the electricity sector. There, reliability is defined
generally as the ability to meet consumer requirements, and comprises two concepts:
adequacy and security. Adequacy refers to the ability of system throughput to meet
demand. Security relates to the level of resiliency against disruption. The definitions
cited earlier were slightly modified in this step to yield formal definitions for reliability in
hydrogen systems:
Reliability – The degree to which the performance of the elements of the
system results in hydrogen being delivered to consumers
within accepted standards and in the amount desired
(adapted from the NERC’s definition of reliability, as cited
in: Kirby and Hirst, 2002, p.9).
Adequacy – The ability of the system to supply the requirements of
customers at all times, taking into account reasonably
expected outages in the system (adapted from: NERC,
2002, p.7).
77
Security – The ability of the system to minimize and withstand unexpected
interruptions (adapted from: NERC, 2002, p.7).
These terms do not incorporate all of the elements required in a traditional reliability
definition as described earlier. Specifically, no time frame is given. In many situations,
the specified time frame will influence the assessment significantly. That was not the
case in this application. The metrics described below do not value reliability in a
traditional, statistical sense. Rather, they aim to capture the relative public benefits
between system configurations. If a time frame had been specified, the experts might be
inclined to think in terms of the likelihood of hydrogen systems lasting so long, and the
concepts captured by the metrics could have been obscured.
3. Select Metrics to Value Reliability in Hydrogen Energy Systems
Metrics to value hydrogen reliability were developed by further dissecting the definition
from the concepts of adequacy and security into tangible elements that can be measured.
The metrics used here are broad, and value hydrogen reliability from a societal
perspective (see Figure 20). They do not aim to quantify reliability in a traditional sense,
in terms of the expected performance and lifetime of system components. Rather, they
include wide-ranging concepts pertaining to the availability of hydrogen and the
consequences that could stem from the use of a particular system.
The relationship between the metrics and the adequacy and security categories is shown
in Figure 20. Each element in the figure is discussed below, and defined in Appendix C.
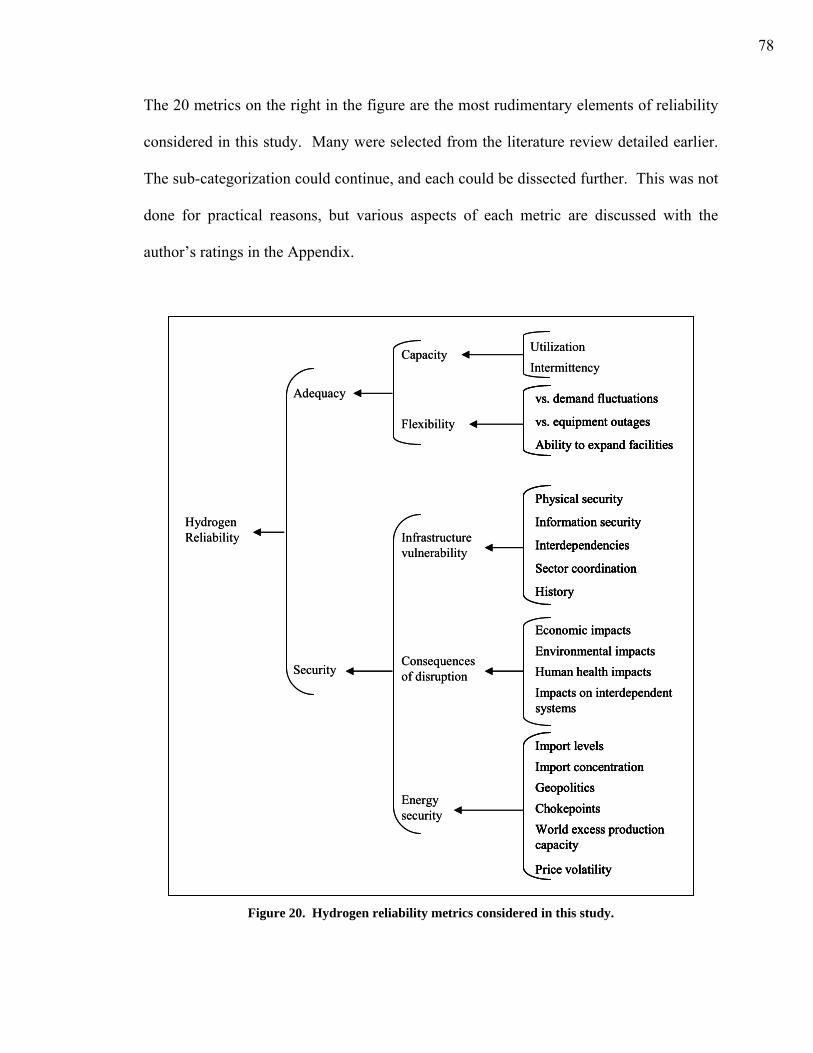
78
The 20 metrics on the right in the figure are the most rudimentary elements of reliability
considered in this study. Many were selected from the literature review detailed earlier.
The sub-categorization could continue, and each could be dissected further. This was not
done for practical reasons, but various aspects of each metric are discussed with the
author’s ratings in the Appendix.
Hydrogen Reliability
Security
Physical security
Information security
Interdependencies
Sector coordination
History
Economic impactsEnvironmental impactsHuman health impactsImpacts on interdependent systems
Import levelsImport concentrationGeopoliticsChokepointsWorld excess production capacity
Price volatility
Infrastructure vulnerability
Consequences of disruption
Energy security
Adequacy
UtilizationIntermittency
vs. demand fluctuations
vs. equipment outages
Ability to expand facilities
Capacity
Flexibility
Hydrogen Reliability
Security
Physical security
Information security
Interdependencies
Sector coordination
History
Physical security
Information security
Interdependencies
Sector coordination
History
Physical security
Information security
Interdependencies
Sector coordination
History
Economic impactsEnvironmental impactsHuman health impactsImpacts on interdependent systems
Economic impactsEnvironmental impactsHuman health impactsImpacts on interdependent systems
Import levelsImport concentrationGeopoliticsChokepointsWorld excess production capacity
Price volatility
Import levelsImport concentrationGeopoliticsChokepointsWorld excess production capacity
Price volatility
Import levelsImport concentrationGeopoliticsChokepointsWorld excess production capacity
Price volatility
Infrastructure vulnerability
Consequences of disruption
Energy security
Adequacy
UtilizationIntermittency
vs. demand fluctuations
vs. equipment outages
Ability to expand facilities
vs. demand fluctuations
vs. equipment outages
Ability to expand facilities
vs. demand fluctuations
vs. equipment outages
Ability to expand facilities
Capacity
Flexibility
Figure 20. Hydrogen reliability metrics considered in this study.
79
Adequacy
The definition of adequacy captures two ideas – capacity and flexibility. Capacity refers
to the ability of the system to produce and transport sufficient quantities of hydrogen to
supply end user demands. It is assigned two metrics:
• Utilization and spare capacity. The degree to which the system is being utilized.
• Intermittency. The degree to which the system lacks constant levels of
productivity.
Flexibility speaks to the second portion of the definition, and refers to the degree to which
the system can adapt to changing conditions. This concept is valued by three metrics:
• Response to demand fluctuations. The extent to which the system is able to adapt
to changes in quantity of hydrogen demanded or location of demand.
• Response to equipment outages. The degree to which the system is able to
continue reliable operation in the event of equipment downtime.
• Ability to expand facilities. The degree to which the system can be easily and
cost-effectively expanded.
Security
Security covers concepts of risk management and supply security of energy resources. It
is valued here by three measures. Risk is typically defined as the product of the
probability of a failure and the consequence of the failure. These concepts are captured
80
with the measures infrastructure vulnerability and consequences of infrastructure
disruption, respectively. Energy security constitutes the third component of security.
Infrastructure vulnerability refers to the degree to which the system is susceptible to
disruption. The following metrics define the concept:
• Physical security. The degree to which physical assets in the system are secure
against threats.
• Information security. The degree to which information assets in the system are
secure against threats.
• Interdependencies. The degree to which the system relies on other infrastructures
for its reliable operation, and is vulnerable to their disruption.
• Sector coordination. The degree to which coordination between stakeholders
within the sector results in an effective exchange of information alerting
stakeholders of emerging threats and mitigation strategies.
• History. The degree to which the system has been prone to disruption in the past.
Consequences of infrastructure disruption gauges the degree to which a disruption in the
system could cause harm. It is measured in terms of four metrics:
• Economic impacts. The degree to which a disruption in the system might cause
economic damage to industry stakeholders, the government, or the public.
81
• Environmental impacts. The degree to which a disruption in the system might
cause environmental damage.
• Human health impacts. The degree to which a disruption in the system might
harm the health of employees and/or the public.
• Impacts on interdependent systems. The degree to which a disruption in the
system might cause damage to interdependent systems.
Finally, energy security refers to the degree to which the primary energy system is secure
against threats to global supply infrastructure. It includes the following metrics:
• Import levels. The degree to which the primary energy supply relies on resources
originating outside of the U.S.
• Import concentration. The degree to which imports are concentrated among a
small group of supplying countries.
• Geopolitics. The degree to which political and social conditions in primary
energy-exporting countries threaten the supply of energy resources to the U.S.
• Chokepoints. The degree to which imported primary energy resources are
vulnerable to disruptions in narrow shipping lanes.
• World excess production capacity. The degree to which excess production
capacity exists in the global market and provides flexibility against demand
fluctuations and supply outages.
• Price volatility. The degree of fluctuation in the average price of primary energy.
82
4. Specify Hydrogen Energy Systems to Evaluate
The demand scenario under which the pathways operate was defined as “a network of
hydrogen refueling stations” in Sacramento (see Appendix C). No parameter regarding
demand volume, demand profile, or geographical distribution of the refueling stations
was specified. Some information regarding end use and time frame was implied in the
description, but no details were given. Transportation applications are suggested as the
end use, but no consideration was given to the requirements of the end user or reliability
at the refueling stations. Also, the experts were asked to evaluate reliability in terms of
their knowledge of the systems and environmental, political, and social conditions today.
This suggests a near-term time frame, though again, none was specified.
Two pathways were assessed. Pathway #1 relies on hydrogen produced centrally via
steam reformation of imported LNG and distribution of hydrogen by pipeline. LNG
supplies come primarily from Trinidad and Tobago, but also from Alaska, Australia,
Indonesia, Malaysia, and trace amounts from the Middle Eastern states of Qatar and the
United Arab Emirates. In Pathway #2, hydrogen is produced at its point of end use via
electrolysis of water using electricity produced independently from the electric grid from
locally available renewable energy resources. No transport of hydrogen from offsite is
needed in this pathway.
The pathways were defined vaguely, and selected to capture general reliability concerns
surrounding two apparently disparate hydrogen supply options. The intention was to
83
learn generally about comparative advantages and disadvantages between primary energy
feedstocks, and between centralized and distributed systems.
5. Develop Evaluation Matrix
The evaluation matrix summarizes all of the information obtained in the study, and
relates the metrics selected and their importance to the pathways defined. The evaluation
matrix used here is shown in Figure 21. The pathway components are listed across the
top of the matrix, and the metrics are listed down the side. The metrics are separated
according to the two subcategories of adequacy, and the three subcategories of security.
The evaluation matrix provides a useful visual to compare reliability ratings across
pathway components. The aggregated reliability scores are also depicted, in the darkly
shaded regions.
It is fitting here to introduce nomenclature that will be used in the remainder of this
discussion. Although words such as “component” and “element” have been used
somewhat loosely before, they now take on more concrete meanings:
• Category. The two aspects of hydrogen reliability – adequacy and security.
• Subcategory. The five aspects of adequacy and security –capacity, flexibility,
infrastructure vulnerability, consequence of infrastructure disruption, and energy
security.
• Metric. The aspects of the subcategories which are rated.
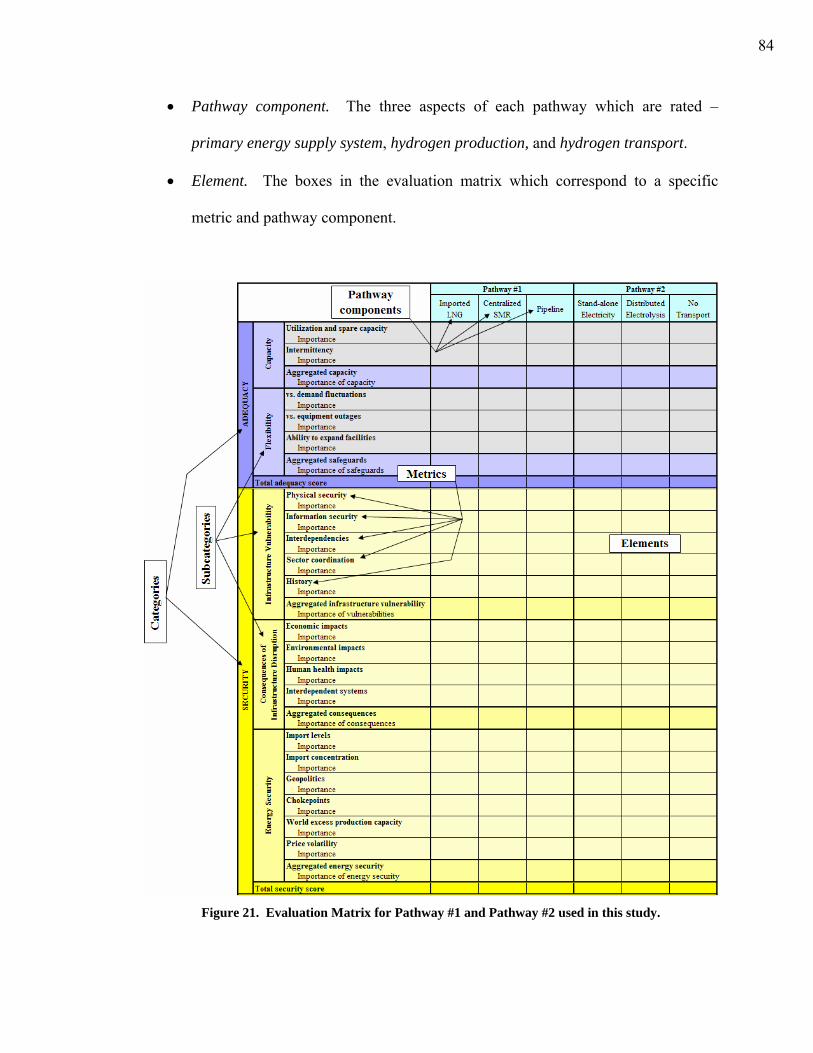
84
• Pathway component. The three aspects of each pathway which are rated –
primary energy supply system, hydrogen production, and hydrogen transport.
• Element. The boxes in the evaluation matrix which correspond to a specific
metric and pathway component.
Figure 21. Evaluation Matrix for Pathway #1 and Pathway #2 used in this study.
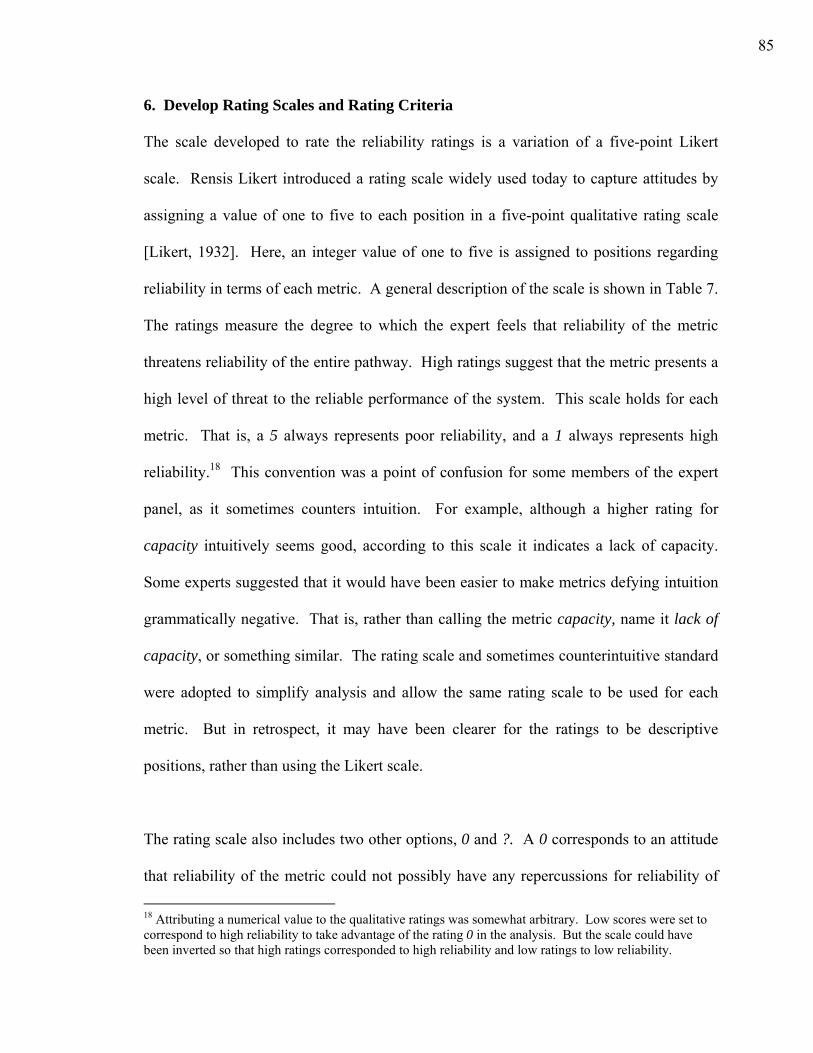
85
6. Develop Rating Scales and Rating Criteria
The scale developed to rate the reliability ratings is a variation of a five-point Likert
scale. Rensis Likert introduced a rating scale widely used today to capture attitudes by
assigning a value of one to five to each position in a five-point qualitative rating scale
[Likert, 1932]. Here, an integer value of one to five is assigned to positions regarding
reliability in terms of each metric. A general description of the scale is shown in Table 7.
The ratings measure the degree to which the expert feels that reliability of the metric
threatens reliability of the entire pathway. High ratings suggest that the metric presents a
high level of threat to the reliable performance of the system. This scale holds for each
metric. That is, a 5 always represents poor reliability, and a 1 always represents high
reliability.18 This convention was a point of confusion for some members of the expert
panel, as it sometimes counters intuition. For example, although a higher rating for
capacity intuitively seems good, according to this scale it indicates a lack of capacity.
Some experts suggested that it would have been easier to make metrics defying intuition
grammatically negative. That is, rather than calling the metric capacity, name it lack of
capacity, or something similar. The rating scale and sometimes counterintuitive standard
were adopted to simplify analysis and allow the same rating scale to be used for each
metric. But in retrospect, it may have been clearer for the ratings to be descriptive
positions, rather than using the Likert scale.
The rating scale also includes two other options, 0 and ?. A 0 corresponds to an attitude
that reliability of the metric could not possibly have any repercussions for reliability of
18 Attributing a numerical value to the qualitative ratings was somewhat arbitrary. Low scores were set to correspond to high reliability to take advantage of the rating 0 in the analysis. But the scale could have been inverted so that high ratings corresponded to high reliability and low ratings to low reliability.
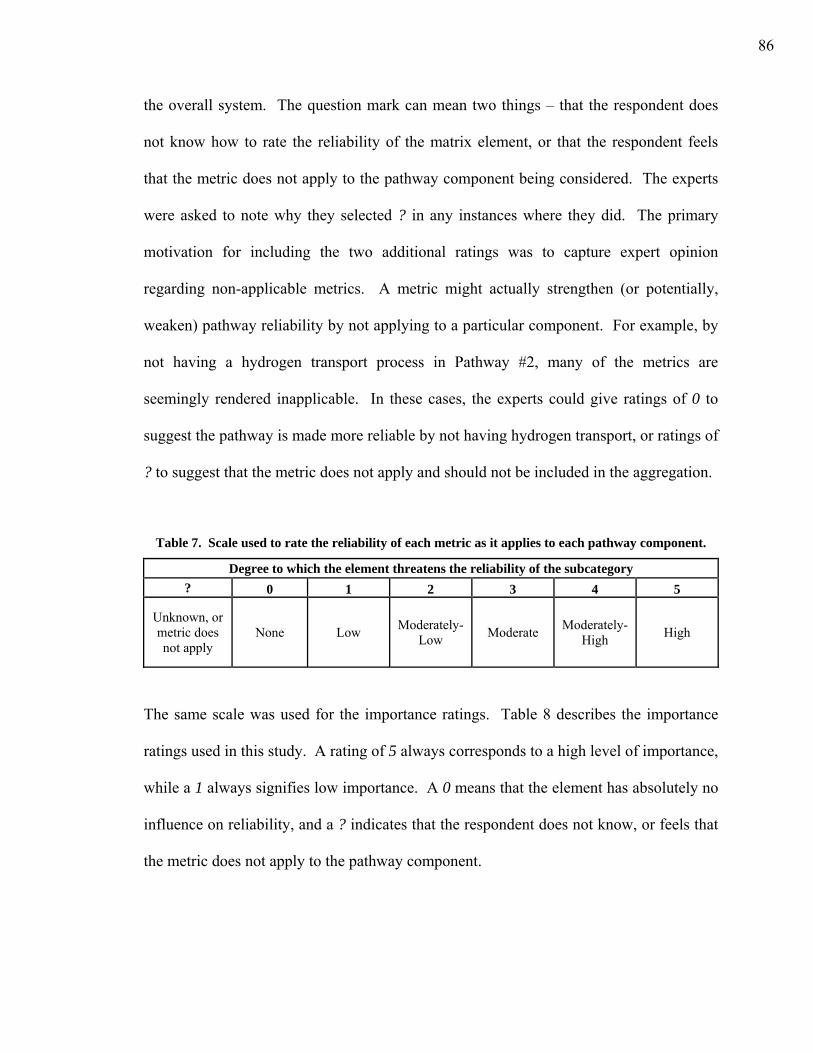
86
the overall system. The question mark can mean two things – that the respondent does
not know how to rate the reliability of the matrix element, or that the respondent feels
that the metric does not apply to the pathway component being considered. The experts
were asked to note why they selected ? in any instances where they did. The primary
motivation for including the two additional ratings was to capture expert opinion
regarding non-applicable metrics. A metric might actually strengthen (or potentially,
weaken) pathway reliability by not applying to a particular component. For example, by
not having a hydrogen transport process in Pathway #2, many of the metrics are
seemingly rendered inapplicable. In these cases, the experts could give ratings of 0 to
suggest the pathway is made more reliable by not having hydrogen transport, or ratings of
? to suggest that the metric does not apply and should not be included in the aggregation.
Table 7. Scale used to rate the reliability of each metric as it applies to each pathway component.
Degree to which the element threatens the reliability of the subcategory ? 0 1 2 3 4 5
Unknown, or metric does not apply
None Low Moderately-Low Moderate Moderately-
High High
The same scale was used for the importance ratings. Table 8 describes the importance
ratings used in this study. A rating of 5 always corresponds to a high level of importance,
while a 1 always signifies low importance. A 0 means that the element has absolutely no
influence on reliability, and a ? indicates that the respondent does not know, or feels that
the metric does not apply to the pathway component.
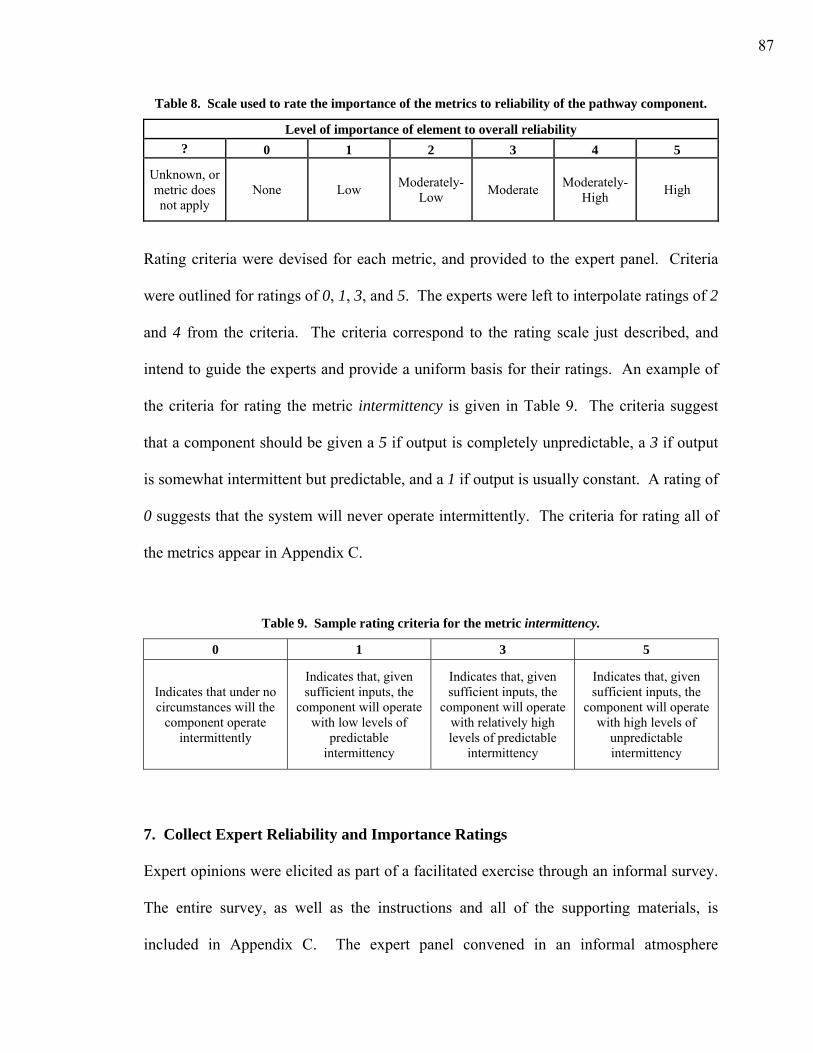
87
Table 8. Scale used to rate the importance of the metrics to reliability of the pathway component.
Level of importance of element to overall reliability ? 0 1 2 3 4 5
Unknown, or metric does not apply
None Low Moderately-Low Moderate Moderately-
High High
Rating criteria were devised for each metric, and provided to the expert panel. Criteria
were outlined for ratings of 0, 1, 3, and 5. The experts were left to interpolate ratings of 2
and 4 from the criteria. The criteria correspond to the rating scale just described, and
intend to guide the experts and provide a uniform basis for their ratings. An example of
the criteria for rating the metric intermittency is given in Table 9. The criteria suggest
that a component should be given a 5 if output is completely unpredictable, a 3 if output
is somewhat intermittent but predictable, and a 1 if output is usually constant. A rating of
0 suggests that the system will never operate intermittently. The criteria for rating all of
the metrics appear in Appendix C.
Table 9. Sample rating criteria for the metric intermittency.
0 1 3 5
Indicates that under no circumstances will the
component operate intermittently
Indicates that, given sufficient inputs, the
component will operate with low levels of
predictable intermittency
Indicates that, given sufficient inputs, the
component will operate with relatively high levels of predictable
intermittency
Indicates that, given sufficient inputs, the
component will operate with high levels of
unpredictable intermittency
7. Collect Expert Reliability and Importance Ratings
Expert opinions were elicited as part of a facilitated exercise through an informal survey.
The entire survey, as well as the instructions and all of the supporting materials, is
included in Appendix C. The expert panel convened in an informal atmosphere
88
encouraging questions and discussion. A brief overview of the research and the
methodology was given. The panel was incrementally walked through the rating
procedure using an unrelated example – milk supply pathways – and was asked to rate
the elements in turn. The example incorporated the same subcategories, metrics and
pathway components as the hydrogen case. Cows constituted the primary supply system,
milk processing at the dairy was the production process, and delivery via trucks served as
the milk transport process.
The exercise was divided into two sections to reduce the stress on the experts and keep
the objectives and considerations discussed in the example fresh in their minds. First, the
experts were walked through the importance ratings for the milk supply pathway, and
asked for importance ratings for the two hydrogen pathways. The same was done for the
reliability ratings. Since the importance ratings are to be uniform across all pathways,
they were ascertained first. This was done to prevent consideration of the reliability of
specific pathways from influencing the ratings for the importance of the metrics to
hydrogen reliability generally. To this end, the importance ratings were considered only
in terms of the general pathway sub-processes: primary energy system, hydrogen
production process, and hydrogen transport process. Specific components of Pathways
#1 and #2 (e.g., hydrogen pipelines vs. onsite utilization) were introduced after the panel
had rated importance.
The experts were asked to rate the importance of two relationships in the matrix. First,
they rated the importance of each metric as it applied to reliability of its subcategory. For

89
example, the importance of utilization and spare capacity and intermittency was rated as
it pertains to the reliability of the subcategory capacity. Next, the experts rated the
importance of each subcategory to overall reliability. These ratings were to be
completely independent of the former ratings. Thus, it is possible for an expert to rate
every metric under a particular subcategory very low, while rating the importance of the
subcategory very high (this would suggest that the metrics were poorly chosen, however).
This dichotomous scheme was adopted in order to allow the inclusion of less important
metrics in subcategories of high importance to overall reliability. If the experts only
rated the importance of the metrics, those thought to be less important to reliability of the
subcategory might artificially lower the perceived importance of the subcategory to
overall reliability.
The importance of the metrics was ascertained prior to that of the subcategories to
prevent thoughts about the subcategory from influencing the importance ratings of the
metrics. In the end, pathway reliability is ultimately determined by the reliability of the
subcategories. The metrics serve to determine reliability of the subcategories. The
importance ratings have no reach beyond weighting the influence of the various metrics
on reliability of the subcategory, and should not be skewed by thoughts regarding the
importance of the subcategory to overall reliability.
The importance rating portion of the survey contained six questions. The first five asked
for the importance of the metrics pertaining to the five subcategories. The last question
asked for the importance of the subcategories to overall reliability. The importance of
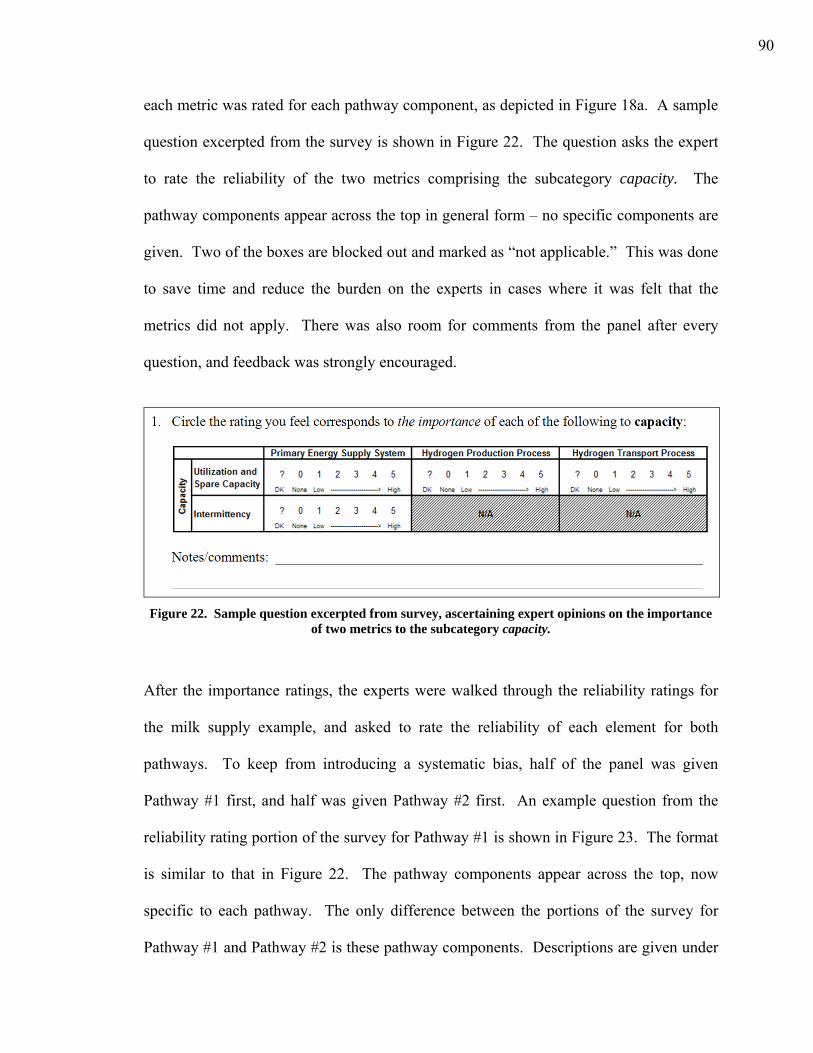
90
each metric was rated for each pathway component, as depicted in Figure 18a. A sample
question excerpted from the survey is shown in Figure 22. The question asks the expert
to rate the reliability of the two metrics comprising the subcategory capacity. The
pathway components appear across the top in general form – no specific components are
given. Two of the boxes are blocked out and marked as “not applicable.” This was done
to save time and reduce the burden on the experts in cases where it was felt that the
metrics did not apply. There was also room for comments from the panel after every
question, and feedback was strongly encouraged.
Figure 22. Sample question excerpted from survey, ascertaining expert opinions on the importance
of two metrics to the subcategory capacity.
After the importance ratings, the experts were walked through the reliability ratings for
the milk supply example, and asked to rate the reliability of each element for both
pathways. To keep from introducing a systematic bias, half of the panel was given
Pathway #1 first, and half was given Pathway #2 first. An example question from the
reliability rating portion of the survey for Pathway #1 is shown in Figure 23. The format
is similar to that in Figure 22. The pathway components appear across the top, now
specific to each pathway. The only difference between the portions of the survey for
Pathway #1 and Pathway #2 is these pathway components. Descriptions are given under
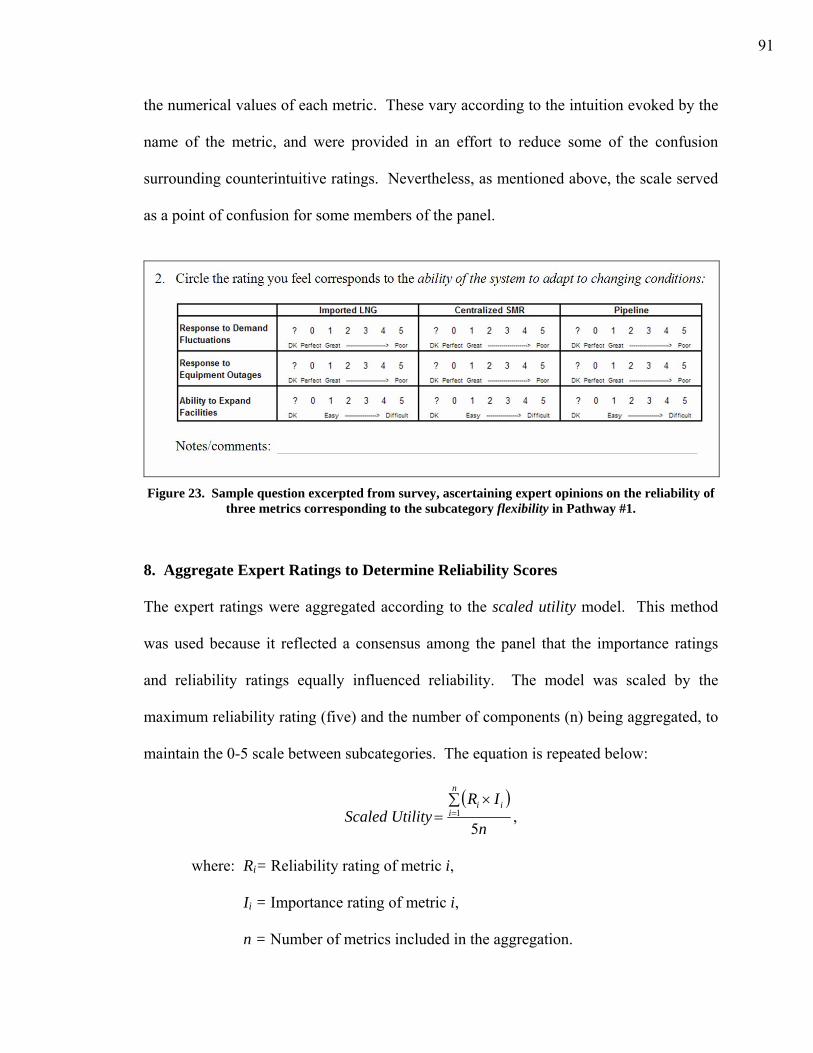
91
the numerical values of each metric. These vary according to the intuition evoked by the
name of the metric, and were provided in an effort to reduce some of the confusion
surrounding counterintuitive ratings. Nevertheless, as mentioned above, the scale served
as a point of confusion for some members of the panel.
Figure 23. Sample question excerpted from survey, ascertaining expert opinions on the reliability of
three metrics corresponding to the subcategory flexibility in Pathway #1.
8. Aggregate Expert Ratings to Determine Reliability Scores
The expert ratings were aggregated according to the scaled utility model. This method
was used because it reflected a consensus among the panel that the importance ratings
and reliability ratings equally influenced reliability. The model was scaled by the
maximum reliability rating (five) and the number of components (n) being aggregated, to
maintain the 0-5 scale between subcategories. The equation is repeated below:
Scaled Utility( )
n
IRn
iii
51∑ ×
= = ,
where: Ri= Reliability rating of metric i,
Ii = Importance rating of metric i,
n = Number of metrics included in the aggregation.
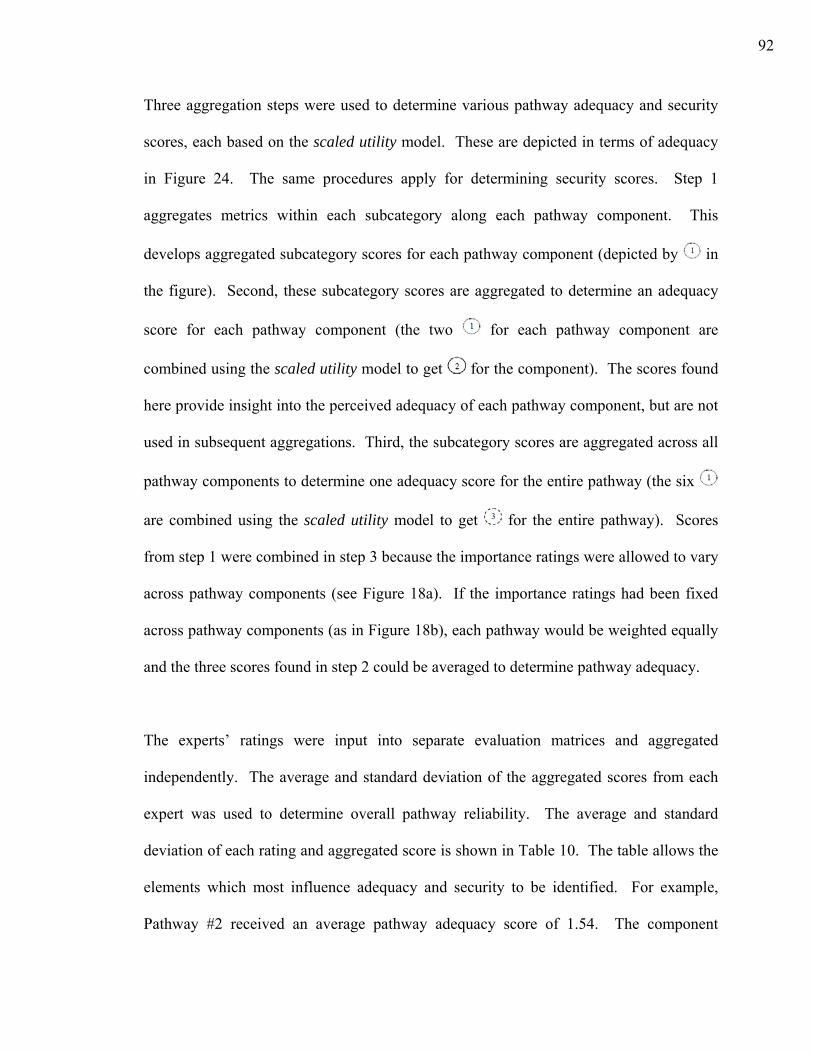
92
Three aggregation steps were used to determine various pathway adequacy and security
scores, each based on the scaled utility model. These are depicted in terms of adequacy
in Figure 24. The same procedures apply for determining security scores. Step 1
aggregates metrics within each subcategory along each pathway component. This
develops aggregated subcategory scores for each pathway component (depicted by in
the figure). Second, these subcategory scores are aggregated to determine an adequacy
score for each pathway component (the two for each pathway component are
combined using the scaled utility model to get for the component). The scores found
here provide insight into the perceived adequacy of each pathway component, but are not
used in subsequent aggregations. Third, the subcategory scores are aggregated across all
pathway components to determine one adequacy score for the entire pathway (the six
are combined using the scaled utility model to get for the entire pathway). Scores
from step 1 were combined in step 3 because the importance ratings were allowed to vary
across pathway components (see Figure 18a). If the importance ratings had been fixed
across pathway components (as in Figure 18b), each pathway would be weighted equally
and the three scores found in step 2 could be averaged to determine pathway adequacy.
The experts’ ratings were input into separate evaluation matrices and aggregated
independently. The average and standard deviation of the aggregated scores from each
expert was used to determine overall pathway reliability. The average and standard
deviation of each rating and aggregated score is shown in Table 10. The table allows the
elements which most influence adequacy and security to be identified. For example,
Pathway #2 received an average pathway adequacy score of 1.54. The component
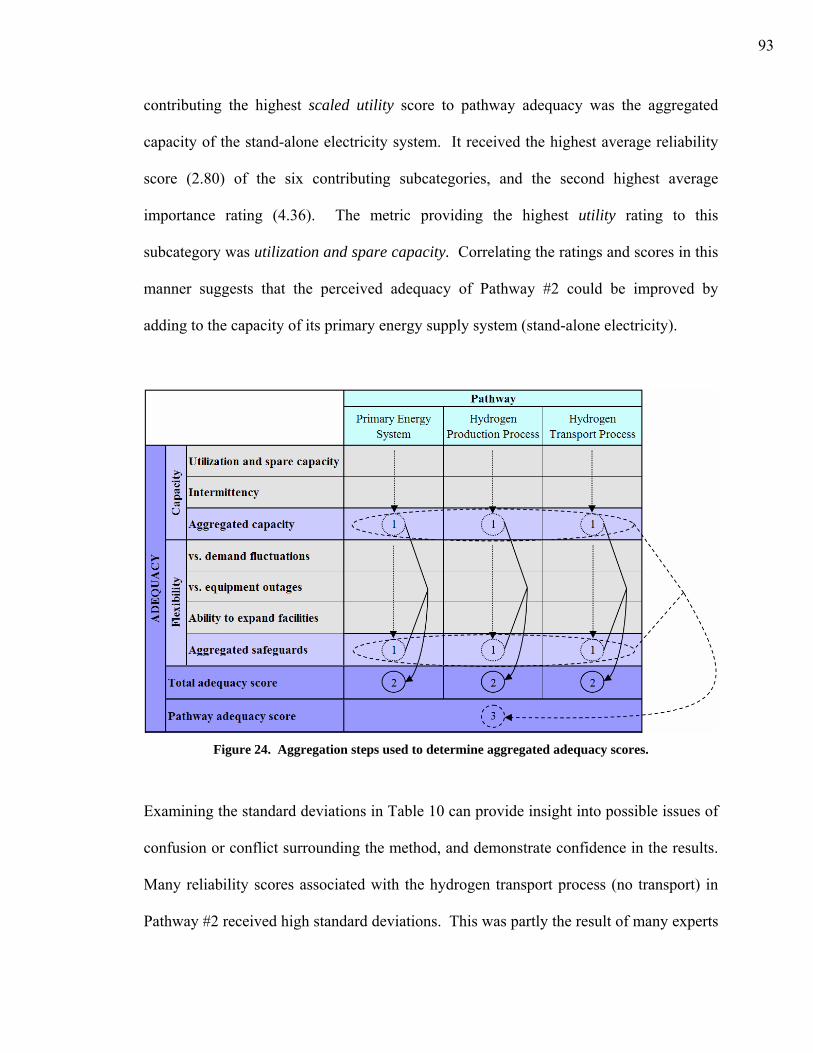
93
contributing the highest scaled utility score to pathway adequacy was the aggregated
capacity of the stand-alone electricity system. It received the highest average reliability
score (2.80) of the six contributing subcategories, and the second highest average
importance rating (4.36). The metric providing the highest utility rating to this
subcategory was utilization and spare capacity. Correlating the ratings and scores in this
manner suggests that the perceived adequacy of Pathway #2 could be improved by
adding to the capacity of its primary energy supply system (stand-alone electricity).
Figure 24. Aggregation steps used to determine aggregated adequacy scores.
Examining the standard deviations in Table 10 can provide insight into possible issues of
confusion or conflict surrounding the method, and demonstrate confidence in the results.
Many reliability scores associated with the hydrogen transport process (no transport) in
Pathway #2 received high standard deviations. This was partly the result of many experts
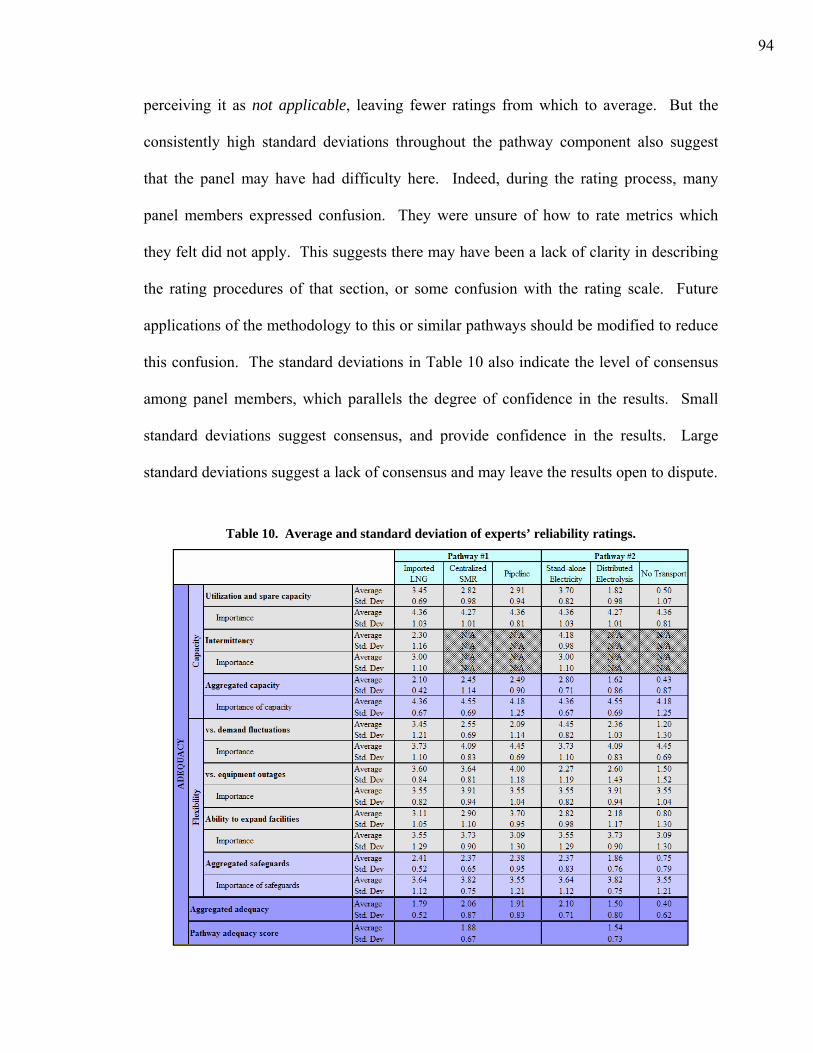
94
perceiving it as not applicable, leaving fewer ratings from which to average. But the
consistently high standard deviations throughout the pathway component also suggest
that the panel may have had difficulty here. Indeed, during the rating process, many
panel members expressed confusion. They were unsure of how to rate metrics which
they felt did not apply. This suggests there may have been a lack of clarity in describing
the rating procedures of that section, or some confusion with the rating scale. Future
applications of the methodology to this or similar pathways should be modified to reduce
this confusion. The standard deviations in Table 10 also indicate the level of consensus
among panel members, which parallels the degree of confidence in the results. Small
standard deviations suggest consensus, and provide confidence in the results. Large
standard deviations suggest a lack of consensus and may leave the results open to dispute.
Table 10. Average and standard deviation of experts’ reliability ratings.
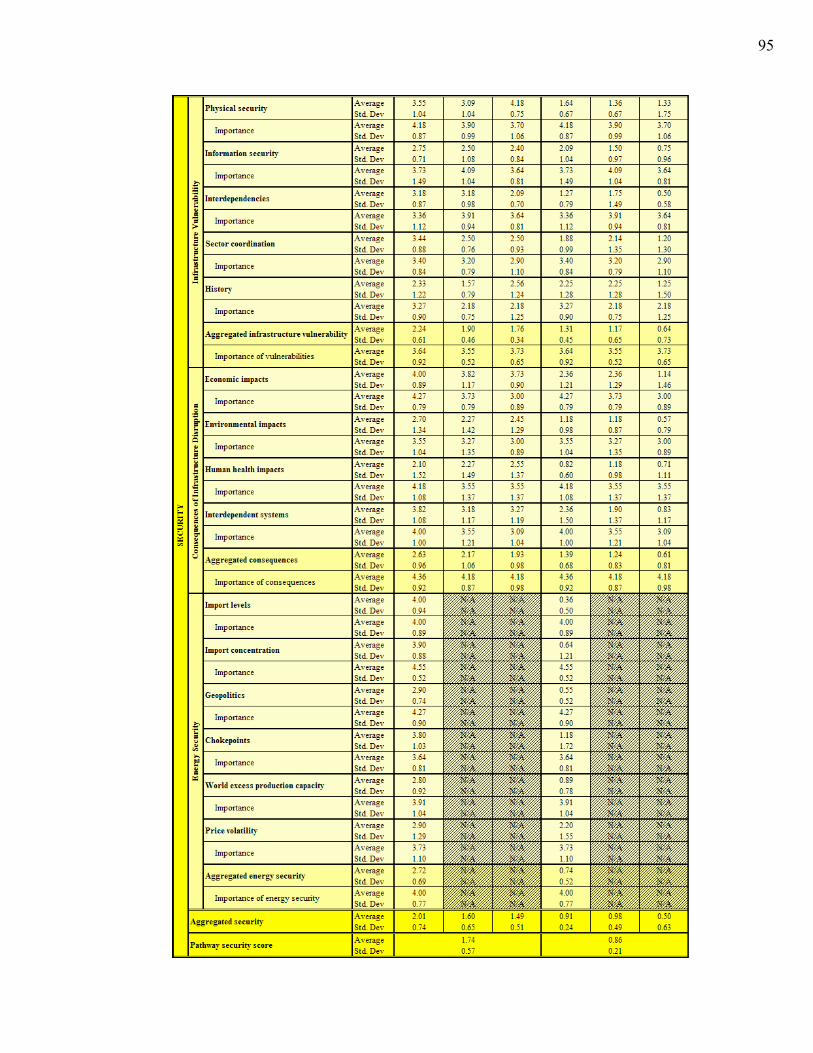
95
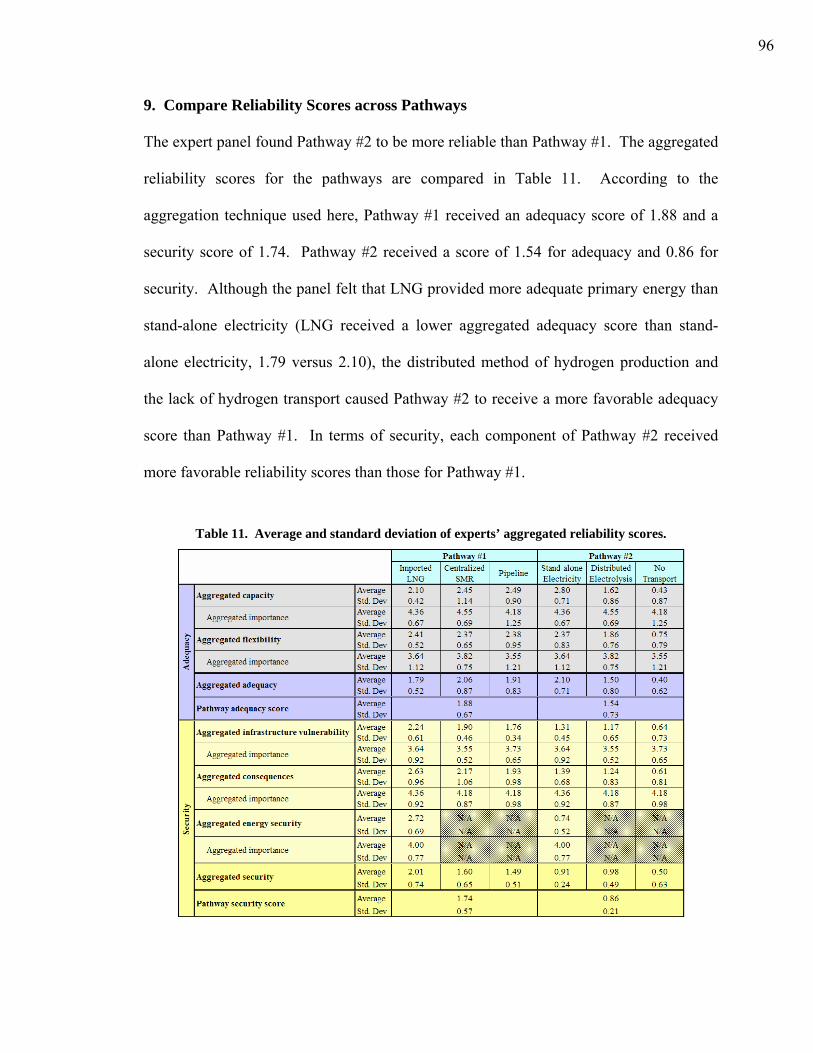
96
9. Compare Reliability Scores across Pathways
The expert panel found Pathway #2 to be more reliable than Pathway #1. The aggregated
reliability scores for the pathways are compared in Table 11. According to the
aggregation technique used here, Pathway #1 received an adequacy score of 1.88 and a
security score of 1.74. Pathway #2 received a score of 1.54 for adequacy and 0.86 for
security. Although the panel felt that LNG provided more adequate primary energy than
stand-alone electricity (LNG received a lower aggregated adequacy score than stand-
alone electricity, 1.79 versus 2.10), the distributed method of hydrogen production and
the lack of hydrogen transport caused Pathway #2 to receive a more favorable adequacy
score than Pathway #1. In terms of security, each component of Pathway #2 received
more favorable reliability scores than those for Pathway #1.
Table 11. Average and standard deviation of experts’ aggregated reliability scores.
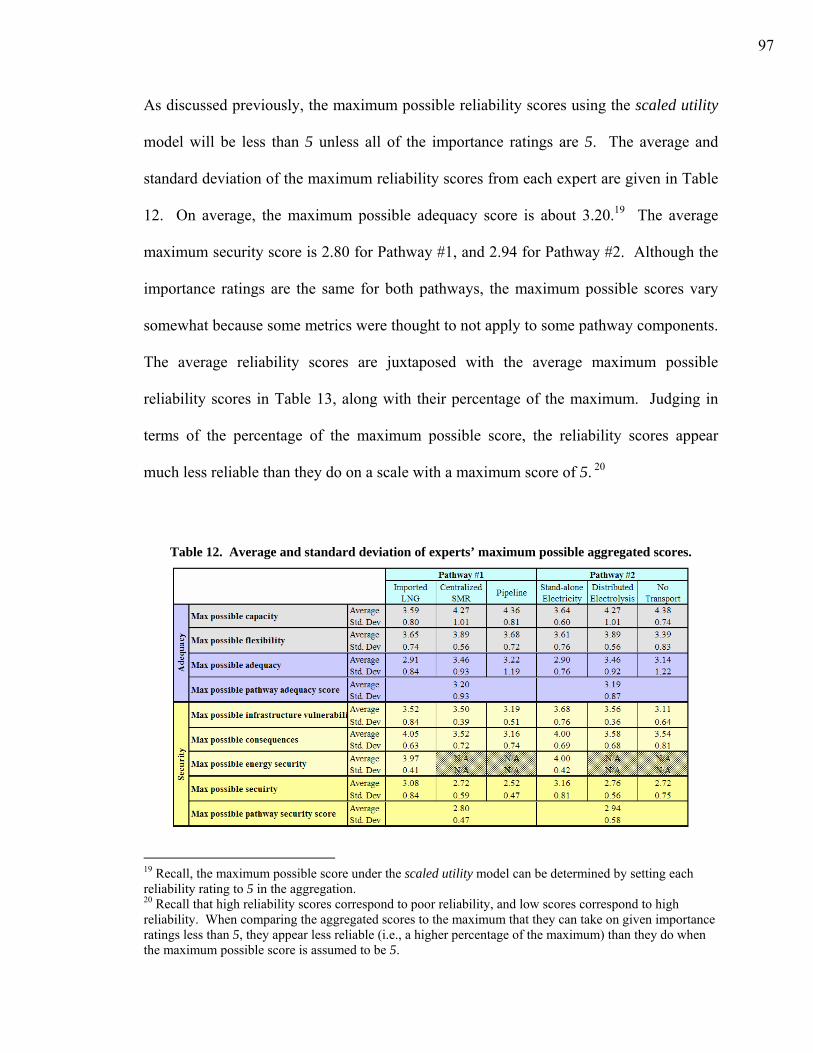
97
As discussed previously, the maximum possible reliability scores using the scaled utility
model will be less than 5 unless all of the importance ratings are 5. The average and
standard deviation of the maximum reliability scores from each expert are given in Table
12. On average, the maximum possible adequacy score is about 3.20.19 The average
maximum security score is 2.80 for Pathway #1, and 2.94 for Pathway #2. Although the
importance ratings are the same for both pathways, the maximum possible scores vary
somewhat because some metrics were thought to not apply to some pathway components.
The average reliability scores are juxtaposed with the average maximum possible
reliability scores in Table 13, along with their percentage of the maximum. Judging in
terms of the percentage of the maximum possible score, the reliability scores appear
much less reliable than they do on a scale with a maximum score of 5. 20
Table 12. Average and standard deviation of experts’ maximum possible aggregated scores.
19 Recall, the maximum possible score under the scaled utility model can be determined by setting each reliability rating to 5 in the aggregation. 20 Recall that high reliability scores correspond to poor reliability, and low scores correspond to high reliability. When comparing the aggregated scores to the maximum that they can take on given importance ratings less than 5, they appear less reliable (i.e., a higher percentage of the maximum) than they do when the maximum possible score is assumed to be 5.
98
Table 13. Aggregated reliability scores showing percentage of maximum score possible.
The reliability of the two pathways is compared graphically in Figure 25. The maximum
possible adequacy and security scores are shown by the vertical and horizontal lines,
respectively.21 The bars emanating from the reliability points represent the standard
deviation of the expert responses. It can be seen that there is a relatively small standard
deviation for security in Pathway #2. That signifies a general consensus among the
expert panel on the level of security provided by Pathway #2.
21 The horizontal line in Figure 4.6 is the average of the two maximum possible security scores (i.e., 2.87).
99
Pathway Comparison
0.00
1.67
3.33
5.00
0.00 1.67 3.33 5.00Good Moderate Poor
Adequacy Rating
Secu
rity
Rat
ing
Goo
d
Mod
erat
e
Poo
r
Centralized SMR Distributed Electrolysis
Figure 25. Comparison of adequacy and security scores for Pathways #1 and #2 (unscaled).
Both pathways appear quite reliable in Figure 25. If the scales are divided into thirds to
represent qualitative reliability descriptions of good, moderate, and poor, the adequacy
and security of both pathways appear to be good or moderately-good. But if the
adequacy and security scales are adjusted in terms of their maximum possible scores, a
different representation emerges. The reliability of the two pathways is compared
graphically again in Figure 26. This figure may be more indicative of the reliability of
each pathway on an absolute scale. Here, the previous figure has been cropped at the
lines for the maximum possible adequacy and security scores, and the qualitative
descriptions have been adjusted accordingly. The reliability of both pathways appears
100
worse than in Figure 25. The adequacy of both pathways is now moderate, and security
is moderately-poor in Pathway #1, and only moderately-good in Pathway #2.
Pathway Comparison
0.00
0.96
1.91
2.87
0.00 1.07 2.13 3.20Good Moderate Poor
Adequacy Score
Secu
rity
Sco
re
Goo
d
Mod
erat
e
Poor
Centralized SMR Distributed Electrolysis
Figure 26. Comparison of adequacy and security scores for Pathways #1 and #2 (scaled according to
maximum possible reliability scores).
Although uncertainty surrounds the placement of the pathways on an absolute scale,
conclusions can still be made on a comparative basis. The scores here suggest reliability
gains to be had in hydrogen energy systems by moving to distributed production and
limiting hydrogen transport. These attributes of Pathway #2 appear more reliable than
the hydrogen production and transport schemes used in Pathway #1, both in terms of
adequacy and security. LNG appears to be a more reliable primary energy supply system
101
in terms of adequacy than stand-alone electricity systems. But, the stand-alone electricity
system was determined to be much more secure than the LNG system.
The results and conclusions from this preliminary application are not definitive. They are
included to demonstrate the methodology and the information that might be gleaned from
its application. Certainly, results from the assessment are interesting and indicative of
perceived reliability, but their significance should not be overstated, nor the primary
motivation of this test application be obfuscated.
CONCLUSIONS
This research describes a method to compare the reliability of hydrogen supply options
for use in transportation applications. The methodology was tried using two distinct
hydrogen pathways: one considering large, centralized processes and relying on
imported energy resources, the other using small, distributed processes and locally
available energy resources. A panel of 11 hydrogen researchers from ITS-Davis rated the
reliability of the two pathways in terms of several metrics. The ratings were combined to
determine broad reliability scores that were compared across the two pathways. The
aggregated scores suggest that distributed production and onsite utilization are more
reliable – both in terms of adequacy and security – than centralized production and
pipeline transport. Grid-independent electricity was determined to be a much more
secure primary energy supply system than imported LNG, but was found to be somewhat
less reliable in terms of adequacy, mostly due to potential intermittency in the system.
102
The application described here was primarily intended to test the methodology. Limited
resources were available for the assessment, and the results are only preliminary. If the
pathways were assessed again – perhaps using a larger panel composed of experts from
diverse backgrounds, and allowing the panel more time and involvement in the process –
different findings might surface.
Lessons Learned from Trial Application
The trial run of the methodology revealed points of confusion and opportunities to
improve the method. Some noteworthy lessons learned include:
• The three hours allotted for the study were not enough to fully describe the
methodology and involve the expert panel to the degree desired. As it was, the
panel had just enough time to rate the reliability and importance of the 20 metrics
for both pathways. If more discussion or input from the panel was desired, or
more pathways or metrics considered, much more time would be needed. Also, to
rate more than 200 items in three hours places a toll on the panel which might
lead its members to rush through the rating process. Additional time might allow
more relaxed and thoughtful consideration of each rating.
• Some panel members expressed difficulty delineating the importance of the
metrics between pathway components. Many suggested it would have been easier
to only rate the importance once for each metric, as illustrated in Figure 18b.
Presumably, experts with perfect knowledge would not have this problem, and
103
this complaint might reflect a lack of expertise (although not necessarily).
Whether the case or not, future applications of the methodology should give
greater consideration to the importance ratings. The value of the extra degree of
specificity should be weighed against the added burden placed on the experts and
the difficulty in distinguishing the importance in terms of the pathway
components. The selection of the technique might ultimately depend on the
composition and knowledge of the panel.
• It was suggested that metrics within the subcategory consequences of
infrastructure disruption related to importance, rather than reliability. In
retrospect, this appears true, and this subcategory should not be included in future
applications as is. It may be desirable to capture the four dimensions of
consequence described by the metrics, but this should be done in the importance
ratings associated with infrastructure vulnerabilities, rather than with the
reliability metrics.
• Many panel members expressed difficulty rating the reliability of the elements
without more information. As discussed previously, the amount of information to
provide to the panel was considered prior to administering the survey. Many
specific details were omitted due to time constraints and the cursory nature of this
preliminary application. But when assessing real systems, all relevant
information known about the system and end user requirements should certainly
be provided.
104
• The rating scale used was confusing, and should probably be modified in
subsequent applications of the methodology. Some panel members expressed
difficulty in distinguishing between ratings on a five-point scale, and suggested
only using three points. Many panelists also had difficulty understanding that a
high score (e.g., a 5) always corresponded to poor reliability. They indicated that
it would have been clearer to make the confusing metrics grammatically negative.
For example, if metrics such as utilization and spare capacity or physical security
– where a high score intuitively seems good – were titled lack of spare capacity or
lack of physical security, there may have been less confusion. But rating a lack of
something seems confusing as well. The panel also expressed confusion with the
double meaning of the rating ?, and the difference between ratings of zero and not
applicable. It was suggested that all be lumped into one rating of 0 or N/A.
Delineating between 0 and N/A was initially thought desirable to account for
conditions under which reliability was improved by a metric not applying (e.g., a
pathway using no imported energy is seemingly made more reliable than one that
does, even if the metric imports is thought not to apply). But judging from the
standard deviations in the ratings of elements where such differentiations might
occur, and from the confusion expressed by the panel, the benefits of such a scale
may not be worth the added uncertainty. Perhaps it would least confusing to
replace the 1-5 scale with qualitative descriptions (e.g., high reliability,
moderately-high reliability, moderate reliability, moderately-low reliability, and
low reliability) and offer an additional rating of N/A. Regardless, the selection
105
and naming of the metrics should be carefully considered in terms of the rating
scale.
• The rating criteria were not uniform across rows. That is, if a metric received a
rating of 2 for one pathway component and 3 for another, it cannot be concluded
that the latter is less reliable. This is a consequence of the qualitative nature of
the rating criteria, and might not be possible to resolve. The metrics would each
have to be judged similarly (e.g., in dollar figures), which might constrain the
assessment.
• It might be beneficial to add confidence ratings to the assessment process. They
would reflect the degree to which the experts are confident in their ratings of each
metric (or element). It could be especially valuable with a diverse expert panel.
The ratings of experts with better knowledge about a particular element would be
weighted more heavily, possibly generating more accurate results. But
confidence ratings add more time and complexity to the rating process, and
increase the burden on the expert panel.
• The methodology is limited by understanding of the supply systems and demand
scenarios. Experts can rate reliability more accurately if specific details regarding
the pathways and metrics are known. Although some metrics apply in existing
energy systems and are relatively well understood, it is difficult to rate others in
these essentially non-existent systems without additional information.
106
Opportunities for Future Research
This work represents the first systematic investigation of hydrogen reliability. The
methodology provides an effective way to consider reliability in hydrogen energy
systems, and an opportunity to compare reliability across energy sectors. Although this
research effectively introduces many issues and methods to evaluate them, it only touches
the surface of this enormous subject. Ultimately, the goal is to compare the reliability of
hydrogen systems to existing gasoline systems, but a great deal of work is needed before
we fully understand hydrogen reliability and can make those comparisons. Among the
many research opportunities that emerged from this discussion are:
• The methodology should be continually tested and applied under different
situations. Several aspects can be varied to further the methodology and advance
understanding of reliability in hydrogen systems. These include the metrics and
pathways being assessed, the composition and role of the expert panel, and the
aggregation techniques used to determine final pathway reliability. A broad
selection of stakeholders representing diverse viewpoints should be consulted and
their thoughts and suggestions incorporated.
• A fourth pathway component for end use can be incorporated into the analysis.
End use considerations include: compression and liquefaction, pressure, purity,
and vulnerabilities and consequences at refueling stations. Whether or not
107
reliability at hydrogen refueling stations will differ from gasoline stations
deserves investigation.
• Further research is needed regarding the rating scales and criteria. The
development of an absolute scale to allow comparisons to be made between
pathway components and general conclusions to be drawn from the reliability
scores on a fixed basis (rather than just comparative conclusions between
pathways) is desirable. But such a scale might require quantification of the rating
criteria, which is difficult in this developmental stage of the technology and could
limit the selection of the metrics.
• Aggregation techniques should be studied in greater quantity and detail. The
aggregation method has profound implications for the final reliability scores, and
should not be overlooked. New techniques should be investigated, and a greater
understanding of the applicability of various techniques to different scenarios
should be developed.
• Interdependencies between hydrogen and other critical infrastructures can be
investigated. This could be of huge interest to the homeland security community,
and is not well understood for any infrastructure, let alone hydrogen.
• The methodology could be applied to other energy sectors, and reliability
compared across energy systems. As developed here, the method only considers
108
hydrogen systems. But it is broad enough that it could easily be applied to other
energy sectors as well. As the future extent of hydrogen remains uncertain, a
comparison of hydrogen to gasoline and other energy systems would be
immensely valuable in guiding its possible development. Presumably, the same
metrics could be used to evaluate multiple energy systems, if they are broad
enough. Perhaps it would be beneficial to use the same panel of experts to assess
each energy system, as well. This would add consistency between the
assessments, but should be weighed against the possible loss of expertise.
Regardless of the methods used in evaluating different energy systems, the
validity of such comparisons should be investigated.
• Other considerations such as cost or environmental impact could be added to the
analysis as well, to rate the overall societal benefit of different hydrogen pathways
or energy systems. Output from this analysis could be conveyed in a graph
similar to that shown in Figures 25 and 26, but with third and higher dimensions
relating to other measures of interest.
This research set out to promote the fair consideration of reliability issues in hydrogen
discourse. The method works effectively towards that goal, but much work remains
before fully understanding the issues. Political, social, and economic climates today
make energy reliability issues such as risk, energy security, and energy availability
urgent. Recent and past events have demonstrated the consequences of unreliability in
the energy sector, and warned of worse. As we anticipate possibly creating an entirely

109
new energy system, we are awarded the opportunity to proactively design reliability into
the system, rather than rely on reactive fixes. We can little afford to disregard this unique
opportunity, and should embrace it with great mind.
110
BIBLIOGRAPHY Adams, N. (2003) Terrorism & Oil. Penn Well Corporation, Tulsa, OK. Alhajji, A.F. and J. Williams (2003) “Measures of Petroleum Dependence and Vulnerability in OECD Countries,” Energy Economics Newsletter. Originally published in the Middle East Economic Survey, MEES 46:16, April 21, 2003. http://www.wtrg.com/oecd/OECD0304.html Alvarado, F. and S. Oren (2002) “Transmission System Operation and Interconnection,” National Transmission Grid Study – Issue Papers, U.S. DOE, Washington, D.C., May. http://tis.eh.doe.gov/ntgs/reports.html#reports Andrews, J. D. and T. R. Moss (2002) Reliability and Risk Assessment, Second Edition. The American Society of Mechanical Engineers (ASME) Press, New York. Baer, R. (2003) “The Fall of the House of Saud,” The Freedom of Information Center, published from The Atlantic Monthly Magazine, May. http://foi.missouri.edu/evolvingissues/fallhouseofsaud.html BBC News (2004) “Libya Welcomes Eased US Sanctions,” April 24. http://news.bbc.co.uk/1/hi/world/africa/3655035.stm Bedford, T. and R. Cooke (2001) Probabilistic Risk Analysis: Foundations and Methods. Cambridge University Press, Cambridge, UK. Billinton, R. (1969) “Composite System Reliability Evaluation,” IEEE Transactions on Power Apparatus and Systems, PAS-88, pp.276-280. As cited in: Debnath, K. and L. Goel (1995) “Power System Planning – A Reliability Perspective,” Electric Power Systems Research, Vol. 34, March, p.181. Billinton, R. and R.N. Allan (1984) Reliability Evaluation of Power Systems. Pitman, London. As cited in: Debnath and Goel (1995) “Power System Planning – A Reliability Perspective,” Electric Power Systems Research, Vol. 34, March, p.183. Contadini, J. F. (2002) Life Cycle Assessment of Fuel Cell Vehicles – Dealing with Uncertainties. Institute of Transportation Studies, UC Davis, Publication No. UCD-ITS-RR-02-07, May. Cooke, R.M. (1991) Experts in Uncertainty. Oxford University Press, New York, NY. Copulos, M.R. (2003) “The Real Cost of Imported Oil,” The Washington Times, July 23.
111
The Center for Strategic and International Studies (CSIS) (2000) The Geopolitics of Energy into the 21st Century, Volume 1: An Overview and Policy Considerations. The CSIS Press, Washington, D.C., November. Day, G. S. (1973) “Theories of Structure and Change.” In Ward, S. and T. S. Robertson, eds. Consumer Behavior: Theoretical Sources. Prentice-Hall, Englewood Cliffs, NJ. Debnath, K. and L. Goel (1995) “Power System Planning – A Reliability Perspective,” Electric Power Systems Research, Vol. 34, March, pp.179-185. Delucchi, M.A. and J. Murphy (1996) U.S. Military Expenditures to Protect the Use of Persian-Gulf Oil for Motor Vehicles, Report #15 in the series: The Annualized Social Cost of Motor-Vehicle Use in the United States, based on 1990-1991 Data. Institute of Transportation Studies, UC Davis, Publication No. UCD-ITS-RR-96-03 (15), April. Dillman, D.A. (1978) Mail and Telephone Surveys: The Total Design Method. John Wiley & Sons, Inc., New York, NY. Electricity Consumers Resource Council (ELCON) (2004) “The Economic Impacts of the August 2003 Blackout,” February 9. http://www.elcon.org/Documents/EconomicImpactsOfAugust2003Blackout.pdf Energy Information Administration (EIA) (1998) Deliverability on the Interstate Natural Gas Pipeline System. U.S. DOE, DOE/EIA-0618(98), Washington D.C., May. EIA (2001a) U.S. Natural Gas Markets: Recent Trends and Prospects for the Future. U.S. DOE, SR/OIAF/2001-02, Washington, D.C., May. EIA (2001b) U.S. Natural Gas Markets: Mid-Term Prospects for Natural Gas Supply. U.S. DOE, SR/OIAF/2001-06, Washington, D.C., December. EIA (2002) “World Oil Transit Chokepoints.” U.S. DOE, Washington, D.C., November. http://eia.doe.gov/cabs/choke.html EIA (2003a) “World Energy ‘Areas to Watch’,” July. http://www.eia.doe.gov/emeu/security/hot.html EIA (2003b) “Indonesia Country Analysis Brief,” April. http://www.eia.doe.gov/emeu/cabs/indonesia.html EIA (2003c) “Iran Country Analysis Brief,” November. http://www.eia.doe.gov/emeu/cabs/iran.html EIA (2003d) “Qatar Country Analysis Brief,” November. http://www.eia.doe.gov/emeu/cabs/qatar.html
112
EIA (2003e) “Saudi Arabia Country Analysis Brief,” December. http://www.eia.doe.gov/emeu/cabs/saudi.html
EIA (2004a) “Algeria Country Analysis Brief,” February. http://www.eia.doe.gov/emeu/cabs/algeria.html EIA (2004b) “Iraq Country Analysis Brief,” March. http://www.eia.doe.gov/emeu/cabs/iraq.html EIA (2004c) “Kuwait Country Analysis Brief,” March. http://www.eia.doe.gov/emeu/cabs/kuwait.html EIA (2004d) “Libya Country Analysis Brief,” January. http://www.eia.doe.gov/emeu/cabs/libya.html EIA (2004e) “United Arab Emirates Country Analysis Brief,” February. http://www.eia.doe.gov/emeu/cabs/uae.html EIA (2004f) Annual Energy Outlook 2004, U.S. DOE, DOE/EIA-0383(2004), Washington, D.C., January. www.eia.doe.gov/oiaf/aeo/ EIA (2004g) “Rules of Thumb for Oil Supply Disruptions,” http://www.eia.doe.gov/security/rule.html Fishbein, M. (1967) “Attitude and the Prediction of Behavior.” In Fishbein, M., ed. (1967) Readings in Attitude Theory and Measurement. John Wiley & Sons, Inc., New York, NY. Freedom House (2004) Freedom in the World 2004: The Annual Survey of Political Rights and Civil Liberties, Freedom House, Inc. GM, LBST, BP, ExxonMobil, Shell, TotalFinaElf (2002) GM Well-to-Wheel Analysis of Energy Use and Greenhouse Gas Emissions of Advanced Fuel/Vehicle Systems - A European Study. L-B-Systemtechnik GmbH, Ottobrunn, Germany, September 27. http://www.lbst.de/gm-wtw/ Greene, D.L. and N. Tishchishyna (2000) Costs of Oil Dependence: A 2000 Update. Oak Ridge National Laboratory, ORNL/TM-2000/152, May. Havens, J. (2003) “Terrorism: Ready to Blow?” Bulletin of the Atomic Scientists, Volume 59, No. 4, July/August, pp.16-18. http://www.thebulletin.org/issues/2003/ja03/ja03havens.html
113
Institute for the Analysis of Global Security (IAGS) (2003a) “Energy Security.” http://www.iags.org/energysecurity.html IAGS (2003b) “How much are we Paying for a Gallon of Gas?” http://www.iags.org/costofoil.html IAGS (2003c) “Threats to Oil Transport.” http://www.iags.org/oiltransport.html International Chamber of Commerce (ICC) Commercial Crime Services (CCS) (2004) “Piracy Takes Higher Toll of Seamen’s Lives,” London, England, January 28. http://www.iccwbo.org/ccs/news_archives/2004/Piracy_report_2003.asp International Institute for Strategic Studies (2001) Strategic Survey 2000-2001, Vol. 101, Issue 1, Oxford University Press. Available at: http://www3.oup.co.uk/stsurv/hdb/Volume_101/Issue_01/ Kirby, B. and E. Hirst (2002) “Reliability Management and Oversight,” National Transmission Grid Study – Issue Papers, U.S. Department of Energy, Washington, D.C., May. http://tis.eh.doe.gov/ntgs/reports.html#reports Kreil, E., EIA (2004) Personal communication (email), May 7. Lax, H. L. (1983) Political Risk in the International Oil and Gas Industry. International Human Resources Development Corporation, Boston, MA. Leemis, L. M. (1995) Reliability: Probabilistic Models and Statistical Methods. Prentice-Hall, Englewood Cliffs, NJ. Likert, R. (1932) “A Technique for the Measurement of Attitudes.” In Summers, G.F., ed. (1970) Attitude Measurement. Rand McNally & Company, Chicago, IL. Lovins, A. and L.H. Lovins (1982) Brittle Power. Brick House Publishing Company, Andover, MA. Luft, G. and A. Korin (2003) “Terror’s Next Target,” The Journal of International Security Affairs, December. Available through IAGS, at: http://www.iags.org/n0111041.htm. Mokhtarian, P. L. (2003) “Typical Kinds of Information Obtained by ‘Attitudinal’ Surveys,” Transportation Technology and Policy 200 course notes, unpublished, available from the author. Institute of Transportation Studies, University of California, Davis. National Petroleum Council (NPC) (2001) Securing Oil and Natural Gas Infrastructures in the New Economy. Library of Congress Catalog Card Number: 2001091810, June. http://www.npc.org/reports/NPC_CIP_4.pdf
114
National Research Council (NRC) (2002) Making the Nation Safer, the Role of Science and Technology in Countering Terrorism. The National Academies Press, Washington D.C. http://www.nap.edu/html/stct/ NRC (2004) The Hydrogen Economy: Opportunities, Costs, Barriers, and R&D Needs. The National Academies Press, Washington D.C. North American Electric Reliability Council (NERC) (2001) An Approach to Action for the Electricity Sector. NERC, Princeton, NJ, June. Taken from the Electricity Sector Information Sharing and Analysis Center (ESISAC) Library of Assessment Methodologies: http://www.esisac.com/publicdocs/ApproachforAction_June2001.pdf NERC (2002) Reliability Assessment 2002-2011 – The Reliability of Bulk Electric Systems in North America. NERC, October. http://www.nerc.com/~filez/rasreports.html Strategic Center for Natural Gas (SCNG) (2000) Natural Gas Infrastructure Reliability: Pathways for Enhanced Integrity, Reliability, and Deliverability. DOE/NETL-2000/1130, September. www.netl.doe.gov/scng/publications/t&d/naturalg.pdf Summers, G. F., ed. (1970) Attitude Measurement. Rand McNally & Company, Chicago, IL. Sudman, S. and N. M. Bradburn (1982) Asking Questions. Jossey-Bass Publishers, San Francisco, CA. U.S. DOE, Office of Energy Assurance (2002) Vulnerability Assessment Methodology – Electric Power Infrastructure (draft). Washington D.C., September 30. Taken from the Electricity Sector Information Sharing and Analysis Center (ESISAC) Library of Assessment Methodologies: http://www.esisac.com/publicdocs/assessment_methods/VA.pdf U.S. DOE and National Energy Technology Laboratory (NETL) (2002) Roadmap Update for Natural Gas Infrastructure Reliability. Workshop Proceedings, January 29-30, U.S. DOE, Washington, D.C. Weiss, M.A., Heywood, J.B., Drake, E.M., Schafer, A., and F.F. AuYeung (2000) On the Road in 2020: A Life-cycle Analysis of New Automobile Technologies. Energy Laboratory Report #MIT EL 00-003, Massachusetts Institute of Technology, Cambridge, MA, October. http://lfee.mit.edu/publications/PDF/el00-003.pdf

115
APPENDIX A: GEOPOLITICAL OVERVIEW OF OPEC MEMBER STATES
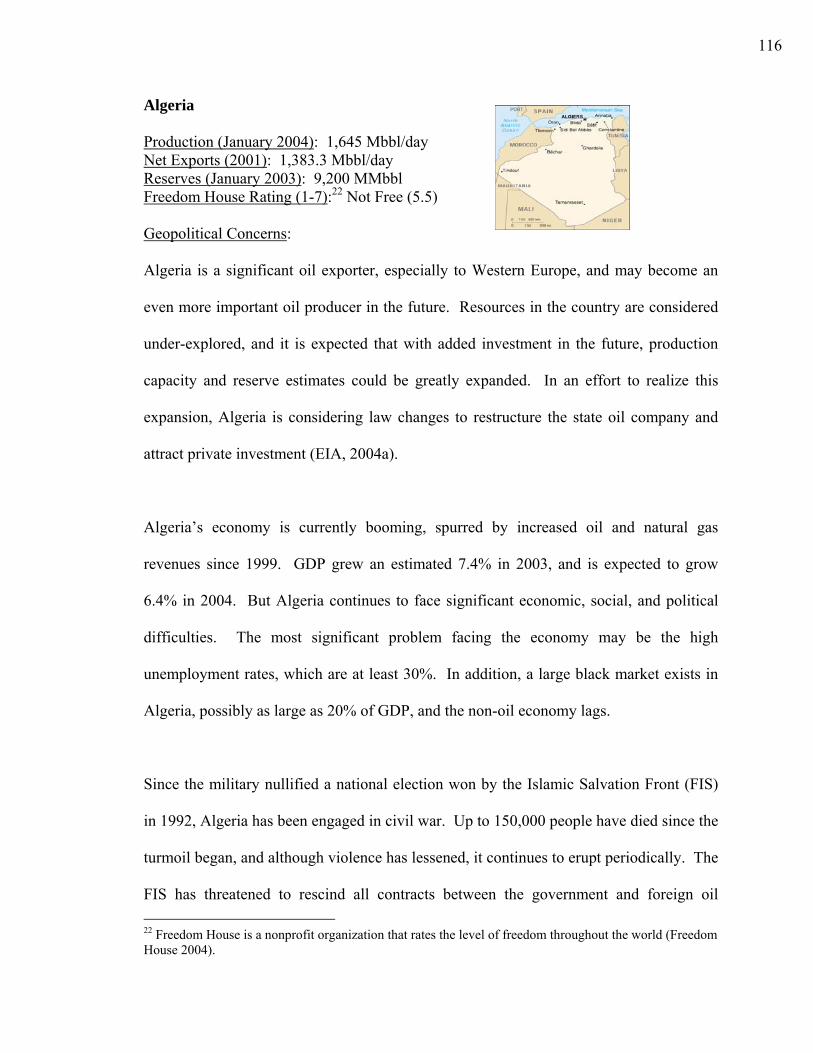
116
Algeria
Production (January 2004): 1,645 Mbbl/day Net Exports (2001): 1,383.3 Mbbl/day Reserves (January 2003): 9,200 MMbbl Freedom House Rating (1-7):22 Not Free (5.5)
Geopolitical Concerns:
Algeria is a significant oil exporter, especially to Western Europe, and may become an
even more important oil producer in the future. Resources in the country are considered
under-explored, and it is expected that with added investment in the future, production
capacity and reserve estimates could be greatly expanded. In an effort to realize this
expansion, Algeria is considering law changes to restructure the state oil company and
attract private investment (EIA, 2004a).
Algeria’s economy is currently booming, spurred by increased oil and natural gas
revenues since 1999. GDP grew an estimated 7.4% in 2003, and is expected to grow
6.4% in 2004. But Algeria continues to face significant economic, social, and political
difficulties. The most significant problem facing the economy may be the high
unemployment rates, which are at least 30%. In addition, a large black market exists in
Algeria, possibly as large as 20% of GDP, and the non-oil economy lags.
Since the military nullified a national election won by the Islamic Salvation Front (FIS)
in 1992, Algeria has been engaged in civil war. Up to 150,000 people have died since the
turmoil began, and although violence has lessened, it continues to erupt periodically. The
FIS has threatened to rescind all contracts between the government and foreign oil 22 Freedom House is a nonprofit organization that rates the level of freedom throughout the world (Freedom House 2004).
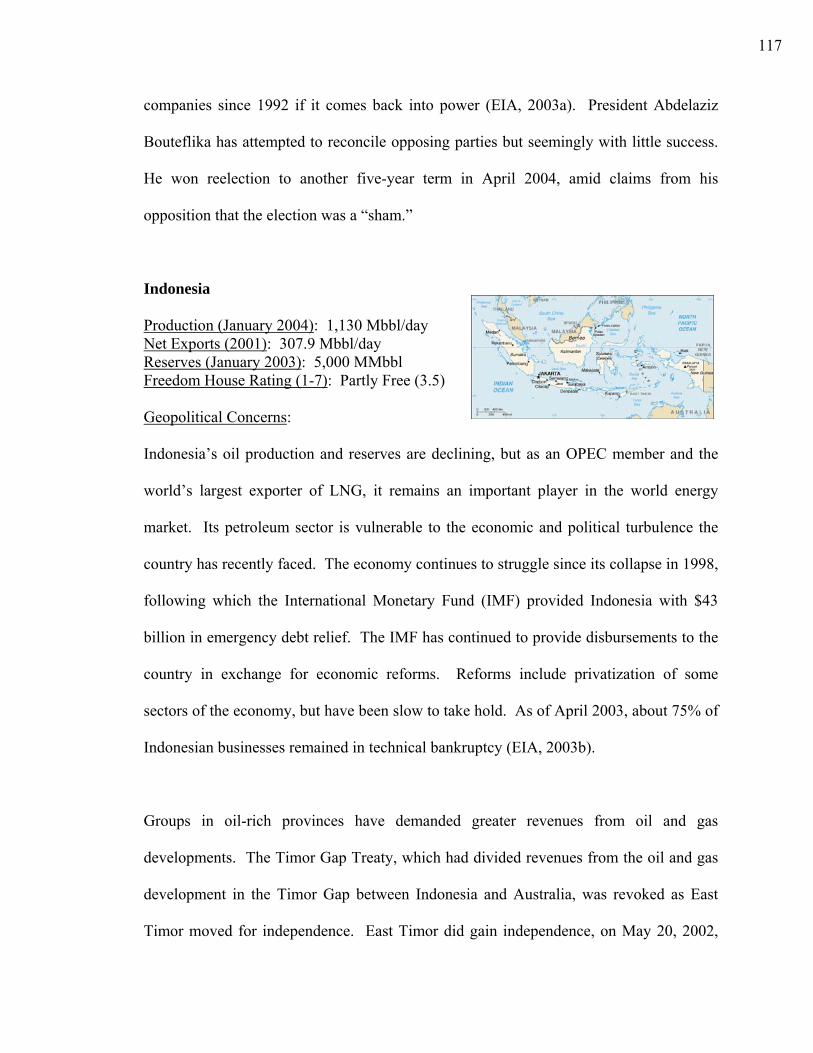
117
companies since 1992 if it comes back into power (EIA, 2003a). President Abdelaziz
Bouteflika has attempted to reconcile opposing parties but seemingly with little success.
He won reelection to another five-year term in April 2004, amid claims from his
opposition that the election was a “sham.”
Indonesia
Production (January 2004): 1,130 Mbbl/day Net Exports (2001): 307.9 Mbbl/day Reserves (January 2003): 5,000 MMbbl Freedom House Rating (1-7): Partly Free (3.5)
Geopolitical Concerns:
Indonesia’s oil production and reserves are declining, but as an OPEC member and the
world’s largest exporter of LNG, it remains an important player in the world energy
market. Its petroleum sector is vulnerable to the economic and political turbulence the
country has recently faced. The economy continues to struggle since its collapse in 1998,
following which the International Monetary Fund (IMF) provided Indonesia with $43
billion in emergency debt relief. The IMF has continued to provide disbursements to the
country in exchange for economic reforms. Reforms include privatization of some
sectors of the economy, but have been slow to take hold. As of April 2003, about 75% of
Indonesian businesses remained in technical bankruptcy (EIA, 2003b).
Groups in oil-rich provinces have demanded greater revenues from oil and gas
developments. The Timor Gap Treaty, which had divided revenues from the oil and gas
development in the Timor Gap between Indonesia and Australia, was revoked as East
Timor moved for independence. East Timor did gain independence, on May 20, 2002,
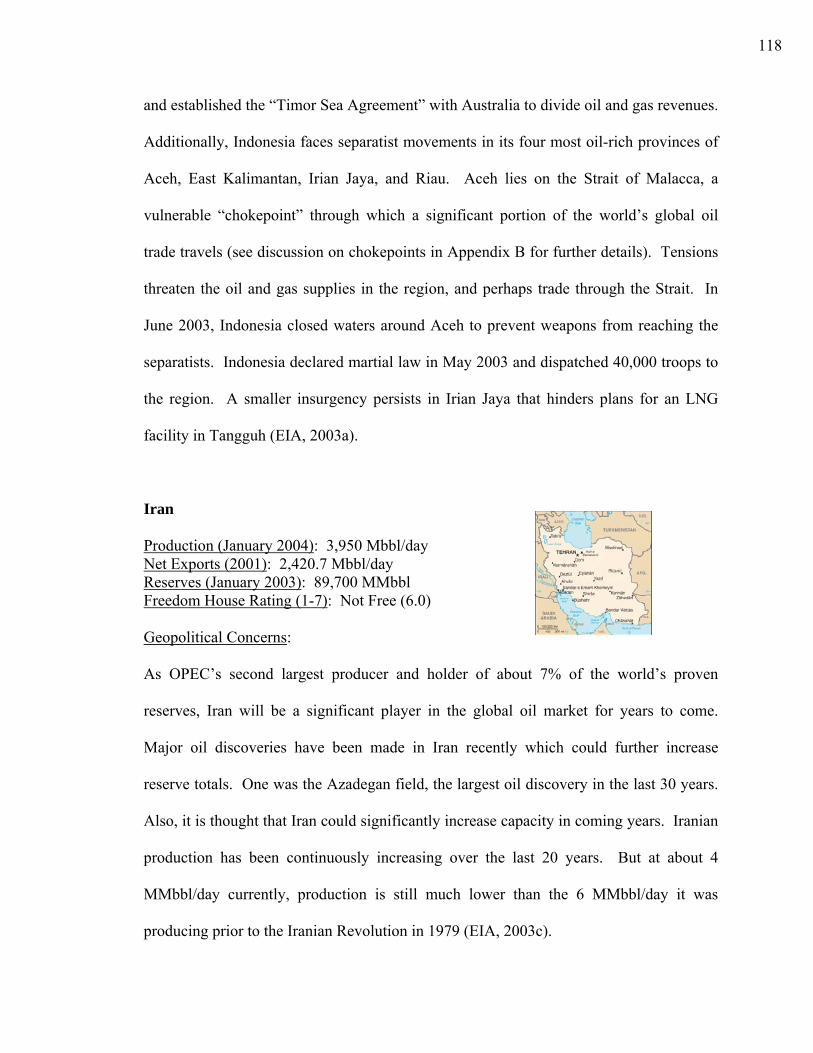
118
and established the “Timor Sea Agreement” with Australia to divide oil and gas revenues.
Additionally, Indonesia faces separatist movements in its four most oil-rich provinces of
Aceh, East Kalimantan, Irian Jaya, and Riau. Aceh lies on the Strait of Malacca, a
vulnerable “chokepoint” through which a significant portion of the world’s global oil
trade travels (see discussion on chokepoints in Appendix B for further details). Tensions
threaten the oil and gas supplies in the region, and perhaps trade through the Strait. In
June 2003, Indonesia closed waters around Aceh to prevent weapons from reaching the
separatists. Indonesia declared martial law in May 2003 and dispatched 40,000 troops to
the region. A smaller insurgency persists in Irian Jaya that hinders plans for an LNG
facility in Tangguh (EIA, 2003a).
Iran
Production (January 2004): 3,950 Mbbl/day Net Exports (2001): 2,420.7 Mbbl/day Reserves (January 2003): 89,700 MMbbl Freedom House Rating (1-7): Not Free (6.0)
Geopolitical Concerns:
As OPEC’s second largest producer and holder of about 7% of the world’s proven
reserves, Iran will be a significant player in the global oil market for years to come.
Major oil discoveries have been made in Iran recently which could further increase
reserve totals. One was the Azadegan field, the largest oil discovery in the last 30 years.
Also, it is thought that Iran could significantly increase capacity in coming years. Iranian
production has been continuously increasing over the last 20 years. But at about 4
MMbbl/day currently, production is still much lower than the 6 MMbbl/day it was
producing prior to the Iranian Revolution in 1979 (EIA, 2003c).
119
Since the Iran hostage crisis of 1979-80, the U.S. has had no diplomatic ties with Iran,
and several points of contention continue between the nations, including (EIA, 2003a):
• U.S. claims that Iran is pursuing nuclear capabilities
• U.S. claims that Iran supports terrorism
• Iran’s opposition to the U.S. vision of the Middle East peace process
• Iran’s purchases of military equipment from North Korea and Russia
• U.S.-imposed sanctions on Iran that extend to foreign oil and gas companies investing
in projects in Iran
• Iran’s claim over three islands disputed by the United Arab Emirates in the strategic
Strait of Hormuz (another “chokepoint”)
Iran’s economy is heavily dependent on oil export revenues, which supply about 40% to
50% of total government earnings, and about 10% to 20% of GDP. Oil price increases
over the last few years has the economy improving, with GDP growing by about 5.9% in
2002, and an estimated 4.5% in 2003. But Iran still faces serious economic problems,
including significant external debt, a growing young population, high rates of
unemployment and poverty, and international isolation and sanctions. The economy
remains heavily dependent on oil revenues, but the government has begun investing in
other areas to improve economic stability (EIA, 2003c).
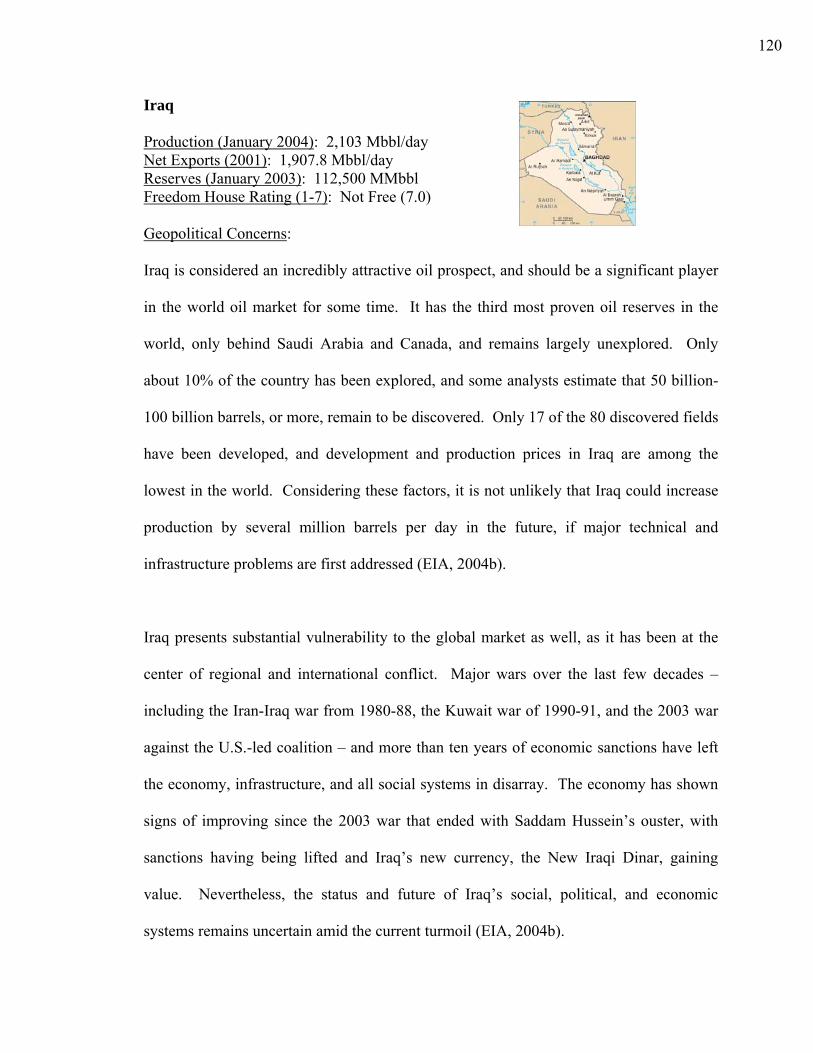
120
Iraq
Production (January 2004): 2,103 Mbbl/day Net Exports (2001): 1,907.8 Mbbl/day Reserves (January 2003): 112,500 MMbbl Freedom House Rating (1-7): Not Free (7.0)
Geopolitical Concerns:
Iraq is considered an incredibly attractive oil prospect, and should be a significant player
in the world oil market for some time. It has the third most proven oil reserves in the
world, only behind Saudi Arabia and Canada, and remains largely unexplored. Only
about 10% of the country has been explored, and some analysts estimate that 50 billion-
100 billion barrels, or more, remain to be discovered. Only 17 of the 80 discovered fields
have been developed, and development and production prices in Iraq are among the
lowest in the world. Considering these factors, it is not unlikely that Iraq could increase
production by several million barrels per day in the future, if major technical and
infrastructure problems are first addressed (EIA, 2004b).
Iraq presents substantial vulnerability to the global market as well, as it has been at the
center of regional and international conflict. Major wars over the last few decades –
including the Iran-Iraq war from 1980-88, the Kuwait war of 1990-91, and the 2003 war
against the U.S.-led coalition – and more than ten years of economic sanctions have left
the economy, infrastructure, and all social systems in disarray. The economy has shown
signs of improving since the 2003 war that ended with Saddam Hussein’s ouster, with
sanctions having being lifted and Iraq’s new currency, the New Iraqi Dinar, gaining
value. Nevertheless, the status and future of Iraq’s social, political, and economic
systems remains uncertain amid the current turmoil (EIA, 2004b).
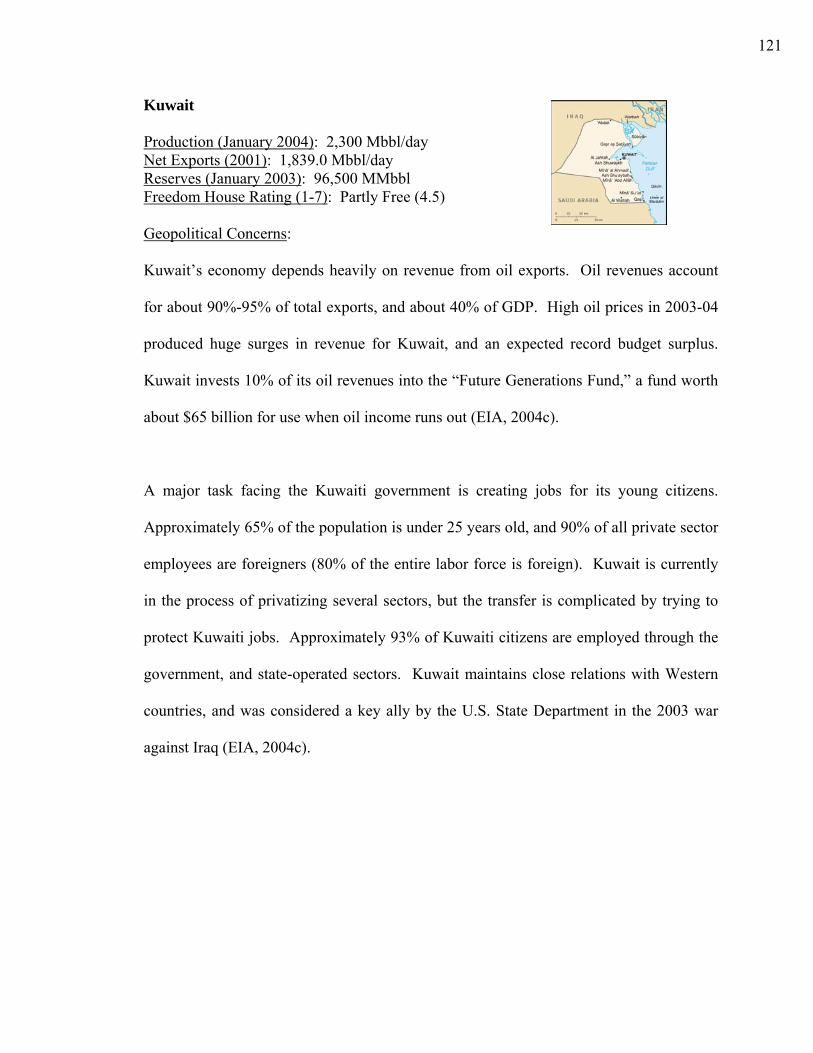
121
Kuwait
Production (January 2004): 2,300 Mbbl/day Net Exports (2001): 1,839.0 Mbbl/day Reserves (January 2003): 96,500 MMbbl Freedom House Rating (1-7): Partly Free (4.5)
Geopolitical Concerns:
Kuwait’s economy depends heavily on revenue from oil exports. Oil revenues account
for about 90%-95% of total exports, and about 40% of GDP. High oil prices in 2003-04
produced huge surges in revenue for Kuwait, and an expected record budget surplus.
Kuwait invests 10% of its oil revenues into the “Future Generations Fund,” a fund worth
about $65 billion for use when oil income runs out (EIA, 2004c).
A major task facing the Kuwaiti government is creating jobs for its young citizens.
Approximately 65% of the population is under 25 years old, and 90% of all private sector
employees are foreigners (80% of the entire labor force is foreign). Kuwait is currently
in the process of privatizing several sectors, but the transfer is complicated by trying to
protect Kuwaiti jobs. Approximately 93% of Kuwaiti citizens are employed through the
government, and state-operated sectors. Kuwait maintains close relations with Western
countries, and was considered a key ally by the U.S. State Department in the 2003 war
against Iraq (EIA, 2004c).
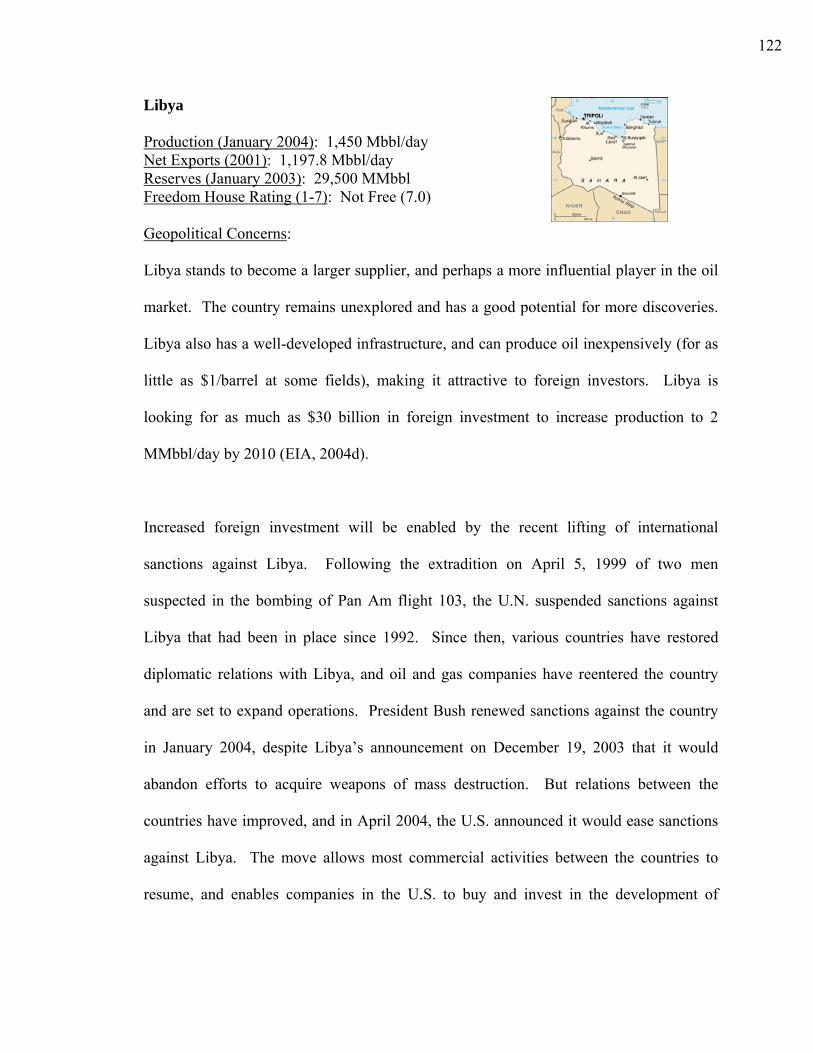
122
Libya
Production (January 2004): 1,450 Mbbl/day Net Exports (2001): 1,197.8 Mbbl/day Reserves (January 2003): 29,500 MMbbl Freedom House Rating (1-7): Not Free (7.0)
Geopolitical Concerns:
Libya stands to become a larger supplier, and perhaps a more influential player in the oil
market. The country remains unexplored and has a good potential for more discoveries.
Libya also has a well-developed infrastructure, and can produce oil inexpensively (for as
little as $1/barrel at some fields), making it attractive to foreign investors. Libya is
looking for as much as $30 billion in foreign investment to increase production to 2
MMbbl/day by 2010 (EIA, 2004d).
Increased foreign investment will be enabled by the recent lifting of international
sanctions against Libya. Following the extradition on April 5, 1999 of two men
suspected in the bombing of Pan Am flight 103, the U.N. suspended sanctions against
Libya that had been in place since 1992. Since then, various countries have restored
diplomatic relations with Libya, and oil and gas companies have reentered the country
and are set to expand operations. President Bush renewed sanctions against the country
in January 2004, despite Libya’s announcement on December 19, 2003 that it would
abandon efforts to acquire weapons of mass destruction. But relations between the
countries have improved, and in April 2004, the U.S. announced it would ease sanctions
against Libya. The move allows most commercial activities between the countries to
resume, and enables companies in the U.S. to buy and invest in the development of
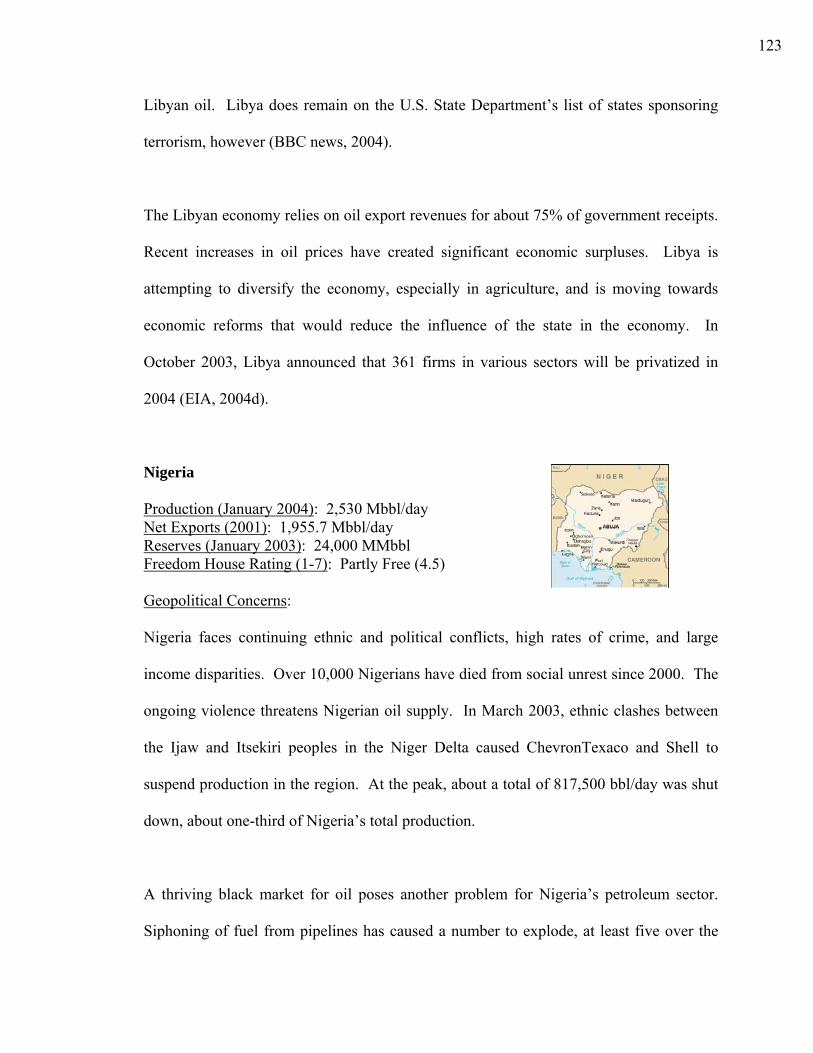
123
Libyan oil. Libya does remain on the U.S. State Department’s list of states sponsoring
terrorism, however (BBC news, 2004).
The Libyan economy relies on oil export revenues for about 75% of government receipts.
Recent increases in oil prices have created significant economic surpluses. Libya is
attempting to diversify the economy, especially in agriculture, and is moving towards
economic reforms that would reduce the influence of the state in the economy. In
October 2003, Libya announced that 361 firms in various sectors will be privatized in
2004 (EIA, 2004d).
Nigeria
Production (January 2004): 2,530 Mbbl/day Net Exports (2001): 1,955.7 Mbbl/day Reserves (January 2003): 24,000 MMbbl Freedom House Rating (1-7): Partly Free (4.5)
Geopolitical Concerns:
Nigeria faces continuing ethnic and political conflicts, high rates of crime, and large
income disparities. Over 10,000 Nigerians have died from social unrest since 2000. The
ongoing violence threatens Nigerian oil supply. In March 2003, ethnic clashes between
the Ijaw and Itsekiri peoples in the Niger Delta caused ChevronTexaco and Shell to
suspend production in the region. At the peak, about a total of 817,500 bbl/day was shut
down, about one-third of Nigeria’s total production.
A thriving black market for oil poses another problem for Nigeria’s petroleum sector.
Siphoning of fuel from pipelines has caused a number to explode, at least five over the
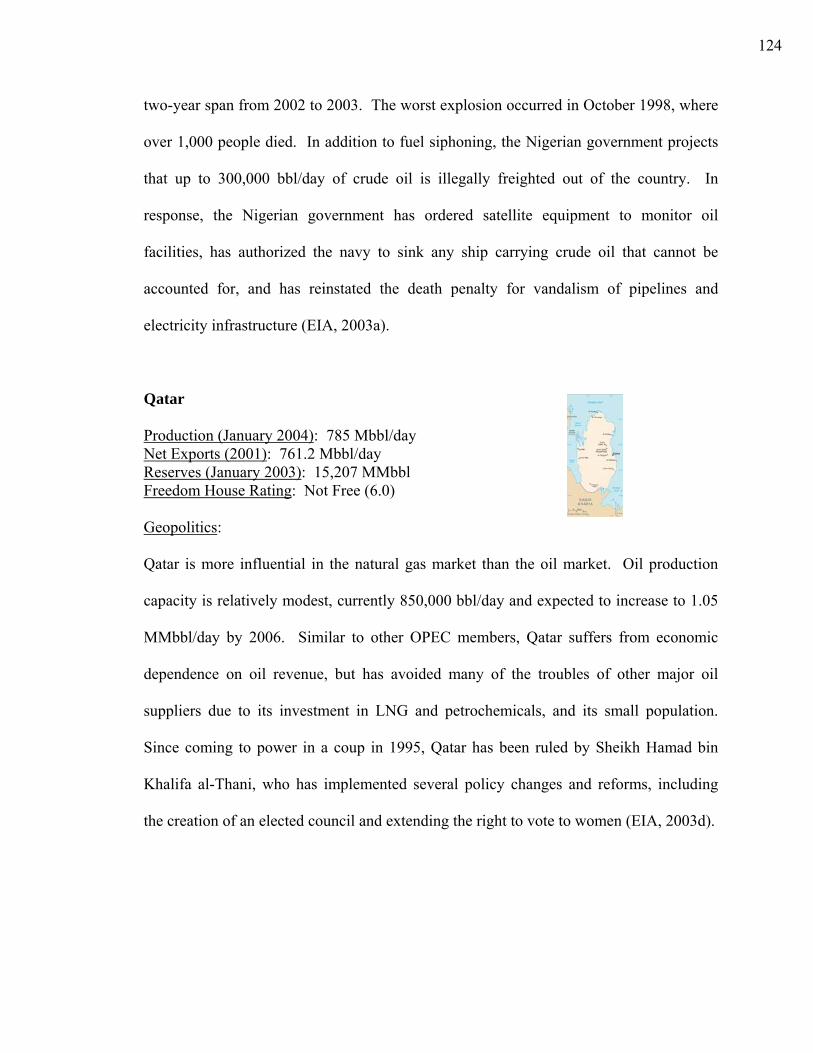
124
two-year span from 2002 to 2003. The worst explosion occurred in October 1998, where
over 1,000 people died. In addition to fuel siphoning, the Nigerian government projects
that up to 300,000 bbl/day of crude oil is illegally freighted out of the country. In
response, the Nigerian government has ordered satellite equipment to monitor oil
facilities, has authorized the navy to sink any ship carrying crude oil that cannot be
accounted for, and has reinstated the death penalty for vandalism of pipelines and
electricity infrastructure (EIA, 2003a).
Qatar
Production (January 2004): 785 Mbbl/day Net Exports (2001): 761.2 Mbbl/day Reserves (January 2003): 15,207 MMbbl Freedom House Rating: Not Free (6.0)
Geopolitics:
Qatar is more influential in the natural gas market than the oil market. Oil production
capacity is relatively modest, currently 850,000 bbl/day and expected to increase to 1.05
MMbbl/day by 2006. Similar to other OPEC members, Qatar suffers from economic
dependence on oil revenue, but has avoided many of the troubles of other major oil
suppliers due to its investment in LNG and petrochemicals, and its small population.
Since coming to power in a coup in 1995, Qatar has been ruled by Sheikh Hamad bin
Khalifa al-Thani, who has implemented several policy changes and reforms, including
the creation of an elected council and extending the right to vote to women (EIA, 2003d).
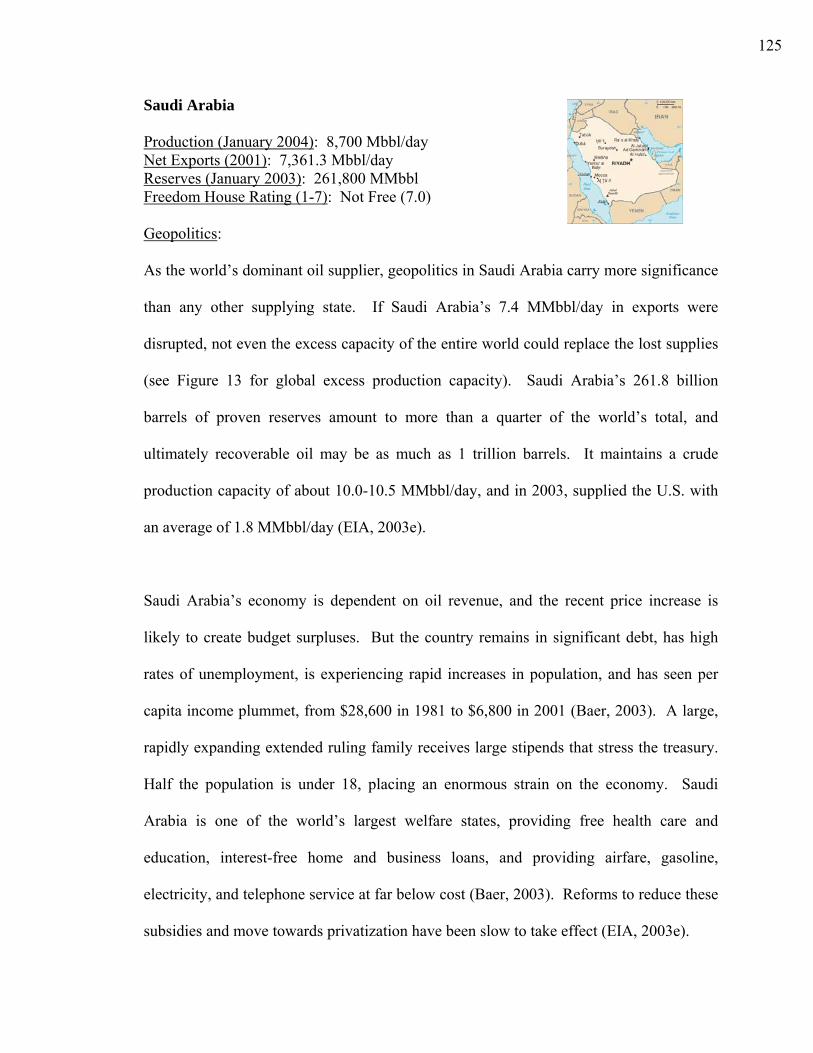
125
Saudi Arabia
Production (January 2004): 8,700 Mbbl/day Net Exports (2001): 7,361.3 Mbbl/day Reserves (January 2003): 261,800 MMbbl Freedom House Rating (1-7): Not Free (7.0)
Geopolitics:
As the world’s dominant oil supplier, geopolitics in Saudi Arabia carry more significance
than any other supplying state. If Saudi Arabia’s 7.4 MMbbl/day in exports were
disrupted, not even the excess capacity of the entire world could replace the lost supplies
(see Figure 13 for global excess production capacity). Saudi Arabia’s 261.8 billion
barrels of proven reserves amount to more than a quarter of the world’s total, and
ultimately recoverable oil may be as much as 1 trillion barrels. It maintains a crude
production capacity of about 10.0-10.5 MMbbl/day, and in 2003, supplied the U.S. with
an average of 1.8 MMbbl/day (EIA, 2003e).
Saudi Arabia’s economy is dependent on oil revenue, and the recent price increase is
likely to create budget surpluses. But the country remains in significant debt, has high
rates of unemployment, is experiencing rapid increases in population, and has seen per
capita income plummet, from $28,600 in 1981 to $6,800 in 2001 (Baer, 2003). A large,
rapidly expanding extended ruling family receives large stipends that stress the treasury.
Half the population is under 18, placing an enormous strain on the economy. Saudi
Arabia is one of the world’s largest welfare states, providing free health care and
education, interest-free home and business loans, and providing airfare, gasoline,
electricity, and telephone service at far below cost (Baer, 2003). Reforms to reduce these
subsidies and move towards privatization have been slow to take effect (EIA, 2003e).
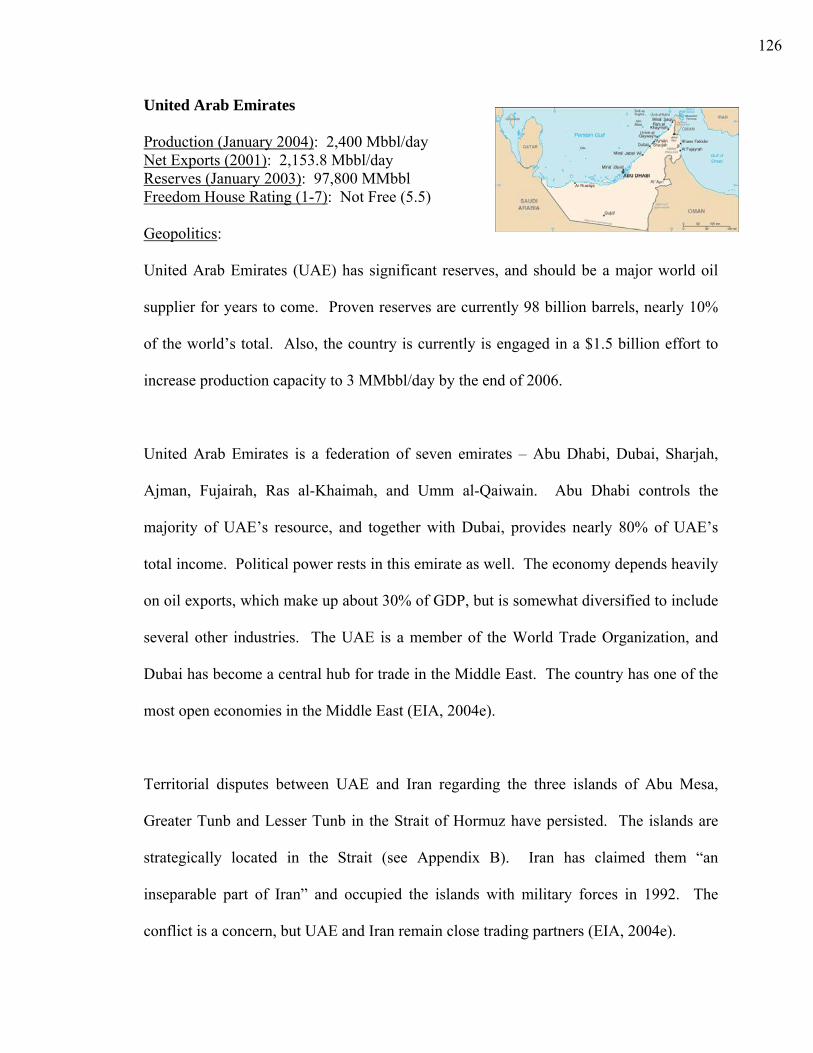
126
United Arab Emirates
Production (January 2004): 2,400 Mbbl/day Net Exports (2001): 2,153.8 Mbbl/day Reserves (January 2003): 97,800 MMbbl Freedom House Rating (1-7): Not Free (5.5)
Geopolitics:
United Arab Emirates (UAE) has significant reserves, and should be a major world oil
supplier for years to come. Proven reserves are currently 98 billion barrels, nearly 10%
of the world’s total. Also, the country is currently is engaged in a $1.5 billion effort to
increase production capacity to 3 MMbbl/day by the end of 2006.
United Arab Emirates is a federation of seven emirates – Abu Dhabi, Dubai, Sharjah,
Ajman, Fujairah, Ras al-Khaimah, and Umm al-Qaiwain. Abu Dhabi controls the
majority of UAE’s resource, and together with Dubai, provides nearly 80% of UAE’s
total income. Political power rests in this emirate as well. The economy depends heavily
on oil exports, which make up about 30% of GDP, but is somewhat diversified to include
several other industries. The UAE is a member of the World Trade Organization, and
Dubai has become a central hub for trade in the Middle East. The country has one of the
most open economies in the Middle East (EIA, 2004e).
Territorial disputes between UAE and Iran regarding the three islands of Abu Mesa,
Greater Tunb and Lesser Tunb in the Strait of Hormuz have persisted. The islands are
strategically located in the Strait (see Appendix B). Iran has claimed them “an
inseparable part of Iran” and occupied the islands with military forces in 1992. The
conflict is a concern, but UAE and Iran remain close trading partners (EIA, 2004e).
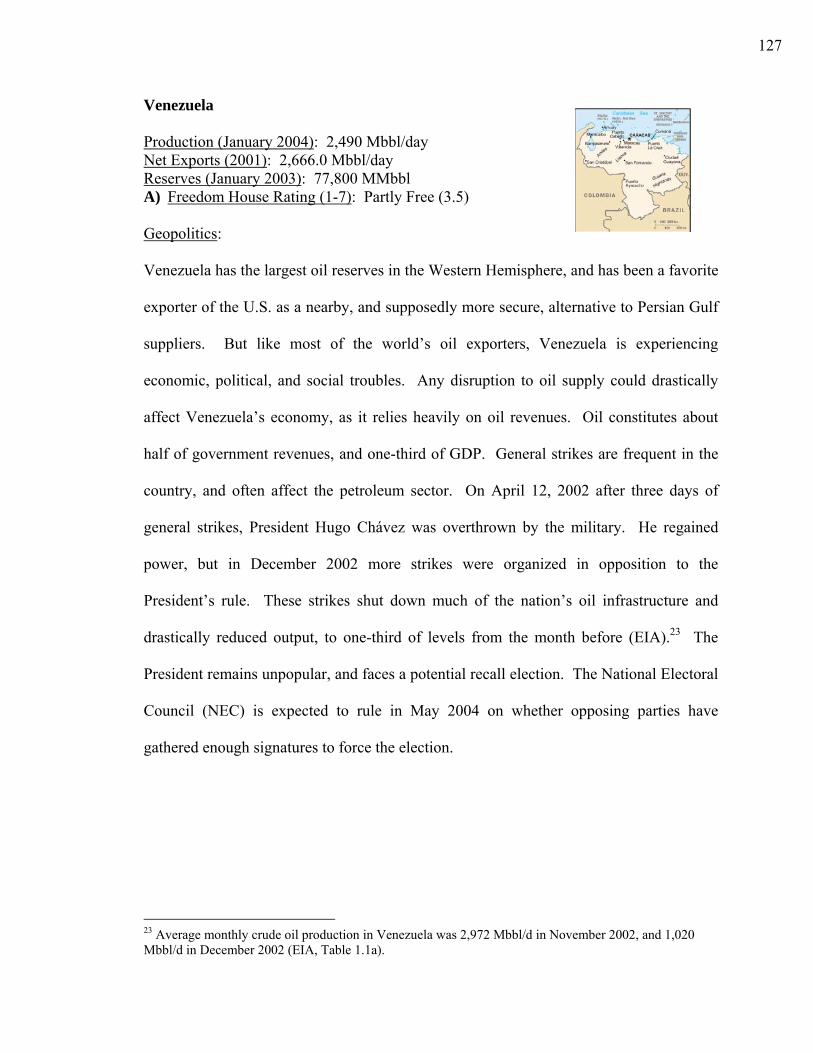
127
Venezuela
Production (January 2004): 2,490 Mbbl/day Net Exports (2001): 2,666.0 Mbbl/day Reserves (January 2003): 77,800 MMbbl A) Freedom House Rating (1-7): Partly Free (3.5)
Geopolitics:
Venezuela has the largest oil reserves in the Western Hemisphere, and has been a favorite
exporter of the U.S. as a nearby, and supposedly more secure, alternative to Persian Gulf
suppliers. But like most of the world’s oil exporters, Venezuela is experiencing
economic, political, and social troubles. Any disruption to oil supply could drastically
affect Venezuela’s economy, as it relies heavily on oil revenues. Oil constitutes about
half of government revenues, and one-third of GDP. General strikes are frequent in the
country, and often affect the petroleum sector. On April 12, 2002 after three days of
general strikes, President Hugo Chávez was overthrown by the military. He regained
power, but in December 2002 more strikes were organized in opposition to the
President’s rule. These strikes shut down much of the nation’s oil infrastructure and
drastically reduced output, to one-third of levels from the month before (EIA).23 The
President remains unpopular, and faces a potential recall election. The National Electoral
Council (NEC) is expected to rule in May 2004 on whether opposing parties have
gathered enough signatures to force the election.
23 Average monthly crude oil production in Venezuela was 2,972 Mbbl/d in November 2002, and 1,020 Mbbl/d in December 2002 (EIA, Table 1.1a).
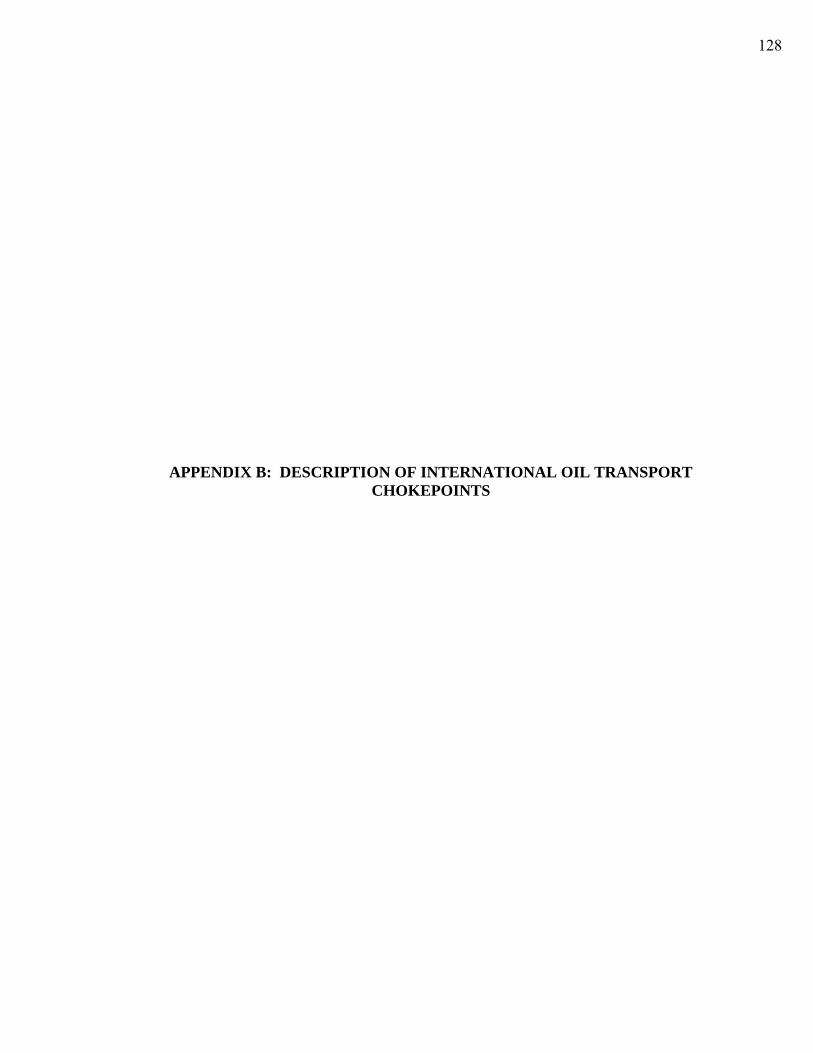
128
APPENDIX B: DESCRIPTION OF INTERNATIONAL OIL TRANSPORT CHOKEPOINTS
129
Figure 27. Chokepoints for international petroleum transport (International Institute for Strategic
Studies, 2001).
Bab el-Mandab
Bab el-Mandab separates Africa and Yemen, connecting the Red Sea with the Gulf of
Aden and the Arabian Sea. Oil traveling west from the Persian Gulf destined for the
Suez Canal or the Sumed Pipeline must travel through Bab el-Mandab. Oil flows
through Bab el-Mandab were an estimated 3.3 MMbbl/day in 2000. A disruption could
significantly increase transit time, and tie up spare capacity. Northbound traffic could
bypass the route using the 5.0 MMbbl/day East-West Pipeline across Saudi Arabia, but
no alternatives exist to the south. Tankers headed for the Suez Canal or Sumed Pipeline
from the Persian Gulf would be diverted around the Cape of Good Hope (EIA [2002] and
Adams [2003, pp.60-61]).
Bosporus Straits
The Bosporus Straits cut through Istanbul, Turkey and connect the Black Sea with the
Sea of Marmara. The Straits carry an estimated 1.7-2.0 MMbbl/day mostly to Western
and Southern Europe. Bosporus is the world’s busiest waterway, carrying about 50,000
130
vessels annually, 5,500 of which are oil tankers (EIA, 2002). It is also one of the most
difficult waterways to navigate. The straits stretch 17 miles and have maximum and
minimum widths of 2 miles and 700 yards, respectively. Navigation requires 12 course
changes, many of which are at 45°. Over the past decade, 350 accidents have occurred,
an astonishingly high rate. The Straits serve as an “energy bridge” between the resource-
rich Caspian Sea and Middle East regions, and provide several high profile targets in a
region with much unrest (Adams, 2003, pp.61-63). Projected increases in production
from the Caspian Sea could further increase demands on the Straits.
Panama Canal and Pipeline
The Panama Canal cuts through Panama, connecting the Pacific Ocean with the
Caribbean Sea and Atlantic Ocean. The Canal carries an estimated 613,000 bbl/day,
mostly westward to islands in the Pacific. Political unrest threatens the region, especially
in bordering Columbia. The absence of a military in Panama adds vulnerability (Adams,
2003, p.71). A disruption in the canal could be bypassed by the 860,000 bbl/day Panama
Pipeline, which was closed in 1996 after Alaskan oil shipments to the Gulf of Mexico
declined (EIA, 2002).
Strait of Hormuz
The Strait of Hormuz is by far the world’s most significant chokepoint. It is located
between Oman and Iran, and connects the Persian Gulf with the Gulf of Oman and the
Arabian Sea. It is the world’s largest oil transit lane, carrying an estimated 13-15
MMbbl/day, and the only exit from the Persian Gulf. Exports through the Strait are
131
destined for Japan, the U.S., and Western Europe. The Strait has a 2-mile-wide inbound
and outbound lane, separated by a 2-mile-wide buffer. Iran and the UAE dispute control
over the Strait, specifically the three islands of Greater Tunb, Lesser Tunb, and Abu
Musa. Militarization of the islands would provide the capability to close the Strait. A
few pipelines provide alternative routes, but not sufficient capacity to handle daily flows
through Hormuz. The East-West Pipeline is one, and currently has about 3.0 MMbbl/day
of spare capacity (Adams, 2003, pp.72-73). The 290,000 bbl/day Abqaiq-Yanbu natural
gas liquids pipeline and the 1.65 MMbbl/day Iraqi Pipeline also cross Saudi Arabia and
could be used to some extent (EIA, 2002).
Strait of Malacca
The Strait of Malacca separates Malaysia and Indonesia, and connects the Indian Ocean
with the South China Sea and the Pacific Ocean. About 10 million barrels of oil from the
Middle East destined for China, Japan, South Korea, and other Pacific Rim countries
travel through the Strait daily. The Strait is 500 miles long, but only 10-70 meters deep
(Adams, 2003, p.69), and is 1.5 miles wide at its narrowest point (EIA, 2002). It is the
key chokepoint in Asia, and the second busiest shipping route behind the Bosporus
Straits. Half of all sea shipments of oil bound for East Asia passes through the Strait, and
two-thirds of the world’s LNG (IAGS, 2003c). The Lombok Strait provides an
alternative route, at a cost of about 1000 extra miles, or three extra days (Adams, 2003,
p.70). Another potential route in the future is a canal through Thailand, a project that
China is pursuing to avoid the Strait as its oil demand rapidly increases (EIA, 2002).
132
Suez Canal
The Suez Canal is located in Egypt and connects the Red Sea and the Gulf of Suez with
the Mediterranean. The Suez carries about 1.3 MMbbl/day destined for Europe and the
U.S. The Canal is 100 miles long, with a minimum width of 195 ft. Loss of the canal
would be significant, but not devastating. Shipments through the Canal would have to be
rerouted around the Cape of Good Hope (Adams, 2003, p.73).
Sumed Pipeline
The Sumed Pipeline also connects the Gulf of Suez and the Red Sea through Egypt with
the Mediterranean. It carries an estimated 2.2-2.5 MMbbl/day northbound destined to the
U.S. and Europe, mostly from Saudi Arabia. It is vulnerable like any pipeline.

133
APPENDIX C: MATERIALS PROVIDED TO THE EXPERT PANEL
134
HYDROGEN RELIABILITY EVALUATION EXERCISE Institute of Transportation Studies University of California, Davis Friday, September 10, 2004 OVERVIEW
Reliability∗ in the energy sector is defined in terms of two categories: adequacy and security. Adequacy refers to the extent to which the system has sufficient throughput to satisfactorily supply demand. Security refers to the ability of the system to minimize and withstand unexpected interruptions. These categories encompass five subcategories. Adequacy includes two: capacity and flexibility. Security includes three: infrastructure vulnerability, consequence of infrastructure disruption, and energy security. In this exercise, you will be asked to rate several aspects of those subcategories and their importance to reliability for two hydrogen pathways. Your ratings will be weighted according to the importance scores you give them, and aggregated to develop reliability ratings for the five subcategories. These scores will then be weighted and aggregated again to develop a score for the adequacy and security categories. The category and subcategory scores highlight portions of the pathways that are particularly reliable or capricious. Comparing these scores across pathways can reveal reliable options for hydrogen infrastructure network designs.
∗ All items that appear in bold are defined in the glossary
135
IMPORTANCE RATINGS
OVERVIEW
In this portion of the exercise, you are asked to rate the importance of several aspects of reliability. The importance ratings will be used to weight the reliability ratings that you will later develop. The weighted scores will then be aggregated to develop scores for each subcategory and for adequacy and security.
INSTRUCTIONS In this section, you will be asked to rate the importance of several components of reliability. First, you will rate the importance of several aspects of the five subcategories. Rate the importance of these components as you feel they influence the reliability of the subcategory. Use the following scale:
Note that these are ratings, not rankings. You are rating components independently, as they pertain to the subcategory, rather than ranking components relative to each other. If you feel that none of the components strongly influence the reliability of the subcategory, rate them all low. Similarly, if you feel that all are very important, you may rate them all very high. Next, you will be asked to rate the importance of each of the five subcategories to overall reliability. These should be independent of the ratings you gave the components of the subcategories. That is, although you may have rated every aspect of one subcategory quite low, if you feel that the subcategory itself is important to overall reliability, that subcategory should receive a high importance rating nonetheless. The scale used for these ratings is the same as the scale described above.
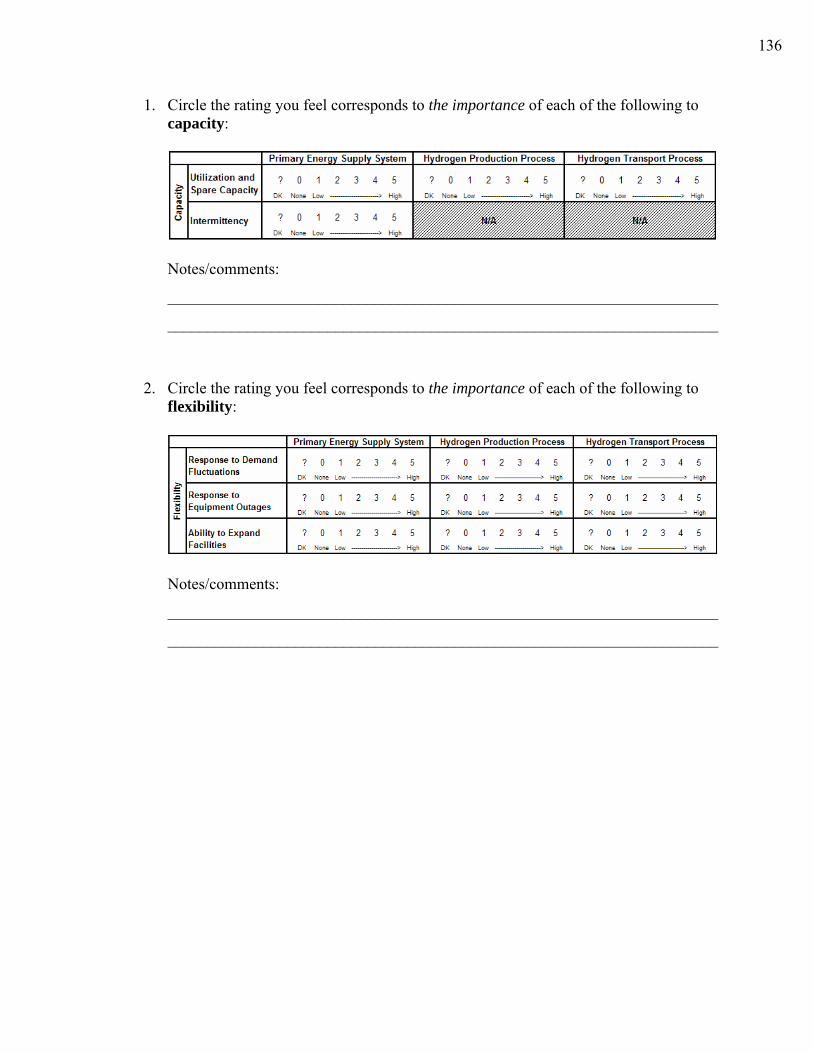
136
1. Circle the rating you feel corresponds to the importance of each of the following to capacity:
Notes/comments:
_____________________________________________________________________
_____________________________________________________________________
2. Circle the rating you feel corresponds to the importance of each of the following to
flexibility:
Notes/comments:
_____________________________________________________________________
_____________________________________________________________________
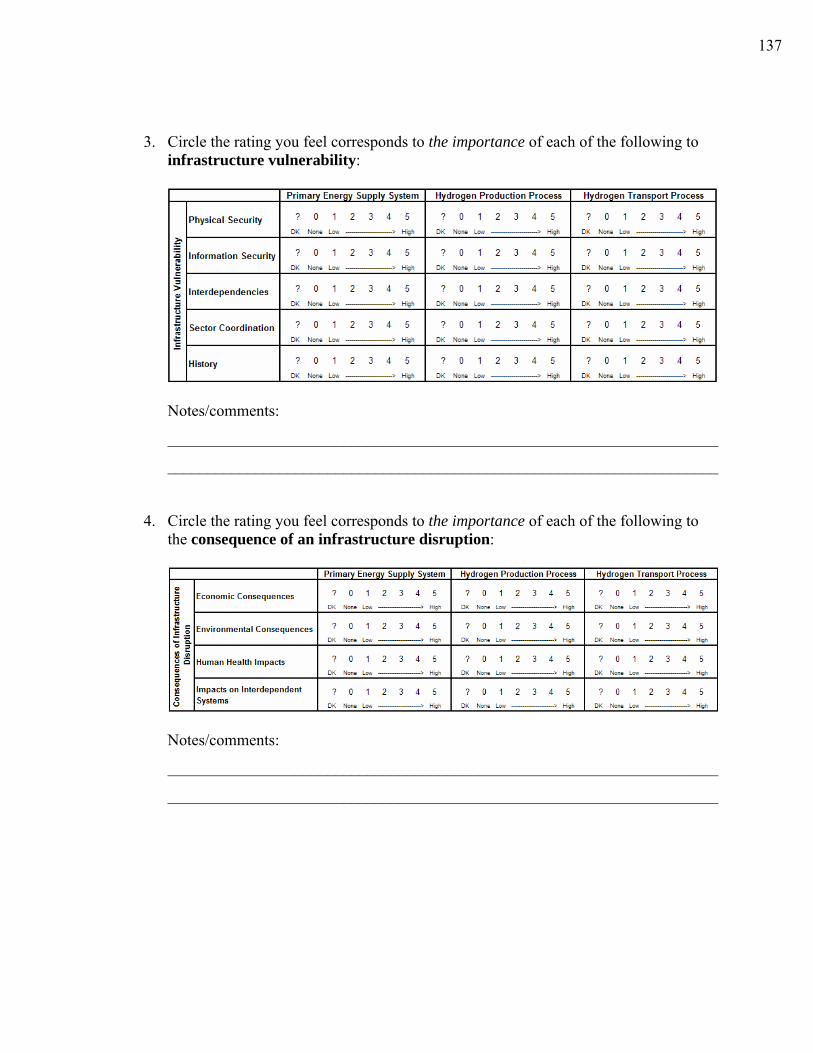
137
3. Circle the rating you feel corresponds to the importance of each of the following to infrastructure vulnerability:
Notes/comments:
_____________________________________________________________________
_____________________________________________________________________
4. Circle the rating you feel corresponds to the importance of each of the following to the consequence of an infrastructure disruption:
Notes/comments:
_____________________________________________________________________
_____________________________________________________________________
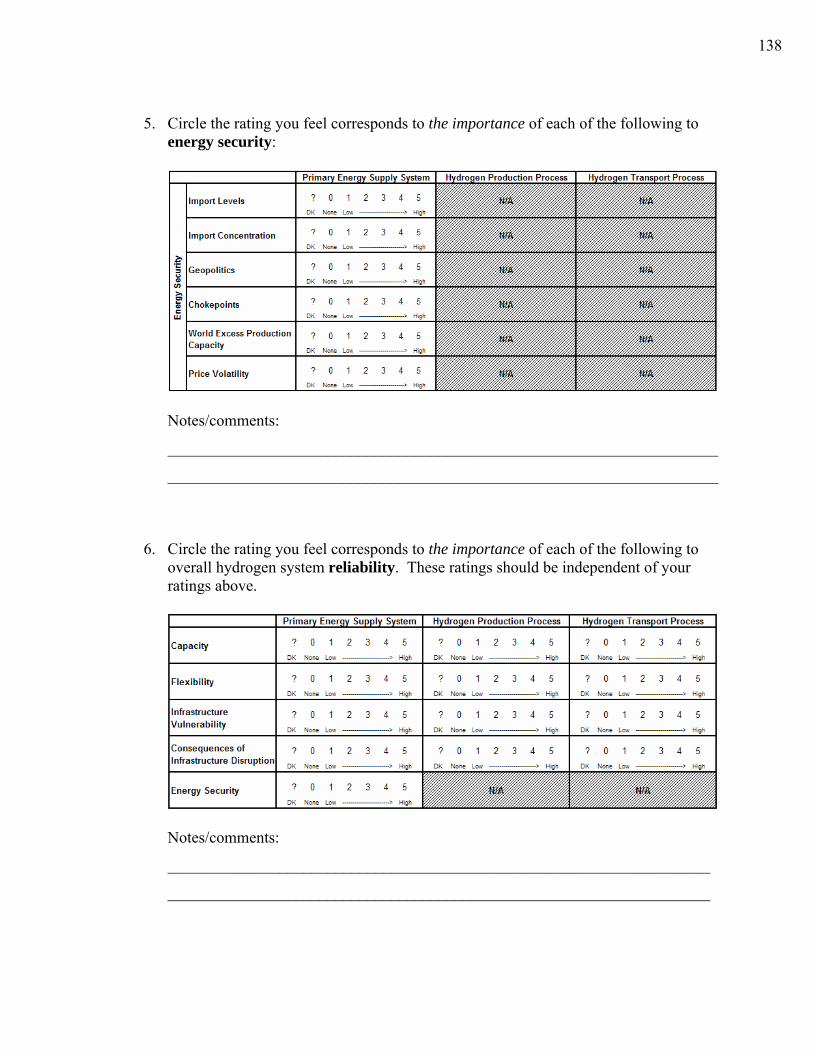
138
5. Circle the rating you feel corresponds to the importance of each of the following to
energy security:
Notes/comments:
_____________________________________________________________________
_____________________________________________________________________
6. Circle the rating you feel corresponds to the importance of each of the following to overall hydrogen system reliability. These ratings should be independent of your ratings above.
Notes/comments:
____________________________________________________________________
____________________________________________________________________
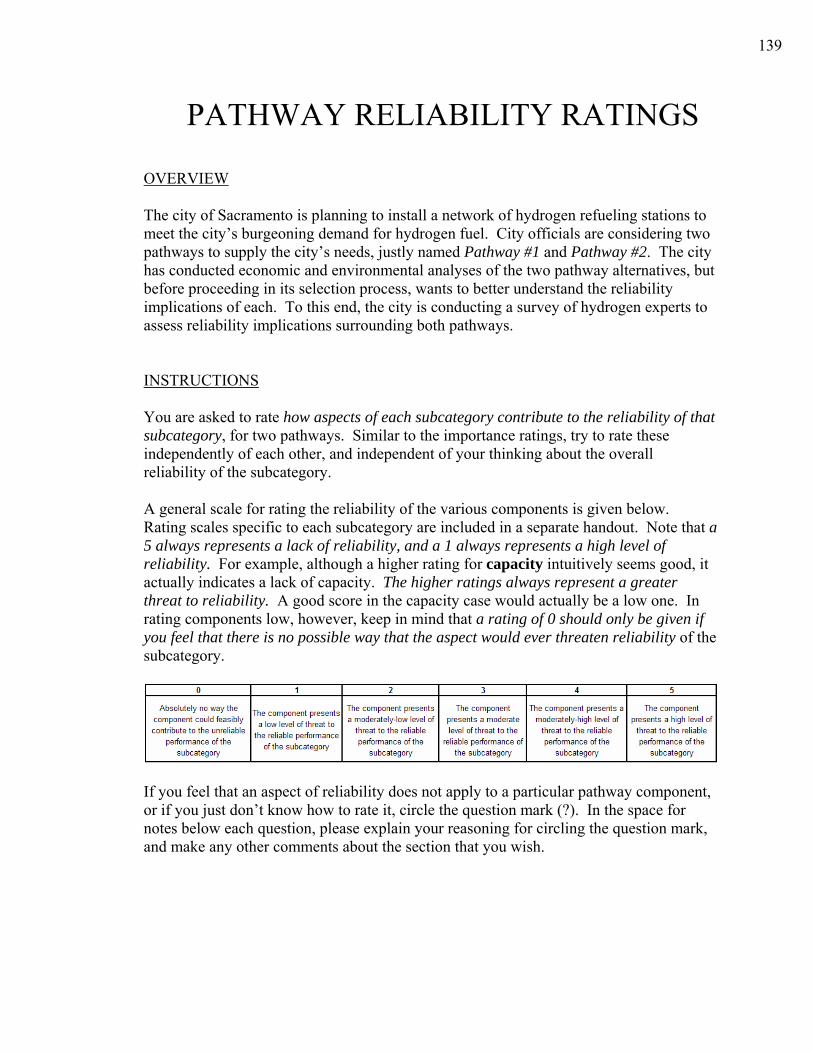
139
PATHWAY RELIABILITY RATINGS OVERVIEW The city of Sacramento is planning to install a network of hydrogen refueling stations to meet the city’s burgeoning demand for hydrogen fuel. City officials are considering two pathways to supply the city’s needs, justly named Pathway #1 and Pathway #2. The city has conducted economic and environmental analyses of the two pathway alternatives, but before proceeding in its selection process, wants to better understand the reliability implications of each. To this end, the city is conducting a survey of hydrogen experts to assess reliability implications surrounding both pathways. INSTRUCTIONS You are asked to rate how aspects of each subcategory contribute to the reliability of that subcategory, for two pathways. Similar to the importance ratings, try to rate these independently of each other, and independent of your thinking about the overall reliability of the subcategory. A general scale for rating the reliability of the various components is given below. Rating scales specific to each subcategory are included in a separate handout. Note that a 5 always represents a lack of reliability, and a 1 always represents a high level of reliability. For example, although a higher rating for capacity intuitively seems good, it actually indicates a lack of capacity. The higher ratings always represent a greater threat to reliability. A good score in the capacity case would actually be a low one. In rating components low, however, keep in mind that a rating of 0 should only be given if you feel that there is no possible way that the aspect would ever threaten reliability of the subcategory.
If you feel that an aspect of reliability does not apply to a particular pathway component, or if you just don’t know how to rate it, circle the question mark (?). In the space for notes below each question, please explain your reasoning for circling the question mark, and make any other comments about the section that you wish.
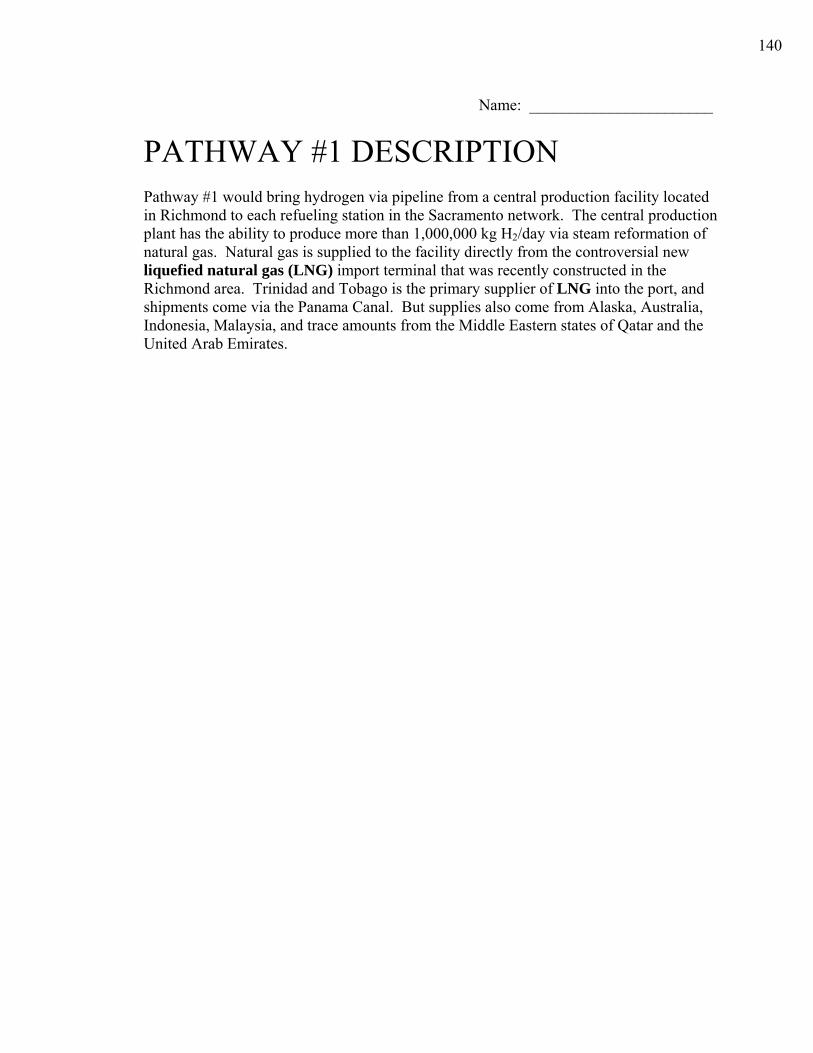
140
Name: _______________________
PATHWAY #1 DESCRIPTION Pathway #1 would bring hydrogen via pipeline from a central production facility located in Richmond to each refueling station in the Sacramento network. The central production plant has the ability to produce more than 1,000,000 kg H2/day via steam reformation of natural gas. Natural gas is supplied to the facility directly from the controversial new liquefied natural gas (LNG) import terminal that was recently constructed in the Richmond area. Trinidad and Tobago is the primary supplier of LNG into the port, and shipments come via the Panama Canal. But supplies also come from Alaska, Australia, Indonesia, Malaysia, and trace amounts from the Middle Eastern states of Qatar and the United Arab Emirates.
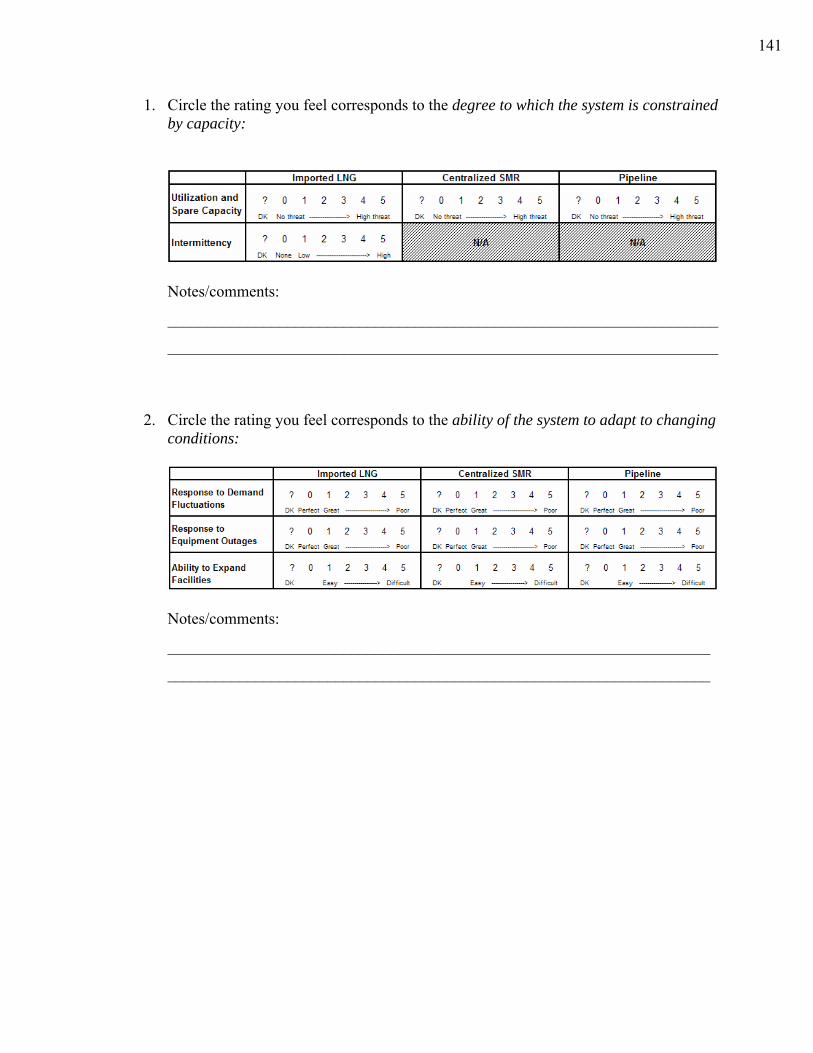
141
1. Circle the rating you feel corresponds to the degree to which the system is constrained by capacity:
Notes/comments:
_____________________________________________________________________
_____________________________________________________________________ 2. Circle the rating you feel corresponds to the ability of the system to adapt to changing
conditions:
Notes/comments:
____________________________________________________________________
____________________________________________________________________
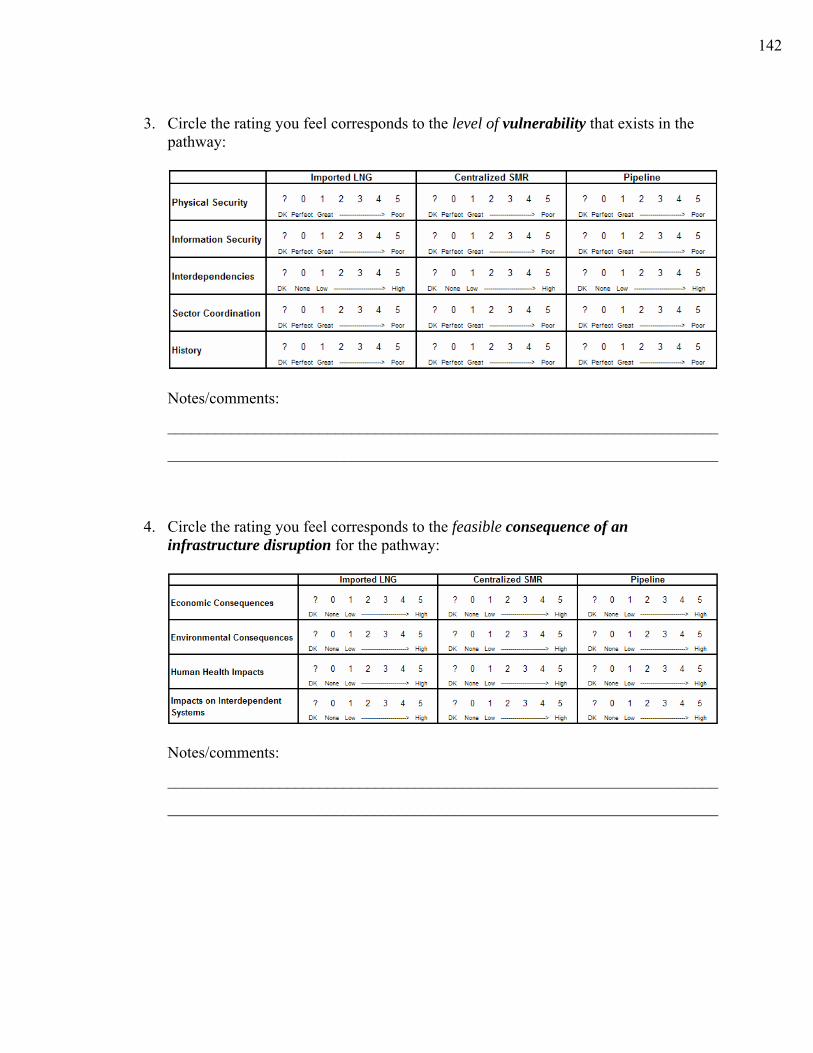
142
3. Circle the rating you feel corresponds to the level of vulnerability that exists in the
pathway:
Notes/comments:
_____________________________________________________________________
_____________________________________________________________________
4. Circle the rating you feel corresponds to the feasible consequence of an infrastructure disruption for the pathway:
Notes/comments:
_____________________________________________________________________
_____________________________________________________________________
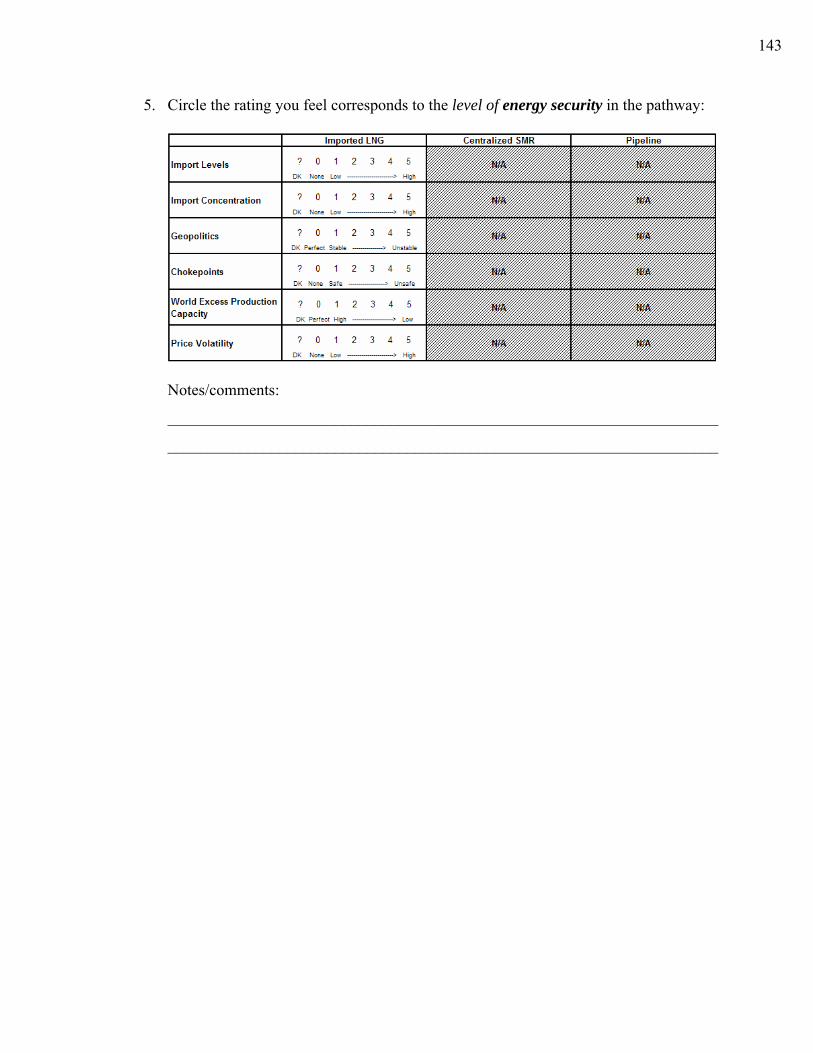
143
5. Circle the rating you feel corresponds to the level of energy security in the pathway:
Notes/comments:
_____________________________________________________________________
_____________________________________________________________________

144
Name: _______________________
PATHWAY #2 DESCRIPTION In accordance with recommendations from experts in the field regarding the development of California’s Hydrogen Highway, the city is also considering an alternative pathway that would utilize renewable energy. The mayor is considering issuing an Executive Order that would require all hydrogen sold in the city to be produced from renewable resources. City officials have developed an alternative pathway to supply the city’s hydrogen demand, which they call Pathway #2. Under the Pathway #2 proposal, each refueling station would produce hydrogen onsite from electricity produced locally from renewable resources.
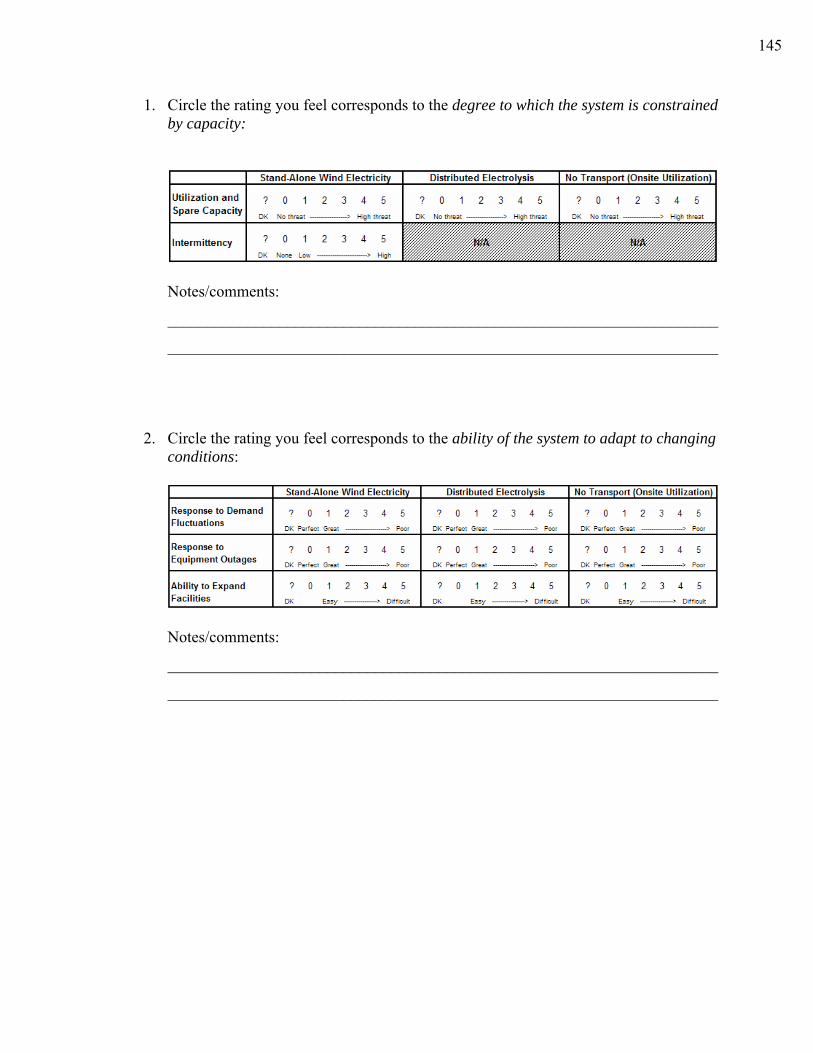
145
1. Circle the rating you feel corresponds to the degree to which the system is constrained by capacity:
Notes/comments:
_____________________________________________________________________
_____________________________________________________________________ 2. Circle the rating you feel corresponds to the ability of the system to adapt to changing
conditions:
Notes/comments:
_____________________________________________________________________
_____________________________________________________________________
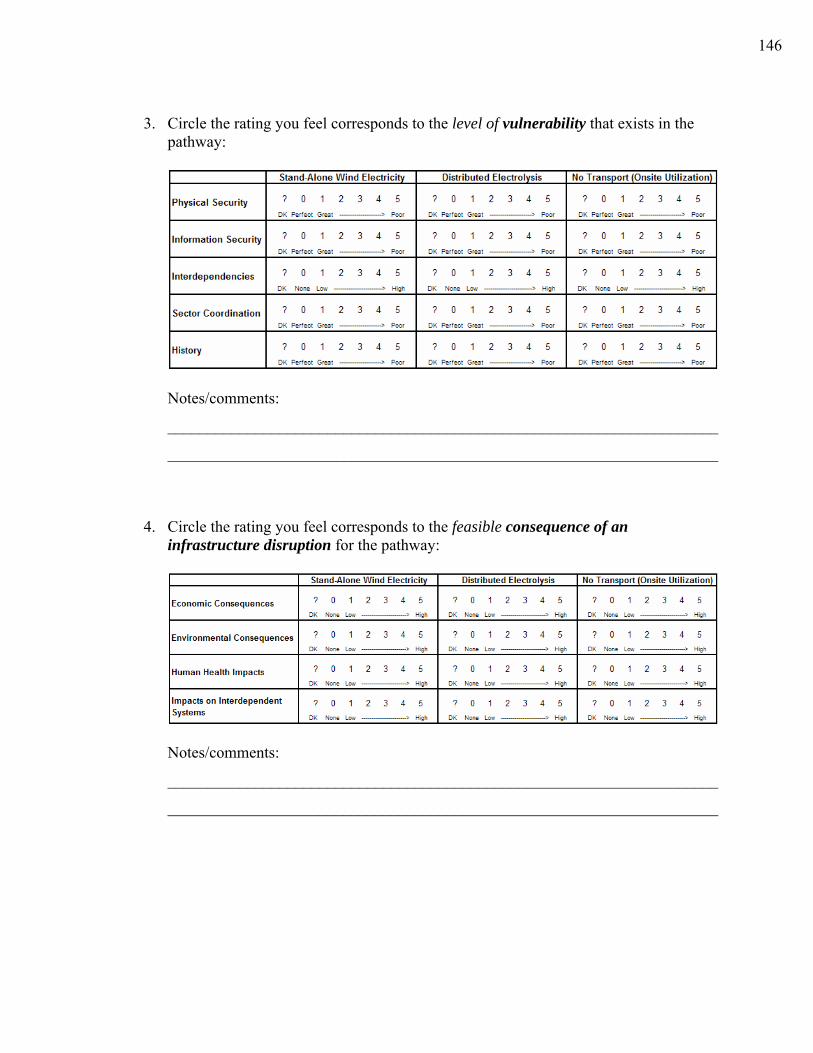
146
3. Circle the rating you feel corresponds to the level of vulnerability that exists in the
pathway:
Notes/comments:
_____________________________________________________________________
_____________________________________________________________________
4. Circle the rating you feel corresponds to the feasible consequence of an infrastructure disruption for the pathway:
Notes/comments:
_____________________________________________________________________
_____________________________________________________________________
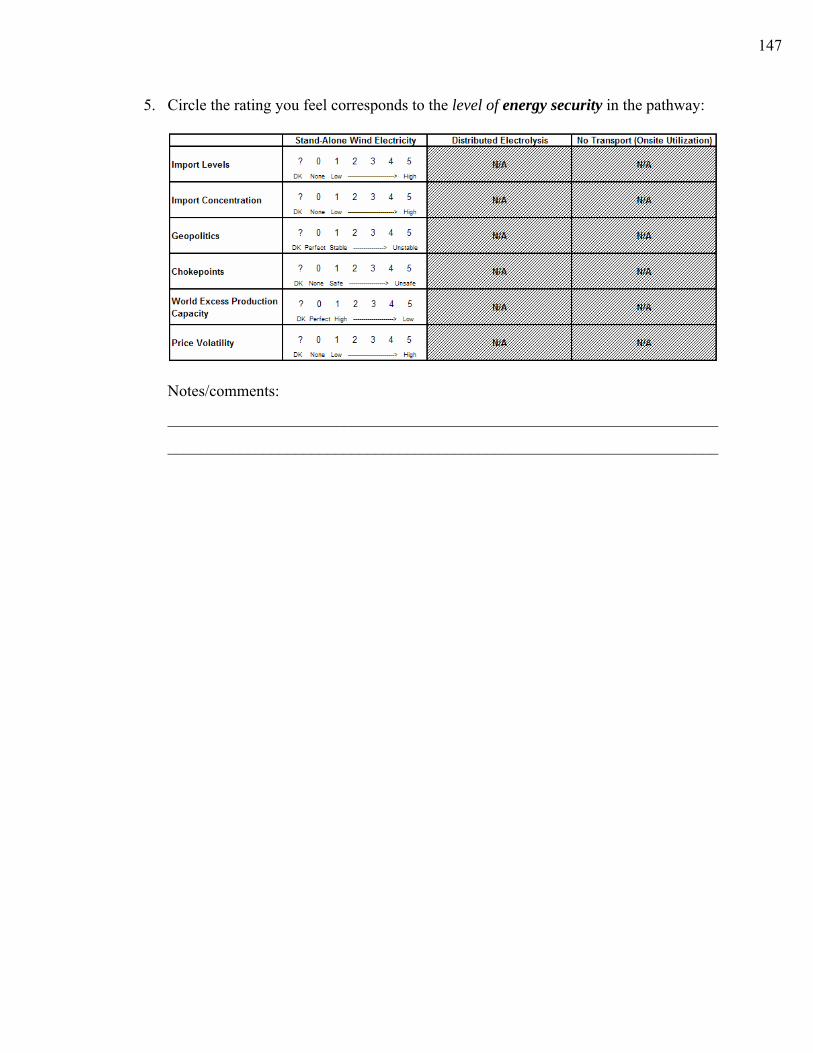
147
5. Circle the rating you feel corresponds to the level of energy security in the pathway:
Notes/comments:
_____________________________________________________________________
_____________________________________________________________________
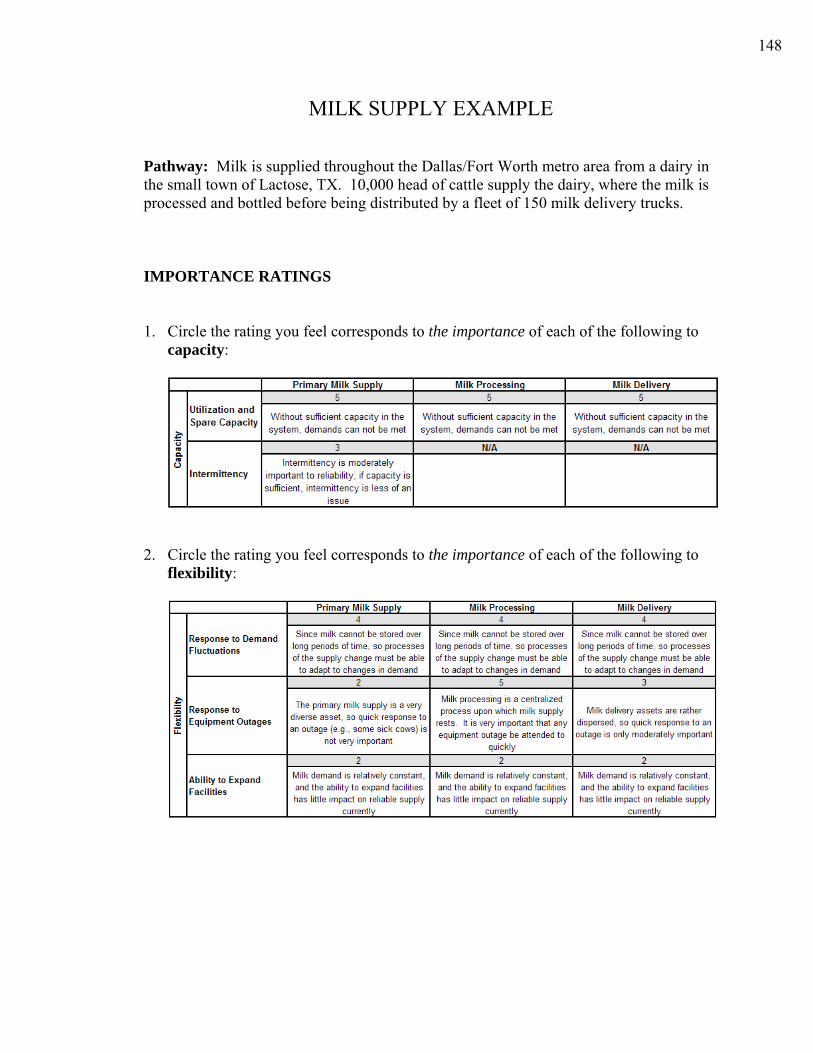
148
MILK SUPPLY EXAMPLE Pathway: Milk is supplied throughout the Dallas/Fort Worth metro area from a dairy in the small town of Lactose, TX. 10,000 head of cattle supply the dairy, where the milk is processed and bottled before being distributed by a fleet of 150 milk delivery trucks. IMPORTANCE RATINGS 1. Circle the rating you feel corresponds to the importance of each of the following to
capacity:
2. Circle the rating you feel corresponds to the importance of each of the following to
flexibility:
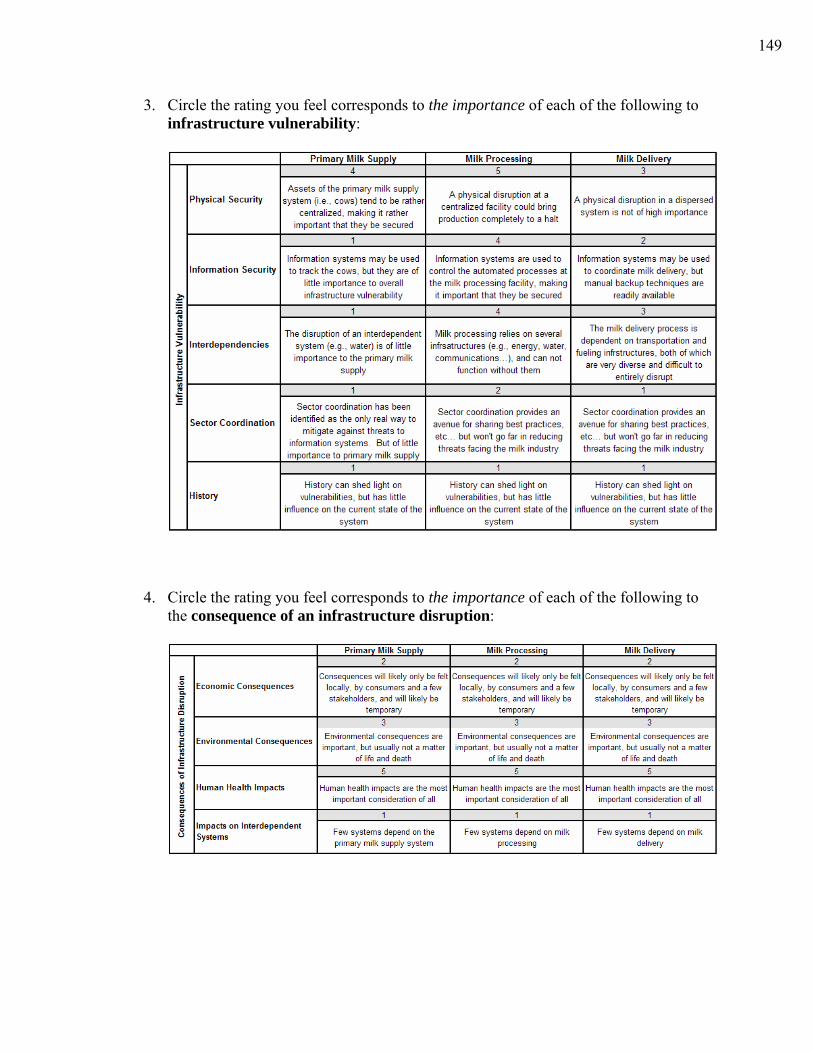
149
3. Circle the rating you feel corresponds to the importance of each of the following to infrastructure vulnerability:
4. Circle the rating you feel corresponds to the importance of each of the following to
the consequence of an infrastructure disruption:
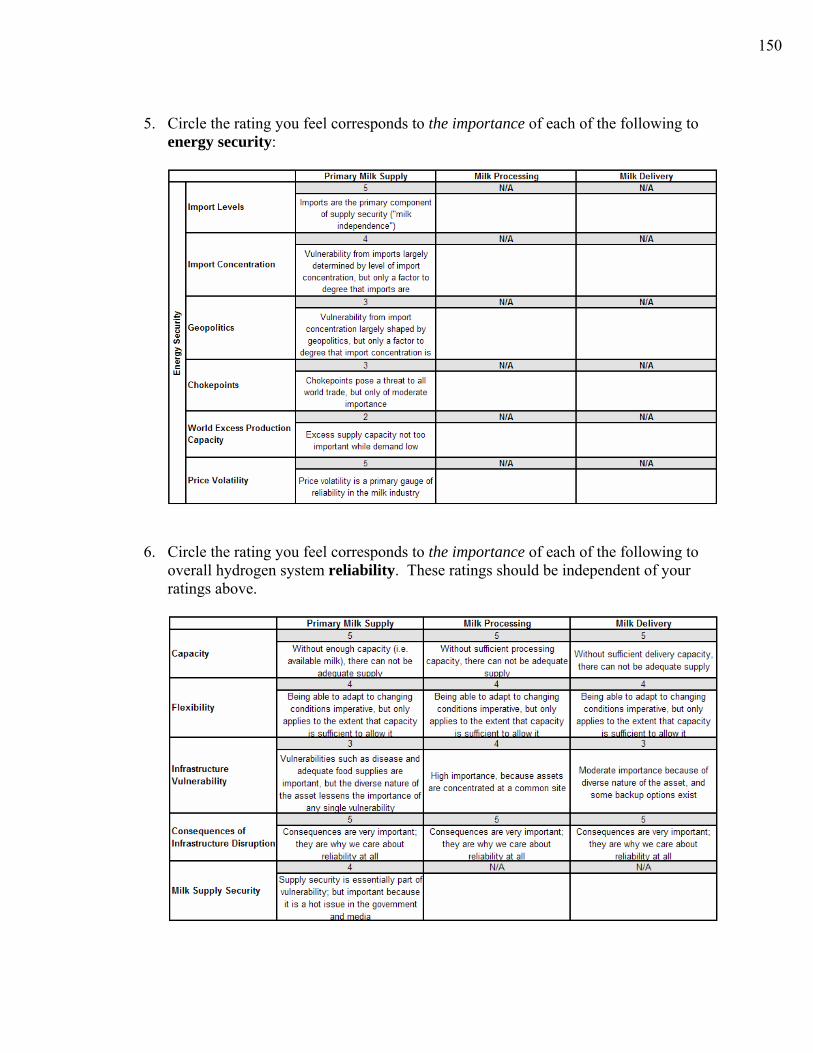
150
5. Circle the rating you feel corresponds to the importance of each of the following to
energy security:
6. Circle the rating you feel corresponds to the importance of each of the following to
overall hydrogen system reliability. These ratings should be independent of your ratings above.
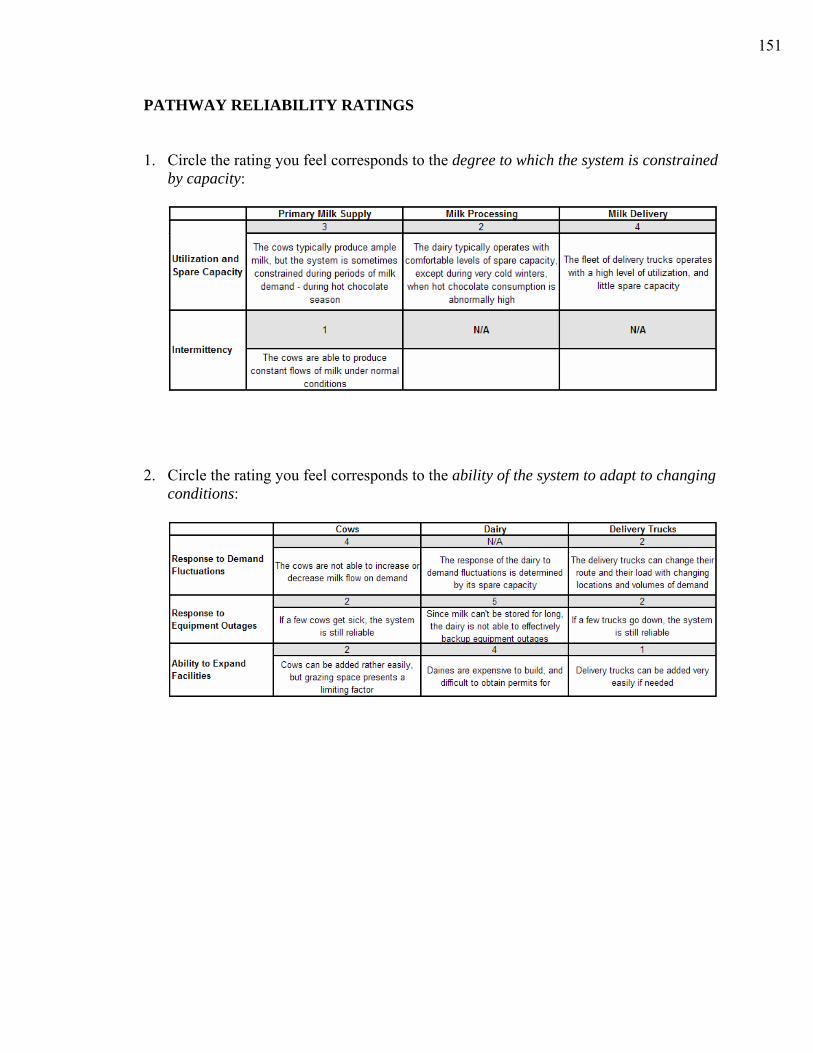
151
PATHWAY RELIABILITY RATINGS 1. Circle the rating you feel corresponds to the degree to which the system is constrained
by capacity:
2. Circle the rating you feel corresponds to the ability of the system to adapt to changing
conditions:
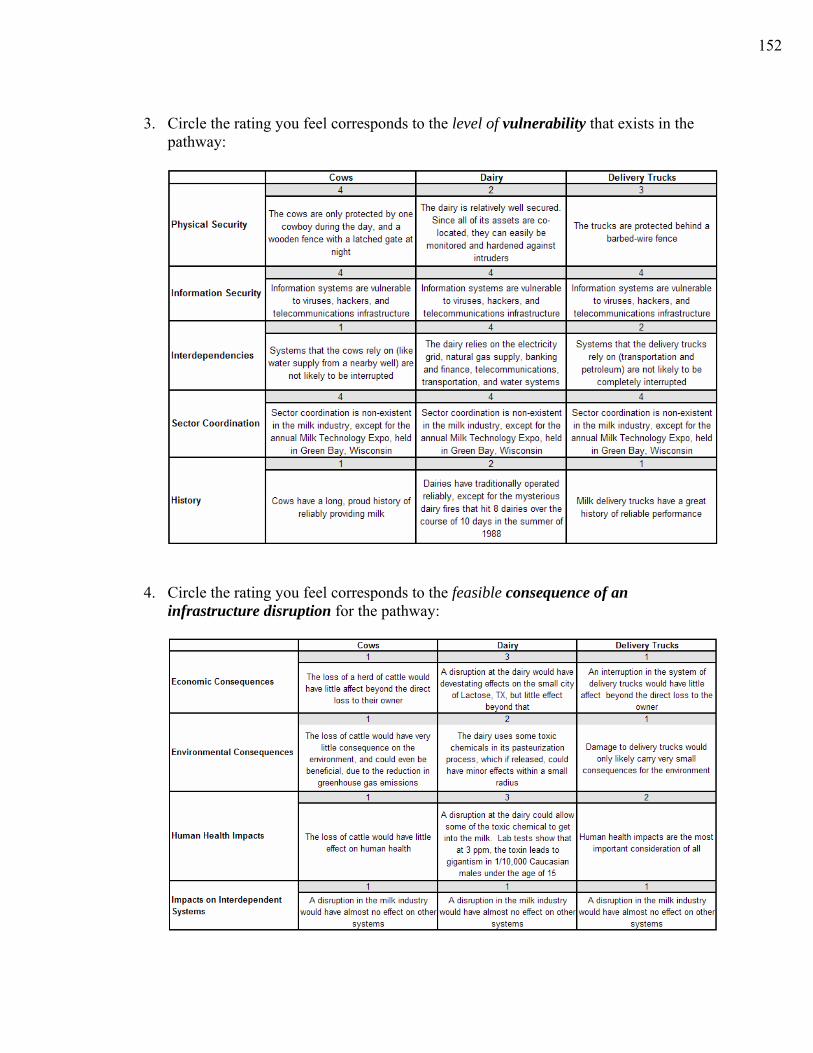
152
3. Circle the rating you feel corresponds to the level of vulnerability that exists in the
pathway:
4. Circle the rating you feel corresponds to the feasible consequence of an
infrastructure disruption for the pathway:
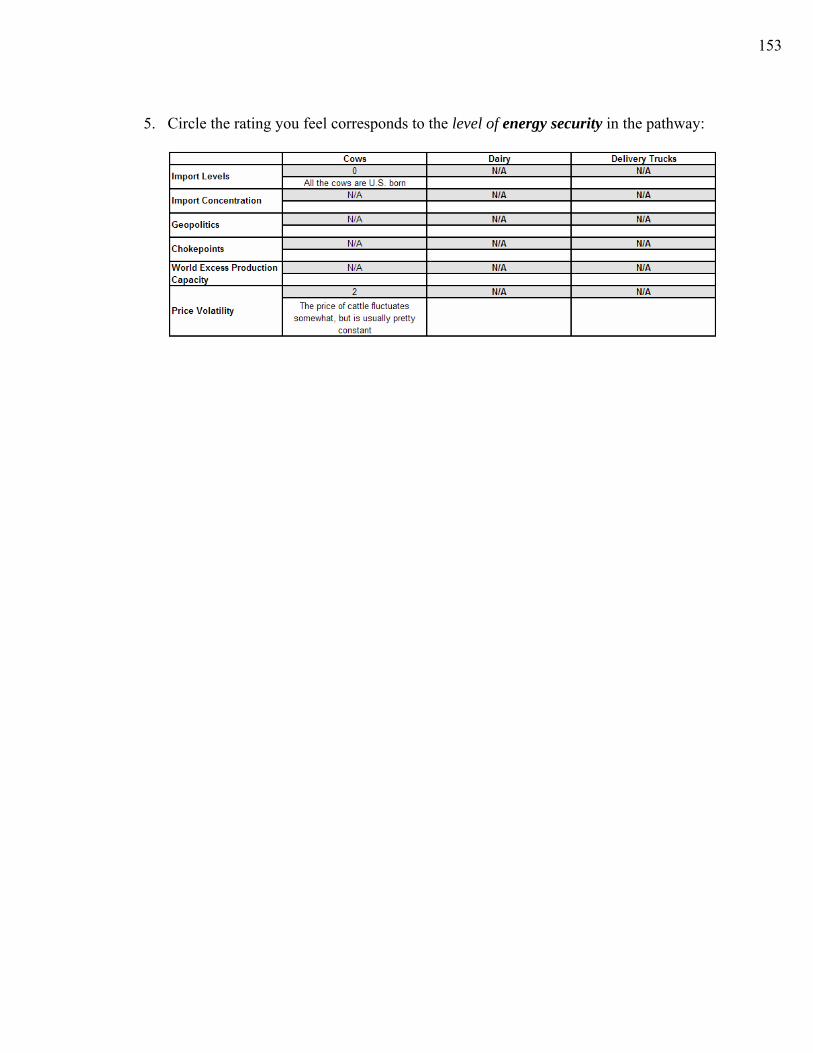
153
5. Circle the rating you feel corresponds to the level of energy security in the pathway:
154
GLOSSARY
Terms listed here are defined as they are meant to be considered in this study. The definitions presented here may not apply universally outside of this study.
Ability to expand facilities: The degree to which portions of the system or subsystem can be easily and cost-effectively expanded Adequacy: The ability of the system or subsystem to provide hydrogen within consumer accepted standards to supply total demand, including expected outages within the system Capacity: The ability of the system or subsystem to provide sufficient throughput to supply final demand Centralized production: A large hydrogen production facility supplying a wide region Chokepoints: The degree to which imported primary energy resources are vulnerable to disruptions in narrow shipping lanes Consequences of Infrastructure Disruption: The degree to which a disruption in the system or subsystem causes harm Distributed production: A small hydrogen production facility producing hydrogen to be used onsite Economic impacts: The degree to which a disruption in the system or subsystem causes economic damage to industry stakeholders, the government, or the public Electrolysis: Electricity passes through an electrolyte and breaks water into its fundamental components, producing hydrogen and oxygen: 2H2O → 2H2 + O2 Energy security: The degree to which the primary energy system is secure against threats to global supply infrastructure Environmental impacts: The degree to which a disruption in the system or subsystem causes environment damage Flexibility: The degree to which the system or subsystem is able to adapt to changing conditions Geopolitics: The degree to which the political and social conditions in primary-energy-exporting countries threaten their supply to the U.S.
155
History: The degree to which the system or subsystem has been prone to disruption in the past Human health impacts: The degree to which a disruption in the system or subsystem harms the health of employees and/or the public Impacts on interdependent systems: The degree to which a disruption in the system or subsystem causes damage to interdependent systems Importance: The degree to which an aspect of reliability weighs on the reliability of the hydrogen pathway Imported liquefied natural gas (LNG): Natural gas supplies imported as a liquid Import concentration: The degree to which imports are concentrated among a small group of supplying countries Import levels: The degree to which the primary energy supply relies on resources originating outside of the U.S. Information security: The degree to which information assets in the system or subsystem are secure against threats Interdependencies: The degree to which the system or subsystem relies on other infrastructures for its reliable operation, and is vulnerable to their disruption Intermittency: The degree to which the productivity of the system or subsystem is not constant Physical security: The degree to which assets in the system or subsystem are secure against physical threats Pipeline: Hydrogen transported through a pipe, often buried underground Price volatility: The degree of fluctuation in the average price of primary energy Primary energy supply system: The upstream system(s) providing the energy from which hydrogen is derived (e.g., natural gas, electricity, or renewable supply infrastructure) Response to demand fluctuations: The degree to which the system or subsystem is able to adapt to varying demand levels and locations Response to equipment outages: The degree to which the system or subsystem is able to continue reliable operation in the event of equipment downtime
156
Sector coordination: The degree to which coordination between stakeholders within the sector results in an effective exchange of information alerting stakeholders of emerging threats and mitigation strategies Security: The ability of the system or subsystem to mitigate risk and withstand unexpected interruptions Steam methane reformation (SMR): A thermochemical process by which methane (CH4) – the primary component of natural gas – is converted into hydrogen. The reaction occurs in two steps:
CH4 + H2O → CO + 3H2 (Steam reforming) CO + H2O → CO2 + H2 (Water-gas shift reaction)
The overall reaction is given by: CH4 + 2H2O → 4H2 + CO2 Utilization and spare capacity: The degree to which the capacity of the system or subsystem is being used Vulnerability: The degree to which the system or subsystem is susceptible to disruption World excess production capacity: The degree to which excess production capacity exists in the global market, and provides flexibility against demand fluctuations and supply outages
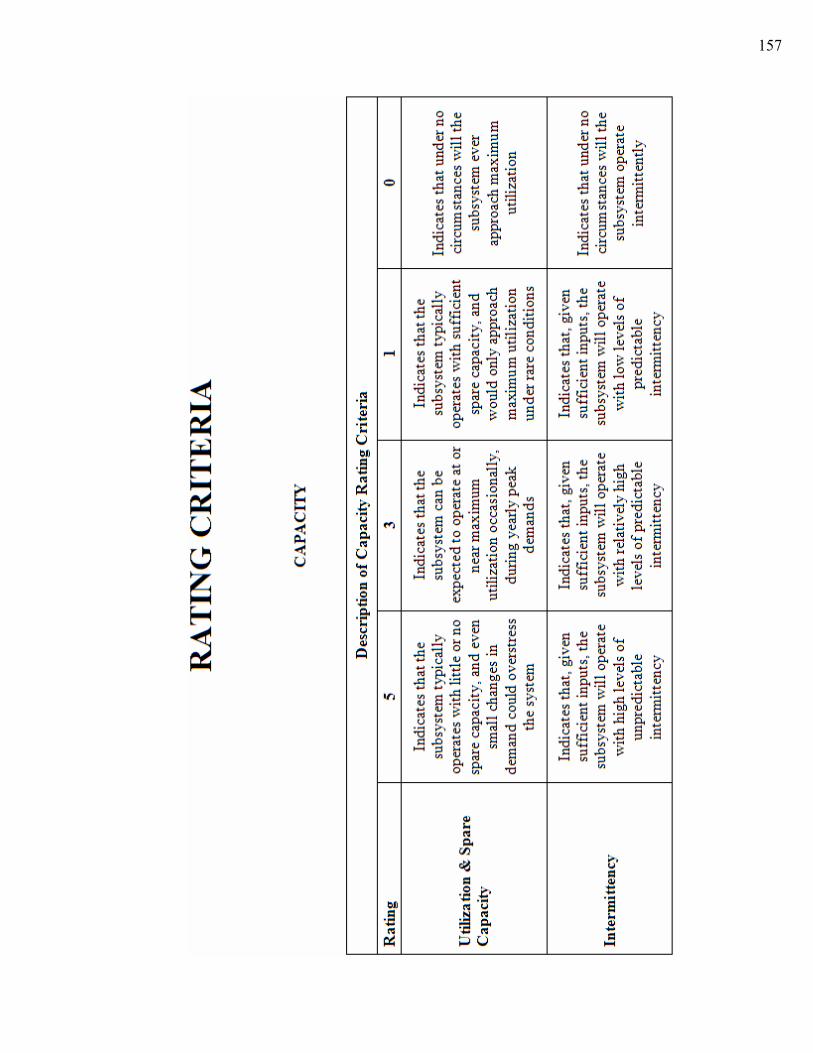
157
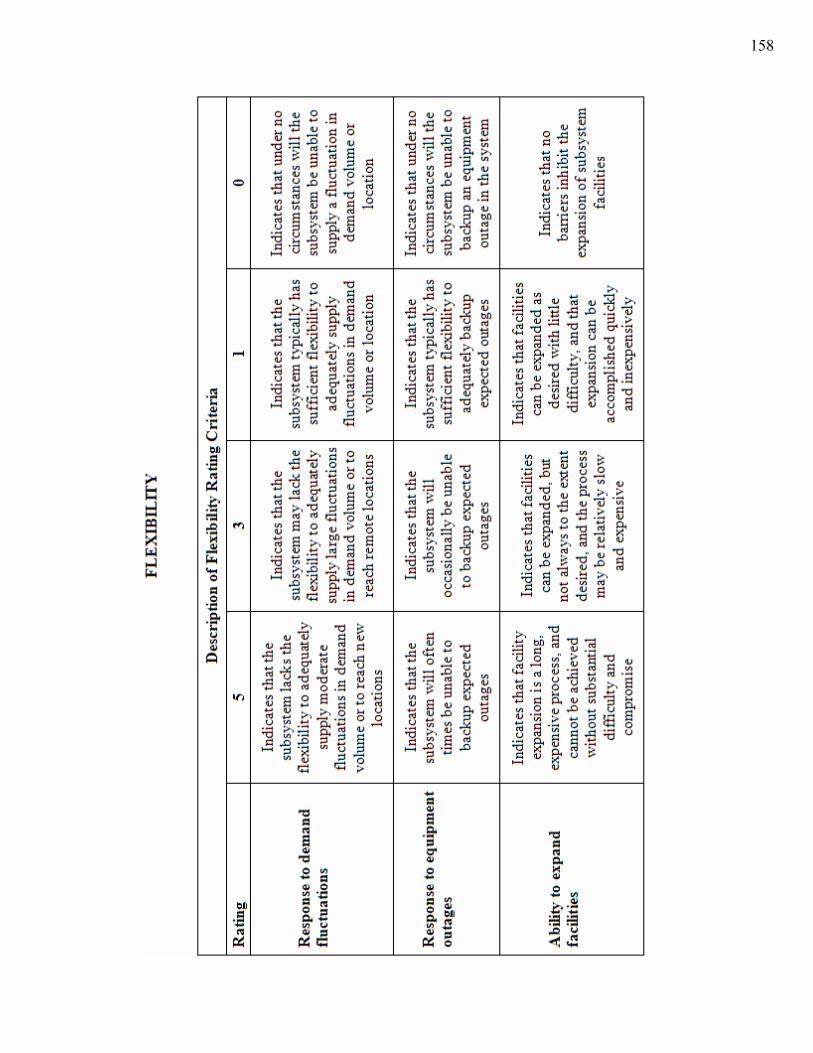
158
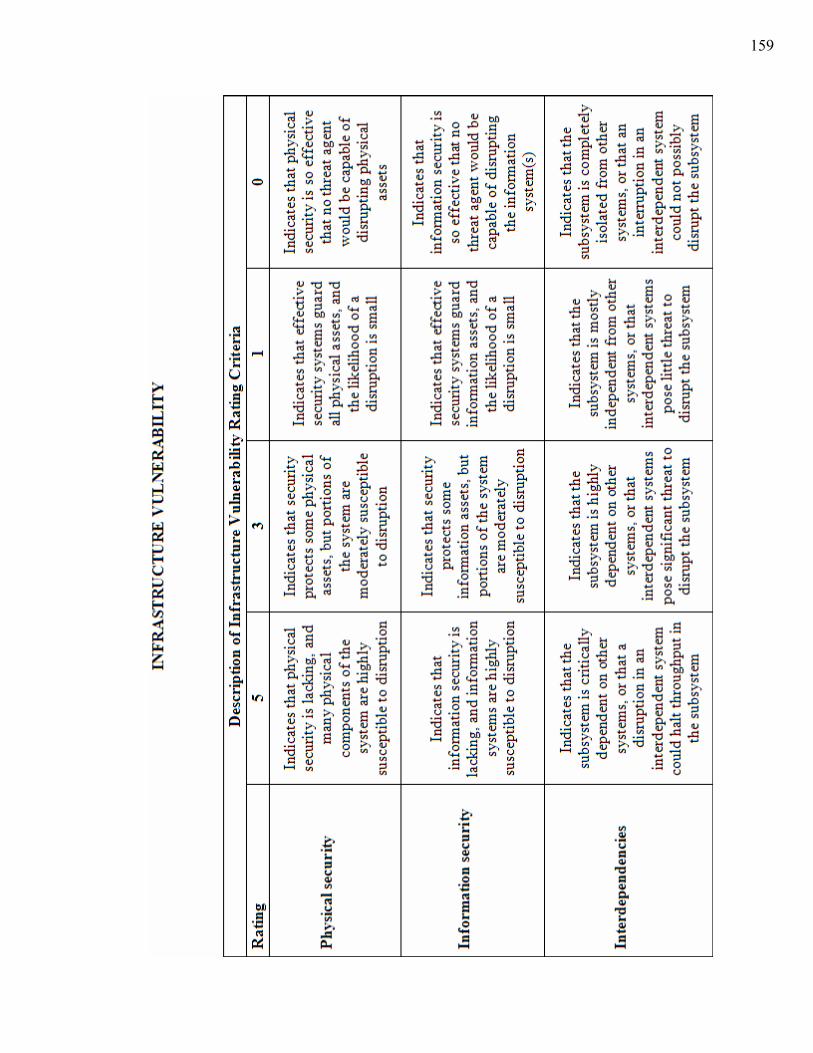
159
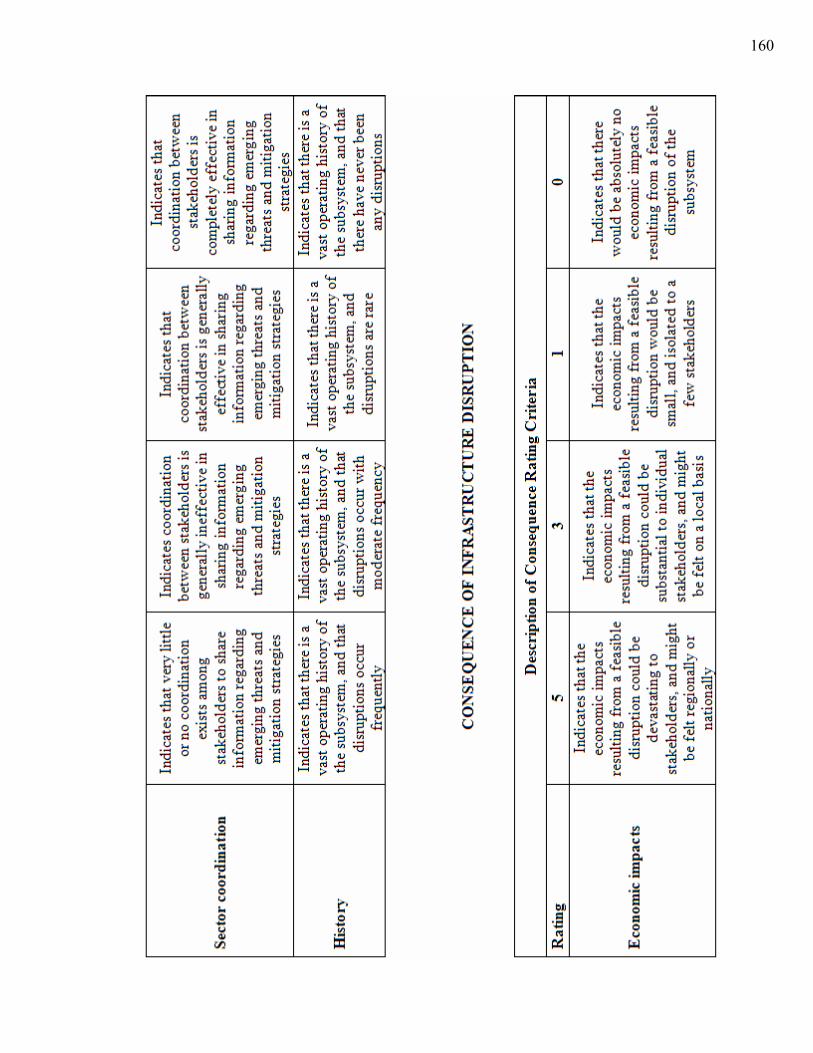
160
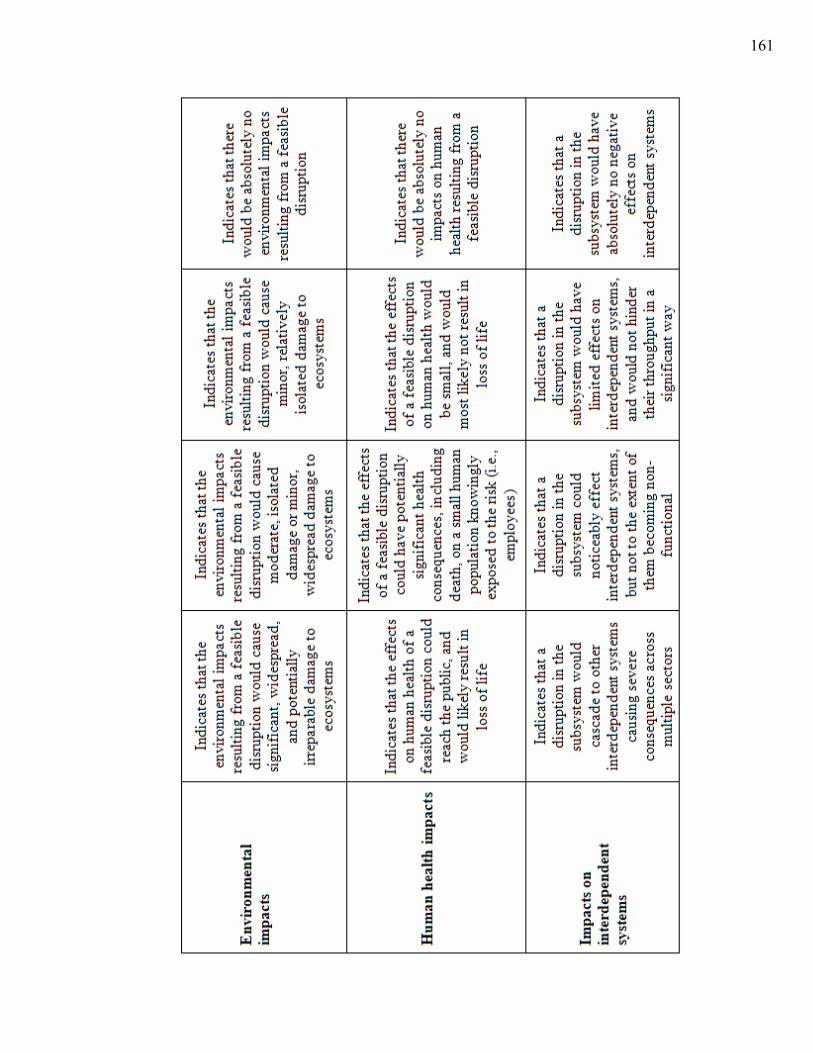
161
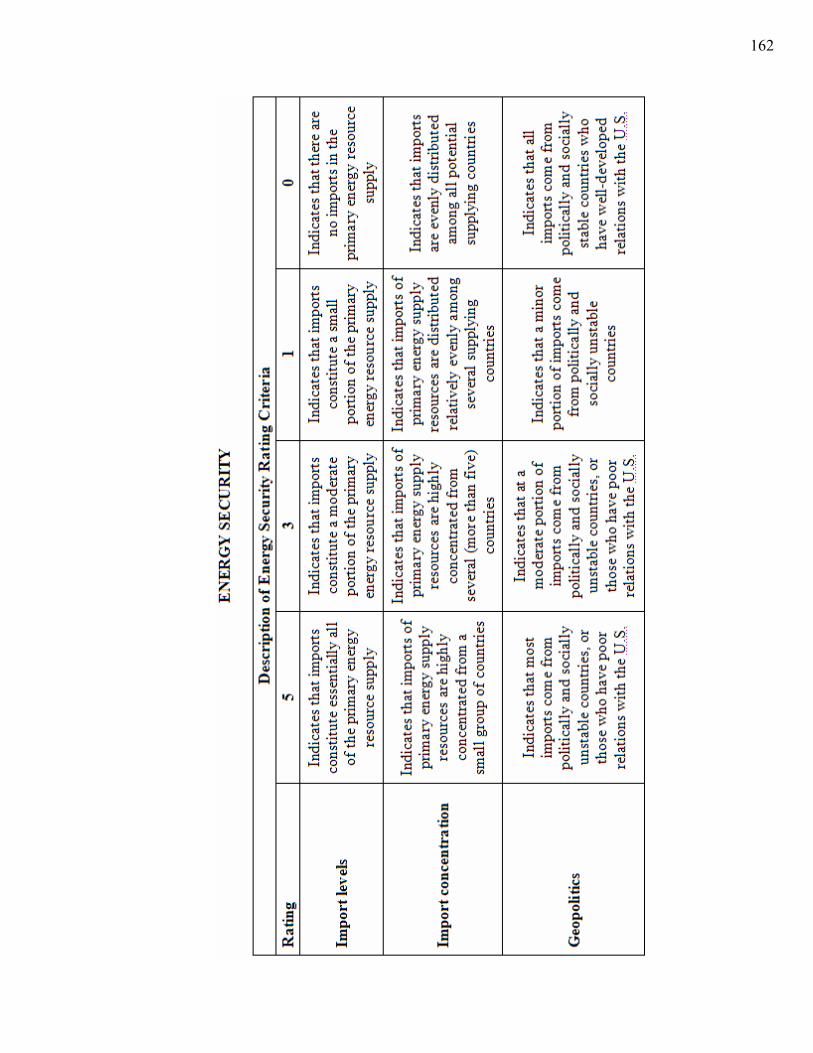
162

163

164
APPENDIX D: AUTHOR’S RELIABILITY RATINGS
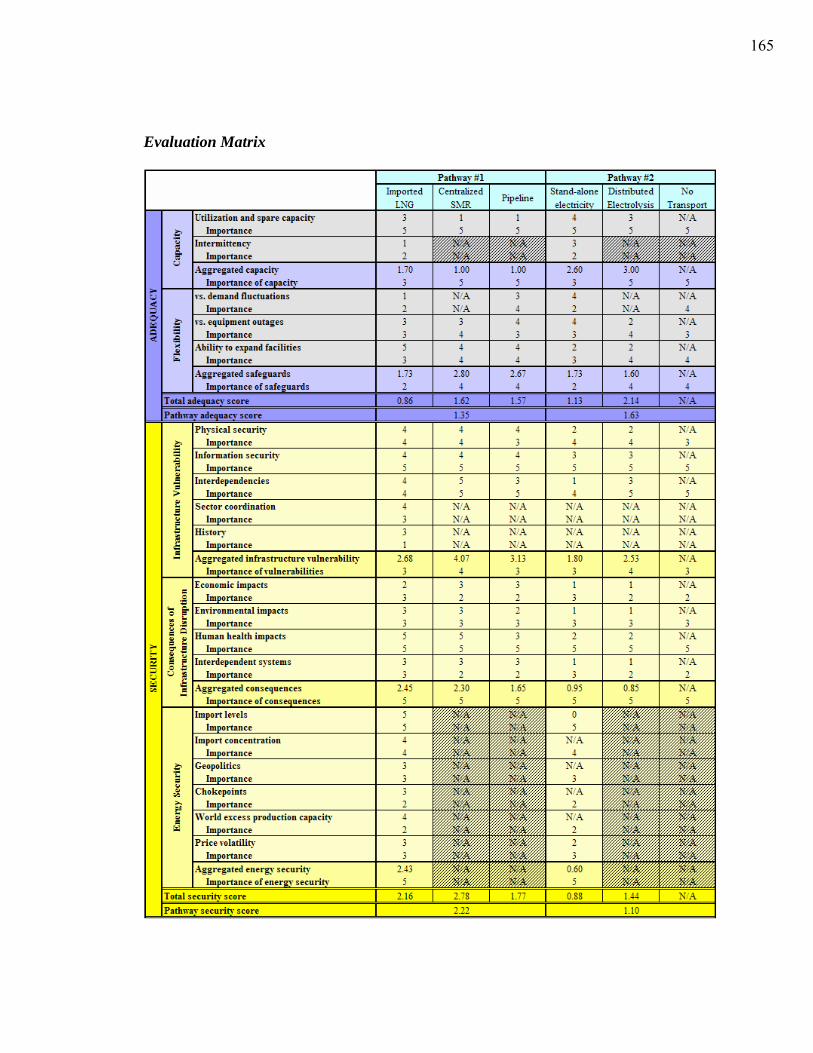
165
Evaluation Matrix
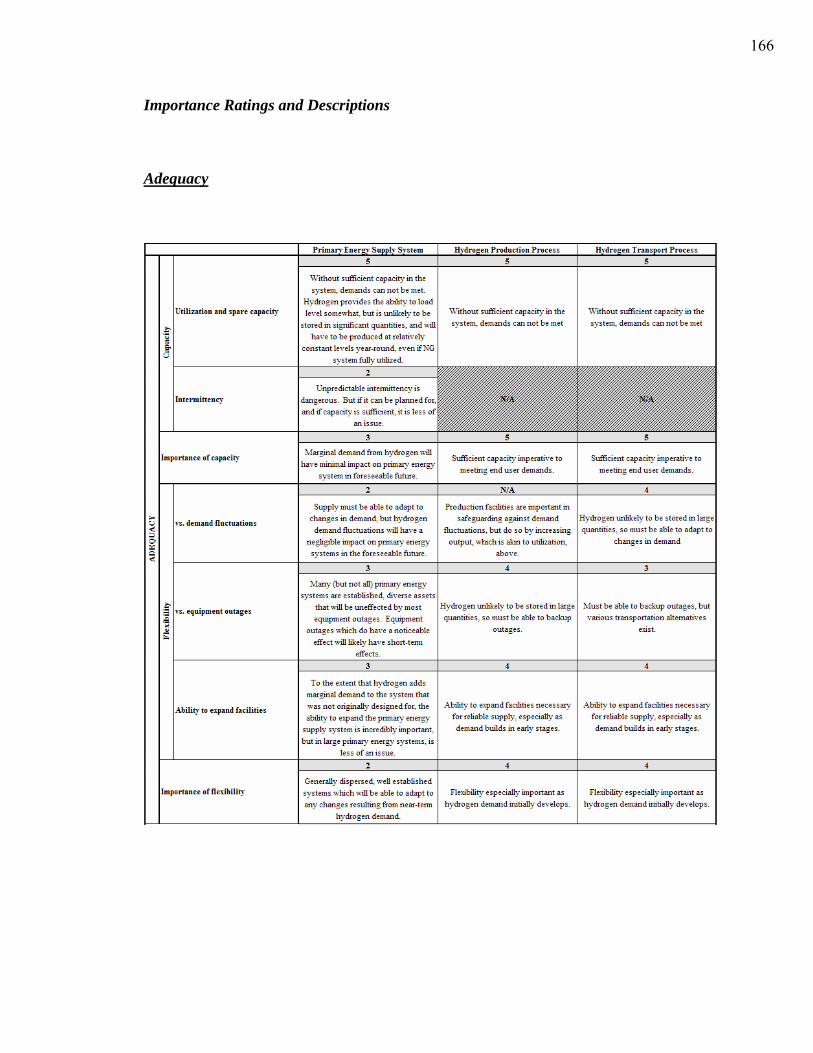
166
Importance Ratings and Descriptions
Adequacy
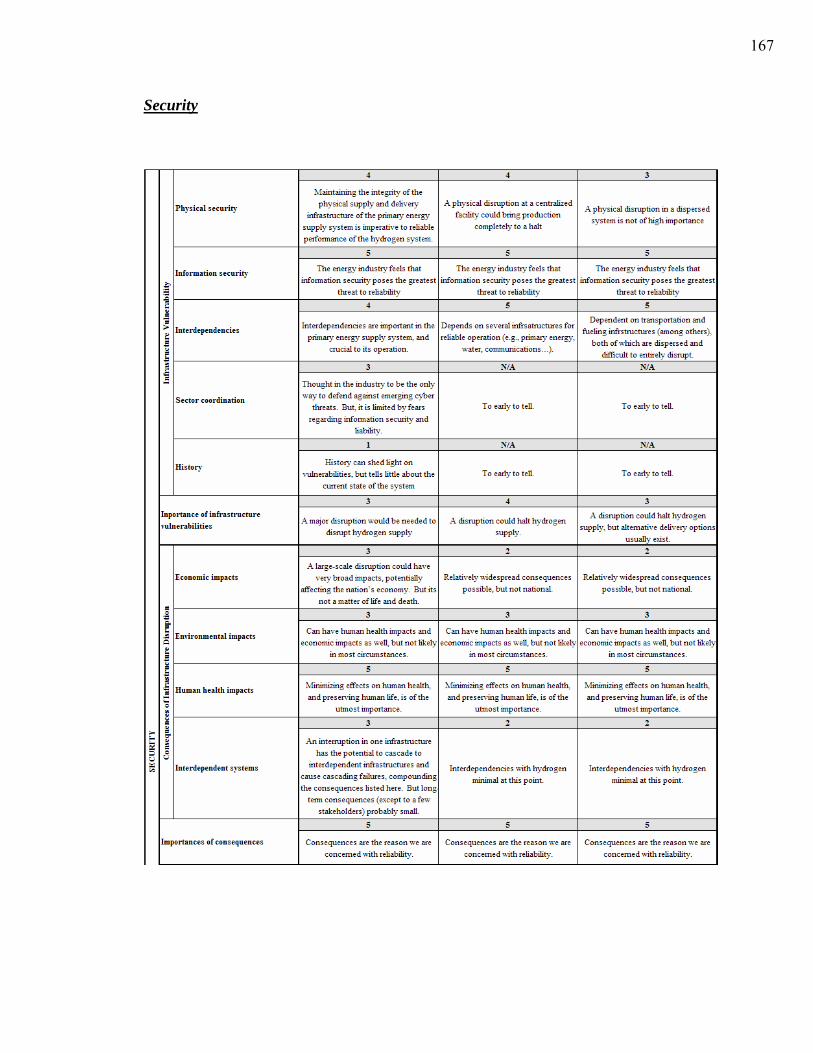
167
Security
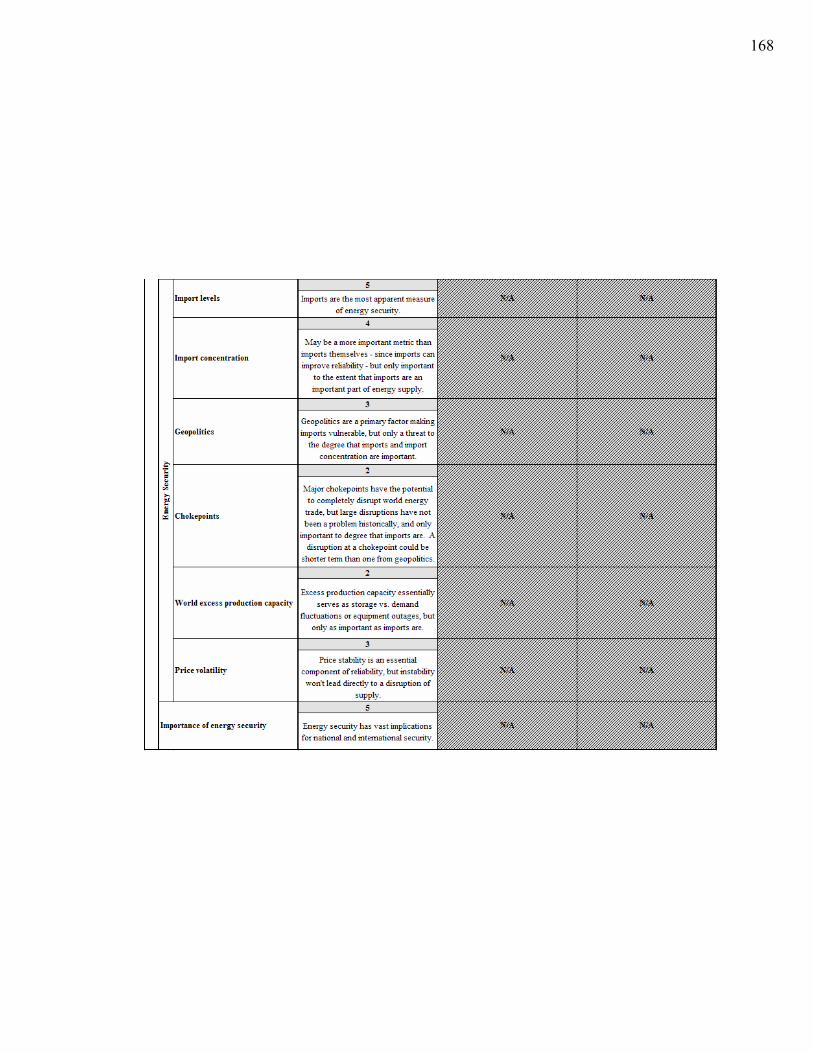
168
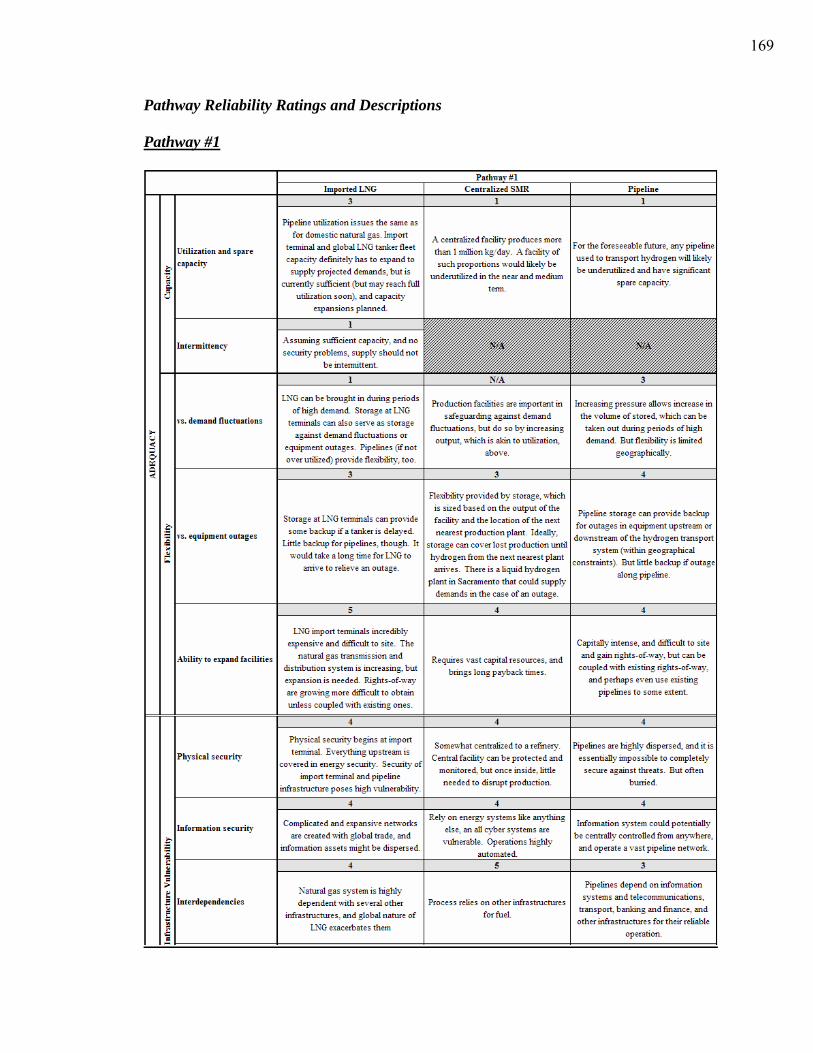
169
Pathway Reliability Ratings and Descriptions
Pathway #1
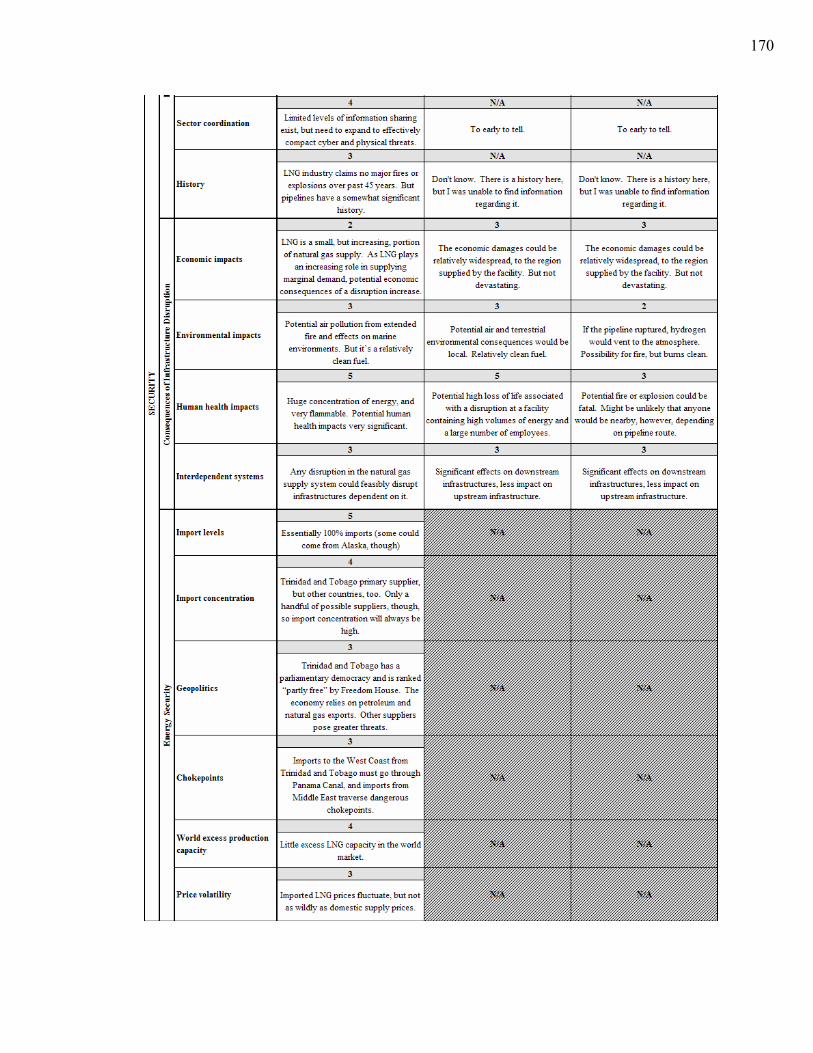
170
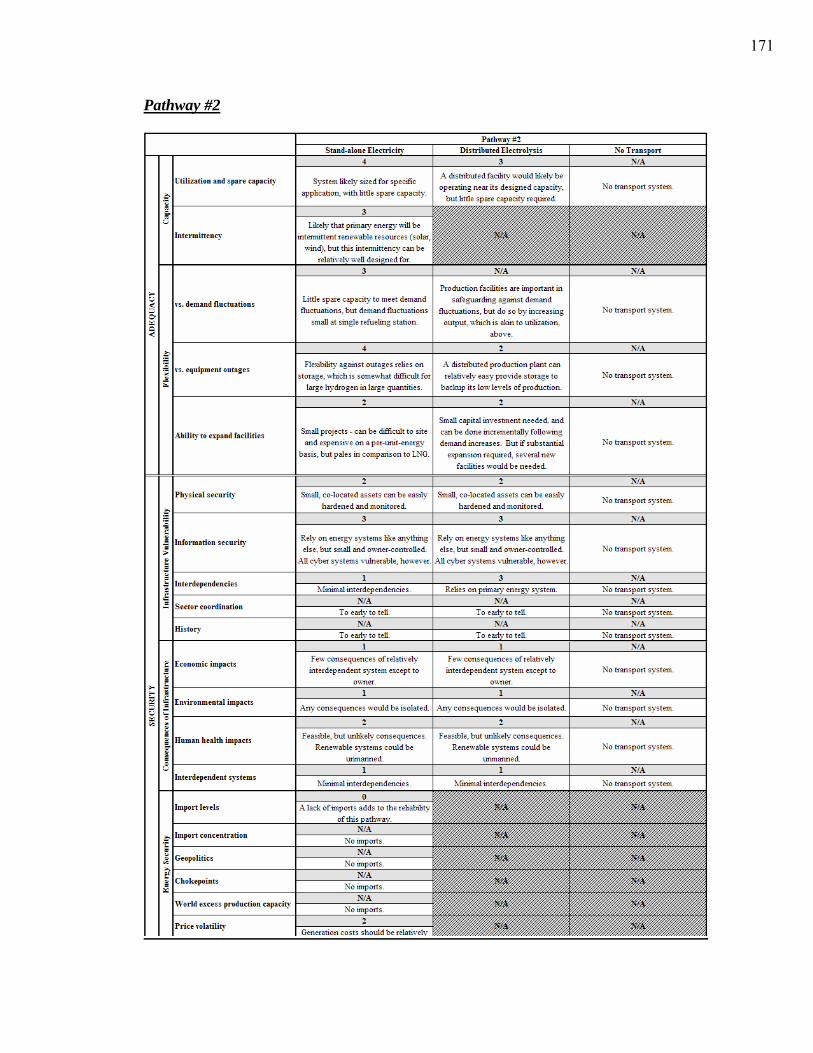
171
Pathway #2
Related Documents