A methodology for user directed search in evolutionary design Jonathan Byrne • Erik Hemberg • Michael O’Neill • Anthony Brabazon Received: 19 July 2012 / Revised: 4 March 2013 / Published online: 18 April 2013 Ó Springer Science+Business Media New York 2013 Abstract A designer should be able to express their intentions with a design tool. This work describes a methodology that enables the architect to directly interact with the encoding of designs they find aesthetically pleasing. Broadening interaction beyond simple evaluation increases the amount of feedback and bias a user can apply to the search. Increased feedback will have the effect of directing the algo- rithm to more fruitful areas of the search space. We conduct trials on two interfaces for making localised changes to a design in order to evaluate if the user is capable of directing search. In addition, an examination of the locality of changes made by the users provides an insight into how they explore the search space. The results show that a suitably designed interface is capable of directing search and that the par- ticipants used different magnitudes of change during directed search. Keywords Grammatical evolution Interactivity Interrupt intervene and resume 1 Introduction In traditional interactive evolutionary computation (IEC) there is a disconnect between the user and the algorithm. User evaluation through selection is only indirectly responsible for the output. The designer must feel directly involved in the J. Byrne (&) E. Hemberg M. O’Neill A. Brabazon Natural Computing Research and Applications Group, University College Dublin, Dublin, Ireland e-mail: [email protected] E. Hemberg e-mail: [email protected] M. O’Neill e-mail: [email protected] A. Brabazon e-mail: [email protected] 123 Genet Program Evolvable Mach (2013) 14:287–314 DOI 10.1007/s10710-013-9189-6

Welcome message from author
This document is posted to help you gain knowledge. Please leave a comment to let me know what you think about it! Share it to your friends and learn new things together.
Transcript
A methodology for user directed search in evolutionarydesign
Jonathan Byrne • Erik Hemberg • Michael O’Neill •
Anthony Brabazon
Received: 19 July 2012 / Revised: 4 March 2013 / Published online: 18 April 2013
� Springer Science+Business Media New York 2013
Abstract A designer should be able to express their intentions with a design tool.
This work describes a methodology that enables the architect to directly interact
with the encoding of designs they find aesthetically pleasing. Broadening interaction
beyond simple evaluation increases the amount of feedback and bias a user can
apply to the search. Increased feedback will have the effect of directing the algo-
rithm to more fruitful areas of the search space. We conduct trials on two interfaces
for making localised changes to a design in order to evaluate if the user is capable of
directing search. In addition, an examination of the locality of changes made by the
users provides an insight into how they explore the search space. The results show
that a suitably designed interface is capable of directing search and that the par-
ticipants used different magnitudes of change during directed search.
Keywords Grammatical evolution � Interactivity � Interrupt intervene and resume
1 Introduction
In traditional interactive evolutionary computation (IEC) there is a disconnect
between the user and the algorithm. User evaluation through selection is only
indirectly responsible for the output. The designer must feel directly involved in the
J. Byrne (&) � E. Hemberg � M. O’Neill � A. Brabazon
Natural Computing Research and Applications Group, University College Dublin, Dublin, Ireland
e-mail: [email protected]
E. Hemberg
e-mail: [email protected]
M. O’Neill
e-mail: [email protected]
A. Brabazon
e-mail: [email protected]
123
Genet Program Evolvable Mach (2013) 14:287–314
DOI 10.1007/s10710-013-9189-6

design process [3]. Take the example of a user evaluating bridge designs for an
interactive evolutionary algorithm. Through selection they manage to find the
perfect bridge, except that the handrail is out of place. The user knows it is possible
to move the handrail to the correct place and wants to alter the design. If evaluation
is the only means of making this change then the user must select bridges where the
handrail is in the correct place and hope the algorithm intuits their wishes correctly.
Interrupt, intervene and resume (IIR) is a desirable quality for an evolutionary
design system [3] as it allows the user to directly manipulate the design while
remaining within the evolutionary framework. Incorporating the immediate wishes
of the designer into the process is necessary if evolutionary algorithms are to be
used for design.
Grammatical evolution (GE) has shown itself to be a suitable representation for
evolving architectural designs when combined with shape generating grammars [34,
38, 39]. For IIR to work with GE it must be possible to map changes to the
phenotype back to the genotype. The mapping used by GE complicates this process.
It is possible the user could make changes that are not expressible in the grammar
and so a reverse mapping would be impossible. The user can export the design to a
suitable CAD format and make further changes but then the design cannot be
evolved.
An alternative approach that permits IIR when a mapping process is involved is
to change the phenotype by directly altering the genotype. This work presents two
novel interfaces that enable the user to directly manipulate the chromosome and
instantly examine the resulting change. The immediate feedback presented to the
users allows them to observe the possible impact of genotypic changes and choose
their preference accordingly. The interface is not intended to replace evaluation in
IEC but to increase user input through direct intervention and enhance existing
interactive evolutionary design tools. The primary contribution of this work is that it
provides a focused version of selection driven search that incorporates the intentions
of the user into the evolutionary design process.
Locality—how well neighbouring genotypes correspond to neighbouring
phenotypes - has been described as a key element in Evolutionary Computation
[28]. In standard GE mutation there are two component behaviours. Nodal mutation
alters a part of the genome that encodes for a leaf node of a derivation tree and
structural mutation encodes for an internal node on a derivation tree. It has been
previously demonstrated that nodal and structural mutation had a perceivable
difference in the locality of their changes [6, 7]. Nodal mutation generated changes
of high locality while structural mutation generated changes of low locality.
By giving the user the ability to selectively apply each operator the user can
choose to move a small or a large distance from the current individual. Choosing
which operator to apply allows the user to bias the search toward exploring a
specific area of the search space, which has been shown by Whigham [51] to
improve evolutionary search. User interaction with the search is increased by
directly mutating individuals they find appealing. The approach taken in this work
makes the assumption that when users want to see similar variations of their
preferred designs. The experiments described in this work evaluate different user
288 Genet Program Evolvable Mach (2013) 14:287–314
123

interfaces to the evolutionary algorithm. The intention of the experiments is to
explore if the interface can aid the evolutionary design process.
The intention of this work is to examine if an IIR methodology combined with a
suitable interface is capable of directing search. To this end, empirical experiments
test whether the user can manipulate a given design to match a specified target.
Previous research in this area is discussed in Sect. 2 An overview of grammatical
evolution and the mapping process is given in Sect. 3 The initial interactivity
experiment and static user interface are described in Sect. 4 The results from the first
experiment led to a novel implementation of the animated interface. A new series of
experiments were carried out on the animated interface, which are described in Sect. 5
Finally, the conclusions and future work are discussed in Sect. 6.
2 Related research
This work combines the use of grammars for architectural design with an
investigation into different approaches for interactive evolutionary computation.
Accordingly, the related research is split into two taxonomies.
2.1 Grammars for architectural design
Grammars are a simple way of describing a generative encoding that allow for
syntactical correctness, compression and domain knowledge embedding [22]. A
grammar defines everything that can be said in a language. A correctly formed
grammar ensures that every completely mapped individual is valid. As well as
ensuring syntactic correctness, grammars allow domain knowledge to be embedded
in the system. By constraining the system to particular constructions or by calling
predefined functions, the user can manipulate how the individuals generated by the
grammar will behave.
The use of grammars to generate shapes was originally conceived by Stiny [45].
The shape grammar formalism developed by Stiny uses three types of rules, a start
rule, at least one transformation rule and a termination rule. The transformation
rules are applied to the start rule to generate shapes until a termination rule is
reached. Shape grammars have had several successful applications for generating
designs. Koning and Eizenberg [26] generated prairie houses in the style of Frank
Lloyd Wright by starting at the central fireplace and building around it with
variations on his tradition design. A shape grammar for describing and generating
coffee maker designs was set out in [1] and there have been several shape grammars
for capturing the aesthetic signature of classic designs such as the work by Pugliese
and Cagan [41] on Harley Davidson motorcycles and the work by McCormack et al.
[31] on Buick cars.
While shape grammars have a great expressive power, there is an inherent
difficulty with implementing shape grammars on a computer. The computer must be
able to recognise emergent shapes so that transformational rules may be applied to
them. Computer vision algorithms are required to categorise these emergent shapes.
The problem is explained in greater detail in [17]. There are three components
Genet Program Evolvable Mach (2013) 14:287–314 289
123

required to implement shape grammars on a computer. An interpreter is required to
apply shape grammar rules, a parser to deduce if a shape is in the shape grammar,
and an inference program that given a set of shapes would infer the rules that
created them.
O’Neill et al. [38] used context free grammars (CFG) in conjunction with
grammatical evolution to generate two dimensional shapes. An objective fitness
function and a specific target was used to automatically evolve designs. This work
was furthered in O’Neill et al. [39] to make three dimensional designs for a smoking
shelter. The output was rendered using Blender [44] and a user interface was
provided for interactive fitness evaluation. The results attained were limited by the
fact that many designs in the grammar were not connected to each other. Hemberg
et al. [23] combined GE with a variation on Lindenmayer systems [40] to create
abstract architectural designs. Evolution was guided by the user and by objective
shape rules such as symmetry and smoothness. The user could also add repellors and
attractors to manipulate the overall shape that was generated.
Machado et al. [29] used a graph based evolutionary approach combined with
context free design grammars to evolve images. Context Free Art [11] is an image
generation software package that uses context free design grammars to generate
shapes and patterns. In this work the genotype was a well formed context free
grammar that was represented as a graph. The graph used nodes to encode for non-
terminals and the edges were annotated with the parameter values being passed to
the non-terminals. The experiments used both objective and subjective fitness tests.
McDermott et al. [34] compared shape grammars with CFGs for design
generation. It was shown that CFGs are easier to manipulate and eliminate much
of the ambiguity present in shape grammar mappings-terminals. There have been
several applications that have used CFGs for design generation. The work by
Wonka et al. [52] used a context free grammar based approach for rapidly
generating feasible architecture. By separating the generation process into split and
set grammars they could generate varied architectural structures that still had
aspects of regularity. Set grammars specify the overall layout of a design while split
grammars break up an object into smaller interchangeable components. The results
generated by the split grammar would then be used as components by the set
grammar.
Coia and Ross [10] combined a context free grammar with CityEngine [15] for
generating three dimensional buildings. The grammar applied rules such as extrude,
rotate, split scale and insert, to a starting component to generate connected yet
varied designs. The buildings were evolved using objective aesthetic constraints
such as the number of unique face normals, overall surface area and overall height.
In an effort to create more coherent designs and also to avoid problems of infinite
recursion in a grammar, higher order functions (HOF) were introduced. Currying
higher order functions, i.e., setting a function argument to a fixed value, allows
recursion to be used without having to worry about non terminating recursive calls
Yu [53]. McDermott et al. [33] incorporated this approach into a CFG. Combining
higher order functions and lambda abstraction meant that the problem of
connectedness in a generated design was addressed and it also allowed for more
modularity, regularity and hierarchy in the resulting designs.
290 Genet Program Evolvable Mach (2013) 14:287–314
123

The designs generated in this work use a context free grammar that incorporates
both higher order functions and lambda functions to generate the designs. This
means that there is a non-trivial mapping process between the genotype and the
phenotype as discussed in greater detail in Sect. 3.2 The next section describes
methods for user interaction with an evolutionary algorithm similar to the methods
implemented in this work.
2.2 Interactive evolutionary computation
Human interaction was originally introduced to the evolutionary process for
problems where no objective fitness function could be found. One of the earliest
applications was the generation of images by Dawkins [13]. Interactive fitness
functions have allowed EC to be applied to problems that have aesthetic
considerations such as music and computer graphics, This allows EAs to function
as an exploratory tool as opposed to being limited to optimisation.
The primary problem with user interaction is the ‘‘fitness bottleneck’’ [4]. An
algorithm can evaluate individuals in parallel and is limited only by the speed and
number of the processors. Humans, conversely, can only process small amounts of
input that is limited by their perceptual abilities and can only assign fitness to
individuals serially. Miller [36] showed that humans have difficulty handling more
than approximately seven quantized measurements of information. This is true
regardless of sensory modality. The result is that user input slows the process of the
EA due to the limited number of evaluations that they can perform.
How the user interacts with the algorithm is of paramount importance. There are
many different implementations that vary the level of interaction and the amount of
information provided to the user. In his survey paper Takagi [47] splits IEC into
several different categories, each based on the level of interaction. Approaches that
allow direct participation in the evolutionary process through means other than
evaluation are categorised as active user intervention (AUI) [47]. The interfaces
described in this work are based on the AUI approach. Several successful AUI
methodologies have been used to increase user participation and are discussed
below.
2.2.1 Online knowledge embedding
Online knowledge embedding (OLKE) [46] provides a mechanism for directing the
algorithm through hints, ideas or intentions. The user highlights components of a
design that they think have high fitness and the genes relating to these components
are then fixed, which reduces the search space. An example of this is the tracking a
criminal suspect through face-space with a genetic algorithm [9]. The main
advantage of using IEC for this task was that it relied on human recognition instead
of human recall. Identikit images that are normally used for criminal investigations
were evaluated by the user. There were 10 discrete values for rating the likeness. If a
user felt that they had matched a particular feature they could set it so it would stay
fixed for the rest of the run. OLKE is only possible if each component of the output
maps directly to a particular gene.
Genet Program Evolvable Mach (2013) 14:287–314 291
123

Hart [19] developed an evolutionary art that used a novel form of tree alignment
to create better genetic dissolves. The user was given fine grained control of the
mutation operator and was allowed to select or mask different types of mutation.
They could also adjust the relative probability of mutation and bias the mutation rate
depending on tree depth. This work is notable for letting the user apply their own
intuition on the operator.
SBART [49], a 2D picture generator, enables the user to break parts of the
population into different sub-populations. Each sub population evolves separately
from their neighbours. Individuals may be saved and introduced into different
populations, thus allowing individuals to be treated as ‘‘digital amber’’ [42], a
metaphor for how the genetic code of an individual organism is preserved in the
computer after a run is terminated, and whereby it may be reintroduced into future
populations or reused in a different run entirely.
The approach of grouping and categorizing interesting individuals was also used
in the evolutionary art tool NEvAr [30]. During the exploration stage of the
selection process the chosen individuals are saved in a separate gallery. The user
may then categorise the individuals as images that should be discarded, images that
may be useful, images that should be further refined, and images that are artworks
that fully satisfy the user’s aesthetic criteria.
2.2.2 Visualised IEC
Visualised IEC (VIEC) collapses a multi-dimensional search space into a 2D
representation. The individuals are then mapped to the 2D space and presented to
the user. The user is able to observe the distribution and fitness of the population and
direct the search to particular parts of the search space, thus combining both
evolutionary and human search techniques. VIEC has been shown to dramatically
improve convergence. Hayashida and Takagi [20] used self organising maps (SOM)
to collapse an n-D Schaffer function into a 2-D representation and Hayashida and
Takagi [21] compared different methods for mapping an n-D function to a 2-D
representation. The problem with VIEC is that a meaningful mapping from n-D to
2-D space must be performed and the topological relationships must remain intact.
2.2.3 Human based genetic algorithm
Human based genetic algorithms (HBGA) enable the user to apply low level genetic
operators such as mutation, initialisation, selection and crossover to the population
[27]. Using humans is useful in problems such as evolving natural language
statements, where it is hard to design efficient computational operators. HBGA
requires that an individual in the population can be understood by the user and that
the operators perform in a manner intuitive to the user.
Hyper-interactive evolutionary computation (HIEC) extends HBGA by giving
the users access all the genetic operators [5]. HIEC treats the operators as a tool set
for the user. Additional operators such as duplicate, delete are available to the users.
The approach taken in this thesis is similar to HBGA in that the users choose when
and where to apply mutation operators. The difference is that the users are presented
292 Genet Program Evolvable Mach (2013) 14:287–314
123

with the consequences of applying an operator and they select the change they want.
One early example of this is the mutasynth sound generation tool by Dahlstedt [12].
In conjunction with selection, the user manually mutates and freezes sets of genes to
focus the search on preferred individuals.
The approaches described in this work are similar to HBGA and HIEC in that
they allow the user to apply mutation operators. There are also aspects of OLKE as
the user is allowed to focus search on a specific individual of interest. This section
gave an overview of the related research under two taxonomies, grammars for
architectural design and interactive evolutionary computing. The next section gives
a detailed description of grammatical evolution, the evolutionary algorithm used in
the experiments.
3 Grammatical evolution
Grammatical evolution [14, 37] is a grammar based form of genetic programming
[35] that uses evolutionary processes to automatically generate programs. GE uses a
mapping process to create output called the genotype to phenotype mapping. The
genotype to phenotype mapping is a terminology that has been adapted from the
field of biology. A genotype is an encoding upon which the evolutionary operators
of mutation and recombination act. A biological example of a genotype would be
human DNA. Changes to the genotype are translated into changes to the phenotype.
A phenotype is an observable characteristic of an individual. An example of this in
humans would be eye-color or height. Evaluation of the fitness is performed on the
phenotype. This biological concept was introduced to the field of EC as a method
for separating the search and solution space [2] and as a metaphor for describing the
representations and mapping processes.
GE generates strings in a context free language by using a list of numeric values
(called a chromosome) to select the production choices for non-terminals. The
chromosome is made up of codons. Each codon in the chromosome is used to select
a production rule from a BNF grammar. The numeric values of each codon can be
stored as either binary or integer values. The choice of genotype representation has
an effect on the algorithm, as shown by Hugosson et al. [25], but this is not
examined as integer representations are used exclusively in the investigations of this
work. Once all the non-terminals in a derivation have been mapped to terminals an
output string in that language has been generated. The output string is the
phenotypic form of the individual. The phenotype is a computer program that may
then be executed and evaluated by the fitness function.
3.1 A component-based view of mutation in GE
As mutation is applied to the genotype and not the phenotype, single mutation
events combined with the mapping process can result in different magnitudes of
change to the phenotype, i.e., mutation events have different locality. Locality refers
to how well neighboring genotypes correspond to neighboring phenotypes, i.e., a
small change to the genotype results in a small change to the phenotype and vice
Genet Program Evolvable Mach (2013) 14:287–314 293
123

versa. A mapping has locality if the neighbourhood is preserved under that mapping
[43]. In order to perform the classification of different types of mutation event, a
derivation tree of the individual must first be created.
Standard GE mutation can be divided into two types of events, those that are
structural in nature and those that are nodal. Nodal mutation changes a single leaf of
the derivation tree. The structure of the derivation tree remains unchanged. A nodal
codon encodes for a rule that only has terminal productions. Structural mutationchanges one or more internal nodes of the derivation tree (and zero or more leaves)
and can result in a change to the structure of the derivation tree. A structural codon
encodes for a rule with non-terminal productions and zero or more terminal
productions. An example of a nodal and structural mutation is given in Fig. 1b, c.
Previous work investigating locality in GE mutation [6–8] showed that structural
and nodal mutation had different effects on locality during the mapping process and
on the resulting output. Nodal mutation generates high locality changes and
structural mutation generates low locality changes. As the user is exclusively
applying mutation, we shall investigate how the different locality of events are used
to navigate the search space.
3.2 Higher-order function grammar
Hornby [24] states that hierarchy, regularity and modularity are desirable qualities
in a representation for design. McDermott et al. [33] and Yu [53] showed that
grammars were capable of encoding such qualities through the use of higher-order
functions (HOF). Higher-order programming requires that functions can be passed
to other functions as arguments (first-class functions) and that anonymous functions
can be created (lambda expressions). Lambda expressions allow the grammar to
define unique functions for the program which then act as modules. Lambda
expressions also allow for currying, where a pre-existing function is called except
some of the arguments to that function are fixed. Passing functions to other
functions allows for a level of hierarchy in the structure of the program. Both of
these functions combine to generate structures that contain repetition and similarity,
also known as regularity. An example of a program that uses such a grammar is now
given.
(a) (b) (c)
Fig. 1 Nodal (green) and structural (blue) nodes of a derivation tree. Nodal mutation changes a leaf nodewhile structural mutation changes an internal node (Color figure online)
294 Genet Program Evolvable Mach (2013) 14:287–314
123

A simplified example of the functional set of the grammar used in this
experiment is given in Algorithm 1. The geometric objects are created by combining
path functions and connecting functions. Path functions are given scalar values and
return nodes on a path. Connecting functions are given nodes and then generate
additional nodes and connect them together.
Variations of the principles in the following example were used to create the bridge
designs that were used in the experiments. An example of a program is shown in
Algorithm 2. The program uses the map function in conjunction with a scalar list to
generate a list of nodes that follow a circular path 2(a). Two of the arguments to
circle_path() have been fixed or ‘‘curried’’, the axis is set to z-axis and the circle
radius is set to 50. The map function then applies the functions Connect3() and
drop_perpendicular() to the set of nodes generated by circle_path().
Connect3() adds triangles to the nodes, as shown in Fig. 2b, and has the axis
argument curried so that it is set to the y-axis for all of the triangles. Finally
drop_perpendicular() add a vertical line as shown in Fig. 2c. The next section
describes how the distances between bridge designs was measured objectively.
4 Application of nodal and structural mutation using a static interface
This experiment primarily examines if user application of mutation operators can
direct the evolutionary algorithm during search. The secondary goal of the
Genet Program Evolvable Mach (2013) 14:287–314 295
123

experiment is to compare whether separating mutation events allows the user to
navigate the search space more effectively by varying the locality of their search.
The experiment compares user performance at directing search using integer
mutation against a combination of nodal and structural mutation. A static interface
consisting of generated is used as this is the traditional method for interactivity
experiments involving visual stimulus.
The subjective nature of aesthetics makes interactive evolutionary design a
difficult area to quantify. Normally a user is allowed to explore the search space
until they discover an appealing design [30]. This approach is problematic as there
is no way of distinguishing if the algorithm provided any benefit to the search or
whether it just presented randomly generated designs to the user. In addition, there
is also the problem that the interest a user has for a design is completely subjective
and prevents any additional analysis of the results.
In an effort to generate measurable results, the experiment specifies a target
design and the goal for the user is to match that target. The user’s results are then
compared against a control group of randomly generated selections. The user is
asked to match three targets using two different techniques. Although this is quite
different to the design process, it is analogous to the user combining an interesting
design with a design they had observed previously during the evolutionary process,
i.e., finding a path from the current design to one that incorporates features of the
previously generated design. Setting an objective makes the task quantifiable but it
does not simplify the task. The user must change the correct codons before they are
mapped to obtain the desired output. This is a non-trivial task given the complex
mapping processes in GE. The experiment described in the next section examines if
the user can direct search to match a target using such an approach.
4.1 Experimental design
The grammar used in this experiment is a shape generating grammar that outputs
bridges using the higher order function techniques as described in Sect. 3.2 The
interface used in this experiment is shown in Fig. 3. There is a target bridge on the
right hand side and nine bridges to select from on the left hand side. When the user
selects a bridge 8 mutated variations are generated and their choice is saved in a green
box in the top left frame, so that they may generate more mutations from it. The user
can keep selecting bridges until they think they have matched the target or have
(a) (b) (c)
Fig. 2 The output design generated by the program example
296 Genet Program Evolvable Mach (2013) 14:287–314
123

reached the 5-minute time limit. A Euclidean distance measure, was used to calculate
the distance of the user generated results from the target. The graph distance provided
an objective measure to calculate how close the user got to the target. A more detailed
description of the graph distance is given in Sect. 4.2 Twenty four volunteers
participated in this experiment and the experiment itself was approved by the Ethics
Committee in UCD (Reference number: LS-E-11-05-Byrne-ONeill).
There is no crossover used in this experiment. All variants are created exclusively
by mutation events. The mutation operators select a codon from within the coding
region of the genome and increment it by one. As a codon is only used when
choosing the production of a rule, incrementing it by one means that it will always
encode for a new production, thus ensuring a genomic change in the individual. It
also means that the Hamming distance between mutation events is exactly one.
To avoid confusion it was decided to simplify the allowed user input. The user is
limited to either the left mouse button (LMB) exclusively, or both the left and right
mouse button (RMB). When the input is exclusively LMB, standard integer mutation
is applied. When the user has a choice of both buttons, the LMB corresponds to a nodal
mutation and the RMB corresponds to a structural mutation. The intention of this
decision is to examine if more fine grained control can have an effect on how the users
traverse the search space. The targets the user was required to match are shown in
Fig. 4. They were created by generating a random genotype which was then mapped
using the same bridge grammar that the static interface was based upon. Randomly
generating the targets removes any human bias from the target selection process.
The user was allowed two trial runs to familiarise themselves with the static
interface and the different effects of the mutation operators. Finally, after
completion of the trial the user was asked to complete six experiments. The first
Fig. 3 A screen-shot of the interactive GUI. The target is on the right and the results from the previousmutation choice are in the 9 frames on the left
Genet Program Evolvable Mach (2013) 14:287–314 297
123

three of the experiments used integer mutation to match three targets and the next
three experiments used nodal and structural mutation to match the same three
targets. A fixed random seed was used for each experiment so that all participants
would be presented with the same initial designs. The user had a time limit of 5 min
to complete each task. The time of each selection and the individual selected were
recorded. Once the user had completed the experiment they were asked to fill out a
short survey that asked them which features they used to compare similarity.
The user was presented with every selection they had made upon completion of
the experiment and was asked to select the design that most closely matched the
target. In order to see if the improvement over time was due to the choices of users,
a sample of random mutation events was generated for comparison. The random
sample was created by allowing a Mersenne twister random number generator make
selections using the same static interface that participants had used.
Given a sample of randomly generated mutation events l0, and the results of user
application of mutation operators, l1 and l2, where l1 allowed the user to apply
integer mutation and where l2 allowed the user to apply nodal and structural
mutation, the following hypothesis is stated.
H0: There will be no statistically significant difference between the random
sample and either operator, l0 = l1 = l2
H1: There is a statistically significant difference in performance for a particular
operator,l0 6¼ l1kl0 6¼ l2kl1 6¼ l2
a: The significance level of the Wilcoxon rank-sum is 0.05.
4.2 Euclidean graph distance
The output of the evolutionary design software generated graph representations
of designs. The graphs consisted of nodes and edges in a three dimensional
space. Euclidean graph distance uses a Euclidean distance measure to compare
the nodes of the output designs. Euclidean distance is defined as the straight-line
distance between two nodes on the same plane. The distance, d, is given by the
formula:
(a) (b) (c)
Fig. 4 The targets that the users had to match
298 Genet Program Evolvable Mach (2013) 14:287–314
123

dððx1; y1; z1Þ; ðx2; y2; z2ÞÞ ¼ffiffiffiffiffiffiffiffiffiffiffiffiffiffiffiffiffiffiffiffiffiffiffiffiffiffiffiffiffiffiffiffiffiffiffiffiffiffiffiffiffiffiffiffiffiffiffiffiffiffiffiffiffiffiffiffiffiffiffiffiffiffiffiffiffiffiffiffiffiffi
ðx1 � x2Þ2 þ ðy1 � y2Þ2 þ ðz1 � z2Þ2q
:
The graph with the most nodes is selected for iteration. The distance is then
calculated by iterating though each node in the larger graph and comparing it with
the the nearest node in the smaller graph. The distance between these nodes is then
added to the total distance between designs. The euclidean graph distance fulfils the
metric axiom of non-negativity, d(a, b) C 0.
The output graphs consist of nodes and the edges between them but the Euclidean
distance formula only compares nodes in space. The edges between nodes must be
taken into consideration so that d(a, b) = 0 if and only if a = b. Exhaustively
checking how the nodes were connected proved to be computationally expensive.
Instead, while computing the distance between node pairs, the number of outgoing
edges for each pair is also compared. Any difference in the number of outgoing
edges is added to the total fitness. As the fitness is being minimised this results in a
worse fitness.
Two graphs, a and b, are considered identical if the distance for every node in
graph a and its nearest respective node in graph b is zero and the number of edges
for each node pair is identical. While Euclidean graph distance does not fulfill all of
the axioms required by a metric this does not prevent it from being a useful measure
in practice [18, 32]. The next section describes how the metric is used to evaluate
the performance of the participants when using an interface to match a given target.
The next section describes the first interface experiment carried out in this work.
4.3 Results
The results for the distance metrics are shown in Fig. 5. The Figures show the time
taken by the user (in seconds) on the x-axis and the distance from the target on the
intTarget1Euc
time(seconds)
dist
ance
0 50 100 150 200 250 300 350
010
020
030
040
0
bothTarget1Euc
time(seconds)
dist
ance
0 50 100 150 200 250 300 350
010
020
030
040
0
(a) (b)
Fig. 5 The best fitness Euclidean distance for target 1, the x axis is the time taken and the y axis is thedistance from the target. There is no significant improvement in distance during the course of the run
Genet Program Evolvable Mach (2013) 14:287–314 299
123
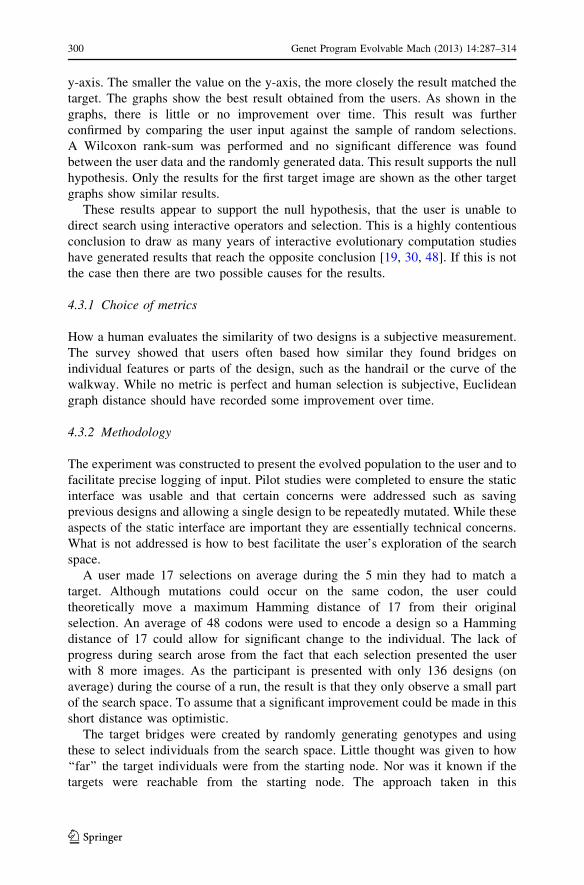
y-axis. The smaller the value on the y-axis, the more closely the result matched the
target. The graphs show the best result obtained from the users. As shown in the
graphs, there is little or no improvement over time. This result was further
confirmed by comparing the user input against the sample of random selections.
A Wilcoxon rank-sum was performed and no significant difference was found
between the user data and the randomly generated data. This result supports the null
hypothesis. Only the results for the first target image are shown as the other target
graphs show similar results.
These results appear to support the null hypothesis, that the user is unable to
direct search using interactive operators and selection. This is a highly contentious
conclusion to draw as many years of interactive evolutionary computation studies
have generated results that reach the opposite conclusion [19, 30, 48]. If this is not
the case then there are two possible causes for the results.
4.3.1 Choice of metrics
How a human evaluates the similarity of two designs is a subjective measurement.
The survey showed that users often based how similar they found bridges on
individual features or parts of the design, such as the handrail or the curve of the
walkway. While no metric is perfect and human selection is subjective, Euclidean
graph distance should have recorded some improvement over time.
4.3.2 Methodology
The experiment was constructed to present the evolved population to the user and to
facilitate precise logging of input. Pilot studies were completed to ensure the static
interface was usable and that certain concerns were addressed such as saving
previous designs and allowing a single design to be repeatedly mutated. While these
aspects of the static interface are important they are essentially technical concerns.
What is not addressed is how to best facilitate the user’s exploration of the search
space.
A user made 17 selections on average during the 5 min they had to match a
target. Although mutations could occur on the same codon, the user could
theoretically move a maximum Hamming distance of 17 from their original
selection. An average of 48 codons were used to encode a design so a Hamming
distance of 17 could allow for significant change to the individual. The lack of
progress during search arose from the fact that each selection presented the user
with 8 more images. As the participant is presented with only 136 designs (on
average) during the course of a run, the result is that they only observe a small part
of the search space. To assume that a significant improvement could be made in this
short distance was optimistic.
The target bridges were created by randomly generating genotypes and using
these to select individuals from the search space. Little thought was given to how
‘‘far’’ the target individuals were from the starting node. Nor was it known if the
targets were reachable from the starting node. The approach taken in this
300 Genet Program Evolvable Mach (2013) 14:287–314
123
experiment was intended to reduce human bias but it may have inadvertently made
the task too difficult for the user.
The user did not know what change to expect between a nodal and a structural
mutation, which meant that the users intention of ‘‘big’’ and ‘‘small’’ changes may
not be evident in the generated individuals. What constitutes a small or a large
change depends on the user’s personal preference. The nodal mutation events
presented a unique problem to the user as the resulting mutations looked identical to
the user. Some nodal changes fell below the threshold of a Just Noticeable
Difference (JND). JND is a concept from cognitive psychology first described by
Ernst Heinrich Weber [50]. JND is the smallest difference between two stimuli that
is still capable of being perceived. The lack of what the user perceived as new
variations also hindered them in completing the task.
The grammar also complicated what was already a difficult task. Several
participants complained of identical bridges being generated. Although most of
these cases were a result of the JND described above, distance comparisons
performed afterwards showed that some individuals were identical. Despite every
mutation incrementing a used codon, sometimes the grammar generated anonymous
functions that required codons for components that were not expressed in the output.
An example of this would be codon values being used to define a curve and only
half the curve being used in the final bridge design. Neutral mutations were removed
in the following experiment by applying the euclidean graph distance formula to the
mutated individuals. If the distance is zero then the mutated individual is removed
from the population.
Due to the reasons discussed above a new approach was developed for allowing
user interaction with the evolutionary algorithm. The new animated interface is
discussed in the next section.
5 An animated search interface for interactive evolutionary architecturaldesign
It became clear from the experiment in Sect. 4 that allowing the user to apply the
mutation operators is not enough, the user has to be able to interact with the
algorithm in a meaningful way and be able to process a much greater area of the
search space. After analysing the results and user feedback gathered from the
previous experiment, the interface was re-implemented in an attempt to allow the
user to explore the search space more effectively. Whether the metrics adequately
reflect similarity and locality is also examined. The problems and their respective
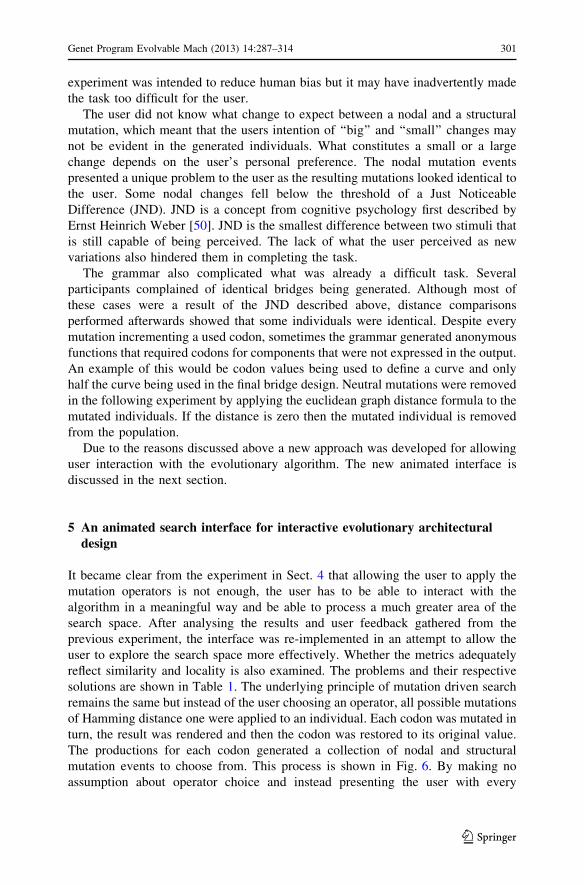
solutions are shown in Table 1. The underlying principle of mutation driven search
remains the same but instead of the user choosing an operator, all possible mutations
of Hamming distance one were applied to an individual. Each codon was mutated in
turn, the result was rendered and then the codon was restored to its original value.
The productions for each codon generated a collection of nodal and structural
mutation events to choose from. This process is shown in Fig. 6. By making no
assumption about operator choice and instead presenting the user with every
Genet Program Evolvable Mach (2013) 14:287–314 301
123

available option, it is now possible to examine how they navigate the search space
based on their selections.
Presenting an entire population of mutation events to the user simultaneously is
not feasible. The animated interface instead uses a single window for exploring the
population. The interface is shown in Fig. 7. The current user selection is on the left
and the target is the image on the right. The leftmost panel states the instructions,
user controls, time remaining and the distance from the target (stated as the
difference). The user scans through the mutation events using the left and right
arrow keys and the selects the mutation change they want and that now becomes the
basis for generating the next population. By presenting the phenotypic effects of a
mutation change to the genome the user is not required to understand the
relationship between the codons and their mapping to the phenotype. The interface
displays the consequences of different mutation events and the user then selects the
change that most closely matches their preference.
The user viewed the individuals by moving the slider or holding down the left
and right arrow keys. The refresh rate for the window is ten frames per second. As
the frame rate is at a level where the frames can be perceived individually, the user
is capable of perceiving the bridges distinctly. A greater frame rate could result in
the user skipping over bridges due to persistence of vision. Codon changes were
made sequentially so a codon’s productions are grouped in their presentation to the
user. Overlaying groups of changes in the same window allowed the user to pick up
smaller JND changes by viewing them in rapid succession.
Fig. 6 Generating Hamming distance 1 individuals for user selection. The value of each codon is alteredand the result is saved. The codon is then restored to the original value before moving on to the nextcodon
Table 1 Problems addressed by the new interface
Problem Solution
Magnitude of change unknown Show all changes in advance
Limited user evaluations Local search is animated for quicker evaluation
No measure of target difficulty Each target increases in Hamming distance
No alternative paths allowed ‘‘undo’’ button added
Difference below JND Mutations animated to highlight changes
Identical Individuals Removed by comparing Euclidean graph distance
302 Genet Program Evolvable Mach (2013) 14:287–314
123

(a)
(b)
(c)
Fig. 7 New animated interface. The target is on the right and the current individual is in the middleframe. The user instructions and a slider that shows the current position in the population is on the left
Genet Program Evolvable Mach (2013) 14:287–314 303
123

5.1 Experimental setup
The subjective nature of aesthetics makes evolutionary design search a difficult area
to quantify. To generate measurable results a target design is specified and the user
must then attempt to match it. The experiment asked the user to match ten different
targets. The random seed was fixed so that the animated interface always started
from the same individual. The targets were mutated variants of the starting
individual and they increased in difficulty as the Hamming distance was greater for
each successive target.
The targets are shown in the order they were presented to the user in Fig. 8. The
Hamming distance, the number of nodal and structural mutations and the Euclidean
graph distance from the starting graph for each target is shown in Table 2. In an
effort to generate a range of target difficulties, each target had a Hamming distance
greater than or equal to the target that preceded it. Although this is not an absolute
measure of difficulty it does mean that more input is required from the user to obtain
a perfect match.
Each participant had 2 min in which to try to match the target. The experiment
was set on a timer to end as soon as 2 min had been reached. This meant that all
experiments could be compared equally. They were free to make as many selections
within this time frame and they could undo selections if they wished. At the end of
target exercise the user was asked a short survey asking them which features they
used to compare similarity. Twenty five volunteers participated in this experiment
and the experiment itself was approved by the Ethics Committee in UCD (reference
number: LS-E-11-129-Byrne-ONeill).
A sample of random trials were generated to examine if the users were capable of
using the animated interface to match the target. The same interface was used
except selections were chosen randomly by a Mersenne twister random number
generator. Twenty five random samples were generated for each of the targets. The
distribution of the random selections for each target matched the user’s click
average and standard deviation, as shown in Table 2.
Given the distance results of a sample of randomly selected individuals from a
given target, l0, and the distance results of the user selected individuals from a
given target, l1, the following hypothesis is stated:
H0 There will be no statistically significant difference between the random
sample and the user generated results, l0 = l1
H1 There is a statistically significant difference in distance from the target for the
user generated results, l0 = l1
a The significance level of the Wilcoxon rank-sum is 0.05.
5.2 Results
The number of user selections (user clicks) and the number of images presented to
the user (user evaluations) are shown in Table 2. In the previous experiment, the
users selected 17 individuals and evaluated 136 designs on average in a five minute
time period, the equivalent of 27 evaluations per minute. The user click and user
304 Genet Program Evolvable Mach (2013) 14:287–314
123

evaluation results show that the user made fewer selections with the new animated
interface than in the previous experiment but they evaluated many more designs
within a two minute time period. The highest number of evaluations was for target 5
where the user was presented on average with 325 images for evaluation, the
equivalent 162 evaluations per minute.
(a) (b) (c)
(d) (e) (f)
(g) (h) (i)
(j) (k)
Fig. 8 The targets that the user had to match, the original individual that the user started with is in thetop left corner
Genet Program Evolvable Mach (2013) 14:287–314 305
123

The percentage of user mutations (User Matched) and random sampling
mutations (Random Matched) that matched the target codon changes are also
shown in Table 2. With some exceptions, the percentage of matched codon
mutations decreases as the Hamming distance increases. The opposite is true for
random sampling: as more codons are changed there is an increased likelihood that
a random mutation would match that of the target.
A Wilcoxon rank-sum test compared the final selections for the user and the
random sampling. There was a statistically significant difference from the random
sample with exceptions of target 5 and target 10. The result rejects the null
hypothesis for 8 of the 10 targets. In these cases the results show a distinct
improvement over time for the user generated results while the random samples
either show no reduction of distance from the target or an increase in distance from
the target. The results show that users could successfully use the animated interface
to direct search.
Scatter plots were generated to examine if there was an improvement over time
regarding Euclidean graph distance from the target. Each user selection generated a
data point that recorded the time, distance from the target and the mutation type. A
locally weighted scatter plot smoothing (LOESS) was performed on the results to
plot a smooth curve of the average values. The set of data points was then
bootstrapped [16]. The graphs on the left of Figs. 9, 10, 11, 12, 13, 14, 15, 16, 17, 18
compares the user distribution (green) with the random sampling (grey).
The type of mutation used for each selection was recorded with intention of
examining if mutation operators of different locality were used at different points
during the target matching process. The user was not informed of whether they were
making a nodal or structural mutation. They made their selection based on the
output of the mutation event. Bar charts showing the number of nodal mutations
(red) compared to the number of structural mutation (blue) are shown in the graphs
on the right of Figs. 9, 10, 11, 12, 13, 14, 15, 16, 17, 18. The X-axis is the number of
selections made while the y-axis shows cumulative frequency for a particular type
of mutation.
Table 2 The distance and change types for each target
Target Nodal:
structural
Hamming:
Euclidean
User clicks User evaluations User
matched (%)
Random
matched (%)
Target 1 1:0 1:10 1.0 ± 0.0 22.4 ± 34.9 100 4.0
Target 2 2:1 3:92 3.8 ± 2.1 190.3 ± 80.6 64.6 11.8
Target 3 2:2 3:184 2.7 ± 1.3 202.4 ± 61.6 64.9 12.1
Target 4 4:1 5:158 4.1 ± 2.2 245.2 ± 126.4 74.1 20.3
Target 5 5:1 6:214 3.3 ± 1.1 325.6 ± 130.2 36.6 31.8
Target 6 7:0 7:188 3.5 ± 1.3 196.0 ± 61.4 58.9 31.3
Target 7 6:2 8:465 3.5 ± 1.2 262.3 ± 83.2 57.6 15.9
Target 8 7:1 8:457 4.0 ± 1.9 364.7 ± 131.0 37.5 27.0
Target 9 7:2 9:273 4.8 ± 2.0 306.4 ± 86.1 28.2 36.4
Target 10 7:4 11:117 4.9 ± 2.0 282.4 ± 103.7 29.7 42.5
306 Genet Program Evolvable Mach (2013) 14:287–314
123

5.3 Discussion
The results discussed in Sect. 5.2 show that the users were able to direct search
towards a target using the new animated interface, with the exception of target 5 and
target 10. In the case of target 5, the users matched few of the mutated codons and
so followed a different mutation path that ended up in a local optima. In the case of
Time (seconds)
Dis
tanc
e
User ResultsRandom Results
NodalStructural
0 20 40 60 80 100 120
010
020
030
040
050
060
0
1 2 3 4 5 6 7 8 9 10
05
1015
2025
Number of Selections
Num
ber
of O
ccur
ence
s
(a) (b)
Fig. 10 Target 2 consisted of two nodal mutations and one structural mutation and was one of the threeinstances where there was more nodal selections initially than structural selections. This meant the userschose a high locality mutation event instead of a low locality event. As the Euclidean distance from theoriginal caused by the mutation events was only 92, meaning that none of the mutation events had agreatly changed the individual
Time (seconds)
Dis
tanc
eUser ResultsRandom Results
NodalStructural
0 20 40 60 80 100 120
010
020
030
040
050
060
0
1 42 3 5 6 7 8 9 10
05
1015
2025
Number of Selections
Num
ber
of O
ccur
ence
s
(a) (b)
Fig. 9 Target 1 was used to introduce the user to the animated interface. As the target was a Hammingdistance of one from the original, every participant successfully matched the target with one selection.The result shows that if a desired individual is in the immediate proximity of the current individual, theuser is capable of finding it
Genet Program Evolvable Mach (2013) 14:287–314 307
123

target 10, a large percentage of the expressed codons were mutated and so it
presented too difficult a challenge to match all the changes within the allotted time.
This evidence supports the hypothesis that the user could use such an animated
interface to mutate a design to incorporate features that they had previously seen in
other designs generated by the evolutionary algorithm. The results obtained
regarding the participants use of nodal and structural mutation show that users
Time (seconds)
Dis
tanc
eUser ResultsRandom Results
NodalStructural
Number of Selections
Num
ber
of O
ccur
ence
s
010
020
030
040
050
060
0
0 20 40 60 80 100 120 1 2 3 4 5 6 7 8 9 10
05
1015
2025
(a) (b)
Fig. 11 Target 3 consisted of two nodal and two structural mutations. The participants overwhelminglychose a structural mutation initially and then refined their selection with higher locality nodal mutations.This is shown in the LOESS results as a steep decrease in the distance followed by a plateau where therewas little additional improvement
Time (seconds)
Dis
tanc
e
User ResultsRandom Results
NodalStructural
0 20 40 60 80 100 120
010
020
030
040
050
060
0
1 2 3 4 5 6 7 8 9 10
05
1015
2025
Number of Selections
Num
ber
of O
ccur
ence
s
(a) (b)
Fig. 12 Target 4 consists of four nodal mutations and one structural mutation. Participantsoverwhelmingly started with structural mutation and then applied nodal mutations. Despite the user’spreference for a low locality event for their first selection, the fitness initially got worse according to theEuclidean distance. Additional selections made by the participants increased the fitness and there wassignificant improvement in distance by the end of the task
308 Genet Program Evolvable Mach (2013) 14:287–314
123

started by predominantly applying a structural mutation and then moving to nodal
mutation. The result means that the participants commenced their search by making
large phenotypic changes and then fine tuning that solution with high locality
mutation events. There were three exceptions to this including target 6 which
consisted of nodal mutations exclusively.
Time (seconds)
Dis
tanc
e
User ResultsRandom Results
NodalStructural
0 20 40 60 80 100 120
010
020
030
040
050
060
0
1 2 3 4 5 6 7 8 9 10
05
1015
2025
Number of Selections
Num
ber
of O
ccur
ence
s
(a) (b)
Fig. 14 Target 6 consists of seven nodal mutations and no structural mutations. This is the second of thethree instances where there were more nodal mutations made initially than structural mutations. As all thechanges that generated the target were nodal changes and 58.9 % of the user selections matched themutated codons, it shows that the users were capable of following an evolutionary path similar to the onethat created the target
Time (seconds)
Dis
tanc
eUser ResultsRandom Results
NodalStructural
Number of Selections
Num
ber
of O
ccur
ence
s
010
020
030
040
050
060
0
05
1015
2025
0 20 40 60 80 100 120 1 2 3 4 5 6 7 8 9 10
(a) (b)
Fig. 13 Target 5 consists of five nodal mutations and one structural mutation. Although more structuralmutations were applied in initially, the proportion of nodal and structural mutations remains consistent.The participants mutated the same codons used to create the target only 36 % of the time, resulting in apoor score. There is no improvement made by the participants for this experiment and their results areindistinguishable from random selection
Genet Program Evolvable Mach (2013) 14:287–314 309
123

A surprising result is that there was a definite improvement in Euclidean graph
distance for targets 8 and 9 while the overall percentage of codons matched were
low (37.5 and 28.2 % respectively). The result shows that it is possible to get close
to matching a target without following the exact same mutation path. What this also
means is that the user is following a different genotypic path to arrive at the same
phenotypic output.
Time (seconds)
Dis
tanc
e
User ResultsRandom Results
NodalStructural
0 20 40 60 80 100 120
010
020
030
040
050
060
0
1 2 3 4 5 6 7 8 9 10
05
1015
2025
Number of Selections
Num
ber
of O
ccur
ence
s
(a) (b)
Fig. 16 Target 8 consists of seven nodal mutations and one structural mutation. It is the third instancewhere there were more nodal mutations initially than structural mutations. Overall there was a lowerpercentage of matched codons. This means that the users were not mutating the same codons that changedto generate the target but there was still a significant decrease in distance. The result suggests the userscould match the phenotypic output but by following a different genotypic path
Time (seconds)
Dis
tanc
eUser ResultsRandom Results
NodalStructural
Number of Selections
Num
ber
of O
ccur
ence
s
010
020
030
040
050
060
0
0 20 40 60 80 100 120
05
1015
2025
1 2 3 4 5 6 7 8 9 10
(a) (b)
Fig. 15 Target 7 consists of six nodal mutations and two structural mutations. There is a large drop off indistance initially as users all selected the same structural codon for mutation. The low locality that resultsfrom changing the structural codon is evident in the Euclidean distance. Once the distance had beenreduced the users used nodal mutations of higher locality vary the design, resulting in smaller fitnesschanges
310 Genet Program Evolvable Mach (2013) 14:287–314
123

6 Conclusion
In this work a novel animated interface was presented. The initial static experiments
failed to show that the user was capable of directing search. A second animated
interface was developed that allowed the user to perform a local search on a specific
individual. The experiments showed that the user was able to use the animated
Time (seconds)
Dis
tanc
e
User ResultsRandom Results
NodalStructural
0 20 40 60 80 100 120
010
020
030
040
050
060
0
1 2 3 4 5 6 7 8 9 10
05
1015
2025
Number of Selections
Num
ber
of O
ccur
ence
s
(a) (b)
Fig. 18 Target 10 consists of seven nodal mutations and four structural mutations. This was the largestHamming distance and over one third of the expressed codons were mutated. As the user only made fourselections on average it is unlikely the user would be able to match the target. There was no statisticallysignificant difference between the user results and the randomly generated sample
Time (seconds)
Dis
tanc
eUser ResultsRandom Results
NodalStructural
Number of Selections
Num
ber
of O
ccur
ence
s
010
020
030
040
050
060
0
0 20 40 60 80 100 120
05
1015
2025
1 2 3 4 5 6 7 8 9 10
(a) (b)
Fig. 17 Target 9 consists of seven nodal mutations and two structural mutations. The users all applied aninitial structural mutation but it does not have the same level of improvement as seen in Fig. 15. Overallthe users matched less codons than the randomly generated sample (28 and 36 % respectively). Despitethis there still was still a significant reduction in distance. The variance of the results is much larger thanon the other targets, indicating that several participants were unable to match the target. The results forthe eighth and ninth targets support the hypothesis that different genotypic paths could lead to the samephenotypic output
Genet Program Evolvable Mach (2013) 14:287–314 311
123

interface to match a target by directly manipulating the genotypic representation.
This result supports the hypothesis that the user is able to perform a directed local
search toward a desired individual. Examining the user generated results showed
that they moved from low locality operators to high locality operators to both
explore and exploit the search space. As the user changes are made to the genotypic
representation, the new individual can be reintroduced into the population and
evolutionary algorithm can continue iterating. The intention of this work was to
combine the interface with existing evolutionary design tools to explore the
additional benefits of combining AUI with evaluation for evolutionary architectural
design.
7 Future work
The objective nature of the target matching experiments constrained the participant
while they interacted with the new interface. It is our intention to allow a more
unrestricted usage of the interface in future experiments. The more qualitative
aspects of the interface would be examined, such as the benefit the user thinks the
interface provides, as well as how much they found it aided their search. The
application of the animated interface in conjunction with evaluation may provide
speed up convergence and should be investigated further. The interface combined
with evaluation could be used for a real world design challenge with a control group
using subjective selection exclusively. This would allow for the investigation of the
benefit provided by the interface.
This approach was developed to handle the mapping process in GE but it should
be applicable to any form of GP. We intend to make the animated interface as a
stand-alone application so that it may be applied to different GP methodologies. The
Euclidean graph distance is still at a early stage and future work will involve
developing it into a full metric. We also plan on carrying out a study comparing
similarity as measured by humans and the Euclidean graph distance.
Acknowledgments We would like to thank Andrea McMahon for her unceasing support and we would
like to thank SFI grant numbers 08/RFP/CMS1115 and 08/IN.1/I1868 for making this research possible.
References
1. M. Agarwal, J. Cagan, A blend of different tastes: the language of coffeemakers. Environ. Plan. B 25,
205–226 (1998)
2. W. Banzhaf, Genotype-phenotype-mapping and neutral variation-a case study in genetic program-
ming, in Proceedings of Parallel Problem Solving from Nature III, volume LNCS 866, pp. 322–332.
Springer, (1994)
3. P.J. Bentley, U. O’Reilly, Ten steps to make a perfect creative evolutionary design system, in
GECCO 2001 Workshop on Non-Routine Design with Evolutionary Systems (2001)
4. J. Biles, GenJam: a genetic algorithm for generating jazz solos, in Proceedings of the InternationalComputer Music Conference, pp. 131–131. International Computer Music Association (1994)
5. B.J. Bush, H. Sayama, Hyperinteractive evolutionary computation. Evol. Comput. IEEE Trans. 15(3), 110 (2011)
312 Genet Program Evolvable Mach (2013) 14:287–314
123

6. J. Byrne, M. O’Neill, A. Brabazon, Structural and nodal mutation in grammatical evolution, in
proceedings of the 11th Annual conference on Genetic and evolutionary computation,
pp. 1881–1882. ACM (2009)
7. J. Byrne, J. McDermott, E.G. Lopez, M. O’Neill, Implementing an intuitive mutation operator for
interactive evolutionary 3d design, in IEEE Congress on Evolutionary Computation, pp. 1–7. IEEE
(2010)
8. J. Byrne, J. McDermott, M. O’Neill, A. Brabazon, An analysis of the behaviour of mutation in
grammatical evolution, in Genetic Programming, Proceedings of EuroGP’2010, pp. 14–25. Springer-
Verlag (2010)
9. C. Caldwell, V. S. Johnston, Tracking a criminal suspect through face-space with a genetic algorithm,
in Proceedings of the Fourth International Conference on Genetic Algorithms, pp. 416–421. Morgan
Kaufmann (1991)
10. C. Coia, B.J. Ross, Automatic evolution of conceptual building architectures, in EvolutionaryComputation (CEC), 2011 IEEE Congress on, pp. 1140–1147. IEEE (2011)
11. C. Coyne, Context free art. http://www.contextfreeart.org/, (2010)
12. P. Dahlstedt, Creating and exploring huge parameter spaces: Interactive evolution as a tool for sound
generation, in Proceedings of the 2001 International Computer Music Conference, pp. 235–242,
(2001)
13. R. Dawkins, The Blind Watchmaker. (Longman Scientific and Technical, Harlow, 1986)
14. I. Dempsey, M. O’Neill, and A. Brabazon. Foundations in Grammatical Evolution for DynamicEnvironments. (Springer, 2009)
15. Economic and Social Research Institute. Cityengine, GIS modeller. http://www.esri.com/software/
cityengine/, (2011)
16. B. Efron, Tibshirani R, An introduction to the bootstrap. Monographs on statistics and applied
probability. (Chapman & Hall, 1993). ISBN 9780412042317. URL http://books.google.ie/books?
id=gLlpIUxRntoC
17. J. Gips, Computer implementation of shape grammars, in NSF/MIT Workshop on Shape Compu-
tation. (Citeseer, 1999)
18. S. Gustafson, L. Vanneschi, Crossover-based tree distance in genetic programming. Evol. Comput.
IEEE. Trans. 12 (4), 506–524 (2008)
19. D.A. Hart, Toward greater artistic control for interactive evolution of images and animation, in:
Applications of Evolutionary Computing, vol. 4448 of LNCS, ed. by M. Giacobini (Springer, 2007),
pp. 527–536. ISBN 978-3-540-71804-8
20. N. Hayashida, H. Takagi, Visualized IEC: Interactive evolutionary computation with multidimen-
sional data visualization, in IECON-PROCEEDINGS, vol. 4, pp. 2738–2743, (2000)
21. N. Hayashida, H. Takagi, Acceleration of EC convergence with landscape visualization and human
intervention. Appl. Soft Comput. 1, 245–256 (2002)
22. E.A.P. Hemberg, An Exploration of Grammars in Grammatical Evolution. PhD thesis, (University
College Dublin, Ireland, 17 September 2010)
23. M. Hemberg, U. O’Reilly, A. Menges, K. Jonas, M. da Costa Goncalves, S. Fuchs, Genr8: Architect’s
experience using an emergent design tool. in The Art of Artificial Evolution, ed. by P. Machado, J.
Romero (Springer-Verlag, Berlin, 2007), pp. 167–188
24. G.S. Hornby, Measuring, enabling and comparing modularity, regularity and hierarchy in evolu-
tionary design, in Proceedings of the 2005 conference on Genetic and evolutionary computation,
pp. 1729–1736 (ACM, 2005)
25. J. Hugosson, E. Hemberg, A. Brabazon, M. O’Neill, An investigation of the mutation operator using
different representations in grammatical evolution, inProceedings of 2nd International Symposium‘‘Advances in Artificial Intelligence and Applications’’, vol. 2 (2007), pp 409–419
26. H. Koning, J. Eizenberg, The language of the prairie: Frank Lloyd Wright’s prairie houses. Environ.
Plan. B 8, 295–323 (1981). URL http://www.envplan.com/abstract.cgi?id=b080295
27. A. Kosorukoff, Human based genetic algorithm, in Systems, Man, and Cybernetics, 2001 IEEEInternational Conference, vol. 5 IEEE (2001), pp. 3464–3469
28. E.G. Lopez, J. McDermott, M. O’Neill, A. Brabazon, Defining locality as a problem difficulty
measure in genetic programming. Genet. Program. Evol. Mach. 12 (4), 365–401 (2011)
29. P. Machado, H. Nunes, J. Romero, Graph-based evolution of visual languages. Appl. Evol. Comput.
6025, 271–280 (2010)
30. P. Machado, A. Cardoso, All the truth about nevar. Appl. Intell. 16, 101–119 (2002)
Genet Program Evolvable Mach (2013) 14:287–314 313
123

31. J.P. McCormack, J. Cagan, C.M. Vogel, Speaking the buick language: capturing, understanding, and
exploring brand identity with shape grammars. Des. Stud. 25 (1), 1 – 29, 2004. ISSN 0142-694X. doi:
10.1016/S0142-694X(03)00023-1
32. J. McDermott, U.M. OReilly, L. Vanneschi, K. Veeramachaneni, How far is it from here to there? A
distance that is coherent with gp operators. Genet. Program. 6621, 190–202, (2011)
33. J. McDermott, J. Byrne, J.M. Swafford, M. O’Neill, A. Brabazon, Higher-order functions in aesthetic
EC encodings, in 2010 IEEE World Congress on Computational Intelligence, pp. 2816–2823,
(Barcelona, Spain, 2010. IEEE Press). doi:10.1109/CEC.2010.5586077
34. J. McDermott, J. Byrne, J.M. Swafford, M. Hemberg, C. McNally, E. Shotton, E. Hemberg, M.
Fenton, M. O’Neill, String-rewriting grammars for evolutionary architectural design. Environ. Plann.
B Plann. Des. 39 (4), 713–731, (2012). URL http://www.envplan.com/abstract.cgi?id=b38037
35. R.I. McKay, N.X. Hoai, P.A. Whigham, Y. Shan, M. ONeill. Grammar-based genetic programming:
a survey. Genet. Programm. Evol. Mach. 11 (3), 365–396 (2010)
36. G.A. Miller, The magical number seven, plus or minus two. Psychol. Rev. 63, 81–97 (1956)
37. M. O’Neill, C. Ryan, Grammatical Evolution: Evolutionary Automatic Programming in an Arbitrary
Language. (Kluwer Academic Publishers, Dordrecht, 2003). ISBN 1402074441
38. M. O’Neill, J.M. Swafford, J. McDermott, J. Byrne, A. Brabazon, E. Shotton, C. McNally, M.
Hemberg, Shape grammars and grammatical evolution for evolutionary design, in GECCO ’09:Proceedings of the 11th Annual conference on Genetic and evolutionary computation (Montreal,
8-12 July 2009), pp. 1035–1042. ACM. doi:10.1145/1569901.1570041
39. M. O’Neill, J. McDermott, J.M. Swafford, J. Byrne, E. Hemberg, A. Brabazon, E. Shotton, C.
McNally, M. Hemberg, Evolutionary design using grammatical evolution and shape grammars:
designing a shelter. Int. J. Design Eng. 3 (1), 4–24 (2010)
40. P. Prezemyslaw, A. Lindenmayer, The Algorithmic Beauty of Plants. (Springer, New York, NY,
1990)
41. M. Pugliese, J. Cagan, Capturing a rebel: modeling the Harley-Davidson brand through a motorcycle
shape grammar. Res. Eng. Des. 13, 139–156 (2002). ISSN 0934-9839. doi:10.1007/s00163-
002-0013-1.
42. J. Romero, P. Machado, The art of artificial evolution: a handbook on evolutionary art and music.
(Springer, New York Inc, 2007)
43. Franz. Rothlauf, Representations for Genetic and Evolutionary Algorithms, 2nd edn. (Physica-Ver-
lag, Wurzburg (Wien), 2006)
44. Stichting Blender Foundation. Blender 3D. http://www.blender.org/, 2009. Last viewed 11 May
(2009)
45. G. Stiny, Introduction to shape and shape grammars. Environ. Plan. B 7 (3): 343–351 (1980)
46. H. Takagi, K. Kishi, On-line knowledge embedding for an interactive ec-based montage system, in
Knowledge-Based Intelligent Information Engineering Systems, 1999. Third International Confer-ence, pp. 280–283. IEEE (1999)
47. Hideyuki. Takagi, Interactive evolutionary computation: fusion of the capabilities of EC optimization
and human evaluation. Proc. IEEE 89 (9), 1275–1296 (2001)
48. T. Unemi, Sbart 2.4: breeding 2d cg images and movies and creating a type of collage. In:
Knowledge-Based Intelligent Information Engineering Systems, 1999. Third International Confer-
ence, pages 288–291. IEEE (1999)
49. T. Unemi, Simulated breeding—a framework of breeding artifacts on the computer. Kybernetes 32(1/2), 203–220 (2003)
50. E.H. Weber, De Pulsu, resorptione, auditu et tactu: annotationes anatomicae et physiologicae. (CF
Koehler, Washington, 1834)
51. P.A. Whigham, Grammatical Bias for Evolutionary Learning. PhD thesis, (University of New South
Wales, Australian Defence Force Academy, Canberra, Australia, 1996)
52. P. Wonka, M. Wimmer, F. Sillion, W. Ribarsky, Instant architecture. ACM Trans. Graph. 22 (3),
669–677, 2003. ISSN 0730-0301. doi:10.1145/882262.882324
53. Tina. Yu, Hierarchical processing for evolving recursive and modular programs using higher-order
functions and lambda abstraction. Genet. Program Evolvable Mach. 2 (4), 345–380, (2001)
314 Genet Program Evolvable Mach (2013) 14:287–314
123
Related Documents


![A Methodology Based on Evolutionary Algorithms to Solve a ...homepage.tudelft.nl/3n07s/papers/Munoz_et_al_TrSc.pdfThis article was downloaded by: [131.180.85.234] On: 18 May 2015,](https://static.cupdf.com/doc/110x72/5d05f02288c99333128c977b/a-methodology-based-on-evolutionary-algorithms-to-solve-a-article-was-downloaded.jpg)
