CETA 77-6 A Method for Estimateng Wind-Wave Growth and Decay in Shallow 'Vater With High Values of Bottom Friction by Frederick E. amfield COASTAL ENGINEERING TECHNICAL AID NO . 77-6 OCTOBER 1 977 Approved for public re lease; distribution unl i mited . U.S. ARMY, CORPS OF ENGINEERS COAS TAL ENel EER ING RESEARCH CENTER Ki ngman Building Fort Belvoir , Va . 22060

Welcome message from author
This document is posted to help you gain knowledge. Please leave a comment to let me know what you think about it! Share it to your friends and learn new things together.
Transcript
CETA 77-6
A Method for Estimateng Wind-Wave Growth and Decay in Shallow 'Vater With High Values of Bottom Friction
by
Frederick E. amfield
COASTAL ENGINEERING TECHNICAL AID NO. 77-6 OCTOBER 1977
Approved for public re lease; distribution unl imited .
U.S. ARMY, CORPS OF ENGINEERS
COASTAL ENel EERING RESEARCH CENTER
Kingman Building Fort Belvoir, Va . 22060
Reprint or republication of any of this material shall give appropriate credit to the U.S. Army Coastal Engineering Research Center.
Limited free distribution within the United States of single copies of this publication has been made by this Center. Additional copies are available from:
National Technical Information Service ATTN: Operations Di vL~ ion
5285 Port Royal Road Springfield, Virginia 22 151
The findings in this report are not to be con tnJcd as an official Department of the Army position unless so design at d by other authorized documents.
UNCLASSIFIED SECURITY CLASSIFICATION OF THIS PA G E ( When Dece En/ered)
REPORT DOCUMENTATION PAGE READ INSTRUCTIONS BEFORE COMPLETING FORM
I. REPORT NUMBER 12. GOVT ACCESSION NO . 3 . RECIPIENT'S CATALOG NUMBER
CcTA 77 - 6 4 . TI TL E ( lrrld Sob/ltle) 5. TyPE OF REPORT & PERIOD COVERED
I
A HETI-iOD FOR E STH1ATl~G WIND-II'AVE GROl\'TI-1 AND Coas tal Engineering DECAY IN SIIALLOlI' \\'ATER WITH HIGH VA LU ES OF Technical Aid ,
BOTTOI\! FRICTI Oi\ 6 . PERFORMING ORG. REPORT NUMBER
7 . AUTHOR(e) B. CONTRACT OR GRANT NUMBER( &)
Frederi ck E. Camfield
9 . PERFORMING ORGANIZATION NAME AND ADDRESS 10. PROGRAM ELEMENT, PROJECT, TA SK
Department of the Army AREA It WORK UNIT NUMBERS
Coastal Engineering Research Center (CEREN-CD) F31234 Kingman Building, Fort Belvoir, Virginia 22060
11. CONTROLLING OFFICE NAME AND ADDRESS 12. REPORT DATE
[)epartment of the Army Oc t ober 1977 Coastal Engineering Research Center 13 , NUMBER OF PAGES
Kingman Building, Fort Bel vo i r Virginia 22060 34 14 MONITORING AGENCY NAME It AOORESS(lf dlfforenc from Conrrol/Jn~ ~Ulce) 15. SECURITY CLA SS . (of t h is rep o rC)
UNC LASS IFI ED IS ... OECL AS SI FI C ATI O N I DOWNGRADING
SCH EDULE
16. DISTRIBUTION STATEMENT (of Chi . Roporl)
Approved for public release, distribution unlimited.
17. DI ~.IT RIBuTION STATEMENT (01 th e . b.tt8Ct Ol1 f1ued in Blo ck 20 , "dl{{eren t (r o m Roport)
~uPPLEME 'lT{'RY NOTES
19 KEY WORDS (Contlnue on re vet" • • Ide If neco ••• .ry l1:nd Identify by block number)
Wave generat ion Wind h'aves ShallOh h'at er
20. A.SST"nACr (Co'at.5:ru. an ,.."..r .. • l a fI ~ • ..." .ad. Identify by blo ck numb~r)
This report pres ent s an approximate method fOT est imating h'ind-h'ave grolvtlJ a nd decay over flooded areas Ivhere there is a major effect fro m bottom fric-tion hec aus e of dense vegetation.
DO F ORM I J NI 73 1473 EDlno,", OF 1 '"'0 \165 I S. 09SOLE'l'E UI\C LA SS I F I ED
SECURITY C LASSIFI CA TION OF rHIS PAGE (""<On Ditta Entered)
PREFACE
This report describes a method for estimating wind-wave growth and decay over flooded areas where there is a major effect from bottom friction because of dense vegetation. The report was initiated in response to a request from the U.S. Army Engineer Division, Lower Mississippi Valley, ~ew Orleans District, at the Division's 14 September 1976 Research and Development Workshop, indicating a need for technical guidelines for predicting wind-wave generation over flooded coastal areas. The work was conducted under the coastal construction program of the U.S. Army Coastal Engineering Research Center (CERC).
These technical guidelines are an extension of the procedures given in the Shore Protection Manual (SPM) (U.S. Army, Corps of Engineers, Coastal Engineering Research Center, 1975). The design curves in the SPM are limited to waves passing over a sandy bottom. The guidelines presented in this report are discussed at greater length in CERC Technical Paper No. 77-12 (Camfield, 1977).
This report was prepared by Dr. Frederick E. Camfield, Hydraulic Engineer, under the general supervision of R.A. Jachowski, Chief, Coastal Design Criteria Branch.
Comments on this publication are invited.
Approved for publication in accordance with Public Law 166, 79th Congress, approved 31 July 1945, as supplemented by Public Law 172, 88th Congress, approved 7 November 1963.
H. COUSINS Colonel, Corps of Engineers Commander and Director
3
CONTENTS
Page
C01\I\IERSIOI\ FACTORS, U.S. CUSTOMARY TO 1'1ETRIC (SI). 6
SYMBOLS AND DEFINITIONS. 7
I INTRODUCT ION . • 9
II FETCH ADJUSTMENT 10
III WAVE GROWTH. 23
IV WAVE DECAY . 26
V SAlvlPLE DESIGN PROBLEfvlS 28
FIGURES
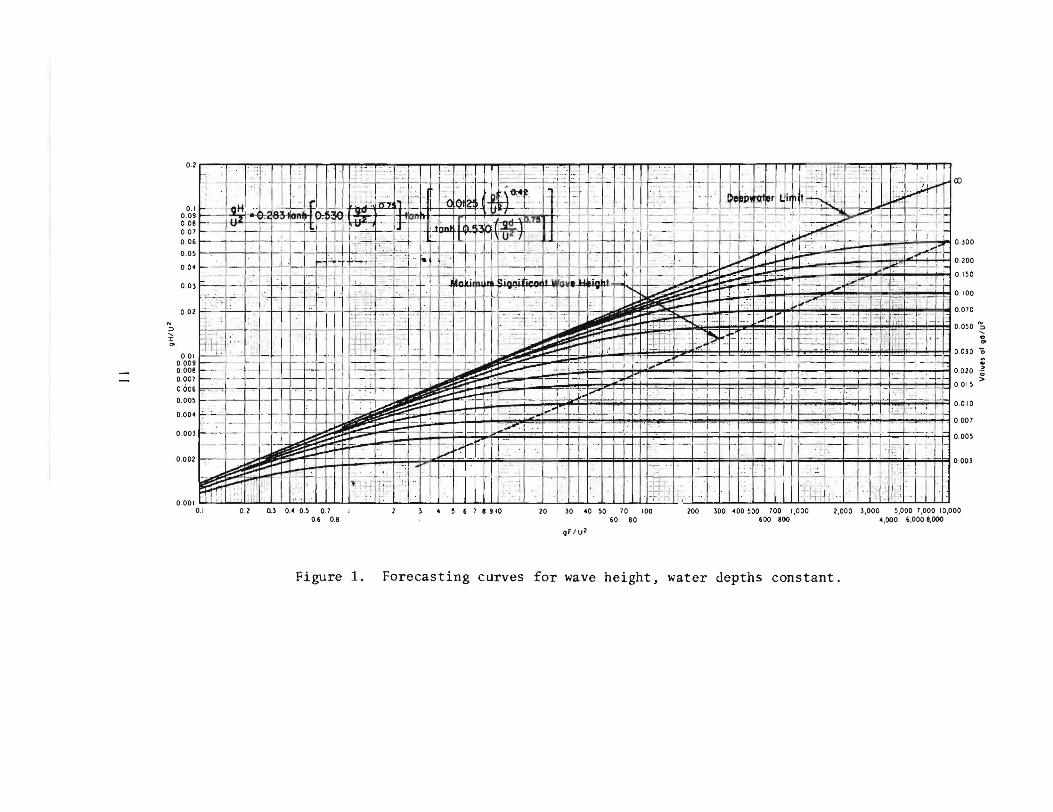
1 Forecasting curves for wave height, water depths constant 11
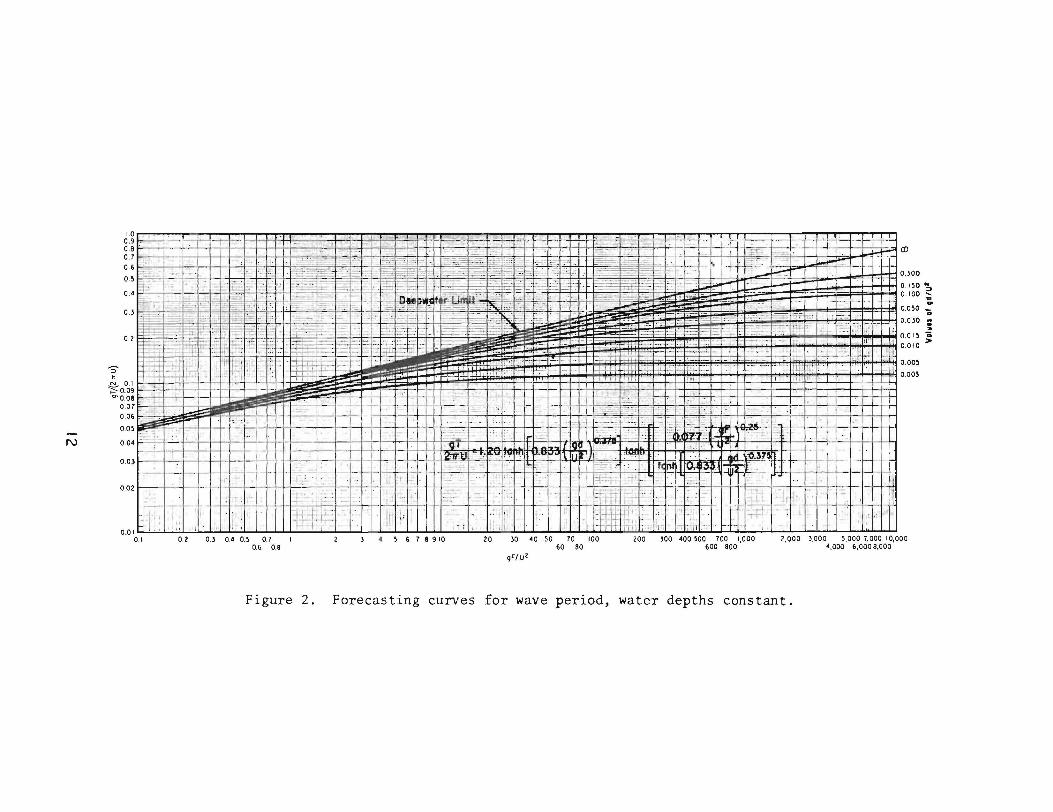
2 Forecasting curves for wave period, water depths constant 12
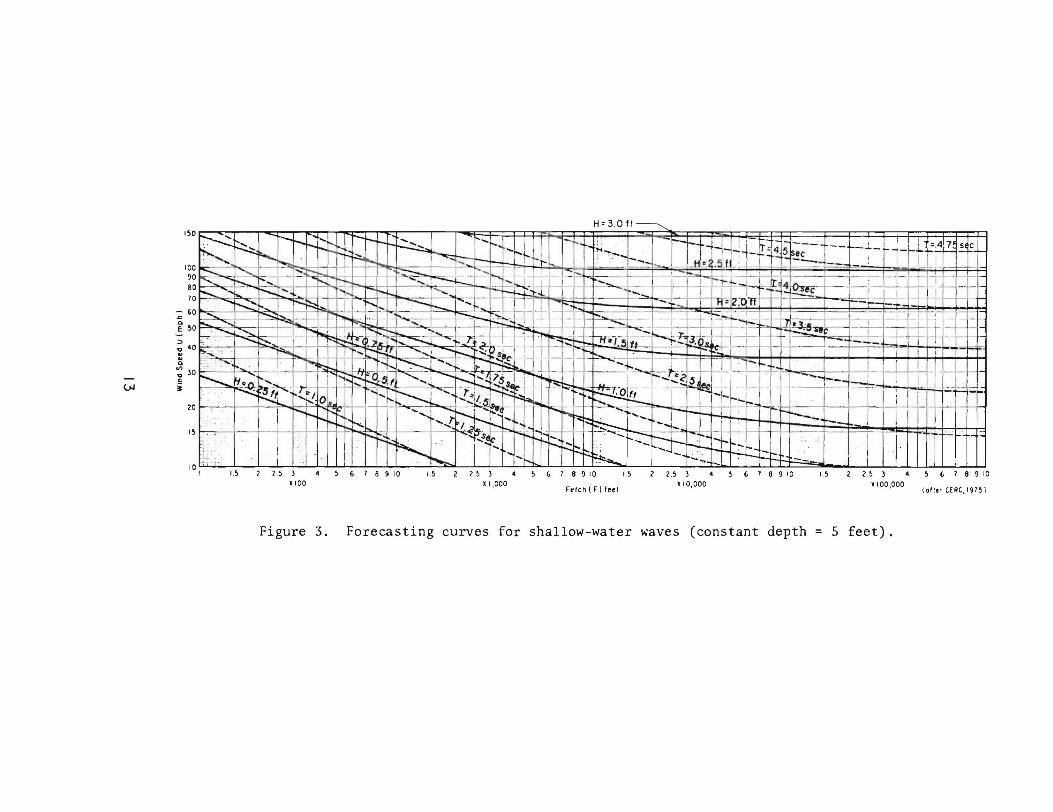
3 Forecasting curves for sha1lo"-',ater waves (constant depth = 5 feet) . 13
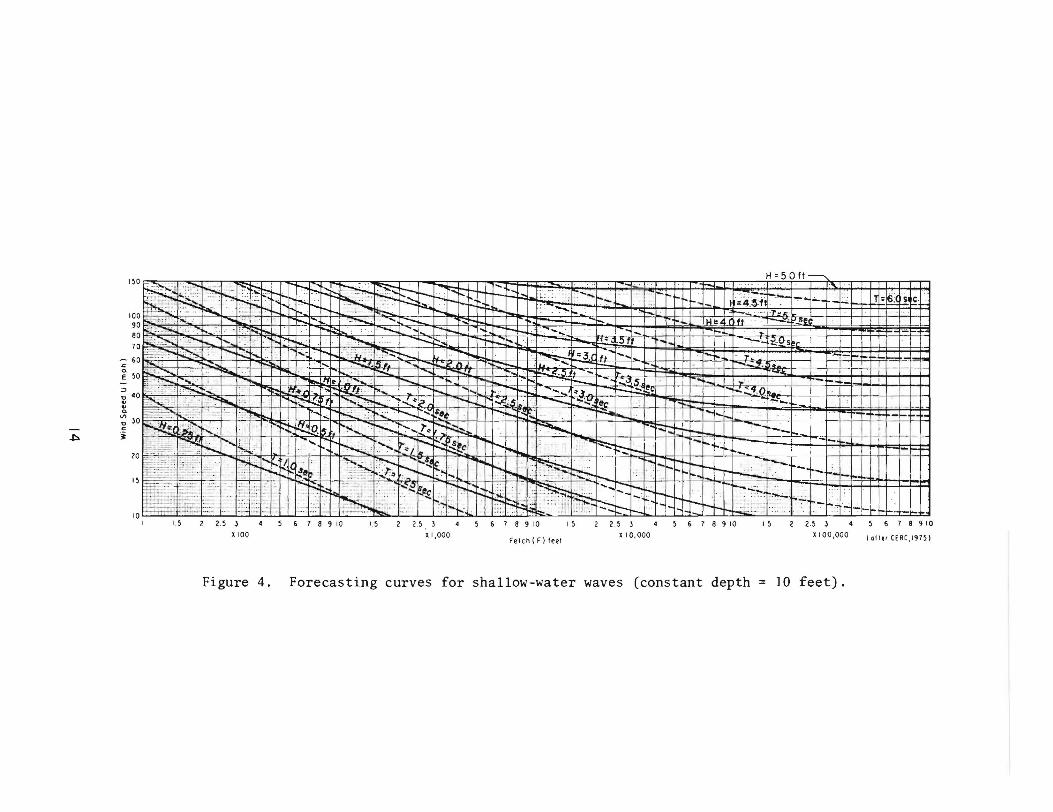
4 Forecasting curves for sha11ow-',ater waves (constant depth = 10 feet) 14
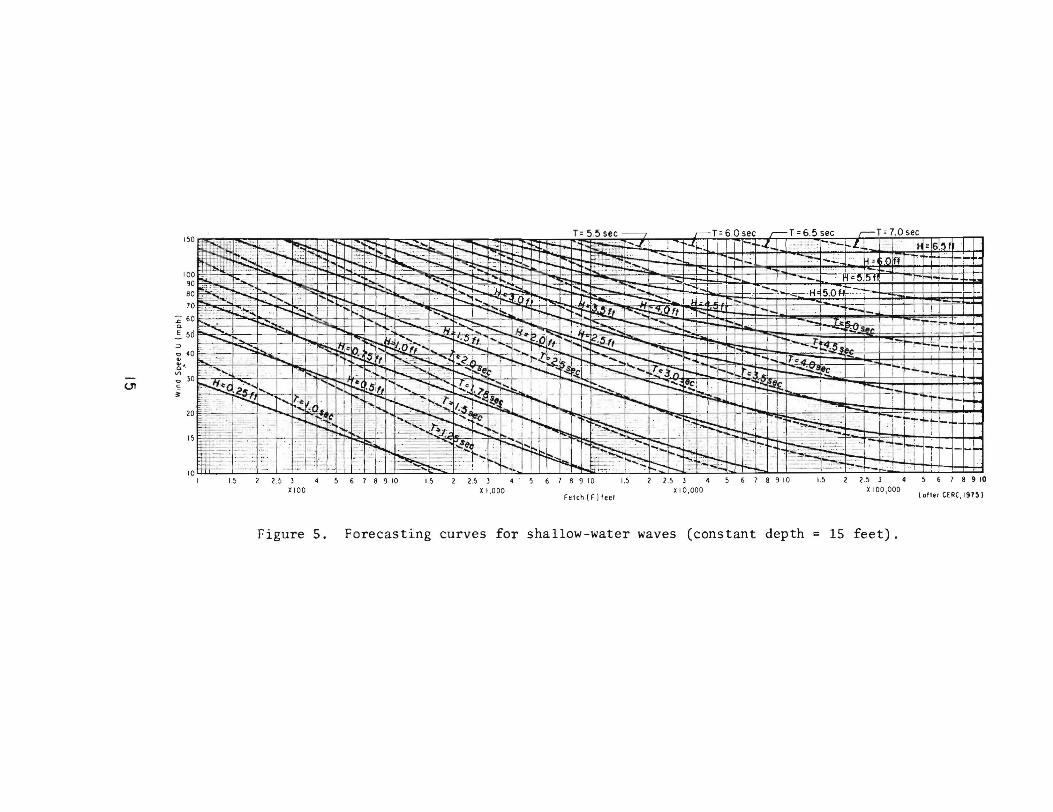
5 Forecasting curves for shallow-water waves (constant depth = 15 feet) 15
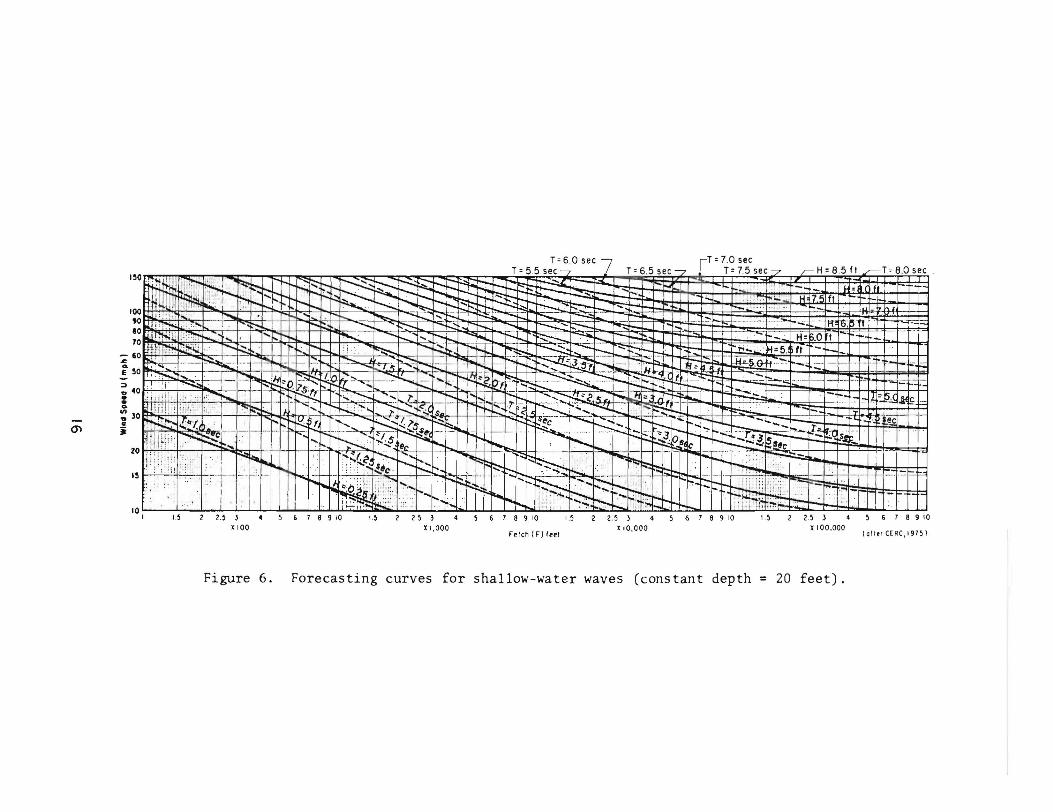
6 Forecasting curves for shal10w-\\'at er waves (constant depth = 20 feet) 16
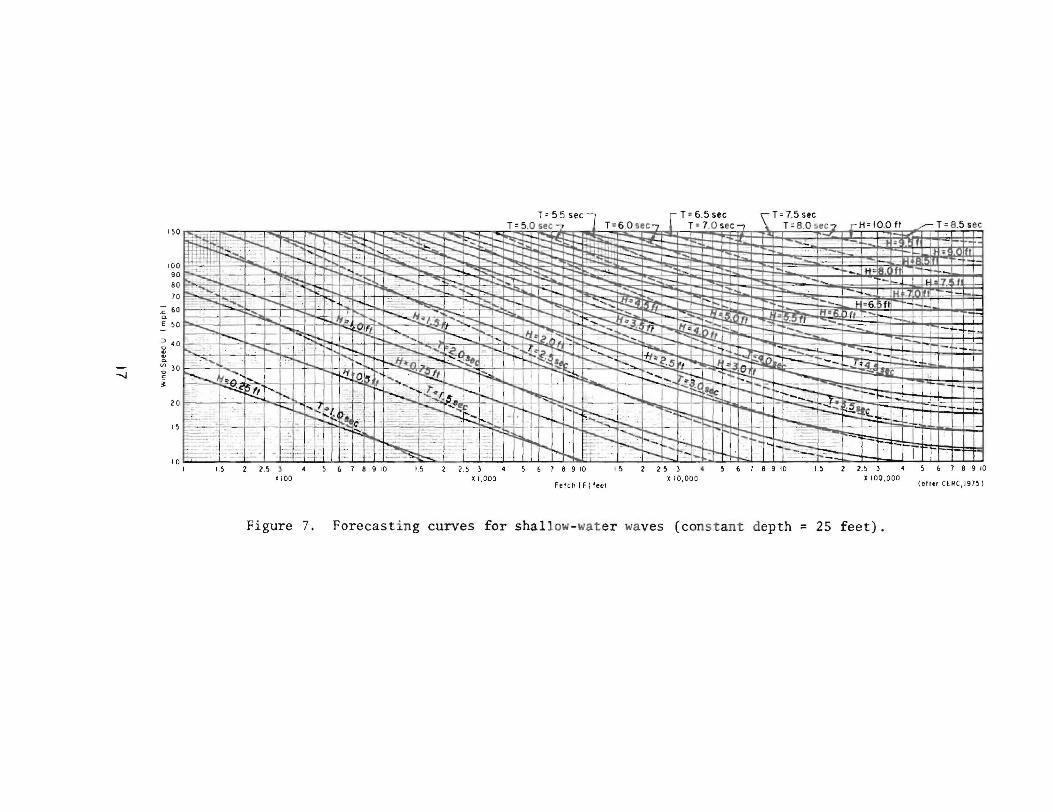
7 Forecasting curves for shallOl,-water waves (constant depth = 25 feet) 17
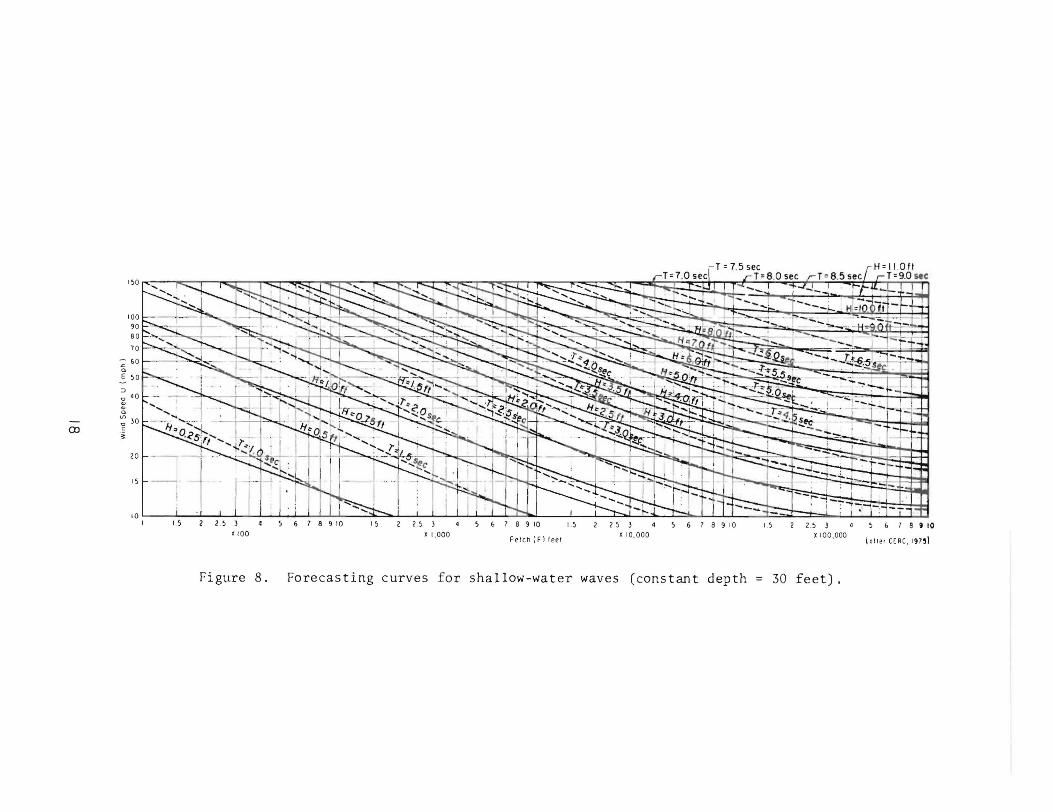
8 Forecasting curves for shallow-water ",aves (constant depth = 30 feet) 18
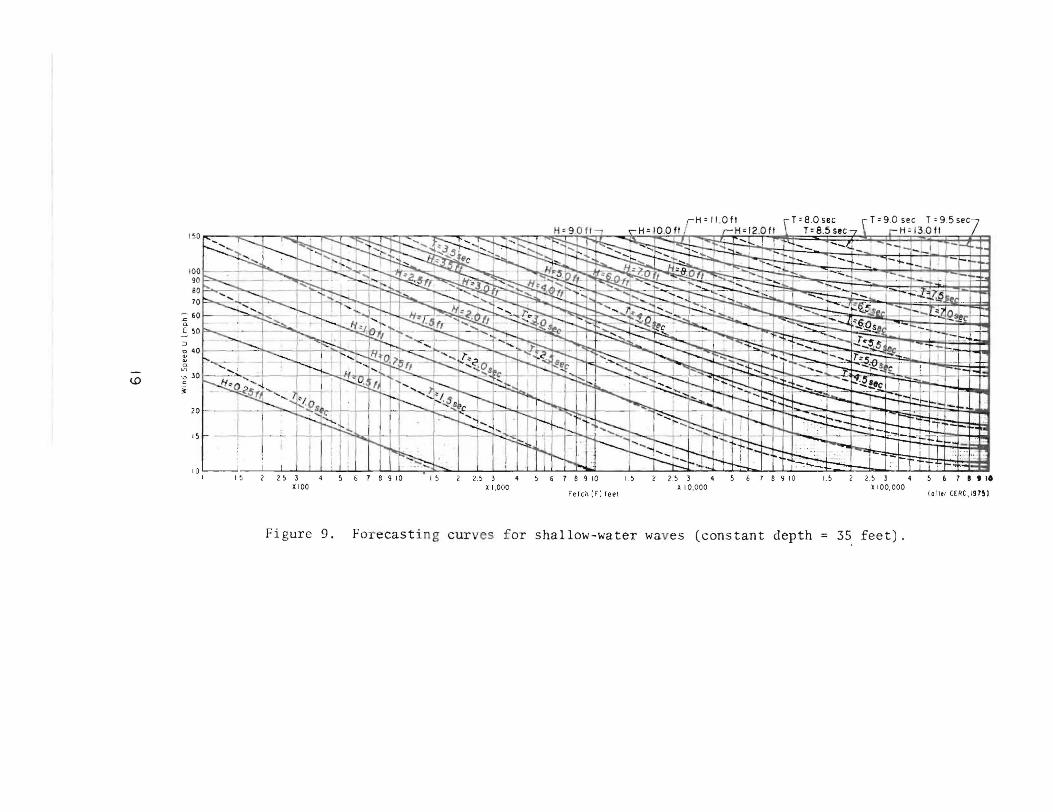
9 Forecasting curves for shallow-water waves (constant depth = 35 Feet) 19
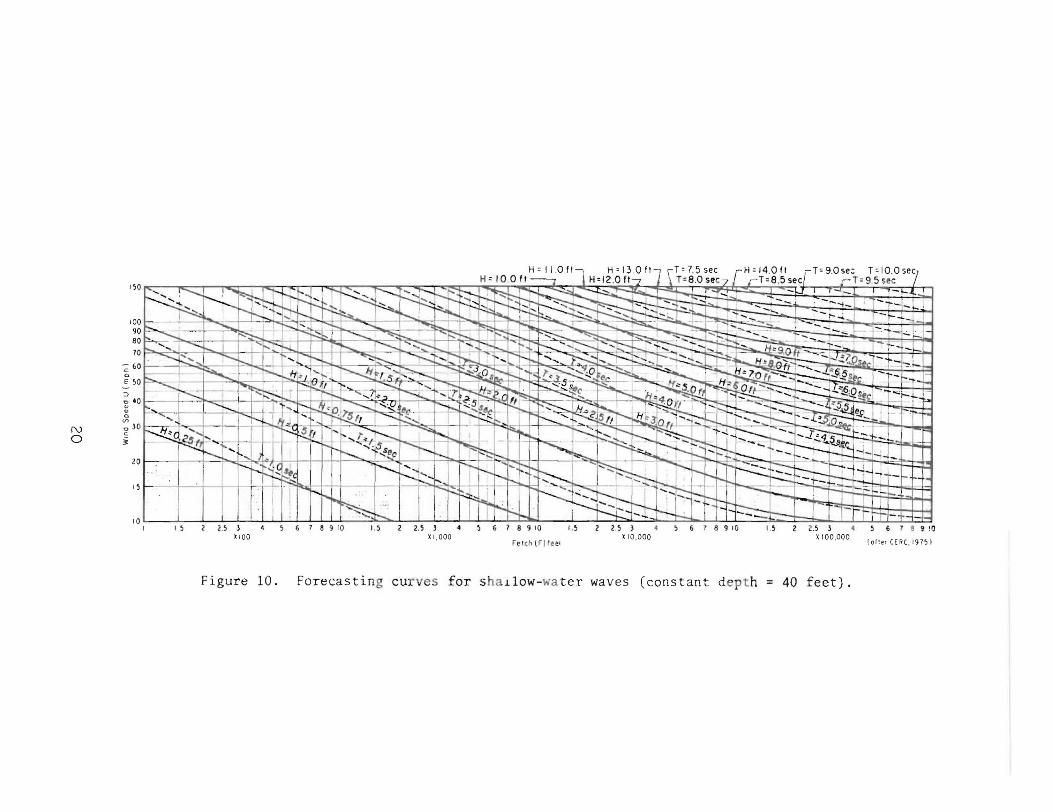
10 Forecasting curves for shal10h'-\\'ater ",aves (constant depth = 40 feet) 20
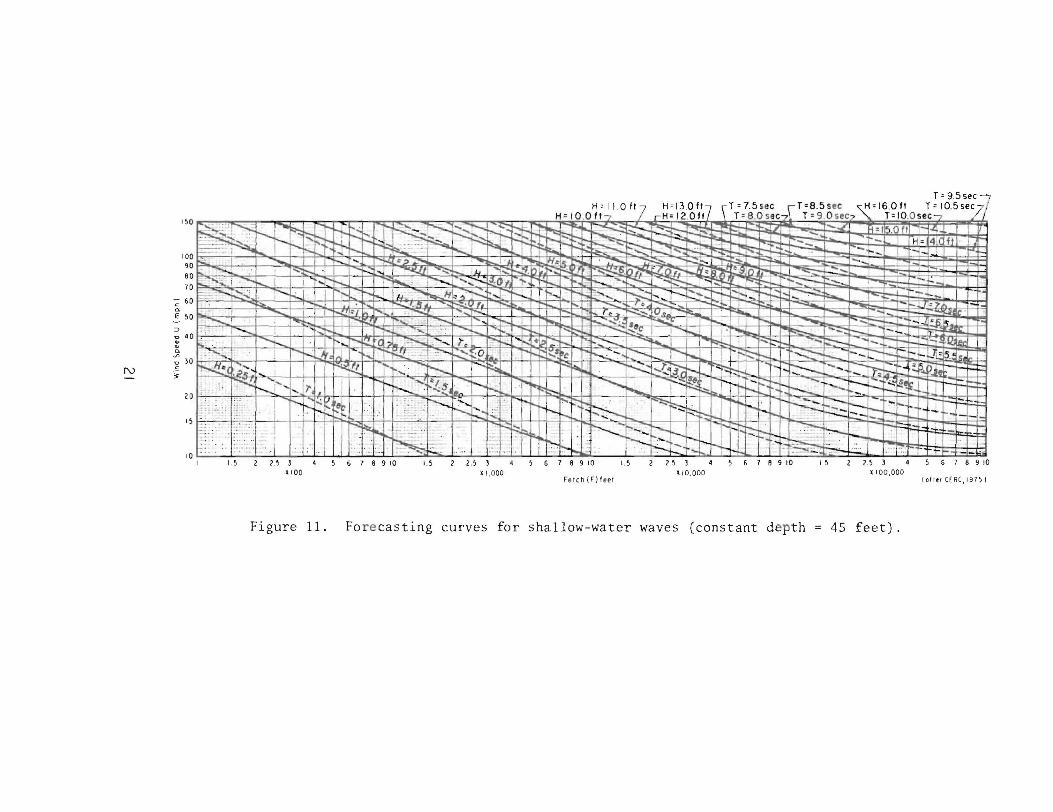
11 Forecasting curves for sha11o"'-'vater "~laves (constant depth = 45 feet) 21
4
CONTENTS
FIGURES-Continued
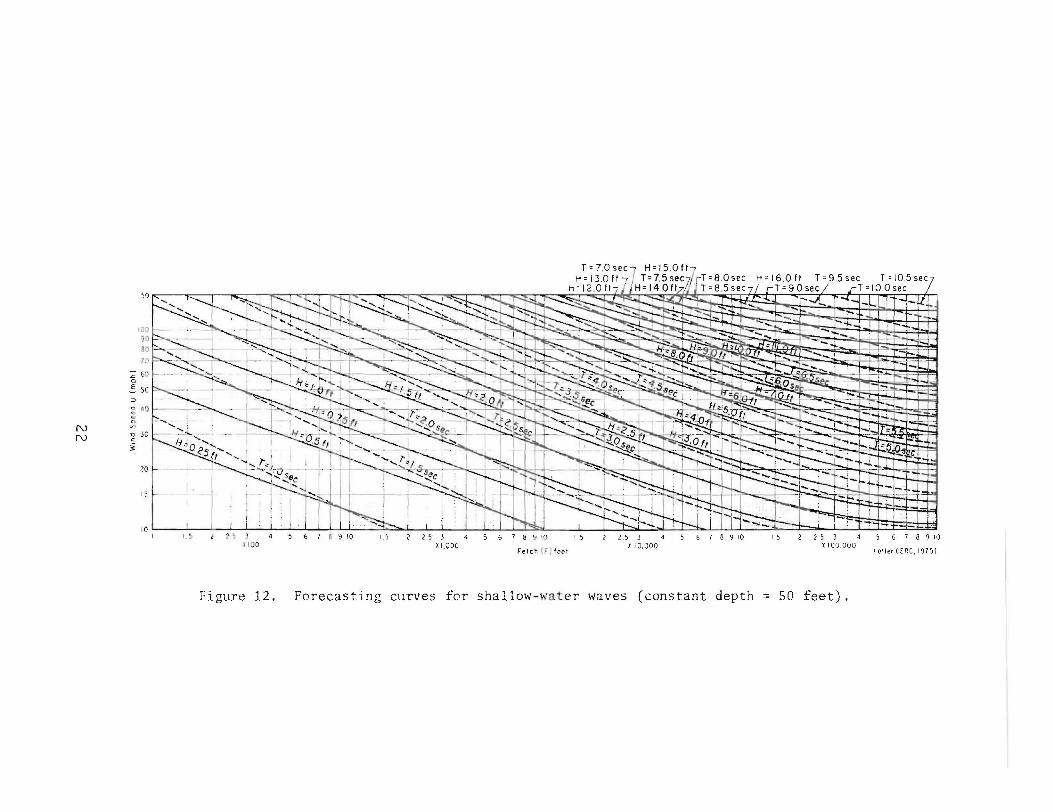
12 Forecasting curves for shallow-water waves (constant depth = 50 feet) . . .
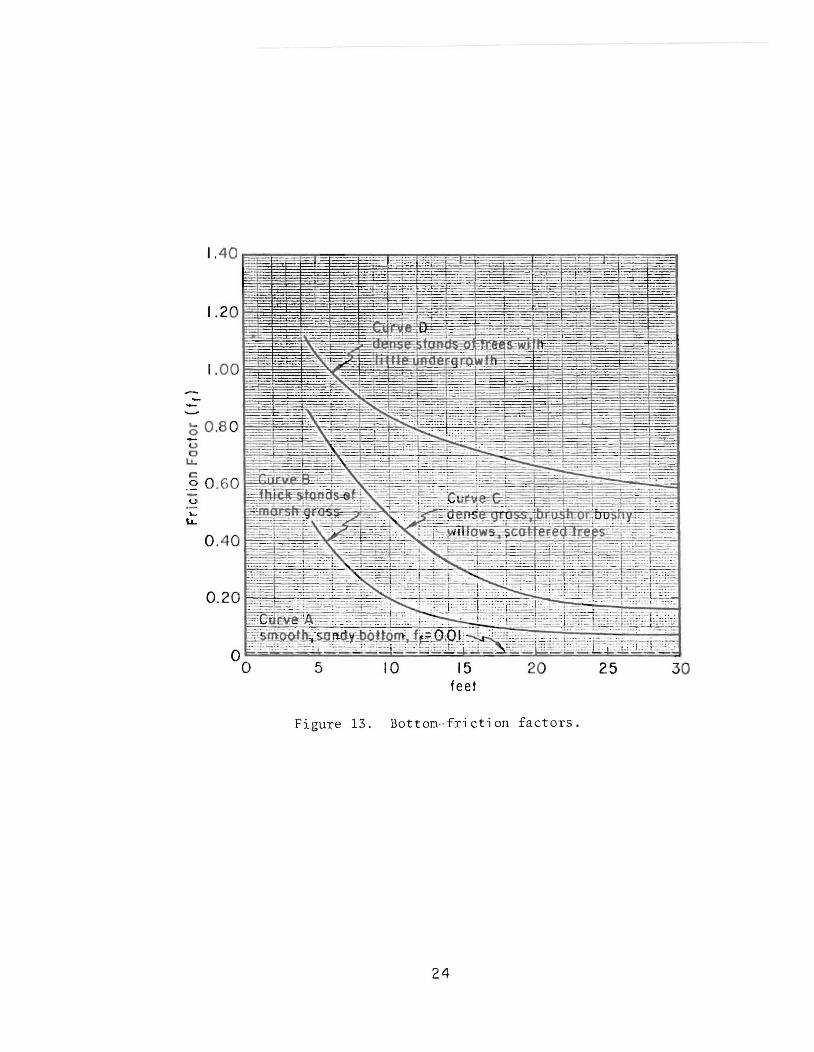
13 Bottom-friction factors
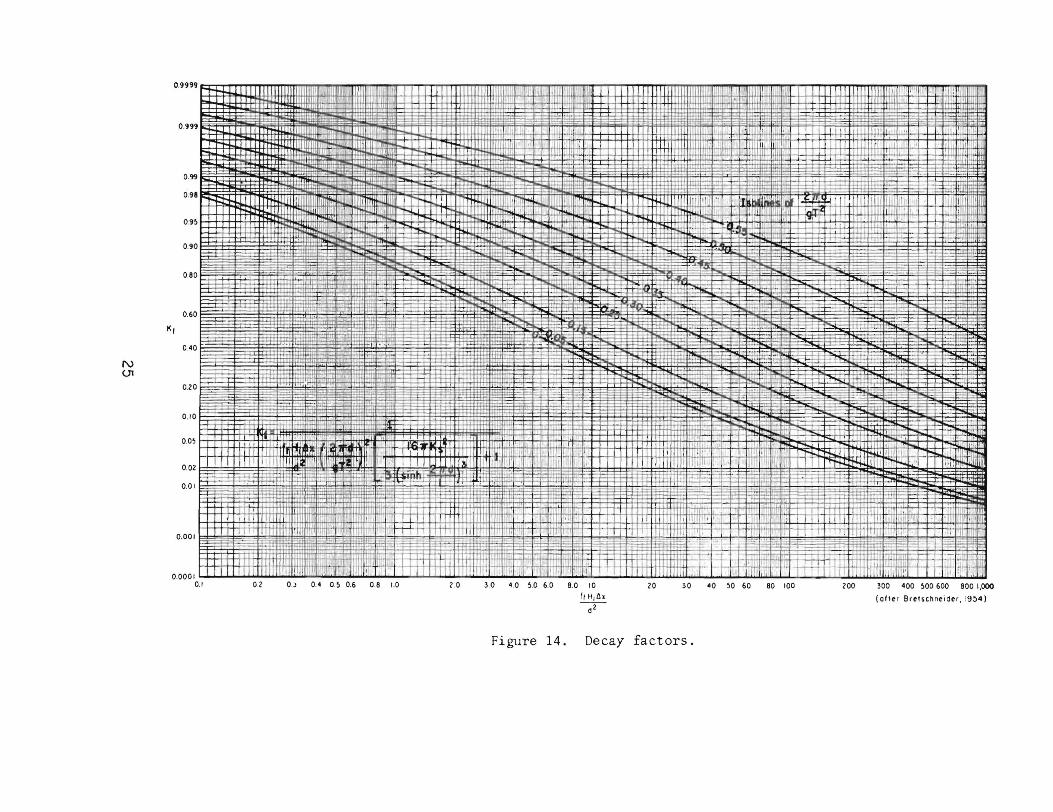
14 Decay factors .
15 Schematic of wave decay calculations.
5
Page
22
24
25
27
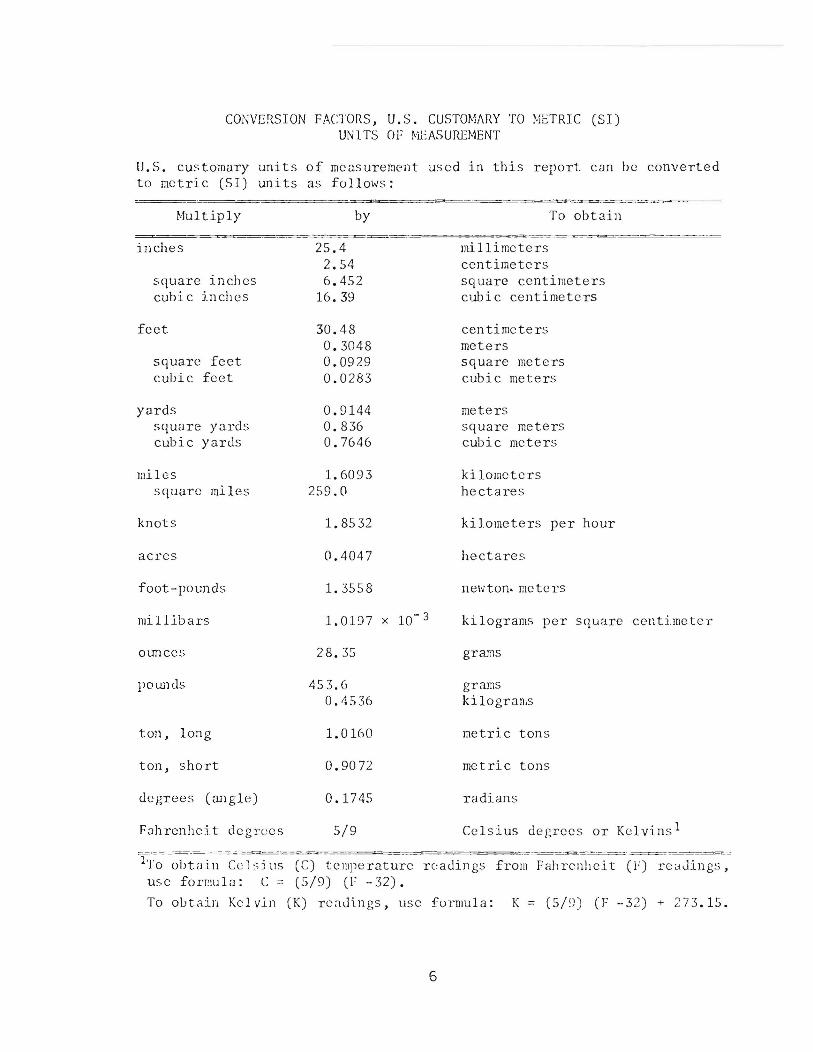
CONVERSION FA(10RS, U.S. CUSTOMARY TO METRIC (SI) UNl TS Of ~ll:ASUREMENT
U.S. cu!'tomary units of measurement used in this report. can be converted to metric (51) units as fo11011s:
Multiply
inches
square inches cubi cinches
feet
square feet cubic feet
yards square yards cubic yards
miles square miles
knots
acres
foot-pounds
millibars
ounces
pow1C1s
ton, long
ton, short
degrees (angle)
Fahrenheit degrees
by
25.4 2.54 6.452
16.39
30.48 0.3048 0.0929 0.0283
0.9144 0.836 0.7646
1. 6093 2S9.0
1. 8532
0.4047
1. 3558
1.0197
28.35
453. () 0.1)536
1. 0 160
0.9072
0.1745
5/9
x 10- 3
mi llimeters centimeters
To obtain
square centimeters cubi c centimeters
cen timeters meters sq uare meters cubic meters
meters s quare meters cubic meters
kilometers hectare s
kilometers per hour
hectares
newton. meters
kilograms per square centimeter
grams
grams kilograms
me tric ton s
metric tons
radians
Celsius degrees or Kelvins!
-ITo obtdin--C~c:-;;j~;-(C)~elllp e r;ture rc:adings from Falncnheit (n l'cCiJings, use formula: C == (5/9) (F -32).
To obtain Kelvin (K) rcaJings , use furmula: K = (5/ ~)) (F -32) + 273.15.
6
F
F e
g
H
L
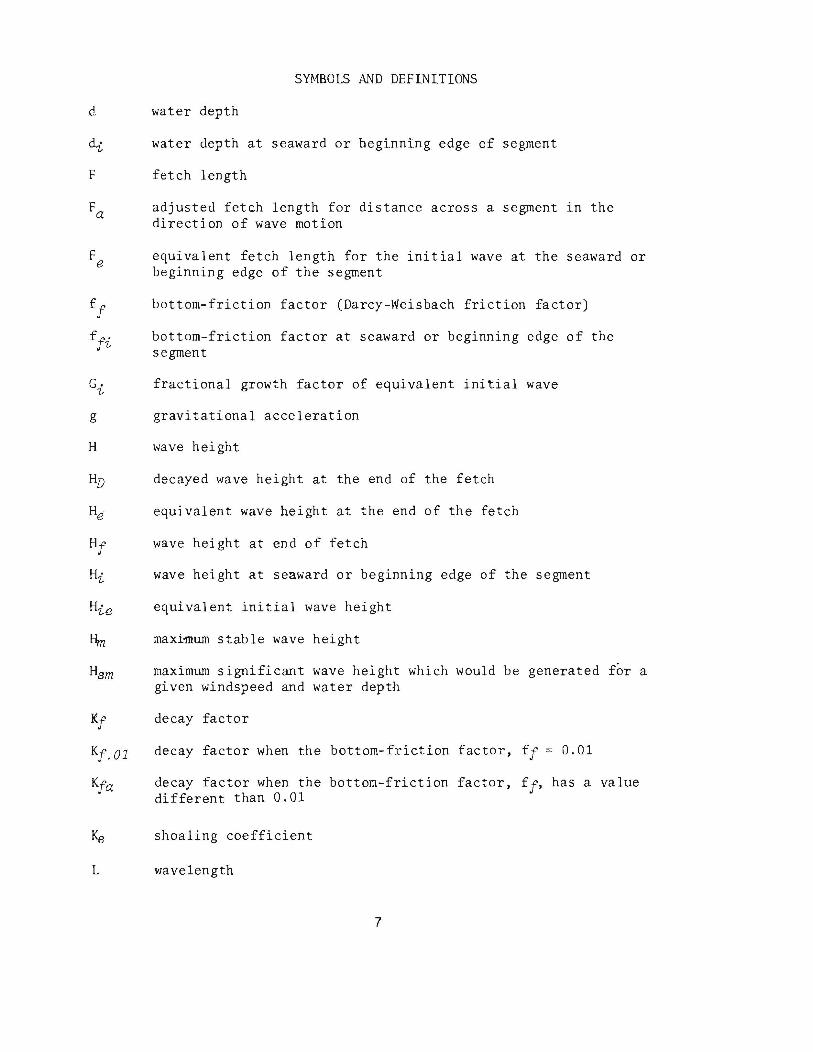
SYMBOLS AND DEFINITIONS
water depth
water depth at seaward or beginning edge of segment
fetch length
adjusted fetch length for distance across a segment in the direction of wave motion
equivalent fetch length for the initial wave at the seaward or beginning edge of the segment
bottom-friction factor (Darcy-Weisbach friction factor)
bottom-friction factor at seaward or beginning edge of the segment
fractional growth factor of equivalent initial wave
gravitational acceleration
wave height
decayed wave height at the end of the fetch
equivalent wave height at the end of the fetch
wave height at end of fetch
wave height at seaward or beginning edge of the segment
equivalent initial wave height
maxi~um stable wave height
maximum significant wave height which would be generated for a given windspeed and water depth
decay factor
decay factor when the bottom-friction factor, ff = 0.01
decay factor when the bottom-friction factor, ff, has a value different than 0.01
shoaling coefficient
wavelength
7
SYHBOLS AJ'JD DEFINITIONS--Continued
R· fractional reduction of ini tial \~ave at the seaward edge of the 'l-
segment, as compared to the maximum stable wave height
T wave period
U windspeed
x distance in the direction of wave motion
a factor for reducing fetch length to t:,e adjusted lengt:,
factor for increasing fetch length to the adjusted length 1/ a
6 incremental change
6x actual distance across a segment In the direction of wave travel
8
A HETI-IOD FOR ESTHlATING WIND-WAVE GROWTI-I AND DECAY IN SHALLOW WATER WITI-l HIGH VALUES OF BOTTOH FRICTION
by Frederick E. Camfield
L INTRODUCTIOn
An important factor in the planning and design of works to protect upland property during periods of storm surge involves the prediction of the wave height and period that will prevail at and seaward of the protective works (i.e., levee, dike, seawall, etc.) for the selected design storm. Although improvements are needed, guidelines are available for prediction of the water levels in upland areas that will result from storm surge; however, no guidelines are presently available for computing the wave attenuation for conditions when a storm-generated wave travels a distance across a shallow flooded area where the bottom characteristics include vegetation \.;hich causes a moderate to high frictional stress. Therefore, it is necessary to estimate the heights and periods of waves which have traveled across a shallo\.; flooded area. At times the initial heights and periods of the waves may increase; i.e., when the wind stress exceeds the frictional stress of the ground and vegetation W1derlying the shallO\, water. 1l1e initial \"ave heights may decay at other times when the frictional stress exceeds the wind stress.
This report presents a preliminary (approximate) method for estimating the growth or decay of waves traveling through shallow water over areas h'i th a high frictional resistance from vegetation. The method is based on previously developed equations for wave growth over areas with low bottom friction ziven in the Shore Protection ~lanual (SP~I) (U.S. Army, Corps of engineers, Coastal Engineering Research Center, 1975)1, and an equation for the decay of gravity waves over areas with a constant \,ater depth and high bottom friction. 1l1e method uses existing shallm,-\,ater \,ave forecasting curves by adjusting fetch lengths to accoW1t for higher bottom friction. Simplifying assumptions are used. 1l1e water depth is assumed to have only gradual variations, and the frictional resistance is treated as bottom friction. The method presented has not been verified in the field and may not be applicable to other problems relating frictional resistance to wave development.
Only limited data are available at this time on the effects of high values of bottom friction on wind waves. Friction factors are estimated by comparing vegetation to similar conditions in river channels and on flood plains. The effect of the vegetation on wind stress, the possible effects of motion of the vegetation, and the dense vegetation effects near the water surface which will damp out short-period \,aves much faster than long-period waves are not considered. The results obtained are considered
1 U. S. ARMY, CORPS OF ENGINEERS, COASTAL ENGINEERING RESEARCH CENTER, Shore Protection i'1anual~ 2d ed., Vols. I, II, and III, Stock No. 008-022-00077-1, U.S. Government Printing Office, Washington, D.C., 1975.
9
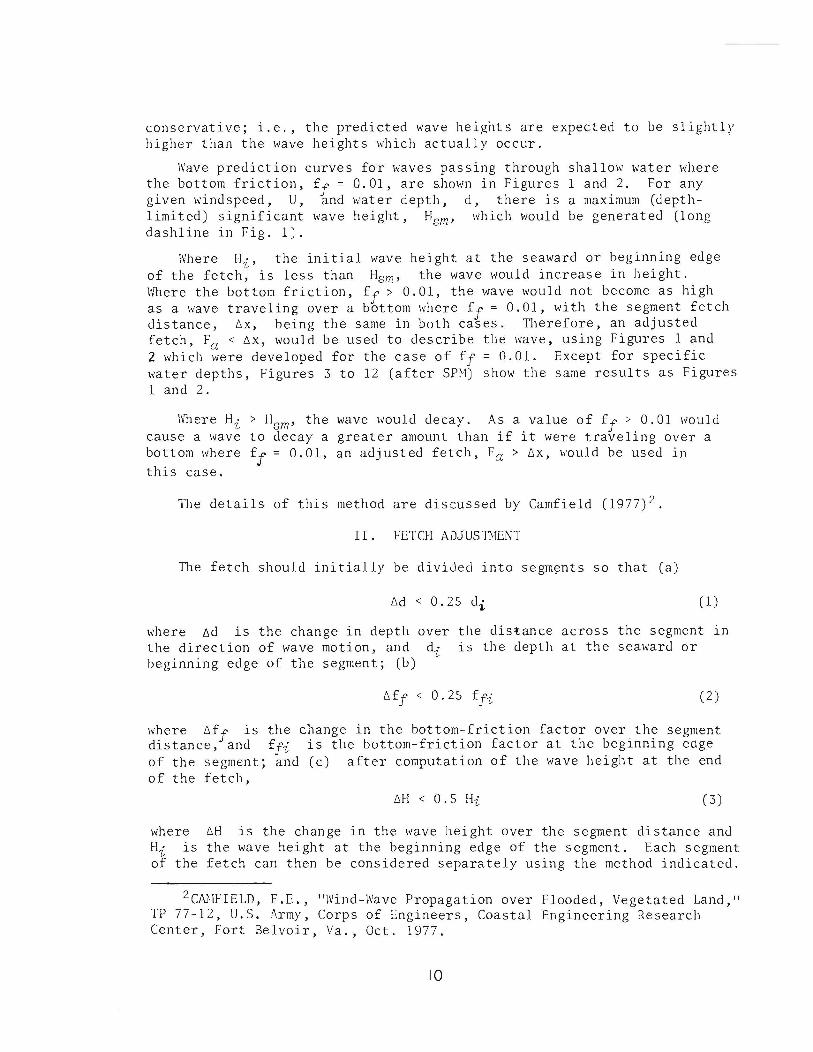
conservative; i.e., the predicted wave heights are expected to be slightly higher than the wave heights which actually occur.
Wave prediction curves for waves passing through shallow water where the bottom friction, ff = 0.01, are shoh'n in Figures 1 and 2. For any given windspeed, U, and water depth, d, there is a maximum (depthlimited) significant wave height, Hsm ' which would be generated (long dashline in f.ig. 1).
Where Hi' the initial wave height at the seaward or beginning edge of the fetch, is less than Hsm , the wave would increase in height. h'here the bottom friction, ff > 0.01, the wave would not become as high as a h'ave traveling over a bottom h'here ff = 0.01, I\'ith the segment fetch distance, 6x, being the same in both cases. Therefore, an adjusted fetch, Fa < 6x, would be used to describe the wave, using Figures 1 and 2 Ivhich were developed for the case of ff = 0.01. Except for specific water depths, Figures 3 to 12 (after SPM) show the same results as Figures 1 and 2.
\\11ere Hi > Ilsm ' the wave Ivould decay. As a value of f f > 0.01 h'ould cause a wave to decay a greater amount than if it were traveling over a bottom I,here ff = 0.01, an adjusted fetch, Fa > 6x, would be used in this case.
~le details of this method are discussed by Camfield (1977)2.
II. FETCH ADJUSTIIENT
The fetch should initially be divided into segm~nts so that (a)
6d < 0.25 di (1)
where 6d is the change in depth over the direction of wave motion, and di beginning edge of the segment; (b)
the distance across the segment ln is the depth at the seaward or
(2)
where 6ff is the change in the bottom-friction factor over the segment distance, and ffi is the bottom-friction factor at the beginning edge of the segment; and (c) after computation of the wave height at the end of the fetch,
6H < 0.5 Hi ( 3)
where 6H is the change in the wave height over the segment distance and Hi is the wave height at the beginning edge of the segment. Each segment of the fetch can then be considered separately using the method indicated.
2CNIFIELD, F.E., "Wind-Wave Propagation over Flooded, Vegetated Land," TP 77-12, U.S. Army, Corps of Engineers, Coastal Engineering Research Center, Fort Belvoir, Va., Oct. 1977.
10
0.< O . ~ 0.7 < ~ 6 7 8 910 lO 30 <0 ~O 70 100 0.6 O.B 60 BO
lOO 300 <00 ~OO 700 1,000 600 BOO
l,OOO 3,000 ~,OOO 7,000 10,000 <,000 6,000 B,OOO
Figure 1. Forecasting curves for wave height, water depths constant.
"'3' •
1.0 0.9 0.8 0.7 0.6
O.~
0.4
O.l
0.1
~ 0.1 IS- 0.09 '" 0.08
0.07 0.06
O.O~
N 0.04
O.Ol
0.02
~
~" r:- !
i':l I ~, ~ === 3'-~ , -
li • '[If -~~:
} ~.
I-
I
0.0 jF'~:
~ I- r I-
.1' , . ; II" :: 1-
". I~ ~'~
,~ ;r- I" . I~~ -
~r II:- IT 1'( ,j'
I" , .,11; IjHl - -.-
, Co. -I- I - I- 1- -
I_ I ' '.
1- -, I
:. I . 0.1 0.2 O.l 0.4 O.~ 0.7
0.6 0.8
,. := 1.:0 =.~"" ~'"= :.i, -,," I~ ' 0=:, .
':0= =~ . . ~,? .~ ,_cO" I, ',
-'= 1= . = ,.,., ~ " : I ~
, I ~ ~ .~ == I==:: =---= ;;= I~· I", ,- .= 1= ~
~ !='~ l=
.~~ ~,j k ·
I:~ :::-- 17' - ~" = ~~ ~ '"' " ~ I ~'~ iiJ:!l!! ~ ~ .. ~ I=F-- -:... 1= -
~~ E 1---, . • C-' :
~ ., r";- -Ie:
.. 1- - ~ I ~· 1--
'--:--:--:-:,. II" .~ i-!- - - y, ..... ..... .,
1_21T.U ':-I"-~ .u I'_U ... ~
~ -- .-0, ., 1--': " ,
, -
- . , ' .. : 1- ,'-1-
I H:tl ~ )1 J' . •. ' I
r , ; , 11. Ii
-~ 1,= = r·
1- - "I~- ::;:;; f;-'~ I=-o=-=" •
~. ..
'-' , 1-
l-, I , ,
. ,'
~=-: [~, ~-1-== '-' ~~
---'-- -.' -. - . ::=' I ~ ~- "' ).( fl: .. :..tr-
t"'~' [ ?,' .. ' fe nt IjQ,J =!:: -,' I
I :~
:+"'} _ I 1.::-
t~t I J~ : '0 . 1
liT: I" , ;il i . ' ; '
"-::- . ~ r-,,£'--
~-:-, -~ :---'::=;Cc-" "'-=
. =;:;: F
~+ .-.
,C
T rlfi , ; ,
,~
" ~~7°l ~
J-,
1-1
17 ~I t.
,
--i"' ~
- 1-~'-
[~
,';- 1'':'' 1- ,
11: . -,
: ,
--~t-r- 1-
t,=,
r- 1-.
-
,: , ,,' I '
-; ,,: '-
-+-I-
-1 -
I'
~
H
J: 1 , I !
I"
co
O.lOO
O.I~O ;, 0.100 ~ ... O.O~O _
o 0.030 5 O.OI~ Q
0.010 >
O.OO~
0.00'
4 ~ 6 7 8 910 20 lO 40 ~O 70 100 100 lOa 400 ~OO 700 1,000 1,000 l,OOO ~,OOO 7,000 10,000 60 80 600 800 4,000 6,000 8,000
Figure 2. Forecasting curves for wave period, water depths constant.
H = 30 11 ------... I~O
100 90 80 70
~ 60 Q
E ~O -=> -= 40 Q
~ lO c
UJ j
20
I ~
7 8 9 10 I~ 2 2.~) 4 ~ 6 7 8 9 10 2 n J ~ 6 7 8 910 XIO,OOO X 100 X 1,000 X 100,000
FelCh (F) feel loll" C[RC,197~1
Figure 3. Forecasting curves for shallow-water waves (constant depth = 5 feet).
H=50ft~
~ ~"
.,.' - r- .... -d '" :"'!.O I J'~-+--+-~-I
" -_~I" ' I c~
X 100 X 1,000 Felch (F) leel
X 10,000 XIOO,OOO loll " CERC , 197)
Figure 4. Forecasting curves for shallow-water waves (constant depth 10 feet).
1.5 2 n l 5 6 ) 8 9 10 2 2.5 l 4' 5 6 ) 8 9 10 1.5 2 2.5 l 4 5 6 ) 8 9 10 1.5 2 2.5 l ~ 5 6 ) 8 9 10
X I 00 X 1,000 Felch (F) teel
X 10,000 XIOO,OOO {otter CERC,19151
Figure 5. Forecasting curves for shallow-water waves (constant depth = 15 feet).
,T = 7.0 sec T= 7.5 sec /' ,,-H=B.5ft ...-----T=B.Osec
5 6 7 8 9 10
{a""C[RC,19 7l1
Figure 6. Forecasting curves for shallow-water waves (constant depth = 20 feet).
150
100 90 8 0
10
~ 60 Q
E 50
i 4 0
-.J ~ 30
j
2 0
15 ~_ 0-
~o
10
== . ~ I 1.5 2 2.5 1 5 6 1 8 9 10 1.5 2 2.5 3 5 6 1 B 9 10 1.5 2 n 3 '. 5 6 1 8 9 10 1.5 2 2.5 3 4
X 100 F.'c~ (F) feeT
X 1,000 X 10,000 X 100,000
Figure 7. Forecast ing curves for shal l ow -water waves (constant depth = 25 feet).
7 ""J
rIft r-
5 6 1 8 9 10
10'Ie, CERC ,I 915 1
" c .~
10
1.5 2.5 1100
Figure 8.
7 8 910 15 1.5 X 1,000
7 8 9 10
Fel c h I F llee l
1.5 7 a 9 10 1.5 XIO,OOO X 100 ,000
Forecasting curves for shallow-water waves (constant depth = 30 feet).
a 9 10
I, ll" C[R C, 197"
I ~
I~ Dl b 7 8 9 10 I ~ 2.~ J 7 8 9 10 U 2 . ~ J • 7 8 '0 2 . ~ J • X 100 X 1.000
Felch IF) fe., X 10,000 X 100,000
Figure 9. Forecasting curves f or shallow-water waves (constant depth 35 feet).
N o
I 5 2.5 XlOO
Figure 10.
7 8 9 iO
10"" C(R C, 19 751
Forecastin cur es for s ha llow-water waves (constant d pt h 40 feet).
I ~ o
100 90
80
70
T = 9.55f!C --; H= II .O ft 7 H=t3.0ft, T=7.5 sec c-T=8 .5 sec "H=t6.0ft T=10.5seC 7 /
H=IO .Oft , r H=1 2.0ft/ T =8.OseC7 T= 9.0 sec7"\. T=IO.O sec "? //
~ti=~~ ~~t-- r--~ ~~~~ r-.~~~","~~~ ~s.'-Et ........ ,L H=I .O ft l~~, 1=' ;".... .......r--- ~r--.t---~f.:::~ ": ~t---... I ~tf~ ~t---::':~~~,,- ", .~~~ ~ ~~ ~~ -:: i ~t 4:0fJ ~ ---.. r-... ... t::> ~ ~ 'ff. I" ~ L:-'" -..,...;:: ~ I ~ 1'-'"", -.."--......
....... . ,' i .... ~ ., I j-..;:L ... ~ ... J., ,~'-.;;:I"'" ~. t:"o.t.O"-:- .ij"):I: . tOt:"".... ~ ...... ...::, i...... I I r .... ~ r-... fo"... . __ .... ~i!:.Ot:"l- ...... " '- ..... ::::-:- -~ -;:::~ """::t- ~~ - ,.:.
~ 60 Q
E ~O -::>
~ 40
"" if>
N ~ 30 .;<
,. "" t'- ... r-~'c ~ > .... t r""-I--.. " ,...; 1;> ..... 1--.. ~ . ....." ....... 1 ~~ .... 1;::- .... ~"'-; ...... -r-f--4.,: - ~ 1G:e.: , ,~, 1 ....,...... _',.) ~ ~ 0 ,-....... ...... 'i.: 0 ........ 1'" :----.;. -:- ::---- I-....~ I ' '';;~~ .~~ - - 1.--l--,l-l. tli -5.
20
101", [[RC, 197~ I
Figure 11. For ecasting curves for shallow-water waves (constant depth 45 feet).
N N
Figure 12.
felch tFJ feel lol,.,C[RC,197J1
Forecasting curves for shallow-wa t er waves (constant depth :: 50 feet).
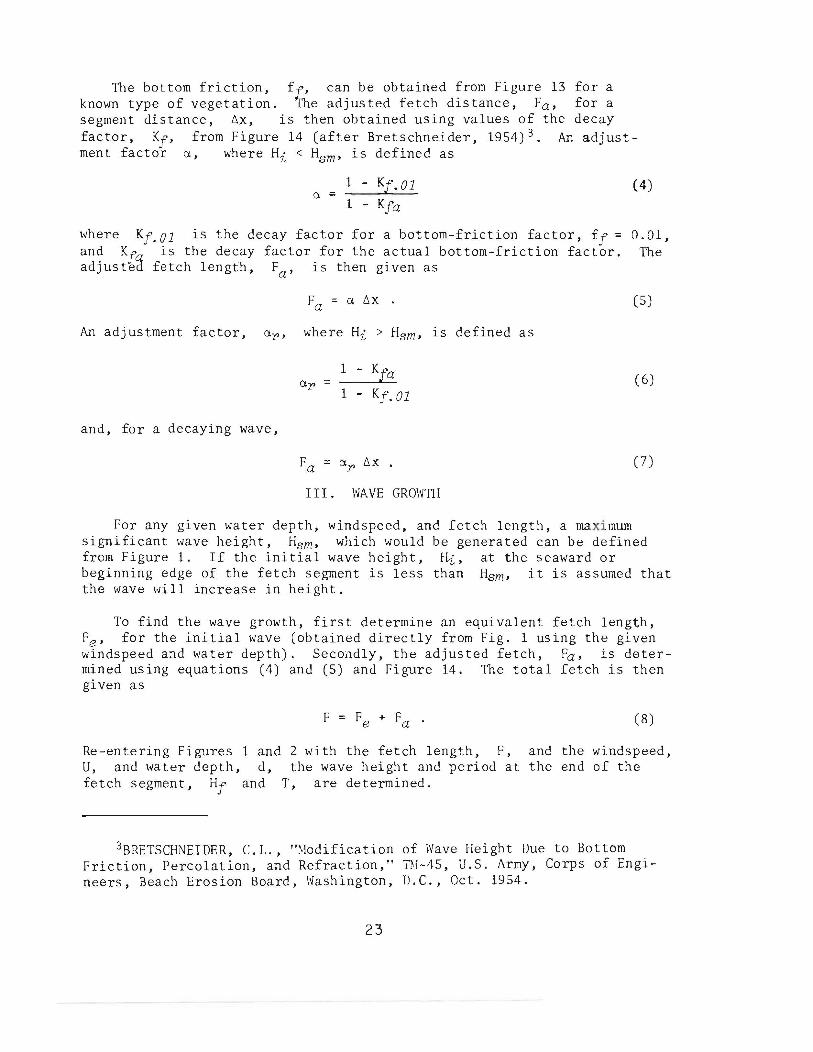
The bottom friction, ff' can be obtained from Figure 13 for a known type of vegetation. 1he adjusted fetch distance, Fa, for a segment distance, 6x, is then obtained using values of the decay factor, Kf' from Figure 14 (after Bretschneider, 1954)3. An adjustment factor a, where Hi < Hsm ' is defined as
a = 1 - Kf.Ol
1 - Kfa
(4)
where Kf.Ol is the decay factor for a bottom-friction factor, ff = 0.01, and Kf< is the decay factor for the actual bottom-friction factor. The adjuste~ fetch length, Fa' is then given as
(5)
An adjustment factor, ar, where Hi > Hsm , is defined as
1 - Kfa (6) 1 - Kf.Ol
and, for a decaying wave,
(7)
III. WAVE GROWTH
For any given water depth, windspeed, and fetch length, a maxi mum significant l<Jave height, Hsm , which would be generated can be defined from Figure 1. If the initial wave height, Hi, at the seaward or beginning edge of the fetch segment is less than Hsm , it is assumed that the wave will increase in height.
To find the wave growth, first determine an equivalent fetch length, Fe' for the initial wave (obtained directly from Fig. 1 using the given windspeed a:1d I,ater depth). Secoi1dly, the adjusted fetch, Fa, is determined using equations (4) and (5) and Figure 14. The total fetch is then given as
(8)
Re-entering Figures 1 and 2 with the fetch length, F, and the windspeed, U, and water depth, d, the wave height and period at the end of the fetch segment, Hf and T, are determined.
3BRETSCHNEIDER, C. L., "t<lodification of Wave Height Due to Bottom Friction, Percolation, and Refraction," 1/1'1-45, U.S. Army, Corps of Engineers, Beach Erosion Board, Washington, D.C., Oct. 1954.
23
1.20
1. 0 0
,::,: :~::"' :· -~r~:- . :t=:~=F=; --~
: ' ''f:':~:=,= ~-::!==o= _.:' :.+. '~E;:l:==~: ---=. :E
=== . :,..:3F= . . :f.~ ~Jh,- = .=.: -.
::-:: -:T-:::=:=-;E~L!:::."~~ : -- 'r='-= -.
r _"""t::::' -.:x .~ -:..- --_.
.. *,- . =-- -~~~ .. I'l'JUf>' ~ ~_
fe el
-:
Figure 13. Bottom-friction factors.
24
N (.J1
0.9999 ~ JI I II rl l !lill llllll I 1III 1111 11 111111 ,1'1 111l111I Ilf,
0 .999
0.99'1111111 09J M'
0. 9~
0.90
0.80
0.60
0.40 o.zo
0.10
Ilh'
IIII!·!!I,
, , , O.O~ H-H-I-H-I+H+I-h-+j1.+!t' iHIt!i-~i!!I1ll{ta.jN ' .lll lill
I I I M'TI 1I" r,tJtm~IlIl"~'~ ' 4~1-+++H~~+JI!~rtlli,.I ' IIIIfJIHltllil-4-
0.01
0.001 L!" ,
'lL !
III
1'1' 1'"
I 1111. Tlf
11 111 1'1 . I 'J , t·, '
, "
! ~
jii', TTT Ifll
I II
I" ,
IIIn m; ' (I, ,
ii l l
I it r-- .
11 1 1111
''I 1' "
1,111 ,
[ II 1m
I'll
I II
,. HiH +H +lJ+I+!·frrl l-'lI"*II,1 ~ . 1'1' ,111' 1! 1+ ! I! :; : ~ 1T m l,I,' ·!!· +-,-,-,-;...........o.[ III l.i ilfli, j ii I;:,: ~ ooool~~~~~~~~~~~~~~~~-w~~~~~~~~~~~~~~~~~~~~~~~~~-W~UL~~~~~~~~~~~~~~~~
1111
0.1 O.z OJ 0.4 O. ~ 0.6 0.8 1.0 z.O 3.0 4.0 ~ .O 6.0 8.0 10
" HiA• -d-Z -
ZO 30
Figure 14. Decay factors.
40 ~O 60 80 100 zoo 300 400 ~OO 600 600 1,000
(aflt r Brelschne i der , 1954)
IV. WAVE DECAY
If the initial significant wave height, at the seaward or beginning edge of a segment of fetch, exceeds the maximum significant wave height for the given water depth of the segment of fetch and the given windspeed, it may be assumed that the effects of the bottom friction will exceed the effects of the wind stress. Therefore, the wave will decay, will lose height, and over a long distance will approach a wave height equal to the maximum significant wave height.
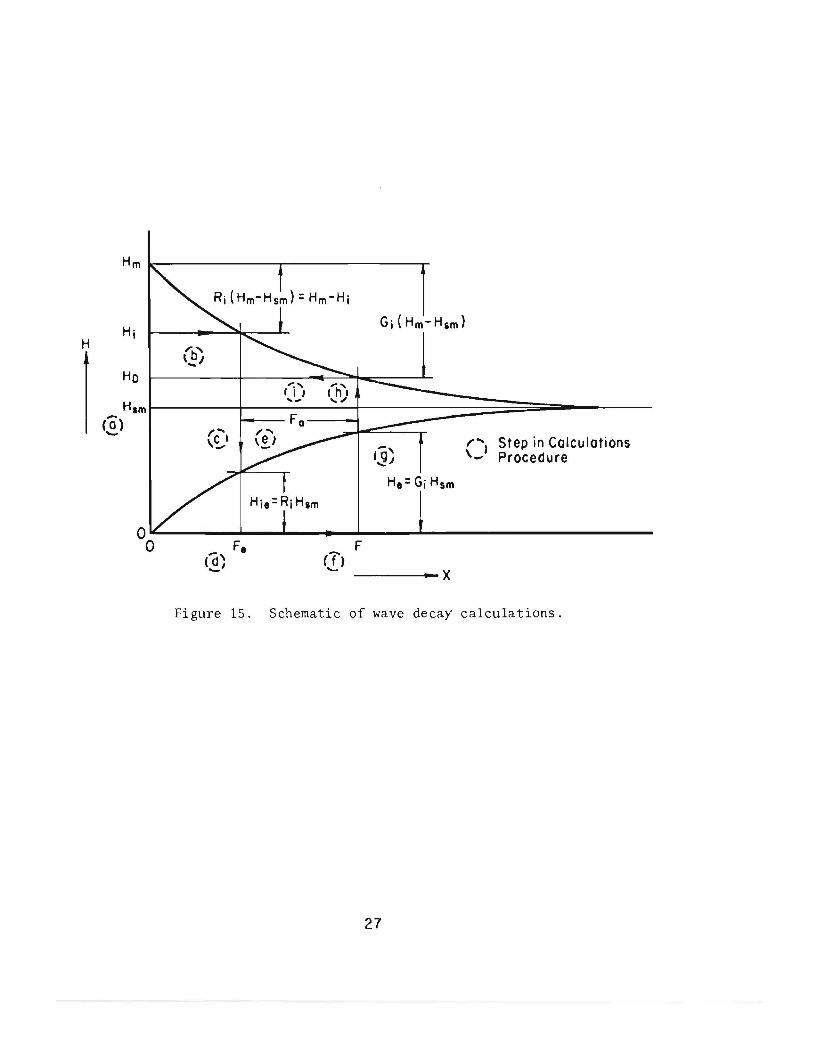
The method of determining the decayed wave height is shown in Figure 15. The following steps are used to predict the decay of a wave:
(a) Determine the maximum significant wave height that would be generated for a given windspeed and water depth, assuming an unlimited fetch and using Figure 1.
(b) Determine the fractional reduction, Ri' represented by the initial wave at the seaward edge of the segment of fetch under consideration.
This is given by
where ~ is the maximum stable wave height given as
(9)
l-k = O. 7 8 d ( 10)
(c) Determine the equivalent initial wave height, Hie, for wave growth by
(d) Determine the equivalent fetch length, Fe, for the wave height, Hie.
(e) Determine an adjusted fetch length, Fa' for the segment length, ~x, using equations (6) and (7).
(f) Determine the total fetch, F, from equation (8).
(g) Determine an equivalent wave height, He, for the total fetch and the given windspeed and water depth.
(h) Calculate the fractional growth by
26
(12)
H
Hm k---------------.-----------------~
Hi .... b' '_I
HO
Him (0) Fa
'c"'. - \- Ig' ...... J
1" Step in Calculations \_1 Procedure
He: Gi Hsm
o~------~--~---.--~----~---------------------o Fe (d' --'
F
• X
Figure 15. Schematic of wave decay calculations.
27
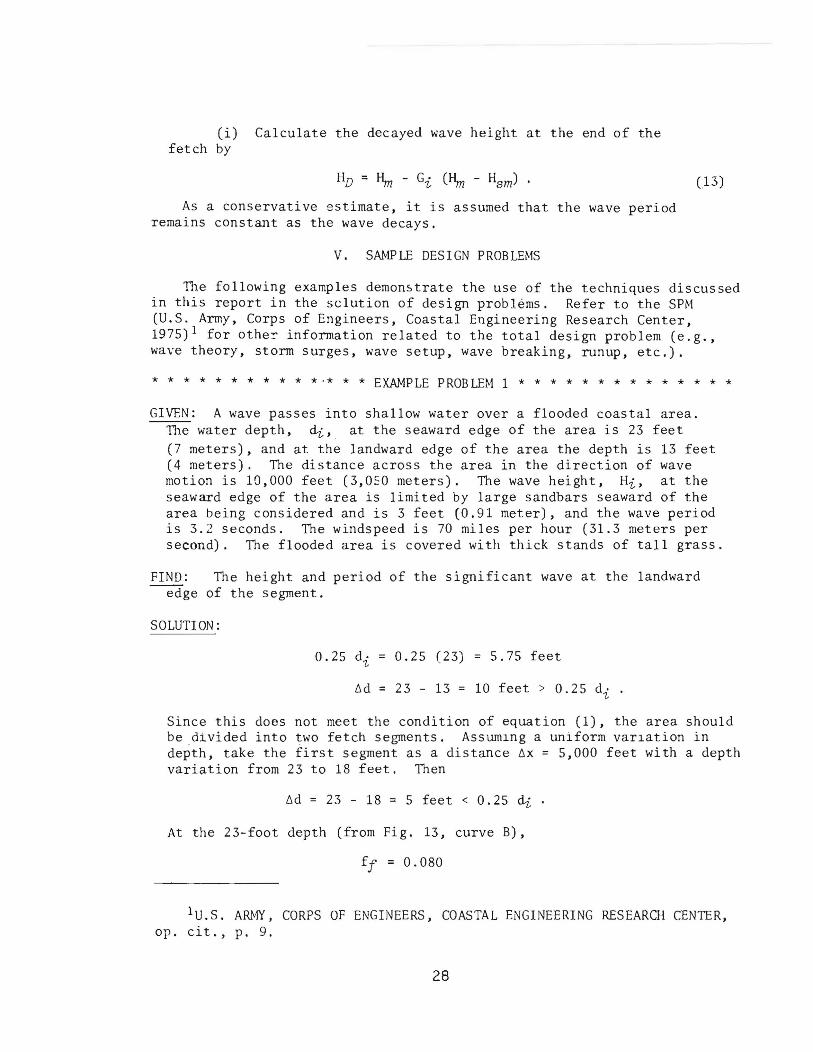
Ci) Calculate the decayed wave height at the end of the fetch by
As a conservative estimate, it is assumed that the wave period remains constant as the wave decays.
V. SAMPLE DESIGN PROBLEMS
(13)
The following examples demon5trate the use of the techniques discussed in this report in the sclution of design problems. Refer to the SPM (U.S. Army, Corps of Engineers, Coastal Engineering Research Center, 1975)1 for othe~ information related to the total design problem (e.g., wave theory, storm surges, wave setup, wave breaking, runup, etc.).
* * * * * * * * * * *' * * * E XAMP LE P ROB LEM 1 * * * * * * * * * * * * * *
GIVEN: A wave passes into shallow water over a flooded coastal area. The water depth, di, at the seaward edge of the area is 23 feet (7 meters), and at the landward edge of the area the depth is 13 feet (4 meters). The distance across the area in the direction of wave motion is 10,000 feet (3,050 meters). The wave height, Hi, at the seaward edge of the area is limited by large sandbars seaward of the area being considered and is 3 feet (0.91 meter), and the wave period is 3.2 seconds. The windspeed is 70 miles per hour (31.3 meters per second). The flooded area is covered with thick stands of tall grass.
FIND: The height and period of the significant wave at the landward edge of the segment.
SOLUTION:
0.25 di 0.25 (23) = 5.75 feet
6d = 23 - 13 = 10 feet > 0.25 di .
Since this does not meet the condition of equation (1), the area should be divided into two fetch segments. Assumlng a uniform varlation in depth, take the first segment as a distance 6x = 5,000 feet with a depth variation from 23 to 18 feet. Then
6d = 23 - 18 = 5 feet < 0.25 di
At the 23-foot depth (from Fig. 13, curve B),
ff = 0.080
lU.S. AR}~, CORPS OF ENGINEERS, COASTAL ENGINEERING RESEARCH CENTER, op. cit., p. 9.
28
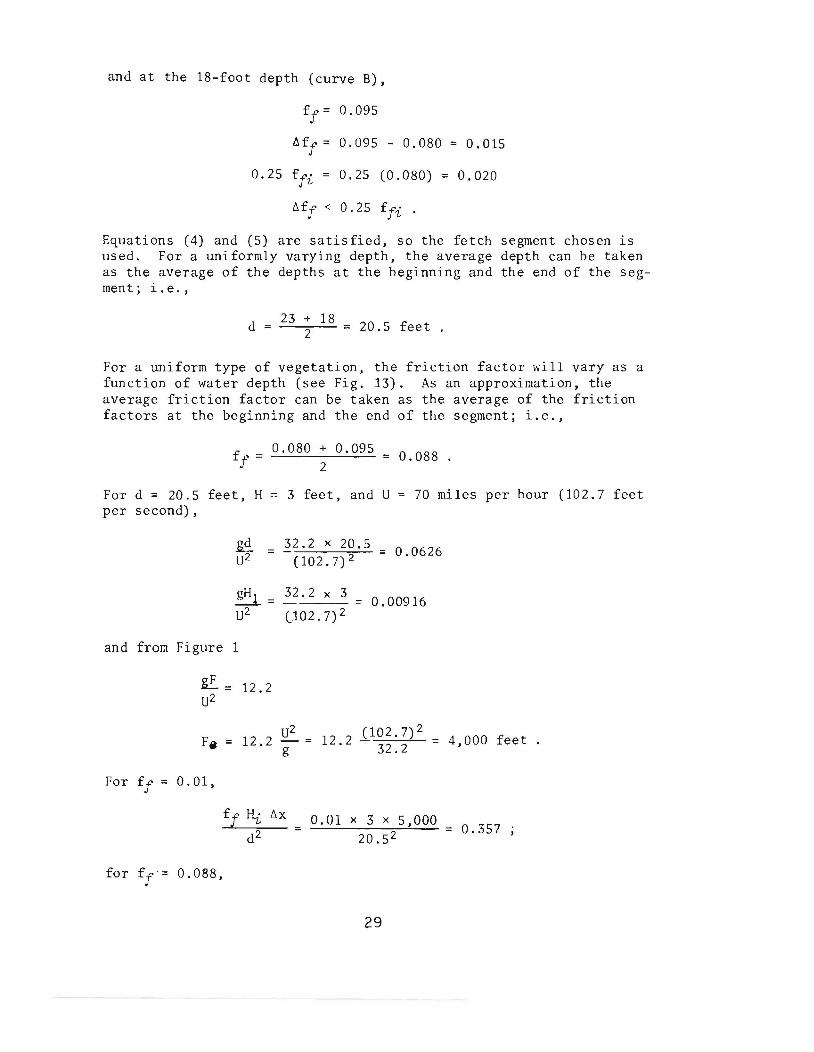
and at the 18-foot depth (curve 8),
ff = 0.095
6ff
= 0.095 - 0.080 = 0.015
0.25 ffi = 0.25 (0.080) = 0.020
t:,ff < 0.25 ffi
Equations (4) and (5) are satisfied, so the fetch segment chosen is used. For a uniformly varying depth, the average depth can be taken as the average of the depths at the beginning and the end of the segment; i. e. ,
23 + 18 d = 2 = 20.5 feet
For a uniform type of vegetation, the friction factor will vary as a function of water depth (see Fig. 13). As an approximation, the average friction factor can be taken as the average of the friction factors at the beginning and the end of the segment; i.e.,
ff = 0.080 + 0.095 0.088 =
2
For d = 20.5 feet, H 3 feet, and U 70 miles per hour per second),
~ U2
and from Figure 1
.8£.= 12.2 U2
32.2 )( 20.5 0.0626 -
(102.7)2
32.2 )( 3
(102.7) 2
=
= 0.00916
u2 Fa = 12.2 - =
g (102.7)2
12 . 2 "'::"""-=-2""':-..!.....-3 .2
For ff = 0.01,
for ff = 0.088,
0.01 )( 3 x 5,000 20.5 2
29
4,000 feet .
= 0.357
(102.7 feet
For the period, T
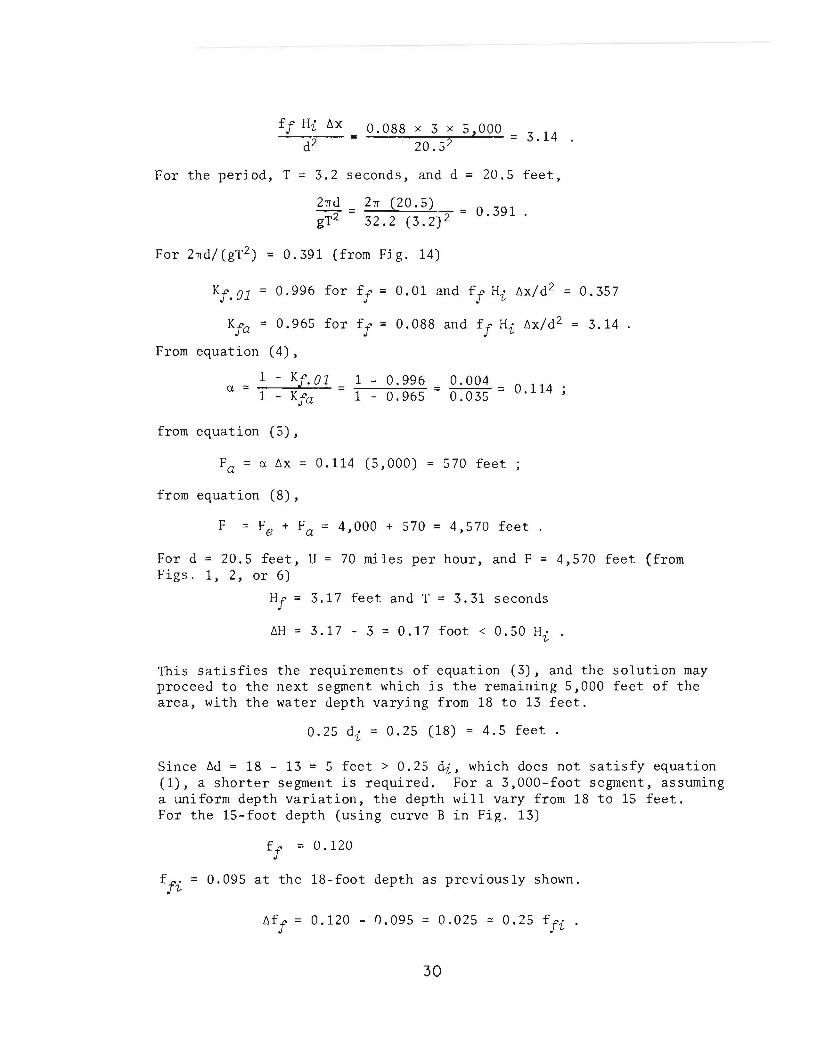
• 0.088 x 3 X 5,000 = 3.14 20.5 2
3.2 seconds, and d = 20.5 feet,
21Td 21T (20.5) - - = 0.391 gT2 - 32.2 (3.2)2
For 2nd/(gT2) = 0.391 (from Fig. 14)
Kf.01 0.996 for ff = 0.01 and ff Hi 6x/d2 = 0.357
Kfa = 0.965 for ff = 0.088 and ff Hi 6x/d2 = 3.14
From equation (4),
a = 1 - Kf.01 1 - Kfa
from equation (5),
1 0.996 1 - 0.965 = 0.004
0.035 = 0.114
Fa = a 6x = 0.114 (5,000) 570 feet
from equation (8),
F = Fe + Fa = 4,000 + 570 = 4,570 feet
For d = 20.5 feet, U = 70 miles per hour, and F = Figs. 1, 2, or 6)
Hf = 3.17 feet and T = 3.31 seconds
6H = 3.17 - 3 = 0.17 foot < 0.50 Hi
4,570 feet (from
This satisfies the requirements of equation (3), and the solution may proceed to the next segment which is the remaining 5,000 feet of the area, with the water depth varying from 18 to 13 feet.
0.25 di = 0.25 (18) = 4.5 feet
Since 6d = 18 - 13 = 5 feet> 0.25 di, which does not satisfy equation (1), a shorter segment is required. For a 3,000-foot segment, assuming a lliliform depth variation, the depth will vary from 18 to 15 feet. For the 15-foot depth (using curve B in Fig. 13)
ff = 0.120
ff' = 0.095 at the 18-foot depth as previously shown. . " 6ff = 0.120 - 0.095 = 0.025 ~ 0.25 ffi .
30
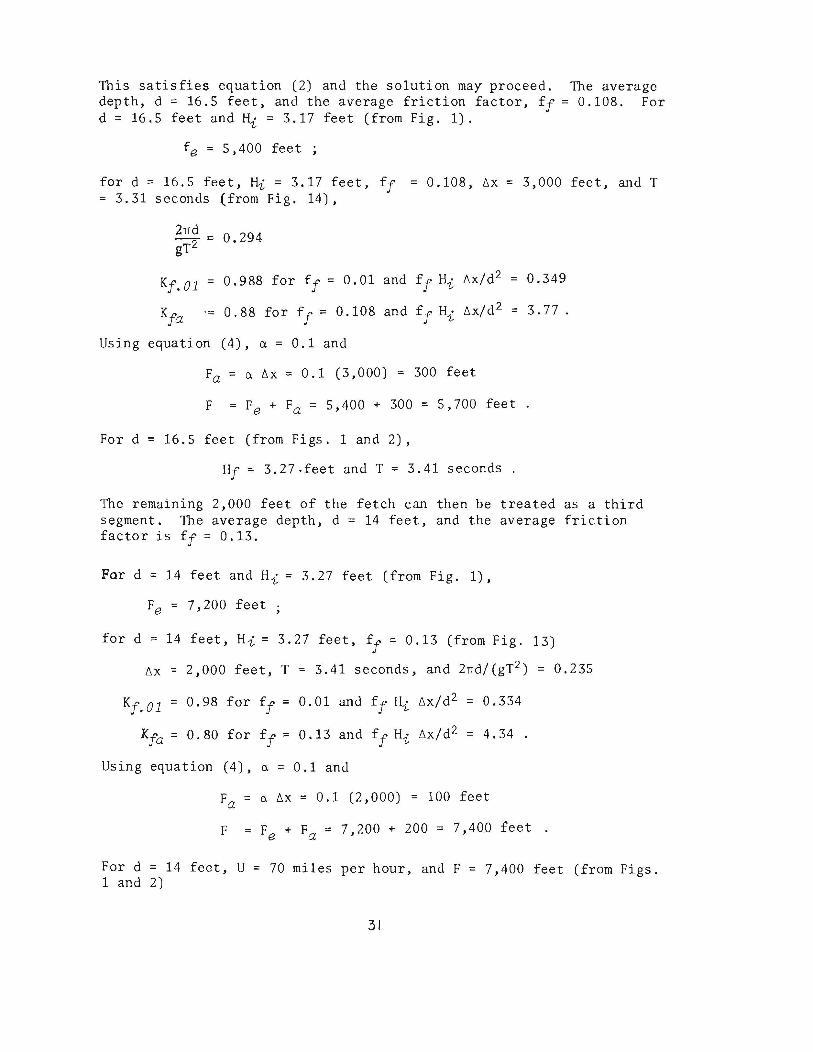
This satisfies equation (2) and the solution may proceed. The average depth, d = 16.5 feet, and the average friction factor, ff = 0.108. For d = 16.5 feet and Hi = 3.17 feet (from Fig. 1).
fe = 5,400 feet ;
for d = 16.5 feet, Hi = 3.17 feet, ff = 3.31 seconds {from Fig. 14),
21Td '" 0.294 gT2
0.108, !:1x
Kf.Ol = 0.988 for ff = 0.01 and ff Hi !:1x/d2
3,000 feet, and T
0.349
Kfa ,= 0.88 for ff = 0.108 and ff Hi !:1x/d 2 = 3.77.
Using equation (4), a = 0.1 and
Fa = a !:1x = 0.1 (3,000) = 300 feet
F Fe + Fa = 5,400 + 300 = 5,700 feet.
For d = 16.5 feet (from Figs. 1 and 2),
Hf = 3.27.feet and T = 3.41 seconds.
The remaining 2,000 feet of the fetch can then be treated as a third segment. The average depth, d = 14 feet, and the average friction factor is ff = 0.13.
For d = 14 feet and Hi = 3.27 feet (from Fig. 1),
Fe = 7,200 feet
for d = 14 feet, Hi = 3.27 feet, ff = 0.13 (from Fig. 13)
!:1x = 2,000 feet, T = 3.41 seconds, and 2rrd/(gTL) = 0.235
Kf.Ol = 0.98 for ff = 0.01 and ff Hi !:1x/d2 = 0.334
Kfa = 0.80 for ff = 0.13 and ff Hi !:1x/d2 4.34
Using equation (4), a = 0.1 and
Fa a !:1x = 0.1 (2,000) = 100 feet
F Fe + F = a 7,200 + 200 = 7,400 feet
For d = 14 feet, U = 70 miles per hour, and F 1 and 2)
31
7,400 feet (from Figs.
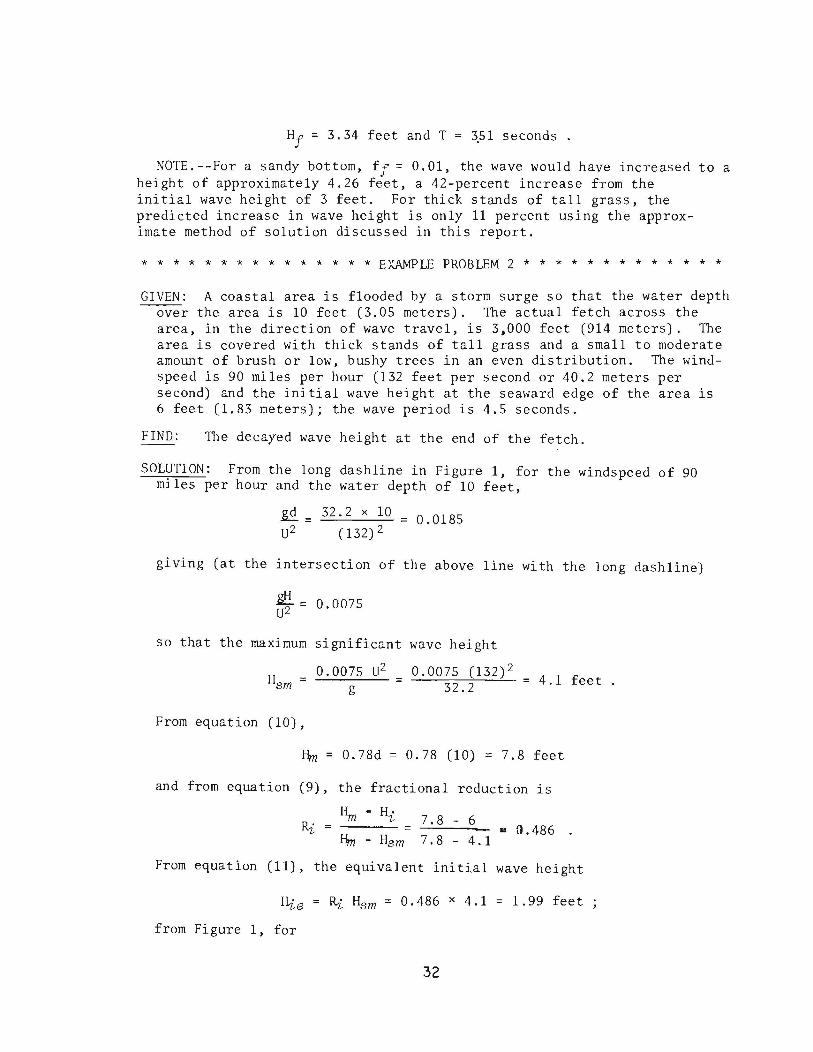
Hf = 3.34 feet and T = ~5l seconds.
NOTE.--For a sandy bottom, ff = 0.01, the wave would have increasen to a height of approximately 4.26 feet, a 42-percent increase from the initial wave height of 3 feet. For thick stands of tall grass, the predicted increase in wave height is only 11 percent using the approximate method of solution discussed in this report.
* * * * * * * * * * * * * * * EXAMPLE PROBLEM 2 * * * * * * * * * * * * *
GIVEN: A coastal area is flooded by a storm surge so that the water depth over the area is 10 feet (3.05 meters). The actual fetch across the area, in the direction of wave travel, is 3,000 feet (914 meters). The area is covered with thick stands of tall grass and a small to moderate amount of brush or low, bushy trees in an even distribution. The windspeed is 90 miles per hour (132 feet per second or 40.2 meters per second) and the initial wave height at the seaward edge of the area is 6 feet (1.83 meters); the wave period is 4.5 seconds.
FIND: The decayed wave height at the end of the fetch.
SOLUTION: From the long dashline in Figure 1, for the windspeed of 90 miles per hour and the water depth of 10 feet,
~ = 32.2 x 10 = 0.0185 U2 (132)2
giving (at the intersection of the above line with the long dash line)
~ - 0.0075 U2 -
so that the maximum significant wave height
0.0075 U2 Hsm = g
From equation (10),
0.0075 (132)2 32.2 4.1 feet .
Hm = 0.78d = 0.78 (10) = 7.8 feet
and from equation (9), the fractional reduction is
7.8 - 6
7.8 - 4.1 .. 0.486
From equation (11), the equivalent initial wave height
Hie = Ri Hsm = 0.486 x 4.1 = 1.99 feet
from Figure 1, for
32
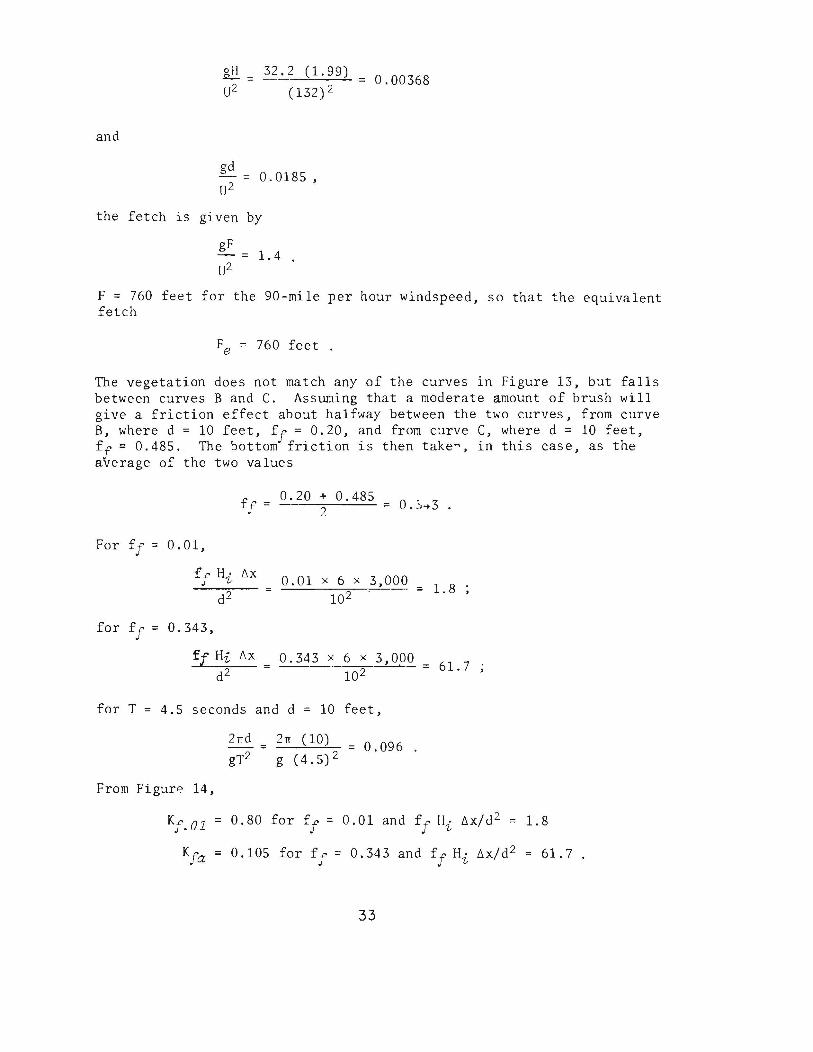
and
~ = 32.2 (1.99) = U2 (132)2
gd - = 0.0185 , lJ2
0.00368
the fetch is given by
gF - = 1.4 U2
F = 760 feet for the 90-mile per hour windspeed, so that the equivalent fetch
Fe = 760 feet .
The vegetation does not match any of the curves in Figure 13, but falls between curves Band C. Assuming that a moderate amount of brush will give a friction effect about halfway between the two curves, from curve B, where d = 10 feet, ff = 0.20, and from curve C, where d = 10 feet, ff = 0.485. The bottom friction is then taken, in this case, as the average of the two values
For ff =
for ff =
for T
0.01,
ff Hi
d2
0.343,
f[ Hi d2
f 0.20 + 0.485
f = 2 = 0 " 3 ..... "t •
D.X
D.X
0.01 x 6 x 3,000 = 10 2
0.343 x 6 x 3,000 ----------~~~- =
10 2
1.8
61.7
4.5 seconds and d = 10 feet,
21f (10)
g (4.5)2 0.096 .
From Figur<;> 14,
Kf . 01 = 0.80 for ff = 0.01 and ff Hi 6X/d 2 = 1.8
Kfa = 0.105 for ff = 0.343 and ff Hi 6x/d 2 = 61.7
33
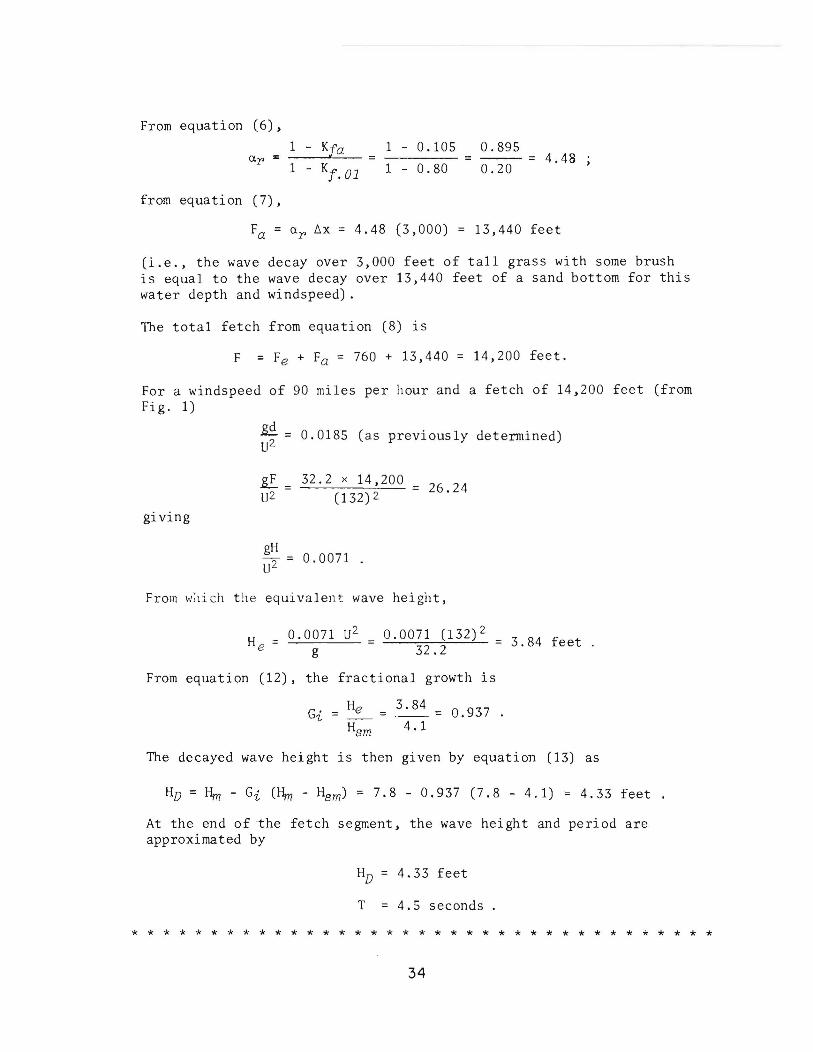
From equation (6) ,
1 - Kfa 1 - 0.105 0.895 aT' :: = = = 4.48
1 - Kf • 01 1 - 0.80 0.20
from equation ( 7),
Fa = aT' ~x = 4.48 (3,000) = 13,440 feet
(i.e., the wave decay over 3,000 feet of tall grass with some brush is equal to the wave decay over 13,440 feet of a sand bottom for this water depth and windspeed) .
The total fetch from equation (8) is
F = Fe + Fa = 760 + 13,440 = 14,200 feet.
For a windspeed of 90 miles per hour and a fetch of 14,200 feet (from Fig. 1)
~ = 0.0185 (as previously determined) U2
giving
~ = 32.2 x 14,200 = U2 (132) 2
gH 2 = 0.0071 U
26.24
From ,,,;\ich the equivalent wave height,
H = 0.0071 U2 e g
0.0071 (132)2 = 32.2
From equation (12), the fractional growth is
H Gi = ~
Hsm
3.84
4.1 :;: 0.937 .
3.84 feet .
The decayed wave height is then given by equation (13) as
HD = Hm - Gi (Hm - Hsm) = 7.8 - 0.937 (7.8 - 4.1) = 4.33 feet
At the end of the fetch segment, the wave height and period are approximated by
HD = 4.33 feet
T = 4.5 seconds
* * * * * * * * * * * * * * * * * * * * * * * * * * * * * * * * * * * * *
34
Camfield, Frederick E.
A method for estimating wind-tlave growth and decay in shallow water with high values of bottom friction / by Frederick E. Camfield.--Ft. Belvoir, Va. : U.S. Coastal Engineering Research Center; Springfield, Va. : available from !iational Technical Information Service, 1977.
34 p. : ill. (Coastal engineering technical aiu - U.S. Coastal Engineering Research Center ; CETA 77-6)
Bibliography: p. 10l. Report describes a method for estioatinp, wind-wave grotJth and decay
over flooded areas IJhere there is a major friction effect because of dense vegetation. These technical guidelines are an extension of the procedures given in the SP!l "hich limits the design curves to waves passing over a sandy bottom.
1. Wave generation. 2. Wind "aves. 3. Shallow "ater waves. 1. Title. II. Series: U.S. Coastal Engineering Research Center. Coastal engineering technical aid. CETA 77-6.
TC203 .U581ta no. 77-6 627
Camfield, Frederick E.
A method for estimating wind-Have grOtJth anu decay in shallow water with high values of bottom friction / by Frederick E. Camfield.--Ft. Belvoir, Va. : U.S. Coastal Engineering Research Center; Springfield, Va. : available from National Technical Information Se rvice, 1977.
34 p. : ill. (Coastal engineerinG technical aid - U.S. Coastal Engineering Research Center; CETA 77-6)
Bibliography: p. 101. Report describes a method for estioating wind-lJave growth and decay
over flooded areas where there is a major friction effect because of dense vegetation. These technical guidelines are an extension of the procedures given in the SPM "hich limits the design Curves to waves passing over a sandy bottom.
1. Wave generation. 2. Wind \4aVes. 3. Shallow t4ater 14aVes. I. Ti tIe. II. Series: U. S. Co as t al Engineering Research Cen te r. Coas tal engineerinf: teclmical aid. CETA 77-6.
TC203 • U581ta no. 77-6 627
Camfield, Frederick E.
A method for estimating wind-wave growth and decay in shallow water with high values of bottom friction / by Frederick E. Camfield.--Ft. BelVOir, Va. : U:S. Coastal Engineering Research Center; Springfield, Va. : available from National Technical Information Service, 1977.
34 p. : ill. (Coastal engineering technical aid - U.S. Coastal Engineering Research Center ; CETA 77-6)
Bibliography: p. 101. Report describes a method for estimating wind-wave growth and decay
over flooded areas where there is a major friction effect because of dense vegetation. These technical guidelines are an extension of the procedures given in the SPM which limits the design curves to waves passing over a sandy bottom.
1. Wave generation. 2. Wind waves. 3. Shallow water waves. I. Title. II. Series: U.S. Coastal Engineering Research Center. Coastal engineering technical aid. CETA 77-6.
TC203 .U581ta no. 77-6 627
Camfield, Frederick E.
A method for estimating winu-wave growth and decay in shallow water with high values of bottom friction / by Frederic!: E. Camfield.--Fr. Belvoir, Va. : U.S. Coastal Engineering Research Center; Springfield, Va. : available from National Technical Information Service, 1977.
34 p. : ill. (Coastal engineering technical aid - U.S. Coastal Engineering Research Center ; CETA 77-6)
Bibliography: p. 101. Report describes a method for estimating wind-wave growth and decay
over flooded areas where there is a major friction effect because of dense vegetation. These technical guidelines are an extension of the procedures given in the SPM which limits the design curves to waves passing over a sandy bottom.
1. \'ave generation. 2. Wind waves. 3. Shallow water waves. I. Title. II. Series: U.S. Coastal Engineering Research Center. Coastal engineering technical aid. CETA 77-6 .
TC203 • U581 ta no. 77-6 627
Related Documents