META-ANALYSIS ON DECEPTION AND P3 AMPLITUDE 1 A meta-analysis of the P3 amplitude in tasks requiring deception in legal and social contexts Anja Leue and André Beauducel Corresponding author: Prof. Dr. Anja Leue, University of Kiel, Institute of Psychology, Germany, email: [email protected] Date of submission: 28-February-2019

Welcome message from author
This document is posted to help you gain knowledge. Please leave a comment to let me know what you think about it! Share it to your friends and learn new things together.
Transcript
META-ANALYSIS ON DECEPTION AND P3 AMPLITUDE 1
A meta-analysis of the P3 amplitude in tasks requiring deception
in legal and social contexts
Anja Leue and André Beauducel
Corresponding author: Prof. Dr. Anja Leue, University of Kiel, Institute of Psychology,
Germany, email: [email protected]
Date of submission: 28-February-2019

META-ANALYSIS ON DECEPTION AND P3 AMPLITUDE 2
Abstract
In deception tasks the parietal P3 amplitude of the event-related potential indicates either
recognition of salient stimuli (larger P3 following salient information) or mental effort
(smaller P3 following demanding information). This meta-analysis (k = 77) investigated
population effect sizes () for conceptual and methodological a-priori moderators (study
design, pre-task scenario, context of deception tasks, and P3 quantification). Within-subjects
designs show evidence of the underlying cognitive processes, between-subjects designs allow
for comparisons of cognitive processes in culprits vs. innocents. Committed vs. imagined
mock crime scenarios yield larger . Deception tasks with a legal context result in almost
twice as large than deception tasks with social-interactional and social-biographical
contexts. Peak-to-peak P3 quantification resulted in larger than other quantifications.
Counter-measure techniques in 3-stimulus protocols reduce the discriminability of concealed
vs. truthful P3 amplitudes. Depending on stimulus knowledge, deception tasks provide
evidence for the salience hypothesis and the mental effort hypothesis, respectively.
Key words: cognitive processes, deception, legal and social context, random-effects meta-
analysis, P3 amplitude

META-ANALYSIS ON DECEPTION AND P3 AMPLITUDE 3
1. Introduction
The investigation of dishonest or concealed information by means of verbal criteria (Vrij,
2015), behavioral and physiological data has a research tradition of more than 55 years (e.g.,
Abe et al., 2014; Ben-Shakhar & Elaad, 2003; Farwell & Donchin, 1991; Furedy & Ben-
Shakhar, 1991; Garrigan, Adlam, & Langdon, 2016; Lykken, 1959; Rosenfeld, Nasman,
Whalen, Cantwell, & Mazzeri, 1987; Rosenfeld, 2018; Vendemia, 2014). O’Sullivan (2008)
emphasized that the literature on deception and lie detection is heterogeneous and can be
related to misinforming others, active lying, or concealing information. One opportunity to
learn more about the cognitive processes occurring during deception is to disentangle the
contexts in that people behave in a deceptive vs. non-deceptive manner and to ask whether
more active deception such as lying or misinforming others is related to different cognitive
processes than concealing information. Moreover, to disentangle the cognitive processes
during socially and forensically relevant behavior like deception time-sensitive parameters as
event-related potentials (ERP) are highly promising in social neuroscience (e.g., Amodio,
Bartholow, & Ito, 2014; Caccioppo & Decety, 2011; Ganis & Keenan, 2009; Rengifo, 2011).
Therefore, the present meta-analysis aims at showing meta-analytic evidence for two
theoretical accounts on cognitive processes in deception tasks for legal and social contexts
and by means of the P3 amplitude. The contexts can be differentiated as follows: (a)
Deception in legal settings implies that people anticipate, imagine or know that their behavior
would have been related to legal consequences in a real-life situation (e.g., being punished
for stealing items, being incarcerated). (b) Deception in social-interactional settings means
that people are afraid of negative consequences in their social relations (e.g., being criticized,
being rejected for their attitudes, not being liked). Thus, deception in social-interactional
settings is related to the anticipation of social rejection. (c) Deception in social-biographical
settings implies that people typically conceal knowledge of learned items (e.g., meaning of
playing cards and games) or (self-chosen) autobiographical items (e.g., names of towns,
names of family member, birthday dates, places where known items are located). Thus,
investigating deception in different experimental task settings (i.e., instructed contexts and

META-ANALYSIS ON DECEPTION AND P3 AMPLITUDE 4
tasks) by means of a meta-analysis helps to learn more about the generalizability of cognitive
processes underlying deception and external validity.
1.1. Previous meta-analyses on deception
Over the years, different meta-analyses on deception detection have been conducted. These
meta-analyses were based on studies investigating response times (Bond & DePaulo, 2006;
Suchotzki, Verschuere, Van Bockstaele, & Ben-Shakhar, 2017), electrodermal measures
(Ben-Shakhar & Elaad, 2003; Meijer, Klein Selle, Elber, & Ben-Shakhar, 2014), the P3
amplitude (Meijer et al., 2014), and functional magnet resonance imaging data (Christ, Van
Essen, Watson, Brubaker, & McDermott, 2009). These meta-analyses incorporated
exclusively deception tasks in legal settings entitled as guilty knowledge tests (GKT) or
concealed information tests (CIT, Lykken, 1959, 1974; Verschuere & Ben-Shakhar, 2011).
To investigate the accuracy of GKT/CITs after correcting for measurement errors (e.g.,
unreliability), Ben-Shakhar and Elaad (2003) suggested investigating the following
moderators: number and repetitions of GKT questions, type of verbal answer, and kind of
motivational instruction. Meijer et al. (2014) investigated the validity of the CIT in a meta-
analysis for skin conductance, respiration, heart rate, and P3 data in 35 task conditions.
Meijer et al. (2014) focused on the following moderators: paradigm (personal-item vs. mock-
crime; complex trial protocol, CTP: yes or no), type of protocol (e.g., number of questions 1
vs. > 1), and unknowledgeable participants (innocent vs. not using innocent subgroups). In
sum, prior meta-analyses focused on the investigation of the moderators that are related to the
task setting in GKT/CITs. The present meta-analysis aims at including deception tasks of
legal and social task settings –not exclusively GKT/CITs– and at addressing a-priori
moderators that have not yet been investigated. According to this broad perspective, the
common aspect of the studies investigated here is that the participants are instructed to
deceive, to conceal knowledge, or to lie. We thereby do not presume that the instruction to
deceive, to conceal knowledge, or to lie induces identical cognitive processes.

META-ANALYSIS ON DECEPTION AND P3 AMPLITUDE 5
1.2. Cognitive processes in deception tasks
There is no single theory on cognitive processes in deception tasks (e.g., Verschuere, Ben-
Shakhar, & Meijer, 2011; Rosenfeld, 2018; Vendemia, 2014, Figure 3). However, predictions
on different cognitive processes activated during deception can be derived from previous
deception research and from research of the parietal P3 amplitude of the ERP. The parietal P3
amplitude has been introduced as an indicator of stimulus salience because it is selectively
sensitive to resources of a perceptual and cognitive nature (Kok, 2001, p. 558). Stimulus
salience in deception tasks means that known stimuli are more salient than unknown (new)
stimuli. Therefore, a known stimulus induces a more positive P3 amplitude than an unknown
stimulus especially when the knowledge of the stimulus is concealed. Typically, the
participants are instructed to learn the known stimuli and to recognize them during the task.
Unknown stimuli are not presented before the task (i.e., they are new stimuli). Known stimuli
should be more salient than unknown stimuli (Kok, 2001). Moreover, deception should be
affectively valent because individuals usually know that not telling the truth is against a
social rule and that honesty is a value that confirms ethical standards (see Abe et al., 2014).
There is also some evidence in deception studies suggesting smaller P3 amplitudes to
concealed compared to non-concealed information (Johnson Jr., Banhardt, & Zhu, 2005;
Pfister, Foerster, & Kunde, 2014; Wu, Hu, & Fu, 2009). Those findings can be interpreted in
terms of the mental effort concept (Beauducel, Brocke, & Leue, 2006) because concealing
knowledge can be regarded as an effortful task. Concealing or deceiving knowledge in the
sense of suppressing knowledge at the behavioral level may cost more mental effort than not
concealing knowledge. When individuals invest more mental effort the P3 amplitude should
be smaller because of an internal dual-task requirement. Internal dual-task requirement
means: More cognitive resources are necessary for one process (e.g., suppressing knowledge)
and fewer resources are available for another process such as current stimulus processing
(Beauducel et al., 2006). Thus, depending on the study design (within-subjects vs. between-
subjects), the experimental conditions and the deception task the P3 amplitude is presumed to
indicate either recognition of known, salient stimuli (Kok, 2001) or mental effort (Beauducel
et al., 2006).

META-ANALYSIS ON DECEPTION AND P3 AMPLITUDE 6
1.3. Pre-task scenario and context of deception task as a-priori moderators
Some deception tasks like GKT/CITs can be differentiated with regard to pre-task scenarios.
GKT/CITs with a pre-task scenario ask participants either to commit a mock crime (e.g.,
stealing a jewel or a wallet) or to imagine they would have committed a mock crime (i.e., a
simulated criminal act in an experimental study). Following theories on episodic memory, the
commission of real behavior results in more intense memory than the imagination of an event
(Schacter, Addis, Hassabis, Martin, Spreng, & Szpunar, 2007). Accordingly, the deception of
a committed mock crime should be more salient resulting in a larger population effect size
than the deception of an imagined or observed mock crime.
Deception has been investigated in experimental tasks that comprise different contexts such
as legal contexts (GKT/CITs), social-interactional contexts (e.g., tasks that require concealing
attitudes), and social-biographical contexts (e.g., concealing knowledge of learned verbal vs.
numerical items such as names, birthday dates, location of objects). GKT/CITs incorporate
probe, target, and irrelevant stimuli. Probe stimuli are known to participants and they are
instructed to conceal knowledge to pre-defined stimuli. Target stimuli are also known to
participants and they are instructed to respond truthfully to those stimuli. Irrelevant stimuli
are typically unknown to participants and participants are instructed to respond truthfully to
these stimuli. Research has shown that stimulus processing in GKT/CITs is related to
recognition of known, salient vs. unknown, non-salient stimuli (Gamer & Berti, 2010; Kok,
2001; Leue & Beauducel, 2015; Leue, Lange, & Beauducel, 2012; Meijer, Verschuere,
Gamer, Merckelbach, & Ben-Shakhar, 2016). In GKT/CITs, known probe stimuli are
presumed to be more salient (more positive P3 amplitude). Unknown irrelevant or known
irrelevant stimuli are expected to evoke less intense stimulus salience (less positive P3
amplitude). GKT/CITs allow for the investigation of known (probe) vs. unknown (irrelevant)
P3 effects in a within-subjects design in the whole sample or in a subgroup of mock guilty
participants. GKT/CITs are related to a legal setting when participants are instructed to
commit, imagine or observe a mock crime. In addition to GKT/CITs, active lying has been
investigated in other paradigms by means of the parietal P3 amplitude (e.g., Pfister et al.,

META-ANALYSIS ON DECEPTION AND P3 AMPLITUDE 7
2014; Suchotzki et al., 2017). Active lying differs from concealing information in GKT/CITs
by the fact that response buttons to probe and irrelevant stimuli are not identical but lying to
known information requires a different response than truthful responding to known
information. That is, lying is characterized by actively suppressing information and providing
different responses, whereas concealing information does not require different reactions than
responding truthfully. Accordingly, concealing information especially requires to mentally or
affectively reduce the legal or ethical meaning of a stimulus (probe).
In deception tasks with a social setting, participants are typically asked to conceal their
attitudes or their intentions. These social deception tasks are characterized by the fact that
participants know all stimuli. They are instructed to respond truthfully to a subset of known
stimuli and to conceal their attitudes or knowledge to another subset of known stimuli (e.g.,
Dong, Wu, & Lu, 2010; Leue & Beauducel, 2015; Leue et al., 2012). Finally, deception tasks
with a social-biographical context require participants to conceal knowledge of stimuli like
words, names, dates, playing cards or object locations. In these tasks, participants are asked
to conceal their knowledge of specific items and to respond truthfully to other known stimuli
entitled as targets and irrelevant stimuli, respectively (e.g., Gamer & Berti, 2010; Kubo &
Nittono, 2009).
Thus, in experimental tasks with social contexts, P3 effects to concealed information
(concealed P3) are compared with P3 effects to truthful, known information (non-concealed
P3) in a within-subjects design. In contrast, in legal settings P3 effects to concealed
information (probe P3) are typically compared with P3 effects to unknown, irrelevant stimuli
(irrelevant P3) in a within-subjects design. Accordingly, we calculated the population effect
sizes and the standard deviations of the population effect sizes for P3 amplitudes of probe vs.
irrelevant stimuli and for P3 amplitudes to concealed, known vs. non-concealed, known
stimuli. We presumed that deception tasks with a legal setting result in more pronounced
population effect sizes compared to deception tasks with a social setting. This prediction
derives from the fact that concealing knowledge in a ‘higher stakes’ context should be more

META-ANALYSIS ON DECEPTION AND P3 AMPLITUDE 8
salient than concealing knowledge in a ‘lower stakes’ context (Le, 2016; Porter & ten Brinke,
2010). Deception in a ‘higher stakes’ context is associated with serious (anticipated)
consequences for the individual who behaves against legal or social rules (e.g., becoming
incarcerated, behaving as untrustworthy), whereas deception in a ‘lower stakes’ context is
related to minimal consequences (e.g., behaving against task instruction, Le, 2016; Porter &
ten Brinke, 2010).
1.4. Counter-measure techniques in 3-stimulus protocols and complex trial protocols
Till date, counter-measure techniques have been exclusively tested in GKT/CITs and for
various physiological parameters (Ben-Shakhar, 2011; Peth, Suchotzki, & Gamer, 2016;
Rosenfeld, Soskins, Bosh, & Ryan, 2004). Counter-measure techniques can be applied to
irrelevant items or to probe items. When counter-measure techniques are successfully applied
to probe stimuli, physiological responses to probe stimuli are reduced compared to situations
without counter-measure techniques. When counter-measure techniques are applied to
irrelevant stimuli, physiological responses to irrelevant stimuli are intensified and become
more similar to physiological responses following probe stimuli. To investigate effects of
counter-measure techniques we compared population effect sizes obtained in primary studies
with and without counter-measure techniques. Successful application of counter-measure
techniques should reduce the difference between probe and irrelevant stimuli. Therefore, the
population effect size for task conditions with counter-measure techniques should be smaller
compared to the population effect size for task conditions that did not apply counter-measure
techniques. CTPs have been introduced to avoid the successful application of counter-
measure techniques (cf. Hu & Rosenfeld, 2012; Labkovsky & Rosenfeld, 2014; Meixner &
Rosenfeld, 2011; Rosenfeld et al., 2008). The population effect size of CTP studies should be
larger (i.e., representing a more pronounced probe vs. irrelevant P3 difference) than the
population effect size of primary studies with a successful application of counter-measure
techniques (cf. 3-stimulus protocol of the GKT/CIT).

META-ANALYSIS ON DECEPTION AND P3 AMPLITUDE 9
1.5. P3 quantification as an a-priori moderator
We investigated whether variations of stimulus salience (i.e., the recognition of rare and/or
significant known items) as reflected in the parietal P3 amplitude generalize across different
contexts of experimental task settings. The parietal P3 amplitude of the ERP is a positive
deflection typically occurring between 300 and 1000 ms post-stimulus (Cuthbert, Schupp,
McManis, Hilman, & Bradley, 1995; Johnson, 1986, 1993; Olofsson & Polich, 2007). Some
studies entitled this parietal ERP component as the Late Positive Component (LPC, Polich,
2007). Because the parietal P3 and the parietal LPC have not been associated with different
processes we refer to the term “P3” component subsequently (Polich, 2007, p. 2128). Studies
in the late 1970s and in the 1980s have shown that type of stimulus (i.e., the relevance of a
stimulus) and stimulus probability (i.e., the frequency of a stimulus presentation) modulate
the P3 amplitude (e.g., Donchin, 1981; Johnson & Donchin, 1978; Johnson, 1986, 1993).
Stimulus salience can vary depending on affective valence and depending on whether a
stimulus is known or unknown. Known stimuli are presented to participants before the
beginning of the task.
Prior studies demonstrated that the quantification method of the ERP has an impact on the
reliability of ERP parameters (e.g., Huffmeijer, Bakermans-Kranenburg, Alink, & van
Ijzendoorn, 2014; Leue, Klein, Lange, & Beauducel, 2013; Marco-Pallares, Cucurell, Münte,
Strien, & Rodriguez-Fornells, 2011; Pollock & Schneider, 1992; Rietdijk, Franken, & Thurik,
2014). In primary studies, mean amplitudes were quantified as the mean number of data
points in a time interval and baseline-to-peak P3 amplitudes were calculated as the most
positive peak in a time interval relative to baseline (Luck, 2014). Peak-to-peak P3 amplitudes
in primary deception tasks were computed in accordance with Rosenfeld, Angell, Johnson,
and Qian (1991) as the difference between the most positive P3 peak and the most negative
peak of the subsequent ERP component (for details see also Soskins, Rosenfeld, & Niendam,
2001). According to the Spearman-Brown prophecy formula averaging a larger number of
data points results in a more reliable component. Accordingly, the reliability of the P3
amplitude depends on the number of averaged epochs. Because the number of averaged data
META-ANALYSIS ON DECEPTION AND P3 AMPLITUDE 10
points is larger for peak-to-peak and mean amplitudes we expected that the peak-to-peak and
the mean amplitude quantification of the P3 amplitude is more reliable than the baseline-to-
peak amplitude. Therefore, we investigate the effect of the quantification method of the P3 on
the population effect size and on the standard deviation of the population effect size.
1.6. Aims and research questions of the present meta-analysis
The present meta-analysis aimed at disentangling salience and effort effects by means of the
parietal P3 amplitudes. We proposed on the one hand that experimental conditions in
deception tasks with a differentiation of known vs. unknown information facilitate the
recognition of stimulus salience (i.e., P3 following known, deceptive stimuli is larger than the
P3 following unknown, truthful information). On the other hand, we predicted that
experimental conditions in deception tasks with a differentiation of known, deceptive vs.
known, truthful information facilitate the mental effort effect (i.e., P3 following known,
deceptive is smaller than the P3 following known, truthful information). We investigated
evidence for the salience hypothesis and the mental effort hypothesis, respectively, in P3
studies using within-subjects designs and between-subjects designs, respectively. We expect
that the differentiation of known versus unknown stimuli that triggers the salience hypothesis
primarily occurs in a legal context, whereas the differentiation of known stimuli requiring
deceptive responses versus known stimuli requiring truthful responses primarily occurs in
social settings. Moreover, we addressed the following research questions by means of overall
and a-priori moderator analyses (Table 1): (a) Does the population effect size depend on the
context of the deception task (i.e., legal and social) and the corresponding study design
(within-subjects design vs. between-subjects design)? These two aspects were investigated
within one question because study design is determined by experimental task conditions. (b)
Does the pre-task scenario (committed vs. imagined mock crime) influence the population
effect size? (c) Do counter-measure techniques reduce the difference between probe and
irrelevant stimuli resulting in a smaller population effect size for counter-measure studies
compared to deception studies without a counter-measure technique? (d) Do pre-processing
parameters of the EEG data (e.g., quantification method) affect the population effect size?

META-ANALYSIS ON DECEPTION AND P3 AMPLITUDE 11
--- Table 1 ---
2. Method
2.1. Literature search
An electronic literature search has been conducted in the data bases PsycInfo, Medline, and
Google scholar. We included studies that were published or that were available online until
June, 8th, 2018. Former literature searches have been updated in 2015 and 2016. Abstracts
that were published in these data bases were screened for the relevant key words: “deception,
EEG” and “deception, ERP” resulting in 118 references. The PRISMA flow diagram (Figure
1) summarizes the procedure of the literature search (see also Moran, Schroder, Kneips, and
Moser, 2017). In order to keep the literature search as reproducible as possible we restricted
our search to these simple two combinations of terms. The use of a complex set of keywords
implies that researchers have a population of studies in mind that they aim to map based on
the included keywords. However, we had no a-priori mind set of studies and, therefore, the
keywords constitute an a-priori definition of the study population.
--- Please insert Figure 1 about here ---
2.2. Exclusion of primary studies
Of these 118 references several primary studies had to be excluded because of the following
reasons: (1) k = 13 studies investigated electrodermal parameters (e.g., skin conductance
level) or cardiovascular parameters (e.g., heart rate), (2) k = 4 studies investigated EEG
frequency band data or connectivity data, (3) k = 9 studies investigated exclusively other
stimulus-locked ERPs (e.g., N400 amplitude) or stimulus-locked P300 at occipital sites
instead of parietal sites (Gibbons, Schnürch, Wittinghofer, Armbrecht, & Stahl, 2018), (4) k =
9 studies investigated response-locked or feedback-locked ERPs (e.g., response-locked
medial frontal negativity, feedback-locked P3), (5) k = 2 studies investigated dipole sources
in a deception task, (6) k = 9 deception studies did not report ERP findings but discussed the
overall investigation of physiological parameters in deception studies or (7) were reviews (k
= 3), (8) k = 1 study was not on deception although the P3 was investigated (Spapé, Hoggan,
META-ANALYSIS ON DECEPTION AND P3 AMPLITUDE 12
Jaccucci, & Ravaja, 2015), (9) k = 2 studies investigated the frontal P3 (Gibbons et al., 2018;
Proverbio, Vanutelli, & Adorni, 2013), which conceptually differs from the parietal P3 (Kok,
2001), (10) k = 3 studies were performed in a financial context or in an individual vs.
collaborative crime context that cannot be mapped on the legal and social context of the
present meta-analysis (Lu et al., 2018; Rosenfeld et al., 2017, 2018), and (11) k = 3 studies
investigated specific memory processes like retrieval and suppression of memory
(Bergström, Anderson, Buda, Simons, & Richardson-Klavehn, 2013; Hu, Bergström,
Bodenhausen, & Rosenfeld, 2015; Meixner & Rosenfeld, 2014). Thus, a total of 60
references including 77 P3-results were available for statistical analysis (Table S1; see
Supplementary Material). We consider each task condition that allowed for the calculation of
a P3-related effect size as a primary study (abbreviated with “k”).
2.3. Coding of study characteristics and calculation of effect size
Study characteristics were independently coded by the first author and three members of her
team. Study characteristics were obtained from the Method and Results sections of the
published articles. Many publications included a statement that their studies were approved
by a local Ethics Committee. As the present meta-analysis referred to the results of the
primary studies, the procedures applied in this meta-analysis were not additionally approved
by a local Ethics Committee. The authors analyzed the meta-analytic data with the best of
their scientific and state-of-the-art knowledge. The following study characteristics were
coded (cf., Table S1): sample size of the primary study, gender, features of EEG
preprocessing (e.g., quantification of the P3 amplitude, time window of the P3 amplitude,
topographical maximum of the P3 amplitude), study design (between-subjects design vs.
within-subjects design), and type of deception task (pre-task scenario vs. no pre-task
scenario); deception tasks with a legal context (GKT/CIT) or a social context. Coding of the
study characteristics was iteratively discussed if coding of the study characteristics did not
match. This procedure was chosen in order to sharpen the categories that were used to code
study characteristics. Prior to statistical analysis a consensus between the first author and

META-ANALYSIS ON DECEPTION AND P3 AMPLITUDE 13
three members of her team was reached for the coding of the study characteristics of the
included primary studies.
We were mainly interested in the following statistical findings: (1) task condition main
effect, (2) electrode position x task condition interaction or a task condition x stimulus
interaction. The effect size of a primary study was positively coded (i.e., confirming the
salience hypothesis) when the parietal P3 amplitude was more positive to probe compared to
irrelevant pictures (within-subjects design). The effect size of a primary study was negatively
coded (i.e., confirming the mental effort hypothesis) when the parietal P3 amplitude was less
positive to probe/concealed compared to irrelevant/non-concealed stimuli (within-subjects
design). In a between-subjects design we positively coded the effect size of a primary study
when the guilty group who was asked to conceal knowledge showed more positive P3
amplitudes than the innocent group who always responded truthfully.
We performed a random-effects meta-analysis that controls for the fact that the studies are
heterogeneous at the level of the population effect sizes (i.e., the studies are selected from
populations with different effect sizes, Hunter & Schmidt, 2000; for alternatives of random-
effects meta-analysis see Hedges, 1983). Statistical values like t-scores and descriptives (e.g.,
M and SD) were transformed into effect size d for each task condition of a primary study. F-
scores were in a first step transformed into effect size r according to the formula reported in
Rosenthal and DiMatteo (2001). In a second step, effect size r was transformed into effect
size d based on a formula given in Hunter and Schmidt (2004; see also Schmidt and Hunter,
2014). If no statistical values were reported for non-significant findings effect size d was set
to zero.
2.4. Correction of measurement error
Hunter and Schmidt (2004) suggested several measurement errors that should be corrected
for before population effect sizes are calculated. Here, we corrected for sampling error and
for unreliability of the P3 amplitude. Thus, in accordance with Hunter and Schmidt (2004),

META-ANALYSIS ON DECEPTION AND P3 AMPLITUDE 14
we conducted an artefact-corrected meta-analysis. We compare the findings of the artefact-
corrected meta-analysis with findings of the barebones meta-analysis exclusively correcting
for sampling error. Based on Turner and Bernard (2006) population effect sizes d and can
be transformed into Hedges g to compare our findings with meta-analytic findings reporting
Hedges g or d* (e.g., Meijer et al., 2014; Suchotzki et al., 2017). We used the formula
presented in Hunter and Schmidt (2004, p. 284-285) in order to calculate the approximately
unbiased estimator of the effect sizes (d*, sometimes called ‘Hedges g’) and of the
approximately unbiased estimator of the standard deviation of effect sizes (𝑆𝐷𝑑∗).
Reliability studies suggest that ERPs are more reliably measured with a larger number of
averaged epochs (e.g., Fabiani, Gratton, Karis, & Donchin, 1987; Leue et al., 2013; Marco-
Pallares et al., 2011; Pollock & Schneider, 1992). A higher number of trials per stimulus type
typically results in a higher reliability coefficient and a better signal-to-noise ratio. For the P3
amplitude, variations of reliability coefficients have been reported for test-retest reliability
(e.g., Huffmeijer et al., 2014) and for internal consistency coefficients such as Cronbach’s
alpha and split-half reliability in go/nogo tasks (Rietdijk et al., 2014). Because none of the
deception-P3 studies reported the reliability of the P3 amplitude we searched for studies
reporting the internal consistency of the P3 amplitude in other experimental tasks (see Cohen
& Polich, 1997; Pollock & Schneider, 1992; Boudewyn, Luck, Farrens, & Kappenman,
2018). Rietdijk et al. (2014, Figure 2) observed a Cronbach’s alpha coefficient of .80 for the
P3 amplitude at Pz when 30 trials in a go/nogo task were averaged. Till date the study of
Rietdijk et al. (2014) is the only P3 study that reported Cronbach’s alpha coefficients of the
P3 amplitude for the number of averaged trials. Thus, to correct the unreliability of the P3
amplitude in the deception studies, we used Cronbach’s alpha coefficients for the P3
amplitude at Pz of .80 for 30 averaged epochs (Rietdijk et al., 2014, Figure 2) as a starting
point. Epoch-specific Cronbach’s alpha coefficients for the probe/concealed and the
irrelevant/non-concealed P3 amplitude were calculated by means of the Spearman-Brown
prophecy formula of each primary study because this formula corrects reliability based on the
number of available stimulus events. The Cronbach’s alpha coefficient for the

META-ANALYSIS ON DECEPTION AND P3 AMPLITUDE 15
probe/concealed P3 amplitude and the Cronbach’s alpha coefficient for the irrelevant/non-
concealed P3 amplitude were averaged per task condition (because reliability of difference
scores is less reliable).
2.5. Statistical analysis
We used the meta-analysis software of Schmidt and Le (2004, 2014). When a primary study
included more than one P3-finding for the same sample of different experimental conditions
(e.g., words, objects), we averaged the effect sizes across experimental conditions because
the single effect sizes would depend on the same sample (e.g., Cutmore, Djakovic, Kebbell,
& Shum, 2009; Meek, Phillips, Bowswell, & Vendemia, 2013). When a primary study
reported effects for a within-subjects effect and for a between-subjects effect, effect sizes
were separately coded for the within-subjects effect and for the between-subjects effect (e.g.,
Meixner & Rosenfeld, 2011). This was due to the fact that the within-subjects effect refers to
the comparison of probe/concealed P3 vs. irrelevant/non-concealed P3. The between-subjects
effect refers to P3 effects (probe minus irrelevant) in a guilty subgroup (concealing
knowledge) compared to an innocent subgroup (responding truthfully). We separately
calculated effect sizes of primary studies without countermeasure effects, with counter-
measure effects, and for studies applying CTPs (e.g., Hu, Hegemann, Landry, & Rosenfeld,
2012; Labkovsky & Rosenfeld, 2012; Meixner, Haynes, Winograd, Brown, & Rosenfeld,
2009; Meixner & Rosenfeld, 2010; Winograd & Rosenfeld, 2011, Table S1, column
“deception task / CM”). When primary studies reported P3 findings for different
quantification methods (e.g., baseline-to-peak P3, mean P3, peak-to-peak P3), we calculated
the effect size separately for each quantification method of the primary study (e.g., Johnson
& Rosenfeld, 1992).
We describe the results in terms of the population effect size (), the standard deviation of
the population effect size (SD), the lower and upper 90% credibility interval, and the
percentage of variance in corrected population effect size () attributable to all artefacts (%
Var. Acc. for). A ratio of /SD larger than 2 indicates that the effect size is always positive

META-ANALYSIS ON DECEPTION AND P3 AMPLITUDE 16
in the population (i.e., probe/concealed P3 is larger than irrelevant/non-concealed P3) and,
thus, confirms the salience hypothesis (Hunter & Schmidt, 2004, p. 65). According to Hunter
and Schmidt (2004) moderator analysis should be conducted when the artefact-corrected
population effect size explained less than 75% of the variance.
The fail-safe number was calculated in accordance with Orwin (1983) and Rosenthal
(1979). The fail-safe number developed by Orwin (1983) is based on d and indicates how
many unpublished primary studies would be necessary to reduce an observed population
effect size d of the bare-bones meta-analysis to a given effect size (e.g., a small effect size
of d = .10). Although the calculation of the fail-safe number has been criticized (Borenstein,
Hedges, Higgins, & Rothstein, 2009), Heene (2010) illustrated that the fail-safe number is
still a convincing tool to evaluate the robustness of meta-analytic findings.
3. Results
3.1. Frequencies and descriptive statistics
All included primary studies (k = 77) investigated variations of P3 amplitudes with a parietal
topographical maximum in deception tasks. Most of the primary studies conducted a within-
subjects design (k = 54) or a within-subjects design in the guilty subgroup (k = 14) and
investigated whether the concealed/deceptive-P3 amplitude was larger than the
irrelevant/non-concealed-P3 amplitude. A subset of k = 9 studies conducted a between-
subjects design. Of the studies that applied a within-subjects design, k = 47 studies
demonstrated evidence for the salience hypothesis (positive population effect size, Table 2)
and k = 7 studies demonstrated results for the mental effort hypothesis (negative population
effect size, Table 2). These seven studies revealing evidence for the mental effort hypothesis
included tasks in that participants were instructed to lie to pre-defined stimuli and to respond
truthfully to other pre-defined stimuli. The difference between concealing information and
lying in the studies analyzed here is realized through different sets of pre-defined buttons. Of
the 77 primary studies that reported the number of ERP epochs, we calculated Cronbach’s
alpha for the concealed/deceptive P3 amplitude and the non-concealed/non-deceptive P3
META-ANALYSIS ON DECEPTION AND P3 AMPLITUDE 17
amplitude by means of Spearman-Brown prophecy formula (Supplement Table S1). Overall,
the P3 amplitudes were often of a moderate to high reliability (Nunnally and Bernstein,
1994).
In order to investigate the research questions outlined above, separate moderator analyses
were performed in studies without counter-measure techniques for task design (within-
subjects vs. between-subjects design; section 3.2.), for type of deception tasks (legal or
social) and task setting (referring to pre-task scenario; section 3.3.), and for quantification of
P3-amplitudes (section 3.4.). Finally, we performed a moderator analysis for primary studies
that applied counter-measure techniques (section 3.5.).
3.2. Overall analysis
For the k = 77 primary studies a medium positive population effect size of 0.72 was
observed suggesting that a more positive P3-amplitude to concealed/deceptive information
compared to non-concealed/non-deceptive information occurred in most experimental task
conditions (Table 2). The mean population effect sizes of the barebones meta-analysis (dm =
0.65), the approximately unbiased estimator (𝑑𝑚∗ = 0.63), and the artefact-corrected meta-
analysis ( = 0.72) were rather similar so that we focus on the artefact-corrected meta-
analysis subsequently. The ratio of the population effect size and the standard deviation of
the population effect size (/SD) across all studies was smaller than 2 (see Table 2,
0.72/0.56) demonstrating that not all results in the primary studies confirmed the salience
hypothesis. The percentage of explained variance accounted for by all artefacts was smaller
than 75% suggesting that moderators might explain further variance.
When the effects of artefacts were removed, the population effect sizes of primary studies
with a between-subjects design always confirmed the salience hypothesis as indicated by an
SD of zero (i.e., this subset of primary studies was very homogeneous). With regard to study
design, primary studies with a within-subjects design resulted in highest population effect

META-ANALYSIS ON DECEPTION AND P3 AMPLITUDE 18
sizes ( = 0.81) relative to studies that applied a within-subjects design in (guilty) subgroups
( = 0.62) or a between-subjects design ( = 0.38).
--- Table 2 ---
3.3. Moderator analysis: Type of deception task
In studies using a within-subjects design and without counter-measure effects (Table 3) it
was investigated whether the concealed/deceptive P3-amplitude is larger than the non-
concealed/non-deceptive P3-amplitude. As the different effect size estimates were very
similar, we focus again on the artefact-corrected estimates. Population effect sizes were
highest for GKT/CITs with a committed mock crime scenario (k = 9). The ratio of /SD was
larger than 2 for GKT/CITs with a mock crime scenario (/SD: 0.94/0.40 = 2.35) and with a
committed mock crime scenario (/SD: 1.10/0.24 = 4.58) indicating that the
concealed/deceptive P3 amplitudes were significantly larger than the non-concealed/non-
deceptive P3 amplitudes. The population effect size was larger for GKT/CITs with
committed mock crime scenarios compared to imagined or observed mock crime scenarios
(/SD: 0.59/0.43 = 1.37). Thus, the concealed/deceptive P3 amplitudes were substantially
larger than the irrelevant/non-concealed/non-deceptive P3 amplitudes in GKT/CITs with
committed mock crime scenarios but not in GKT/CITs with imagined or observed mock
crime scenarios. Population effect sizes for deception tasks within a social-interactional
context ( = 0.63) and for deception tasks in a social-biographical context were moderate to
high ( = 1.01, Table 3). For deception tasks in a social context the ratio of /SD was
substantial (/SD: 0.63/0.26 = 2.42, i.e., the salience hypothesis was mostly confirmed).
Deception in card games and verbal/numerical tasks that did not evoke a legal context also
revealed moderate to high population effect sizes and the study subset was very
homogeneous (SD = 0; i.e., salience hypothesis was always confirmed according to the
population effect sizes). Deception tasks with a forensic scenario” (Table 3) include studies
of Meek et al. (2013) activating a police setting, Johnson et al. (1992, two effect sizes) asking
for antisocial acts and Rosenfeld et al. (2009) instructing participants to give a falsified ID.

META-ANALYSIS ON DECEPTION AND P3 AMPLITUDE 19
These paradigms are more complex and include other stimulus types (e.g., misinformation)
compared to CITs which we classified as “deception tasks in a legal context” (Table 3).
---- Table 3 ----
3.4. Moderator analysis: Quantification of the P3 amplitude
Again, the population effect sizes of the barebones meta-analysis, the approximately
unbiased estimator of mean effect sizes, and the artefact-corrected effect sizes were very
similar (Table 4). We investigated population effects depending on the quantification of the
P3 amplitude in deception tasks with a within-subjects design. A substantial ratio of /SD
(1.24 / 0.28 = 4.43) was exclusively observed for a peak-to-peak quantification of P3
amplitudes indicating that the salience hypothesis was confirmed when the P3 amplitude was
quantified by means of a peak-to-peak method. To investigate the population effect size for
the peak-to-peak quantified P3 amplitudes we conducted separate moderator analyses in
GKT/CITs with a mock crime scenario (k = 8) and GKT/CITs without a mock crime scenario
(k = 12). Table 4 illustrates that the peak-to-peak quantification of the P3 amplitude resulted
in a more homogeneous study set in GKT/CITs with a mock crime scenario (SD = 0)
compared to GKT/CITs without a mock crime scenario (SD = 0.41).
---- Table 4 ---
3.5. Counter-measure effects
All studies using a 3-stimulus protocol (probe, target, irrelevant) with counter-measure
techniques (k = 10) applied counter-measure techniques to irrelevant stimuli so that the
magnitude of irrelevant-P3 amplitudes should become similar to the magnitude of probe-P3
amplitudes. The ratio of /SD was smaller than 2 for primary studies that investigated
counter-measure effects (/SD: 0.55/0.47 = 1.17, Table 5) suggesting that the
probe/concealed P3 amplitude was not larger than the irrelevant/non-concealed P3 amplitude
in 3-stimulus-protocols. This finding supports assumptions on counter-measure effects
presuming that physical and mental counter-measure techniques reduce the difference
between probe/concealed and irrelevant/non-concealed P3 amplitudes. The CTP studies (k =
13) incorporated a 2 2 combination of task scenario (mock crime vs. no mock crime) and
META-ANALYSIS ON DECEPTION AND P3 AMPLITUDE 20
counter-measure techniques (yes vs. no): within-subjects CTPs with mock crime and
counter-measure techniques (k = 2), CTPs with mock crime and without counter-measure
techniques (k = 3), CTPs without mock crime and without counter-measure techniques (k =
1; Rosenfeld, Tang et al., 2009), and CTPs without mock crime and with counter-measure
techniques in within-subjects designs (k = 7). We observed an artefact-corrected population
effect size of = 1.12 for all available CTP studies (Table 5). This population effect size was
almost twice as large as the population effect size for studies with a 3-stimulus protocol with
counter-measure techniques ( = 0.55). CTPs without a mock crime scenario and with
counter-measure techniques (k = 7) revealed a substantial ratio of /SD (1.40/0.52 = 2.69).
Thus, the predicted P3 difference (P3-probe > P3-irrelevant) was confirmed in CTP studies
without mock crimes and with counter-measures. Moreover, the population effect size in the
CTP subset of k = 7 studies was more than twice as large than in 3-stimulus protocol studies
with counter-measure techniques. The standard deviation of the population effect size of CTP
studies (SD = 0.52) was comparable to the standard deviation of the population effect size of
counter-measure studies (SD = 0.47). Despite a comparable standard deviation of the
population effect size, the probe P3 was substantially larger than the irrelevant P3 in CTPs
confirming the salience hypothesis. These findings also indicate that the probe vs. irrelevant
difference of the P3 amplitudes remains in CTPs (without mock crime scenarios) despite of
applied counter-measure techniques. In line with Meijer et al. (2014), our findings show that
the CTP-without mock crime and with counter-measures (which all incorporated
autobiographical items) have a larger population effect size ( = 1.40; Table 5) than the
GKT/CIT with mock crime ( = 0.94; Table 5).
---- Table 5 ----
3.6. Fail-safe number
The calculation of the fail-safe number revealed three very robust barebones population
effect sizes (Table 2, last column: fail safe number). A total of k = 351 to k = 424
unpublished studies would be necessary to reduce several population effect sizes to a small
effect size of d = 0.10. In other words, the number of unpublished studies should be six to

META-ANALYSIS ON DECEPTION AND P3 AMPLITUDE 21
seven times larger to reduce the observed barebones population effect sizes to a small effect
size of d = .10 (Cohen, 1966). It is rather unlikely that such a large number of unpublished
studies with non-significant results exists for all deception studies investigating P3 effects (k
= 424), applying a within-subjects design (without counter-measure effects, k = 351). The
evidence for the salience hypothesis is also very robust because N = 362 unpublished primary
studies would be necessary to reduce the population effect size to a small effect of .10.
Another subset of population effect sizes suggested robust results with a number of k = 21 to
k = 57 unpublished task conditions being necessary to reduce the observed population effect
size to a small effect size of d = 0.10 (Table 2). For this subset we cannot rule out that a
relevant number of unpublished studies exists that could reduce the observed population
effect size to a small effect size of d = 0.10. As nonsignificant findings could have a reduced
likelihood to be published it might be possible that a substantial number of unpublished
studies exist (cf., Ferguson & Heene, 2012).
Table 3 indicates that the population effect sizes for deception tasks in a legal context (k =
117), for deception tasks in social contexts (k = 141), and for legal GKT/CITs with a
committed mock crime (k = 74) were substantial and very robust. The number of unpublished
studies would have been seven to eight times larger than k to reduce the population effect
size to a d of 0.10. For the moderator P3 quantification (Table 4), the population effect sizes
are robust for the peak-to-peak P3 quantification across deception tasks (k = 263) and for the
mean P3 amplitudes (k = 37). The number of unpublished studies would have been three to
about ten times larger than the published studies to reduce the population effect sizes to d =
0.10. Similarly, in Table 5 the number of unpublished CTP studies without mock crime and
with counter-measure effects should have been 11 times larger than k to reduce the
population effect size to a d of 0.10.
4. Discussion
This meta-analysis presents the following main findings: The ratio of the overall population
effect size was smaller than 2 suggesting that the salience hypothesis was not always

META-ANALYSIS ON DECEPTION AND P3 AMPLITUDE 22
confirmed (Table 2, research question a). In studies using a within-subjects design the
artefact-corrected population effect size was almost twice as large as in studies applying a
between-subjects design (Table 2). In line with research question (a), we demonstrated that
the population effect sizes for GKT/CITs with imagined or observed mock crime and with
committed mock crime scenarios were about twice higher than population effect sizes in
social contexts (Table 3). The ratio of /SD was substantial for GKT/CITs with mock crime
scenarios and deception in social contexts suggesting that the salience hypothesis was always
confirmed in these studies. Additionally, it is noteworthy that the population effect size in
legal deception tasks ( = 0.98, Table 3) was positive and more pronounced than the
population effect size in deception tasks comprising social contexts ( = 0.73, Table 3)
suggesting that recognition of stimulus salience is more likely in GKT/CITs whereas a
combination of recognition of stimulus salience and mental effort might account for the
smaller population effect size in deception tasks with social contexts. In deception tasks with
social contexts all stimuli are known and there are no real unknown stimuli (e.g., playing
cards of 9, 10 are typically known to people who have ever played cards). Thus, the P3
difference between concealed information and truthful information might be due to a
combined effect of recognition of stimulus salience (enhancing the P3 amplitude) and mental
effort (reducing the P3 amplitude).
In accordance with research question (b), we found that committing a mock crime
was more salient compared to the imagination of a mock crime (Table 3). With regard to the
quantification method of the P3 amplitude (research question c), the population effect size of
the peak-to-peak quantification was about three to four times as large compared to baseline-
to-peak quantification and mean amplitude quantification (Table 4). Moreover, the standard
deviation of the population effect size for peak-to-peak quantification was only half as large
as for the baseline-to-peak quantification suggesting that the latter quantification results in
more noise. In contrast, the standard deviation of the population effect size for the mean
amplitudes was nearly comparable to the standard deviation of the population effect size for
baseline-to-peak quantification. As presumed in research question (d), the population effect
size for 3-stimulus protocols with countermeasure techniques (Table 5) was smaller
META-ANALYSIS ON DECEPTION AND P3 AMPLITUDE 23
compared to the population effect size for deception tasks in a legal context without counter-
measures (Table 3). CTP studies suggested a population effect size that was twice as large as
the population effect size observed for 3-stimulus CITs with a successful application of
counter-measure techniques (Table 5).
4.1. Cognitive processes in deception tasks
Our findings support a differentiation of ‘lower stakes’ and ‘higher stakes’ deception
contexts. Deception tasks in legal contexts demonstrate ‘higher stakes’ situations compared
to deception tasks in social-biographical contexts as card games and social-interactional
contexts representing ‘lower stakes’ situations (Le, 2016; Porter & ten Brinke, 2010). The
salience hypothesis was confirmed and effect sizes were substantial for deception tasks in a
legal context (/SD : 0.98 / 0.39 = 2.51) and for deception tasks in social contexts (/SD :
0.73 / 0.25 = 2.92, Table 3). This finding illustrates that the salience hypothesis is a valuable
account to explain at least one essential cognitive process during deception. The fact that the
standard deviation of the population effect size was not zero reveals that some heterogeneity
remained in the study subsets. This might be due to the fact that other cognitive processes
beyond stimulus salience and mental effort (Beauducel et al., 2006; Kok, 2001) such as
orienting and inhibition (Klein Selle, Verschuere, Kindt, Meijer, & Ben-Shakhar, 2016,
2017), encoding, switching, updating, storing etc. (Oberauer, Süß, Wilhelm, & Wittmann,
2003; Verschuere & Ben-Shakhar, 2011) may account for the P3 differences to deceptive vs.
truthful stimuli. As deception tasks in social settings do typically not incorporate unknown
stimuli it is likely that the parietal P3 amplitude difference between probe/concealed and
irrelevant/non-concealed stimuli in legal settings is at least partly due to familiarity effects
(known vs. unknown stimuli). Thus, recognition of known/salient stimuli seems to be a
cognitive process during deception that depends on the relation of known compared to
unknown or known irrelevant information.
It should also be noted that deception tasks in a social context also resulted in robust P3
findings (Table 3). Thus, P3-related cognitive processes on deception can be well studied in

META-ANALYSIS ON DECEPTION AND P3 AMPLITUDE 24
tasks applying a within-subjects design that represent a legal context (e.g., GKT/CITs with
mock crime comparing probe-P3 amplitudes vs. irrelevant-P3 amplitudes) but also in a social
context (e.g., concealing attitudes, trustworthiness). The negative population effect size for
the P3 has been exclusively observed in primary studies that instructed participants to lie and
that compared P3 effects of known, concealed vs. known, truthful stimuli (k = 7, Table 2).
This demonstrates that mental effort modulates P3 effects when deception/lying occurs in a
context of known stimuli and requires active suppression of information. The differentiation
of known, concealed vs. known, unconcealed information by means of P3 variations is more
likely in social settings or in tasks with previously learned verbal/numerical stimuli that did
not activate a specific context (Table 3).
4.2. Quantification of the P3 amplitude in deception tasks
The peak-to-peak quantification as suggested by Rosenfeld et al. (1991) and Soskins et al.
(2001) contributed most to the confirmation of the salience hypothesis. The peak-to-peak
quantification method uses averaged segments of ERP data points in order to determine the
difference between the most positive peak and the most negative peak within a time interval
of interest. Although the peak-to-peak quantification enhances the effect sizes in line with the
salience hypothesis, the difference between two peaks as a P3 measure might incorporate
processes that do not exclusively represent characteristics of the P3 amplitude. The baseline-
to-peak quantification is less suitable in order to investigate P3 differences during deception
because this quantification method demonstrated comparably large heterogeneity of the
population effect sizes (Table 4) and the findings are not very robust. The peak-to-peak
quantification of the P3 amplitude results in reduced variability (cf., SD) and a higher
percentage of variance that is attributable to measurement errors (e.g., sample size,
unreliability of P3 measurement) compared to baseline-to-peak and mean P3 amplitude.
4.3. CTPs and counter-measure effects
The fact that the ratio of the population effect size and the standard deviation of the
population effect size (/SD) was smaller than 2 in counter-measure studies (Table 5)

META-ANALYSIS ON DECEPTION AND P3 AMPLITUDE 25
suggests that the application of physical and mental counter-measure techniques to
irrelevant/non-deceptive stimuli has an impact on the difference between probe/concealed-P3
amplitude and irrelevant/non-concealed P3-amplitude. When counter-measure techniques are
applied to irrelevant/non-concealed stimuli, the magnitude of the irrelevant/non-concealed P3
will be enhanced so that differences between probe/concealed P3 amplitude and
irrelevant/non-concealed P3 amplitude are less likely to be detected (see Ben-Shakhar, 2011
for counter-measure effects of other physiological parameters). Thus, in contrast to prior
assumptions that ERPs would be immune against counter-measure effects (Ben-Shakhar,
2002), the findings of our meta-analysis demonstrate that the P3 amplitude following
irrelevant/non-concealed P3 amplitudes can be modulated by counter-measure effects at least
in 3-stimulus protocols. Future research might investigate whether earlier ERPs like N1, P2,
or N2 amplitude are less likely to be affected by counter-measure techniques.
Due to a comparably small number of primary studies with counter-measure
techniques we could not investigate whether counter-measure effects generalize across
different types of deception tasks and whether physical and mental counter-measure
techniques affect the P3-magnitude differently across stimulus type (e.g., probe vs.
irrelevant). However, the ratio of the population effect size and the standard deviation of the
population effect size (/SD) for the CTP tasks demonstrates that the probe vs. irrelevant
difference between P3 amplitudes remains and supports the salience hypothesis. The P3
amplitude in CTPs without mock crimes appear to be immune against counter-measures
although participants were instructed to apply counter-measure techniques. That is why CTPs
should be preferred over 3-stimulus-protocols when it cannot be excluded that participants
perform counter-measure techniques.
4.4. Lessons learned from prior meta-analyses and from the present meta-analysis
Prior meta-analyses focused on the investigation of GKT/CITs (cf., Meijer et al., 2014). In
contrast, the present meta-analysis investigates the generalization of P3-findings across
different types of deception tasks in a legal context and in tasks activating social contexts.
Moreover, our meta-analysis compared population effect sizes of the barebones, the artefact-

META-ANALYSIS ON DECEPTION AND P3 AMPLITUDE 26
corrected meta-analysis, and transformations of d into Hedges g (Tables 2 to 5) and referred
to the investigation of a-priori moderators like study design (within-subjects vs. between-
subjects design), type of deception task, and quantification method of the P3 amplitude after
correcting for measurement errors. To study cognitive processes (e.g., recognition of salient
stimuli vs. mental effort) and to identify robust concealed/deceptive vs. non-concealed/non-
deceptive P3-effects within individuals the best practice would be to apply a within-subjects
design. A between-subjects design should be used to compare P3 variations of individual
cases and normative groups (e.g., culprits and innocents). Due to population effect size and
the ratio of /SD the P3 amplitude should be quantified by means of peak-to-peak technique
as suggested by Rosenfeld et al. (1991).
In comparison to Meijer et al. (2014, Tables 4a, 4b, and 5) who reported a larger effect size
of the corrected 𝑑𝑚∗ = 1.89, we found an artefact-corrected population effect size of 𝑑𝑚
∗ of
0.81 (Table 3). This difference in the population effect sizes can be explained by the fact that
Meijer et al. (2014) reported corrected population effect sizes for autobiographical CITs
including CTP studies and mock crime CITs also including CTPs. Our data show CTP
studies (even with counter-measures) do not reduce the difference between probe and
irrelevant P3 amplitudes (Table 5). Thus, Meijer et al. (2014) did not disentangle CITs with
and without CTPs. By reporting population effect sizes separately for CITs without counter-
measures, with counter-measures, and CTPs (Tables 3 and 5 in the present meta-analysis) we
extend the meta-analysis of Meijer et al. (2014). We demonstrate that the population effect
size for concealed vs. non-concealed information in CTP studies is larger than the population
effect size for 3-stimulus protocols. That is, the differentiation of concealed vs. non-
concealed information for the P3 amplitude is robust in CTP studies (Table 5), whereas
counter-measure techniques reduce the discriminability between concealed vs. non-concealed
information for the P3 amplitude (population effect size in CTP studies is more than twice as
large than in counter-measure studies: d = 1.40 vs. d = 0.55). This is important news
especially for single case analysis in practical fields (cf., Owaga, Matsuda, & Tsuneoka,
2015). In a nutshell, the prior meta-analyses and our meta-analysis provide a valuable

META-ANALYSIS ON DECEPTION AND P3 AMPLITUDE 27
conceptual and empirical framework on deception by means of different types of deception
tasks and physiological parameters such as electrodermal parameters (Ben-Shakhar & Elaad,
2003; Meijer et al., 2014), P3 parameters (Meijer et al., 2014 and the present meta-analysis),
behavioral parameters (Suchotzki et al., 2017), and fMRI data (Christ et al., 2009; Garrigan
et al., 2016).
4.4. Limitations and future directions
The present meta-analysis is based on studies of the P3 amplitude when participants are
instructed to deceive, to conceal information, or to lie. Although participants may deceive,
conceal information, or lie at the behavioral level, the P3 amplitude may also represent
processes that are to some degree independent from deception, concealing, or lying at the
behavioral level. As deception tasks might differ in the cognitive processes required to
perform the task (including encoding, switching, updating, storing, Oberauer et al., 2003;
Verschuere & Ben-Shakhar, 2011), future ERP-meta-analyses on deception could benefit
from moderator analyses that refer to further cognitive processes beyond recognition of
known/salient stimuli and mental effort. Moreover, moderators beyond those investigated
here could be conceived in future meta-analyses on deception (e.g., differentiation of number
of stimuli per picture type and number of iterations per picture type, cross-classification of
task conditions, relevance of instructions). Future research needs to further our knowledge on
additional P3-related cognitive processes like suppression and memory retrieval based on
physiological and behavioral data in deception tasks (cf. Vendemia, 2014).
As too few studies investigated individual differences and sex differences during deception
(Leue & Beauducel, 2015; Leue et al., 2012), we did not investigate individual differences as
moderators in the present meta-analysis. Leue et al. (2012) as well as Leue and Beauducel
(2015) demonstrated that trait-anxiety modulates P3-related processes during deception.
Moreover, they reported that injustice sensitivity, a trait dimension that describes individual
differences of sensitivity for injustice from different perspectives (perpetrator, victim,
beneficiary, Schmitt, Baumert, Gollwitzer, & Maes, 2010) also modulates P3-related

META-ANALYSIS ON DECEPTION AND P3 AMPLITUDE 28
processes during deception. Individuals with a higher vs. lower sensitivity to injustice and
women compared to men showed more positive probe P3 amplitudes than irrelevant P3
amplitudes. Thus, future research should more intensely study the relation between trait-like
individual differences and deception, the differentiation of cognitive and memory processes
(Bergström et al., 2013; Hu et al., 2015; Meixner & Rosenfeld, 2014), the relevance of
financial incentives (Rosenfeld, Labkovsky, Davydova, Ward, & Rosenfeld, 2017;
Rosenfeld, Sitar, Wasserman, & Ward (2018), and individual vs. collaborative crimes (Lu et
al., 2018).
To avoid non-reporting of statistical values we encourage an adaptation of the publication
practice increasing the opportunity that even non-significant findings get a higher chance to
be published. From a methodological perspective, it is of interest to compare different
descriptive and quantitative techniques (e.g., trim and fill, funnel plot, fail-safe number, p-
curve analysis) to control for publication bias (Duval & Tweedie, 2000; Heene, 2010; Orwin,
1983; Simonsohn, Simmons, & Nelson, 2015). To correct measurement errors of the P3
amplitude more closely in conjunction with the P3 quantification method, future studies
should take reliability of difference scores into account when peak-to-peak P3 quantification
is applied (e.g., Overall & Woodward, 1975).
5. Conclusion
The present artefact-corrected meta-analysis (k = 77 primary studies) investigated P3-related
deception with regard to the salience hypothesis and the mental effort hypothesis. Our
findings demonstrate that deception tasks with a legal context result in larger population
effect sizes especially when combined with a committed mock crime as pre-task scenario
compared to other deception tasks. The salience hypothesis (larger concealed vs. non-
concealed P3) was mainly confirmed in studies with a within-subjects design and
demonstrates effects of stimulus familiarity versus dual task effects (storing knowledge and
concealing knowledge) during deception. The mental effort hypothesis (smaller concealed
vs. non-concealed P3) represents dual task effects during deception especially in primary

META-ANALYSIS ON DECEPTION AND P3 AMPLITUDE 29
tasks with instructed lying. Our findings also demonstrate that peak-to-peak P3 quantification
leads to larger effect sizes than other quantification methods (mean P3, baseline-to-peak P3).
The P3 amplitude can be modulated by mental and physical counter-measure techniques if no
CTP is applied. Deception tasks with a between-subjects design result in smaller population
effect sizes than deception tasks with a within-subjects design. Whereas the within-subjects
design helps to elucidate cognitive processes during deception, the between-subjects design
is important for the differentiation of individuals or subgroups who conceal knowledge or
who do not. Finally, the present meta-analysis reveals that it could be promising to measure
the difference between concealed knowledge and truthful knowledge by means of the P3
amplitude even in social settings. Future research should further elucidate the modulating
role of individual differences and further contextual and task-specific factors during
deception and the experimental conditions for familiarity and dual task effects during
deception.

META-ANALYSIS ON DECEPTION AND P3 AMPLITUDE 30
Acknowledgement
We are grateful to Katharina Bodenheim, Franziska Clemens, and Nils Lennart Lang-Keller
for their assistance during literature search and coding of study characteristics.
Conflict of interest statement
The authors declare that they have no conflict of interest.
META-ANALYSIS ON DECEPTION AND P3 AMPLITUDE 31
References
* references with an asterisk have been included in the present meta-analysis.
Abe, N., Fujii, T., Ito, A., Ueno, A., Koseki, Y., Hashimoto, R., Hayashi, A., Mugikura, S.,
Takahashi, S., & Mori, E. (2014). The neural basis of dishonest decisions that serve to harm
or help the target. Brain and Cognition, 90, 41-49. doi:
http://dx.doi.org/10.1016/j.bandc.2014.06.005
*Abootalebi, V., Moradi, M. H., & Khalilzadeh, M. A. (2006). A comparison of methods for
ERP assessment in a P300-based GKT. International Journal of Psychophysiology, 62, 309-
320. doi.org/10.1016/j.ijpsycho.2006.05.009
*Abootalebi, V., Moradi, M. H., & Khalilzadeh, M. A. (2009). A new approach for EEG
feature extraction in P300-based lie detection. Computer methods and programs in
biomedicine, 94, 48-57. doi: 10.1016/j.cmpb.2008.10.001
*Allen, J. J., Iacono, W. G., & Danielson, K. D. (1992). The identification of concealed
memories using the event-related potential and implicit behavioral measures: A methodology
for prediction in the face of individual differences. Psychophysiology, 29, 504-522.
*Ambach, W., Bursch, S., Stark, R., & Vaitl, D. (2010). A Concealed Information Test with
multimodal measurement. International Journal of Psychophysiology, 75, 258-267.
doi:10.1016/j.ijpsycho.2009.12.007
Amodio, D. M., Bartholow, B. D., & Ito, T. A. (2014). Tracking the dynamics of the social
brain: ERP approaches for social cognitive and affective neuroscience. Social, Cognitive and
Affective Neuroscience, 9, 385-393. doi:10.1093/scan/nst177

META-ANALYSIS ON DECEPTION AND P3 AMPLITUDE 32
Beauducel, A., Brocke, B., & Leue, A. (2006). Energetical bases of extraversion: Effort,
arousal, EEG, and performance. International Journal of Psychophysiology, 62, 212-223.
doi: 10.1016/j.ijpsycho.2005.12.001
Ben-Shakhar, G. (2002). A critical review of the control question test. In M. Kleiner (Ed.),
Handbook of polygraph testing. San Diego: Academic Press.
Ben-Shakhar, G. (2011). Countermeasures. In B. Verschuere, G. Ben-Shakhar, and E. H.
Meijer (Eds.), Memory detection (pp. 200-214). Cambridge: University Press.
Ben-Shakhar, G., & Elaad, E. (2003). The validity of psychophysiological detection of
information with the guilty knowledge test: A meta-analytic review. Journal of Applied
Psychology, 88, 133-151. doi: 10.1037/0021-9010.88.1.131
Bergström, Z. M., Anderson, M. C., Buda, M., Simons, J. S., & Richardson-Klavehn, A.
(2013). Biological Psychology, 94, 1-11. doi:
http://dx.doi.org/10.1016/j.biopsycho.2013.04.012
Boudewyn, M. A., Luck, S. J., Farrens, J. L., & Kappenman, E. S. (2018). How many trials
does it take to get a significant ERP effect? It depends. Psychophysiology, 55, 1-16. doi:
https://doi.org/10.1111/psyp.13049
*Boudreau, C., McCubbins, M. D., & Coulson, S. (2009). Knowing when to trust others: An
ERP study of decision making after receiving information from unknown people.
Social Cognition and Neuroscience, 4, 23-34. doi: 10.1093/scan/nsn034
Bond, J., C.F., & DePaulo, B. M. (2006). Accuracy of deception judgements. Personality and
Social Psychology Review, 10, 214-234. doi: 10.1207/s15327957pspr1003_2

META-ANALYSIS ON DECEPTION AND P3 AMPLITUDE 33
Borenstein, M., Hedges, L. V., Higgins, J. P. T., & Rothstein, H. R. (2009). Introduction to
meta-analysis. Croydon: Wiley.
*Bowman, H., Filetti, M., Janssen, D., Su, L., Alsufyani, A., & Wyble, B. (2013). Subliminal
salience search illustrated: EEG identity and deception detection on the fringe of awareness.
PLOS one, 8, e54258. doi: 10.1371/journal.pone.0054258
Caccioppo, J. T. & Decety, J. (2011). Challenges and opportunities in social neuroscience.
Annals of the New York Academy of Sciences, 1224, 162–173. doi:10.1111/j.1749-
6632.2010.05858.x
Christ, S. E., Van Essen, D. C., Watson, J. M., Brubaker, L. E., & McDermott, K. B. (2009).
The contributions of prefrontal cortex and executive control to deception: Evidence from
activation likelihood estimate meta-analyses. Cerebral Cortex, 19, 1557-1566.
doi: 10.1093/cercor/bhn189
Cohen, J. (1966). Statistical power analysis for the behavioral sciences. Hillsdale, NJ:
Erlbaum.
Cohen, J., & Polich, J. (1997). On the number of trials needed for P300. International
Journal of Psychophysiology, 25, 249-255. doi: 10.1016/S0167-8760(96)00743-X
*Crites, S. L., Cacioppo, J. T., Gardner, W. L., & Berntson, G. G. (1995). Bioelectrical
echoes from evaluative categorization: II. A late positive brain potential that varies as a
function of attitude registration rather than attitude report. Journal of Personality and Social
Psychology, 68, 997-1013.
META-ANALYSIS ON DECEPTION AND P3 AMPLITUDE 34
*Crites, S. L., Mojica, A. J., Corral, G., & Taylor, J. H. (2010). An event-related potential
paradigm for identifying (rare negative) attitude stimuli that people intentionally misreport.
Psychophysiology, 47, 984-988. doi: 10.1111/j.1469-8986.2010.01002.x
Cuthbert, B. N., Schupp, H. T., McManis, M., Hilman, C., Bradley, M. M., & Lang, P.J.
(1995). Cortical slow waves: emotional perception and processing. Psychophysiology, 32,
S26.
*Cutmore, T. R. H., Djakovic, T., Kebbell, M. R., & Shum, D. H. K. (2009). An object cue is
more effective than a word in ERP-based detection of deception. International Journal of
Psychophysiology, 71, 185-192. doi: 10.1016/j.ijpsycho.2008.08.003
Donchin, E. (1981). Surprise! . . . Surprise?. Psychophysiology, 18, 493-513. doi:
10.1111/j.1469-8986.1981.tb01815.x
*Dong, G., Wu, H., & Lu, Q. (2010). Attempting to hide our real thoughts:
Electrophysiological evidence from truthful and deceptive responses during evaluation.
Neuroscience Letters, 479, 1-5. doi: 10.1016/j.neulet.2010.05.014
Duval, S., & Tweedie, R. (2000). Trim and Fill: A Simple Funnel-Plot-Based Method of
Testing and Adjusting for Publication Bias in Meta-Analysis. Biometrics, 56, 455-463.
Fabiani, M., Gratton, G., Karis, D., & Donchin, E. (1987). The definition, identification, and
reliability measurement of the P300 component of the event-related brain potential. Advances
in Psychophysiology, 2, 1-78.
*Farwell, L. A., & Donchin, E. (1991). The truth will out: Interrogative Polygraphy ("Lie
detection") with event-related brain potentials. Psychophysiology, 28, 531-547. doi:
10.1111/j.1469-8986.1991.tb01990.x

META-ANALYSIS ON DECEPTION AND P3 AMPLITUDE 35
Ferguson, C. J., & Heene, M. (2012). A vast graveyard of undead theories: Publication bias
and psychological science’s aversion to the null. Association for Psychological Science, 7,
555-561. doi: 10.1177/1745691612459059
Furedy, J. J., & Ben-Shakhar, G. (1991). The roles of deception, intention to deceive, and
motivation to avoid detection in the psychophysiological detection of guilty knowledge.
Psychophysiology, 28, 163-171.
*Gamer, M., & Berti, S. (2010). Task relevance and recognition of concealed information
have different influences on electrodermal activity and event-related brain potentials.
Psychophysiology, 47, 355-364. doi: 10.1111/j.1469-8986.2009.00933.x
*Gamer, M., & Berti, S. (2012). P300 amplitudes in the concealed information test are less
affected by depth of processing than electrodermal responses. Frontiers in Human
Neuroscience, 6, 308. doi: 10.3389/fnhum.2012.00308
Ganis, G. & Keenan, J. P. (2009). The cognitive neuroscience of deception. Social
Neuroscience, 4, 465-472. doi: 10.1080/17470910802507660
Garrigan, B., Adlam, A.L.R., & Langdon, P.E. (2016). The neural correlates of moral
decision-making: A systematic review and meta-analysis of moral evaluations and response
decision judgements. Brain and Cognition, 108, 88-97. doi:
http://dx.doi.org/10.1016/j.bandc.2016.07.007
Gibbons, H., Schnürch, R., Wittinghofer, C., Armbrecht, S., & Stahl, J. (2018). Detection of
deception: Event-related potential markers of attention and cognitive control during
intentional false responses. Psychophysiology. 55, e13047. doi: 10.1111/psyp.1304
META-ANALYSIS ON DECEPTION AND P3 AMPLITUDE 36
*Hahm, J., Ki, H., Jeong, J. Y., Oh, D. H., Kim, S. H., Sim, K.-B., & Lee, J.-H. (2009).
Detection of concealed information: Combining a virtual mock crime with a P300based
guilty knowledge test. Cyberpsychology & Behavior, 12, 269-275. doi:
10.1089/cpb.2008.0309
Hedges, L. V. (1983). A random effects model for effect sizes. Psychological Bulletin, 93,
388-395.
Heene, M. (2010). A brief history of the fail-safe number in applied research. ArXiv,
arXiv:1010.2326.
Hu, X., Bergström, Z. M., Bodenhausen, G., & Rosenfeld, J. P. (2015). Suppressing
unwanted autobiographical memories reduces their automatic influences: Evidence from
electrophysiology and an implicit autobiographical memory test. Psychological Science, 26,
1098-1106. doi: 10.1177/0956797615575734
*Hu, X., Hegemann, D., Landry, E., & Rosenfeld, J. P. (2012). Increasing the number of
irrelevant stimuli increases ability to detect countermeasures to the P300-based Complex
Trial Protocol for concealed information detection. Psychophysiology, 49,
85-95. doi: 10.1111/j.1469-8986.2011.01286.x
*Hu, X., Pornpattananangkul, N., & Rosenfeld, J. P. (2013). N200 and P300 as orthogonal
and integrable indicators of distinct awareness and recognition processes in memory
detection. Psychophysiology, 50, 454-464. doi: 10.1111/psyp.12018
*Hu, X., & Rosenfeld, J. P. (2012). Combining the P300-complex trial-based Concealed
Information Test and the reaction time-based autobiographical Implicit Association Test in
concealed memory detection. Psychophysiology, 49, 1090-1100. doi:
10.1111/j.1469-8986.2012.01389.x

META-ANALYSIS ON DECEPTION AND P3 AMPLITUDE 37
*Hu, X., Wu, H., & Fu, G. (2011). Temporal course of executive control when lying about
self- and other-referential information: An ERP study. Brain Research, 1369, 149-157. doi:
10.1016/j.brainres.2010.10.106
Huffmeijer, R., Bakermans-Kranenburg, M. J., Alink, L. R. A., & van IJzendoorn, M. H.
(2014). Reliability of event-related potentials: The influence of number of trials and
electrodes. Physiology & Behavior, 130, 13-22. doi: 10.1016/j.physbeh.2014.03.008
Hunter, J. E., & Schmidt, F. L. (2000). Fixed effects and random effects meta-analysis
models: Implications for cumulative knowledge in psychology. International Journal of
Selection and Assessment, 8, 275-292. doi: 10.1111/1468-2389.00156
Hunter, J. E., & Schmidt, F. L. (2004). Methods of meta-analysis. London: Sage.
Johnson Jr., R. (1986). A triarchic model of P300 amplitude. Psychophysiology, 23, 367–384.
Johnson Jr., R. (1993). On the neural generators of the P300 component of the event related
potential. Psychophysiology 30, 90-97.
*Johnson Jr., R., Banhardt, J., and Zhu, J. (2003). The deceptive response: effects of response
conflict and strategic monitoring on the late positive component and episodic memory-related
brain activity. Biological Psychology, 64, 217-253. doi: 10.1016/j.biopsycho.2003.07.006
*Johnson Jr., R., Banhardt, J., & Zhu, J. (2005). Differential effects of practice on the
executive processes used for truthful and deceptive responses: An event-related brain
potential study. Cognitive Brain Research, 24, 386-404. doi:
10.1016/j.cogbrainres.2005.02.011

META-ANALYSIS ON DECEPTION AND P3 AMPLITUDE 38
Johnson, R. E. Jr., & Donchin, E. (1978). On how P300 amplitude varies with the utility of
the eliciting stimuli. Electroencephalography & Clinical Neurophysiology, 44, 424-437.
doi.org/10.1016/0013-4694(78)90027-5
*Johnson, M. M., & Rosenfeld, J. P. (1992). Oddball-evoked P300-based method of
deception detection in the laboratory II: Utilization of non-selective activation of relevant
knowledge. International Journal of Psychophysiology, 12, 289-306.
*Jung, E. K., Kang, K.-Y., & Kim, Y. Y. (2013). Frontoparietal activity during deceptive
responses in the P300-based guilty knowledge 2 test: An sLORETA study.
Neuroimage, 28, 27-38. doi: 10.1016/j.nicl.2013.06.013.
Klein Selle, N., Verschuere, B., Kindt, M., Meijer, E., & Ben-Shakhar, G. (2016). Orienting
versus inhibition in the Concealed Information Test. Different cognitive processes drive
different physiological measures. Psychophysiology, 53, 579-590. doi: 10.1111/psyp.12583
Klein Selle, N., Verschuere, B., Kindt, M., Meijer, E., & Ben-Shakhar, G. (2017). Unraveling
the roles of orienting and inhibition in the Concealed Information Test. Psychophysiology,
54, 628-639. doi: 10.1111/psyp.12825
Kok, A. (2001). On the utility of P3 amplitude as a measure of processing capacity.
Psychophysiology, 38, 557-577. doi: 10.1017/S0048577201990559
*Kubo, K., & Nittono, H. (2009). The role of intention to conceal in the P300-based
concealed information test. Applied Psychophysiology and Biofeedback, 34, 227-235. doi:
10.1007/s10484-009-9089-y
*Labkovsky, E., & Rosenfeld, J. P. (2012). The P300-based, complex trial protocol for
concealed information detection resists any number of sequential countermeasures against up

META-ANALYSIS ON DECEPTION AND P3 AMPLITUDE 39
to five irrelevant stimuli. Applied Psychophysiology and Biofeedback, 37, 1-10. doi:
10.1007/s10484-011-9171-0
*Labkovsky, E., & Rosenfeld, J. P. (2014). A novel Dual Probe Complex Trial protocol for
detection of concealed information. Psychophysiology, 51, 1122-1130. doi:
10.1111/psyp.12258
Le, M. T. (2016). Language of low-stakes and high-stakes deception: Differences within
individuals. The University of British Columbia.
*Lefebvre, C. D., Marchand, Y., Smith, S. M., & Connolly, J. F. (2009). Use of event-related
brain potentials (ERPs) to assess eyewitness accuracy and deception. International Journal of
Psychophysiology, 73, 218-225. doi: 10.1016/j.ijpsycho.2009.03.003
*Leue, A., & Beauducel, A. (2015). Effects of injustice sensitivity and sex on the P3
amplitude during deception. Biological Psychology, 109, 29-36. doi:
10.1016/j.biopsycho.2015.04.004
Leue, A., Klein, C., Lange, S., & Beauducel, A. (2013). Inter-individual and intra-individual
variability of the N2 component: On reliability and signal-to-noise ratio. Brain and
Cognition, 83, 61-71. doi: 10.1016/j.bandc.2013.06.009
*Leue, A., Lange, S., & Beauducel, A. (2012). "Have you ever seen this face?" - Individual
differences of deception and event-related potentials. Frontiers in Psychology, 3, 570. doi:
10.3389/fpsyg.2012.00570
Lu, Y., Deng, X., Zhang, E., Zheng, H., Ouyang, D., Rosenfeld, J, P., Gejun, Y., & Hayat, S.
Z. (2018). Inferior detection of information from collaborative versus individual crimes based
on a P300 concealed information test. Psychophysiology.

META-ANALYSIS ON DECEPTION AND P3 AMPLITUDE 40
Luck, S. J. (2014). An introduction to the event-related potential technique. 2nd edition.
Cambridge: MIT Press.
*Lui, M., & Rosenfeld, J. P. (2008). Detection of deception about multiple, concealed, mock
crime items, based on a spatial-temporal analysis of ERP amplitude and scalp distribution.
Psychophysiology, 45, 721-730. doi: 10.1111/j.1469-8986.2008.00683.x
Lykken, D. T. (1959). The GSR in the detection of guilt. Journal of Applied Psychology, 43,
385-388. doi: 10.1037/h0046060
Lykken, D. T. (1974). Psychology and lie detector industry. American Psychologist, 29, 725-
739. doi: 10.1037/h0037441
Marco-Pallares, J., Cucurell, D., Münte, T. F., Strien, N., & Rodriguez-Fornells, A. (2011).
On the number of trials needed for a stable feedback-related negativity.
Psychophysiology, 48, 852-860. doi: 10.1111/j.1469-8986.2010.01152.x
*Matsuda, I., Nittono, H., & Allen, J. J. (2013). Detection of concealed information by P3
and frontal EEG asymmetry. Neuroscience Letters, 537, 55-59. doi:
10.1016/j.neulet.2013.01.029
*Meek, S. W., Phillips, M. C., Bowswell, C. P., & Vendemia, J. M. C. (2013). Deception and
the misinformation effect: An event-related potential study. International Journal of
Psychophysiology, 87, 81-87. doi: 10.1016/j.ijpsycho.2012.11.004
*Meijer, E. H. (2008). Psychophysiology and the detection of deception: Promises and perils.
University of Maastricht, Netherlands.

META-ANALYSIS ON DECEPTION AND P3 AMPLITUDE 41
*Meijer, E. H., Klein Selle, N., Elber, L., & Ben-Shakhar, G. (2014). Memory detection with
the Concealed Information Test: A meta-analysis of skin conductance, respiration, heart rate,
and P300 data. Psychophysiology, 51, 879-904. doi: 10.1111/psyp.12239
*Meijer, E. H., Smulders, F. T. Y., Merckelbach, H. L. G. J., & Wolf, A. G. (2007). The
P300 is sensitive to concealed face recognition. International Journal of Psychophysiology,
66, 231-237. doi: 10.1016/j.ijpsycho.2007.08.001
*Meijer, E. H., Smulders, F. T. Y., & Wolf, A. (2009). The contribution of mere recognition
to the P300 effect in a concealed information test. Applied Psychophysiology Biofeedback,
34, 221-226. doi: 10.1007/s10484-009-9099-9
*Meijer, E. H., Verschuere, B., Gamer, M., Merckelbach, H., & Ben-Shakhar, G. (2016).
Deception detection with behavioral, autonomic, and neural measures: Conceptual and
methodological considerations that warrant modesty. Psychophysiology, 53, 593-604. doi:
10.1111/psyp.12609
*Meixner, J. B., Haynes, A., Winograd, M. R., Brown, J., & Rosenfeld, J. P. (2009).
Assigned versus random, countermeasure-like responses in the P300 based complex trial
protocol for detection of deception: Task demand effects. Applied Psychophysiology and
Biofeedback, 34, 209-220. doi: 10.1007/s10484-009-9091-4
*Meixner, J. B., & Rosenfeld, J. P. (2010). Countermeasure mechanisms in a P300-based
concealed information test. Psychophysiology, 47, 57-65. doi:
10.1111/j.14698986.2009.00883.x
*Meixner, J. B., & Rosenfeld, J. P. (2011). A mock terrorism application of the P300-based
concealed information test. Psychophysiology, 48, 149-154. doi:
10.1111/j.14698986.2010.01050.x

META-ANALYSIS ON DECEPTION AND P3 AMPLITUDE 42
Meixner, J. B., & Rosenfeld, J. P. (2014). Detecting knowledge of incidentally acquired real-
world memories using a P300-based concealed-information test. Psychological Science, 25,
1-12. doi: 10.1177/0956797614547278
*Mertens, R., & Allen, J. J. (2008). The role of psychophysiology in forensic assessments:
Deception detection, ERPs, and virtual reality mock crime scenarios.
Psychophysiology, 45, 286-298.
*Merzagora, A. C., Bunce, S., Izzetoglu, M., & Onaral, B. (2006). Wavelet analysis for EEG
feature extraction in deception detection. Proceedings of the 28th IEEE EMBS Annual
International Conference, 2434-2437.
*Merzagora, A. C., Izzetoglu, M., Bunce, S., & Onaral, B. (2007). Time-domain analysis of
EEG during guilty knowledge test: Investigation of epoch extraction criteria. IEEE.
Moher, D., Liberati, A., Tetzlaff, J., & Altman, D. G., The PRISMA Group (2009). Preferred
Reporting Items for Systematic Reviews and Meta-analyses: The PRISMA Statement. PLoS
Med 6(7): e1000097.
Moran, T. P., Schroder, H.S., Kneip, C., & Moser, J. S. (2017). Meta-analysis and
psychophysiology: A tutorial using depression and action-monitoring event-related
potentials. International Journal of Psychophysiology, 111, 17–32.
Nunnally, J. C., & Bernstein, I. H. (1994). Psychometric theory. New York: McGraw-Hill.
Oberauer, K., Süß, H.-M., Wilhelm, O., & Wittmann, W. W. (2003). The multiple faces of
working memory: Storage, processing, supervision, and coordination. Intelligence, 31, 167-
193.

META-ANALYSIS ON DECEPTION AND P3 AMPLITUDE 43
Olofsson, J. K., & Polich, J. (2007). Affective visual event-related potentials: Arousal,
repetition, and time-on-task. Biological Psychology, 75, 101-108. doi:
10.1016/j.biopsycho.2006.12.006
Orwin, R. G. (1983). A fail-safe N for effect size in meta-analysis. Journal of Educational
Statistics, 8, 157-159. doi: 10.2307/1164923
O'Sullivan, M. (2008). Home Runs and Humbugs: Comment on Bond and DePaulo (2008).
Psychological Bulletin, 134, 493–497. doi: 10.1037/0033-2909.134.4.493
Overall, J. E., & Woodward, J. A. (1975). Unreliability of difference scores: A paradox for
measurement of change. Psychological Bulletin, 82, 85-86.
Owaga, T., Matsuda, I., & Tsuneoka, M. (2015). The concealed information test in the
laboratory versus Japanese field practice: Bridging the Scientist Practitioner Gap.
Archives of Forensic Psychology, 1, 16-27.
*Panasiti, M. S., Pavone, E. F., Mancini, A., Merla, A., Grisoni, L., & Aglioti, S. M. (2014).
The motor cost of telling lies: Electrocortical signatures and personality foundations of
spontaneous deception. Social Neuroscience, 9, 573-589. doi:
10.1080/17470919.2014.934394
Peth, J., Suchotzki, K., & Gamer, M. (2016). Influence of countermeasures on the validity of
the Concealed Information Test. Psychophysiology, 53, 1429-1440. doi:
10.1111/psyp.12690
*Pfister, R., Foerster, A., & Kunde, W. (2014). Pants on fire: The electrophysiological
signature of telling a lie. Social Neuroscience, 9, 562–572. doi:

META-ANALYSIS ON DECEPTION AND P3 AMPLITUDE 44
10.1080/17470919.2014.934392
Polich, J. (2007). Updating P300: An integrative theory of P3a and P3b. Clinical
Neurophysiology, 118, 2128-2148. doi: 10.1016/j.clinph.2007.04.019
Pollock, V. E., & Schneider, L. S. (1992). Reliability of late Positive component activity (P3)
in healthy elderly adults. Journal of Gerontology: Medical Sciences, 47, M88-92. doi:
10.1093/geronj/47.3.M88
Porter, S., & ten Brinke, L. (2010). The truth about lies: What works in detecting high-stakes
deception? Legal and Criminological Psychology, 15, 57-75. doi:
10.1348/135532509X433151
Rengifo, R. (2011). The Cognitive Neuroscience of Deception: Advances in Neuroscience,
Criminal Law Applications and Ethics. Neurogenesis, 1, 2-6.
Rietdijk, W. J. R., Franken, I. H. A., & Thurik, A. R. (2014). Internal consistency of event-
related potentials associated with cognitive control: N2/P3 and ERN/Pe. Plos One, 9,
e102672. doi: 10.1371/journal.pone.0102672
Rosenfeld, J.P. (2018). Detecting concealed information and deception: Recent
developments. Elsevier: Northwestern University.
Rosenfeld, J. P., Labkovsky, E., Davydova, E., Ward, A., & Rosenfeld, L. (2017). Financial
incentive does not affect P300 (in response to certain episodic and semantic probe stimuli) in
the Complex Trial Protocol (CTP) version of the Concealed Information Test (CIT) in
detection of malingering. Psychophysiology, 54, 764-772. doi: 10.1111/psyp.12835

META-ANALYSIS ON DECEPTION AND P3 AMPLITUDE 45
Rosenfeld, J. P., Sitar, E., Wasserman, J., & Ward, A. (2018). Moderate financial incentive
does not appear to influence the P300 Concealed Information Test (CIT) effect in the
Complex Trial Protocol (CTP) version of the CIT in a forensic scenario, while affecting P300
peak latencies and behavior. International Journal of Psychophysiology, 125, 42-49. doi:
10.1016/j.ijpsycho.2018.02.006
*Rosenfeld, J. P., Angell, A., Johnson, M. M., & Qian, J.-H. (1991). An ERP-Based, control
question lie detector analog: Algorithms for discriminating effects within individuals' average
waveforms. Psychophysiology, 28, 319-335. doi: 10.1111/j.14698986.1991.tb02202.x
*Rosenfeld, J. P., Cantwell, B., Nasman, V. T., Wojdac, V., Ivanaov, S., & Mazzeri, L.
(1988). A modified event-related potential-based guilty knowledge test. International
Journal of Neuroscience, 42, 157-161. doi: 10.3109/00207458808985770
*Rosenfeld, J. P., Ellwanger, J. W., Nolana, K., Wu, S., Bermanna, R. G., & Sweet, J.
(1999). P300 scalp amplitude distribution as an index of deception in a simulated cognitive
deficit model. International Journal of Psychophysiology, 33, 3-19. doi: 10.1016/S0167-
8760(99)00021-5
*Rosenfeld, J. P., Hu, X., & Pedersen, K. (2012). Deception awareness improves P300-based
deception detection in concealed information tests. International Journal of
Psychophysiology, 86, 114-121. doi: 10.1016/j.ijpsycho.2012.06.007
*Rosenfeld, J. P., Labkovsky, E., Winograd, M. R., Lui, M. A., Vandenboom, C., & Chedid,
E. (2008). The Complex Trial Protocol (CTP): A new, countermeasure-resistant, accurate,
P300-based method for detection of concealed information. Psychophysiology, 45, 906-919.
doi: 10.1111/j.1469-8986.2008.00708.x

META-ANALYSIS ON DECEPTION AND P3 AMPLITUDE 46
*Rosenfeld, P. J., Nasman, V. T., Whalen, R., Cantwell, B., & Mazzeri, L. (1987). Late
vertex positivity in event-related potentials as a guilty knowledge indicator: A new method of
lie detection. International Journal of Neuroscience, 34, 125-129. doi:
10.3109/00207458708985947
*Rosenfeld, J. P., Reinhart, A. M., Bhatt, M., Ellwanger, J., Gora, K., Sekera, M., & Sweet, J.
(1998). P300 correlates of simulated malingered amnesia in a matching-to-sample task:
topographic analyses of deception versus truth-telling responses. International Journal of
Psychophysiology, 28, 233-247.
*Rosenfeld, J. P., Shue, E., & Singer, E. (2007). Single versus multiple probe blocks of
P300based concealed information tests for self-referring versus incidentally obtained
information. Biological Psychology, 74, 396-404. doi: 10.1016/j.biopsycho.2006.10.002
*Rosenfeld, J. P., Soskins, M., Bosh, G., & Ryan, A. (2004). Simple, effective
countermeasures to P300-based tests of detection of concealed information.
Psychophysiology, 41, 205-219. doi: 10.1111/j.1469-8986.2004.00158.x
*Rosenfeld, J. P., Tang, M., Meixner, J. B., Winograd, M. R., & Labkovsky, E. (2009). The
effects of asymmetric vs. symmetric probability of targets following probe and irrelevant
stimuli in the complex trial protocol for detection of concealed information with P300.
Physiology & Behavior, 98, 10-16. doi: 10.1016/j.physbeh.2009.03.030
Rosenthal, R. (1979). The “file-drawer problem” and tolerance for null results. Psychological
Bulletin, 86, 638-641. doi: 10.1037/0033-2909.86.3.638
Rosenthal, R., & DiMatteo, M. R. (2001). Meta-Analysis: Recent developments in
quantitative methods for literature reviews. Annual Review of Psychology, 52, 59-82.
doi: 10.1146/annurev.psych.52.1.59

META-ANALYSIS ON DECEPTION AND P3 AMPLITUDE 47
Sai, L., Lin, X., Hu, X., & Fu, G. (2014). Detecting concealed information using feedback
related event-related potentials. Brain and Cognition, 90, 142-150. doi:
https://doi.org/10.1016/j.bandc.2014.06.012
Sai, L., Lin, X., Rosenfeld, J. P., Sang, B., Hu, X., & Fu, G. (2016). Novel, ERP-based,
concealed information detection: Combining recognition-based and feedback-
evoked ERPs. Biological Psychology, 114, 13-22. doi:
http://dx.doi.org/10.1016/j.biopsycho.2015.11.011
Schacter, D. L., Addis, D. R., Hassabis, D., Martin, V. C., Spreng, N., & Szpunar, K. K.
(2007). The cognitive neuroscience of constructive memory: Remembering the past and
imagining the future. Philosophical Transactions of the Royal Society B, 362, 773-786. doi:
10.1098/rstb.2007.2087
*Schindler, S., Wolff, W., Kissler, J. M., & Brand, R. (2015). Cerebral correlates of faking:
evidence from a brief implicit association test on doping attitudes. Frontiers in Behavioral
Neuroscience, 9, 139. doi.org/10.3389/fnbeh.2015.00139
Schmidt, F. L., & Hunter, J. E. (2014). Methods of Meta-Analysis: Correcting error and bias
in research findings London: Sage.
Schmidt, F. L., & Le, H. (2004, 2014). Software for the Hunter-Schmidt meta-analysis
methods. Iowa City, IA: University of Iowa, Department of Management & Organization.
Schmitt, M., Baumert, A., Gollwitzer, M., & Maes, J. (2010). The Justice Sensitivity
Inventory: Factorial validity, location in the personality facet space, demographic pattern, and
normative data. Social Justice Research, 23, 211-238. doi:
10.1007/s11211-010-0115-2

META-ANALYSIS ON DECEPTION AND P3 AMPLITUDE 48
Simonsohn, U., Simmons, J. P., & Nelson, L. D. (2015). Better P-Curves: Making P-Curve
analysis more robust to errors, fraud, and ambitious P-Hacking, A Reply To Ulrich and
Miller (2015). Journal of Experimental Psychology: General, 144, 1146–1152. doi:
http://dx.doi.org/10.1037/xge0000104
*Sokolovsky, A., Rothenberg, J., Labkovsky, E., Meixner, J. B., & Rosenfeld, J. P. (2011). A
novel countermeasure against the reaction time index of countermeasure use in the P300-
based complex trial protocol for detection of concealed information.
International Journal of Psychophysiology, 81, 60-63. doi:
10.1016/j.ijpsycho.2011.03.008
Soskins, M., Rosenfeld, J. P., & Niendam, T. (2001). Peak-to-peak measurement of P300
recorded at 0.3 Hz high pass filter settings in intra-individual diagnosis: complex vs. simple
paradigms. International Journal of Psychophysiology, 40, 173-180.
Spapé, M. M., Hoggan, E. E., Jaccucci, G., & Ravaja, N. (2015). The meaning of the virtual
midas touch: An ERP study in economic decision making. Psychophysiology, 52, 378–387.
doi: 10.1111/psyp.12361
*Suchotzki, K., Crombez, G., Smulders, F. T. Y., Meijer, E. H., & Verschuere, B. (2015).
The cognitive mechanisms underlying deception: An event-related potential study.
International Journal of Psychophysiology, 95, 395-405. doi:
10.1016/j.ijpsycho.2015.01.010
Suchotzki, K., Verschuere, B., Van Bockstaele, B., Ben-Shakhar, G., & Crombez, G. (2017).
Lying Takes Time: A meta-analysis on reaction time measures of deception. Psychological
Bulletin, 143, 428-453. doi: 10.1037/bul0000087.

META-ANALYSIS ON DECEPTION AND P3 AMPLITUDE 49
Turner, H. M., & Bernard, R. M. (2006). Calculating and synthesizing effect sizes.
Contemporary issues in communication science and disorders, 33, 42-55.
*van Hoff, J. C., Sargeant, E., Foster, J. K., & Schmand, B. A. (2009). Identifying deliberate
attempts to fake memory impairment through the combined use of reaction time and event-
related potential measures. International Journal of Psychophysiology, 73, 246-256. doi:
10.1016/j.ijpsycho.2009.04.002
Vendemia, J. M. C. (2014). fMRI as a method of detection of deception. A review of
experiences. European Polygraph, 8, 5-21. doi: 10.2478/ep-2014-0001
Verschuere, B., & Ben-Shakhar, G. (2011). Theory of the concealed information test. In B.
Verschuere, G. Ben-Shakhar and E. Meijer (Eds.), Memory detection (pp. 128-148).
Cambridge: University Press.
Vrij, A. (2015). Verbal lie detection tools: Statement validity analysis, reality monitoring and
scientific content analysis. In P. A. Granhag, A. Vrij, and B. Verschuere (Eds.), Detecting
Deception: Current challenges and cognitive approaches. Sussex: Wiley Blackwell.
*Winograd, M. R., & Rosenfeld, J. P. (2011). Mock crime application of the complex trial
protocol (CTP) P300-based concealed information test. Psychophysiology, 48, 155-
161. doi: 10.1111/j.1469-8986.2010.01054.x
*Wu, H., Hu, X., & Fu, G. (2009). Does willingness affect the N2-P3 effect of deceptive and
honest responses? Neuroscience Letters, 467, 63-66. doi: 10.1016/j.neulet.2009.10.002

META-ANALYSIS ON DECEPTION AND P3 AMPLITUDE 50
Table 1. Summary of a-priori moderators in deception studies
Type of a-priori moderator Description of a-priori moderator
Task design Between-subjects vs. within-subjects design
Task setting Type of GKT/CIT pre-task
scenario:
committed mock crime
imagined mock crime
no mock crime
Context of experimental deception task legal context
social context
Counter-measure techniques
EEG pre-processing Quantification of P3 amplitude
Individual differences Sex
Trait-anxiety
Injustice sensitivity
Note. Because too few studies investigated individual differences of deception (e.g., Leue &
Beauducel, 2015; Leue et al., 2012), effects of individual differences (e.g., injustice
sensitivity, trait-anxiety) on the probe-irrelevant P3 difference could not be calculated in this
meta-analysis.
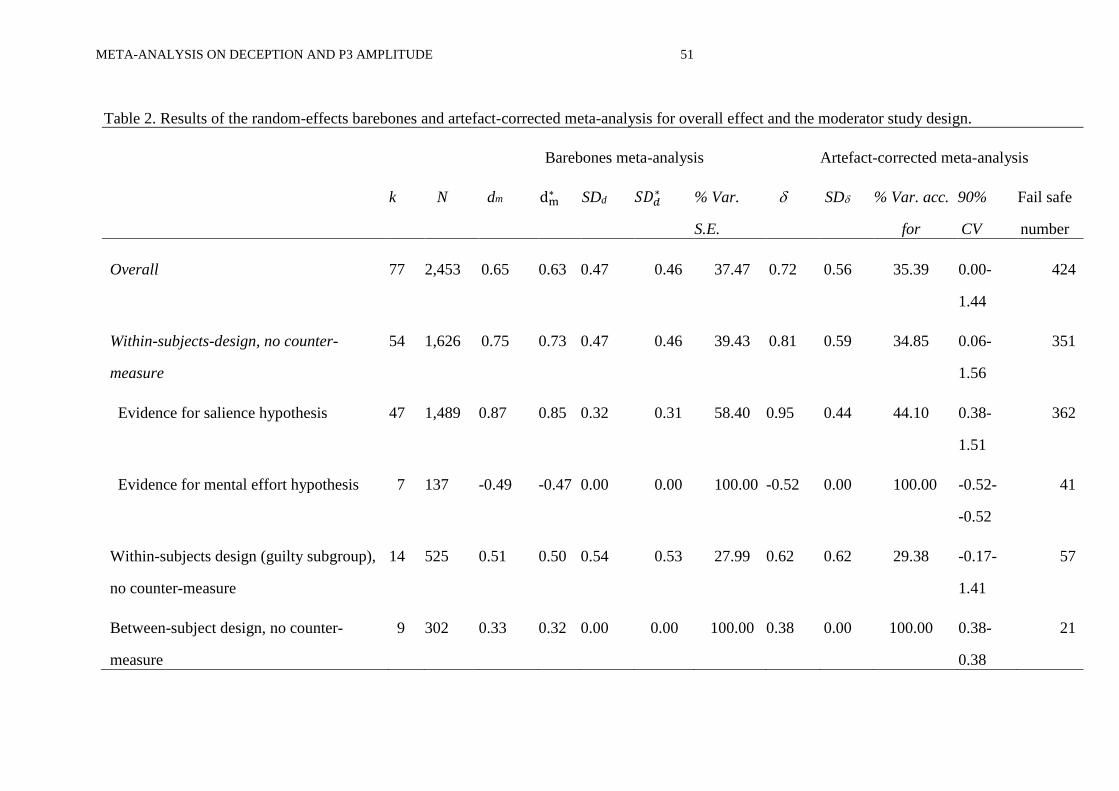
META-ANALYSIS ON DECEPTION AND P3 AMPLITUDE 51
Table 2. Results of the random-effects barebones and artefact-corrected meta-analysis for overall effect and the moderator study design.
Barebones meta-analysis Artefact-corrected meta-analysis
k N dm dm∗ SDd 𝑆𝐷𝑑
∗ % Var.
S.E.
SD % Var. acc.
for
90%
CV
Fail safe
number
Overall 77 2,453 0.65 0.63 0.47 0.46 37.47 0.72 0.56 35.39 0.00-
1.44
424
Within-subjects-design, no counter-
measure
54 1,626 0.75 0.73 0.47 0.46 39.43 0.81 0.59 34.85 0.06-
1.56
351
Evidence for salience hypothesis 47 1,489 0.87 0.85 0.32 0.31 58.40 0.95 0.44 44.10 0.38-
1.51
362
Evidence for mental effort hypothesis 7 137 -0.49 -0.47 0.00 0.00 100.00 -0.52 0.00 100.00 -0.52-
-0.52
41
Within-subjects design (guilty subgroup),
no counter-measure
14 525 0.51 0.50 0.54 0.53 27.99 0.62 0.62 29.38 -0.17-
1.41
57
Between-subject design, no counter-
measure
9 302 0.33 0.32 0.00 0.00 100.00 0.38 0.00 100.00 0.38-
0.38
21

META-ANALYSIS ON DECEPTION AND P3 AMPLITUDE 52
Notes. Parameters of the artefact-corrected meta-analysis are corrected for Spearman-Brown estimated reliability coefficients and sample size.
dm = sample size corrected mean effect size. 𝑑𝑚∗ = approximately unbiased estimator of mean effects sizes, sometimes called ‘Hedges g’. SDd =
sample size corrected standard deviation of the mean effect size. 𝑆𝐷𝑑∗ = approximately unbiased estimator of standard deviation. = population
effect size. k = number of primary studies. N = sample size across primary studies. SD = standard deviation of the population effect size. %
Var. acc. for = percentage of variance in corrected population effect attributable to artefacts. % Var. S.E. = percentage of variance attributable
to sampling error. 90% CV = lower and upper 90% credibility interval.

META-ANALYSIS ON DECEPTION AND P3 AMPLITUDE 53
Table 3. Results of the random-effects barebones and artefact-corrected meta-analysis for the moderator type of deception task.
Barebones meta-analysis
Artefact-corrected meta-analysis
Within-subjects design and without
counter-measures (k = 40)
k N dm 𝑑𝑚∗ SDd 𝑆𝐷𝑑
∗ % Var.
S.E.
SD % Var. acc.
for
90%
CV
Fail safe
number
Deception tasks in a legal context 16 525 0.83 0.81 0.24 0.23 70.66 0.98 0.39 57.39 0.48-
1.48
117
GKT/CIT with mock crime 12 368 0.83 0.81 0.26 0.25 67.40 0.94 0.40 55.30 0.43-
1.45
88
GKT/CIT with committed mock crime 9 274 0.92 0.90 0.06 0.06 97.84 1.10 0.24 79.66 0.80-
1.41
74
GKT/CIT with imagined / observed
mock crime
3 94 0.59 0.57 0.42 0.41 42.91 0.59 0.43 42.96 0.04-
1.14
15
Deception task with forensic scenario 4 157 0.81 0.79 0.15 0.15 83.15 1.13 0.31 70.57 0.74-
1.52
28

META-ANALYSIS ON DECEPTION AND P3 AMPLITUDE 54
Deception tasks in social contexts 24 644 0.69 0.67 0.24 0.23 73.21 0.73 0.25 74.84 0.42-
1.05
141
Deception of faces/attitudes in a social
context
11 372 0.59 0.58 0.26 0.25 64.97 0.63 0.26 66.98 0.29-
0.96
54
Card games 5 67 0.41 0.38 0.00 0.00 100.00 0.47 0.00 100.00 0.47-
0.47
16
Verbal and numerical recognition tasks
of biographical data
8 205 0.95 0.92 0.00 0.00 100.00 1.01 0.00 100.00 1.01-
1.01
68
Notes. Parameters of the artefact-corrected meta-analysis are corrected for Spearman-Brown estimated reliability coefficients and sample size.
dm = sample size corrected mean effect size. 𝑑𝑚∗ = approximately unbiased estimator of mean effects sizes, sometimes called ‘Hedges g’. SDd =
sample size corrected standard deviation of the mean effect size. 𝑆𝐷𝑑∗ = approximately unbiased estimator of standard deviation. = population
effect size. k = number of primary studies. N = sample size across primary studies. SD = standard deviation of the population effect size. % Var.
acc. for = percentage of variance in corrected population effect attributable to artefacts. % Var. S.E. = percentage of variance attributable to
sampling error. 90% CV = lower and upper 90% credibility interval.

META-ANALYSIS ON DECEPTION AND P3 AMPLITUDE 55
Table 4. Results of the random-effects barebones and artefact-corrected meta-analysis for the moderator quantification of P3 amplitude.
Barebones meta-analysis
Artefact-corrected meta-analysis
Within-subjects design and without
counter-measures (k = 52)
k N dm 𝑑𝑚∗ SDd 𝑆𝐷𝑑
∗ % Var.
S.E.
SD % Var. acc.
for
90%
CV
Fail safe
number
Baseline-to-peak P3 amplitude (across
tasks)
15 443 0.25 0.24 0.41 0.40 45.26 0.26 0.47 44.00 -0.34-
0.86
23
Peak-to-peak P3 amplitude (across tasks) 26 888 1.11 1.08 0.00 0.00 100.00 1.24 0.28 69.76 0.88-
1.60
263
Mean / adaptive mean P3 amplitude
(across tasks)
11 274 0.44 0.43 0.35 0.34 57.44 0.46 0.43 52.73 -0.09-
1.01
37
Notes. Parameters of the artefact-corrected meta-analysis are corrected for Spearman-Brown estimated reliability coefficients and sample size.
Included studies incorporate k = 45 studies supporting the salience hypothesis and k = 7 studies supporting the mental effort hypothesis. The
seven studies that support the mental effort hypothesis (i.e., indicated negative population effect sizes) used either baseline-to-peak
quantification (k = 5) or mean P3 quantification (k = 2). The number of studies was too small in order to analyze the effects of P3 quantification
separately for the seven studies. dm = sample size corrected mean effect size. 𝑑𝑚∗ = approximately unbiased estimator of mean effects sizes,
sometimes called ‘Hedges g’. SDd = sample size corrected standard deviation of the mean effect size. 𝑆𝐷𝑑∗ = approximately unbiased estimator

META-ANALYSIS ON DECEPTION AND P3 AMPLITUDE 56
of standard deviation. = population effect size. k = number of primary studies. N = sample size across primary studies. SD = standard
deviation of the population effect size. % Var. acc. for = percentage of variance in corrected population effect attributable to artefacts. % Var.
S.E. = percentage of variance attributable to sampling error. 90% CV = lower and upper 90% credibility interval. k = 2 primary studies did not
report the quantification method of the P3 amplitude.

META-ANALYSIS ON DECEPTION AND P3 AMPLITUDE 57
Table 5. Results of the random-effects barebones and artefact-corrected meta-analysis for the moderator counter-measure effects in GKT/CIT
and autobiographical CTP studies (collapsed across study design).
Barebones meta-analysis
Artefact-corrected meta-analysis
k N dm 𝑑𝑚∗ SDd 𝑆𝐷𝑑
∗ % Var.
S.E.
SD % Var. acc.
for
90%
CV
Fail safe
number
3-stimulus protocol with counter-measure
techniques
10 360 0.44 0.43 0.44 0.43 37.03 0.55 0.47 41.36 -0.05-
1.14
34
CTP
13 491 1.03 1.01 0.20 0.20 74.97 1.12 0.21 77.32 0.86-
1.39
121
CTP with counter-measure techniques
(without mock crime, within-design)
7 320 1.29 1.27 0.13 0.13 86.85 1.40 0.52 34.93 0.74-
2.06
83
Notes. CTP = Complex Trial Protocol. Parameters of the artefact-corrected meta-analysis are corrected for Spearman-Brown estimated
reliability coefficients and sample size. dm = sample size corrected mean effect size. 𝑑𝑚∗ = approximately unbiased estimator of mean effects
sizes, sometimes called ‘Hedges g’. SDd = sample size corrected standard deviation of the mean effect size. 𝑆𝐷𝑑∗ = approximately unbiased
estimator of standard deviation. = population effect size. k = number of primary studies. N = sample size across primary studies. SD =
META-ANALYSIS ON DECEPTION AND P3 AMPLITUDE 58
standard deviation of the population effect size. % Var. acc. for = percentage of variance in corrected population effect attributable to artefacts.
% Var. S.E. = percentage of variance attributable to sampling error. 90% CV = lower and upper 90% credibility interval.
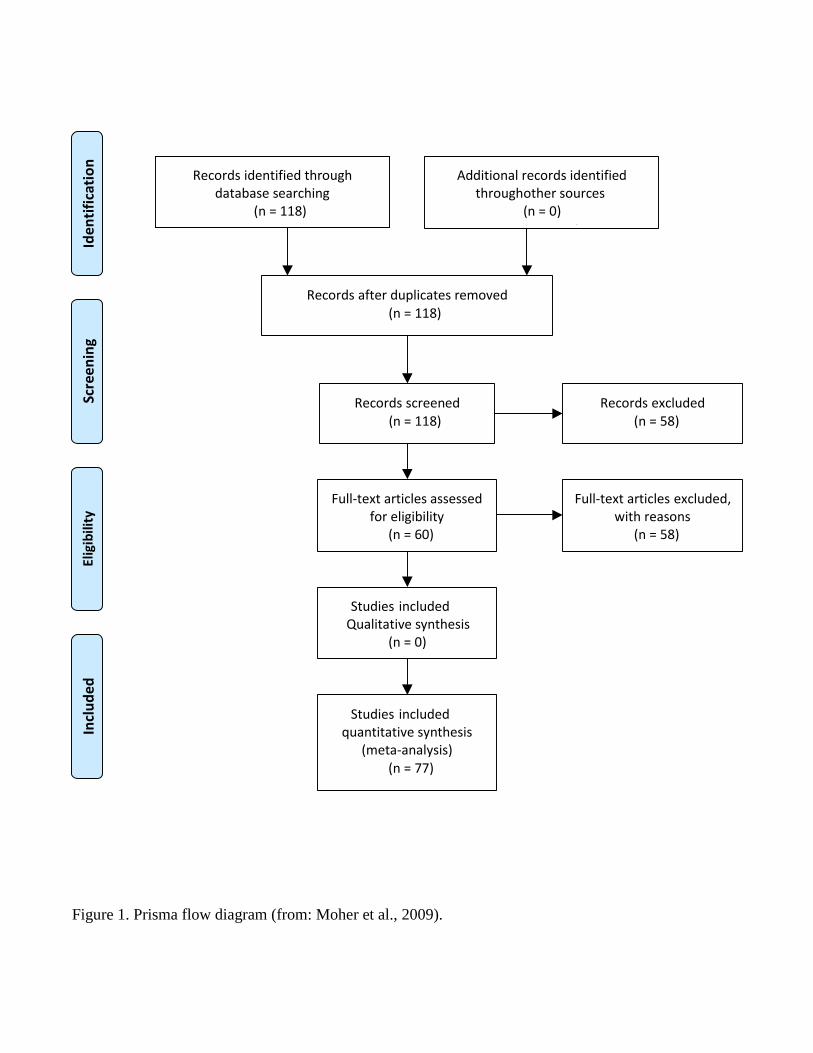
Figure 1. Prisma flow diagram (from: Moher et al., 2009).
Records identified through database searching
n = 118)
=
(
Additional records identified through other sources
n = 0)
)
(
Records after duplicates removed
n = 118)
=
(
Records screened
( n = 118)
=
Records excluded
( n = 58)
Full-text articles assessed for eligibility
(n = 60)
Full-text articles excluded, with reasons
n = 58)
(
Studies included
in Qualitative synthesis n = 0)
(
Studies included
in quantitative synthesis ( meta-analysis)
( n = 77)
Related Documents