ORIGINAL PAPER A Meta-Analysis of Single Case Research Studies on Aided Augmentative and Alternative Communication Systems with Individuals with Autism Spectrum Disorders Jennifer B. Ganz • Theresa L. Earles-Vollrath • Amy K. Heath • Richard I. Parker • Mandy J. Rispoli • Jaime B. Duran Published online: 5 March 2011 Ó Springer Science+Business Media, LLC 2011 Abstract Many individuals with autism cannot speak or cannot speak intelligibly. A variety of aided augmentative and alternative communication (AAC) approaches have been investigated. Most of the research on these approa- ches has been single-case research, with small numbers of participants. The purpose of this investigation was to meta- analyze the single case research on the use of aided AAC with individuals with autism spectrum disorders (ASD). Twenty-four single-case studies were analyzed via an effect size measure, the Improvement Rate Difference (IRD). Three research questions were investigated con- cerning the overall impact of AAC interventions on tar- geted behavioral outcomes, effects of AAC interventions on individual targeted behavioral outcomes, and effects of three types of AAC interventions. Results indicated that, overall, aided AAC interventions had large effects on tar- geted behavioral outcomes in individuals with ASD. AAC interventions had positive effects on all of the targeted behavioral outcome; however, effects were greater for communication skills than other categories of skills. Effects of the Picture Exchange Communication System and speech-generating devices were larger than those for other picture-based systems, though picture-based systems did have small effects. Keywords Autism spectrum disorders Augmentative and alternative communication Aided AAC Communication skills Social skills Interventions Meta-analysis Voice output communication aid Speech-generating device Picture Exchange Communication System Individuals who cannot effectively use conventional speech to communicate may use augmentative and alter- native communication (AAC) systems to compensate for a lack of speech or to replace, or augment, unintelligible speech. Difficulty or delay in language development is a core characteristic associated with autism spectrum disor- ders (ASD; American Psychiatric Association [APA] 2000); approximately half of children with autism do not develop speech or develop limited speech and language abilities (Centers for Disease Control and Prevention [CDC] 2007). Given this statistic, many professionals implement AAC with individuals with ASD (Mirenda 2003). Examples of AAC include unaided systems, such as gestures and manual sign language, and aided systems, such as pointing to a picture on a communication board, The results of this meta-analysis were presented at the 2010 Applied Behavior Analysis International Annual Convention in San Antonio, TX. J. B. Ganz A. K. Heath R. I. Parker M. J. Rispoli J. B. Duran Texas A&M University, College Station, TX, USA e-mail: [email protected] R. I. Parker e-mail: [email protected] M. J. Rispoli e-mail: [email protected] J. B. Duran e-mail: [email protected] T. L. Earles-Vollrath University of Central Missouri, Warrensburg, MO, USA e-mail: [email protected] J. B. Ganz (&) Department of Educational Psychology, 4225 TAMU, College Station, TX, USA e-mail: [email protected] 123 J Autism Dev Disord (2012) 42:60–74 DOI 10.1007/s10803-011-1212-2

Welcome message from author
This document is posted to help you gain knowledge. Please leave a comment to let me know what you think about it! Share it to your friends and learn new things together.
Transcript
ORIGINAL PAPER
A Meta-Analysis of Single Case Research Studies on AidedAugmentative and Alternative Communication Systemswith Individuals with Autism Spectrum Disorders
Jennifer B. Ganz • Theresa L. Earles-Vollrath •
Amy K. Heath • Richard I. Parker •
Mandy J. Rispoli • Jaime B. Duran
Published online: 5 March 2011
� Springer Science+Business Media, LLC 2011
Abstract Many individuals with autism cannot speak or
cannot speak intelligibly. A variety of aided augmentative
and alternative communication (AAC) approaches have
been investigated. Most of the research on these approa-
ches has been single-case research, with small numbers of
participants. The purpose of this investigation was to meta-
analyze the single case research on the use of aided AAC
with individuals with autism spectrum disorders (ASD).
Twenty-four single-case studies were analyzed via an
effect size measure, the Improvement Rate Difference
(IRD). Three research questions were investigated con-
cerning the overall impact of AAC interventions on tar-
geted behavioral outcomes, effects of AAC interventions
on individual targeted behavioral outcomes, and effects of
three types of AAC interventions. Results indicated that,
overall, aided AAC interventions had large effects on tar-
geted behavioral outcomes in individuals with ASD. AAC
interventions had positive effects on all of the targeted
behavioral outcome; however, effects were greater for
communication skills than other categories of skills.
Effects of the Picture Exchange Communication System
and speech-generating devices were larger than those for
other picture-based systems, though picture-based systems
did have small effects.
Keywords Autism spectrum disorders � Augmentative
and alternative communication � Aided AAC �Communication skills � Social skills � Interventions �Meta-analysis � Voice output communication aid �Speech-generating device � Picture Exchange
Communication System
Individuals who cannot effectively use conventional
speech to communicate may use augmentative and alter-
native communication (AAC) systems to compensate for a
lack of speech or to replace, or augment, unintelligible
speech. Difficulty or delay in language development is a
core characteristic associated with autism spectrum disor-
ders (ASD; American Psychiatric Association [APA]
2000); approximately half of children with autism do not
develop speech or develop limited speech and language
abilities (Centers for Disease Control and Prevention
[CDC] 2007). Given this statistic, many professionals
implement AAC with individuals with ASD (Mirenda
2003).
Examples of AAC include unaided systems, such as
gestures and manual sign language, and aided systems,
such as pointing to a picture on a communication board,
The results of this meta-analysis were presented at the 2010 Applied
Behavior Analysis International Annual Convention in San Antonio,
TX.
J. B. Ganz � A. K. Heath � R. I. Parker �M. J. Rispoli � J. B. Duran
Texas A&M University, College Station, TX, USA
e-mail: [email protected]
R. I. Parker
e-mail: [email protected]
M. J. Rispoli
e-mail: [email protected]
J. B. Duran
e-mail: [email protected]
T. L. Earles-Vollrath
University of Central Missouri, Warrensburg, MO, USA
e-mail: [email protected]
J. B. Ganz (&)
Department of Educational Psychology, 4225 TAMU, College
Station, TX, USA
e-mail: [email protected]
123
J Autism Dev Disord (2012) 42:60–74
DOI 10.1007/s10803-011-1212-2
writing on paper, activating a speech-generating device
(SGD; American Speech-Language-Hearing Association
[ASHA] 1997), or exchanging a symbol, as when using a
Picture Exchange Communication System (PECS) (Frost
and Bondy 1994, 2002). Many practitioners choose aided
AAC systems for individuals with ASD that require
external equipment (Bondy and Frost 2002; Mirenda
2001). Aided, picture-based AAC systems are frequently
implemented with individuals with ASD; such systems
appear to match the characteristics of ASD (Mirenda 2001;
Schuler and Baldwin 1981). Fine motor difficulties are
common in individuals with ASD, thus causing difficulty in
learning manual signs (Jones and Prior 1985; Mirenda
2001; Seal and Bonvillian 1997). However, picture-based
systems are concrete, remain present to refer back to
(unlike manual signs, which are transient), and many
resemble their referents and appear to be well suited for
individuals with ASD (Mirenda 2001; Rotholz et al. 1989).
Thus, aided systems are the focus of this article. Speech
generating-devices (SGDs), also known as voice output
communication aids (VOCAs), are portable electronic
aided AAC devices that usually combine digitized or
synthesized speech with static visual symbols such as line
drawings, photographs, or abstract symbols (Mirenda 2003;
Ogletree and Oren 2006).
While numerous AAC systems exist, some of the sys-
tems most widely used with children with autism include
SGDs (e.g., Schlosser et al. 1998; Sigafoos et al. 2004),
PECS (Bondy and Frost 2002; Frost and Bondy 2002), and
other picture-based systems (e.g., Frea et al. 2001; Nunes
and Hanline 2007), thus, they are the focus of this article.
Although manual sign language is considered to be an
emerging treatment for individuals with ASD, a recent
systematic review of the literature (Wendt 2009) included a
focus on sign language implementation with this popula-
tion, thus, sign language was excluded from the current
analysis.
History of AAC in ASD
There has been a strong movement in the field to identify
evidence-based practices (EBP) for individuals with autism
(Reichow et al. 2008; Schlosser and Sigafoos 2009;
Simpson 2005, 2008; Simpson et al. 2007). This movement
was initiated with the legal mandates of NCLB (2001) and
the IDEA (2004) requiring school personnel to implement
‘‘…special education and related services and supplemen-
tary aids and services, based on peer-reviewed research to
the extent practicable…’’ (IDEA 2004, 20 U.S.C. 1414
§614, p. 118). Additional support for this movement was
provided by researchers such as Horner et al. (2005), who
proposed standards for using single-subject design research
to identify EBP in special education.
Research is the foundation for determining EBP in
special education (Tankersley et al. 2008), however, due to
the low incidence of some disabilities, researchers often
use single-case designs rather than more conventional
group designs. Issues arise when professionals attempt to
synthesize and aggregate the data from numerous single-
subject design studies to determine EBP. A primary diffi-
culty relates to the amount of research being conducted.
Special education has an extremely large single-case
research base which makes it difficult to evaluate and
summarize the results unless organized into a useable form
(Kavale 2001). In addition, comparing results of research
using different single-subject designs, diverse outcome
measures and participants with varying demographics, as
well as the variable and sometimes conflicting results of the
research (Kavale 1984, 2001) makes it difficult to sum-
marize the findings without a common metric. Further,
although some group studies on AAC for individuals with
ASD do exist, they are few in number compared to the
plethora of single-case studies and they have been excluded
from this meta-analysis because it is not possible to use a
single index to compare these two different methods of
research.
Meta-analysis combines and synthesizes results of
numerous single-participant studies from an area of
research allowing professionals to determine the general
effectiveness of the selected interventions and with whom
these practices produce the greatest benefits (Kavale 1984,
1998, 2001). In addition, meta-analysis addresses many of
the previously stated concerns (Kavale 1984, 2001) while
providing a quantitative means for synthesizing research
(Glass 1976; Kavale 2001) making it an effective metric
for identifying EBP in special education (Banda and
Therrien 2008). Meta-analysis commonly converts data
from each of the studies into an effect size (ES) which
indicates the amount of change between baseline and
intervention phases (Kavale 1998). The ES is comparable
to the normal distribution and z-score, therefore confidence
intervals can be derived. Effect sizes can be positive or
negative, however, the closer the ES is to 1.0, the larger the
effect of the intervention on the outcome variables.
While numerous researchers promote the use of meta-
analysis in summarizing single-case research (Banda and
Therrien 2008; Kavale 1984, 1998, 2001; Marquis et al.
2000; Parker et al. 2007; Scruggs 1992; Scruggs and
Mastropieri 1998; Scruggs et al. 1987) controversy exists
regarding the type of metric to use (Scruggs, 1992; Scruggs
and Mastropieri 2001). Percent of non-overlapping data
points (PND; Scruggs et al. 1987) is the most commonly
used index; however, concerns regarding the use of PND as
a single-case research statistical indices have been
J Autism Dev Disord (2012) 42:60–74 61
123
documented (Allison and Gorman 1993; Scruggs and
Mastropieri 2001; Parker et al. 2007) including the need for
a clear description of the guidelines used when applying
the procedure (Scruggs et al. 1987; Parker et al. 2007),
inability to calculate confidence intervals because of an
unknown sampling distribution (Parker et al. 2007) the
overestimation of treatment effects when the baseline trend
is in the expected direction of the treatment data (Scruggs
et al. 1987), decreased reliability due to an emphasis on the
most extreme data point in phase A (Parker et al. 2007) and
the lack of sensitivity to powerful treatment effects (White
et al. 1989). Another index is the percent of all non-over-
lapping data points (PAND, Parker et al. 2007). PAND is
similar to PND in that it focuses on non-overlapping data
points, however, it uses all data points from each of the
phases thus addressing the criticism that PND relies on the
most extreme, therefore unreliable, data point (Parker et al.
2007). In addition, PAND can be converted into an effect
size and has a sampling distribution which allows for the
calculation of confidence intervals (Parker et al. 2007).
PAND, however, like PND, is insensitive to ES at the top
of the scale and does not account for positive changes in
baseline trend (Parker et al. 2007).
The abovementioned shortcomings have spurred the
development of more defensible non-overlap indices, one
of which is the Improvement Rate Difference (IRD). IRD is
defined as the improvement rate (IR) of the treatment phase
minus the improvement rate of the baseline phase [IR
(t) - IR (b) = IRD]. The IR is calculated by number of
‘‘improved data points’’ divided by the total data points in
that phase. IRD is calculated as the difference between the
two independent proportions. This meta-analysis relies on
IRD, with confidence intervals (CIs) to indicate precision
and credibility of obtained IRD values. However, PND
analyses are included also, for readers who are familiar
with that earlier index.
Purpose and Research Questions
The purpose of this meta-analysis was to investigate the
effectiveness of various augmentative and alternative
communication (AAC) systems and procedures that are
currently implemented with individuals with autism spec-
trum disorders (ASD). As noted above, the pressure to
implement EBP in schools calls for the need to determine
the overall effectiveness of AAC (Tankersley et al. 2008).
Thus, although several single-case studies have demon-
strated the efficacy of AAC with individuals with ASD, it is
critical to evaluate that data using a common metric, i.e., an
effect size measure via a meta-analysis (Kavale 1984,
1998, 2001). The first research question seeks to solve this
problem: (a) What are the overall effects of AAC on the
behaviors (e.g., communication skills, social skills,
challenging behaviors, and academic skills) of children
with ASD?
Beyond determining the overall impact of AAC, it is
also necessary to determine the effects of AAC on indi-
vidual types of targeted behavioral outcomes. While single-
case research has demonstrated that AAC may be effective
in improving communication skills (e.g., Charlop-Christy
et al. 2002), social skills (e.g., Kravits et al. 2002), chal-
lenging behaviors (e.g., Frea et al. 2001; Ganz et al. 2009),
and academics (e.g., Schlosser et al. 1998), it is unclear
whether AAC is more effective for one type of behavior
than others. Thus, the second research question asks:
(b) Do effects differ by targeted client outcome (dependent
variable)?
Finally, although a number of single-case studies have
demonstrated the effectiveness of PECS (e.g., Ganz and
Simpson 2004), SGDs (e.g., Schepis et al. 1998), and other
picture-based AAC systems (e.g., Thompson et al. 1998),
few studies have compared the effectiveness of these sys-
tems to each other. Meta-analysis allows for such compar-
isons to be made (Banda and Therrien 2008). This provides
a means to answer the final research question: (c) Do effects
differ by type of AAC treatment variables (e.g., Picture
Exchange Communication System, other picture-based
system, or use of speech-generating devices)?
Method
Literature Search
A literature search was conducted that focused on the use
of AAC systems with individuals with ASD. ERIC, Psy-
chINFO, Education Full Text, Professional Development
Collection, and Social Sciences Full Text online databases
were searched for literature published between 1980 and
the first 6 months of 2008 that contained one of the fol-
lowing keywords: autis*, autism spectrum disorder*, ASD,
pervasive developmental disorder*, PDD, PDD-NOS,
Asperger*, Asperger syndrome, and Asperger’s syndrome
and one of these keywords: AAC, augmentative communi-
cation, alternative communication, augmentative and
alternative communication, PECS, and Picture Exchange
Communication System. This search resulted in 122 articles,
books, book chapters, dissertations, and other literature.
Procedures
Following the literature search, each article or document
was evaluated according to whether or not it met all of the
following criteria: (a) participants were diagnosed with an
ASD (i.e., any of the PDD diagnoses in the DSM-IV-TR;
62 J Autism Dev Disord (2012) 42:60–74
123
American Psychiatric Association 2000); (b) outcome
measures included one or more of these: social skills,
adaptive behavior, challenging behavior, communication,
and academic skills; (c) interventions included aided AAC
system (e.g., PECS, SGDs, voice output communication
aids, picture-point systems); (d) study employed a single-
case research design demonstrating experimental control
(i.e., reversal, multiple-baseline, alternating treatment);
(e) no dichotomous dependent variables (e.g., yes/no, 0/1)
used; (f) data were displayed as line graphs; (g) articles
were published in peer-reviewed journals; and (h) articles
were in English. Articles had to meet all of these criteria to
be included in the meta-analysis. Although a few group
studies have been published demonstrating the effects of
AAC on individuals with ASD (e.g., Yoder and Stone
2006a, b), these were excluded from this meta-analysis
because it is not possible to meaningfully compare dispa-
rate types of data with a single effect size measure. Effect
sizes from single case research are commonly two to three
times larger than from group studies; thus they cannot be
summarized statistically together (Beretvas and Chung
2008).
Each document was independently evaluated by two of
the authors to determine if it met each of the inclusion
criteria. The majority of the documents that were elimi-
nated were dissertations (i.e., not peer-reviewed publica-
tions), were descriptive articles (e.g., described how to
implement PECS, were large group studies, or did not
include participants with ASD. A small number of exclu-
ded documents were in Japanese or included single-case
designs that did not demonstrate experimental control (e.g.,
Ganz et al. 2008a). In cases where inclusion judgments
were in disagreement or one of the authors was unsure, a
third author critiqued the article and the inclusion/exclu-
sion decision made by two of the three authors stood. As a
result, 24 articles were identified to include in the meta-
analysis.
One of the authors then did a manual search of the
articles referenced in the included articles. This search
resulted in the inclusion of one additional article that met
the aforementioned criteria. One article was later elimi-
nated because the research design did not include the col-
lection of baseline data with which to compare intervention
results (Beck et al. 2008); thus, this meta-analysis includes
the analysis of 24 single-case studies.
Data Extraction
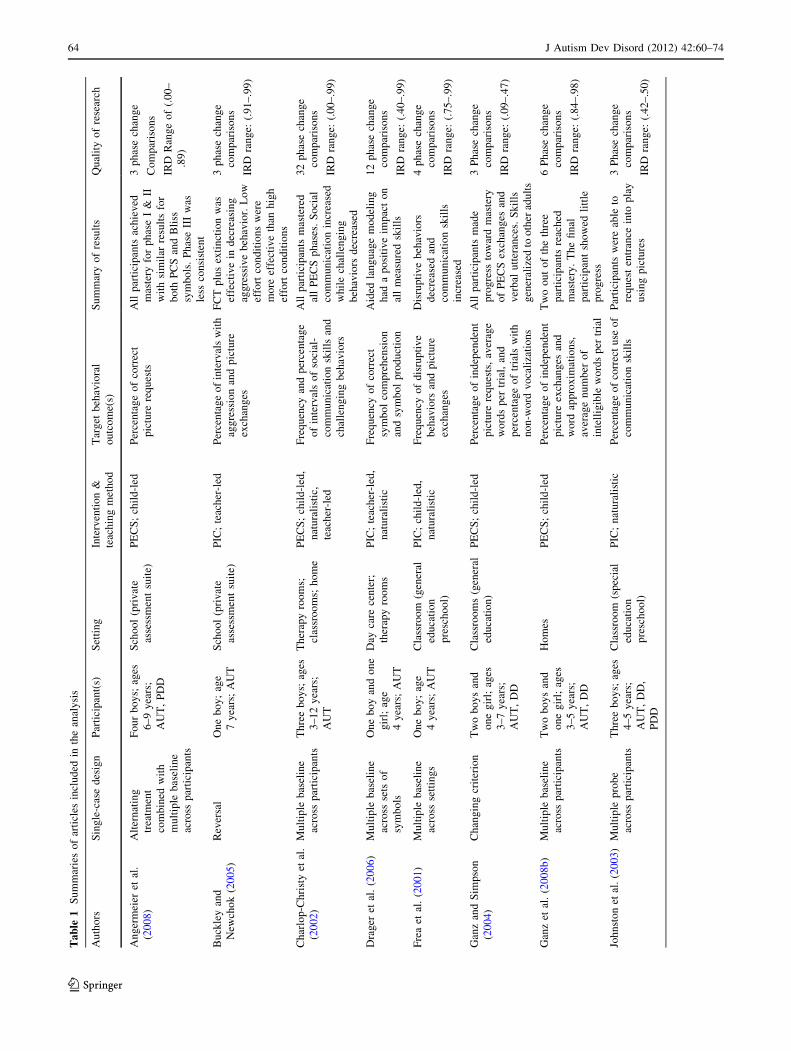
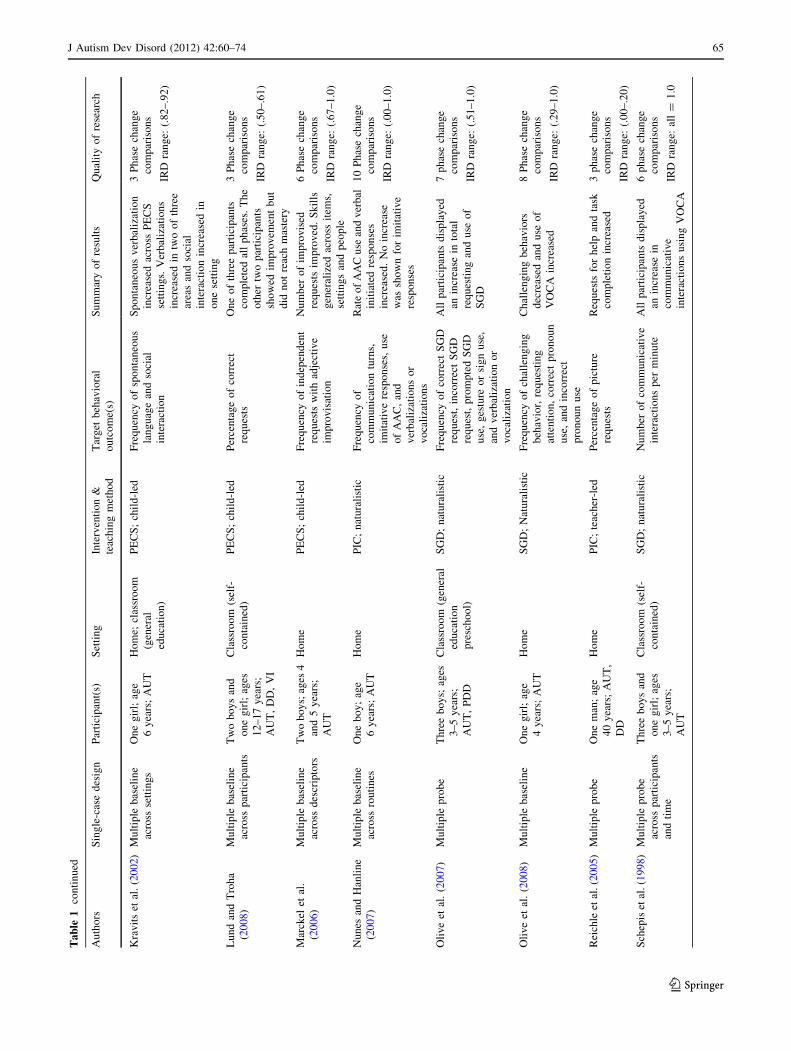
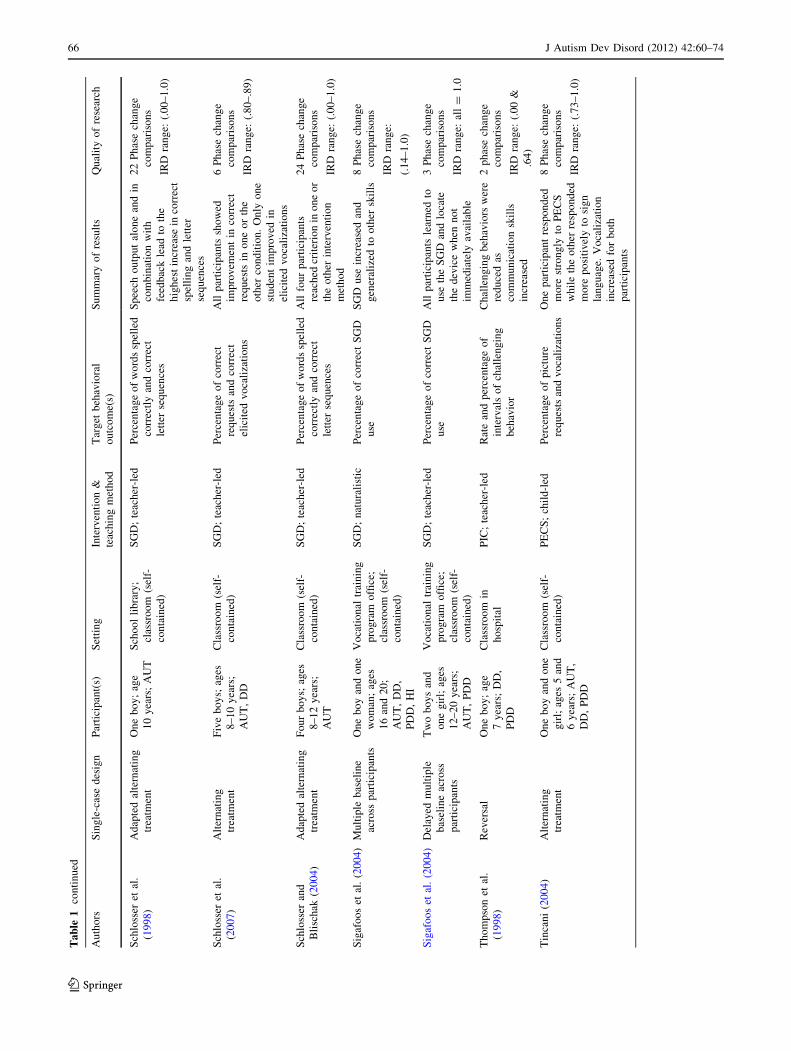
Each of the 24 articles were summarized, including study
design, brief participant descriptions (number, sex, age
range, diagnosis), settings, intervention implemented,
teaching method implemented, target behavioral outcomes,
summary of the results, and overall quality of the research.
The categories for intervention implemented were deter-
mined post hoc, that is, following the gathering of articles
and according to the easiest means of categorizing the
types of AAC, based on categories commonly used by
practitioners. SGDs included any electronic AAC system
that included synthetic or natural (recorded) speech output.
PECS included only those articles that specifically identi-
fied the intervention as following the PECS protocol (Frost
and Bondy 2002). Finally, PIC included any other picture-
based AAC system; that is, any AAC system that did not
include electronic voice output and did not follow the
PECS protocol of instruction and implementation.
The teaching method implemented included three cate-
gories. Child-led involved instruction that began only when
the child initiated an interaction by displaying a behavioral
indication that he or she wished to obtain the item (e.g.,
reached for, tried to grab, intently stared at the item) and
instruction consisted of massed trials, often stimuli or
controlled by the adult. Naturalistic generally fit the criteria
for child-led, however, instruction took place during nat-
ural activities (e.g., free play, snack time); the adult did not
strictly control access to the stimuli. Teacher-led involved
one-on-one instruction in a contrived situation in which
instruction was given with no clear behavioral indication
that the child wished to obtain the item. Instruction was
also considered teacher-led if the teacher led the commu-
nication situation with a prompt such as, ‘‘what do you
want,’’ or, ‘‘time to make choices.’’
Horner et al. (2005) suggestions for determining the
quality of research were considered. As a result, the overall
quality of research column in Table 1 includes the number
of phase change comparisons as well as the range of cal-
culated IRD results for each article. According to Horner
et al. (2005), a minimum of three phase changes demon-
strating experimental control is required in studies con-
sidered to be high quality. Horner et al. (2005) describe
seven quality indicators to determine whether or not indi-
vidual single-case studies should be considered to be
credible: (a) participant and setting descriptions; (b) inde-
pendent variables; (c) dependent variables; (d) baseline
measurement; (e) experimental control, or internal validity;
(f) external validity; and (g) social validity.
Overall, the studies included in this meta analysis meet
most of the Horner et al. criteria, particularly replicable
descriptions of participants and settings, replicable
description of and systematic manipulation of the inde-
pendent variable(s), measurement and description of the
dependent variable(s), collection of and high overall inter-
observer agreement, replicable description of baseline
conditions and collection of baseline data (although some
of the studies included only two to three baseline data
points for some participants; e.g., Ganz et al. 2008b), and
single-case designs demonstrating experimental control.
J Autism Dev Disord (2012) 42:60–74 63
123
Ta
ble
1S
um
mar
ies
of
arti
cles
incl
ud
edin
the
anal
ysi
s
Au
tho
rsS
ing
le-c
ase
des
ign
Par
tici
pan
t(s)
Set
tin
gIn
terv
enti
on
&
teac
hin
gm
eth
od
Tar
get
beh
avio
ral
ou
tco
me(
s)
Su
mm
ary
of
resu
lts
Qu
alit
yo
fre
sear
ch
An
ger
mei
eret
al.
(20
08
)
Alt
ern
atin
g
trea
tmen
t
com
bin
edw
ith
mu
ltip
leb
asel
ine
acro
ssp
arti
cip
ants
Fo
ur
bo
ys;
ages
6–
9y
ears
;
AU
T,
PD
D
Sch
oo
l(p
riv
ate
asse
ssm
ent
suit
e)
PE
CS
;ch
ild
-led
Per
cen
tag
eo
fco
rrec
t
pic
ture
req
ues
ts
All
par
tici
pan
tsac
hie
ved
mas
tery
for
ph
ase
I&
II
wit
hsi
mil
arre
sult
sfo
r
bo
thP
CS
and
Bli
ss
sym
bo
ls.
Ph
ase
III
was
less
con
sist
ent
3p
has
ech
ang
e
Co
mp
aris
on
s
IRD
Ran
ge
of
(.0
0–
.89
)
Bu
ckle
yan
d
New
cho
k(2
00
5)
Rev
ersa
lO
ne
bo
y;
age
7y
ears
;A
UT
Sch
oo
l(p
riv
ate
asse
ssm
ent
suit
e)
PIC
;te
ach
er-l
edP
erce
nta
ge
of
inte
rval
sw
ith
agg
ress
ion
and
pic
ture
exch
ang
es
FC
Tp
lus
exti
nct
ion
was
effe
ctiv
ein
dec
reas
ing
agg
ress
ive
beh
avio
r.L
ow
effo
rtco
nd
itio
ns
wer
e
mo
reef
fect
ive
than
hig
h
effo
rtco
nd
itio
ns
3p
has
ech
ang
e
com
par
iso
ns
IRD
ran
ge:
(.9
1–
.99
)
Ch
arlo
p-C
hri
sty
etal
.
(20
02
)
Mu
ltip
leb
asel
ine
acro
ssp
arti
cip
ants
Th
ree
bo
ys;
ages
3–
12
yea
rs;
AU
T
Th
erap
yro
om
s;
clas
sro
om
s;h
om
e
PE
CS
;ch
ild
-led
,
nat
ura
list
ic,
teac
her
-led
Fre
qu
ency
and
per
cen
tag
e
of
inte
rval
so
fso
cial
-
com
mu
nic
atio
nsk
ills
and
chal
len
gin
gb
ehav
iors
All
par
tici
pan
tsm
aste
red
all
PE
CS
ph
ases
.S
oci
al
com
mu
nic
atio
nin
crea
sed
wh
ile
chal
len
gin
g
beh
avio
rsd
ecre
ased
32
ph
ase
chan
ge
com
par
iso
ns
IRD
ran
ge:
(.0
0–
.99
)
Dra
ger
etal
.(2
00
6)
Mu
ltip
leb
asel
ine
acro
ssse
tso
f
sym
bo
ls
On
eb
oy
and
on
e
gir
l;ag
e
4y
ears
;A
UT
Day
care
cen
ter;
ther
apy
roo
ms
PIC
;te
ach
er-l
ed,
nat
ura
list
ic
Fre
qu
ency
of
corr
ect
sym
bo
lco
mp
reh
ensi
on
and
sym
bo
lp
rod
uct
ion
Aid
edla
ng
uag
em
od
elin
g
had
ap
osi
tiv
eim
pac
to
n
all
mea
sure
dsk
ills
12
ph
ase
chan
ge
com
par
iso
ns
IRD
ran
ge:
(.4
0–
.99
)
Fre
aet
al.
(20
01)
Mu
ltip
leb
asel
ine
acro
ssse
ttin
gs
On
eb
oy
;ag
e
4y
ears
;A
UT
Cla
ssro
om
(gen
eral
edu
cati
on
pre
sch
oo
l)
PIC
;ch
ild
-led
,
nat
ura
list
ic
Fre
qu
ency
of
dis
rup
tiv
e
beh
avio
rsan
dp
ictu
re
exch
ang
es
Dis
rup
tiv
eb
ehav
iors
dec
reas
edan
d
com
mu
nic
atio
nsk
ills
incr
ease
d
4p
has
ech
ang
e
com
par
iso
ns
IRD
ran
ge:
(.7
5–
.99
)
Gan
zan
dS
imp
son
(20
04
)
Ch
ang
ing
crit
erio
nT
wo
bo
ys
and
on
eg
irl;
ages
3–
7y
ears
;
AU
T,
DD
Cla
ssro
om
s(g
ener
al
edu
cati
on
)
PE
CS
;ch
ild
-led
Per
cen
tag
eo
fin
dep
end
ent
pic
ture
req
ues
ts,
aver
age
wo
rds
per
tria
l,an
d
per
cen
tag
eo
ftr
ials
wit
h
no
n-w
ord
vo
cali
zati
on
s
All
par
tici
pan
tsm
ade
pro
gre
ssto
war
dm
aste
ry
of
PE
CS
exch
ang
esan
d
ver
bal
utt
eran
ces.
Sk
ills
gen
eral
ized
too
ther
adu
lts
3P
has
ech
ang
e
com
par
iso
ns
IRD
ran
ge:
(.0
9–
.47
)
Gan
zet
al.
(20
08
b)
Mu
ltip
leb
asel
ine
acro
ssp
arti
cip
ants
Tw
ob
oy
san
d
on
eg
irl;
ages
3–
5y
ears
;
AU
T,
DD
Ho
mes
PE
CS
;ch
ild
-led
Per
cen
tag
eo
fin
dep
end
ent
pic
ture
exch
ang
esan
d
wo
rdap
pro
xim
atio
ns,
aver
age
nu
mb
ero
f
inte
llig
ible
wo
rds
per
tria
l
Tw
oo
ut
of
the
thre
e
par
tici
pan
tsre
ach
ed
mas
tery
.T
he
fin
al
par
tici
pan
tsh
ow
edli
ttle
pro
gre
ss
6P
has
ech
ang
e
com
par
iso
ns
IRD
ran
ge:
(.8
4–
.98
)
Joh
nst
on
etal
.(2
00
3)
Mu
ltip
lep
rob
e
acro
ssp
arti
cip
ants
Th
ree
bo
ys;
ages
4–
5y
ears
;
AU
T,
DD
,
PD
D
Cla
ssro
om
(sp
ecia
l
edu
cati
on
pre
sch
oo
l)
PIC
;n
atu
rali
stic
Per
cen
tag
eo
fco
rrec
tu
seo
f
com
mu
nic
atio
nsk
ills
Par
tici
pan
tsw
ere
able
to
req
ues
ten
tran
cein
top
lay
usi
ng
pic
ture
s
3P
has
ech
ang
e
com
par
iso
ns
IRD
ran
ge:
(.4
2–
.50
)
64 J Autism Dev Disord (2012) 42:60–74
123
Ta
ble
1co
nti
nu
ed
Au
tho
rsS
ing
le-c
ase
des
ign
Par
tici
pan
t(s)
Set
tin
gIn
terv
enti
on
&
teac
hin
gm
eth
od
Tar
get
beh
avio
ral
ou
tco
me(
s)
Su
mm
ary
of
resu
lts
Qu
alit
yo
fre
sear
ch
Kra
vit
set
al.
(20
02)
Mu
ltip
leb
asel
ine
acro
ssse
ttin
gs
On
eg
irl;
age
6y
ears
;A
UT
Ho
me;
clas
sro
om
(gen
eral
edu
cati
on
)
PE
CS
;ch
ild
-led
Fre
qu
ency
of
spo
nta
neo
us
lan
gu
age
and
soci
al
inte
ract
ion
Sp
on
tan
eou
sv
erb
aliz
atio
n
incr
ease
dac
ross
PE
CS
sett
ing
s.V
erb
aliz
atio
ns
incr
ease
din
two
of
thre
e
area
san
dso
cial
inte
ract
ion
incr
ease
din
on
ese
ttin
g
3P
has
ech
ang
e
com
par
iso
ns
IRD
ran
ge:
(.8
2–
.92
)
Lu
nd
and
Tro
ha
(20
08
)
Mu
ltip
leb
asel
ine
acro
ssp
arti
cip
ants
Tw
ob
oy
san
d
on
eg
irl;
ages
12
–1
7y
ears
;
AU
T,
DD
,V
I
Cla
ssro
om
(sel
f-
con
tain
ed)
PE
CS
;ch
ild
-led
Per
cen
tag
eo
fco
rrec
t
req
ues
ts
On
eo
fth
ree
par
tici
pan
ts
com
ple
ted
all
ph
ases
.T
he
oth
ertw
op
arti
cip
ants
sho
wed
imp
rov
emen
tb
ut
did
no
tre
ach
mas
tery
3P
has
ech
ang
e
com
par
iso
ns
IRD
ran
ge:
(.5
0–
.61
)
Mar
ckel
etal
.
(20
06
)
Mu
ltip
leb
asel
ine
acro
ssd
escr
ipto
rs
Tw
ob
oy
s;ag
es4
and
5y
ears
;
AU
T
Ho
me
PE
CS
;ch
ild
-led
Fre
qu
ency
of
ind
epen
den
t
req
ues
tsw
ith
adje
ctiv
e
imp
rov
isat
ion
Nu
mb
ero
fim
pro
vis
ed
req
ues
tsim
pro
ved
.S
kil
ls
gen
eral
ized
acro
ssit
ems,
sett
ing
san
dp
eop
le
6P
has
ech
ang
e
com
par
iso
ns
IRD
ran
ge:
(.6
7–
1.0
)
Nu
nes
and
Han
lin
e
(20
07
)
Mu
ltip
leb
asel
ine
acro
ssro
uti
nes
On
eb
oy
;ag
e
6y
ears
;A
UT
Ho
me
PIC
;n
atu
rali
stic
Fre
qu
ency
of
com
mu
nic
atio
ntu
rns,
imit
ativ
ere
spo
nse
s,u
se
of
AA
C,
and
ver
bal
izat
ion
so
r
vo
cali
zati
on
s
Rat
eo
fA
AC
use
and
ver
bal
init
iate
dre
spo
nse
s
incr
ease
d.
No
incr
ease
was
sho
wn
for
imit
ativ
e
resp
on
ses
10
Ph
ase
chan
ge
com
par
iso
ns
IRD
ran
ge:
(.0
0–
1.0
)
Oli
ve
etal
.(2
00
7)
Mu
ltip
lep
rob
eT
hre
eb
oy
s;ag
es
3–
5y
ears
;
AU
T,
PD
D
Cla
ssro
om
(gen
eral
edu
cati
on
pre
sch
oo
l)
SG
D;
nat
ura
list
icF
req
uen
cyo
fco
rrec
tS
GD
req
ues
t,in
corr
ect
SG
D
req
ues
t,p
rom
pte
dS
GD
use
,g
estu
reo
rsi
gn
use
,
and
ver
bal
izat
ion
or
vo
cali
zati
on
All
par
tici
pan
tsd
isp
lay
ed
anin
crea
sein
tota
l
req
ues
tin
gan
du
seo
f
SG
D
7p
has
ech
ang
e
com
par
iso
ns
IRD
ran
ge:
(.5
1–
1.0
)
Oli
ve
etal
.(2
00
8)
Mu
ltip
leb
asel
ine
On
eg
irl;
age
4y
ears
;A
UT
Ho
me
SG
D;
Nat
ura
list
icF
req
uen
cyo
fch
alle
ng
ing
beh
avio
r,re
qu
esti
ng
atte
nti
on
,co
rrec
tp
ron
ou
n
use
,an
din
corr
ect
pro
no
un
use
Ch
alle
ng
ing
beh
avio
rs
dec
reas
edan
du
seo
f
VO
CA
incr
ease
d
8P
has
ech
ang
e
com
par
iso
ns
IRD
ran
ge:
(.2
9–
1.0
)
Rei
chle
etal
.(2
00
5)
Mu
ltip
lep
rob
eO
ne
man
;ag
e
40
yea
rs;
AU
T,
DD
Ho
me
PIC
;te
ach
er-l
edP
erce
nta
ge
of
pic
ture
req
ues
ts
Req
ues
tsfo
rh
elp
and
task
com
ple
tio
nin
crea
sed
3p
has
ech
ang
e
com
par
iso
ns
IRD
ran
ge:
(.0
0–
.20
)
Sch
epis
etal
.(1
99
8)
Mu
ltip
lep
rob
e
acro
ssp
arti
cip
ants
and
tim
e
Th
ree
bo
ys
and
on
eg
irl;
ages
3–
5y
ears
;
AU
T
Cla
ssro
om
(sel
f-
con
tain
ed)
SG
D;
nat
ura
list
icN
um
ber
of
com
mu
nic
ativ
e
inte
ract
ion
sp
erm
inu
te
All
par
tici
pan
tsd
isp
lay
ed
anin
crea
sein
com
mu
nic
ativ
e
inte
ract
ion
su
sin
gV
OC
A
6p
has
ech
ang
e
com
par
iso
ns
IRD
ran
ge:
all
=1
.0
J Autism Dev Disord (2012) 42:60–74 65
123
Ta
ble
1co
nti
nu
ed
Au
tho
rsS
ing
le-c
ase
des
ign
Par
tici
pan
t(s)
Set
tin
gIn
terv
enti
on
&
teac
hin
gm
eth
od
Tar
get
beh
avio
ral
ou
tco
me(
s)
Su
mm
ary
of
resu
lts
Qu
alit
yo
fre
sear
ch
Sch
loss
eret
al.
(19
98
)
Ad
apte
dal
tern
atin
g
trea
tmen
t
On
eb
oy
;ag
e
10
yea
rs;
AU
T
Sch
oo
lli
bra
ry;
clas
sro
om
(sel
f-
con
tain
ed)
SG
D;
teac
her
-led
Per
cen
tag
eo
fw
ord
ssp
elle
d
corr
ectl
yan
dco
rrec
t
lett
erse
qu
ence
s
Sp
eech
ou
tpu
tal
on
ean
din
com
bin
atio
nw
ith
feed
bac
kle
adto
the
hig
hes
tin
crea
sein
corr
ect
spel
lin
gan
dle
tter
seq
uen
ces
22
Ph
ase
chan
ge
com
par
iso
ns
IRD
ran
ge:
(.0
0–
1.0
)
Sch
loss
eret
al.
(20
07
)
Alt
ern
atin
g
trea
tmen
t
Fiv
eb
oy
s;ag
es
8–
10
yea
rs;
AU
T,
DD
Cla
ssro
om
(sel
f-
con
tain
ed)
SG
D;
teac
her
-led
Per
cen
tag
eo
fco
rrec
t
req
ues
tsan
dco
rrec
t
elic
ited
vo
cali
zati
on
s
All
par
tici
pan
tssh
ow
ed
imp
rov
emen
tin
corr
ect
req
ues
tsin
on
eo
rth
e
oth
erco
nd
itio
n.
On
lyo
ne
stu
den
tim
pro
ved
in
elic
ited
vo
cali
zati
on
s
6P
has
ech
ang
e
com
par
iso
ns
IRD
ran
ge:
(.8
0–
.89
)
Sch
loss
eran
d
Bli
sch
ak(2
00
4)
Ad
apte
dal
tern
atin
g
trea
tmen
t
Fo
ur
bo
ys;
ages
8–
12
yea
rs;
AU
T
Cla
ssro
om
(sel
f-
con
tain
ed)
SG
D;
teac
her
-led
Per
cen
tag
eo
fw
ord
ssp
elle
d
corr
ectl
yan
dco
rrec
t
lett
erse
qu
ence
s
All
fou
rp
arti
cip
ants
reac
hed
crit
erio
nin
on
eo
r
the
oth
erin
terv
enti
on
met
ho
d
24
Ph
ase
chan
ge
com
par
iso
ns
IRD
ran
ge:
(.0
0–
1.0
)
Sig
afo
os
etal
.(2
00
4)
Mu
ltip
leb
asel
ine
acro
ssp
arti
cip
ants
On
eb
oy
and
on
e
wo
man
;ag
es
16
and
20
;
AU
T,
DD
,
PD
D,
HI
Vo
cati
on
altr
ain
ing
pro
gra
mo
ffice
;
clas
sro
om
(sel
f-
con
tain
ed)
SG
D;
nat
ura
list
icP
erce
nta
ge
of
corr
ect
SG
D
use
SG
Du
sein
crea
sed
and
gen
eral
ized
too
ther
skil
ls
8P
has
ech
ang
e
com
par
iso
ns
IRD
ran
ge:
(.1
4–
1.0
)
Sig
afo
os
etal
.(2
00
4)
Del
ayed
mu
ltip
le
bas
elin
eac
ross
par
tici
pan
ts
Tw
ob
oy
san
d
on
eg
irl;
ages
12
–2
0y
ears
;
AU
T,
PD
D
Vo
cati
on
altr
ain
ing
pro
gra
mo
ffice
;
clas
sro
om
(sel
f-
con
tain
ed)
SG
D;
teac
her
-led
Per
cen
tag
eo
fco
rrec
tS
GD
use
All
par
tici
pan
tsle
arn
edto
use
the
SG
Dan
dlo
cate
the
dev
ice
wh
enn
ot
imm
edia
tely
avai
lab
le
3P
has
ech
ang
e
com
par
iso
ns
IRD
ran
ge:
all
=1
.0
Th
om
pso
net
al.
(19
98
)
Rev
ersa
lO
ne
bo
y;
age
7y
ears
;D
D,
PD
D
Cla
ssro
om
in
ho
spit
al
PIC
;te
ach
er-l
edR
ate
and
per
cen
tag
eo
f
inte
rval
so
fch
alle
ng
ing
beh
avio
r
Ch
alle
ng
ing
beh
avio
rsw
ere
red
uce
das
com
mu
nic
atio
nsk
ills
incr
ease
d
2p
has
ech
ang
e
com
par
iso
ns
IRD
ran
ge:
(.0
0&
.64
)
Tin
can
i(2
00
4)
Alt
ern
atin
g
trea
tmen
t
On
eb
oy
and
on
e
gir
l;ag
es5
and
6y
ears
;A
UT
,
DD
,P
DD
Cla
ssro
om
(sel
f-
con
tain
ed)
PE
CS
;ch
ild
-led
Per
cen
tag
eo
fp
ictu
re
req
ues
tsan
dv
oca
liza
tio
ns
On
ep
arti
cip
ant
resp
on
ded
mo
rest
ron
gly
toP
EC
S
wh
ile
the
oth
erre
spo
nd
ed
mo
rep
osi
tiv
ely
tosi
gn
lan
gu
age.
Vo
cali
zati
on
incr
ease
dfo
rb
oth
par
tici
pan
ts
8P
has
ech
ang
e
com
par
iso
ns
IRD
ran
ge:
(.7
3–
1.0
)
66 J Autism Dev Disord (2012) 42:60–74
123
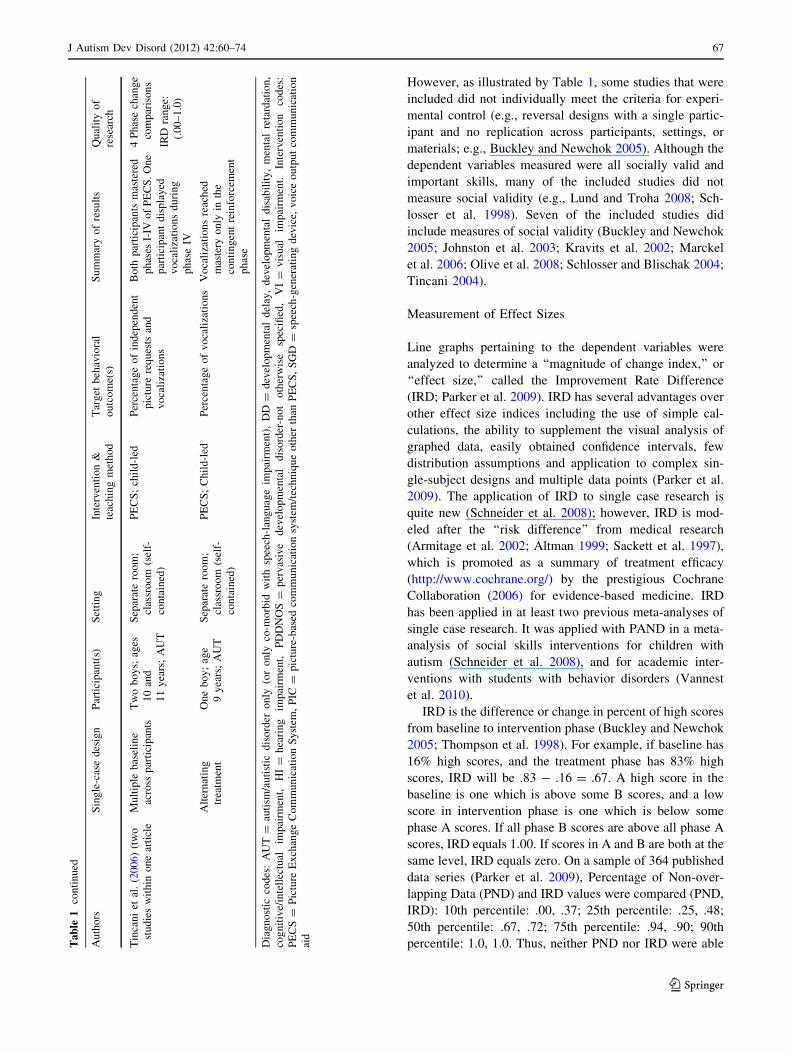
However, as illustrated by Table 1, some studies that were
included did not individually meet the criteria for experi-
mental control (e.g., reversal designs with a single partic-
ipant and no replication across participants, settings, or
materials; e.g., Buckley and Newchok 2005). Although the
dependent variables measured were all socially valid and
important skills, many of the included studies did not
measure social validity (e.g., Lund and Troha 2008; Sch-
losser et al. 1998). Seven of the included studies did
include measures of social validity (Buckley and Newchok
2005; Johnston et al. 2003; Kravits et al. 2002; Marckel
et al. 2006; Olive et al. 2008; Schlosser and Blischak 2004;
Tincani 2004).
Measurement of Effect Sizes
Line graphs pertaining to the dependent variables were
analyzed to determine a ‘‘magnitude of change index,’’ or
‘‘effect size,’’ called the Improvement Rate Difference
(IRD; Parker et al. 2009). IRD has several advantages over
other effect size indices including the use of simple cal-
culations, the ability to supplement the visual analysis of
graphed data, easily obtained confidence intervals, few
distribution assumptions and application to complex sin-
gle-subject designs and multiple data points (Parker et al.
2009). The application of IRD to single case research is
quite new (Schneider et al. 2008); however, IRD is mod-
eled after the ‘‘risk difference’’ from medical research
(Armitage et al. 2002; Altman 1999; Sackett et al. 1997),
which is promoted as a summary of treatment efficacy
(http://www.cochrane.org/) by the prestigious Cochrane
Collaboration (2006) for evidence-based medicine. IRD
has been applied in at least two previous meta-analyses of
single case research. It was applied with PAND in a meta-
analysis of social skills interventions for children with
autism (Schneider et al. 2008), and for academic inter-
ventions with students with behavior disorders (Vannest
et al. 2010).
IRD is the difference or change in percent of high scores
from baseline to intervention phase (Buckley and Newchok
2005; Thompson et al. 1998). For example, if baseline has
16% high scores, and the treatment phase has 83% high
scores, IRD will be .83 - .16 = .67. A high score in the
baseline is one which is above some B scores, and a low
score in intervention phase is one which is below some
phase A scores. If all phase B scores are above all phase A
scores, IRD equals 1.00. If scores in A and B are both at the
same level, IRD equals zero. On a sample of 364 published
data series (Parker et al. 2009), Percentage of Non-over-
lapping Data (PND) and IRD values were compared (PND,
IRD): 10th percentile: .00, .37; 25th percentile: .25, .48;
50th percentile: .67, .72; 75th percentile: .94, .90; 90th
percentile: 1.0, 1.0. Thus, neither PND nor IRD were ableTa
ble
1co
nti
nu
ed
Au
tho
rsS
ing
le-c
ase
des
ign
Par
tici
pan
t(s)
Set
tin
gIn
terv
enti
on
&
teac
hin
gm
eth
od
Tar
get
beh
avio
ral
ou
tco
me(
s)
Su
mm
ary
of
resu
lts
Qu
alit
yo
f
rese
arch
Tin
can
iet
al.
(20
06)
(tw
o
stu
die
sw
ith
ino
ne
arti
cle
Mu
ltip
leb
asel
ine
acro
ssp
arti
cip
ants
Tw
ob
oy
s;ag
es
10
and
11
yea
rs;
AU
T
Sep
arat
ero
om
;
clas
sro
om
(sel
f-
con
tain
ed)
PE
CS
;ch
ild
-led
Per
cen
tag
eo
fin
dep
end
ent
pic
ture
req
ues
tsan
d
vo
cali
zati
on
s
Bo
thp
arti
cip
ants
mas
tere
d
ph
ases
I-IV
of
PE
CS
.O
ne
par
tici
pan
td
isp
lay
ed
vo
cali
zati
on
sd
uri
ng
ph
ase
IV
4P
has
ech
ang
e
com
par
iso
ns
IRD
ran
ge:
(.0
0–
1.0
)
Alt
ern
atin
g
trea
tmen
t
On
eb
oy
;ag
e
9y
ears
;A
UT
Sep
arat
ero
om
;
clas
sro
om
(sel
f-
con
tain
ed)
PE
CS
;C
hil
d-l
edP
erce
nta
ge
of
vo
cali
zati
on
sV
oca
liza
tio
ns
reac
hed
mas
tery
on
lyin
the
con
tin
gen
tre
info
rcem
ent
ph
ase
Dia
gn
ost
icco
des
:A
UT
=au
tism
/au
tist
icd
iso
rder
on
ly(o
ro
nly
co-m
orb
idw
ith
spee
ch-l
ang
uag
eim
pai
rmen
t),
DD
=d
evel
op
men
tal
del
ay,
dev
elo
pm
enta
ld
isab
ilit
y,
men
tal
reta
rdat
ion
,
cog
nit
ive/
inte
llec
tual
imp
airm
ent,
HI
=h
eari
ng
imp
airm
ent,
PD
DN
OS
=p
erv
asiv
ed
evel
op
men
tal
dis
ord
er-n
ot
oth
erw
ise
spec
ified
,V
I=
vis
ual
imp
airm
ent.
Inte
rven
tio
nco
des
:
PE
CS
=P
ictu
reE
xch
ang
eC
om
mu
nic
atio
nS
yst
em,
PIC
=p
ictu
re-b
ased
com
mu
nic
atio
nsy
stem
/tec
hn
iqu
eo
ther
than
PE
CS
,S
GD
=sp
eech
-gen
erat
ing
dev
ice,
vo
ice
ou
tpu
tco
mm
un
icat
ion
aid
J Autism Dev Disord (2012) 42:60–74 67
123
to discriminate among the most successful interventions.
IRD could discriminate among the least successful inter-
ventions, but PND could not.
The IRD has a maximum value of 1.00 (no data-overlap
between phases), and a chance-level of .50, which means that
half of the phase A scores are larger than half of the B scores,
which would be chance level change between phases. If users
so wish, the IRD can be easily converted to a 0–100 range,
where zero indicates chance level (2 * IRDold - 100 =
IRDnew) (Parker et al. 2009). Parker et al. interpreted IRD
scores by comparing IRD calculations to visual analysis of
data for 166 single case data sets, suggesting the following
guidelines: IRD of approximately .50 or lower indicates
small or questionable effects, IRD scores between approxi-
mately .50 and .70 are considered moderate effects, and IRD
scores of approximately .70 or .75 or higher are considered to
be large or very large effects. See Parker et al. for more
detailed directions and examples for calculating IRD.
IRD Calculations
IRD calculations and their 84% confidence intervals for
each research question are specified in Table 2. A confi-
dence interval (CI) is a necessity for effect sizes, especially
with small N studies (Thompson 2002, 2007; Fidler and
Thompson 2001; Fowler 1985). The CI describes the
degree of precision of an obtained score (the IRD, in this
case). For an obtained IRD of .71, and a 90% CI of
.62 \\ .71 � .80, we can be 90% certain that the true IRD
lies somewhere between .62 and .80.
The 84% CI has very useful properties. First, for judging
the precision of an individual IRD, an 84% confidence
limit is liberal enough to permit decision-making within a
clinical setting (e.g., changing or intensifying treatments)
when those decisions are not high-stakes. But more
importantly, comparing two 84% CIs for interval overlap is
equivalent to making an inference test of differences at
p = .05 (Schenker and Gentleman 2001; Payton et al.
2003; Browne 1979; Goldstein and Healy 1995; Payton
et al. 2000). Thus, visual tests of significance are possible
by comparing the CIs of any IRD pair in Figure 2.
Inter-Observer Agreement (IOA) for Effect Size
Calculations
All of the 24 included articles had multiple IRD phase
comparisons. For example, several studies included mul-
tiple clients and targeted outcomes. This resulted in a total
of 191 individual IRD calculations. One hundred twenty-
two (64%) were independently calculated by two of the
authors. IOA was calculated by dividing the number of
agreements (111) by the total number of IRD calculations
(122) and multiplying by 100, resulting in an overall IOA
of 91%. Disagreements were discussed and recalculated
until both authors agreed. Once a high rate of agreement
was attained (over 90%), the remaining IRD calculations
were made by one author. The few errors that existed were
due to difficult to view crowded graphs, counting errors,
and incorrect hand calculations. PND was calculated for
each comparison as well. Twenty percent were indepen-
dently calculated by two of the authors, resulting in an
overall IOA of 97%
Results
Descriptive Summary of Studies Included
in the Analyses
Participants
Overall, 58 individuals participated in the studies. Thirty-
seven (64%) of the participants had a diagnosis or met
diagnostic criteria for autistic disorder; four (7%) were
diagnosed with PDD-NOS; seven (12%) were diagnosed
with autism and other developmental disabilities (e.g.,
intellectual disability); four (7%) had diagnoses of PDD-
NOS and developmental disabilities; and five (9%) had
diagnoses of autism, developmental disabilities, and sen-
sory impairments (e.g., hearing impairments). Regarding
age, 27 (47%) of the participants were preschool-aged (up
to age 5 years), 18 (31%) were elementary-aged (ages
6–10 years), 7 (12%) were secondary-school aged (ages
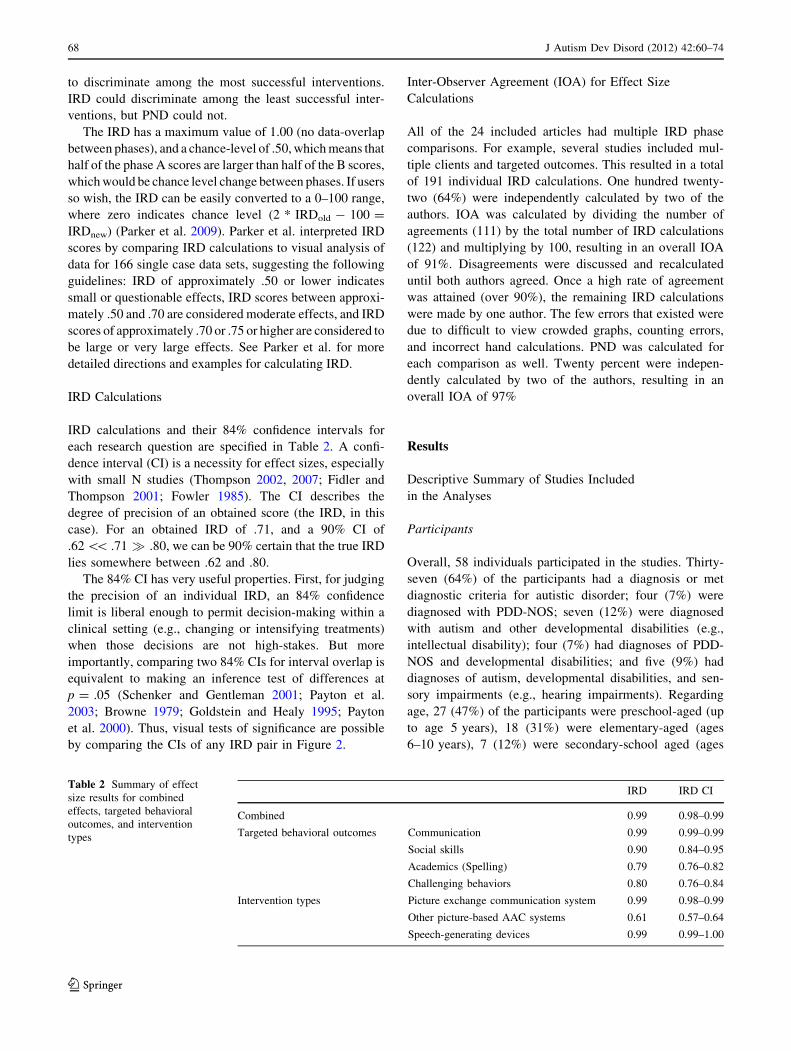
Table 2 Summary of effect
size results for combined
effects, targeted behavioral
outcomes, and intervention
types
IRD IRD CI
Combined 0.99 0.98–0.99
Targeted behavioral outcomes Communication 0.99 0.99–0.99
Social skills 0.90 0.84–0.95
Academics (Spelling) 0.79 0.76–0.82
Challenging behaviors 0.80 0.76–0.84
Intervention types Picture exchange communication system 0.99 0.98–0.99
Other picture-based AAC systems 0.61 0.57–0.64
Speech-generating devices 0.99 0.99–1.00
68 J Autism Dev Disord (2012) 42:60–74
123
11–15 years), and 6 (10%) were categorized as young
adults or adults (over age 15 years).
Settings
The studies were conducted in various settings. Fifteen
(63%) of the 24 studies were conducted in schools or
school-like settings (e.g., clinics with classroom set-ups).
Of those, 10 (42%) included treatment in self-contained
special education classrooms; seven (29%) included treat-
ment in separate, isolated rooms (e.g., therapy rooms,
assessment suites); two (8%) included treatment within
general education settings; and one (4%) was unspecific
(e.g., classroom at participants’ schools). Four (17%)
studies were conducted in preschools for typically devel-
oping children. Seven (29%) were conducted in home
settings. One (4%) study was conducted in a classroom
within a hospital and one (4%) in the school library. Some
of the studies included phases in multiple settings or par-
ticipants within a single study were treated within different
settings, thus, the percentages sum to greater than 100%.
Targeted Behavioral Outcomes
The dependent variables investigated in the studies inclu-
ded communication skills (e.g., making requests verbally,
with pictures, or via an SGD; symbol comprehension; non-
word vocalizations); social interaction skills (e.g., sponta-
neous social initiations); academics (the only academic
skill assessed was spelling); and challenging behaviors
(e.g., aggression). Twenty of the studies (83%) investigated
the effects of intervention on communication skills, two
studies (8%) investigated effects on social skills, two (8%)
investigated impact on academics, and five studies (21%)
investigated challenging behaviors. Many of the studies
included data on multiple dependent variables, so the sum
of the percentages is greater than 100%.
It was hypothesized that because AAC interventions
target communication skills, the treatments overall would
have generally high effects on these skills. Further, while
AAC interventions may not primarily target social skills,
because communication and social interaction are linked
(e.g., Carr and Felce 2007), it was hypothesized that AAC
interventions would have at least moderate effects on social
skills as well. Challenging behaviors are often communi-
cative in nature, thus, it was also hypothesized that for
participants who engaged in challenging behaviors, AAC
interventions may have some effect on challenging
behaviors (Thompson et al. 1998). However, this would not
be the case for every participant, some of whom engaged in
challenging behaviors for functions other than communi-
cating requests for preferred items or activities, which are
the primary target behaviors of AAC interventions for
individuals with ASD. For example, some participants may
engage in challenging behaviors to escape interactions or for
self-stimulation. Finally, individuals with ASD often have
difficulties with academic tasks due to difficulties commu-
nicating, thus, it was hypothesized that AAC interventions
may have moderate effects on academic skills.
Intervention Types
The interventions included three categories of aided AAC
systems: (a) PECS, (b) picture-based systems other than
PECS, and (c) SGDs. Nine of the included studies (38%)
involved implementation of PECS (Frost and Bondy 1994,
2002). Seven of the studies (29%) involved use of other
aided, picture-based AAC systems (PIC). That is, these
involved pointing to or exchanging pictures, but did not
involve the same structured instructional protocol and had
varied instructional procedures that did not have instruc-
tional manuals. The other eight studies (33%) involved the
use of various procedures to teach participants to use
SGDs. As with the PIC studies, the SGD studies did not
adhere to a single instructional manual or protocol.
It was hypothesized that each of these interventions
would have large effects on overall targeted behaviors.
However, because PECS includes an instructional manual
and protocol (Frost and Bondy 2002) and the researchers
and teachers who implemented PECS in the included
studies typically had attended PECS training, it was
anticipated that PECS would have larger effects than either
of the other two intervention types, which were imple-
mented following no single instructional protocol or
instructional manual.
Overall Effects of AAC on Targeted Behavioral Outcomes
The first research question was the simplest, asking about
overall average effects of AAC, despite variations in targeted
outcomes. An average effect size was computed by meta-
analysis software (Meta module in NCSS, Hintze 2010), by
weighting individual IRD results by the inverse of their
standard error (Wolf 1986). This is perhaps the most popular
method of combining results in meta-analyses (Rosenberg
et al. 2000; Rosenthal 1991). Standard error is SD/sqrt(N), so
two elements drove the weighting: N and SD. IRD results
were weighted most heavily when scores had low variability
and data series were long. When multiple clients within one
study received identical treatments (IVs) and were measured
on identical outcomes (DVs), their results were combined
within-study for a single result with greater precision
(because of the larger number of data points). The IRD cal-
culated for overall effects of AAC (IRD = 0.99) indicates
large effects. Further, the 84% confidence interval is narrow,
strengthening the argument that the use of AAC has positive
J Autism Dev Disord (2012) 42:60–74 69
123
effects on behaviors of individuals with ASD. Overall PND
calculations ranged from 0% to 100%, with a median of 76%,
indicating that aided AAC is an effective treatment (Scruggs
and Mastropieri 1998).
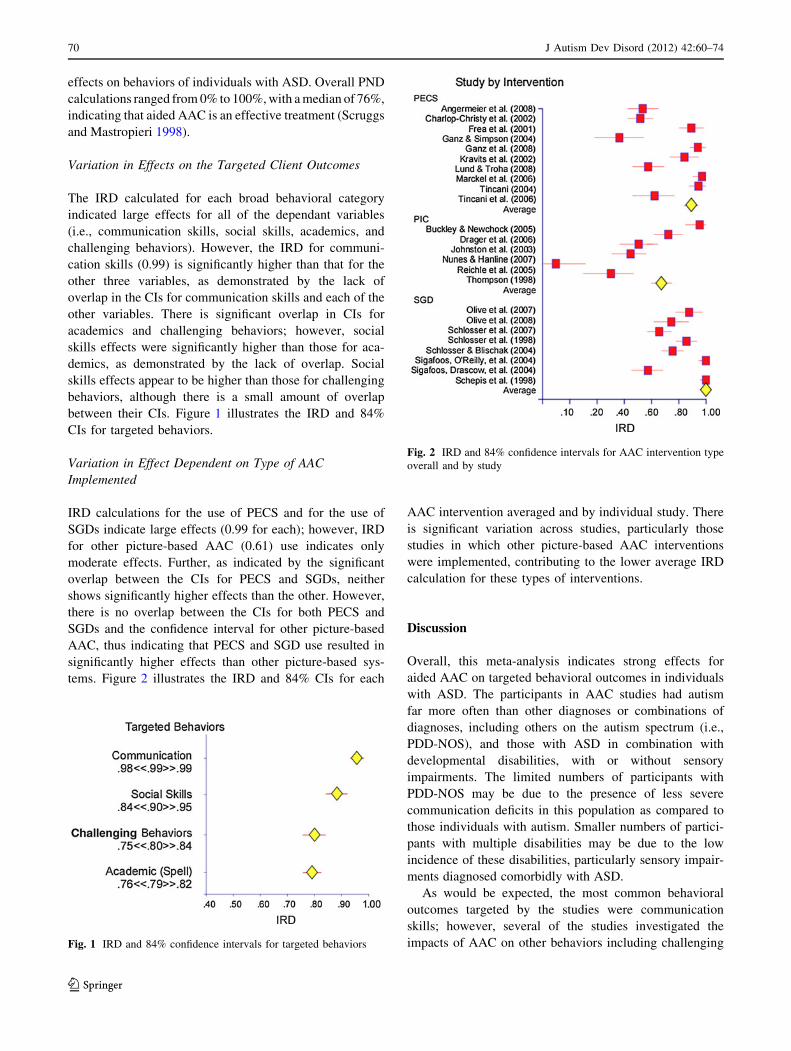
Variation in Effects on the Targeted Client Outcomes
The IRD calculated for each broad behavioral category
indicated large effects for all of the dependant variables
(i.e., communication skills, social skills, academics, and
challenging behaviors). However, the IRD for communi-
cation skills (0.99) is significantly higher than that for the
other three variables, as demonstrated by the lack of
overlap in the CIs for communication skills and each of the
other variables. There is significant overlap in CIs for
academics and challenging behaviors; however, social
skills effects were significantly higher than those for aca-
demics, as demonstrated by the lack of overlap. Social
skills effects appear to be higher than those for challenging
behaviors, although there is a small amount of overlap
between their CIs. Figure 1 illustrates the IRD and 84%
CIs for targeted behaviors.
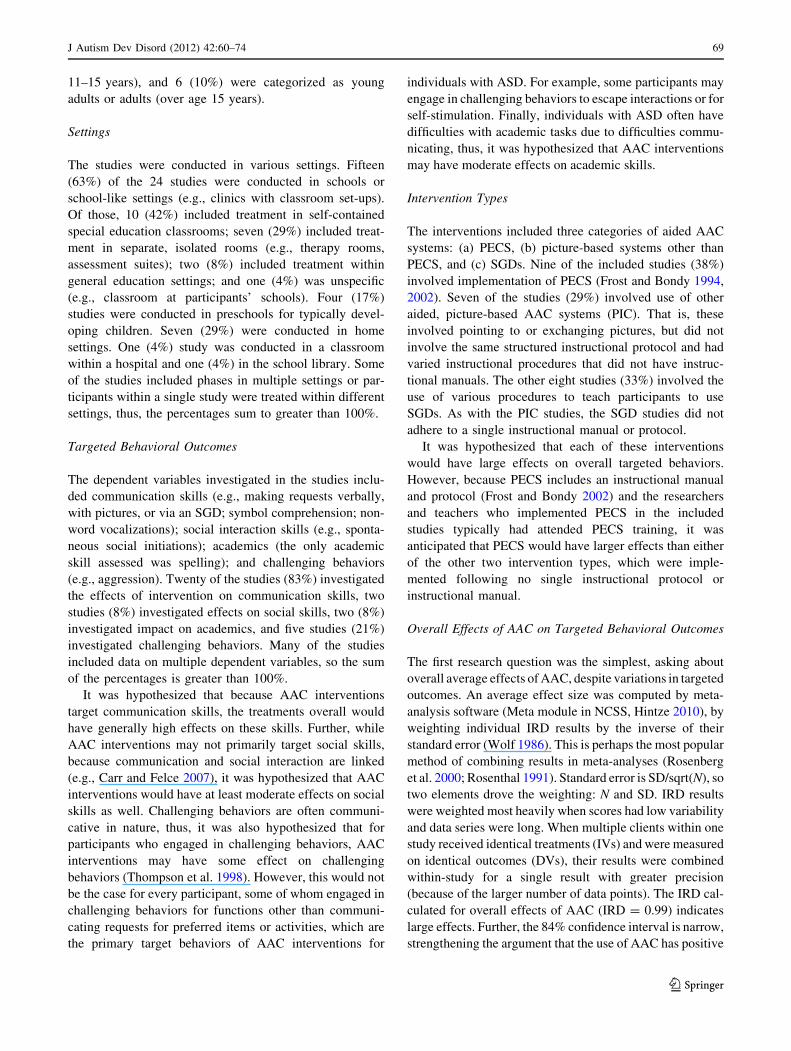
Variation in Effect Dependent on Type of AAC
Implemented
IRD calculations for the use of PECS and for the use of
SGDs indicate large effects (0.99 for each); however, IRD
for other picture-based AAC (0.61) use indicates only
moderate effects. Further, as indicated by the significant
overlap between the CIs for PECS and SGDs, neither
shows significantly higher effects than the other. However,
there is no overlap between the CIs for both PECS and
SGDs and the confidence interval for other picture-based
AAC, thus indicating that PECS and SGD use resulted in
significantly higher effects than other picture-based sys-
tems. Figure 2 illustrates the IRD and 84% CIs for each
AAC intervention averaged and by individual study. There
is significant variation across studies, particularly those
studies in which other picture-based AAC interventions
were implemented, contributing to the lower average IRD
calculation for these types of interventions.
Discussion
Overall, this meta-analysis indicates strong effects for
aided AAC on targeted behavioral outcomes in individuals
with ASD. The participants in AAC studies had autism
far more often than other diagnoses or combinations of
diagnoses, including others on the autism spectrum (i.e.,
PDD-NOS), and those with ASD in combination with
developmental disabilities, with or without sensory
impairments. The limited numbers of participants with
PDD-NOS may be due to the presence of less severe
communication deficits in this population as compared to
those individuals with autism. Smaller numbers of partici-
pants with multiple disabilities may be due to the low
incidence of these disabilities, particularly sensory impair-
ments diagnosed comorbidly with ASD.
As would be expected, the most common behavioral
outcomes targeted by the studies were communication
skills; however, several of the studies investigated the
impacts of AAC on other behaviors including challengingFig. 1 IRD and 84% confidence intervals for targeted behaviors
Fig. 2 IRD and 84% confidence intervals for AAC intervention type
overall and by study
70 J Autism Dev Disord (2012) 42:60–74
123
behaviors, social skills, and academic skills. As illustrated in
Fig. 1, the impact of AAC on communication skills appears
to be greater than for other behavior categories; however,
AAC seems to positively impact social skills, challenging
behaviors, and spelling. Although the effects were not as
strong as those for communication skills, it appears that
improving communication may lead to improved social
interaction and academics and decreased challenging
behavior. It may be that because communication and social
interaction are closely related, improvements in one results
in related improvements in the other. Another explanation
could be that AAC, though primarily targeting communi-
cation, also may address social interaction by teaching a
social approach in order to communicate.
Further, when challenging behaviors function to com-
municate desire for an item or attention, or to escape an
activity or attention, providing a more conventional means
of communicating (e.g., simulated voice) may result in
decreased challenging behaviors due to the efficiency of
the new form of communication. For example, giving a
picture to request candy may result in faster access to
candy than a tantrum. Finally, improvements in academic
skills may result from improved communication in indi-
viduals who might otherwise be able to perform such tasks
if not for difficulty communicating knowledge.
Effect sizes calculated for social skills, academic skills
(spelling), and challenging behaviors should be viewed
with caution considering the small number of studies that
investigated each of these variables. This points to the need
for future research to investigate the effects of AAC on
skills other than communication skills. Several more
studies must be conducted before results may be meta-
analyzed with confidence.
There was significant variation in IRD measures across
studies, particularly for those involving implementation of
other picture-based AAC strategies. The two studies with the
lowest effect sizes (Reichle et al. 2005; Thompson et al. 1998)
involved single participants, which contributed to wide CIs as
well. Further, these studies included participants with both
developmental delays and autism. Further, the studies with
the lowest effect sizes within each AAC category included
some of those with the oldest participants (Lund and Troha
2008; Reichle et al. 2005; Sigafoos et al. 2004). Older par-
ticipants who have not previously learned basic communi-
cation skills may be more difficult to teach as they age.
Future research should investigate several questions. In
particular, additional research is needed to thoroughly
evaluate the effects of AAC interventions on social skills,
challenging behaviors, and academic skills. The effects on
academic skills have rarely been investigated. Research is
needed that investigates instructional elements of AAC
interventions that are most effective. There may be several
aspects of AAC intervention types, particularly PECS and
SGDs, that are particularly effective, such as the use of
pictures versus written words or the implementation of a
standardized treatment protocol. Research should investi-
gate if different types of symbols have an impact on tar-
geted behavioral objectives, whether participants within
particular ASD categories respond better to AAC inter-
ventions, and whether the age during which intervention
commences impacts its effectiveness. Research is also
warranted to teach out the differential effects of different
types of AAC systems and instructional variables, such as
symbol iconicity, display layouts and organization, selec-
tion techniques, and instructional procedures.
There were some limitations to this meta-analysis.
Although we included several variables, beyond communi-
cation skills, in this investigation, of course, the effects on
these outcomes were considered only when the researchers
collected data on those target outcomes. Many of the included
studies only measured communication skills; thus, these
studies or others may have found different effects on these
variables if they had been analyzed and interpretation of
effects on these outcomes variables is limited. This meta-
analysis was limited to single case studies; therefore, by
excluding group studies, the scope of this investigation is
reduced in that it does not summarize all available evidence
on the effects of AAC interventions. Further, the authors
recognize that there is a publication bias in favor of pub-
lishing studies with positive results; thus, it is a limitation that
this meta-analysis only included published works and
excluded unpublished dissertations and theses. This meta-
analysis is limited in that it only included research on aided
AAC interventions for individuals with ASD; thus, it did not
investigate the effects of unaided AAC, such as manual sign
language, which has been successfully implemented with
individuals with ASD (e.g., Tincani 2004). The participants
included in the studies were primarily preschool and ele-
mentary-aged; thus, this analysis is limited in its applicability
to older individuals. Finally, some researchers may consider
the use of 84% confidence intervals to be too generous; small
numbers (N = 58) in the study, the use of a new effect size
measure, and wide confidence intervals requires readers to be
cautious in interpreting the results of this analysis.
References
References marked with an asterisk indicate studies
included in the meta-analysis.
Allison, D. B., & Gorman, B. S. (1993). Calculating effect sizes for
meta-analysis: The case of the single case. Behaviour Researchand Therapy, 31, 621–631.
J Autism Dev Disord (2012) 42:60–74 71
123
Altman, D. G. (1999). Practical statistics for medical research.
Bristol, UK: Chapman & Hall.
American Psychiatric Association [APA]. (2000). Diagnostic andstatistical manual of mental disorders (4th Ed., text rev.).
Washington, DC: Author.
American Speech-Language-Hearing Association [ASHA]. (1997).
Augmentative and alternative communication (AAC). Retrieved
from http://www.asha.org/public/speech/disorders/AAC.htm.
*Angermeier, K., Schlosser, R. W., Luiselli, J. K., Harrington, C., &
Carter, B. (2008). Effects of iconicity on requesting with the
picture exchange communication system in children with autism
spectrum disorder. Research in Autism Spectrum Disorders, 2,
430–446.
Armitage, P., Berry, G., & Matthews, J. N. S. (2002). Statisticalmethods in medical research (4th ed.). Malden, Massachusetts:
Blackwell Science.
Banda, D. R., & Therrien, W. J. (2008). A teacher’s guide to meta-
analysis. Teaching Exceptional Children, 41, 66–71.
Beck, A. R., Stoner, J. B., Bock, S., & Parton, T. (2008). Comparison
of PECS and the use of a VOCA: A replication. Education andTraining in Developmental Disabilities, 43, 198–216.
Beretvas, S. N., & Chung, H. (2008). A review of single-subject
design meta-analyses: Methodological issues and practice.
Evidence-Based Communication Assessment and Intervention,2, 129–141.
Bondy, A., & Frost, L. A. (2002). A pictures worth: PECS andother visual communication strategies in autism. Bethesda,
MD: Woodbine House.
Browne, R. H. (1979). On visual assessment of the significance of a
mean difference. Biometrics, 35, 657–665.
*Buckley, S. D., & Newchok, D. K. (2005). Differential impact of
response effort within a response chain on use of mands in a
student with autism. Research in Developmental Disabilities, 26,
77–85.
Carr, D., & Felce, J. (2007). Brief report: The effects of PECS
teaching to phase III on the communicative interactions between
children with autism and their teachers. Journal of Autism andDevelopmental Disorders, 37, 724–737.
Centers for Disease Control and Prevention (CDC). (2007). Preva-
lence of —autism spectrum disorders—Autism and Develop-
mental Disabilities Monitoring Network, 14 Sites, United States,
2002. MMWR SS 2007; 56(No.SS-1). Retrieved August 28,
2009, from http://www.cdc.gov/mmwr/preview/mmwrhtml/
ss5601a2.htm.
*Charlop-Christy, M. H., Carpenter, M., Le, L., LeBlanc, L. A., &
Kellet, K. (2002). Using the picture exchange communication
system (PECS) with children with autism: Assessment of PECS
acquisition, speech, social-communication behavior, and prob-
lem behavior. Journal of Applied Behavior Analysis, 35,
213–231.
Cochrane Collaboration (2006). Retrieved May 18, 2006, from
http://www.cochrane.org/.
*Drager, K. D. R., Postal, V. J., Carrolus, L., Castellano, M.,
Gagliano, C., & Glynn, J. (2006). The effect of aided language
modeling on symbol comprehension and production in two
preschoolers with autism. American Journal of Speech-Lan-guage Pathology, 15, 112–125.
Fidler, F., & Thompson, B. (2001). Computing correct confi-
dence intervals for ANOVA fixed- and random-effects effect
sizes. Educational and Psychological Measurement, 61,
575–604.
Fowler, R. J. (1985). Point estimates and confidence intervals in
measures of association. Psychological Bulletin, 98, 160–165.
*Frea, W. D., Arnold, C. L., & Vittimberga, G. L. (2001). A
demonstration of the effects of augmentative communication on
the extreme aggressive behavior of a child with autism within an
integrated preschool setting. Journal of Positive BehaviorInterventions, 3, 194–198.
Frost, L., & Bondy, A. (1994). The picture exchange communicationsystem training manual. Cherry Hill, NJ: Pyramid EducationalConsultants, Inc.
Frost, L., & Bondy, A. (2002). The picture exchange communicationsystem training manual (2nd ed.). Cherry Hill, NJ: Pyramid
Educational Consultants.
Ganz, J. B., Parker, R., & Benson, J. (2009). The impact of the picture
exchange communication system: Effects on communication and
collateral effects on maladaptive behaviors. Augmentative andAlternative Communication, 25, 250–261.
Ganz, J. B., Sigafoos, J., Simpson, R. L., & Cook, K. E. (2008a).
Generalization of a pictorial alternative communication system
across instructors and distance. Augmentative and AlternativeCommunication, 24, 89–99.
*Ganz, J. B., & Simpson, R. L. (2004). Effects on communicative
requesting and speech development of the picture exchange
communication system in children with characteristics of autism.
Journal of Autism and Developmental Disorders, 34, 395–409.
*Ganz, J. B., Simpson, R. L., & Corbin-Newsome, J. (2008b). The
impact of the picture exchange communication system on
requesting and speech development in preschoolers with autism
spectrum disorders and similar characteristics. Research inAutism Spectrum Disorders, 2, 157–169.
Glass, G. V. (1976). Primary, secondary, and meta-analysis of
research. Educational Researcher, 5, 3–8.
Goldstein, H., & Healy, M. J. R. (1995). The graphical presentation of
a collection of means. Journal of the Royal Statistical Society,158, 175–177.
Hintze, J. (2010). NCSS (Number Cruncher Statistical System), NCSS,‘‘Meta-analysis Module’’ LLC. Kaysville, Utah. www.ncss.com.
Horner, R. H., Carr, E. G., Halle, J., McGee, G., Odom, S., & Wolery,
M. (2005). The use of single-subject research to identify
evidence-based practice in special education. Exceptional Chil-dren, 71, 165–179.
Individuals with Disabilities Education Improvement Act Regula-
tions, 34 C.F.R. § 300.35 et seq. (2004).*Johnston, S., Nelson, C., Evans, J., & Palazolo, K. (2003). The use of
visual supports in teaching young children with autism spectrum
disorder to intiate interactions. Augmentative and AlternativeCommunication, 19, 86–103.
Jones, V., & Prior, M. (1985). Motor imitation abilities and
neurological signs in autistic children. Journal of Autism andDevelopmental Disorders, 15, 37–46.
Kavale, K. A. (1984). Potential advantages of the meta-analysis
technique for research in special education. Journal of SpecialEducation, 18, 61–72.
Kavale, K. A. (1998). Some methods are more effective than others.
Intervention in School and Clinic, 33, 195–200.
Kavale, K. A. (2001). Meta-analysis: A primer. Exceptionality, 9,
177–183.
*Kravits, T. R., Kamps, D. M., Kemmerer, K., & Potucek, J. (2002).
Brief report: Increasing communication skills for an elementary-
aged student with autism using the picture exchange communi-
cation system. Journal of Autism and Developmental Disorders,32, 225–230.
*Lund, S. K., & Troha, J. M. (2008). Teaching young people who are
blind and have autism to make requests using a variation on the
picture exchange communication system with tactile symbols: A
preliminary investigation. Journal of Autism and DevelopmentalDisorders, 38, 719–730.
*Marckel, J. M., Need, N. A., & Ferreri, S. J. (2006). A preliminary
analysis of teaching improvisation with the picture exchange
communication system to children with autism. Journal ofApplied Behavior Analysis, 39, 109–115.
72 J Autism Dev Disord (2012) 42:60–74
123
Marquis, J. G., Horner, R. H., Carr, E. G., Turnbull, A. P., Thompson,
M., Behrens, G. A., et al. (2000). A meta-analysis of positive
behavior support. In R. Gersten, E. Schiller, S. Vaughn, &
J. Schumm (Eds.), Contemporary special education research:Syntheses of knowledge base on critical instructional issues(pp. 137–178). Mahwah, NJ: Lawrence Erlbaum.
Mirenda, P. (2001). Autism, augmentative communication and
assistive technology: What do we really know? Focus on Autismand Other Developmental Disabilities, 16(3), 141–151.
Mirenda, P. (2003). Towards functional augmentative and alternative
communication for students with autism: Manual signs, graphic
symbols, and voice output communication aids. Language,Speech, and Hearing Services in Schools, 34, 203–216.
No Child Left Behind Act of 2001, 20 U.S.C. 70 §6301 et seq. (2002)
*Nunes, D., & Hanline, M. F. (2007). Enhancing the alternative and
augmentative communication use of a child with autism through
a parent implemented naturalistic intervention. InternationalJournal of Disability, Development and Education, 54, 177–197.
Ogletree, B. T., & Oren, T. (2006). How to use augmentative andalternative communication. Austin, TX: Pro-Ed.
*Olive, M. L., Cruz, B. d. l., Davis, T. N., Chan, J. M., Lang, R. B., &
O’Reilly, M. F., et al. (2007). The effects of enhanced milieu
teaching and a voice output communication aid on the requesting
of three children with autism. Journal of Autism and Develop-mental Disorders, 37, 1505–1513.
*Olive, M. L., Lang, R. B., & Davis, T. N. (2008). An analysis of the
effects of functional communication and a voice output
communication aid for a child with autism spectrum disorder.
Research in Autism Spectrum Disorders, 2, 223–236.
Parker, R. I., Hagan-Burke, S., & Vannest, K. (2007). Percentage of
all non-overlapping data (PAND): An alternative to PND. TheJournal of Special Education, 40, 194–204.
Parker, R. I., Vannest, K. J., & Brown, L. (2009). The improvement
rate difference for single case research. Exceptional Children,75, 135–150.
Payton, M. E., Greenstone, M. H., & Schenker, N. (2003). Overlap-
ping confidence intervals or standard error intervals: What do
they mean in terms of statistical significance? Journal of InsectScience, 3(34), 1–6.
Payton, M. E., Miller, A. E., & Raun, W. R. (2000). Testing statistical
hypotheses using standard error bars and confidence intervals.
Communications in Soil Science and Plant Analysis, 31, 547–552.
*Reichle, J., McComas, J., Dahl, N., Solberg, G., Pierce, S., & Smith,
D. (2005). Teaching an individual with severe intellectual delay
to request assistance conditionally. Educational Psychology, 25,
275–286.
Reichow, B., Volkmar, F. R., & Cicchetti, D. V. (2008). Development
of the evaluative methods for evaluating and determining
evidence-based practices in autism. Journal of Autism andDevelopmental Disorders, 38, 1311–1319. doi:
10.1007/s10803-007-0517-7.
Rosenberg, M. S., Adams, D. C., & Gurevitch, J. (2000). MetaWin2.0. [Computer software]. Sunderland, MA: Sinauer Associates.
Rosenthal, R. (1991). Meta-analysis procedures for social scienceresearch. Beverly Hills, CA: Sage.
Rotholz, D. A., et al. (1989). Functionality of two modes of
communication in the community by students with develop-
mental disabilities: A comparison of signing and communication
books. Journal of the Association for Persons with SevereHandicaps, 14, 227–233.
Sackett, D. L., Richardson, W. S., Rosenberg, W., & Haynes, R. B.
(Eds.). (1997). Evidence-based medicine: How to practice andteach EBM. London: Churchill Livingstone.
Schenker, N., & Gentleman, J. F. (2001). On judging the significance
of differences by examining overlap between confidence inter-
vals. The American Statistician, 55, 182–186.
*Schepis, M. M., Reid, D. H., Behrmann, M. M., & Sutton, K. A.
(1998). Increasing communicative interactions of young children
with autism using a voice output communication aid and
naturalistic teaching. Journal of Applied Behavior Analysis, 31,
561–578.
*Schlosser, R. W., & Blischak, D. M. (2004). Effects of speech and
print feedback on spelling by children with autism. Journal ofSpeech, Language and Hearing Research, 47, 848–862.
*Schlosser, R. W., Blischak, D. M., Belfiore, P. J., Bartley, C., &
Barnett, N. (1998). Effects of synthetic speech output and
orthographic feedback on spelling in a student with autism: A
preliminary study. Journal of Autism and Developmental Disor-ders, 28, 309–319.
Schlosser, R. W., & Sigafoos, J. (2009). Navigating evidence-based
information sources in augmentative and alternative communi-
cation. Augmentative and Alternative Communication, 25,
225–235.
*Schlosser, R. W., Sigafoos, J., Luiselli, J. K., Angermeier, K.,
Harasymowyz, U., & Schooley, K., et al. (2007). Effects of
synthetic speech output on requesting and natural speech
production in children with autism: A preliminary study.
Research in Autism Spectrum Disorders, 1, 139–163.
Schneider, N., Goldstein, H., & Parker, R. (2008). Social skills
interventions for children with autism: A meta-analytic applica-
tion of percentage of all non-overlapping data (PAND).
Evidence-Based Communication Assessment and Intervention,2, 152–162.
Schuler, A. L., & Baldwin, M. (1981). Nonspeech communication
and childhood autism. Language, Speech, and Hearing Servicesin the Schools, 12, 246–257.
Scruggs, T. E. (1992). Single subject methodology in the study of
learning and behavioral disorders: Design, analysis and synthe-
sis. In T. E. Scruggs & M. A. Mastropieri (Eds.), Advances inlearning and behavioral disabilities (Vol. 7, pp. 223–248).
Greenwich, CT: JAI Press.
Scruggs, T. E., & Mastropieri, M. A. (1998). Summarizing single-
subject research: Issues and applications. Behavior Modification,22, 221–242.
Scruggs, T. E., & Mastropieri, M. A. (2001). How to summarize
single-participant research: Ideas and applications. Exceptional-ity, 9, 227–244.
Scruggs, T. E., Mastropieri, M. A., & Casto, G. (1987).
The quantitative synthesis of single-subject research: Method-
ology and validation. Remedial and Special Education, 8(2),
24–33.
Seal, B. C., & Bonvillian, J. D. (1997). Sign language and motor
functioning in students with autistic disorder. Journal of Autismand Developmental Disorders, 27, 437–466.
*Sigafoos, J., Drasgow, E., Halle, J. W., O’Reilly, M., Seely-York, S.,
& Edrisinha, C., et al. (2004). Teaching VOCA use as a
communicative repair strategy. Journal of Autism and Develop-mental Disorders, 34, 411–422.
*Sigafoos, J., O’Reilly, M., Seely-York, S., & Edrisinha, C. (2004).
Teaching students with developmental disabilities to locate their
AAC device. Research in Developmental Disabilities, 25,
371–383.
Simpson, R. L. (2005). Evidence-based practices and students with
autism spectrum disorders. Focus on Autism and Other Devel-opmental Disabilities, 20, 140–149.
Simpson, R. L. (2008). Children and youth with autism spectrum
disorders: The search for effective methods. Focus on Excep-tional Children, 40, 1–14.
Simpson, R. L., McKee, M., Teeter, D., & Beytien, A. (2007).
Evidence-based methods for children and youth with autism
spectrum disorders: Stakeholder issues and perspectives. Excep-tionality, 15, 203–217.
J Autism Dev Disord (2012) 42:60–74 73
123
Tankersley, M., Cook, B. G., & Cook, L. (2008). A preliminary
examination to identify the presence of quality indicators in
single-subject research. Education and Treatment of Children,31, 523–548.
Thompson, B. (2002). What future quantitative social science
research could look like: Confidence intervals for effect sizes.
Educational Researcher, 31, 24–31.
Thompson, B. (2007). Effect sizes, confidence intervals, and confi-
dence intervals for effect sizes. Psychology in the Schools, 44,
423–432.
*Thompson, R. H., Fisher, W. W., Piazza, C. C., & Kuhn, D. E.
(1998). The evaluation and treatment of aggression maintained
by attention and automatic reinforcement. Journal of AppliedBehavior Analysis, 31, 103–116.
*Tincani, M. (2004). Comparing the picture exchange communication
system and sign language training for children with autism.
Focus on Autism and Other Developmental Disabilities, 19,
152–163.
*Tincani, M., Crozier, S., & Alazetta, L. (2006). The Picture
Exchange Communication System: Effects on manding and
speech development for school-aged children with autism.
Education and Training in Developmental Disabilities, 41,
177–184.
Vannest, K. J., Harrison, J., Parker, R., Harvey, K. T., & Ramsey, L.
(2010). Improvement rate differences of academic interventions
for students with emotional and behavioral disorders. Remedialand Special Education. doi:10.1177/0741932510362509.
Wendt, O. (2009). Research on the use of manual signs and graphic
symbols in autism spectrum disorders: A systematic review. In
P. Mirenda & T. Iacono (Eds.), Autism spectrum disorders andAAC. Baltimore, MD: Paul H. Brookes Publishing Co.
White, D. M., Rusch, F. R., Kazdin, A. E., & Hartman, D. P. (1989).
Applications of meta-analysis in individual subject research.
Behavioral Assessment, 11, 281–296.
Wolf, F. M. (1986). Meta-analysis: Quantitative methods for researchsynthesis. Beverly Hills, CA: Sage.
Yoder, P., & Stone, W. L. (2006a). A randomized comparison of the
effect of two prelinguistic communication interventions on the
acquisition of spoken communication in preschoolers with ASD.
Journal of Speech. Language and Hearing Research, 49(4),
698–711.
Yoder, P., & Stone, W. L. (2006b). Randomized comparison of two
communication interventions for preschoolers with autism
spectrum disorders. Journal of Counseling and Clinical Psy-chology, 74(3), 426–435.
74 J Autism Dev Disord (2012) 42:60–74
123
Related Documents