IOP PUBLISHING JOURNAL OF NEURAL ENGINEERING J. Neural Eng. 6 (2009) 036003 (10pp) doi:10.1088/1741-2560/6/3/036003 A MEMS-based flexible multichannel ECoG-electrode array Birthe Rubehn 1 , Conrado Bosman 2 , Robert Oostenveld 2 , Pascal Fries 2 and Thomas Stieglitz 1 1 Laboratory for Biomedical Microtechnology, Department of Microsystems Engineering—IMTEK, University of Freiburg, Freiburg, Germany 2 Donders Institute for Brain, Cognition and Behaviour, Radboud University Nijmegen, Nijmegen, The Netherlands E-mail: [email protected] Received 12 February 2009 Accepted for publication 16 April 2009 Published 12 May 2009 Online at stacks.iop.org/JNE/6/036003 Abstract We present a micromachined 252-channel ECoG (electrocorticogram)-electrode array, which is made of a thin polyimide foil substrate enclosing sputtered platinum electrode sites and conductor paths. The array subtends an area of approximately 35 mm by 60 mm and is designed to cover large parts of a hemisphere of a macaque monkey’s cortex. Eight omnetics connectors are directly soldered to the foil. This leads to a compact assembly size which enables a chronic implantation of the array and allows free movements of the animal between the recording sessions. The electrode sites are 1 mm in diameter and were characterized by electrochemical impedance spectroscopy. At 1 kHz, the electrode impedances vary between 1.5 k and 5 k. The yield of functioning electrodes in three assembled devices is 99.5%. After implantation of a device with 100% working electrodes, standard electrocorticographic signals can be obtained from every electrode. The response to visual stimuli can be measured with electrodes lying on the visual cortex. After an implantation time of 4.5 months, all electrodes are still working and no decline in signal quality could be observed. (Some figures in this article are in colour only in the electronic version) 1. Introduction The brain is anatomically and functionally organized into separated regions. However, several studies support the notion that brain regions interact during information processing [1–3]. Thus, one of the major goals in neuroscience research is to determine the mechanisms that are responsible for neuronal interaction between several neuronal populations [4]. An interesting brain signal in the study of neuronal communication over large areas in the brain is the local field potential (LFP). The LFP is a measure of pre- and postsynaptic activity within a volume of neuronal tissue [5, 6]. Several studies showed that significant LFP modulations are related to sensory processing, motor planning, visuomotor interactions and higher cognitive functions such as attention, memory and decision making [7–13]. LFPs appear to convey relevant information that is not present in neuronal spike activity [10, 14, 15]. In addition, LFP fluctuations are also closely correlated with haemodynamic changes measured by functional magnetic resonance imaging (fMRI) [16] and underlie the generation of electroencephalographic (EEG) and magnetoencephalographic (MEG) measurements [17]. Thus, using techniques that are able to record LFP signals from large parts of the brain might help to understand the underlying mechanisms that allow the neuronal population interaction. For that purpose, we developed a micromachined ECoG- electrode array which contains 252 electrode sites to cover large expanses of the cortex of a macaque’s cortex. Electrode arrays made for recording electrocorticograms are already widely used in research as well as in clinical therapy. Besides understanding fundamental brain functions, scientists are interested in how brain signals can be used in therapy to treat neurological disorders such as paralysis by using brain–machine interfaces [18, 19]. In clinical practice, 1741-2560/09/036003+10$30.00 1 © 2009 IOP Publishing Ltd Printed in the UK

Welcome message from author
This document is posted to help you gain knowledge. Please leave a comment to let me know what you think about it! Share it to your friends and learn new things together.
Transcript
IOP PUBLISHING JOURNAL OF NEURAL ENGINEERING
J. Neural Eng. 6 (2009) 036003 (10pp) doi:10.1088/1741-2560/6/3/036003
A MEMS-based flexible multichannelECoG-electrode arrayBirthe Rubehn1, Conrado Bosman2, Robert Oostenveld2, Pascal Fries2
and Thomas Stieglitz1
1 Laboratory for Biomedical Microtechnology, Department of Microsystems Engineering—IMTEK,University of Freiburg, Freiburg, Germany2 Donders Institute for Brain, Cognition and Behaviour, Radboud University Nijmegen, Nijmegen,The Netherlands
E-mail: [email protected]
Received 12 February 2009Accepted for publication 16 April 2009Published 12 May 2009Online at stacks.iop.org/JNE/6/036003
AbstractWe present a micromachined 252-channel ECoG (electrocorticogram)-electrode array, whichis made of a thin polyimide foil substrate enclosing sputtered platinum electrode sites andconductor paths. The array subtends an area of approximately 35 mm by 60 mm and isdesigned to cover large parts of a hemisphere of a macaque monkey’s cortex. Eight omneticsconnectors are directly soldered to the foil. This leads to a compact assembly size whichenables a chronic implantation of the array and allows free movements of the animal betweenthe recording sessions. The electrode sites are 1 mm in diameter and were characterized byelectrochemical impedance spectroscopy. At 1 kHz, the electrode impedances vary between1.5 k� and 5 k�. The yield of functioning electrodes in three assembled devices is 99.5%.After implantation of a device with 100% working electrodes, standard electrocorticographicsignals can be obtained from every electrode. The response to visual stimuli can be measuredwith electrodes lying on the visual cortex. After an implantation time of 4.5 months, allelectrodes are still working and no decline in signal quality could be observed.
(Some figures in this article are in colour only in the electronic version)
1. Introduction
The brain is anatomically and functionally organized intoseparated regions. However, several studies support the notionthat brain regions interact during information processing[1–3]. Thus, one of the major goals in neuroscience researchis to determine the mechanisms that are responsible forneuronal interaction between several neuronal populations[4]. An interesting brain signal in the study of neuronalcommunication over large areas in the brain is the localfield potential (LFP). The LFP is a measure of pre- andpostsynaptic activity within a volume of neuronal tissue[5, 6]. Several studies showed that significant LFPmodulations are related to sensory processing, motor planning,visuomotor interactions and higher cognitive functions such asattention, memory and decision making [7–13]. LFPs appearto convey relevant information that is not present in neuronal
spike activity [10, 14, 15]. In addition, LFP fluctuations arealso closely correlated with haemodynamic changes measuredby functional magnetic resonance imaging (fMRI) [16] andunderlie the generation of electroencephalographic (EEG) andmagnetoencephalographic (MEG) measurements [17]. Thus,using techniques that are able to record LFP signals from largeparts of the brain might help to understand the underlyingmechanisms that allow the neuronal population interaction.
For that purpose, we developed a micromachined ECoG-electrode array which contains 252 electrode sites to coverlarge expanses of the cortex of a macaque’s cortex. Electrodearrays made for recording electrocorticograms are alreadywidely used in research as well as in clinical therapy.Besides understanding fundamental brain functions, scientistsare interested in how brain signals can be used in therapyto treat neurological disorders such as paralysis by usingbrain–machine interfaces [18, 19]. In clinical practice,
1741-2560/09/036003+10$30.00 1 © 2009 IOP Publishing Ltd Printed in the UK
J. Neural Eng. 6 (2009) 036003 B Rubehn et al
ECoG-electrode arrays are implanted onto the cortex tolocate the seizure focus during the pre-surgical diagnosisof epilepsy [20]. While in clinical practice commerciallyavailable arrays (Ad-Tech Medical Instrument Corporation,Racine, WI, USA) with electrode diameters and electrodepitches in the millimetre scale are used, researchers inmedicine and engineering try to scale down the dimensionsto micrometre size. This is in order to obtain a higher spatialresolution of brain signals from the cortex, which can berealized by using MEMS (microelectromechanical systems)technology. In the past few years, numerous groups presentedprecision-engineered or MEMS-based electrode arrays. Withprecision engineering, it is possible to reduce the dimensionsof an electrode array. But implementing a large number ofelectrodes, that are individually connected to wires forminga bulky cable, leads to a large and rigid device which cannotbe chronically implanted [21]. With MEMS-processing, it iseasy to arrange a large number of microelectrodes inside asmall area. But even most of the microarrays described in theliterature do not have a larger number of electrodes, limitedby the assembly. Even if the electrode array is processedon the wafer level, cables and connectors are still necessaryto connect the electrodes to a measurement setup. Oftenmicroarrays are joined to printed circuit boards or to a bunchof cables making the microdevice bulky and rigid [22–25].Most micromachined arrays have electrodes distributed overa small area with a small electrode pitch. Therewith, a highspatial resolution is obtained but the cortex region from whichmeasurements can be taken is limited to the small array area[21–23]. If recordings over larger areas of the brain are needed,most micromachined arrays fail because they only cover asmall brain area. In small animals, a micromachined electrodearray can cover a rat’s motor cortex [24] but cannot be usedfor larger cortex areas.
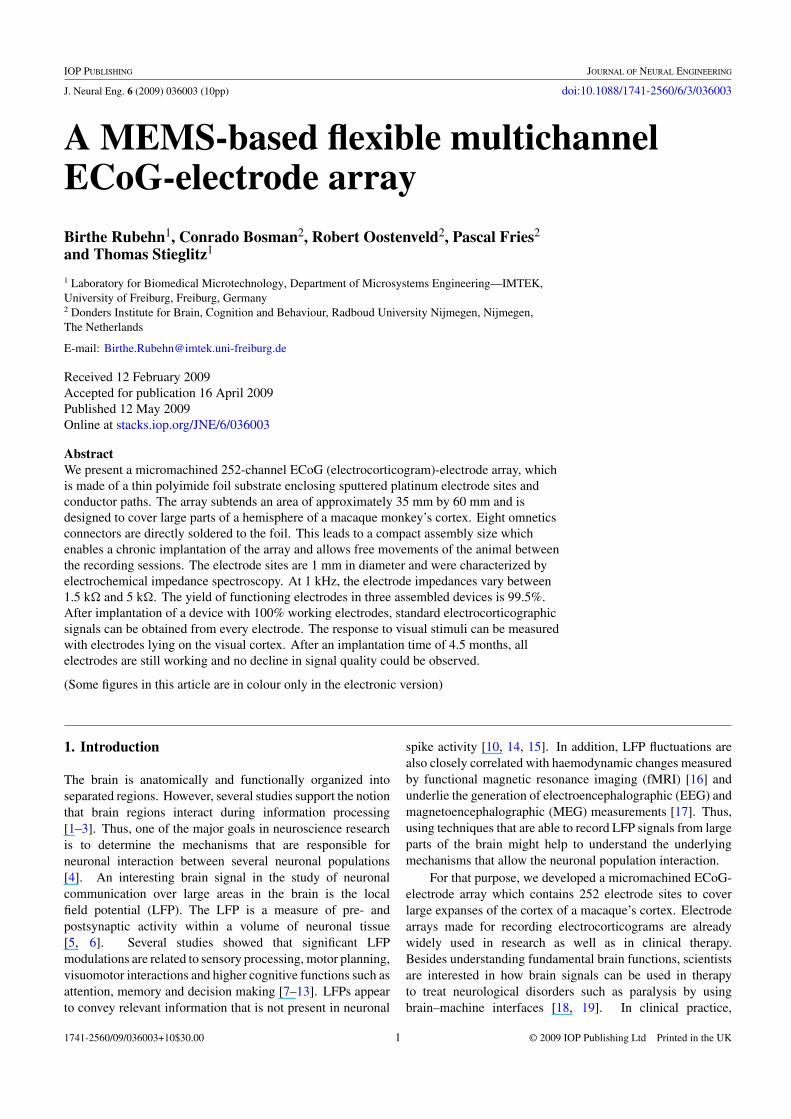
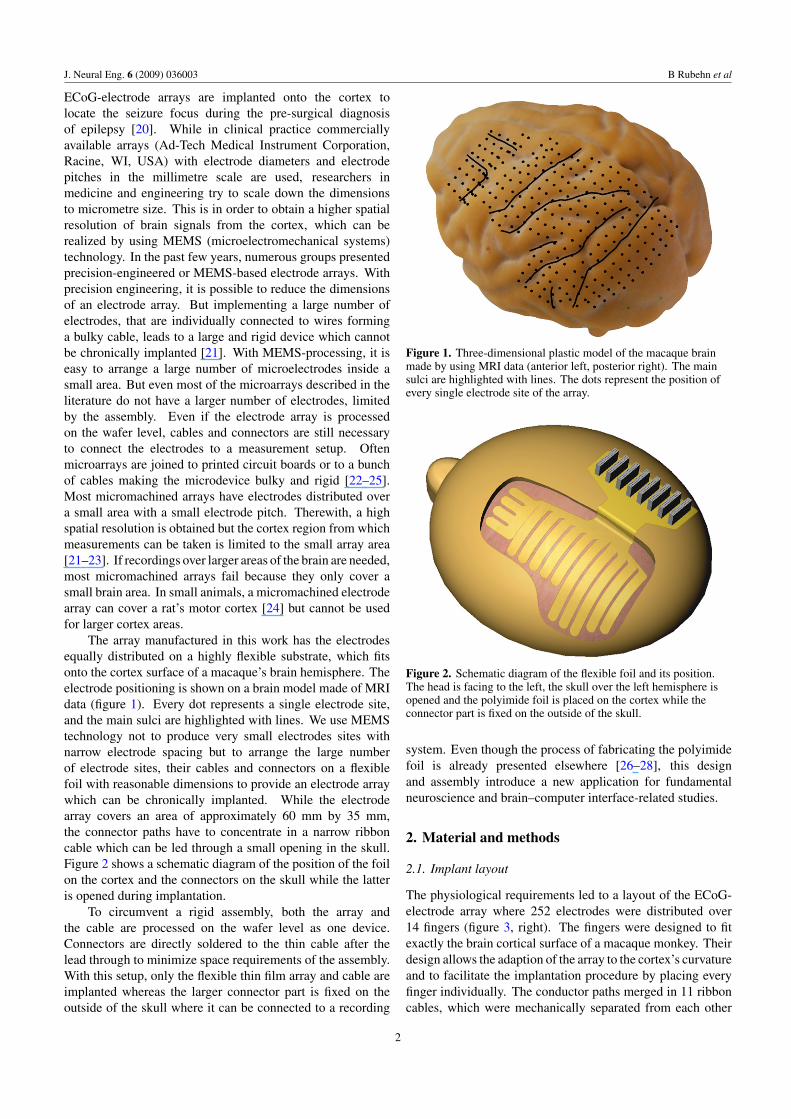
The array manufactured in this work has the electrodesequally distributed on a highly flexible substrate, which fitsonto the cortex surface of a macaque’s brain hemisphere. Theelectrode positioning is shown on a brain model made of MRIdata (figure 1). Every dot represents a single electrode site,and the main sulci are highlighted with lines. We use MEMStechnology not to produce very small electrodes sites withnarrow electrode spacing but to arrange the large numberof electrode sites, their cables and connectors on a flexiblefoil with reasonable dimensions to provide an electrode arraywhich can be chronically implanted. While the electrodearray covers an area of approximately 60 mm by 35 mm,the connector paths have to concentrate in a narrow ribboncable which can be led through a small opening in the skull.Figure 2 shows a schematic diagram of the position of the foilon the cortex and the connectors on the skull while the latteris opened during implantation.
To circumvent a rigid assembly, both the array andthe cable are processed on the wafer level as one device.Connectors are directly soldered to the thin cable after thelead through to minimize space requirements of the assembly.With this setup, only the flexible thin film array and cable areimplanted whereas the larger connector part is fixed on theoutside of the skull where it can be connected to a recording
Figure 1. Three-dimensional plastic model of the macaque brainmade by using MRI data (anterior left, posterior right). The mainsulci are highlighted with lines. The dots represent the position ofevery single electrode site of the array.
Figure 2. Schematic diagram of the flexible foil and its position.The head is facing to the left, the skull over the left hemisphere isopened and the polyimide foil is placed on the cortex while theconnector part is fixed on the outside of the skull.
system. Even though the process of fabricating the polyimidefoil is already presented elsewhere [26–28], this designand assembly introduce a new application for fundamentalneuroscience and brain–computer interface-related studies.
2. Material and methods
2.1. Implant layout
The physiological requirements led to a layout of the ECoG-electrode array where 252 electrodes were distributed over14 fingers (figure 3, right). The fingers were designed to fitexactly the brain cortical surface of a macaque monkey. Theirdesign allows the adaption of the array to the cortex’s curvatureand to facilitate the implantation procedure by placing everyfinger individually. The conductor paths merged in 11 ribboncables, which were mechanically separated from each other
2

J. Neural Eng. 6 (2009) 036003 B Rubehn et al
(a)
(b)
Figure 3. Layout of the ECoG-array with 252 electrodes on 14 fingers (right), the ribbon cable (middle) and solder pads (left).
to enhance flexibility (figure 3, middle). The electrodes havea diameter of 1 mm with electrode pitches of 2 mm, 2.5 mmand 3 mm, respectively. The connector paths have a widthof 15 μm and a pitch of 30 μm; thus, MEMS technologyis necessary to process and to integrate the high number ofconnector paths into the electrode array foil. The connectorpaths ended in solder pads to which eight Omnetics connectors(NPD series, Omnetics Connector Corp., Minneapolis, MN,USA) can be soldered by through-hole technology. To preventthe foil from tearing, the perimeters were designed to reducemechanical stress at the notches (figures 3(a), (b)).
The substrate of the electrode array had to consist of a thinand flexible foil, which could adapt to the cortex’s curvature.For this reason, polyimide was chosen as the substrate material.It was processed as a 10 μm thick foil on the wafer level usingstandard micromachining tools and processes. Apart frombeing thin and flexible, polyimide is mechanically strong sothat a 10 μm thick foil can be handled and implanted withoutbreaking.
2.2. MEMS processing
The electrode array was made by cleanroom processing. Aftercleaning a 4′′ wafer with hydrofluoric acid for 15 s, thepolyimide U-Varnish S (UBE, Tokyo, Japan) was spin coatedat 3000 rpm for 30 s. To evaporate the solvent, the waferwas put on a hotplate for 3 min at 120 ◦C. Subsequently, thepolyimide was cured under nitrogen atmosphere at 450 ◦C for10 min (furnace: YES-459PB6-2PE-CP, Yield EngineeringSystems Inc., San Jose, CA, USA) resulting in a 5 μm
Figure 4. Process steps of the electrode array foil. (a) Polyimide isspin coated on the wafer; (b) platinum is sputtered and structured;(c) second layer of polyimide; (d) dry etching of electrode openings,solder pads and perimeters; (e) detaching the foil from the wafer.
thick layer (figure 4(a)). Hexamethyldisiloxane (HMDS) wasused as an adhesion promoter for the photoresist ma-N 1420(Micro Resist Technology GmbH, Berlin, Germany) whichwas spin coated at 2700 rpm for 30 s. The 2.1 μm thicklayer of photo resist was structured by exposing it to UVlight (mask aligner: MA6, Suss MicroTec AG, Garching,Germany) through a chromium mask. After the development(development solution: ma-D 533 S, Micro Resist Technology
3
J. Neural Eng. 6 (2009) 036003 B Rubehn et al
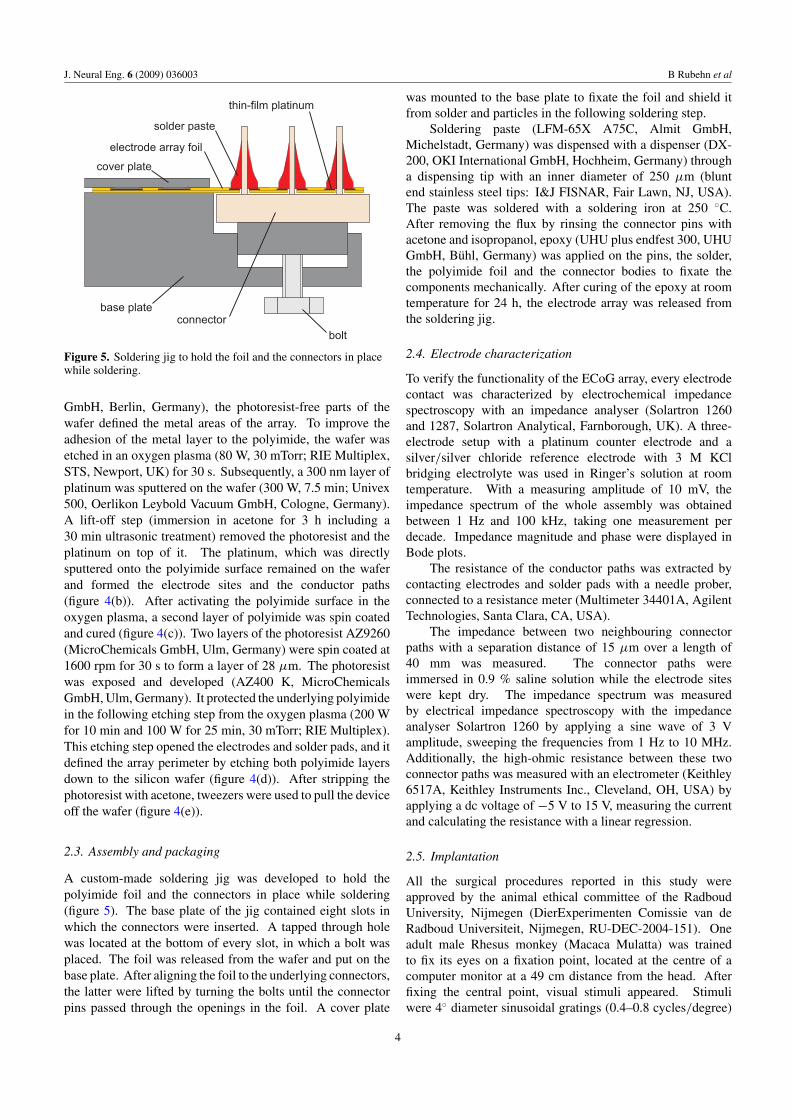
Figure 5. Soldering jig to hold the foil and the connectors in placewhile soldering.
GmbH, Berlin, Germany), the photoresist-free parts of thewafer defined the metal areas of the array. To improve theadhesion of the metal layer to the polyimide, the wafer wasetched in an oxygen plasma (80 W, 30 mTorr; RIE Multiplex,STS, Newport, UK) for 30 s. Subsequently, a 300 nm layer ofplatinum was sputtered on the wafer (300 W, 7.5 min; Univex500, Oerlikon Leybold Vacuum GmbH, Cologne, Germany).A lift-off step (immersion in acetone for 3 h including a30 min ultrasonic treatment) removed the photoresist and theplatinum on top of it. The platinum, which was directlysputtered onto the polyimide surface remained on the waferand formed the electrode sites and the conductor paths(figure 4(b)). After activating the polyimide surface in theoxygen plasma, a second layer of polyimide was spin coatedand cured (figure 4(c)). Two layers of the photoresist AZ9260(MicroChemicals GmbH, Ulm, Germany) were spin coated at1600 rpm for 30 s to form a layer of 28 μm. The photoresistwas exposed and developed (AZ400 K, MicroChemicalsGmbH, Ulm, Germany). It protected the underlying polyimidein the following etching step from the oxygen plasma (200 Wfor 10 min and 100 W for 25 min, 30 mTorr; RIE Multiplex).This etching step opened the electrodes and solder pads, and itdefined the array perimeter by etching both polyimide layersdown to the silicon wafer (figure 4(d)). After stripping thephotoresist with acetone, tweezers were used to pull the deviceoff the wafer (figure 4(e)).
2.3. Assembly and packaging
A custom-made soldering jig was developed to hold thepolyimide foil and the connectors in place while soldering(figure 5). The base plate of the jig contained eight slots inwhich the connectors were inserted. A tapped through holewas located at the bottom of every slot, in which a bolt wasplaced. The foil was released from the wafer and put on thebase plate. After aligning the foil to the underlying connectors,the latter were lifted by turning the bolts until the connectorpins passed through the openings in the foil. A cover plate
was mounted to the base plate to fixate the foil and shield itfrom solder and particles in the following soldering step.
Soldering paste (LFM-65X A75C, Almit GmbH,Michelstadt, Germany) was dispensed with a dispenser (DX-200, OKI International GmbH, Hochheim, Germany) througha dispensing tip with an inner diameter of 250 μm (bluntend stainless steel tips: I&J FISNAR, Fair Lawn, NJ, USA).The paste was soldered with a soldering iron at 250 ◦C.After removing the flux by rinsing the connector pins withacetone and isopropanol, epoxy (UHU plus endfest 300, UHUGmbH, Buhl, Germany) was applied on the pins, the solder,the polyimide foil and the connector bodies to fixate thecomponents mechanically. After curing of the epoxy at roomtemperature for 24 h, the electrode array was released fromthe soldering jig.
2.4. Electrode characterization
To verify the functionality of the ECoG array, every electrodecontact was characterized by electrochemical impedancespectroscopy with an impedance analyser (Solartron 1260and 1287, Solartron Analytical, Farnborough, UK). A three-electrode setup with a platinum counter electrode and asilver/silver chloride reference electrode with 3 M KClbridging electrolyte was used in Ringer’s solution at roomtemperature. With a measuring amplitude of 10 mV, theimpedance spectrum of the whole assembly was obtainedbetween 1 Hz and 100 kHz, taking one measurement perdecade. Impedance magnitude and phase were displayed inBode plots.
The resistance of the conductor paths was extracted bycontacting electrodes and solder pads with a needle prober,connected to a resistance meter (Multimeter 34401A, AgilentTechnologies, Santa Clara, CA, USA).
The impedance between two neighbouring connectorpaths with a separation distance of 15 μm over a length of40 mm was measured. The connector paths wereimmersed in 0.9 % saline solution while the electrode siteswere kept dry. The impedance spectrum was measuredby electrical impedance spectroscopy with the impedanceanalyser Solartron 1260 by applying a sine wave of 3 Vamplitude, sweeping the frequencies from 1 Hz to 10 MHz.Additionally, the high-ohmic resistance between these twoconnector paths was measured with an electrometer (Keithley6517A, Keithley Instruments Inc., Cleveland, OH, USA) byapplying a dc voltage of −5 V to 15 V, measuring the currentand calculating the resistance with a linear regression.
2.5. Implantation
All the surgical procedures reported in this study wereapproved by the animal ethical committee of the RadboudUniversity, Nijmegen (DierExperimenten Comissie van deRadboud Universiteit, Nijmegen, RU-DEC-2004-151). Oneadult male Rhesus monkey (Macaca Mulatta) was trainedto fix its eyes on a fixation point, located at the centre of acomputer monitor at a 49 cm distance from the head. Afterfixing the central point, visual stimuli appeared. Stimuliwere 4◦ diameter sinusoidal gratings (0.4–0.8 cycles/degree)
4

J. Neural Eng. 6 (2009) 036003 B Rubehn et al
drifting unidirectionally within a circular aperture, locatedat approximately 4◦ eccentricity. One of the gratings wascued to be the target stimulus, and the monkey’s task was todetect a small change in the orientation of the target gratingto obtain reward. After reliable performance of the task, themonkey was subdurally implanted with the electrode array.Under general anaesthesia, a 6.5 cm by 4 cm craniotomy wasperformed using an Electric Pen Drive Neurospine 90 000 K(Synthes-Stratec, Solothurn, Switzerland) to expose thecomplete left hemisphere. The autoclaved (15 min at 134 ◦Cand 2 bar) electrode array was placed subdurally over the lefthemisphere. The boneflap was placed back and attached to therest of the skull with calcium phosphate bone substitute andcovered with dental acrylic.
2.6. Recordings
Recordings were started 3 weeks after the surgery. Thesignals from the 252 electrodes were amplified with again of 20 by a headstage amplifier (Headstage 32 V-G20,Plexon Inc., Dallas, TX, USA), low-pass filtered at 8 kHzand digitized at 32 kHz sampling frequency (Digital Lynx,256 channels, Neuralynx Tucson, AZ, USA). The data werepreprocessed and analysed off-line using the Fieldtrip toolbox(HTU http://www.ru.nl/neuroimaging/fieldtrip/UTH) forMatlab (The MathWorks, Inc., Natick, MA, USA). LFPactivity was obtained by low-pass filtering at 200 Hz anddownsampling to 1 kHz. To characterize the quality ofthe recorded signals, we performed a time-locked analysisand a power-spectral analysis. The time-locked analysiswas performed over data epochs containing 35 consecutivestimulus presentations. Epochs were subsequently averagedover time. Power spectral estimation was calculated foreach channel over 20 successive epochs of 3 s length. Eachepoch was tapered using discrete prolate spheroidal sequences(Slepian functions) [29]. Spectral power was then computed asan average across epochs and tapers. This multi-taper methodwas used to optimize spectral concentration. In this analysis,tapering yielded a spectral concentration of ±1 Hz aroundeach centre frequency.
3. Results
3.1. In vitro
The electrode array was successfully processed and assembled(figure 6). The soldering of the omnetics connectors to thepolyimide foil led to a 99.5% yield of properly connected,functional electrodes in three assembled devices. The fixationof the soldered connections by epoxy made the array a robustdevice that could be handled easily during characterizationand surgery. No damage of the array was observed duringassembly, measurements or implantation. The connectorpart of the array attached on the outside of the skull fitsinto a volume of 42 mm by 20 mm by 10 mm. Theelectrochemical impedance spectrograms of all 252 electrodeslocated on one electrode array are shown in figure 7. Everygrey curve represents the measurement data of one electrodesite. The average value of all electrodes is the black curve.
Figure 6. Fully assembled electrode array. The diameter of the coinis 16 mm.
Figure 7. Impedance spectra of all 252 electrodes of the array. Greylines represent single electrodes; the black line is the average of allelectrodes.
The magnitude of the electrode impedances varied from 1.5 k�
to 5 k� at 1 kHz. The resistances of the connector paths variedfrom 1 k� to 2 k� depending on the different connector paths’length. The cutoff frequency at which the impedance turnedfrom a predominantly capacitive into a resistive behaviourwas at 300 Hz. The impedance spectrogram of the electrode–electrolyte interface could be modelled with a basic electricalcircuit model: an ohmic resistance parallel to a capacitor andboth in series to a second ohmic resistance (figure 8). Fittingthis model to the measured data of an exemplary electrode(software: Zview 2.8, Scribner Associates Inc., SouthernPines, NC, USA) resulted in RF = 143 k�, CH = 377 nFand RAC = 1.7 k�, where RAC was the access resistance tothe electrode surface. This access resistance consisted of theresistance of the electrolyte as well as the resistance ofthe array’s conductor paths. RF and CH represented themetal–electrolyte interface.
The electrical impedance spectrum of the impedancebetween two neighbouring connector paths was measured and
5
J. Neural Eng. 6 (2009) 036003 B Rubehn et al
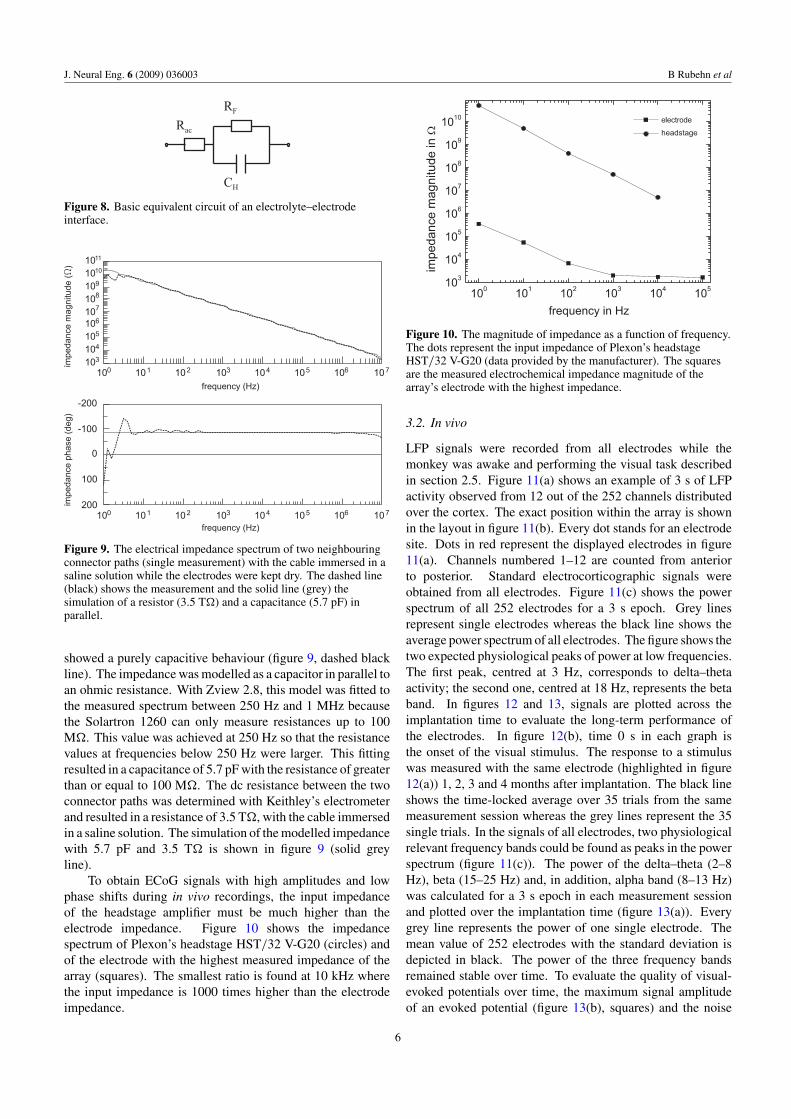
Figure 8. Basic equivalent circuit of an electrolyte–electrodeinterface.
Figure 9. The electrical impedance spectrum of two neighbouringconnector paths (single measurement) with the cable immersed in asaline solution while the electrodes were kept dry. The dashed line(black) shows the measurement and the solid line (grey) thesimulation of a resistor (3.5 T�) and a capacitance (5.7 pF) inparallel.
showed a purely capacitive behaviour (figure 9, dashed blackline). The impedance was modelled as a capacitor in parallel toan ohmic resistance. With Zview 2.8, this model was fitted tothe measured spectrum between 250 Hz and 1 MHz becausethe Solartron 1260 can only measure resistances up to 100M�. This value was achieved at 250 Hz so that the resistancevalues at frequencies below 250 Hz were larger. This fittingresulted in a capacitance of 5.7 pF with the resistance of greaterthan or equal to 100 M�. The dc resistance between the twoconnector paths was determined with Keithley’s electrometerand resulted in a resistance of 3.5 T�, with the cable immersedin a saline solution. The simulation of the modelled impedancewith 5.7 pF and 3.5 T� is shown in figure 9 (solid greyline).
To obtain ECoG signals with high amplitudes and lowphase shifts during in vivo recordings, the input impedanceof the headstage amplifier must be much higher than theelectrode impedance. Figure 10 shows the impedancespectrum of Plexon’s headstage HST/32 V-G20 (circles) andof the electrode with the highest measured impedance of thearray (squares). The smallest ratio is found at 10 kHz wherethe input impedance is 1000 times higher than the electrodeimpedance.
Figure 10. The magnitude of impedance as a function of frequency.The dots represent the input impedance of Plexon’s headstageHST/32 V-G20 (data provided by the manufacturer). The squaresare the measured electrochemical impedance magnitude of thearray’s electrode with the highest impedance.
3.2. In vivo
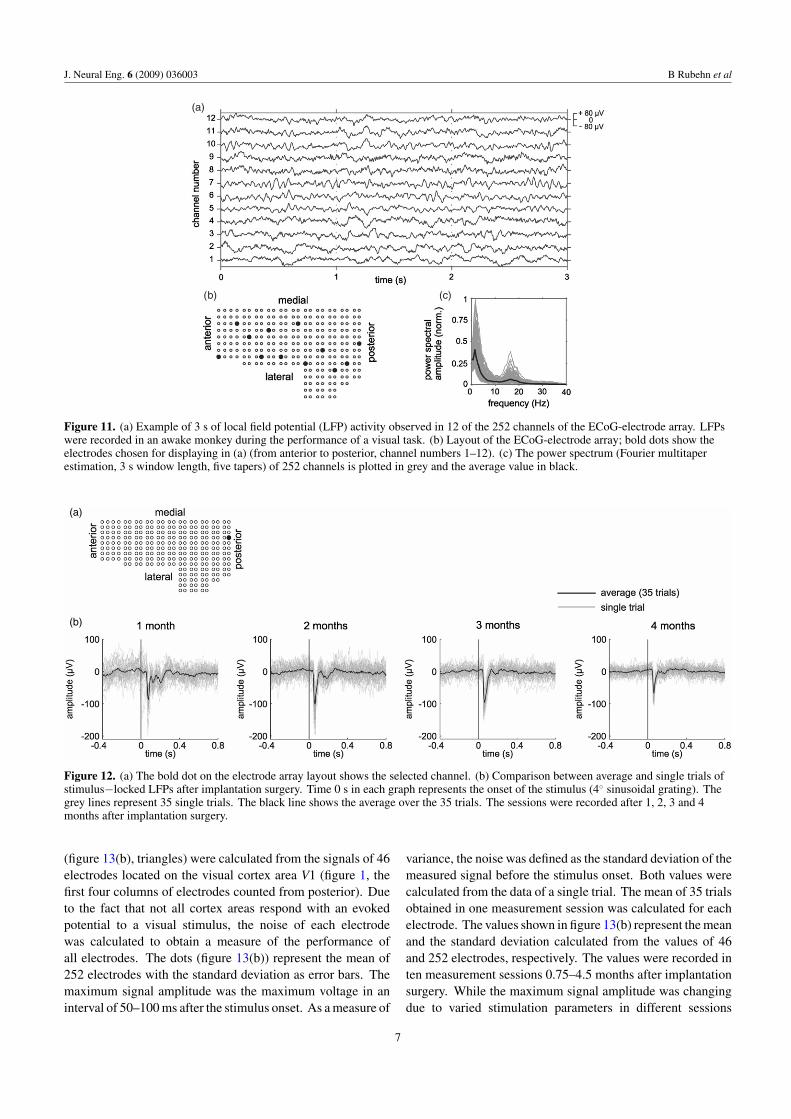
LFP signals were recorded from all electrodes while themonkey was awake and performing the visual task describedin section 2.5. Figure 11(a) shows an example of 3 s of LFPactivity observed from 12 out of the 252 channels distributedover the cortex. The exact position within the array is shownin the layout in figure 11(b). Every dot stands for an electrodesite. Dots in red represent the displayed electrodes in figure11(a). Channels numbered 1–12 are counted from anteriorto posterior. Standard electrocorticographic signals wereobtained from all electrodes. Figure 11(c) shows the powerspectrum of all 252 electrodes for a 3 s epoch. Grey linesrepresent single electrodes whereas the black line shows theaverage power spectrum of all electrodes. The figure shows thetwo expected physiological peaks of power at low frequencies.The first peak, centred at 3 Hz, corresponds to delta–thetaactivity; the second one, centred at 18 Hz, represents the betaband. In figures 12 and 13, signals are plotted across theimplantation time to evaluate the long-term performance ofthe electrodes. In figure 12(b), time 0 s in each graph isthe onset of the visual stimulus. The response to a stimuluswas measured with the same electrode (highlighted in figure12(a)) 1, 2, 3 and 4 months after implantation. The black lineshows the time-locked average over 35 trials from the samemeasurement session whereas the grey lines represent the 35single trials. In the signals of all electrodes, two physiologicalrelevant frequency bands could be found as peaks in the powerspectrum (figure 11(c)). The power of the delta–theta (2–8Hz), beta (15–25 Hz) and, in addition, alpha band (8–13 Hz)was calculated for a 3 s epoch in each measurement sessionand plotted over the implantation time (figure 13(a)). Everygrey line represents the power of one single electrode. Themean value of 252 electrodes with the standard deviation isdepicted in black. The power of the three frequency bandsremained stable over time. To evaluate the quality of visual-evoked potentials over time, the maximum signal amplitudeof an evoked potential (figure 13(b), squares) and the noise
6
J. Neural Eng. 6 (2009) 036003 B Rubehn et al
(a)
(b) (c)
Figure 11. (a) Example of 3 s of local field potential (LFP) activity observed in 12 of the 252 channels of the ECoG-electrode array. LFPswere recorded in an awake monkey during the performance of a visual task. (b) Layout of the ECoG-electrode array; bold dots show theelectrodes chosen for displaying in (a) (from anterior to posterior, channel numbers 1–12). (c) The power spectrum (Fourier multitaperestimation, 3 s window length, five tapers) of 252 channels is plotted in grey and the average value in black.
(a)
(b)
Figure 12. (a) The bold dot on the electrode array layout shows the selected channel. (b) Comparison between average and single trials ofstimulus−locked LFPs after implantation surgery. Time 0 s in each graph represents the onset of the stimulus (4◦ sinusoidal grating). Thegrey lines represent 35 single trials. The black line shows the average over the 35 trials. The sessions were recorded after 1, 2, 3 and 4months after implantation surgery.
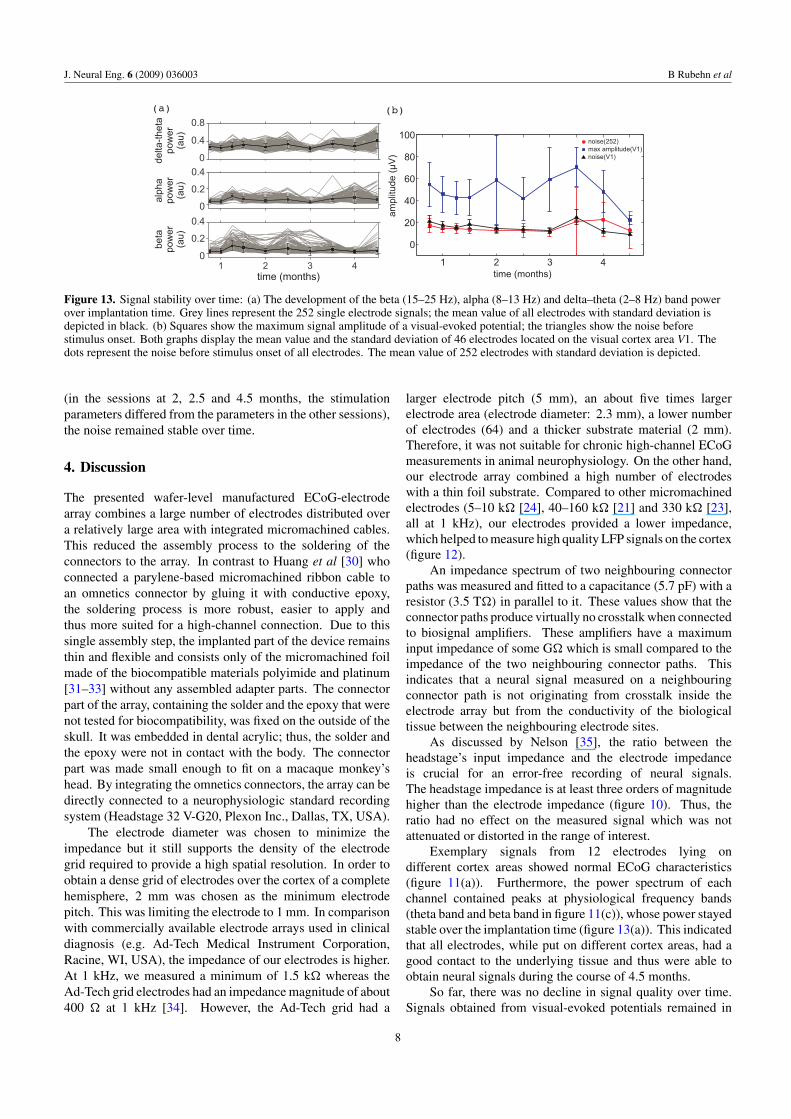
(figure 13(b), triangles) were calculated from the signals of 46electrodes located on the visual cortex area V1 (figure 1, thefirst four columns of electrodes counted from posterior). Dueto the fact that not all cortex areas respond with an evokedpotential to a visual stimulus, the noise of each electrodewas calculated to obtain a measure of the performance ofall electrodes. The dots (figure 13(b)) represent the mean of252 electrodes with the standard deviation as error bars. Themaximum signal amplitude was the maximum voltage in aninterval of 50–100 ms after the stimulus onset. As a measure of
variance, the noise was defined as the standard deviation of themeasured signal before the stimulus onset. Both values werecalculated from the data of a single trial. The mean of 35 trialsobtained in one measurement session was calculated for eachelectrode. The values shown in figure 13(b) represent the meanand the standard deviation calculated from the values of 46and 252 electrodes, respectively. The values were recorded inten measurement sessions 0.75–4.5 months after implantationsurgery. While the maximum signal amplitude was changingdue to varied stimulation parameters in different sessions
7
J. Neural Eng. 6 (2009) 036003 B Rubehn et al
(a) (b)
Figure 13. Signal stability over time: (a) The development of the beta (15–25 Hz), alpha (8–13 Hz) and delta–theta (2–8 Hz) band powerover implantation time. Grey lines represent the 252 single electrode signals; the mean value of all electrodes with standard deviation isdepicted in black. (b) Squares show the maximum signal amplitude of a visual-evoked potential; the triangles show the noise beforestimulus onset. Both graphs display the mean value and the standard deviation of 46 electrodes located on the visual cortex area V1. Thedots represent the noise before stimulus onset of all electrodes. The mean value of 252 electrodes with standard deviation is depicted.
(in the sessions at 2, 2.5 and 4.5 months, the stimulationparameters differed from the parameters in the other sessions),the noise remained stable over time.
4. Discussion
The presented wafer-level manufactured ECoG-electrodearray combines a large number of electrodes distributed overa relatively large area with integrated micromachined cables.This reduced the assembly process to the soldering of theconnectors to the array. In contrast to Huang et al [30] whoconnected a parylene-based micromachined ribbon cable toan omnetics connector by gluing it with conductive epoxy,the soldering process is more robust, easier to apply andthus more suited for a high-channel connection. Due to thissingle assembly step, the implanted part of the device remainsthin and flexible and consists only of the micromachined foilmade of the biocompatible materials polyimide and platinum[31–33] without any assembled adapter parts. The connectorpart of the array, containing the solder and the epoxy that werenot tested for biocompatibility, was fixed on the outside of theskull. It was embedded in dental acrylic; thus, the solder andthe epoxy were not in contact with the body. The connectorpart was made small enough to fit on a macaque monkey’shead. By integrating the omnetics connectors, the array can bedirectly connected to a neurophysiologic standard recordingsystem (Headstage 32 V-G20, Plexon Inc., Dallas, TX, USA).
The electrode diameter was chosen to minimize theimpedance but it still supports the density of the electrodegrid required to provide a high spatial resolution. In order toobtain a dense grid of electrodes over the cortex of a completehemisphere, 2 mm was chosen as the minimum electrodepitch. This was limiting the electrode to 1 mm. In comparisonwith commercially available electrode arrays used in clinicaldiagnosis (e.g. Ad-Tech Medical Instrument Corporation,Racine, WI, USA), the impedance of our electrodes is higher.At 1 kHz, we measured a minimum of 1.5 k� whereas theAd-Tech grid electrodes had an impedance magnitude of about400 � at 1 kHz [34]. However, the Ad-Tech grid had a
larger electrode pitch (5 mm), an about five times largerelectrode area (electrode diameter: 2.3 mm), a lower numberof electrodes (64) and a thicker substrate material (2 mm).Therefore, it was not suitable for chronic high-channel ECoGmeasurements in animal neurophysiology. On the other hand,our electrode array combined a high number of electrodeswith a thin foil substrate. Compared to other micromachinedelectrodes (5–10 k� [24], 40–160 k� [21] and 330 k� [23],all at 1 kHz), our electrodes provided a lower impedance,which helped to measure high quality LFP signals on the cortex(figure 12).
An impedance spectrum of two neighbouring connectorpaths was measured and fitted to a capacitance (5.7 pF) with aresistor (3.5 T�) in parallel to it. These values show that theconnector paths produce virtually no crosstalk when connectedto biosignal amplifiers. These amplifiers have a maximuminput impedance of some G� which is small compared to theimpedance of the two neighbouring connector paths. Thisindicates that a neural signal measured on a neighbouringconnector path is not originating from crosstalk inside theelectrode array but from the conductivity of the biologicaltissue between the neighbouring electrode sites.
As discussed by Nelson [35], the ratio between theheadstage’s input impedance and the electrode impedanceis crucial for an error-free recording of neural signals.The headstage impedance is at least three orders of magnitudehigher than the electrode impedance (figure 10). Thus, theratio had no effect on the measured signal which was notattenuated or distorted in the range of interest.
Exemplary signals from 12 electrodes lying ondifferent cortex areas showed normal ECoG characteristics(figure 11(a)). Furthermore, the power spectrum of eachchannel contained peaks at physiological frequency bands(theta band and beta band in figure 11(c)), whose power stayedstable over the implantation time (figure 13(a)). This indicatedthat all electrodes, while put on different cortex areas, had agood contact to the underlying tissue and thus were able toobtain neural signals during the course of 4.5 months.
So far, there was no decline in signal quality over time.Signals obtained from visual-evoked potentials remained in
8

J. Neural Eng. 6 (2009) 036003 B Rubehn et al
the same order of magnitude and the noise did not change overmonths (figures 12 and 13(b)).
5. Conclusion
One of the ultimate goals of neuroscience research is theunderstanding of the mechanisms through which brain regionsare able to interact with each other in order to processinformation and produce behaviourally relevant responses[4]. Recent advances in multielectrode techniques haveprovided new insights in that direction [36, 37]. In thissense, the presented multielectrode array provides two relevantcharacteristics. Firstly, a large number of electrodes combinedwith the flexibility of a thin-film array allow the simultaneousrecording over several brain areas. This electrode array isable to record neuronal activity from early visual areas (e.g.V1) to prefrontal regions, such as the frontal eye fields. Thisextensive sampling over large brain areas can help to revealthe mechanisms of interaction between neuronal populationsduring the development of a cognitive task. Secondly,signal fidelity recorded over time provides an indication thatneuroprosthetic devices could be developed using ECoG-electrode arrays as the neural interface [13].
Acknowledgment
We would like to thank Dr Martin Schuettler for valuablediscussions and consultations.
References
[1] Varela F, Lachaux J-P, Rodriguez E and Martinerie J 2001 Thebrainweb: phase synchronization and large-scaleintegration Nat. Rev. Neurosci. 2 229–39
[2] Engel A K, Fries P and Singer W 2001 Dynamic predictions:oscillations and synchrony in top-down processing Nat. Rev.Neurosci. 2 704–16
[3] Mesulam M-M 1998 From sensation to cognition Brain121 1013–52
[4] Fries P 2005 A mechanism for cognitive dynamics: neuronalcommunication through neuronal coherence Trends Cogn.Sci. 9 474–80
[5] Mitzdorf U 1985 Current source-density method andapplication in cat cerebral cortex: investigation of evokedpotentials and EEG phenomena Physiol. Rev. 65 37–100
[6] Katzner S, Nauhaus I, Benucci A, Bonin V, Ringach D andCarandini M 2009 Local origin of field potentials in visualcortex Neuron 61 35–41
[7] Henrie J A and Shapley R 2005 LFP power spectra in V1cortex: the graded effect of stimulus contrastJ. Neurophysiol. 94 479–90
[8] Kreiman G, Hung C P, Kraskov A, Quiroga R Q, Poggio T andDiCarlo J J 2006 Object selectivity of local field potentialsand spikes in the macaque inferior temporal cortex Neuron49 433–45
[9] Liu J and Newsome W T 2006 Local field potential in corticalarea MT: stimulus tuning and behavioral correlationsJ. Neurosci. 26 7779–90
[10] Womelsdorf T, Fries P, Mitra P P and Desimone R 2006Gamma-band synchronization in visual cortex predictsspeed of change detection Nature 439 733–6
[11] Pesaran B, Nelson M J and Andersen R A 2008 Free choiceactivates a decision circuit between frontal and parietalcortex Nature 453 406–9
[12] Pesaran B, Pezaris J S, Sahani M, Mitra P P and Andersen R A2002 Temporal structure in neuronal activity duringworking memory in macaque parietal cortex Nat. Neurosci.5 805–11
[13] Scherberger H, Jarvis M R and Andersen R A 2005 Corticallocal field potential encodes movement intentions in theposterior parietal cortex Neuron 46 347–54
[14] Wilke M, Logothetis N K and Leopold D A 2006 Local fieldpotential reflects perceptual suppression in monkey visualcortex Proc. Natl Acad. Sci. USA 103 17507–12
[15] Womelsdorf T, Schoffelen J-M, Oostenveld R, Singer W,Desimone R, Engel A K and Fries P 2007 Modulation ofneuronal interactions through neuronal synchronizationScience 316 1609–12
[16] Logothetis N K, Pauls J, Augath M, Trinath T and OeltermannA 2001 Neurophysiological investigation of the basis of thefMRI signal Nature 412 150–7
[17] Lopes das Silva F and Van Rotterdam A 1982 Biophysicalaspects of EEG and MEG generationElectroencephalography: Basic Principles, ClinicalApplications and Related Fields ed E Niedermeyer andF Lopes da Silva (Baltimore, MD: Lippincott Williams andWilkins) pp 15–26
[18] Rickert J, Cardoso de Oliveira S, Vaadia E, Aertsen A,Rotter S and Mehring C 2005 Encoding of movementdirection in different frequency ranges of motor corticallocal field potentials J. Neurosci. 25 8815–24
[19] Hochberg L R, Serruya M D, Friehs G M, Mukand J A,Saleh M, Caplan A H, Branner A, Chen D, Penn R D andDonoghue J P 2006 Neuronal ensemble control ofprosthetic devices by a human with tetraplegia Nature442 164–71
[20] Schramm J and Clusmann H 2008 The surgery of epilepsyNeurosurgery 62 463–81
[21] Tsytsarev V, Taketani M, Schottler F, Tanaka S and Hara M2006 A new planar multielectrode array: recording from arat auditory cortex J. Neural. Eng. 3 293–8
[22] Kitzmiller J, Beversdorf D and Hansford D 2006 Fabricationand testing of microelectrodes for small-field corticalsurface recordings Biomed. Microdevices 8 81–5
[23] Takahashi H, Ejiri T, Nakao M, Nakamura N, Kaga K andHerve T 2003 Microelectrode array on folding polyimideribbon for epidural mapping of functional evoked potentialsIEEE Trans. Biomed. Eng. 50 510–6
[24] Molina-Luna K, Buitrago M M, Hertler B, Schubring M,Haiss F, Nisch W, Schulz J B and Luft A R 2007 Corticalstimulation mapping using epidurally implanted thin-filmmicroelectrode arrays J. Neurosci. Methods 161 118–25
[25] Hollenberg B A, Richards C D, Richards R, Bahr D F andRector D M 2006 A MEMS fabricated flexible electrodearray for recording surface field potentials J. Neurosci.Methods 153 147–53
[26] Shamma-Donoghue S A, May G A, Cotter N E, White R L andSimmons F B 1982 Thin-film multielectrode arrays for acochlear prosthesis IEEE Trans. Electron. Dev.29 136–44
[27] Boppart S A, Wheeler B C and Wallace C S 1992 A flexibleperforated microelectrode array for extended neuralrecordings IEEE Trans. Biomed. Eng. 39 37–43
[28] Stieglitz T, Beutel H, Schuettler M and Meyer J-U 2000Micromachined, polyimide-based devices for flexibleneural interfaces Biomed. Microdevices 2 283–94
[29] Jarvis M R and Mitra P P 2001 Sampling properties of thespectrum and coherency of sequences of action potentialsNeural. Computat. 13 717–49
[30] Huang R, Pang C, Tai Y-C, Emken J, Ustun C, Andersen R Aand Burdick J W 2008 Integrated parylene-cabled siliconprobes for neural prosthetics Proc. of the 21st IEEE AnnualConf. on MEMS pp 240–3
9

J. Neural Eng. 6 (2009) 036003 B Rubehn et al
[31] Richardson R R Jr, Miller J A and Reichert W M 1993Polyimides as biomaterials: preliminary biocompatibilitytesting Biomaterials 14 627–35
[32] Klinge P M, Vafa M A, Brinker T, Brandis T, Walter G F,Stieglitz T, Samii M and Wewetzer K 2001Immunohistochemical characterization of axonal sproutingand reactive tissue changes after long-term implantation ofa polyimide sieve electrode to the transected adult rat sciaticnerve Biomaterials 22 2333–43
[33] Lago N, Yoshida K, Koch K P and Navarro X 2007Assessment of biocompatibility of chronicallyimplanted polyimide and plantinum intrafascicularelectrodes IEEE Trans. Biomed. Eng.54 281–90
[34] Henle C 2008 Personal communication, Laboratory forBiomedical Microtechnology, University of Freiburg,Germany
[35] Nelson M J, Pouget P, Nilsen E A, Patten C D and Schall J D2008 Review of signal distortion through metalmicroelectrode recording circuits and filters J. Neurosci.Methods 169 141–57
[36] Miller E K and Wilson M A 2008 All my circuits: usingmultiple electrodes to understand functioning neuralnetworks Neuron 60 483–8
[37] Kipke D R, Shain W, Buzsaki G, Fetz E, Henderson J M,Hetke J F and Schalk G 2008 Advanced neurotechnologiesfor chronic neural interfaces: new horizons and clinicalopportunities J. Neurosci. 28 11830–8
10
Related Documents