1164 VOLUME 40 JOURNAL OF APPLIED METEOROLOGY q 2001 American Meteorological Society A Melting-Layer Model for Passive/Active Microwave Remote Sensing Applications. Part II: Simulation of TRMM Observations WILLIAM S. OLSON Joint Center for Earth Systems Technology, University of Maryland, Baltimore County, Baltimore, Maryland PETER BAUER Deutsche Forschungsanstalt fu ¨r Luft- und Raumfahrt, Cologne, Germany CHRISTIAN D. KUMMEROW Department of Atmospheric Science, Colorado State University, Fort Collins, Colorado YE HONG The Aerospace Corporation, Los Angeles, California WEI-KUO TAO NASA Goddard Space Flight Center, Greenbelt, Maryland (Manuscript received 11 March 2000, in final form 30 October 2000) ABSTRACT The one-dimensional, steady-state melting-layer model developed in Part I of this study is used to calculate both the microphysical and radiative properties of melting precipitation, based upon the computed concentrations of snow and graupel just above the freezing level at applicable horizontal grid points of three-dimensional cloud- resolving model simulations. The modified 3D distributions of precipitation properties serve as input to radiative transfer calculations of upwelling radiances and radar extinction/reflectivities at the Tropical Rainfall Measuring Mission (TRMM) Microwave Imager (TMI) and precipitation radar (PR) frequencies, respectively. At the res- olution of the cloud-resolving model grids (;1 km), upwelling radiances generally increase if mixed-phase precipitation is included in the model atmosphere. The magnitude of the increase depends upon the optical thickness of the cloud and precipitation, as well as the scattering characteristics of the mixed-phase particles and ice-phase precipitation aloft. Over the set of cloud-resolving model simulations utilized in this study, maximum radiance increases of 43, 28, 18, and 10 K are simulated at 10.65, 19.35, 37.0, and 85.5 GHz, respectively. The impact of melting on TMI-measured radiances is determined not only by the physics of the melting particles but also by the horizontal extent of the melting precipitation, given that the lower-frequency channels have footprints that extend over tens of kilometers. At TMI resolution, the maximum radiance increases are 16, 15, 12, and 9 K at the same frequencies. Simulated PR extinction and reflectivities in the melting layer can increase dramatically if mixed-phase precipitation is included, a result consistent with previous studies. Maximum increases of 0.46 (22 dB) in extinction optical depth and 5 dB in reflectivity are simulated based upon the set of cloud-resolving model simulations. 1. Introduction In Part I (Olson et al. 2001, this issue), a physical model that describes the melting of ice-phase precipi- tation within the stratiform regions of ‘‘parent’’ 3D cloud-resolving model (CRM) simulations was pre- sented. Alternative methods for calculating the dielectric Corresponding author address: William S. Olson, Joint Center for Earth Systems Technology, NASA Goddard Space Flight Center, Code 912, Greenbelt, MD 20771. E-mail: [email protected] and radiative properties of melting precipitation were compared, and the optical depths and reflectivities of the simulated melting layers were compared with ob- servations. Here, the parent 3D CRM fields that have been modified to include melting precipitation serve as the basis for simulations of upwelling microwave ra- diances and extinction/reflectivities as they might be measured by the Tropical Rainfall Measuring Mission (TRMM) Microwave Imager (TMI) and precipitation radar (PR) instruments, respectively. The parent 3D CRM simulations, described in Part I,

Welcome message from author
This document is posted to help you gain knowledge. Please leave a comment to let me know what you think about it! Share it to your friends and learn new things together.
Transcript
1164 VOLUME 40J O U R N A L O F A P P L I E D M E T E O R O L O G Y
q 2001 American Meteorological Society
A Melting-Layer Model for Passive/Active Microwave Remote Sensing Applications.Part II: Simulation of TRMM Observations
WILLIAM S. OLSON
Joint Center for Earth Systems Technology, University of Maryland, Baltimore County, Baltimore, Maryland
PETER BAUER
Deutsche Forschungsanstalt fur Luft- und Raumfahrt, Cologne, Germany
CHRISTIAN D. KUMMEROW
Department of Atmospheric Science, Colorado State University, Fort Collins, Colorado
YE HONG
The Aerospace Corporation, Los Angeles, California
WEI-KUO TAO
NASA Goddard Space Flight Center, Greenbelt, Maryland
(Manuscript received 11 March 2000, in final form 30 October 2000)
ABSTRACT
The one-dimensional, steady-state melting-layer model developed in Part I of this study is used to calculateboth the microphysical and radiative properties of melting precipitation, based upon the computed concentrationsof snow and graupel just above the freezing level at applicable horizontal grid points of three-dimensional cloud-resolving model simulations. The modified 3D distributions of precipitation properties serve as input to radiativetransfer calculations of upwelling radiances and radar extinction/reflectivities at the Tropical Rainfall MeasuringMission (TRMM) Microwave Imager (TMI) and precipitation radar (PR) frequencies, respectively. At the res-olution of the cloud-resolving model grids (;1 km), upwelling radiances generally increase if mixed-phaseprecipitation is included in the model atmosphere. The magnitude of the increase depends upon the opticalthickness of the cloud and precipitation, as well as the scattering characteristics of the mixed-phase particlesand ice-phase precipitation aloft. Over the set of cloud-resolving model simulations utilized in this study,maximum radiance increases of 43, 28, 18, and 10 K are simulated at 10.65, 19.35, 37.0, and 85.5 GHz,respectively. The impact of melting on TMI-measured radiances is determined not only by the physics of themelting particles but also by the horizontal extent of the melting precipitation, given that the lower-frequencychannels have footprints that extend over tens of kilometers. At TMI resolution, the maximum radiance increasesare 16, 15, 12, and 9 K at the same frequencies. Simulated PR extinction and reflectivities in the melting layercan increase dramatically if mixed-phase precipitation is included, a result consistent with previous studies.Maximum increases of 0.46 (22 dB) in extinction optical depth and 5 dB in reflectivity are simulated basedupon the set of cloud-resolving model simulations.
1. Introduction
In Part I (Olson et al. 2001, this issue), a physicalmodel that describes the melting of ice-phase precipi-tation within the stratiform regions of ‘‘parent’’ 3Dcloud-resolving model (CRM) simulations was pre-sented. Alternative methods for calculating the dielectric
Corresponding author address: William S. Olson, Joint Center forEarth Systems Technology, NASA Goddard Space Flight Center,Code 912, Greenbelt, MD 20771.E-mail: [email protected]
and radiative properties of melting precipitation werecompared, and the optical depths and reflectivities ofthe simulated melting layers were compared with ob-servations. Here, the parent 3D CRM fields that havebeen modified to include melting precipitation serve asthe basis for simulations of upwelling microwave ra-diances and extinction/reflectivities as they might bemeasured by the Tropical Rainfall Measuring Mission(TRMM) Microwave Imager (TMI) and precipitationradar (PR) instruments, respectively.
The parent 3D CRM simulations, described in Part I,
JULY 2001 1165O L S O N E T A L .
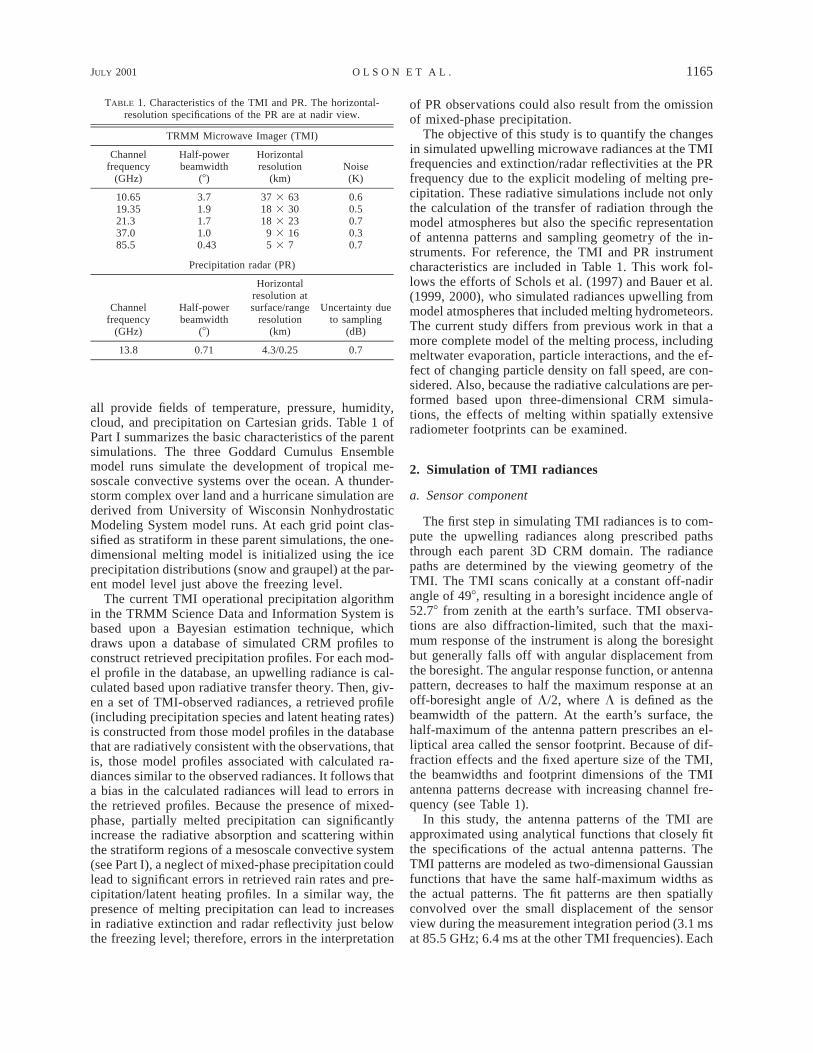
TABLE 1. Characteristics of the TMI and PR. The horizontal-resolution specifications of the PR are at nadir view.
TRMM Microwave Imager (TMI)
Channelfrequency
(GHz)
Half-powerbeamwidth
(8)
Horizontalresolution
(km)Noise(K)
10.6519.3521.337.085.5
3.71.91.71.00.43
37 3 6318 3 3018 3 23
9 3 165 3 7
0.60.50.70.30.7
Precipitation radar (PR)
Channelfrequency
(GHz)
Half-powerbeamwidth
(8)
Horizontalresolution atsurface/range
resolution(km)
Uncertainty dueto sampling
(dB)
13.8 0.71 4.3/0.25 0.7
all provide fields of temperature, pressure, humidity,cloud, and precipitation on Cartesian grids. Table 1 ofPart I summarizes the basic characteristics of the parentsimulations. The three Goddard Cumulus Ensemblemodel runs simulate the development of tropical me-soscale convective systems over the ocean. A thunder-storm complex over land and a hurricane simulation arederived from University of Wisconsin NonhydrostaticModeling System model runs. At each grid point clas-sified as stratiform in these parent simulations, the one-dimensional melting model is initialized using the iceprecipitation distributions (snow and graupel) at the par-ent model level just above the freezing level.
The current TMI operational precipitation algorithmin the TRMM Science Data and Information System isbased upon a Bayesian estimation technique, whichdraws upon a database of simulated CRM profiles toconstruct retrieved precipitation profiles. For each mod-el profile in the database, an upwelling radiance is cal-culated based upon radiative transfer theory. Then, giv-en a set of TMI-observed radiances, a retrieved profile(including precipitation species and latent heating rates)is constructed from those model profiles in the databasethat are radiatively consistent with the observations, thatis, those model profiles associated with calculated ra-diances similar to the observed radiances. It follows thata bias in the calculated radiances will lead to errors inthe retrieved profiles. Because the presence of mixed-phase, partially melted precipitation can significantlyincrease the radiative absorption and scattering withinthe stratiform regions of a mesoscale convective system(see Part I), a neglect of mixed-phase precipitation couldlead to significant errors in retrieved rain rates and pre-cipitation/latent heating profiles. In a similar way, thepresence of melting precipitation can lead to increasesin radiative extinction and radar reflectivity just belowthe freezing level; therefore, errors in the interpretation
of PR observations could also result from the omissionof mixed-phase precipitation.
The objective of this study is to quantify the changesin simulated upwelling microwave radiances at the TMIfrequencies and extinction/radar reflectivities at the PRfrequency due to the explicit modeling of melting pre-cipitation. These radiative simulations include not onlythe calculation of the transfer of radiation through themodel atmospheres but also the specific representationof antenna patterns and sampling geometry of the in-struments. For reference, the TMI and PR instrumentcharacteristics are included in Table 1. This work fol-lows the efforts of Schols et al. (1997) and Bauer et al.(1999, 2000), who simulated radiances upwelling frommodel atmospheres that included melting hydrometeors.The current study differs from previous work in that amore complete model of the melting process, includingmeltwater evaporation, particle interactions, and the ef-fect of changing particle density on fall speed, are con-sidered. Also, because the radiative calculations are per-formed based upon three-dimensional CRM simula-tions, the effects of melting within spatially extensiveradiometer footprints can be examined.
2. Simulation of TMI radiances
a. Sensor component
The first step in simulating TMI radiances is to com-pute the upwelling radiances along prescribed pathsthrough each parent 3D CRM domain. The radiancepaths are determined by the viewing geometry of theTMI. The TMI scans conically at a constant off-nadirangle of 498, resulting in a boresight incidence angle of52.78 from zenith at the earth’s surface. TMI observa-tions are also diffraction-limited, such that the maxi-mum response of the instrument is along the boresightbut generally falls off with angular displacement fromthe boresight. The angular response function, or antennapattern, decreases to half the maximum response at anoff-boresight angle of L/2, where L is defined as thebeamwidth of the pattern. At the earth’s surface, thehalf-maximum of the antenna pattern prescribes an el-liptical area called the sensor footprint. Because of dif-fraction effects and the fixed aperture size of the TMI,the beamwidths and footprint dimensions of the TMIantenna patterns decrease with increasing channel fre-quency (see Table 1).
In this study, the antenna patterns of the TMI areapproximated using analytical functions that closely fitthe specifications of the actual antenna patterns. TheTMI patterns are modeled as two-dimensional Gaussianfunctions that have the same half-maximum widths asthe actual patterns. The fit patterns are then spatiallyconvolved over the small displacement of the sensorview during the measurement integration period (3.1 msat 85.5 GHz; 6.4 ms at the other TMI frequencies). Each
1166 VOLUME 40J O U R N A L O F A P P L I E D M E T E O R O L O G Y
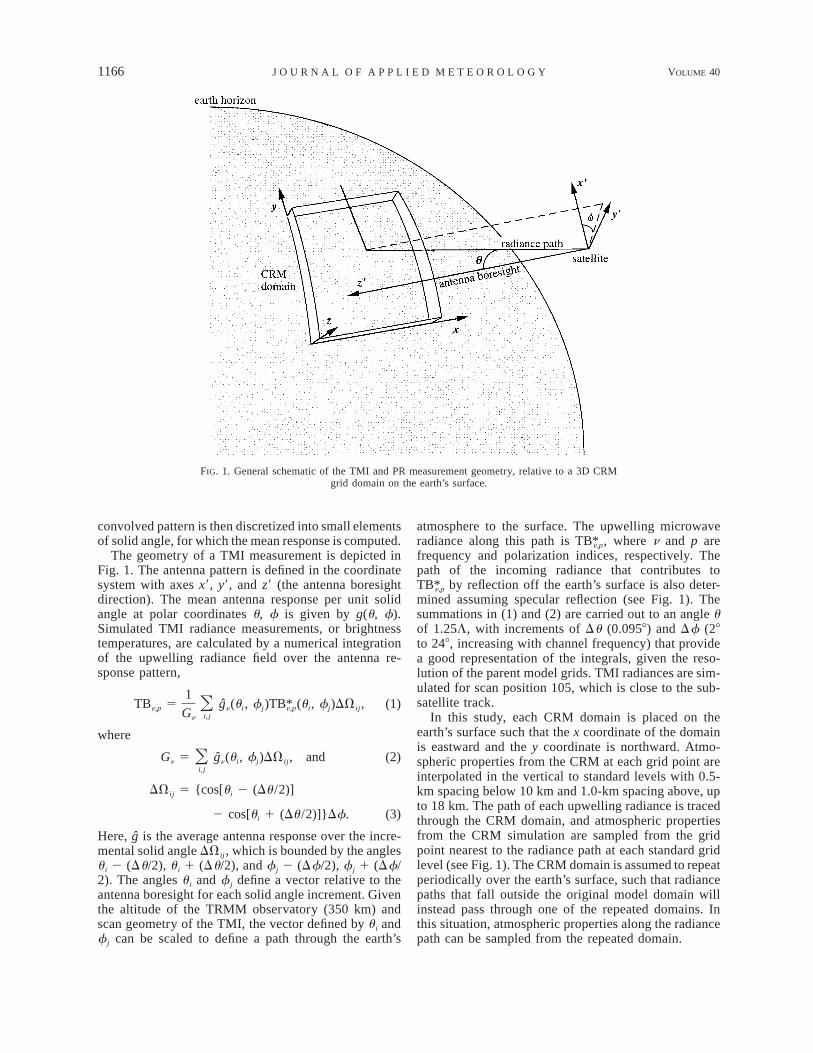
FIG. 1. General schematic of the TMI and PR measurement geometry, relative to a 3D CRMgrid domain on the earth’s surface.
convolved pattern is then discretized into small elementsof solid angle, for which the mean response is computed.
The geometry of a TMI measurement is depicted inFig. 1. The antenna pattern is defined in the coordinatesystem with axes x9, y9, and z9 (the antenna boresightdirection). The mean antenna response per unit solidangle at polar coordinates u, f is given by g(u, f).Simulated TMI radiance measurements, or brightnesstemperatures, are calculated by a numerical integrationof the upwelling radiance field over the antenna re-sponse pattern,
1TB 5 g (u , f )TB* (u , f )DV , (1)On,p n i j n,p i j ijG i,jn
where
G 5 g (u , f )DV , and (2)On n i j iji, j
DV 5 {cos[u 2 (Du /2)]ij i
2 cos[u 1 (Du /2)]}Df. (3)i
Here, g is the average antenna response over the incre-mental solid angle DVij, which is bounded by the anglesui 2 (Du/2), ui 1 (Du/2), and fj 2 (Df/2), fj 1 (Df/2). The angles ui and f j define a vector relative to theantenna boresight for each solid angle increment. Giventhe altitude of the TRMM observatory (350 km) andscan geometry of the TMI, the vector defined by ui andfj can be scaled to define a path through the earth’s
atmosphere to the surface. The upwelling microwaveradiance along this path is where n and p areTB* ,n,p
frequency and polarization indices, respectively. Thepath of the incoming radiance that contributes to
by reflection off the earth’s surface is also deter-TB*n,p
mined assuming specular reflection (see Fig. 1). Thesummations in (1) and (2) are carried out to an angle uof 1.25L, with increments of Du (0.0958) and Df (28to 248, increasing with channel frequency) that providea good representation of the integrals, given the reso-lution of the parent model grids. TMI radiances are sim-ulated for scan position 105, which is close to the sub-satellite track.
In this study, each CRM domain is placed on theearth’s surface such that the x coordinate of the domainis eastward and the y coordinate is northward. Atmo-spheric properties from the CRM at each grid point areinterpolated in the vertical to standard levels with 0.5-km spacing below 10 km and 1.0-km spacing above, upto 18 km. The path of each upwelling radiance is tracedthrough the CRM domain, and atmospheric propertiesfrom the CRM simulation are sampled from the gridpoint nearest to the radiance path at each standard gridlevel (see Fig. 1). The CRM domain is assumed to repeatperiodically over the earth’s surface, such that radiancepaths that fall outside the original model domain willinstead pass through one of the repeated domains. Inthis situation, atmospheric properties along the radiancepath can be sampled from the repeated domain.
JULY 2001 1167O L S O N E T A L .
b. Radiative transfer component
The properties of the atmosphere, sampled from theparent 3D CRM simulations, are used to calculate themicrowave radiative properties at the TMI frequenciesalong each radiance path. Radiative absorption by mo-lecular oxygen and water vapor in the atmosphere isdetermined from the sampled temperature, pressure, andrelative humidity according to the model of Liebe(1985). The size distribution of liquid cloud drops isassumed to follow a gamma distribution as in Liou(1992) with a 6-mm-mode radius and a water contentgiven by the parent simulation. It is assumed that cloudice particles have a size distribution described by theempirical formulas of Heymsfield and Platt (1984), giv-en the temperature and ice water content derived fromthe parent simulation. The radiative properties (extinc-tion coefficient, single scatter albedo, and asymmetryfactor) of cloud liquid and ice are determined from Mietheory (Mie 1908), which assumes spherical, homoge-neous particles. In applications to cloud ice particles,ice spheres with the same water content as the crystalsare specified. Liquid and ice precipitation water contentsand size distributions are derived directly from the par-ent simulation except in stratiform regions, where themelting model is applied. The radiative properties ofrain and nonmelting ice precipitation are again calcu-lated from Mie theory. The refractive indices of snowand graupel particles, which contain ice and air, arecomputed using Maxwell-Garnett (1904) dielectric mix-ing for air inclusions within an ice matrix [see (32) and(33) of Part I].
In stratiform regions where the one-dimensional melt-ing model is applied, the water contents and radiativeproperties of the mixed-phase melting precipitation par-ticles are substituted at all standard levels of the parentsimulation between the freezing level and 3 km belowthe freezing level (the extent of the melting-model do-main). Rainwater contents from the melting model arealso substituted for the rainwater contents of the parentsimulation, but the drop size distribution of rain is as-sumed to be the same as in the parent simulation, andthe radiative properties of rain are calculated using Mietheory.
The calculation of the radiative properties of mixed-phase, melting particles using different dielectric/radi-ative property models was described in Part I. In thatstudy, melting snow described by the Fabry and Szyrmer(1999, hereinafter FS) core-shell dielectric model andmelting graupel described using either a Maxwell-Gar-nett (1904, hereinafter MGwi) water matrix formulationor the Meneghini and Liao (2000, hereinafter ML00)homogeneous dielectric model were tested. Althoughmodeled attenuation based upon the FS snow–MGwigraupel dielectric models yielded the best agreementwith PR observations, both the FS snow–MGwi graupelmodels and FS snow–ML00 graupel models are appliedin the radiative simulations here. The reader is referred
to Part I (Olson et al. 2001) for more details concerningthe different dielectric/radiative property model for-mulations.
Radiative transfer simulations in this study are limitedto atmospheres overlying water-surface backgrounds.Over these backgrounds the effects of microwave ab-sorption by the melting layer are expected to be mostsignificant. The model of Wilheit (1979) is utilized todescribe the dependence of water surface emissivity/reflectivity on wind speed. Simulations assuming 20-mwind speeds of 0, 6, 12, and 18 m s21 are performed,and specular reflection off the water surface is assumed.The isotropic, downwelling cosmic background radi-ance (2.7 K) at the top of the atmosphere is also includedin the simulations.
Once the surface conditions and radiative propertiesof the atmosphere along a given radiance path are spec-ified, a radiative transfer calculation of is per-TB*n,p
formed. The radiative transfer method is based uponEddington’s second approximation (see Weinman andDavies 1978; Robinson et al. 1992), but with a modi-fication to account for the oblique radiance path throughthe three-dimensional CRM domain (Olson and Kum-merow 1996; Bauer et al. 1998). Here, Eddington’s sec-ond approximation is applied independently to the two‘‘slanted’’ profiles of atmospheric constituents definedby the incoming (downwelling) and outgoing (upwell-ing) radiance paths. The application of the method tothe downwelling radiance path yields the downwellingradiance at the earth’s surface, from which the reflectedportion of the radiance can be calculated. The methodis then reapplied to the upwelling radiance path, incor-porating the reflected radiance as part of the surfaceboundary condition. The upwelling radiance at the topof the atmosphere, is calculated in this step.TB* ,n,p
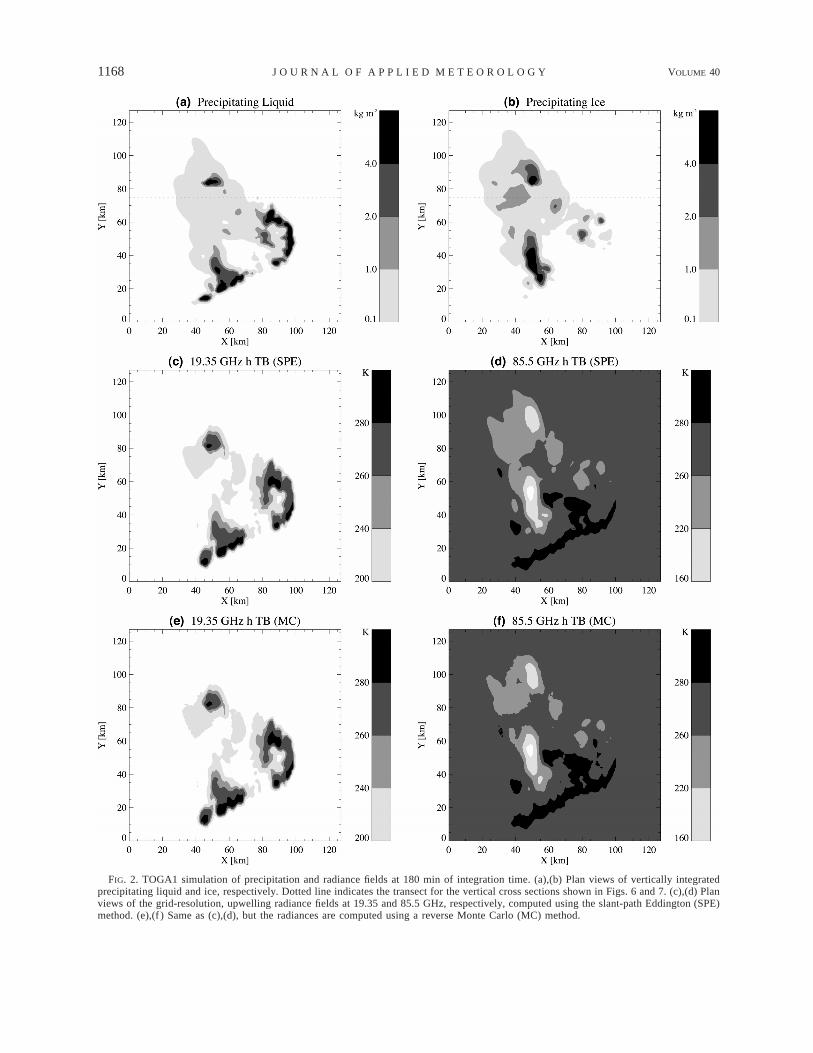
The accuracy of the slant-path Eddington (hereinafterSPE) approximation is illustrated using the TropicalOcean and Global Atmosphere TOGA1 CRM simula-tion at 180 min (see Part I, Table 1), for which the effectsof melting are not included. Displayed in Figs. 2a,b areplan views of the vertically integrated precipitating liq-uid and ice hydrometeors from the CRM. In Figs. 2c,dare the fields of radiances at model grid resolution at19.35 and 85.5 GHz, calculated using SPE. Radiancefields at CRM grid resolution are obtained by first sub-stituting a delta function for the TMI response functiong. Equation (1) is then applied, such that the antennaboresight of the sensor intersects the earth’s surface ateach model grid point successively, creating a field ofradiances at the horizontal resolution of the CRM grid(1 km). The TMI radiance path is assumed to lie parallelto the bounding y–z plane of the CRM model domain,with the sensor viewing toward the north (1y) at theboresight incidence angle (52.78). For comparison, ra-diances are also calculated using a rigorous Monte Carlo(hereinafter MC) method, as described by Roberti et al.(1994). The MC-calculated radiances at 19.35 and 85.5GHz appear in Figs. 2e and 2f, respectively.
1168 VOLUME 40J O U R N A L O F A P P L I E D M E T E O R O L O G Y
FIG. 2. TOGA1 simulation of precipitation and radiance fields at 180 min of integration time. (a),(b) Plan views of vertically integratedprecipitating liquid and ice, respectively. Dotted line indicates the transect for the vertical cross sections shown in Figs. 6 and 7. (c),(d) Planviews of the grid-resolution, upwelling radiance fields at 19.35 and 85.5 GHz, respectively, computed using the slant-path Eddington (SPE)method. (e),(f ) Same as (c),(d), but the radiances are computed using a reverse Monte Carlo (MC) method.
JULY 2001 1169O L S O N E T A L .
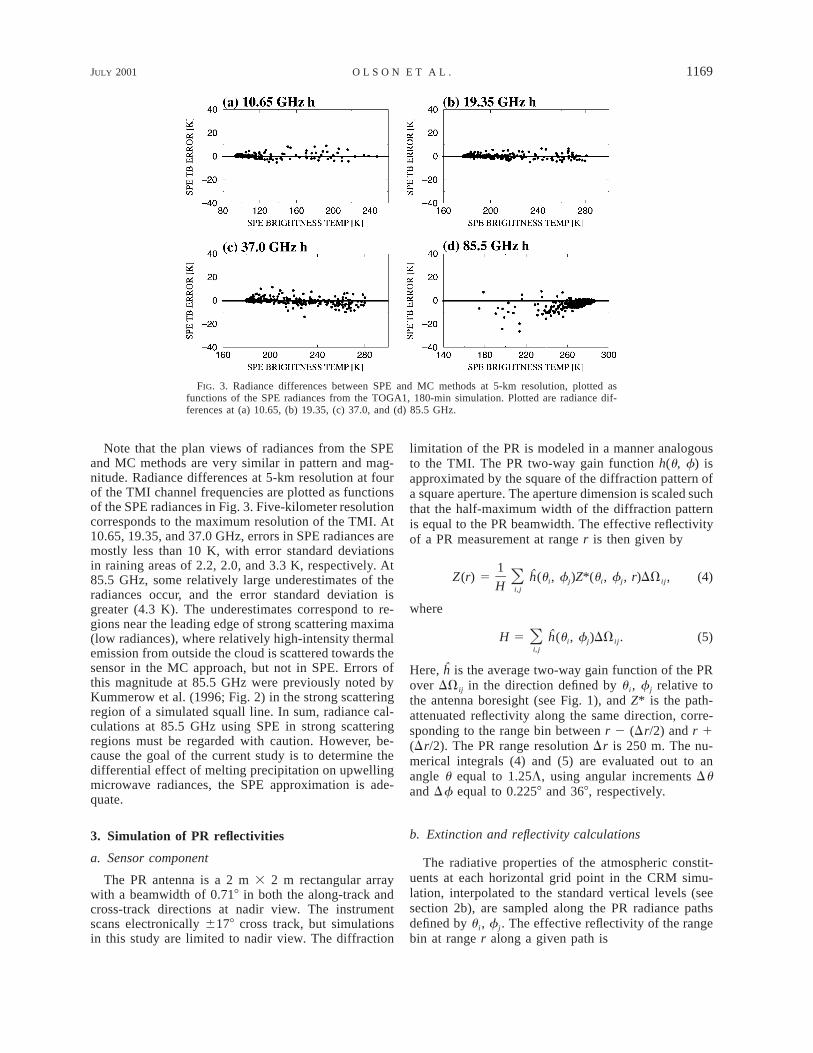
FIG. 3. Radiance differences between SPE and MC methods at 5-km resolution, plotted asfunctions of the SPE radiances from the TOGA1, 180-min simulation. Plotted are radiance dif-ferences at (a) 10.65, (b) 19.35, (c) 37.0, and (d) 85.5 GHz.
Note that the plan views of radiances from the SPEand MC methods are very similar in pattern and mag-nitude. Radiance differences at 5-km resolution at fourof the TMI channel frequencies are plotted as functionsof the SPE radiances in Fig. 3. Five-kilometer resolutioncorresponds to the maximum resolution of the TMI. At10.65, 19.35, and 37.0 GHz, errors in SPE radiances aremostly less than 10 K, with error standard deviationsin raining areas of 2.2, 2.0, and 3.3 K, respectively. At85.5 GHz, some relatively large underestimates of theradiances occur, and the error standard deviation isgreater (4.3 K). The underestimates correspond to re-gions near the leading edge of strong scattering maxima(low radiances), where relatively high-intensity thermalemission from outside the cloud is scattered towards thesensor in the MC approach, but not in SPE. Errors ofthis magnitude at 85.5 GHz were previously noted byKummerow et al. (1996; Fig. 2) in the strong scatteringregion of a simulated squall line. In sum, radiance cal-culations at 85.5 GHz using SPE in strong scatteringregions must be regarded with caution. However, be-cause the goal of the current study is to determine thedifferential effect of melting precipitation on upwellingmicrowave radiances, the SPE approximation is ade-quate.
3. Simulation of PR reflectivities
a. Sensor component
The PR antenna is a 2 m 3 2 m rectangular arraywith a beamwidth of 0.718 in both the along-track andcross-track directions at nadir view. The instrumentscans electronically 6178 cross track, but simulationsin this study are limited to nadir view. The diffraction
limitation of the PR is modeled in a manner analogousto the TMI. The PR two-way gain function h(u, f) isapproximated by the square of the diffraction pattern ofa square aperture. The aperture dimension is scaled suchthat the half-maximum width of the diffraction patternis equal to the PR beamwidth. The effective reflectivityof a PR measurement at range r is then given by
1Z(r) 5 h(u , f )Z*(u , f , r)DV , (4)O i j i j ijH i,j
where
H 5 h(u , f )DV . (5)O i j iji, j
Here, h is the average two-way gain function of the PRover DV ij in the direction defined by ui, fj relative tothe antenna boresight (see Fig. 1), and Z* is the path-attenuated reflectivity along the same direction, corre-sponding to the range bin between r 2 (Dr/2) and r 1(Dr/2). The PR range resolution Dr is 250 m. The nu-merical integrals (4) and (5) are evaluated out to anangle u equal to 1.25L, using angular increments Duand Df equal to 0.2258 and 368, respectively.
b. Extinction and reflectivity calculations
The radiative properties of the atmospheric constit-uents at each horizontal grid point in the CRM simu-lation, interpolated to the standard vertical levels (seesection 2b), are sampled along the PR radiance pathsdefined by ui, fj. The effective reflectivity of the rangebin at range r along a given path is
1170 VOLUME 40J O U R N A L O F A P P L I E D M E T E O R O L O G Y
4cZ* 5 [k (r)v (r)P (r) ]ext o 1806 4 24p n |K |l
3 exp 22 k (r9) Dr9 . (6)O ext m m[ ]m
Here, c is the speed of light in a vacuum, n is the op-erating frequency of the radar (13.8 GHz), and | Kl | 2
is a liquid water dielectric factor that has a value of0.93. The parameters kext, vo, and P180 are the extinctioncoefficient, single scatter albedo, and backscatter phasefunction of the atmosphere, respectively. The productof these three parameters is the backscatter cross sectionof the atmosphere, and the overbar indicates a spatialaverage of the cross section between r 2 (Dr/2) and r1 (Dr/2) along the radiance path. The exponential termrepresents the two-way attenuation of the reflectivity;the summation in rectangular brackets is over all re-flectivity bins from the top of the CRM domain to therange r. Note that the potential contribution from ther-mal noise power is not included in the current simulationof Z* but may be added as a second term on the right-hand side of (6) (see Olson et al. 1996).
The calculation of the radiative properties of the mod-el atmosphere is based upon the methods described insection 2b but for a frequency of 13.8 GHz; that is, theTMI and PR calculations are consistent.
4. Squall line radiance/reflectivity simulationsincluding melting
The TOGA1 CRM run at 180 min is again selectedto demonstrate the radiance and reflectivity simulations.Distributions of partially melted ice precipitation areincluded in the simulations by applying the one-dimen-sional melting model in stratiform areas, assuming theFS dielectric model for melting snow and the MGwidielectric model for melting graupel.
Before considering the effects of sensor resolution, itis instructive to analyze the radiance and reflectivityfields simulated at the highest possible resolution. Grid-resolution radiance/reflectivity fields are obtained byfirst substituting a delta function for both the TMI andPR response functions g and h, respectively. Equations(1) and (4) are then applied, such that the antenna bore-sights of the sensors intersect the earth’s surface at eachmodel grid point successively, creating a field of radi-ances/reflectivities at the horizontal resolution of theCRM grid (1 km). The TMI radiance paths are assumedto lie parallel to the bounding y–z plane of the CRMmodel domain, with the sensor viewing toward the north(1y). The PR always views toward nadir (2z) in thesimulation.
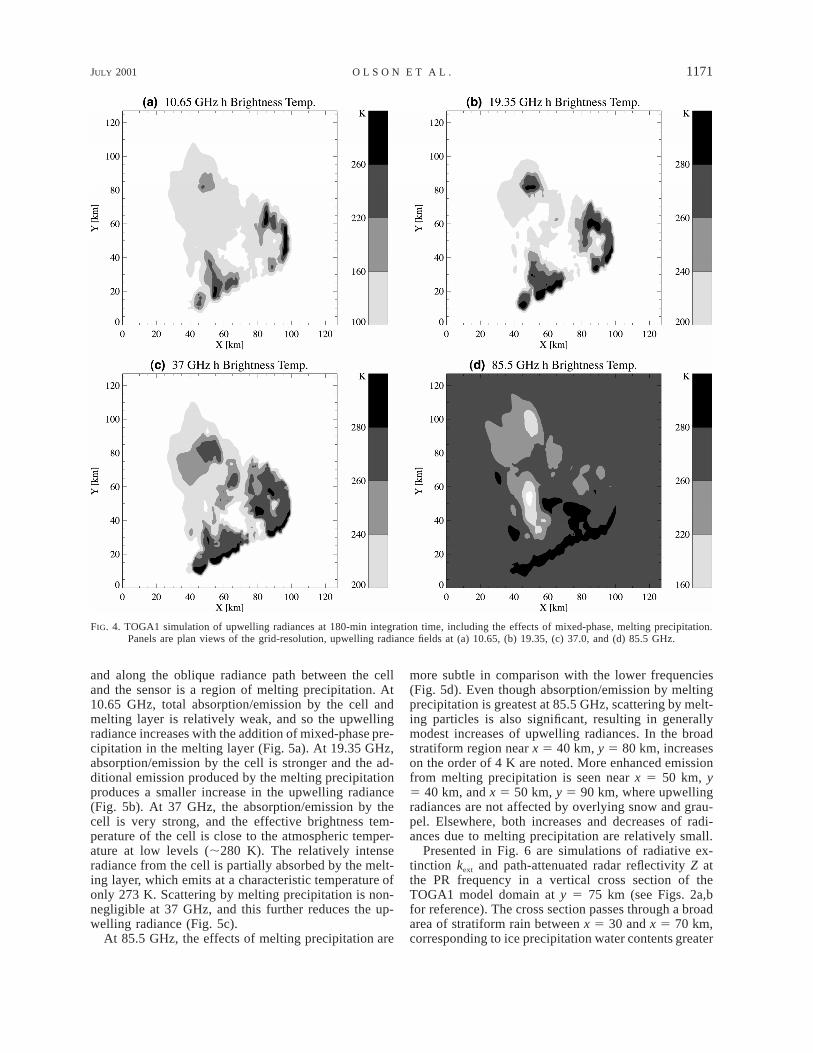
Presented in Fig. 4 are plan views of the simulatedradiance fields at the TMI frequencies, correspondingto the liquid and ice precipitation distributions shownin Figs. 2a,b. Note that there is a strong correlationbetween concentrations of liquid precipitation and high-
er radiances at the 10.65-, 19.35-, and 37-GHz fre-quencies. Convective rain, located primarily along theeastern and southern edges of the simulated squall line,produces relatively strong microwave emission at thesefrequencies. Stratiform rain to the north and west of theconvection tends to produce less emission, although thedifference between convective and stratiform rain emis-sion decreases with increasing frequency. At 85.5 GHz,greater microwave emission from the water surfacebackground and atmospheric water vapor in rain-freeregions is essentially indistinguishable from rain emis-sion. However, precipitation-sized ice particles (snowand graupel) scatter microwaves and create depressionsin the upwelling radiance field. The deepest convectivecells, seen along x 5 50 km, generally produce the mostice scattering and therefore the lowest radiances, where-as shallower cells along the eastern and southern edgesof the squall line are associated with less ice and rel-atively weak scattering. Stratiform regions, such as thearea near x 5 40 km, y 5 80 km, may also exhibitsignificant scattering depressions. Note the relativelyhigh radiances (.280 K) along the southern edge of thesquall line at 19.35, 37, and 85.5 GHz. These high ra-diances are caused by downwelling emission from cloudand precipitation that is reflected off the water surfacetoward the sensor, an effect previously described byPetty (1994).
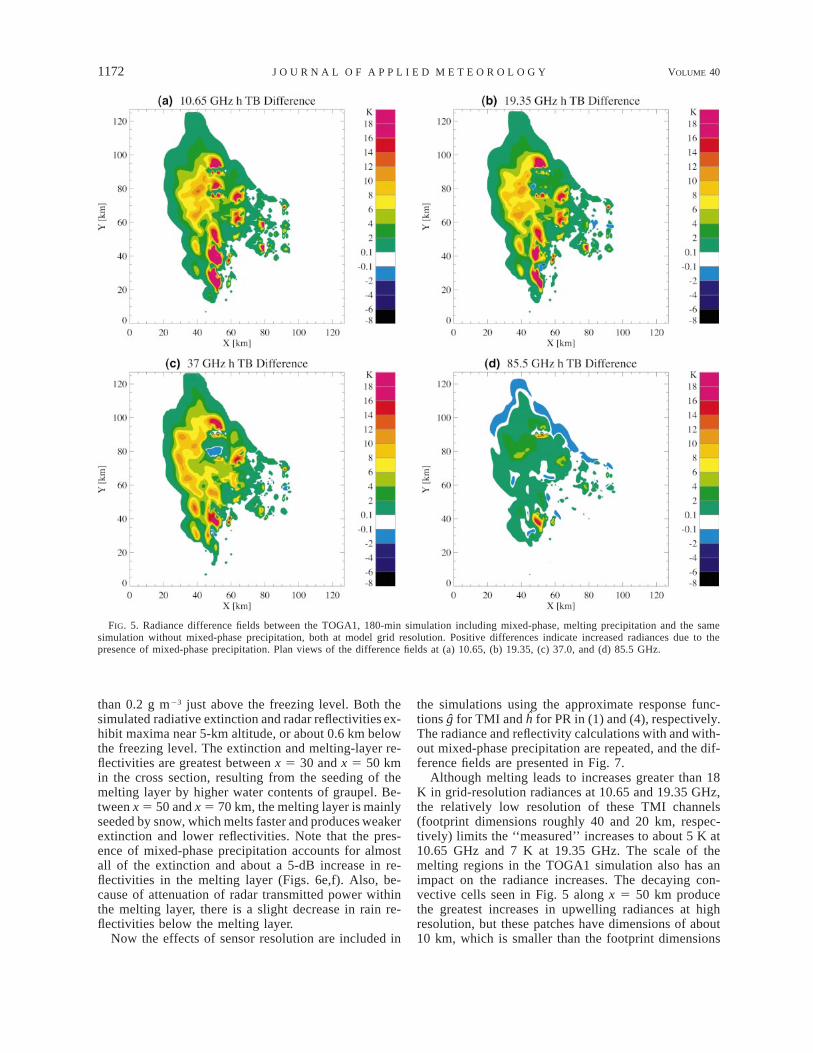
Because the effects of melting precipitation are notobvious in plots of total radiance, the differences be-tween the simulated radiance fields of Fig. 4 and thoseproduced by a simulation without mixed-phase precip-itation are presented in Fig. 5. In general, radiances atthe TMI frequencies increase with the inclusion of theeffect of melting. Along the transect x 5 50 km at 10.65GHz, for example, a train of decaying convective cellsproduces patches where radiances increase by more than18 K. The more ‘‘stratiform’’ melting region near x 540 km, y 5 80 km yields radiances that increase by 6–10 K relative to the control simulation. The generalincrease of radiances at 10.65 GHz is attributed to theincrease of radiative absorption/emission from the pres-ence of mixed-phase, melting precipitation (see Part I,section 2).
As the frequency increases from 10.65 to 19.35 GHzand then to 37 GHz, some of the regions of enhancedradiances persist while others decay. For example, in-creased emission at 19.35 and 37 GHz is associated withmost of the decaying convective cells along x 5 50 km.However, near x 5 50 km, y 5 80 km, the region ofenhanced emission at 10.65 GHz nearly disappears at19.35 GHz, and radiances actually decrease with melt-ing at 37 GHz.
The frequency dependence of the radiances near x 550 km, y 5 80 km is mainly determined by the precip-itation geometry and melting particle absorption, whichgenerally increases with frequency. Located near thepoint in question is an active convective cell with arelatively high rainwater content at low levels (Fig. 2a),
JULY 2001 1171O L S O N E T A L .
FIG. 4. TOGA1 simulation of upwelling radiances at 180-min integration time, including the effects of mixed-phase, melting precipitation.Panels are plan views of the grid-resolution, upwelling radiance fields at (a) 10.65, (b) 19.35, (c) 37.0, and (d) 85.5 GHz.
and along the oblique radiance path between the celland the sensor is a region of melting precipitation. At10.65 GHz, total absorption/emission by the cell andmelting layer is relatively weak, and so the upwellingradiance increases with the addition of mixed-phase pre-cipitation in the melting layer (Fig. 5a). At 19.35 GHz,absorption/emission by the cell is stronger and the ad-ditional emission produced by the melting precipitationproduces a smaller increase in the upwelling radiance(Fig. 5b). At 37 GHz, the absorption/emission by thecell is very strong, and the effective brightness tem-perature of the cell is close to the atmospheric temper-ature at low levels (;280 K). The relatively intenseradiance from the cell is partially absorbed by the melt-ing layer, which emits at a characteristic temperature ofonly 273 K. Scattering by melting precipitation is non-negligible at 37 GHz, and this further reduces the up-welling radiance (Fig. 5c).
At 85.5 GHz, the effects of melting precipitation are
more subtle in comparison with the lower frequencies(Fig. 5d). Even though absorption/emission by meltingprecipitation is greatest at 85.5 GHz, scattering by melt-ing particles is also significant, resulting in generallymodest increases of upwelling radiances. In the broadstratiform region near x 5 40 km, y 5 80 km, increaseson the order of 4 K are noted. More enhanced emissionfrom melting precipitation is seen near x 5 50 km, y5 40 km, and x 5 50 km, y 5 90 km, where upwellingradiances are not affected by overlying snow and grau-pel. Elsewhere, both increases and decreases of radi-ances due to melting precipitation are relatively small.
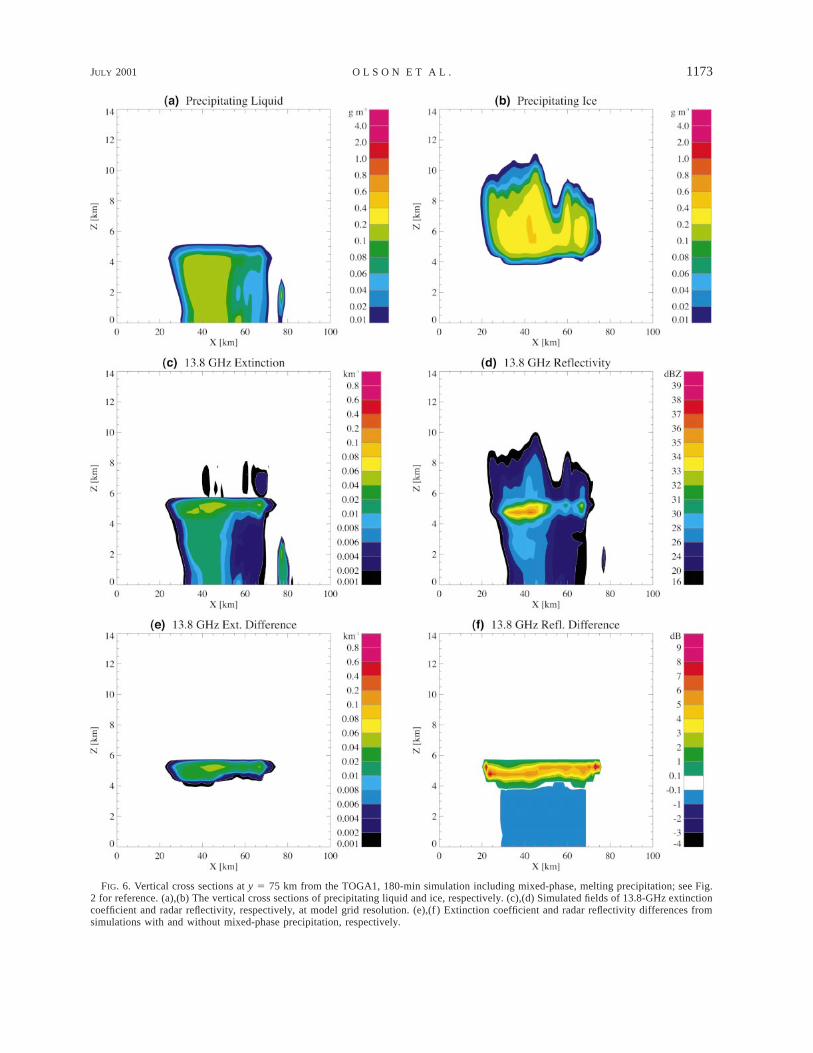
Presented in Fig. 6 are simulations of radiative ex-tinction kext and path-attenuated radar reflectivity Z atthe PR frequency in a vertical cross section of theTOGA1 model domain at y 5 75 km (see Figs. 2a,bfor reference). The cross section passes through a broadarea of stratiform rain between x 5 30 and x 5 70 km,corresponding to ice precipitation water contents greater
1172 VOLUME 40J O U R N A L O F A P P L I E D M E T E O R O L O G Y
FIG. 5. Radiance difference fields between the TOGA1, 180-min simulation including mixed-phase, melting precipitation and the samesimulation without mixed-phase precipitation, both at model grid resolution. Positive differences indicate increased radiances due to thepresence of mixed-phase precipitation. Plan views of the difference fields at (a) 10.65, (b) 19.35, (c) 37.0, and (d) 85.5 GHz.
than 0.2 g m23 just above the freezing level. Both thesimulated radiative extinction and radar reflectivities ex-hibit maxima near 5-km altitude, or about 0.6 km belowthe freezing level. The extinction and melting-layer re-flectivities are greatest between x 5 30 and x 5 50 kmin the cross section, resulting from the seeding of themelting layer by higher water contents of graupel. Be-tween x 5 50 and x 5 70 km, the melting layer is mainlyseeded by snow, which melts faster and produces weakerextinction and lower reflectivities. Note that the pres-ence of mixed-phase precipitation accounts for almostall of the extinction and about a 5-dB increase in re-flectivities in the melting layer (Figs. 6e,f). Also, be-cause of attenuation of radar transmitted power withinthe melting layer, there is a slight decrease in rain re-flectivities below the melting layer.
Now the effects of sensor resolution are included in
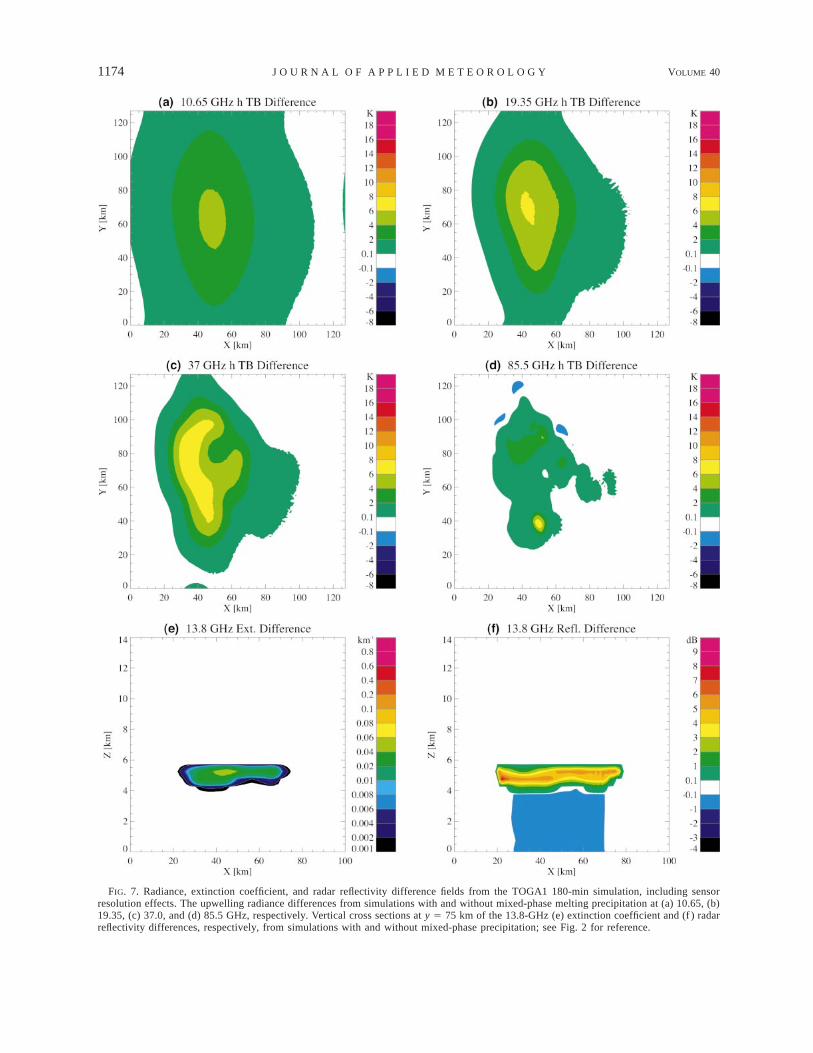
the simulations using the approximate response func-tions g for TMI and h for PR in (1) and (4), respectively.The radiance and reflectivity calculations with and with-out mixed-phase precipitation are repeated, and the dif-ference fields are presented in Fig. 7.
Although melting leads to increases greater than 18K in grid-resolution radiances at 10.65 and 19.35 GHz,the relatively low resolution of these TMI channels(footprint dimensions roughly 40 and 20 km, respec-tively) limits the ‘‘measured’’ increases to about 5 K at10.65 GHz and 7 K at 19.35 GHz. The scale of themelting regions in the TOGA1 simulation also has animpact on the radiance increases. The decaying con-vective cells seen in Fig. 5 along x 5 50 km producethe greatest increases in upwelling radiances at highresolution, but these patches have dimensions of about10 km, which is smaller than the footprint dimensions
JULY 2001 1173O L S O N E T A L .
FIG. 6. Vertical cross sections at y 5 75 km from the TOGA1, 180-min simulation including mixed-phase, melting precipitation; see Fig.2 for reference. (a),(b) The vertical cross sections of precipitating liquid and ice, respectively. (c),(d) Simulated fields of 13.8-GHz extinctioncoefficient and radar reflectivity, respectively, at model grid resolution. (e),(f ) Extinction coefficient and radar reflectivity differences fromsimulations with and without mixed-phase precipitation, respectively.
1174 VOLUME 40J O U R N A L O F A P P L I E D M E T E O R O L O G Y
FIG. 7. Radiance, extinction coefficient, and radar reflectivity difference fields from the TOGA1 180-min simulation, including sensorresolution effects. The upwelling radiance differences from simulations with and without mixed-phase melting precipitation at (a) 10.65, (b)19.35, (c) 37.0, and (d) 85.5 GHz, respectively. Vertical cross sections at y 5 75 km of the 13.8-GHz (e) extinction coefficient and (f ) radarreflectivity differences, respectively, from simulations with and without mixed-phase precipitation; see Fig. 2 for reference.
JULY 2001 1175O L S O N E T A L .
at 10.65 and 19.35 GHz. The stratiform precipitationnear x 5 40 km, y 5 80 km produces smaller increasesin radiances at grid resolution, but it covers an area ofroughly 20 km 3 30 km. Therefore, the stratiform rainarea makes a comparable contribution to the overallincrease of radiances at sensor resolution. In the Tropics,stratiform precipitation regions may extend 100 km ormore in organized mesoscale convective systems (seeRickenbach and Rutledge 1998), and, in these situations,greater radiance increases could be observed at 10.65and 19.35 GHz. At 37 GHz, sensor resolution effectsare less severe (footprint dimension of roughly 10 km),and radiance increases of greater than 6 K are seen overa much larger area than at 19.35 GHz. The 85.5-GHzchannels of the TMI have the best resolution (footprint;5 km), but the effects of scattering by melting pre-cipitation and ice offset the potential increases in emis-sion due to melting. Increases of less than 2 K are in-dicated over most of the extent of the squall line at 85.5GHz.
The PR has relatively high resolution at nadir view(4.3-km footprint) and the increases in extinction andreflectivity in the melting layer are almost fully realizedat sensor resolution.
5. General impact of melting on TMI and PRsimulations
Radiative simulations based upon all of the CRM runs(see Part I, Table 1) are performed for TMI and PR,both at grid resolution and with the instrument responsefunctions applied. Each radiative simulation is per-formed (i) assuming no mixed-phase particles (melt-water is assumed to be frozen until the particle is com-pletely melted), (ii) assuming the FS dielectric modelfor melting snow and the MGwi dielectric model formelting graupel, and (iii) assuming the FS model forsnow and the ML00 model for graupel.
a. Impact of melting on TMI radiances
The impact of mixed-phase, melting precipitation onupwelling radiances at the TMI frequencies can be ap-proximately described by a simple radiative model.First, from (1) it is assumed that the integrated responseof TMI over the region of melting precipitation is givenby f mb, such that
TB 5 f TB* 1 (1 2 f )TB* ,n,p mb mbn,p mb fovn,p (7)
where is the average radiance upwelling fromTB*mbn,p
the melting region, and is the average radianceTB*fovn,p
within the sensor field of view if no accounting for theeffects of mixed-phase particles is taken. By this defi-nition, the change in the total radiance TBn,p caused bythe presence of melting particles is
DTB 5 f (TB* 2 TB* ).n,p mb mbn,p fovn,p (8)
It is further assumed that the earth’s surface is char-
acterized by a surface temperature Ts and a reflectivityrs and that the entire atmosphere is represented by asingle layer with a temperature Tatm and a transmittancePatm. Under these assumptions, the radiance upwellingfrom a specific region can be approximated by
TB* ø T (1 2 r )Ps s atm
1 T (1 2 P )(1 1 r P ). (9)atm atm s atm
Here, the effects of scattering, as well as the small ra-diative contribution from the cosmic background, areignored. A final simplification, Ts ø Tatm, reduces (9) to
2TB* ø T (1 2 r P ).atm s atm (10)
Expression (10) can be applied to the radiances on theright-hand side of (8) by noting that the total transmit-tance of the atmosphere Patm is equal to Pfov outside themelting region and Pfov 3 Pmb inside the melting region.Substituting these transmittances successively into (10)and then substituting the resulting expressions into (8)leads to the following relation for the change of the totalradiance due to melting:
2DTB 5 f (T 2 TB )(1 2 P ).n,p mb atm fovn,p mb (11)
Here, TBfovn,p is the total radiance if no mixed-phaseprecipitation is considered. From (11), the impact ofmelting relative to a simulation that does not explicitlyinclude mixed-phase precipitation is primarily a func-tion of the fractional coverage of melting precipitationwithin the sensor field of view and the transmittance ofthe melting layer. The impact is modulated, however,by the difference between the atmospheric temperatureand the upwelling radiance in the absence of mixed-phase particles.
Using (11) as a guide, radiance differences at gridresolution due to melting are plotted versus the differ-ence Tatm 2 TBfovn,p in Fig. 8, with Tatm set to 273 K.Only radiances emanating from 10 km 3 10 km modelregions with all grid points classified as stratiform (seePart I, section 2a) are selected, to isolate the impact ofmelting on atmospheric transmittance (i.e., f mb ø 1).Isolines of melting-layer optical depth from 0 to 0.2based upon (11) are overlaid in the figure.
The inclusion of the FS snow–MGwi graupel meltinglayer clearly increases the optical depth of the precip-itation layer at 10.65, 19.35, and 37 GHz, as seen inFigs. 8a, 8c, and 8e, respectively. Even though the op-tical depths of the melting layers generally increase withfrequency, the greatest increases in the upwelling ra-diances occur at 10.65 GHz, with more modest increasesat 19.35 GHz and even smaller increases at 37 GHz.Maximum increases of 43, 28, and 18 K due to meltingare attained at 10.65, 19.35, and 37 GHz, respectively.The frequency dependence of the maxima is linked tothe general decrease of Tatm 2 TBfovn,p with frequency.At 85.5 GHz, the simple model represented by (11)above breaks down because radiative scattering is thedominant process at this frequency (Fig. 8g). The FS
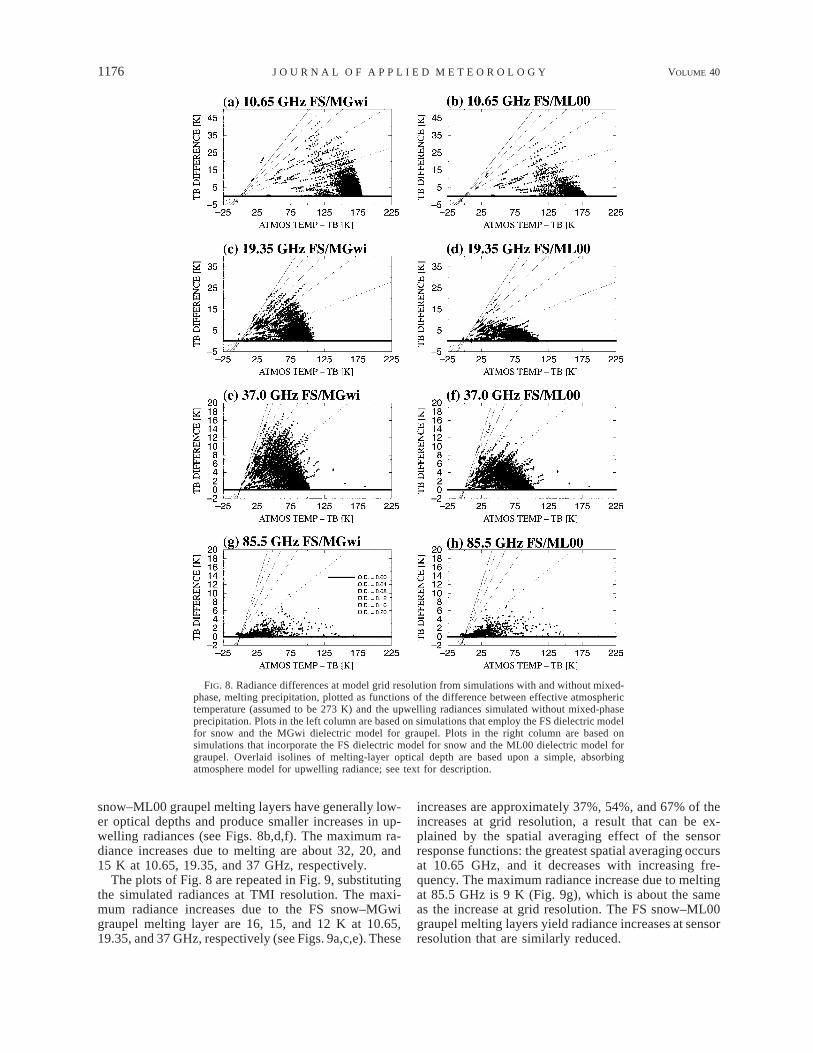
1176 VOLUME 40J O U R N A L O F A P P L I E D M E T E O R O L O G Y
FIG. 8. Radiance differences at model grid resolution from simulations with and without mixed-phase, melting precipitation, plotted as functions of the difference between effective atmospherictemperature (assumed to be 273 K) and the upwelling radiances simulated without mixed-phaseprecipitation. Plots in the left column are based on simulations that employ the FS dielectric modelfor snow and the MGwi dielectric model for graupel. Plots in the right column are based onsimulations that incorporate the FS dielectric model for snow and the ML00 dielectric model forgraupel. Overlaid isolines of melting-layer optical depth are based upon a simple, absorbingatmosphere model for upwelling radiance; see text for description.
snow–ML00 graupel melting layers have generally low-er optical depths and produce smaller increases in up-welling radiances (see Figs. 8b,d,f). The maximum ra-diance increases due to melting are about 32, 20, and15 K at 10.65, 19.35, and 37 GHz, respectively.
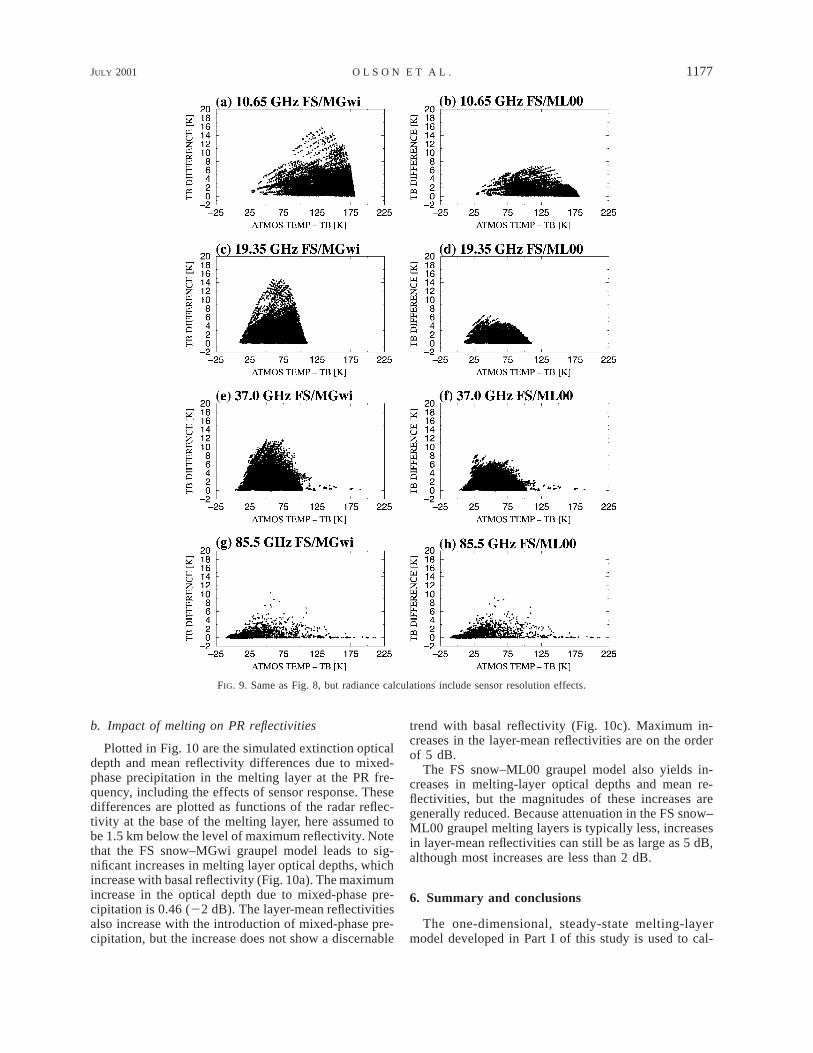
The plots of Fig. 8 are repeated in Fig. 9, substitutingthe simulated radiances at TMI resolution. The maxi-mum radiance increases due to the FS snow–MGwigraupel melting layer are 16, 15, and 12 K at 10.65,19.35, and 37 GHz, respectively (see Figs. 9a,c,e). These
increases are approximately 37%, 54%, and 67% of theincreases at grid resolution, a result that can be ex-plained by the spatial averaging effect of the sensorresponse functions: the greatest spatial averaging occursat 10.65 GHz, and it decreases with increasing fre-quency. The maximum radiance increase due to meltingat 85.5 GHz is 9 K (Fig. 9g), which is about the sameas the increase at grid resolution. The FS snow–ML00graupel melting layers yield radiance increases at sensorresolution that are similarly reduced.
JULY 2001 1177O L S O N E T A L .
FIG. 9. Same as Fig. 8, but radiance calculations include sensor resolution effects.
b. Impact of melting on PR reflectivities
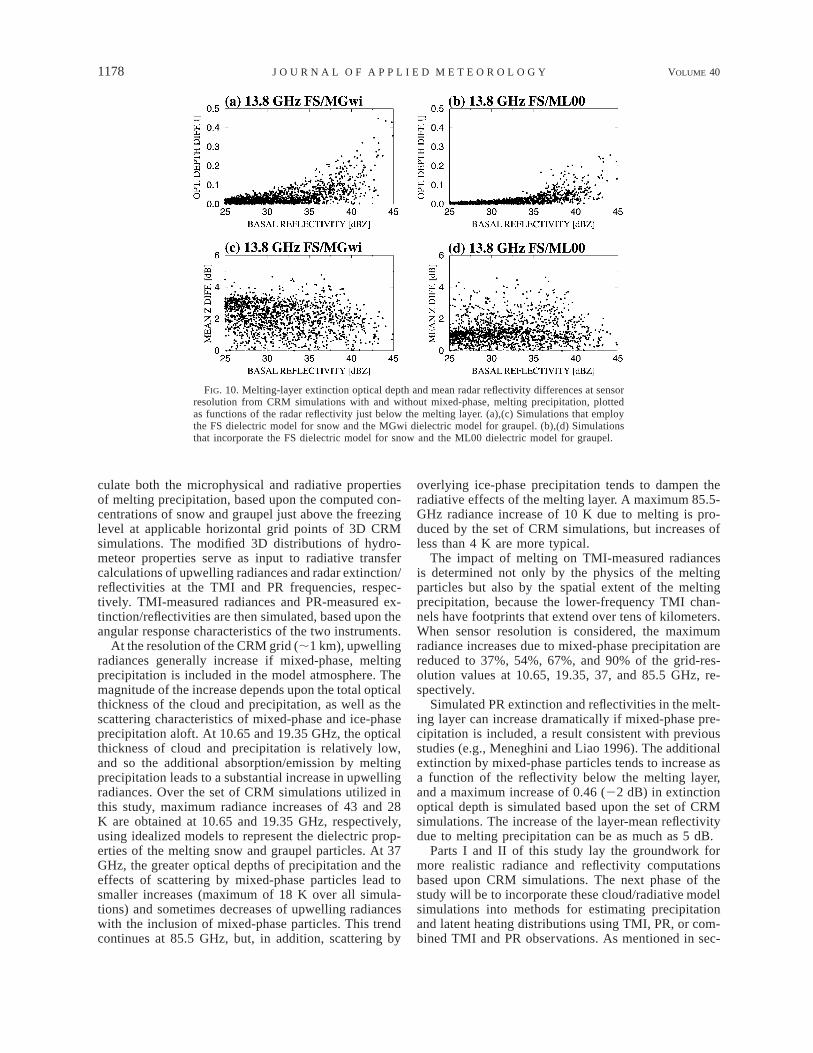
Plotted in Fig. 10 are the simulated extinction opticaldepth and mean reflectivity differences due to mixed-phase precipitation in the melting layer at the PR fre-quency, including the effects of sensor response. Thesedifferences are plotted as functions of the radar reflec-tivity at the base of the melting layer, here assumed tobe 1.5 km below the level of maximum reflectivity. Notethat the FS snow–MGwi graupel model leads to sig-nificant increases in melting layer optical depths, whichincrease with basal reflectivity (Fig. 10a). The maximumincrease in the optical depth due to mixed-phase pre-cipitation is 0.46 (22 dB). The layer-mean reflectivitiesalso increase with the introduction of mixed-phase pre-cipitation, but the increase does not show a discernable
trend with basal reflectivity (Fig. 10c). Maximum in-creases in the layer-mean reflectivities are on the orderof 5 dB.
The FS snow–ML00 graupel model also yields in-creases in melting-layer optical depths and mean re-flectivities, but the magnitudes of these increases aregenerally reduced. Because attenuation in the FS snow–ML00 graupel melting layers is typically less, increasesin layer-mean reflectivities can still be as large as 5 dB,although most increases are less than 2 dB.
6. Summary and conclusions
The one-dimensional, steady-state melting-layermodel developed in Part I of this study is used to cal-
1178 VOLUME 40J O U R N A L O F A P P L I E D M E T E O R O L O G Y
FIG. 10. Melting-layer extinction optical depth and mean radar reflectivity differences at sensorresolution from CRM simulations with and without mixed-phase, melting precipitation, plottedas functions of the radar reflectivity just below the melting layer. (a),(c) Simulations that employthe FS dielectric model for snow and the MGwi dielectric model for graupel. (b),(d) Simulationsthat incorporate the FS dielectric model for snow and the ML00 dielectric model for graupel.
culate both the microphysical and radiative propertiesof melting precipitation, based upon the computed con-centrations of snow and graupel just above the freezinglevel at applicable horizontal grid points of 3D CRMsimulations. The modified 3D distributions of hydro-meteor properties serve as input to radiative transfercalculations of upwelling radiances and radar extinction/reflectivities at the TMI and PR frequencies, respec-tively. TMI-measured radiances and PR-measured ex-tinction/reflectivities are then simulated, based upon theangular response characteristics of the two instruments.
At the resolution of the CRM grid (;1 km), upwellingradiances generally increase if mixed-phase, meltingprecipitation is included in the model atmosphere. Themagnitude of the increase depends upon the total opticalthickness of the cloud and precipitation, as well as thescattering characteristics of mixed-phase and ice-phaseprecipitation aloft. At 10.65 and 19.35 GHz, the opticalthickness of cloud and precipitation is relatively low,and so the additional absorption/emission by meltingprecipitation leads to a substantial increase in upwellingradiances. Over the set of CRM simulations utilized inthis study, maximum radiance increases of 43 and 28K are obtained at 10.65 and 19.35 GHz, respectively,using idealized models to represent the dielectric prop-erties of the melting snow and graupel particles. At 37GHz, the greater optical depths of precipitation and theeffects of scattering by mixed-phase particles lead tosmaller increases (maximum of 18 K over all simula-tions) and sometimes decreases of upwelling radianceswith the inclusion of mixed-phase particles. This trendcontinues at 85.5 GHz, but, in addition, scattering by
overlying ice-phase precipitation tends to dampen theradiative effects of the melting layer. A maximum 85.5-GHz radiance increase of 10 K due to melting is pro-duced by the set of CRM simulations, but increases ofless than 4 K are more typical.
The impact of melting on TMI-measured radiancesis determined not only by the physics of the meltingparticles but also by the spatial extent of the meltingprecipitation, because the lower-frequency TMI chan-nels have footprints that extend over tens of kilometers.When sensor resolution is considered, the maximumradiance increases due to mixed-phase precipitation arereduced to 37%, 54%, 67%, and 90% of the grid-res-olution values at 10.65, 19.35, 37, and 85.5 GHz, re-spectively.
Simulated PR extinction and reflectivities in the melt-ing layer can increase dramatically if mixed-phase pre-cipitation is included, a result consistent with previousstudies (e.g., Meneghini and Liao 1996). The additionalextinction by mixed-phase particles tends to increase asa function of the reflectivity below the melting layer,and a maximum increase of 0.46 (22 dB) in extinctionoptical depth is simulated based upon the set of CRMsimulations. The increase of the layer-mean reflectivitydue to melting precipitation can be as much as 5 dB.
Parts I and II of this study lay the groundwork formore realistic radiance and reflectivity computationsbased upon CRM simulations. The next phase of thestudy will be to incorporate these cloud/radiative modelsimulations into methods for estimating precipitationand latent heating distributions using TMI, PR, or com-bined TMI and PR observations. As mentioned in sec-
JULY 2001 1179O L S O N E T A L .
tion 1, a Bayesian framework for directly estimatingprecipitation and latent heating profiles using cloud/ra-diative model simulations has been developed by theauthors. This method will be employed to determine thesensitivity of precipitation/latent heating estimates to thephysical parameterization of melting in the supportingmodel simulations.
Acknowledgments. The authors thank Nicolas Viltard,Brad Ferrier, Daniel Johnson, Robert Meneghini, LiangLiao, and Gene Poe for their helpful suggestionsthroughout the development of this study. The work wasfunded by the TRMM Science Program.
REFERENCES
Bauer, P., L. Schanz, and L. Roberti, 1998: Correction of three-di-mensional effects for passive microwave remote sensing of con-vective clouds. J. Appl. Meteor., 37, 1619–1632.
——, J. P. V. Poiares Baptista, and M. Iulis, 1999: On the effect ofthe melting layer on microwave emission of clouds over theocean. J. Atmos. Sci., 56, 852–867.
——, A. Khain, A. Pokrovsky, R. Meneghini, C. Kummerow, F. Mar-zano, and J. P. V. Poaires Baptista, 2000: Combined cloud–mi-crowave radiative transfer modeling of stratiform rainfall. J. At-mos. Sci., 57, 1082–1104.
Fabry, F., and W. Szyrmer, 1999: Modeling of the melting layer. PartII: Electromagnetic. J. Atmos. Sci., 56, 3593–3600.
Heymsfield, A. J., and C. M. R. Platt, 1984: A parameterization ofthe particle size spectrum of ice clouds in terms of the ambienttemperature and the ice water content. J. Atmos. Sci., 41, 846–855.
Kummerow, C., W. S. Olson, and L. Giglio, 1996: A simplifiedscheme for obtaining precipitation and vertical hydrometeor pro-files from passive microwave sensors. IEEE Trans. Geosci. Re-mote Sens., 34, 1213–1232.
Liebe, H. J., 1985: An updated model for millimeter wave propagationin moist air. Radio Sci., 20, 1069–1089.
Liou, K-N., 1992: Radiation and Cloud Processes in the Atmosphere:Theory, Observation and Modeling. Oxford University Press,487 pp.
Maxwell-Garnett, J. C., 1904: Colors in metal glasses and in metallicfilms. Philos. Trans. Roy. Soc. London, 203A, 385–420.
Meneghini, R., and L. Liao, 1996: Comparisons for cross sectionsfor melting hydrometeors as derived from dielectric mixing for-mulas and a numerical method. J. Appl. Meteor., 35, 1658–1670.
——, and ——, 2000: Effective dielectric constants of mixed-phasehydrometeors. J. Atmos. Oceanic Technol., 17, 628–640.
Mie, G., 1908: Beitrage zur Optik truber Medien, speziell kolloidalerMetallosungen (Contributions to the optics of turbid media, par-ticularly of colloidal metal solutions). Ann. Phys., 25, 377–445.
Olson, W. S., and C. D. Kummerow, 1996: Simulated retrieval ofprecipitation profiles from TRMM Microwave Imager and pre-cipitation radar data. Preprints, Eighth Conf. on Satellite Me-teorology and Oceanography, Atlanta, GA, Amer. Meteor. Soc.,248–251.
——, ——, G. M. Heymsfield, and L. Giglio, 1996: A method forcombined passive–active microwave retrievals of cloud and pre-cipitation profiles. J. Appl. Meteor., 35, 1763–1789.
——, P. Bauer, N. F. Viltard, D. E. Johnson, W.-K. Tao, R. Meneghini,and L. Liao, 2001: A melting-layer model for passive/activemicrowave remote sensing applications. Part I: Model formu-lation and comparison with observations. J. Appl. Meteor., 40,1145–1163.
Petty, G. W., 1994: Physical retrievals of over-ocean rain rate frommultichannel microwave imagery. Part I: Theoretical character-istics of normalized polarization and scattering indices. Meteor.Atmos. Phys., 54, 79–99.
Rickenbach, T. M., and S. A. Rutledge, 1998: Convection in TOGACOARE: Horizontal scale, morphology, and rainfall production.J. Atmos. Sci., 55, 2715–2729.
Roberti, L., J. Haferman, and C. Kummerow, 1994: Microwave ra-diative transfer through horizontally inhomogeneous precipitat-ing clouds. J. Geophys. Res., 99, 16 707–16 718.
Robinson, W., C. Kummerow, and W. S. Olson, 1992: A techniquefor matching the resolution of microwave measurements fromthe SSM/I instrument. IEEE Trans. Geosci. Remote Sens., 30,419–429.
Schols, J., J. Haferman, J. Weinman, C. Prabhakara, M. Cadeddu,and C. Kummerow, 1997: Polarized microwave radiation modelof melting deformed hydrometeors. Preprints, Ninth Conf. onAtmospheric Radiation, Long Beach, CA, Amer. Meteor. Soc.,270–273.
Weinman, J. A., and R. Davies, 1978: Thermal microwave radiancesfrom horizontally finite clouds of hydrometeors. J. Geophys.Res., 83, 3099–3107.
Wilheit, T. T., 1979: A model for the microwave emissivity of theocean’s surface as a function of wind speed. IEEE Trans. Geosci.Electron., GE-17, 244–249.
Related Documents