1 A mathematical model of the tetrapyrrole biosynthesis pathway Problem presented by: Alison Smith and Michael Moulin (Cambridge). Report by: John Ward (Loughborough), Michael Moulin (Cambridge), Francois Feugier (Newcastle) and Saul Hazledine (John Innes Centre). Study group contributors: Alistair Middleton, Eleanor Norris, Markus Owen, Jonathan Wattis (all Nottingham) and Ed Green (Columbia, USA). Abstract The tetrapyrrole biosynthesis pathway is a key part in chlorophyll production and is essen- tial for plant survival. It involves numerous interacting compounds and, crucially, light. The understanding of the complex regulation processes involved has been the focus of extensive experimental research providing a large source of data. A particular set of data, concerned with the modelling described in this report, involves 24 hour timecourse data from seedlings exposed to constant light, following a three day period of growth from seed in darkness. This data includes the levels of key components such as chlorophyll, ATP, chlorophyllide and proto- chlorophyllide. Amongst the questions posed in the study-group were: i) Can the timecourse data be predicted by a model? ii) Can it predict the differences in levels of various components in found mutant strains. To address these questions, we present in this report a model consisting of a coupled system of nonlinear ODEs that describes a simplified version of the tetrapyrrole pathway based on mass action laws. Model simulations produced results that agree qualitatively well with most, but not all, of the available timecourse data obtained from wild-type and mutant strains. Nearly all of the model’s parameters are not known, so the values used in these simulations are based on estimates of the relative timescales of the reactions. An attempt at improving these estimates using data fitting techniques is also discussed. 1 Introduction Tetrapyrroles are the most abundant pigment molecules on the planet, and chlorophyll is the only biological molecule visible from space. Chlorophyll is present only in photosynthetic organisms whereas haem (a key compound in tetrapyrrole synthesis) is universally found in all organisms, including bacteria, fungi, plants and animals. Plants also contain two other tetrapyrroles, sirohaem and phytochromobilin. These molecules are cofactors for many pro- teins involved in different plants functions such as light harvesting, photoreception or in nutri- ent assimilation and detoxification. The tetrapyrroles are synthesised by a common branched pathway which can be divided into four parts, consisting of a main branch, that serves to provide the intermediates for the other three branches, and branches involved in the synthesis of sirohaem, chlorophyll and haem. 1.1 Background on the regulation of the pathway The compounds sirohaem, chlorophyll and haem are all essential for plant survival, but the amount of each compund the plant requires varies greatly. This results in competition for

Welcome message from author
This document is posted to help you gain knowledge. Please leave a comment to let me know what you think about it! Share it to your friends and learn new things together.
Transcript

1
A mathematical model of the tetrapyrrole biosynthesis
pathway
Problem presented by: Alison Smith and Michael Moulin (Cambridge).Report by: John Ward (Loughborough), Michael Moulin (Cambridge), Francois Feugier(Newcastle) and Saul Hazledine (John Innes Centre).Study group contributors: Alistair Middleton, Eleanor Norris, Markus Owen, JonathanWattis (all Nottingham) and Ed Green (Columbia, USA).
Abstract
The tetrapyrrole biosynthesis pathway is a key part in chlorophyll production and is essen-tial for plant survival. It involves numerous interacting compounds and, crucially, light. Theunderstanding of the complex regulation processes involved has been the focus of extensiveexperimental research providing a large source of data. A particular set of data, concernedwith the modelling described in this report, involves 24 hour timecourse data from seedlingsexposed to constant light, following a three day period of growth from seed in darkness. Thisdata includes the levels of key components such as chlorophyll, ATP, chlorophyllide and proto-chlorophyllide. Amongst the questions posed in the study-group were: i) Can the timecoursedata be predicted by a model? ii) Can it predict the differences in levels of various componentsin found mutant strains.
To address these questions, we present in this report a model consisting of a coupled systemof nonlinear ODEs that describes a simplified version of the tetrapyrrole pathway based onmass action laws. Model simulations produced results that agree qualitatively well with most,but not all, of the available timecourse data obtained from wild-type and mutant strains.Nearly all of the model’s parameters are not known, so the values used in these simulationsare based on estimates of the relative timescales of the reactions. An attempt at improvingthese estimates using data fitting techniques is also discussed.
1 Introduction
Tetrapyrroles are the most abundant pigment molecules on the planet, and chlorophyll is theonly biological molecule visible from space. Chlorophyll is present only in photosyntheticorganisms whereas haem (a key compound in tetrapyrrole synthesis) is universally found inall organisms, including bacteria, fungi, plants and animals. Plants also contain two othertetrapyrroles, sirohaem and phytochromobilin. These molecules are cofactors for many pro-teins involved in different plants functions such as light harvesting, photoreception or in nutri-ent assimilation and detoxification. The tetrapyrroles are synthesised by a common branchedpathway which can be divided into four parts, consisting of a main branch, that serves toprovide the intermediates for the other three branches, and branches involved in the synthesisof sirohaem, chlorophyll and haem.
1.1 Background on the regulation of the pathway
The compounds sirohaem, chlorophyll and haem are all essential for plant survival, but theamount of each compund the plant requires varies greatly. This results in competition for

2
Figure 1: A Schematic diagram of the tetrapyrrole pathway and regulation processes, high-lighting the role of each of the components in the system that feature in the modelling.The variable names of each component is indicated. Note we will adopt the commonly usedshortened names Pchlide and Chlide for protochlorophyllide and chlorophyllide, respectively,throughout this report.
common intermediates of the pathway during their synthesis. One good example is the com-petition, which takes place between haem and chlorophyll. Haem (produced via synthesis,Figure 1) is essential for the plants to perceive light whereas chlorophylls is the key moleculefor the conversion of photons from the sun into useable energy that can fuel plant growth. Inaddition, the flux of the chlorophyll branch is probably around 1000 times greater than thehaem branch making the competition even more pronounced between these two branches [1].
Because of this competition between all end-products, several regulatory mechanisms havebeen demonstrated or proposed. The most characterised is light. Seedlings grown in com-plete darkness are not able to make any chlorophyll, because of the requirement of one ofthe enzymes, protochlorophyllide reductase (POR) for light in its enzymic reaction. Con-versely, when seedlings are put in the light this induces the conversion of protochlorophyllideto chlorophyllide and then chlorophyll (Fig. 1, path labelled (1); henceforth, we will denotethis using Fig. 1(1)). In addition light induces a signal cascade mediated by a photoreceptor(phytochrome) synthesised by the haem branch (Fig. 1(1)) [4]. This results in co-ordinatedsynthesis of the light-harvesting complex proteins, chlorophyll-binding proteins, and also thesynthesis of haemoproteins involved in the photosynthesis apparatus (Fig. 1(2)) [8].
A number of tetrapyrrole intermediates are phototoxic, accumulation causes necrotic le-sions, further complicating the regulation of this pathway. To circumvent the production of

3
Hub 1 Hub 2
Figure 2: Gene network obtained by state-space modelling of the tetrapyrrole pathway [12],showing two major hubs that influence expression of many other genes. Hub 1 = chlorophyll;Hub 2 = enzyme of the trunk branch.
these toxic compounds the haem and cholorophyll branches of the pathway have been proposedto acts a regulators by inhibiting the first step in the tetrapyrrole pathway (Fig. 1(3)&(4)).
Chlorophyll and haem differ in the type of metal ion they contain, chlorophyll containsmagnesium (Mg) and haem contains iron (Fe). The biochemical reaction for metal ion insertionis likely to be similar for both compounds, however, the chelatase enzymes that catalyse thesereactions are quite different. Mg-chelatase requires ATP for activity (Fig. 1(5)) whilst it hasbeen shown that Fe-chelatase is inhibited by ATP. So in the light when ATP levels are higher,the Mg branch of the pathway would be favoured; conversely, in the dark Mg chelation wouldbe reduced.
We think these features make it an ideal system with which to carry out wet/dry studiesof a subcellular network. However, although we have collected a lot of genomic data, we tendto interpret it based on our existing understanding of the pathway and its regulation. Wehave previously carried out a mathematical investigation of this pathway using state spacemodelling. The results shown in Figure 2 demonstrate that an enzyme of the trunk branchof the pathway might play a key role in the regulation Hub 2, unfortunately testing thishypothesis requires extensive analysis and generation of specific mutants. We decided insteadto take part in the Maths Study group meeting in order to know if another mathematicalapproach could lead to an objective non-biased model that would allow us to confirm, orotherwise, the regulatory models, and to generate a further series of predictions that we couldtest experimentally.
4
1.2 Questions posed and aims of the modelling
The questions posed are
1. Can a model be built to describe the feedback regulation with the pathway?
• Can it predict the time course data for chlorophyll increase?
• Can it predict the levels of accumulation of intermediates in mutants?
2. Is the state-space model valid?
• Does an alternative analysis of the data implicate a key role of the “trunk branch”enzyme (Hub 2)?
The modelling undertaken during the four days of the meeting and described below at-tempts to tackle the first question, in which a deterministic model is developed to simulatethe experimental work. We did not attempt the second question, indeed this enzyme is notexplicitly considered in the model, though its effects can be investigated by the changing of asingle parameter (A0).
2 Mathematical model
The mathematical model is derived from the tetrapyrrole biosynthesis pathway diagram shownin Figure 1. The pathway does not show all the molecules involved in this process, therebeing several intermediate compounds between, for example, ALA and protoporphyrin IX(namely Uroporphyrinogen III, Coproporphyrinogen III and protoporphyrinogen IX [7]). The13 molecules selected can be viewed as being representative in the process, either as the headof a branching process, stopping points in the absence of light or molecules for which directmeasurement has been made experimentally. Such measurements will help in model validationand parameter estimation (see Section 5).
The kinetics in the model below are the simplest possible based on the Mass Action Law.All of the inhibition processes in this system, namely Flu and haem on ALA output andATP on haem output, act on intermediate production processes rather than directly on themolecules themselves, hence the inhibitors effect is to reduce the reaction rates of productionfor the molecules concerned. The effect of light is modelled as a dimensionless switch functionf(L) as follows
f(L) =
{0 No light,1 Light on.
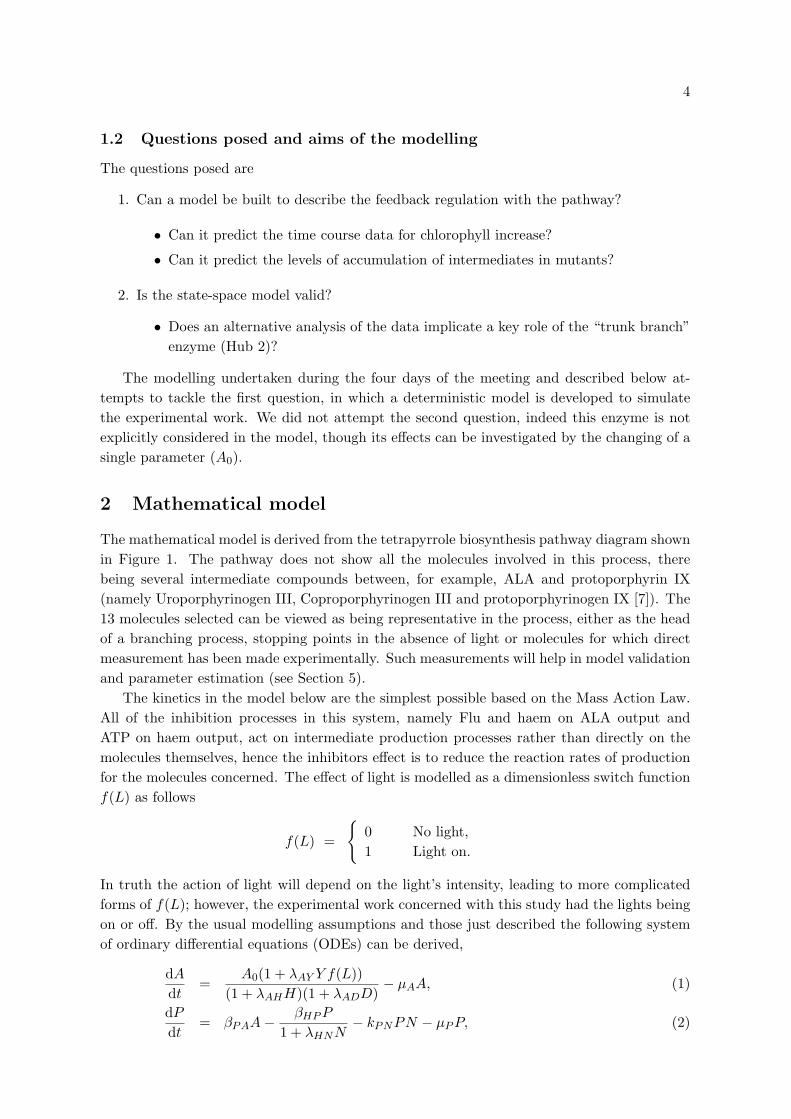
In truth the action of light will depend on the light’s intensity, leading to more complicatedforms of f(L); however, the experimental work concerned with this study had the lights beingon or off. By the usual modelling assumptions and those just described the following systemof ordinary differential equations (ODEs) can be derived,
dAdt
=A0(1 + λAY Y f(L))
(1 + λAHH)(1 + λADD)− µAA, (1)
dPdt
= βPAA−βHPP
1 + λHNN− kPNPN − µPP, (2)

5
Molecule VariableALA A
Protoporphyrin IX P
Haem H
Haemoproteins h
Active haemoproteins Q
Phytochrome Y
Chlorophyll Proteins S
Pchlide (protochlorophyllide) D
Chlide (chlorophyllide) W
Chlorophyll C
Membrane bound chlorophyll M
Metabolites G
ATP N
Table 1: Variables used in the model.
dHdt
=βHPP
1 + λHNN− µHH − βHYH − khHhH, (3)
dQdt
= khHhH − µQQ, (4)
dYdt
= βHYH − βY SY f(L)− µY Y, (5)
dhdt
= H0(1 + λhY Y f(L))− µhh− khHhH, (6)
dDdt
= kPNPN − βDW f(L)D − µDD, (7)
dWdt
= βDW f(L)D − βWW, (8)
dCdt
= βWW − kSCSC − µCC, (9)
dSdt
= βY SY f(L)− µSS − kSCSC, (10)
dMdt
= kSCCS − µMM, (11)
dGdt
= kGMNMf(L)− βG(1 + δGLf(L))G+G0(t), (12)
dNdt
= δNGβG(1 + δGLf(L))G+ kNQMQf(L)− µNN − kNMNMf(L), (13)
The variables are listed in Table 1 and correspond to the bracketed letters in Figure 1. The onlyfeature of the model that has not been discussed so far is the function G0(t) in equation (12).This represents metabolite sources other than that obtained from photosynthesis, includingnutrients still in the seed and that obtained from soil or growth media.
To close the system of ODEs we need a set of initial conditions. With regards to theexperimental work concerned, we assume the light is switched on at t = 0 (in simulationst = 10) and all the variables start at the steady-state values for the case f(L) = 0. We notefor a plant that has never been exposed to light we have S = 0,W = 0, C = 0 and M = 0,corresponding to a plant without chlorophyll.

6
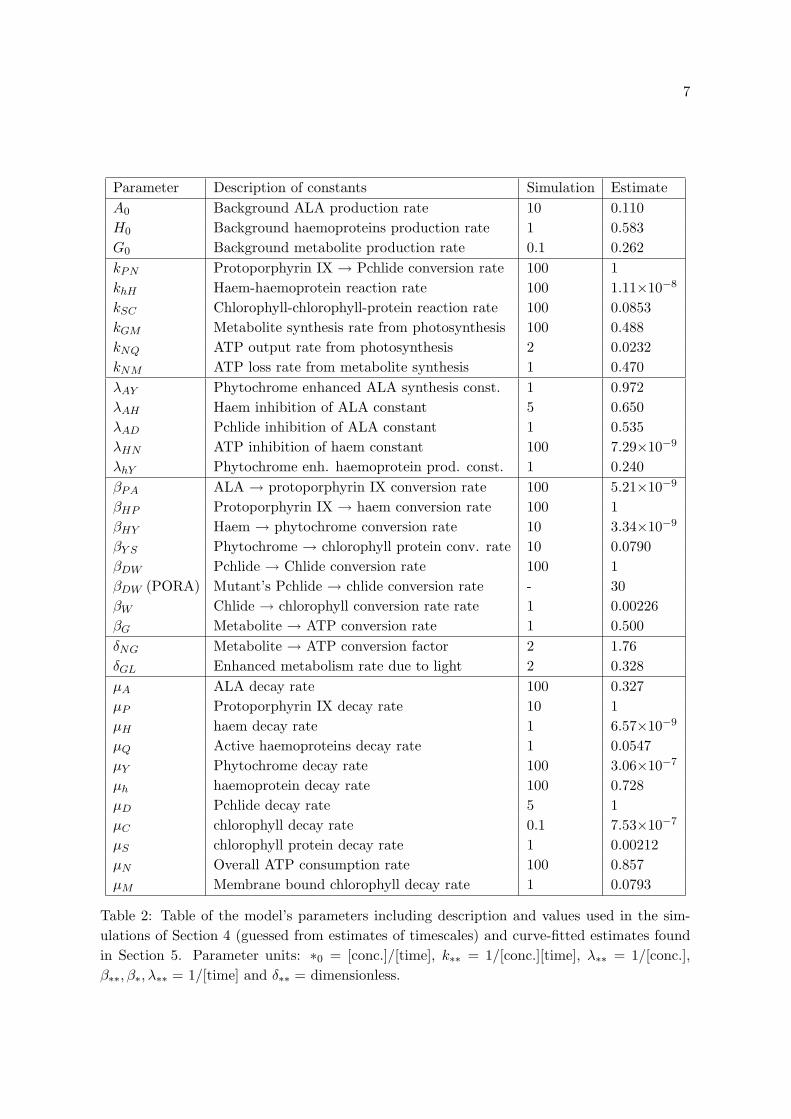
A description of all of the parameters are listed in Table 2.
2.1 Quasi-steady approximations
It is routine at this point to determine where possible relative timescales of each of the processesin the system; these can often be exploited to simplify a system of ODEs, by expressing someof the variables in terms of the others in the form of algebraic equations. If all the reactionrates were known, then this process can be made systematic. However, lacking such data wetook a more heuristic approach. Further work in the parameter estimation process may gosome way to assist in going the systematic route.
The overall timescale of interest is about 24 hours and the “slow” events seem to occur on atimescale of hours. Reactions and gene expression will occur much faster (on the order of min-utes). Experience of plants surviving and staying green overnight suggest to us that changesin stable chlorophyll (M) and metabolites (G) is rather slow, and experimental time-coursedata suggests that Chlide (W ) and active-haemoproteins (Q) also take a few hours to changeor decay. For the remaining variables we debated which were the fast (seconds), medium(minutes) and slow (hours) timescales and proposed the following quasi-steady assumptions.
Y ∼ βHYH
βY Sf(L) + µY, D ∼ kPNPN
βDW f(L) + µD, (14)
h ∼ H0(1 + λhY Y f(L))khHH + µh
∼ 1khHH
(βHPP
1 + λHNN− µHH − βHYH
), (15)
S ∼ βY SY f(L)kSCC + µS
∼ βWW − µCC
kSCC, (16)
A ∼ A0
µA
(1 + λAY Y f(L))(1 + λAHH)(1 + λADD)
∼ 1βPA
(βHPP
1 + λHNN+ kPNPN + µPP
), (17)
N ∼δNGβG(1 + δGLf(L))G+ kNQMQf(L)
kNMMf(L) + µN. (18)
It can be shown by examination of these expressions that it is possible to express all the quasi-steady variables in terms of the slow variables M,G,W and Q, though care would be needed asmultiple solutions are possible. The complexity of these terms prevents easy simplification ofthe full system by this route and, consequently, no further progress was made in this analysis.
2.2 Steady-state analysis
Since the model does not take into account plant growth, the steady-state analysis summarisedhere will only be of relevance for the initial conditions, at which the plant is exposed tolight for the first time. For such a plant, the Pchlide-Chlide and phytochrome-chlorophyllprotein pathways will always have been blocked, leading to S = W = C = M = 0 (i.e. nochlorophyll production). If the remaining slow processes (involving G and Q, see Section 2.1)operate sufficiently fast in terms of the plant growth timescale, then the steady-state valuescorresponding to f(L) = 0 should provide appropriate initial conditions for the simulations tofollow.
In the absence of light the non-zero steady-states, denoted with a ∗, eventually satisfy,
A∗A =
µDA0
µA(1 + λAHH∗)(µD + λADkPNP ∗N∗), (19)
7
Parameter Description of constants Simulation EstimateA0 Background ALA production rate 10 0.110H0 Background haemoproteins production rate 1 0.583G0 Background metabolite production rate 0.1 0.262kPN Protoporphyrin IX → Pchlide conversion rate 100 1khH Haem-haemoprotein reaction rate 100 1.11×10⁻⁸
kSC Chlorophyll-chlorophyll-protein reaction rate 100 0.0853kGM Metabolite synthesis rate from photosynthesis 100 0.488kNQ ATP output rate from photosynthesis 2 0.0232kNM ATP loss rate from metabolite synthesis 1 0.470λAY Phytochrome enhanced ALA synthesis const. 1 0.972λAH Haem inhibition of ALA constant 5 0.650λAD Pchlide inhibition of ALA constant 1 0.535λHN ATP inhibition of haem constant 100 7.29×10⁻⁹
λhY Phytochrome enh. haemoprotein prod. const. 1 0.240βPA ALA → protoporphyrin IX conversion rate 100 5.21×10⁻⁹
βHP Protoporphyrin IX → haem conversion rate 100 1βHY Haem → phytochrome conversion rate 10 3.34×10⁻⁹
βY S Phytochrome → chlorophyll protein conv. rate 10 0.0790βDW Pchlide → Chlide conversion rate 100 1βDW (PORA) Mutant’s Pchlide → chlide conversion rate - 30βW Chlide → chlorophyll conversion rate rate 1 0.00226βG Metabolite → ATP conversion rate 1 0.500δNG Metabolite → ATP conversion factor 2 1.76δGL Enhanced metabolism rate due to light 2 0.328µA ALA decay rate 100 0.327µP Protoporphyrin IX decay rate 10 1µH haem decay rate 1 6.57×10⁻⁹
µQ Active haemoproteins decay rate 1 0.0547µY Phytochrome decay rate 100 3.06×10⁻⁷
µh haemoprotein decay rate 100 0.728µD Pchlide decay rate 5 1µC chlorophyll decay rate 0.1 7.53×10⁻⁷
µS chlorophyll protein decay rate 1 0.00212µN Overall ATP consumption rate 100 0.857µM Membrane bound chlorophyll decay rate 1 0.0793
Table 2: Table of the model’s parameters including description and values used in the sim-ulations of Section 4 (guessed from estimates of timescales) and curve-fitted estimates foundin Section 5. Parameter units: ∗0 = [conc.]/[time], k∗∗ = 1/[conc.][time], λ∗∗ = 1/[conc.],β∗∗, β∗, λ∗∗ = 1/[time] and δ∗∗ = dimensionless.
8
A∗P =
1βPA
(βHP
1 + λHNN∗ + kPNN∗ + µP
)P ∗, (20)
P ∗ =(1 + λHNN
∗)βHP
(µH + βHY +
khHH0
µh + khHH∗
)H∗, (21)
Q∗ = khHh∗H∗/µQ, (22)
Y ∗ = βHYH∗/µY , (23)
D∗ = kPNP∗N∗/µD, (24)
h∗ = H0/(µh + khHH∗), (25)
G∗ = G∗0/βG, (26)
N∗ = δNGG∗0/µN , (27)
which are 9 expressions derived from the respective equations (1)-(7), (12) and (13), where(24) is used to obtain (19). We note we have used A∗
A and A∗P to emphasise that the steady-
state expressions for ALA result from the “A” and “P” equations (1) and (2), respectively.The parameter G∗
0 is a “representative” metabolite feed rate at the time the light is switchedon.
Substitution of (21) into the equation resulting from that formed by writing (19)=(20)results with a quintic polynomial in H∗ (details omitted in this discussion due to the ratherugly nature of the coefficients). In principle, this could mean that there may be 5 physicalsolutions of H∗ (i.e. real and positive) representing 5 different “valid” steady-states. However,examination of the signs of the coefficients of successive powers in the quintic reveal that thereis only one change of sign, which, by Descartes’ Rule of Signs (see [9]), means that there isone and only one root H∗ that is positive and real; i.e. only one of the 5 roots is biologicallyrelevant. Using this root, all the other steady-state terms can be found uniquely using (19)-(25). In practice, it is simpler to numerically solve the system (1)-(13) for f(L) = 0 longenough so each of the variables have reached their steady-state values, and use these as initialconditions in the simulations.
3 Experimental results
The evolution of various components of the pathway as measured in experiments are shownin Figure 3, namely, the levels of Pchlide and Chlide (a), chlorophyll (b) and ATP levels(amongst others, (c)). We observed that Pchlide levels drop dramatically on exposure tolight, apparently increasing slowly after 10 hours or so. Meanwhile Chlide levels has increasedsignificantly over the first 7-8 hours, slowing down and perhaps saturating by 24 hours. Thispattern is strongly reflected in the levels of Chlorophyll. ATP levels in both the wild-typeand mutant rise sharply during the first hour and then fall away over a longer timescale asobserved in Figure 3(c). Capturing the qualitative forms of these curves using the modelproposed above is the aim of the first part of the next section.
4 Simulation results
We run the simulations of the model using parameters that give reasonably comparable resultswith experimental observations in a qualitative sense. The parameter values are listed in the3rd column of Table 2. Initial choices of parameter values were selected based on estimates

9
(a) (b)
(c)
Figure 3: Time evolution of (a) Pchlide (black squares) and Chlide (white circles), (b) Chloro-phyll and (c) ATP levels (amongst others, see graph labelling) measured for a plant exposedto light following 3 days in darkness after germination. Figure (c) is taken from Oelze-Karowand Butler [10].
of timescales, critical concentrations etc., in which the values of 1, 10, 100 represented, forexample, slow, medium and fast timescales, respectively. These initial paremeter estimateswere then tweaked to get solutions that agreed reasonably with experimental results.
The model equations were simulated using Mathematica. These simulations consisted oftwo phases: a first phase of ten time units in dark condition where F = 0, then a light phaseusing F = 1. By t = 10 all the variables have typically settled to a steady-state and are usedas initial conditions at the point the light is switched on. This should be a good approximationto the plant’s condition following its first 3 days following germination in darkness.
Shown in Figure 4 is the evolution of each of the 13 variables using the standard parameterset, which represents the “wild-type” plant. For the purposes of matching timescales of themodel solutions with the experimental data shown in Figure 3, two simulated time unitsrepresents about 24 hours. The simulations predict a very rapid decay of the phytotoxicchemicals like Pchlide, being in agreement with the experimental data described in Section3. Furthermore, the predicted increase of stable chlorophyll and Chlide on longer timescalesis again in agreement with observation. The increase levels of ATP is perhaps too sharp, butthe general rapid increase and gradual decay is in broad agreement to the picture shown inFigure 3(c).
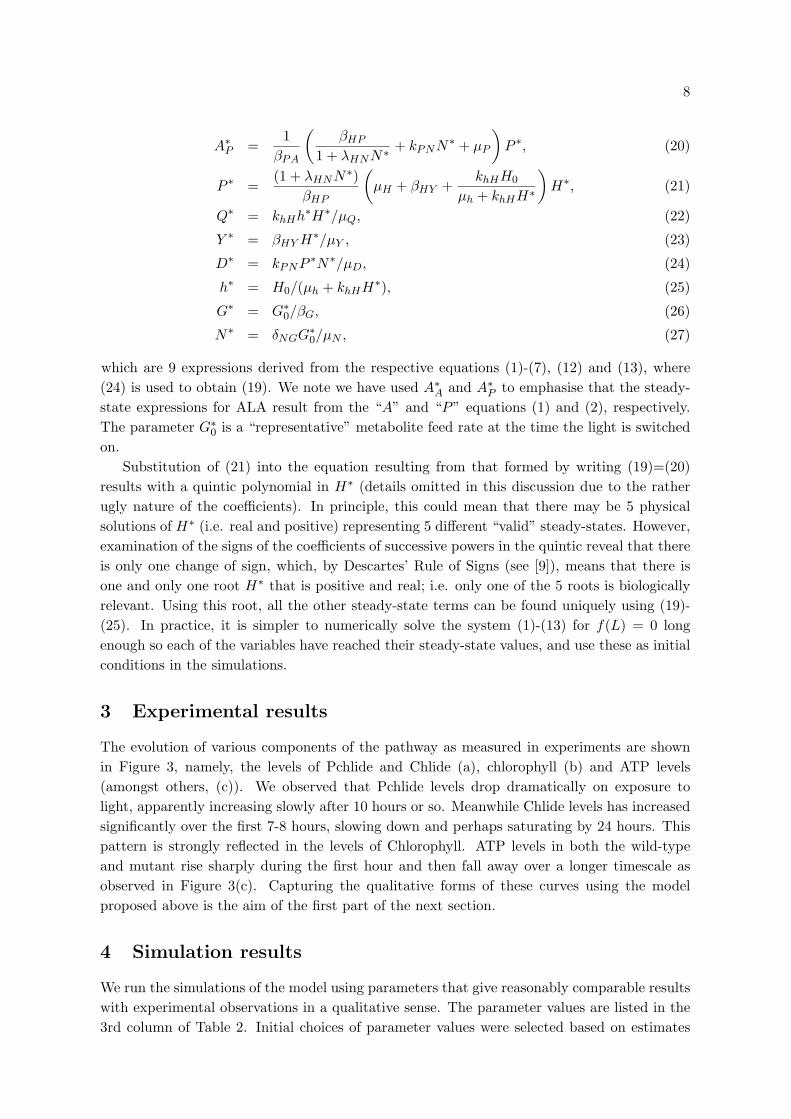
To further validate the model, simulations of mutant strains were performed and the resultscompared with experimental studies. Figure 5 shows the model solutions of a hy1 mutant,

10
Figure 4: Time evolution of each variables for the wild type strain. A single time unit for thisdata is approximately 12 hours.
which has reduced expression of haem oxygenase, an enzyme responsible for the conversion ofhaem to phytochrome. In the hy1 mutation leads to a reduced rate of phytochrome synthesisto about half that of the wild type (parameter βHY ). The experimental studies only reportedcomparisons of Chlorophyll levels between the wild-type and mutant. In agreement with ex-periments, the model predicts only a marginal reduction in chlorophyll levels. The simulationspredict that the reduction in phytochrome output in the mutant leads to enhanced accumula-tion of haem and consequently activated haemoprotein production. The reduced phytochromelevels, however, lead to the reduction in chlorophyll protein production and hence lower sta-ble chlorophyll levels. In addition, an increase of the haem level affects the production oftetrapyrrole intermediate (Figure 5, Proto (P)) by inhibiting the first step of the tetrapyrrolebiosynthesis
Interestingly, metabolite and ATP levels appear to be unaffected in Figure 5, as well as inFigures 6 and 7. Examination of the model’s parameter and these simulation results show thatthe background production rate of the metabolite (G0 = 0.1time units−1) far exceeds thatof Chlorophyll based production (kGMNMf(L) = O(0.0001)time units−1). This is probablyunrealistic and will need to be investigated in the future.
The gun5 mutant expresses altered Mg-chelatase activity, which is involved in the conver-sion of protoporphyrin IX to Mg-protoporphyrin IX, intermediate of the Pchlide synthesis.The gun5 mutation leads to a reduced rate of Pchlide synthesis to about half that of the wildtype. The model’s prediction of this mutant’s response to light is depicted in Figure 6. Thereduction in stable chlorophyll (M) in the mutant is quite significant. These results are incomplete accordance with Mochizuki et al.[5] that gun5 mutants accumulate less Chlorophyllthan the wild type. All components downstream of the protoporphyrin IX-Pchlide pathway
11
Figure 5: Time evolution of each variables for the hy1 mutant (red, βHY = 5) and the wildtype (blue, βHY = 10).
have been reduced to about half the levels of the wild-type. Surprisingly, the model predictsthat the levels of all other components are almost identical between the mutant and wild-typestrains.
Figure 7 shows the response from the PORA over-expressing line, which over expressesan enzyme that enhances the rate of Pchlide-Chlide conversion (increased βDW ). The resultssuggest that response is almost identical to that of the wild-type. This does not compare wellwith experimental results as levels of stable-chlorophyll (M) are recorded to be higher in theover-expressing line than the wild-type. The most likely explanation for this discrepancy isthe choice of parameter values, which were not compiled with a great deal of sophistication.Another possibility is that there is another control step not accounted for by the model,however, much more scrutiny of the parameters is required before any such conclusions canbe drawn.
5 Parameter estimation
5.1 Introduction
After constructing a mathematical model of a system, it is useful to see how closely the outputof the model matches available experimental data. In order fit the model to the data, a set ofparameters must be chosen that control the model to optimally reproduce the real world data.In the proposed model for the tetrapyrrole biosynthesis pathway, these are the parameterslisted in Table 2.
One way of finding an optimal set of parameters is to check all combinations, measuring

12
Figure 6: Time evolution of each variable for the gun5 mutant (red, kPN = 50) and the wildtype (blue, kPN = 100).
Figure 7: Time evolution of each variable for the PORA over-expressing line (red, βDW = 200)and the wild type (blue, βDW = 100).
13
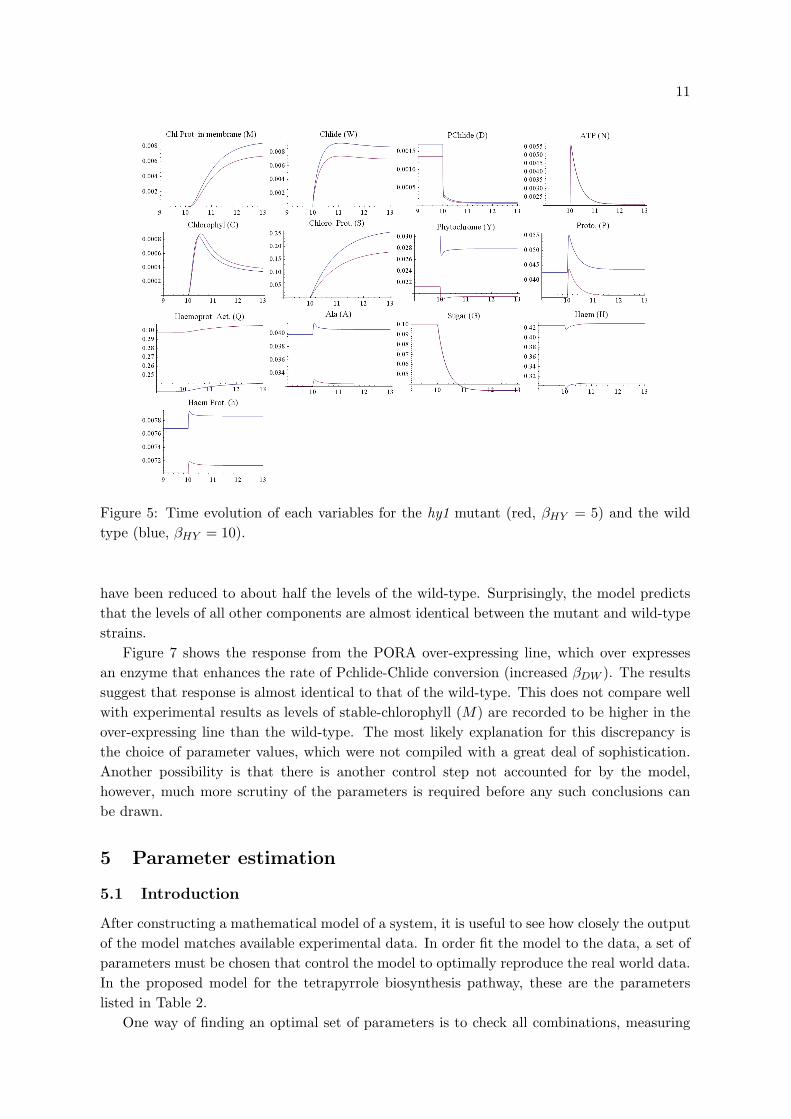
Figure 8: Parameter values generated from the SRES algorithm are used to integrate themodel. The results are then compared to experimental data. Each mutant is expected todiffer by only a single parameter value. The applicable parameter is changed, the modelintegrated and a comparison done with mutant experimental data.
how well each combination fits the experimental data. However, this method rapidly becomesunfeasible as the number of parameters increases. As an example, if there are 10 parametersand only 8 different parameter values are considered, the model has to be fitted to the data810 times. In order to reduce this computational workload, more discerning methods exist forproposing and combining parameter values.
5.2 Method
We chose a parameter estimation method known as SRES, the Stochastic Ranking EvolutionStrategy [11]. SRES has been shown to perform well with models of biochemical pathways [6]

14
and is freely available as a library for C programmers [3].The algorithm works by testing around 300 sets of parameters in a single step known as a
generation. The best sets of parameters are then selected to breed new parameters, which aresubjected to small changes in a step known as mutation, for the next generation. In order toassess if one set of parameters is better than another, the algorithm requires a fitness functionto be provided by the user. When the fitness function is given a set of parameters, it returnsa number indicating how closely the model fits the experimental data when used with theparameter values. A lower number indicates a better fit and a higher fitness.
An overview of the fitness function we used is given in Figure 8. The experimental datais compared, with data generated from the model, using the Normalised Root Mean SquareDeviation (NRMSD) method. The use of NRMSD allows different measurement scales to becompared by the fitness function. Given n experimental data points y and n data pointsgenerated from the model z, the NRMSD is calculated as:
RMSD =
√√√√√ n∑i=1
(yi − zi)2
n , (28)
NRMSD = RMSDymax − ymin
, (29)
where ymax and ymin are the maximum and minimum values of the data.When calculating a value for the fitness, the wild type chlorophyll experimental results are
given a weighting of 2.0. Intermediates and mutants given a weighting of 1.0 to emphasise theimportance of the chlorophyll production. Currently, there are 36 parameters for the wild-type, one parameter for the mutant and 10 initial conditions to estimate from 40 data points.However, only the PORA over-expressing line is currently being considered and experimentaldata from additional mutants is available.
5.3 Results
Figure 9 shows the fit between experimental and model data after an overnight run of theSRES algorithm over 144000 generations. All parameter values were constrained between 0.0and 1.0 except βDW for the PORA over-expressing line, which could take any value between5.0 and 30.0.
Table 2 shows the parameter values after fitting to experimental data. Table 3 gives theestimated initial conditions. Currently, no units have been considered. Both the parametersand initial conditions are given without specifying their units.
6 Discussion
In this report a mathematical model was developed and studied to describe the tetrapyrroleregulation pathway, in particular response to light exposure after 3 days following germinationin darkness. Simulations of the model seems to produce results that are consistent withexperimental observation, including those of the mutant strains. It should be stressed thatthe results presented in Section 4 and the parameter values shown in Table 2 should not beviewed as definitive. However, the results thus far, particularly regarding the wild-typeand

15
0
0.005
0.01
0.015
0.02
0.025
0.03
0 1 2 3 4 5 6 7 8
Experimental ResultsModel
(a) Chlorophyll in Membrane WT
0
0.05
0.1
0.15
0.2
0.25
0.3
0 1 2 3 4 5 6 7 8
Experimental ResultsModel
(b) Chlorophyll in Membrane PORA o/e
0
2e-11
4e-11
6e-11
8e-11
1e-10
1.2e-10
1.4e-10
1.6e-10
1.8e-10
0 1 2 3 4 5 6 7 8
Experimental ResultsModel
(c) PChilde
0 1e-10 2e-10 3e-10 4e-10 5e-10 6e-10 7e-10 8e-10 9e-10 1e-09
1.1e-09
0 1 2 3 4 5 6 7 8
Experimental ResultsModel
(d) Childe
0
5e-12
1e-11
1.5e-11
2e-11
2.5e-11
3e-11
3.5e-11
0 1 2 3 4 5 6 7 8
Experimental ResultsModel
(e) Protoporphyrin IX
1.15e-08
1.2e-08
1.25e-08
1.3e-08
1.35e-08
1.4e-08
1.45e-08
1.5e-08
0 1 2 3 4 5 6 7 8
Experimental ResultsModel
(f) Haem
Figure 9: Model output compared to experimental results for Chlorophyll and intermediates.
hy1 and gun5 mutant strains, are encouraging and the current model should provide the basisfor further study.
With the limited duration of the studygroup we were principally concerned with gettingthe model to qualitatively predict observed results. However, a serious attempt was madeat systematically determining suitable parameter values using curve fitting techniques withwild-type and mutant time-course data, this being described in Section 5. This is a highlynon-trivial task involving the estimation of about 35 parameters plus initial conditions withabout as many data points. As can be seen from the values in Table 2 there is considerabledisparity between the simulated and curve fitted values, in particularly the relative sizes ofparameters to each other; this may be due to the constraining of values between 0 and 1 inthe curve fitting procedure. However, this work is very much in progress and there are a

16
Variable name Identifier Initial ConditionALA A 0.806765Protoporphyrin IX P 4.6e-11Haem H 1.3e-08Phytochromobilin Y 0.505698Pchlide D 1.97e-10Chlide W 9.28e-11Chlorophyll C 0.384744Chlorophyll proteins S 0.00861472ATP N 0.993669Chlorophyll in membrane M 0.000596312Activated haemoprotein h 0.262178Sugars G 0.806906Stable haem + haemoprotein Q 0.797839
Table 3: Estimated initial conditions after running the SRES algorithm.
number of avenues that can be tried to assist the searching algorithm; this will hopefully beundertaken in the near future.
The modelling focussed on the tetrapyrrole regulation processes for a particular experi-ment. There is certainly considerable potential for further work on the current model, whichthrough improved parametrisation and tweaking of the terms will hopefully be able to providequantitatively accurate reproductions of existing data and provide predictions and insightsthat will motivate further investigation. In broader applications, other regulation processesare known to be important, in particular, it seems, the circadian signal transduction process.Such factors are not accounted for in the current model and offers considerable potential forfuture work.
References
[1] J.E. Cornah, M.J. Terry and A.G. Smith (2003). Trends Plant Sci., 8, 224-230.[2] J.E. Cornah, J.M. Roper, D.P. Singh and A.G. Smith (2002). Biochem J., 362, 423-432.[3] X. Ji and Y. Xu (2006). Bioinformatics. 22, 124-126.[4] A.C. McCormac and M.J. Terry (2002). Plant J., 32, 549-559.[5] N. Mochizuki, J.A. Brusslan, R. Larkin, A. Nagatani and J. Chory (2001). PNAS, 98,
2053-2058.[6] C.G. Moles, P. Mendes and J.R. Banga (2003). Genome Res., 13, 2467-2474.[7] M. Moulin and A.G. Smith (2005). Biochem. Soc. Trans., 33, 737-742.[8] A. Murakami and Y. Fujita (1991). Plant Cell Physiol., 32, 223-230.[9] J.D. Murray, Mathematical Biology 2nd Ed. (1993), Springer-Verlag.[10] H. Oelze-Karow and W.L. Butler (1971). Plant Physiol., 48, 621-625.[11] T.P. Runarsson and X. Yao (2000). IEEE Trans. Evolution. Comput., 4, 284-294.[12] B. Schmid (2006). “Modeling of microarray data for the investigation of the tetrapyrrole
pathway in A. thaliana. Diploma thesis, University of Applied Sciences Weihenstephan.
Related Documents