ORIGINAL ARTICLE A matching pursuit-based signal complexity measure for the analysis of newborn EEG L. Rankine M. Mesbah B. Boashash Received: 8 September 2006 / Accepted: 9 December 2006 / Published online: 13 January 2007 Ó International Federation for Medical and Biological Engineering 2007 Abstract This paper presents a new relative measure of signal complexity, referred to here as relative struc- tural complexity (RSC), which is based on the matching pursuit (MP) decomposition. By relative, we refer to the fact that this new measure is highly dependent on the decomposition dictionary used by MP. The struc- tural part of the definition points to the fact that this new measure is related to the structure, or composi- tion, of the signal under analysis. After a formal defi- nition, the proposed RSC measure is used in the analysis of newborn electroencephalogram (EEG). To do this, firstly, a time–frequency decomposition dic- tionary is specifically designed to compactly represent the newborn EEG seizure state using MP. We then show, through the analysis of synthetic and real new- born EEG data, that the relative structural complexity measure can indicate changes in EEG structure as it transitions between the two EEG states; namely seizure and background (non-seizure). Keywords Matching pursuit Relative structural complexity Coherent dictionary Time–frequency Newborn EEG 1 Introduction The electroencephalogram (EEG) is an important tool in the study of the central nervous system (CNS), particularly in the newborn where it provides high prognostic and diagnostic capabilities [20]. In some cases, the newborn EEG is the only indicator of CNS pathologies, with electrographic seizure events being the most significant indicator of CNS dysfunction [22]. The EEG of newborn patients suffering seizure events can be broadly classified into two main states; namely, background and seizure. The newborn EEG background signal is a complex waveform which, in the first instance, appears to be some form of noisy signal [20]. In fact, it was recently shown that the newborn EEG background can be modelled as a nonstationary stochastic 1/f c process [27]. Newborn EEG seizure, on the other hand, is generally characterized by periods of rhythmic spiking or repetitive sharp waves [18], whose patterns are highly variable, with complex and varied morphology and cover a variety of frequencies. These dynamical changes in structure and frequency infer that the newborn EEG is highly nonstationary. Time– frequency (TF) signal analysis techniques, which have been shown to provide informative representations of signal nonstationarities [5], are highly suitable for the newborn EEG background and seizure states. Quadratic time–frequency distributions (QTFDs), such as the Wigner–Ville, Choi–Williams and Modified B distributions [4], are very useful for the visualization of nonstationary signals in the TF domain. A com- prehensive analysis and characterization of the new- born EEG using QTFDs was previously undertaken by the present authors in [6–9, 27]. The TF analysis revealed significant differences in the TF structure of This work was supported by grants from the NHMRC and ARC. L. Rankine (&) M. Mesbah B. Boashash Perinatal Research Centre, Royal Brisbane and Women’s Hospital, Herston, QLD 4029, Australia e-mail: [email protected] B. Boashash College of Engineering, University of Sharjah, University City, Sharjah, United Arab Emirates 123 Med Bio Eng Comput (2007) 45:251–260 DOI 10.1007/s11517-006-0143-0

Welcome message from author
This document is posted to help you gain knowledge. Please leave a comment to let me know what you think about it! Share it to your friends and learn new things together.
Transcript
ORIGINAL ARTICLE
A matching pursuit-based signal complexity measurefor the analysis of newborn EEG
L. Rankine Æ M. Mesbah Æ B. Boashash
Received: 8 September 2006 / Accepted: 9 December 2006 / Published online: 13 January 2007� International Federation for Medical and Biological Engineering 2007
Abstract This paper presents a new relative measure
of signal complexity, referred to here as relative struc-
tural complexity (RSC), which is based on the matching
pursuit (MP) decomposition. By relative, we refer to
the fact that this new measure is highly dependent on
the decomposition dictionary used by MP. The struc-
tural part of the definition points to the fact that this
new measure is related to the structure, or composi-
tion, of the signal under analysis. After a formal defi-
nition, the proposed RSC measure is used in the
analysis of newborn electroencephalogram (EEG). To
do this, firstly, a time–frequency decomposition dic-
tionary is specifically designed to compactly represent
the newborn EEG seizure state using MP. We then
show, through the analysis of synthetic and real new-
born EEG data, that the relative structural complexity
measure can indicate changes in EEG structure as
it transitions between the two EEG states; namely
seizure and background (non-seizure).
Keywords Matching pursuit � Relative structural
complexity � Coherent dictionary � Time–frequency �Newborn EEG
1 Introduction
The electroencephalogram (EEG) is an important tool
in the study of the central nervous system (CNS),
particularly in the newborn where it provides high
prognostic and diagnostic capabilities [20]. In some
cases, the newborn EEG is the only indicator of CNS
pathologies, with electrographic seizure events being
the most significant indicator of CNS dysfunction [22].
The EEG of newborn patients suffering seizure
events can be broadly classified into two main states;
namely, background and seizure. The newborn EEG
background signal is a complex waveform which, in the
first instance, appears to be some form of noisy signal
[20]. In fact, it was recently shown that the newborn
EEG background can be modelled as a nonstationary
stochastic 1/fc process [27]. Newborn EEG seizure, on
the other hand, is generally characterized by periods of
rhythmic spiking or repetitive sharp waves [18], whose
patterns are highly variable, with complex and varied
morphology and cover a variety of frequencies. These
dynamical changes in structure and frequency infer
that the newborn EEG is highly nonstationary. Time–
frequency (TF) signal analysis techniques, which have
been shown to provide informative representations of
signal nonstationarities [5], are highly suitable for the
newborn EEG background and seizure states.
Quadratic time–frequency distributions (QTFDs),
such as the Wigner–Ville, Choi–Williams and Modified
B distributions [4], are very useful for the visualization
of nonstationary signals in the TF domain. A com-
prehensive analysis and characterization of the new-
born EEG using QTFDs was previously undertaken
by the present authors in [6–9, 27]. The TF analysis
revealed significant differences in the TF structure of
This work was supported by grants from the NHMRC and ARC.
L. Rankine (&) � M. Mesbah � B. BoashashPerinatal Research Centre, Royal Brisbane and Women’sHospital, Herston, QLD 4029, Australiae-mail: [email protected]
B. BoashashCollege of Engineering, University of Sharjah,University City, Sharjah, United Arab Emirates
123
Med Bio Eng Comput (2007) 45:251–260
DOI 10.1007/s11517-006-0143-0
newborn EEG background and seizure signals, with
significant changes in structure occurring as the new-
born EEG progresses from the background to seizure
state, and vice versa.
Although QTFDs have proved extremely useful in
the analysis of the nonstationary newborn EEG, they
are not designed for signal parameterization and usu-
ally require sophisticated image processing techniques
for feature extraction [23, 26, 32]. For this reason,
much attention has recently been directed to the use of
atomic decomposition techniques, such as the matching
pursuit (MP) algorithm [21], using overcomplete TF
dictionaries for TF representation and parameteriza-
tion [16].
An objective of atomic decomposition techniques is
to generate sparse (compact), yet highly informative,
signal representations [13], given a particular over-
complete dictionary. The development and theoretical
study of algorithms which attempt to find the sparsest
representation has been the focus of many researchers
recently [13–15, 17, 30, 31]. However, compact and
informative representations can also be achieved
through the use of a highly coherent TF dictionary [21].
In this paper, we aim to first develop a new relative
measure of signal complexity, referred to as relative
structural complexity (RSC), which is based on MP
decomposition using a coherent TF dictionary. Since
RSC is dependent on the use of a coherent dictionary,
the second aim is to develop a TF dictionary, which is
coherent with some particular newborn EEG signal
structures. Finally, we apply the RSC measure, using
the designed coherent dictionary, to the analysis of
newborn EEG, showing that RSC is an indicator of
structural change in the EEG as it transitions between
the background and seizure states.
2 Signal processing methods
2.1 Time–frequency signal analysis
In the following subsections, we give brief introductions
to the two TF methods mentioned in the introduction;
namely, QTFDs and MP atomic decomposition. It
was stated in the previous section that QTFDs are
extremely useful for visualization of nonstationary
signals in the TF domain but lack the compact repre-
sentation of atomic decomposition techniques such as
MP. Therefore, in this paper, QTFDs are used only for
visualization purposes while the MP atomic decompo-
sition technique is used in the development of the RSC
measure.
2.1.1 Quadratic time–frequency distributions
Quadratic TF distributions are commonly used
methods for obtaining joint TF representations of
nonstationary signals. The fundamental QTFD is the
Wigner–Ville distribution (WVD), from which all
other QTFDs can be obtained by a TF averaging or
smoothing [4].
The WVD of a continuous real signal, s(t), is defined
as
Wzðt; f Þ ¼Z1
�1
Kzðt; sÞe�j2pf s ds ð1Þ
where Kz(t,s) is the instantaneous autocorrelation
function (IAF) given by
Kzðt; sÞ ¼ zðt þ s2Þz�ðt � s
2Þ ð2Þ
and z(t) is the analytic associate of s(t)
ði:e:; zðtÞ ¼ sðtÞ þ jp
R1�1
sðsÞt�s dsÞ [5].
The WVD satisfies a number of desirable mathe-
matical properties. However, application of the WVD
is limited by interference terms, occurring as a result of
the bilinear transformation. These interferences occur
in the case of nonlinear frequency modulated signals
and multicomponent signals, (see [4] for details).
Quadratic time–frequency distributions, belonging
to a class referred to as reduced interference distribu-
tions (RIDs), were introduced in order to attenuate the
interference terms (crossterms), and hence, provide a
better signal representation. The RID used for TF
visualization in this paper is the modified B distribu-
tion, expressed as [3]
qzðt; f Þ ¼Z1
�1
Z1
�1
Gbðt � u; sÞKzðu; sÞe�j2pfs du ds ð3Þ
where
Gbðt; sÞ ¼cosh�2b tR1
�1 cosh�2b f dfð4Þ
is the smoothing time-lag kernel defining the modified
B distribution. This distribution was chosen as it has
been shown, using objective criteria, to provide high
TF resolution and excellent cross term suppression
simultaneously [11]. A discrete version of the modified
B distribution for digital implementation is presented
in [10].
252 Med Bio Eng Comput (2007) 45:251–260
123
2.1.2 Matching pursuit algorithm
Given a discrete signal of length N, s 2 RN ; we con-
sider the problem of representing s as a linear combi-
nation of elements from a large, overcomplete,
dictionary, U 2 RN�M; of M waveforms, where M > N.
The individual waveforms of U are referred to as
atoms, denoted by /i 2 RN ; i ¼ 0; 1; . . . ;M � 1: The
problem of representing s using the dictionary U can
be formulated simply as
s ¼X
i
ai/i ð5Þ
where ai are the atom coefficients. Methods for solving
this problem are referred to as atomic decomposition
techniques.
The MP algorithm is an iterative atomic decompo-
sition technique currently finding application in a
number of engineering areas. Using MP, a signal
s 2 RN can be represented using the overcomplete
dictionary U as follows.
s ¼XP�1
i¼0
ai/i þ RP ¼ sP þ RP ð6Þ
where RP ¼ s� sP is the signal residue and sP is the
signal approximation after the (P – 1)th iteration. The
signal approximation and the residual are updated
through the following iterative process:
Assume R0 = s. For k ¼ 1; . . . ;P;
Rk ¼ Rk�1 ��Rk�1;/k
i
��� ��/ki
sk ¼ sk�1 þ�Rk�1;/k
i
��� ��/ki
ð7Þ
where
i ¼ arg max1�i�M
�Rk�1;/k
i
��� �� ð8Þ
and h:; :i denotes the inner product. The dictionary
atoms are normalized such that ||/i||2 = 1. It can be
easily shown that the orthogonality of Rk + 1 and /ik in
each iteration ensures conservation of energy; that is
jjsjj22 ¼XP�1
i¼0
hRi;/ii�� ��2þjjRPjj22 ð9Þ
2.2 Relative structural complexity measure
In many real signal processing applications, such as
machine condition monitoring and newborn EEG
seizure detection, the recorded signal undergoes a
change in structure, as the underlying process gener-
ating the signal undergoes some type of changes. An
analytical method for identifying changes in signal
structure is therefore highly desirable. The proposed
RSC measure, defined in this subsection, is a method
for analyzing changes in signal structure.
2.2.1 Definition of relative structural complexity
When using MP decomposition, we are usually inter-
ested in approximating a signal using the least number
of dictionary atoms while maintaining the most rele-
vant signal information embedded in the original sig-
nal. This is usually accomplished by stopping the MP
iterative process when a suitable criterion, referred to
as the stopping criterion, is met. In this paper, the level
of approximation accuracy, [i.e., signal to error ratio
(SER)], defined as
SERk ¼ 20 log10
jjsjj2jjRkjj2
� �dB ð10Þ
is used as the stopping criterion. The MP process is
stopped when SERk ‡ gD, where gD is the desired
approximation accuracy.
In [2], it was reported that the number of Gabor
atoms (modulated, scaled and translated Gaussian
functions), chosen in a MP approximation, was related
to the complexity1 of a signal. This was demonstrated
with synthetic signals exhibiting limit cycle and chaotic
behaviour constructed from the Duffing equation.
In [21], it was stated that ‘‘a matching pursuit
decomposition in a given dictionary defines a system of
interpretation for signals.’’ Signal components, which
are interpreted well with a given dictionary, are re-
ferred to as coherent structures, and these structures
are indicated by strong correlation with some dictio-
nary atoms. The more coherent a signal is with a dic-
tionary, the larger the correlations between dictionary
atoms and the signal residues [21]. From this, we infer
that the more coherent a signal is with a given dictio-
nary, the fewer MP iterations required to achieve the
desired level of approximation accuracy.
Considering the findings of [ 2, 21], it seems natural
to introduce a new MP-based complexity measure re-
ferred to as RSC, which gives a quantitative indication
of the complexity in interpreting a signal given a
decomposition dictionary.
1 The definition of complexity here is related to the complexity ofthe phase space representation (level of chaotic behaviour) ofthe signal, often used in nonlinear time series analysis [19].
Med Bio Eng Comput (2007) 45:251–260 253
123
Definition [RSC]: Given a decomposition dictionary
U 2 RN�M; we define the RSC of a signal s 2 R
N as the
minimum number of atoms needed by the MP
decomposition to approximate the signal to a desired
level of accuracy, as defined by (10).
As it can be seen from this definition, the RSC is
very dependent on both the chosen decomposition
dictionary and the desired accuracy of approximation.
This dependence justifies the word ‘‘relative’’ in our
definition. This complexity measure has the advanta-
geous ability to be adapted to the signal to be
approximated, given that some a priori information
about the signal is available.
2.2.2 Illustration of RSC using synthetic signals
To illustrate the idea of RSC, we designed the fol-
lowing experiment using synthetically generated sig-
nals. The experiment involved three different TF
dictionaries, which include:
1. Gabor dictionary—this dictionary consists of
translated, scaled and modulated versions of a
Gaussian window [21].
2. Wavelet Packet dictionary—this dictionary con-
sists of approximately Nlog2(N) waveforms [13]
and is simply a family of orthonormal wavelet
bases [21]. The dictionary used in this paper
was built from a Daubechies 10 quadrature mirror
filter.
3. Cosine Packet dictionary—this dictionary also
consists of approximately Nlog2(N) waveforms,
including the standard orthonormal Fourier basis
and a variety of rectangular windowed sinusoids of
various widths and locations [13] (n.b. this dictio-
nary is similar to the real Gabor dictionary).
In this experiment, a number of synthetic signals,
which have varying levels of coherency with the chosen
decomposition dictionary were created. To do this, two
different TF dictionaries were selected. One of the
dictionaries was chosen to be the decomposition dic-
tionary, UD: The second dictionary was used only in
the composition of the synthetic signals (i.e., not used
for signal decomposition), and is referred to as the
alternative dictionary, denoted by UA:
Synthetic signals of length N were constructed using
P randomly selected atoms of which P–L were selected
from UD and L from UA: The number of atoms, L,
from UA was increased from 0 to P, resulting in syn-
thetic signals with decreasing levels of coherency with
the decomposition dictionary UD:
In the case where L is small, we would expect
the signal to be highly coherent with UD and hence
produce a low RSC. For the case where L is close to P,
only a small proportion of UD atoms would be used to
construct the signal. For this signal, we would expect
low coherency with UD which translates to a large
RSC.
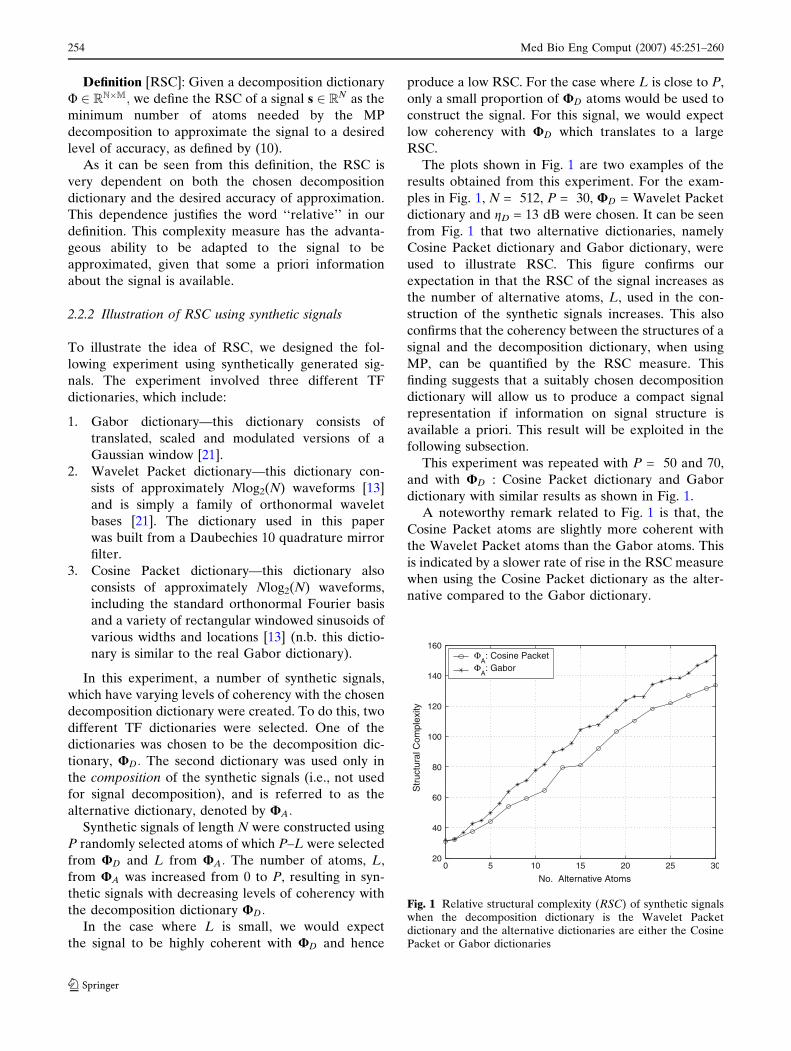
The plots shown in Fig. 1 are two examples of the
results obtained from this experiment. For the exam-
ples in Fig. 1, N = 512, P = 30, UD = Wavelet Packet
dictionary and gD = 13 dB were chosen. It can be seen
from Fig. 1 that two alternative dictionaries, namely
Cosine Packet dictionary and Gabor dictionary, were
used to illustrate RSC. This figure confirms our
expectation in that the RSC of the signal increases as
the number of alternative atoms, L, used in the con-
struction of the synthetic signals increases. This also
confirms that the coherency between the structures of a
signal and the decomposition dictionary, when using
MP, can be quantified by the RSC measure. This
finding suggests that a suitably chosen decomposition
dictionary will allow us to produce a compact signal
representation if information on signal structure is
available a priori. This result will be exploited in the
following subsection.
This experiment was repeated with P = 50 and 70,
and with UD : Cosine Packet dictionary and Gabor
dictionary with similar results as shown in Fig. 1.
A noteworthy remark related to Fig. 1 is that, the
Cosine Packet atoms are slightly more coherent with
the Wavelet Packet atoms than the Gabor atoms. This
is indicated by a slower rate of rise in the RSC measure
when using the Cosine Packet dictionary as the alter-
native compared to the Gabor dictionary.
0 5 10 15 20 25 3020
40
60
80
100
120
140
160
No. Alternative Atoms
Str
uctu
ral C
ompl
exity
ΦA: Cosine Packet
ΦA: Gabor
Fig. 1 Relative structural complexity (RSC) of synthetic signalswhen the decomposition dictionary is the Wavelet Packetdictionary and the alternative dictionaries are either the CosinePacket or Gabor dictionaries
254 Med Bio Eng Comput (2007) 45:251–260
123
2.2.3 Coherent newborn EEG time–frequency
dictionary design
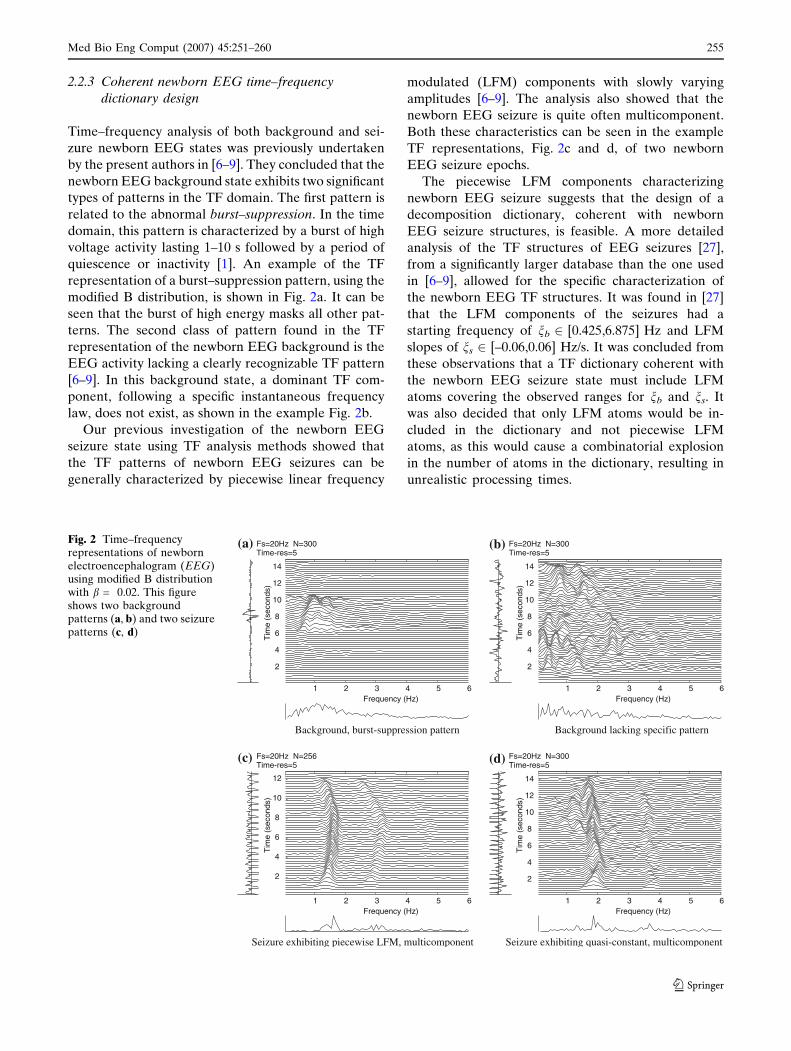
Time–frequency analysis of both background and sei-
zure newborn EEG states was previously undertaken
by the present authors in [6–9]. They concluded that the
newborn EEG background state exhibits two significant
types of patterns in the TF domain. The first pattern is
related to the abnormal burst–suppression. In the time
domain, this pattern is characterized by a burst of high
voltage activity lasting 1–10 s followed by a period of
quiescence or inactivity [1]. An example of the TF
representation of a burst–suppression pattern, using the
modified B distribution, is shown in Fig. 2a. It can be
seen that the burst of high energy masks all other pat-
terns. The second class of pattern found in the TF
representation of the newborn EEG background is the
EEG activity lacking a clearly recognizable TF pattern
[6–9]. In this background state, a dominant TF com-
ponent, following a specific instantaneous frequency
law, does not exist, as shown in the example Fig. 2b.
Our previous investigation of the newborn EEG
seizure state using TF analysis methods showed that
the TF patterns of newborn EEG seizures can be
generally characterized by piecewise linear frequency
modulated (LFM) components with slowly varying
amplitudes [6–9]. The analysis also showed that the
newborn EEG seizure is quite often multicomponent.
Both these characteristics can be seen in the example
TF representations, Fig. 2c and d, of two newborn
EEG seizure epochs.
The piecewise LFM components characterizing
newborn EEG seizure suggests that the design of a
decomposition dictionary, coherent with newborn
EEG seizure structures, is feasible. A more detailed
analysis of the TF structures of EEG seizures [27],
from a significantly larger database than the one used
in [6–9], allowed for the specific characterization of
the newborn EEG TF structures. It was found in [27]
that the LFM components of the seizures had a
starting frequency of nb 2 [0.425,6.875] Hz and LFM
slopes of ns 2 [–0.06,0.06] Hz/s. It was concluded from
these observations that a TF dictionary coherent with
the newborn EEG seizure state must include LFM
atoms covering the observed ranges for nb and ns. It
was also decided that only LFM atoms would be in-
cluded in the dictionary and not piecewise LFM
atoms, as this would cause a combinatorial explosion
in the number of atoms in the dictionary, resulting in
unrealistic processing times.
1 2 3 4 5 6
2
4
6
8
10
12
14
Frequency (Hz)
Tim
e (s
econ
ds)
Fs=20Hz N=300Time-res=5
Background, burst-suppression pattern
1 2 3 4 5 6
2
4
6
8
10
12
14
Frequency (Hz)
Tim
e (s
econ
ds)
Fs=20Hz N=300Time-res=5
Background lacking specific pattern
1 2 3 4 5 6
2
4
6
8
10
12
Frequency (Hz)
Tim
e (s
econ
ds)
Fs=20Hz N=256Time-res=5
Seizure exhibiting piecewise LFM, multicomponent
1 2 3 4 5 6
2
4
6
8
10
12
14
Frequency (Hz)
Tim
e (s
econ
ds)
Fs=20Hz N=300Time-res=5
Seizure exhibiting quasi-constant, multicomponent
(a) (b)
(c) (d)
Fig. 2 Time–frequencyrepresentations of newbornelectroencephalogram (EEG)using modified B distributionwith b = 0.02. This figureshows two backgroundpatterns (a, b) and two seizurepatterns (c, d)
Med Bio Eng Comput (2007) 45:251–260 255
123
The set of LFM atoms to be included in the pro-
posed dictionary are of the form
/LFMi ðnÞ ¼ A cos
2pðnib þ
nis
2 nÞnFs
þ h
!;
n ¼ 0; 1; . . . ;N � 1 ð11Þ
where Fs is the sampling frequency, h 2 [0,2p) is the
starting phase and A is a scalar value chosen such that
||uiLFM||2 = 1. For the analysis of newborn EEG, a
sampling frequency of Fs = 20 Hz was chosen as
approximately 95% of the newborn EEG power is
found in frequencies less than 8 Hz [28].
Since the described set of LFM atoms do not, in
general, form a complete dictionary, we construct an
overcomplete coherent dictionary by combining the set
of LFM atoms with an overcomplete Gabor dictionary
[24, 25]. This dictionary is used for the RSC analysis of
real and synthetic newborn EEG data.
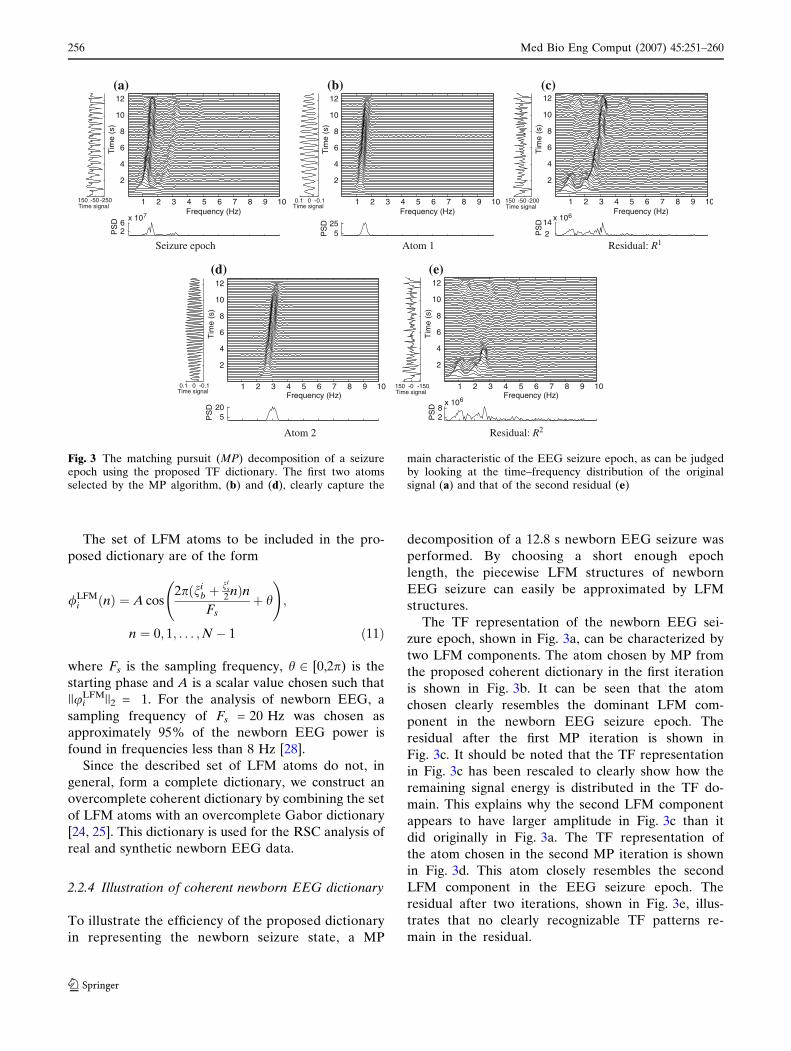
2.2.4 Illustration of coherent newborn EEG dictionary
To illustrate the efficiency of the proposed dictionary
in representing the newborn seizure state, a MP
decomposition of a 12.8 s newborn EEG seizure was
performed. By choosing a short enough epoch
length, the piecewise LFM structures of newborn
EEG seizure can easily be approximated by LFM
structures.
The TF representation of the newborn EEG sei-
zure epoch, shown in Fig. 3a, can be characterized by
two LFM components. The atom chosen by MP from
the proposed coherent dictionary in the first iteration
is shown in Fig. 3b. It can be seen that the atom
chosen clearly resembles the dominant LFM com-
ponent in the newborn EEG seizure epoch. The
residual after the first MP iteration is shown in
Fig. 3c. It should be noted that the TF representation
in Fig. 3c has been rescaled to clearly show how the
remaining signal energy is distributed in the TF do-
main. This explains why the second LFM component
appears to have larger amplitude in Fig. 3c than it
did originally in Fig. 3a. The TF representation of
the atom chosen in the second MP iteration is shown
in Fig. 3d. This atom closely resembles the second
LFM component in the EEG seizure epoch. The
residual after two iterations, shown in Fig. 3e, illus-
trates that no clearly recognizable TF patterns re-
main in the residual.
-250-50150Time signal
-200-50150Time signal
-150-0150Time signal
26
x 107
PS
D
1 2 3 4 5 6 7 8 9 10
2
4
6
8
10
12
Frequency (Hz)
Tim
e (s
)
Seizure epoch
-0.100.1Time signal
-0.100.1Time signal
525
PS
D
1 2 3 4 5 6 7 8 9 10
2
4
6
8
10
12
Frequency (Hz)
Tim
e (s
)
Atom 1214
x 106
PS
D
1 2 3 4 5 6 7 8 9 10
2
4
6
8
10
12
Frequency (Hz)
Tim
e (s
)
Residual: R1
520
PS
D
1 2 3 4 5 6 7 8 9 10
2
4
6
8
10
12
Frequency (Hz)
Tim
e (s
)
Atom 2
28
x 106
PS
D
1 2 3 4 5 6 7 8 9 10
2
4
6
8
10
12
Frequency (Hz)
Tim
e (s
)Residual: R2
(a) (b) (c)
(e)(d)
Fig. 3 The matching pursuit (MP) decomposition of a seizureepoch using the proposed TF dictionary. The first two atomsselected by the MP algorithm, (b) and (d), clearly capture the
main characteristic of the EEG seizure epoch, as can be judgedby looking at the time–frequency distribution of the originalsignal (a) and that of the second residual (e)
256 Med Bio Eng Comput (2007) 45:251–260
123
3 Newborn EEG data
3.1 Synthetic newborn EEG data
In [27], a method for simulating newborn EEG back-
ground and newborn EEG seizure was presented.2 For
the initial investigation of the RSC measure applied to
newborn EEG, we created a number of realistic syn-
thetic newborn EEG signals using the simulation
methods of [27]. The synthetic newborn EEG signals
are composed of four time periods; namely, preictal,
seizure onset, seizure and postictal. The preictal and
postictal periods were created using the newborn EEG
background model described in [27], each lasting 60 s.
The seizure period was created using the seizure model
of [27] and lasted for 50 s. The seizure onset period was
constructed using a combination of synthetic back-
ground and seizure signals. The seizure onset period
was synthesized with a gradual increase in signal to
background ratio (SBR), given by
SBR ¼ 20 logjjsszjj2jjsbkjj2
� �dB ð12Þ
where ssz is the seizure signal and sbk is the background
signal. The seizure onset was synthesized to start 24 s
before the full-fledged seizure. The SBR was changed
every 4 s with the following successive values
[-2.5,0,2.5,4,5,6] dB. Fifty synthetic newborn EEG sig-
nals of this form were created for the synthetic RSC
analysis in Sect. 4.1.
3.2 Real newborn EEG data
The EEG from six neonates exhibiting EEG seizure
periods, as marked by a pediatric neurologist from the
Royal Children’s Hospital, Brisbane, Australia, were
analyzed using the RSC measure. The EEG data was
recorded at the Royal Brisbane and Women’s Hospi-
tal, using the MEDELEC Profile System. The raw
EEG was bandpass filtered with cutoff frequencies at
0.5 and 70 Hz, and was sampled at 256 Hz. For the
RSC analysis, the EEG data were digitally bandpassed
filtered with cutoff frequencies at 0.5 and 10 Hz, before
being downsampled to 20 Hz.
4 Application of RSC to newborn EEG
4.1 RSC analysis of synthetic newborn EEG
Synthetic newborn EEG signals were used in the initial
investigation for two main reasons. Using a mathe-
matical model, we can generate a signal that captures
the main characteristics of the newborn EEG without
the added complexity introduced by artefacts. Also,
synthetic signals allow us to specify the exact time
locations of the transitions between the two EEG
states; a matter which is subjective and reviewer-
dependent for the case of real newborn EEG [33].
These two characteristics of the synthetic signals allow
us to assess the strengths and the weaknesses of the
new complexity measure before being applied to real
newborn EEG.
The RSC was implemented using a sliding, rectan-
gular window, of length N = 256 samples. The overlap
between successive windows was set at 60 samples (i.e.,
3 s). The stopping criterion for the MP decomposition
was chosen to be gD � 13 dB:
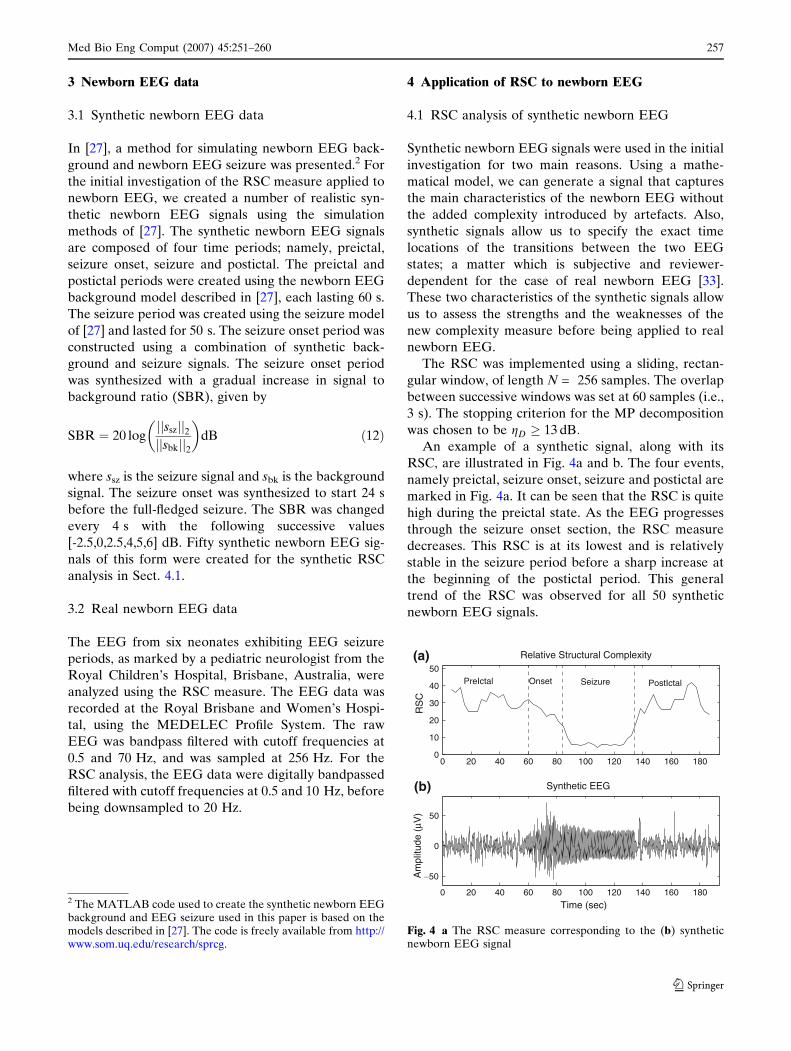
An example of a synthetic signal, along with its
RSC, are illustrated in Fig. 4a and b. The four events,
namely preictal, seizure onset, seizure and postictal are
marked in Fig. 4a. It can be seen that the RSC is quite
high during the preictal state. As the EEG progresses
through the seizure onset section, the RSC measure
decreases. This RSC is at its lowest and is relatively
stable in the seizure period before a sharp increase at
the beginning of the postictal period. This general
trend of the RSC was observed for all 50 synthetic
newborn EEG signals.
0 20 40 60 80 100 120 140 160 1800
10
20
30
40
50
RS
C
Relative Structural Complexity
0 20 40 60 80 100 120 140 160 180
−50
0
50
Time (sec)
Am
plitu
de (
µV)
Synthetic EEG
PreIctal Onset Seizure PostIctal
(a)
(b)
Fig. 4 a The RSC measure corresponding to the (b) syntheticnewborn EEG signal
2 The MATLAB code used to create the synthetic newborn EEGbackground and EEG seizure used in this paper is based on themodels described in [27]. The code is freely available from http://www.som.uq.edu/research/sprcg.
Med Bio Eng Comput (2007) 45:251–260 257
123
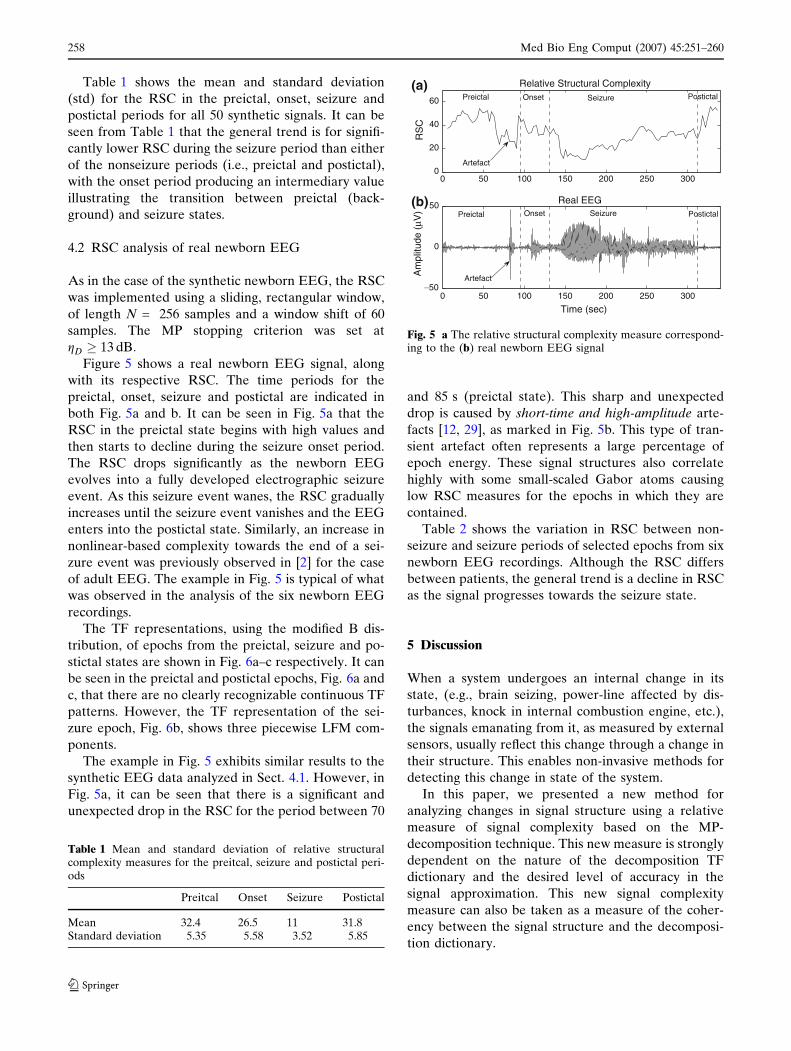
Table 1 shows the mean and standard deviation
(std) for the RSC in the preictal, onset, seizure and
postictal periods for all 50 synthetic signals. It can be
seen from Table 1 that the general trend is for signifi-
cantly lower RSC during the seizure period than either
of the nonseizure periods (i.e., preictal and postictal),
with the onset period producing an intermediary value
illustrating the transition between preictal (back-
ground) and seizure states.
4.2 RSC analysis of real newborn EEG
As in the case of the synthetic newborn EEG, the RSC
was implemented using a sliding, rectangular window,
of length N = 256 samples and a window shift of 60
samples. The MP stopping criterion was set at
gD � 13 dB:
Figure 5 shows a real newborn EEG signal, along
with its respective RSC. The time periods for the
preictal, onset, seizure and postictal are indicated in
both Fig. 5a and b. It can be seen in Fig. 5a that the
RSC in the preictal state begins with high values and
then starts to decline during the seizure onset period.
The RSC drops significantly as the newborn EEG
evolves into a fully developed electrographic seizure
event. As this seizure event wanes, the RSC gradually
increases until the seizure event vanishes and the EEG
enters into the postictal state. Similarly, an increase in
nonlinear-based complexity towards the end of a sei-
zure event was previously observed in [2] for the case
of adult EEG. The example in Fig. 5 is typical of what
was observed in the analysis of the six newborn EEG
recordings.
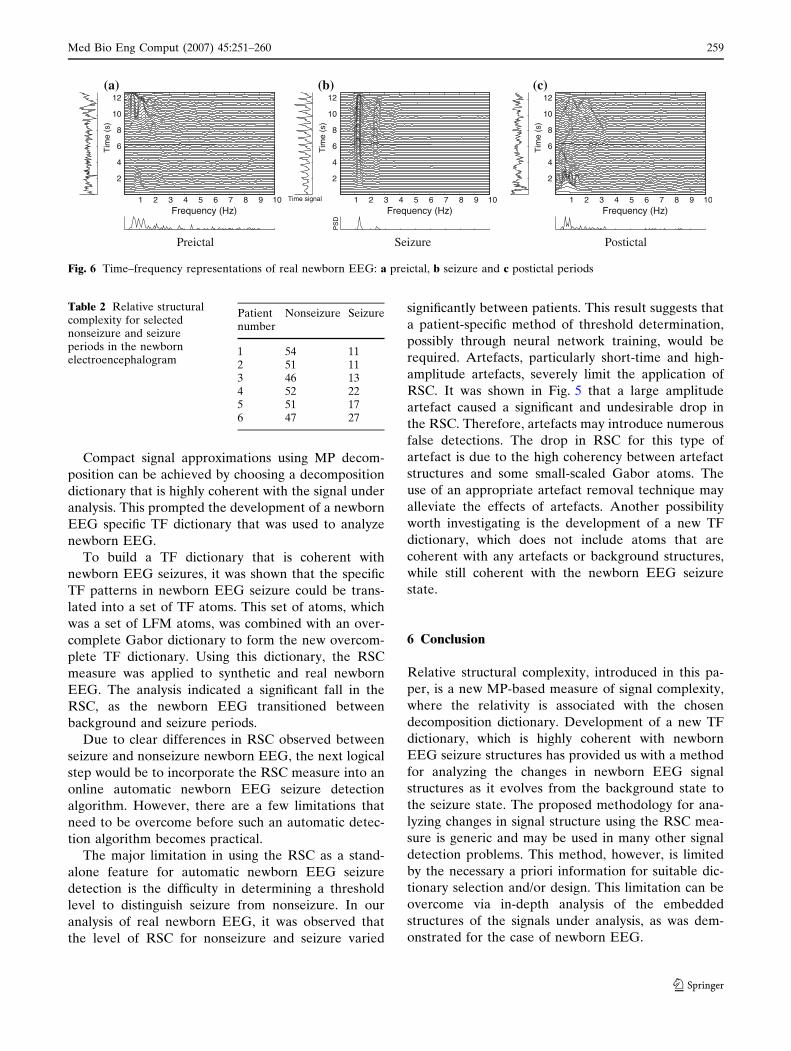
The TF representations, using the modified B dis-
tribution, of epochs from the preictal, seizure and po-
stictal states are shown in Fig. 6a–c respectively. It can
be seen in the preictal and postictal epochs, Fig. 6a and
c, that there are no clearly recognizable continuous TF
patterns. However, the TF representation of the sei-
zure epoch, Fig. 6b, shows three piecewise LFM com-
ponents.
The example in Fig. 5 exhibits similar results to the
synthetic EEG data analyzed in Sect. 4.1. However, in
Fig. 5a, it can be seen that there is a significant and
unexpected drop in the RSC for the period between 70
and 85 s (preictal state). This sharp and unexpected
drop is caused by short-time and high-amplitude arte-
facts [12, 29], as marked in Fig. 5b. This type of tran-
sient artefact often represents a large percentage of
epoch energy. These signal structures also correlate
highly with some small-scaled Gabor atoms causing
low RSC measures for the epochs in which they are
contained.
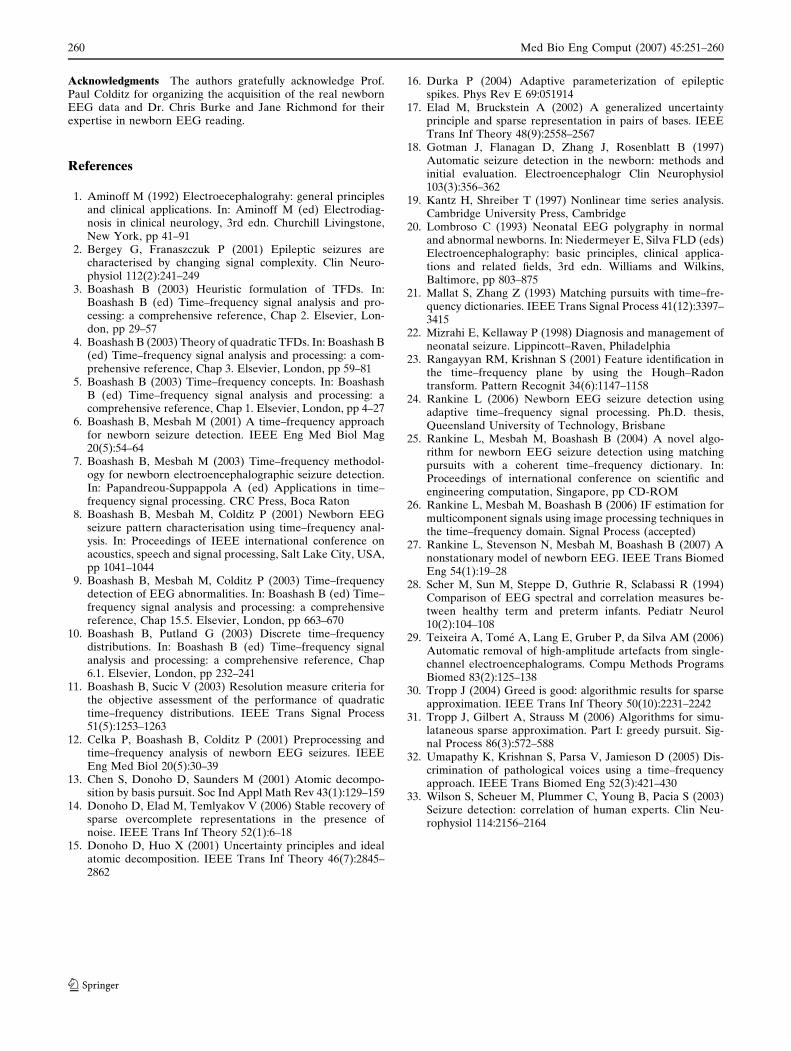
Table 2 shows the variation in RSC between non-
seizure and seizure periods of selected epochs from six
newborn EEG recordings. Although the RSC differs
between patients, the general trend is a decline in RSC
as the signal progresses towards the seizure state.
5 Discussion
When a system undergoes an internal change in its
state, (e.g., brain seizing, power-line affected by dis-
turbances, knock in internal combustion engine, etc.),
the signals emanating from it, as measured by external
sensors, usually reflect this change through a change in
their structure. This enables non-invasive methods for
detecting this change in state of the system.
In this paper, we presented a new method for
analyzing changes in signal structure using a relative
measure of signal complexity based on the MP-
decomposition technique. This new measure is strongly
dependent on the nature of the decomposition TF
dictionary and the desired level of accuracy in the
signal approximation. This new signal complexity
measure can also be taken as a measure of the coher-
ency between the signal structure and the decomposi-
tion dictionary.
Table 1 Mean and standard deviation of relative structuralcomplexity measures for the preitcal, seizure and postictal peri-ods
Preitcal Onset Seizure Postictal
Mean 32.4 26.5 11 31.8Standard deviation 5.35 5.58 3.52 5.85
0 50 100 150 200 250 3000
20
40
60
RS
C
Relative Structural Complexity
0 50 100 150 200 250 300−50
0
50
Time (sec)
Am
plitu
de (
µV)
Real EEGPreictal Onset Seizure Postictal
Preictal Onset Seizure Postictal
Artefact
Artefact
(b)
(a)
Fig. 5 a The relative structural complexity measure correspond-ing to the (b) real newborn EEG signal
258 Med Bio Eng Comput (2007) 45:251–260
123
Compact signal approximations using MP decom-
position can be achieved by choosing a decomposition
dictionary that is highly coherent with the signal under
analysis. This prompted the development of a newborn
EEG specific TF dictionary that was used to analyze
newborn EEG.
To build a TF dictionary that is coherent with
newborn EEG seizures, it was shown that the specific
TF patterns in newborn EEG seizure could be trans-
lated into a set of TF atoms. This set of atoms, which
was a set of LFM atoms, was combined with an over-
complete Gabor dictionary to form the new overcom-
plete TF dictionary. Using this dictionary, the RSC
measure was applied to synthetic and real newborn
EEG. The analysis indicated a significant fall in the
RSC, as the newborn EEG transitioned between
background and seizure periods.
Due to clear differences in RSC observed between
seizure and nonseizure newborn EEG, the next logical
step would be to incorporate the RSC measure into an
online automatic newborn EEG seizure detection
algorithm. However, there are a few limitations that
need to be overcome before such an automatic detec-
tion algorithm becomes practical.
The major limitation in using the RSC as a stand-
alone feature for automatic newborn EEG seizure
detection is the difficulty in determining a threshold
level to distinguish seizure from nonseizure. In our
analysis of real newborn EEG, it was observed that
the level of RSC for nonseizure and seizure varied
significantly between patients. This result suggests that
a patient-specific method of threshold determination,
possibly through neural network training, would be
required. Artefacts, particularly short-time and high-
amplitude artefacts, severely limit the application of
RSC. It was shown in Fig. 5 that a large amplitude
artefact caused a significant and undesirable drop in
the RSC. Therefore, artefacts may introduce numerous
false detections. The drop in RSC for this type of
artefact is due to the high coherency between artefact
structures and some small-scaled Gabor atoms. The
use of an appropriate artefact removal technique may
alleviate the effects of artefacts. Another possibility
worth investigating is the development of a new TF
dictionary, which does not include atoms that are
coherent with any artefacts or background structures,
while still coherent with the newborn EEG seizure
state.
6 Conclusion
Relative structural complexity, introduced in this pa-
per, is a new MP-based measure of signal complexity,
where the relativity is associated with the chosen
decomposition dictionary. Development of a new TF
dictionary, which is highly coherent with newborn
EEG seizure structures has provided us with a method
for analyzing the changes in newborn EEG signal
structures as it evolves from the background state to
the seizure state. The proposed methodology for ana-
lyzing changes in signal structure using the RSC mea-
sure is generic and may be used in many other signal
detection problems. This method, however, is limited
by the necessary a priori information for suitable dic-
tionary selection and/or design. This limitation can be
overcome via in-depth analysis of the embedded
structures of the signals under analysis, as was dem-
onstrated for the case of newborn EEG.
1 2 3 4 5 6 7 8 9 10
2
4
6
8
10
12
Frequency (Hz)
Tim
e (s
)
Preictal
Time signal
PS
D
1 2 3 4 5 6 7 8 9 10
2
4
6
8
10
12
Frequency (Hz)
Tim
e (s
)
Seizure
1 2 3 4 5 6 7 8 9 10
2
4
6
8
10
12
Frequency (Hz)
Tim
e (s
)
Postictal
(a) (c)(b)
Fig. 6 Time–frequency representations of real newborn EEG: a preictal, b seizure and c postictal periods
Table 2 Relative structuralcomplexity for selectednonseizure and seizureperiods in the newbornelectroencephalogram
Patientnumber
Nonseizure Seizure
1 54 112 51 113 46 134 52 225 51 176 47 27
Med Bio Eng Comput (2007) 45:251–260 259
123
Acknowledgments The authors gratefully acknowledge Prof.Paul Colditz for organizing the acquisition of the real newbornEEG data and Dr. Chris Burke and Jane Richmond for theirexpertise in newborn EEG reading.
References
1. Aminoff M (1992) Electroecephalograhy: general principlesand clinical applications. In: Aminoff M (ed) Electrodiag-nosis in clinical neurology, 3rd edn. Churchill Livingstone,New York, pp 41–91
2. Bergey G, Franaszczuk P (2001) Epileptic seizures arecharacterised by changing signal complexity. Clin Neuro-physiol 112(2):241–249
3. Boashash B (2003) Heuristic formulation of TFDs. In:Boashash B (ed) Time–frequency signal analysis and pro-cessing: a comprehensive reference, Chap 2. Elsevier, Lon-don, pp 29–57
4. Boashash B (2003) Theory of quadratic TFDs. In: Boashash B(ed) Time–frequency signal analysis and processing: a com-prehensive reference, Chap 3. Elsevier, London, pp 59–81
5. Boashash B (2003) Time–frequency concepts. In: BoashashB (ed) Time–frequency signal analysis and processing: acomprehensive reference, Chap 1. Elsevier, London, pp 4–27
6. Boashash B, Mesbah M (2001) A time–frequency approachfor newborn seizure detection. IEEE Eng Med Biol Mag20(5):54–64
7. Boashash B, Mesbah M (2003) Time–frequency methodol-ogy for newborn electroencephalographic seizure detection.In: Papandreou-Suppappola A (ed) Applications in time–frequency signal processing. CRC Press, Boca Raton
8. Boashash B, Mesbah M, Colditz P (2001) Newborn EEGseizure pattern characterisation using time–frequency anal-ysis. In: Proceedings of IEEE international conference onacoustics, speech and signal processing, Salt Lake City, USA,pp 1041–1044
9. Boashash B, Mesbah M, Colditz P (2003) Time–frequencydetection of EEG abnormalities. In: Boashash B (ed) Time–frequency signal analysis and processing: a comprehensivereference, Chap 15.5. Elsevier, London, pp 663–670
10. Boashash B, Putland G (2003) Discrete time–frequencydistributions. In: Boashash B (ed) Time–frequency signalanalysis and processing: a comprehensive reference, Chap6.1. Elsevier, London, pp 232–241
11. Boashash B, Sucic V (2003) Resolution measure criteria forthe objective assessment of the performance of quadratictime–frequency distributions. IEEE Trans Signal Process51(5):1253–1263
12. Celka P, Boashash B, Colditz P (2001) Preprocessing andtime–frequency analysis of newborn EEG seizures. IEEEEng Med Biol 20(5):30–39
13. Chen S, Donoho D, Saunders M (2001) Atomic decompo-sition by basis pursuit. Soc Ind Appl Math Rev 43(1):129–159
14. Donoho D, Elad M, Temlyakov V (2006) Stable recovery ofsparse overcomplete representations in the presence ofnoise. IEEE Trans Inf Theory 52(1):6–18
15. Donoho D, Huo X (2001) Uncertainty principles and idealatomic decomposition. IEEE Trans Inf Theory 46(7):2845–2862
16. Durka P (2004) Adaptive parameterization of epilepticspikes. Phys Rev E 69:051914
17. Elad M, Bruckstein A (2002) A generalized uncertaintyprinciple and sparse representation in pairs of bases. IEEETrans Inf Theory 48(9):2558–2567
18. Gotman J, Flanagan D, Zhang J, Rosenblatt B (1997)Automatic seizure detection in the newborn: methods andinitial evaluation. Electroencephalogr Clin Neurophysiol103(3):356–362
19. Kantz H, Shreiber T (1997) Nonlinear time series analysis.Cambridge University Press, Cambridge
20. Lombroso C (1993) Neonatal EEG polygraphy in normaland abnormal newborns. In: Niedermeyer E, Silva FLD (eds)Electroencephalography: basic principles, clinical applica-tions and related fields, 3rd edn. Williams and Wilkins,Baltimore, pp 803–875
21. Mallat S, Zhang Z (1993) Matching pursuits with time–fre-quency dictionaries. IEEE Trans Signal Process 41(12):3397–3415
22. Mizrahi E, Kellaway P (1998) Diagnosis and management ofneonatal seizure. Lippincott–Raven, Philadelphia
23. Rangayyan RM, Krishnan S (2001) Feature identification inthe time–frequency plane by using the Hough–Radontransform. Pattern Recognit 34(6):1147–1158
24. Rankine L (2006) Newborn EEG seizure detection usingadaptive time–frequency signal processing. Ph.D. thesis,Queensland University of Technology, Brisbane
25. Rankine L, Mesbah M, Boashash B (2004) A novel algo-rithm for newborn EEG seizure detection using matchingpursuits with a coherent time–frequency dictionary. In:Proceedings of international conference on scientific andengineering computation, Singapore, pp CD-ROM
26. Rankine L, Mesbah M, Boashash B (2006) IF estimation formulticomponent signals using image processing techniques inthe time–frequency domain. Signal Process (accepted)
27. Rankine L, Stevenson N, Mesbah M, Boashash B (2007) Anonstationary model of newborn EEG. IEEE Trans BiomedEng 54(1):19–28
28. Scher M, Sun M, Steppe D, Guthrie R, Sclabassi R (1994)Comparison of EEG spectral and correlation measures be-tween healthy term and preterm infants. Pediatr Neurol10(2):104–108
29. Teixeira A, Tome A, Lang E, Gruber P, da Silva AM (2006)Automatic removal of high-amplitude artefacts from single-channel electroencephalograms. Compu Methods ProgramsBiomed 83(2):125–138
30. Tropp J (2004) Greed is good: algorithmic results for sparseapproximation. IEEE Trans Inf Theory 50(10):2231–2242
31. Tropp J, Gilbert A, Strauss M (2006) Algorithms for simu-lataneous sparse approximation. Part I: greedy pursuit. Sig-nal Process 86(3):572–588
32. Umapathy K, Krishnan S, Parsa V, Jamieson D (2005) Dis-crimination of pathological voices using a time–frequencyapproach. IEEE Trans Biomed Eng 52(3):421–430
33. Wilson S, Scheuer M, Plummer C, Young B, Pacia S (2003)Seizure detection: correlation of human experts. Clin Neu-rophysiol 114:2156–2164
260 Med Bio Eng Comput (2007) 45:251–260
123
Related Documents