A Smart Grid Prerequisite: Survey on Electricity Demand Forecasting Models and Scope Analysis of Demand Fsorecasting in Bangladesh Samiul Islam Department of Computer Science and Engineering BRAC University Dhaka, Bangladesh [email protected] Amin Ahsan Ali Department of Computer Science and Engineering University of Dhaka Dhaka, Bangladesh [email protected] Moinul Zaber Department of Computer Science and Engineering University of Dhaka Dhaka, Bangladesh [email protected] Abstract–Electricity supply via smart grid mechanism is gaining importance in many country’s priority lists. A detailed study on electricity forecasting is required to ensure a smooth transition to the smart grid. Forecasting is evident to ensure better management of generation plants, supply grids and the transmission system. This article focuses on demand forecasting study as a preparation of smart grid, presents a technical survey/review of several forecasting methods which have been done earlier. This paper also conducts a study highlighting the forecasting scenario, performs scope analysis from developing countries’ context and presents analytical results of a short-term forecasting. As a candidate, these have been discussed on the basis of electricity load data of Dhaka, the capital city of Bangladesh; one of the world’s most highly populated city. Electricity distribution has been handled in Dhaka city by two companies, DESCO and DPDC. This article discusses on few average sized DESCO zones of its total 16 and emphasized more on Shah Ali zone. Two selective feature based forecasting methods have been also proposed and results have been shown to support that forecasting will help to see the unseen. Index Terms –Demand forecasting, Smart Grid, Developing countries, Scope analysis. I. INTRODUCTION Electricity is a prerequisite for economic prosperity. If the current global energy consumption pattern continues, by 2030 overall consumption will be increased by 50% [1]. These energy transitions are more visible in a country experiencing an economic shift. A country while in its developing phase, should ensure efficient use of its resources, proper management, prioritisation of needs, forecast the demand etc. In a developing country, the industrial sector generally consumes 45% to 50% of the total commercial energy [2]. Electricity as one of the fuels of the development thus needs to be managed in an organised fashion. Policy makers need to come up with a better plan than they currently own where statisticians, researchers, data scientists, practitioners can come into play. A number of data- driven models have been proposed by the researchers to predict future demand. These models differ from situation to situation based on the input data, aggregation level, frequency, time span, economic status of the region, incorporation of renewable energy resources etc. for short-term, medium-term or long-term prediction analysis. Smart grid (SG), designed with digital technologies channels a two-way communication between the customers and the utility. It includes different operational and energy measures through smart meters, smart appliances and energy efficient resources [3]. Another way of saying, SG is an advanced electricity transmission and distribution network that uses information, communication, and control technologies to improve the economy, efficiency, reliability, and security of the grid [4]. Many countries worldwide now either have switched or are planning to replace their old electric grid system with the SG. For example, in 2010, the US government spent $7.02B on its SG initiative, while the Chinese government used $7.32B for its SG program [5]. In Bangladesh, The distribution system loss is high and the customers face daily planned load shedding. To address the power crisis and other problems, the conventional distribution system should be restructured to the smart distribution system, a part of SG. Though it is a very new and expensive concept, yet Bangladesh Government has shown positive approach [6]. Through the SG, demand forecasting even in end-user level can be achieved which will provide the necessary information for having a better awareness of individual usage pattern and efficient pricing strategy, in addition with, planning for growth [7]. As with SG, this is ensured that more granular level forecasting can be performed, before switching we need to understand the different forecasting techniques and their applicability. This transition is not a straightforward concept to acquire all of a sudden. Moving from old conventional grid systems to SG, there are several prerequisites to ensure. While this is being planned, currently available data, patterns in it, techniques those can be used should be observed thoroughly as a preparation step for the final goal. This article can bring a positive impact towards it. Load prediction may depend on several factors including time, social, economic, and environmental variables by which the pattern will form various complex variations [8], [9]. Social and environmental factors are sources of randomness found on the load pattern [10]. There are some prediction models based on architectonic features such as heat loss surface, building shape factor, building heated volume and so on [5], [6], or housing type and socioeconomic features such as age of the dwelling, size of the dwelling, monthly household income, 2017 IEEE Region 10 Humanitarian Technology Conference (R10-HTC) 21 - 23 Dec 2017, Dhaka, Bangladesh 691

Welcome message from author
This document is posted to help you gain knowledge. Please leave a comment to let me know what you think about it! Share it to your friends and learn new things together.
Transcript

A Smart Grid Prerequisite: Survey on Electricity
Demand Forecasting Models and Scope Analysis of
Demand Fsorecasting in Bangladesh
Samiul Islam
Department of Computer Science and
Engineering
BRAC University
Dhaka, Bangladesh
Amin Ahsan Ali
Department of Computer Science and
Engineering
University of Dhaka
Dhaka, Bangladesh
Moinul Zaber
Department of Computer Science and
Engineering
University of Dhaka
Dhaka, Bangladesh
Abstract–Electricity supply via smart grid mechanism is
gaining importance in many country’s priority lists. A detailed
study on electricity forecasting is required to ensure a smooth
transition to the smart grid. Forecasting is evident to ensure better
management of generation plants, supply grids and the
transmission system. This article focuses on demand forecasting
study as a preparation of smart grid, presents a technical
survey/review of several forecasting methods which have been
done earlier. This paper also conducts a study highlighting the
forecasting scenario, performs scope analysis from developing
countries’ context and presents analytical results of a short-term
forecasting. As a candidate, these have been discussed on the basis
of electricity load data of Dhaka, the capital city of Bangladesh;
one of the world’s most highly populated city. Electricity
distribution has been handled in Dhaka city by two companies,
DESCO and DPDC. This article discusses on few average sized
DESCO zones of its total 16 and emphasized more on Shah Ali
zone. Two selective feature based forecasting methods have been
also proposed and results have been shown to support that
forecasting will help to see the unseen.
Index Terms –Demand forecasting, Smart Grid, Developing
countries, Scope analysis.
I. INTRODUCTION
Electricity is a prerequisite for economic prosperity. If the
current global energy consumption pattern continues, by 2030
overall consumption will be increased by 50% [1]. These
energy transitions are more visible in a country experiencing an
economic shift. A country while in its developing phase, should
ensure efficient use of its resources, proper management,
prioritisation of needs, forecast the demand etc. In a developing
country, the industrial sector generally consumes 45% to 50%
of the total commercial energy [2]. Electricity as one of the fuels
of the development thus needs to be managed in an organised
fashion. Policy makers need to come up with a better plan than
they currently own where statisticians, researchers, data
scientists, practitioners can come into play. A number of data-
driven models have been proposed by the researchers to predict
future demand. These models differ from situation to situation
based on the input data, aggregation level, frequency, time span,
economic status of the region, incorporation of renewable
energy resources etc. for short-term, medium-term or long-term
prediction analysis.
Smart grid (SG), designed with digital technologies
channels a two-way communication between the customers and
the utility. It includes different operational and energy measures
through smart meters, smart appliances and energy efficient
resources [3]. Another way of saying, SG is an advanced
electricity transmission and distribution network that uses
information, communication, and control technologies to
improve the economy, efficiency, reliability, and security of the
grid [4]. Many countries worldwide now either have switched
or are planning to replace their old electric grid system with the
SG. For example, in 2010, the US government spent $7.02B on
its SG initiative, while the Chinese government used $7.32B for
its SG program [5]. In Bangladesh, The distribution system loss
is high and the customers face daily planned load shedding. To
address the power crisis and other problems, the conventional
distribution system should be restructured to the smart
distribution system, a part of SG. Though it is a very new and
expensive concept, yet Bangladesh Government has shown
positive approach [6]. Through the SG, demand forecasting
even in end-user level can be achieved which will provide the
necessary information for having a better awareness of
individual usage pattern and efficient pricing strategy, in
addition with, planning for growth [7]. As with SG, this is
ensured that more granular level forecasting can be performed,
before switching we need to understand the different
forecasting techniques and their applicability. This transition is
not a straightforward concept to acquire all of a sudden. Moving
from old conventional grid systems to SG, there are several
prerequisites to ensure. While this is being planned, currently
available data, patterns in it, techniques those can be used
should be observed thoroughly as a preparation step for the final
goal. This article can bring a positive impact towards it.
Load prediction may depend on several factors including
time, social, economic, and environmental variables by which
the pattern will form various complex variations [8], [9]. Social
and environmental factors are sources of randomness found on
the load pattern [10]. There are some prediction models based
on architectonic features such as heat loss surface, building
shape factor, building heated volume and so on [5], [6], or
housing type and socioeconomic features such as age of the
dwelling, size of the dwelling, monthly household income,
2017 IEEE Region 10 Humanitarian Technology Conference (R10-HTC)21 - 23 Dec 2017, Dhaka, Bangladesh
691
User
Typewriter
978-1-5386-2175-2/17/$31.00 ©2017 IEEE

number of household members, etc. [11] along with historical
load data.
The main contributions of this paper are (i) a review of load
forecasting techniques, (ii) load forecasting scope analysis and
(iii) a preliminary model and results of load forecasting. Section
II of this paper presents a review of load forecasting
methodologies, section III discusses load forecasting scopes,
section IV comprises results of a short forecasting on the
available data while section V concludes the paper.
II. REVIEW OF LOAD FORECASTING METHODOLOGIES
On the basis of input data, expected outcome forecasting
methodologies differ, so does models. Hence, to understand
how forecasting works, a study on forecasting in inevitable.
This section contains a summarised technical review of a few
electricity demand/load forecasting related research. This
summary focuses on a particular research at a time. It will
summarise the data related information followed by the
models/algorithms used and performance. Research chosen
here are published on or after 2012. Primarily around 10 such
forecasting papers were chosen and from there 4 papers have
been selected and discussed here as because of page limitation.
Selected papers differ in both long and short-term prediction
and also in space and context which helps us understand the
applicability of different algorithms in various context. Goal
here is to discuss and analyse recent approaches taken by the
researchers related to developing countries (those who haven't
yet switched to SG with one exception where forecasting
technique on smart grid is discussed to point out how SG helps
in more granular level prediction) and also extend the view of a
previously published review paper of Suganthi L, Samuel A.A.
back in 2012 [2]. Their research was not specifically on
electricity load forecasting rather was on overall energy
demand prediction. Before going into the reviews of selected
papers, a brief summary from the view of electricity load
prediction on Suganthi L, Samuel A.A.’s review paper is
included here. From there, the discussion will be taken further
by classifying those recent researches based on different
datasets used and also on different conclusions were drawn.
Suganthi L and Samuel A.A’s review paper discusses
several models of load prediction highlighting the uses in
previous research. Demand is changing over time, so is data and
models. Moreover, performance is varying for previously
introduced models against the same data sources. So, with such
changes in trend, an updated review is also needed. In that
energy forecasting review paper [2], models like time-series,
regression, econometric, decomposition, genetic algorithms
etc. have been discussed. Here, we are promoting similar sort
of models those have been used recently. On the basis of the
articles selected here, techniques can be classified as Time
series models, Regression analysis, Group method of data
handling, Classifiers, Fuzzy inductive reasoning and Hybrid
techniques. Here, each model and its performance have been
discussed article-wise with a data description of each research
on which that model was executed.
Long-term forecasting: Kaytez F. et al. conducted
comparative analysis of regression models, neural networks and
least squares support vector machines [12]. This research has
been carried out on Turkish electricity transmission data which
spans over the time span of 1970~2009. The indicators that
were used as an independent class variable to predict the net
electricity consumption were the number of population,
installed capacity of the power generation, gross electricity
generation and total subscription. The Turkish Electricity
Transmission Company (TEIAS) statistical database was used
for Turkey’s total installed capacity and gross electricity
generation [11], [13], [14], and the Turkish Statistical Institute
(TIE) database was used for population data [15]. Both the
number of subscribers and the net electricity consumption
values for Turkey were taken from Turkish Electricity
Distribution Company (TEDAS) and other private electricity
distribution companies [16]. Data were split into 2:1 ratio for
training and testing purposes respectively while the process was
validated using 2010~11 data. A multilayer feedforward
backpropagation neural network was one of three models used
in prediction of the net electricity consumption. Multiple linear
regression models was another method used in addition to the
least square support vector machine (LS-SVM) to estimate the
target class. The predictive accuracy of all the model was
impressive but the LS-SVM outperforms other models in
various performance indicators [17].
Short-term forecasting: A short-term forecasting research
work has been performed on Korean hourly electricity load
data. This one day ahead of load forecasting technique was
performed on a single Korean electric load data set sourced by
Korea Electric Power Corporation. This has been carried out on
a sample set of two weeks of data where weekdays’ data was
used for forecasting load for another immediate weekday and
likewise, weekend data was used to predict the load of another
subsequent weekend.
The data was classified before making a forecasting model
using K- means and k-NN to eliminate error from calendar-
based classification. Then Artificial neural network (ANN),
Group Method of Data Handling (GMDH) in addition to Simple
Exponential Smoothing (SSE) were used to design the
predictive model. They also gave a comparative study of the
models. GMDH which had the least Mean Absolute Percentage
Error (MAPE) provided the best predictive accuracy in
compared to other models. GMDH uses Kolmogrov-Gabor
polynomial which is an inductive self-organizing data-driven
approach which provides scintillating performance in
modelling small data set. In this study, the data set was very
small as mentioned earlier and other than historical load data no
other sources have been used to predict the load which assists
GMDH to be the best performer because of having strength in
providing predictive accuracy in small data-driven predictive
design [17].
Another short-term load forecasting research was done by
Lee C.M, and Ko C.N. Electric load data set of the year 2007 of
Taiwan has been used here to perform 24 hours ahead of load
forecasting. Three different patterns of load data are utilised to
evaluate the effectiveness of the proposed algorithm. Working
days were considered from Monday to Friday, Saturday as
weekends and Sunday and other national holidays as holidays.
2017 IEEE Region 10 Humanitarian Technology Conference (R10-HTC)21 - 23 Dec 2017, Dhaka, Bangladesh
692

Whole year’s data was divided into these 3 groups and different
training and testing data have been selected from each group to
perform and evaluate forecasting efficiency [18].
Previous 41 days of weekdays data used as an indicator to
predict the load of the 42nd date. Likewise, few weekends and
holidays data was used to predict a load of the subsequent
weekend and holiday. Here, a model was proposed to improve
the accuracy of the short-term load forecasting which integrated
radial basis function neural network (RBFNN), support vector
regression (SVR), and adaptive annealing learning algorithm
(AALA). Determining the initial structure of the RBFNN using
an SVR was the first step in designing the proposed
methodology. With the intention of optimising the initial
parameters of SVR-RBFNN (AALA-SVR-RBFNN), an AALA
along with the time-varying learning rates was applied. In order
to overcome the stagnation for searching optimal RBFNN, a
particle swarm optimisation (PSO) was applied to
simultaneously find promising learning rates in AALA. Finally,
the short-term load demands were predicted by using the
optimal RBFNN. Comparing DEKF-RBFNN, GRD-RBFNN,
SVR-DEKF-RBFNN, and ARLA-SVR-RBFNN with the
proposed AALA-SVR-RBFNN, the error of MAPE is reduced
by 44.94%, 68.79%, 12.50%, and 20.97%, respectively.
Short-term forecasting (consumer specific): Another
research has been carried out in small scale with some new
fields as predictors. Here, data of three buildings of the
Universitat Politecnica de Catalunya (UPC-Technical
University of Catalonia) was obtained; 1) the Library of the
ETSEIAT2 faculty in Terrassa of more than 500 m2; 2) the bar
of the ETSAV3 faculty in Sant Cugat of 150 m2; 3) a building
with different classrooms at FIB4 faculty in Barcelona of 630
m2. For determining the scalability of the models in any type of
building, three zones with different profiles of consumption and
locations are used here affecting different climatology
(temperature, humidity, solar radiation, etc.), consumption
patterns, schedules and working days. There was a one-hour
data acquisition frequency. Therefore there are 24 recordings
per day per location. For all three zones, the data set comprise
a whole year of electricity consumption, from 13/11/2011 to
12/11/2012. Training and test data were split respectively into
91% and 9%. The testing data consists of 35 different days
distributed equally through the whole year; meaning around 9
days per season. For understanding the seasonal effect, the
whole dataset was split into four chunks; autumn, winter, spring
and summer [19].
In this research, two Soft Computing techniques and one
traditional statistical method were used for the hourly energy
forecasting in buildings and the techniques were Random
Forest (RF), Artificial Neural Network (ANN), Fuzzy Inductive
Reasoning (FIR) and Auto Regressive Integrated Moving
Average (ARIMA), respectively. At first, a feature selection
methodology was applied to previous consumption data to dig
out features having the highest impact on prediction. The design
of the predictive model was divided into two stages: 1) Feature
selection applied before training to all the methods 2) All the
models used without any feature selection. In this study, FIR
outperformed, most of the cases, all the methodologies
followed by the RF and NN. Regarding ARIMA which had the
least errors but when it came to predictive accuracy, ARIMA
was far from most of other methodologies [19].
TABLE I. SUMMARY OF FORECASTING TECHNIQUES
Ref Data used Time span
&Country
Subgroup
ing
Methodology
12 Load data Number of
population
Installed capacity Gross electricity
generation
Total subscription
40 years
Turkey
Multilayer feedforward backpropagation neural
network
Multiple linear regression models
Least square support
vector machinea
17 Load data 2 weeks
Korea
Weekday and
Weekend
Artificial neural network
Group Method of Data
Handlinga
Exponential Smoothing
18 Load data 1 year
Taiwan
Weekday,
Weekend
and Holiday
Radial basis function
neural networka
Support vector regression Adaptive annealing
learning algorithm
19 Load data (Data of 3
buildings of Universitat
Politecnica de Catalunya were
used)
1 year
Spain
Autumn,
Winter, Spring and
Summer
Random forest
Artificial neural network
Fuzzy Inductive
Reasoninga
Auto-Regressive
Integrated Moving Avg. a. Best performing methodology in each technique
In light of these research and from the summary of TABLE
I, it has been seen that to perform load forecasting, along with
historical load/transmission data, the number of population, the
number of subscription, power generation statistics,
meteorological data etc. are required. For more granular level
forecasting, data is needed from the smart meters (smart grid is
required to perform this level of forecasting) about particular
household’s load requirements at different hours of the day,
randomness in requirements, appliances used, shape and size of
the household etc. (last technique of TABLE I is such
approach).
In many research, data has been further subdivided into
some groups to ensure better forecasting and to accommodate
seasonal impacts and occasional impacts (subgrouping column
of TABLE I). The timespan of dataset also matters. Therefore,
a detailed study of the available data, finding patterns,
understanding the relevance of heterogeneous sources etc. is a
huge concern before starting forecasting. Hence, such review of
forecasting techniques and scope analysis is a must.
III. SCOPE ANALYSIS OF DEMAND FORECASTING IN
BANGLADESH
Bangladesh is one of the developing countries in the world
with an area of around fifty-seven thousand square miles.
Country’s demand in the energy sector is increasing highly
while the scenario of electricity utility structure (generation,
supply, distribution) is very complex. This section includes
details of the electricity sector in Bangladesh, how distribution
works, how legacy methodologies are being used to predict
electricity demand/load and future prospects.
2017 IEEE Region 10 Humanitarian Technology Conference (R10-HTC)21 - 23 Dec 2017, Dhaka, Bangladesh
693

Under the jurisdiction of the Ministry of Power, Energy and
Mineral Resources (MPEMR), the Power Division (PD)
oversees the whole electricity utility. Electricity is generated by
the Bangladesh Power Development Board (BPDB), a
company spun off from BPDB, Independent Power Producers
(IPPs) and private power producers. Generated electricity is
supplied via the Power Grid Company of Bangladesh’s (PGCB)
power grid to the capital area and then distributed by Dhaka
Power Distribution Company (DPDC) and Dhaka Electricity
Supply Company (DESCO); local areas are supplied by BPDB
and West Zone Power Distribution Company Limited
(WZPDCL); and farming areas are supplied by Palli Bidyuit
Samity (PBS). A few generation plants (SIPPs) are directly
distributing to the distributors while others are delivering
through the national power grid. Under these distributors, there
are several substations from where power goes area specific
feeders. Feeders are directly responsible for consumer-end
distribution. So, from the top level, we can name this tier flow
as: Generation > Transmission (PGCB) > Distribution
(Substation) > Feeder > Consumer end.
Forecasting always will have uncertainty as we are
predicting a future state which depends on several 'frequently
changing' data like, meteorological data, economic status,
consumption behaviour etc. We all that can ensure is a good
forecasting method with a minimum possible error. A proper
management and good forecasting require detailed and
necessary data flow from consumer end & feeders to
Distributors/Substations (for understanding area specific need
and ensuring timely distribution) & to Generation plants (to
design an optimum generation schedule for satisfying the need).
Monthly billing data/consumption data, hourly load
variability data and load shedding data are available through
Dhaka Electric Supply Company (DESCO) and Dhaka Power
Distribution Company (DPDC). Mainly Shah Ali, an averagely
sized zone of those 16 belongs to DESCO with an area of 5.15
square km and a population over 100 thousand has been used to
determine scopes and evaluate forecasting performance.
In every substation (there can be one or more substations
under one zone), under each feeder, the load has been recorded
hourly which means 24 entries each day. In Bangladesh, these
entries are not maintained in a digitised format rather it is being
handwritten in a logbook. As the actual load data is not
digitised, a summarised report is being sent to the upper level
on which legacy methods of load prediction works. Because of
this aggregation (summarised report), we lose some key factors
like, feeder wise load, the difference in peak hours across
different feeders etc. which could lead to better management.
Fig. 1 Supply/Demand (Max) Balance in a Day: in 2015, available
capacity was enough to satisfy maximum demand
Fig 1 represents a comparison between installed capacity,
available capacity and maximum demand for the year 2013 to
2015 [20]. Approximately 30% of installed capacity was not
available due to decreases in the output and thermal efficiency
and failures of power generators mainly due to the insufficient
periodic maintenance etc. However, it is clear that in the year
2015, available capacity was sufficient to satisfy maximum
demand. However, load shedding is still a huge concern here in
Bangladesh. Without knowing area specific demand, even if
with available resources, demand cannot be satisfied. Thus,
aggregated data and legacy method needs to be restructured.
Moreover, In Dhaka, electricity consumers are increasing day
by day. If Pallabi, Shah Ali and Baridhara, three zones of
DESCO have been considered, number of connections has been
almost doubled from 2010 to 2015. An increment in number of
consumers is equivalent to the complexity of management
which demands a better forecasting. There are occasional
impact, seasonal impact on load variability, the effect of
industrial working hours or feeder-wise pattern difference in
same substation etc. These also support the claim that better
forecasting can be achieved with the data in hand and data from
meteorological department. After a successful transition to the
smart grid, more granular level data will be available; so,
another level of betterment in load forecasting could be
achieved.
Fig. 2 Hourly Average Load of Kalyanpur: loads are almost stationary
throughout the day where loads in winter are around 40 kWh less than the loads
in summer
Fig. 3 Hourly Average Load of Shah Ali: the graph is following a hockey stick pattern. From 12 am to 7 am, the load remains almost stationary and lowest
while during 8 am to 11 pm, for half of this range, load rises and then gradually
falls. Loads in winter are around 40 kWh less than the loads in summer
0
5000
10000
15000
2013 2014 2015
Meg
aw
att
Year
Installed Capacity Available Capacity Maximum Demand
0
20
40
60
80
100
120
140
160
1 2 3 4 5 6 7 8 9 101112131415161718192021222324
Avera
ge L
oa
d
Hours of the day
winter summer
0
50
100
150
200
1 2 3 4 5 6 7 8 9 101112131415161718192021222324
Avera
ge L
oa
d
Hours of the day
winter summer
2017 IEEE Region 10 Humanitarian Technology Conference (R10-HTC)21 - 23 Dec 2017, Dhaka, Bangladesh
694

Fig 2 and 3 represents a comparison between winter and
summer season in Kalyanpur and Shah Ali substation of Shah
Ali zone respectively. As, during winter, people most likely do
not use room heaters and during summer many people use ACs,
it is clearly visible that in summer, consumption is quite high.
However, in a particular season (summer or winter), in
Kalyanpur substation, the load varies a little throughout the day
while in Shah Ali, from midnight to 7 AM in the morning it
remains almost same but then gradually rising till 12 PM,
mostly remain constant till 8 PM and then again gradually drops
till midnight. The main point of bringing these statistics is to
clear the point that even in the same zone, different substations
act differently. As the load data are available from the logbook
of previous years, substation-wise or feeder-wise forecasting
could lead to a better management and distribution in the
electricity sector.
Fig 4 represents a comparison of the percentage of load
shedding occurrence on a day of a week between different
feeders of Shah Ali substation. Around 30% of load shedding
occurs on Sunday while 50% occurs in first two weekdays
(Sunday and Monday). For some feeders, i.e. Mazar Sharif and
Ahmed Nagar this crosses even 70%. So, satisfying the need of
only two days of a week can reduce the load shedding for more
than 50%.
Fig. 4 Percentage of Load Shedding Occurrence on a Day at Shah Ali:
More than 50% load shedding occurs during first two days of a week
Here, the only snapshot of entire data has been used to
show the statistics and showcased a glimpse of what can be
achieved. Forecasting at this granular level will ensure better
management, efficient generation and distribution which might
have a positive impact on reducing load shedding as well.
IV. LOAD FORECASTING AND PERFORMANCE ANALYSIS
To forecast load, granular level data is a prerequisite such
as half-hourly or hourly historical load data, generation
capacity, meteorological data (like hourly temperature, rain
prediction index, humidity etc.), wealth index of an area,
population of an area, number of active connection, frequency
and impact of load shedding etc. More in-depth data ensures
more accurate forecasting generally. It has been mentioned
before that hourly load data are kept in a handwritten log book.
Because of such limitation, four parts of data has been digitised
from two substations (two parts from each substation) in a one-
week span. One week of summer and one week of winter data
has been digitised to compare seasonal load variability. On the
basis of above scope analysis, with the currently available
sources, a model has been proposed to perform a short-term
load prediction. For performing forecasting, one-week of
summer data of Shah Ali substation has been taken from 15th
May 2017 to 21st May 2017; a total of 7 days (1st 6 days for
training the model and the 7th day for testing). Daily
temperature has been web scrapped from Weather Underground
website [21] and based on the maximum and minimum
temperature, a uniform distribution has been run to mimic the
hourly temperature.
Two different forecasting model has been proposed
varying the inputs and has shown that better forecasting can be
achieved with more granular level data. These two models have
been denoted as ‘5 input model’ and ‘8 input model’. In 5 input
model, an hour of the day, whether this is a peak hour or not,
due point, temperature (hourly) and previous hour’s load have
been used as features to predict future demand. In 8 input
model, along with the features of the first model, load of
24hours earlier, average load of the previous day and peak
hours’ average load of previous day have been used as
predictors. We then run a neural network with 70% data in
training, 15% in validation and 15% in testing to create a neural
net. Later, testing data of 21st may 2015 which was not a part of
training process was sent to judge.
Fig. 5 Workflow of the load forecasting network buildup and performance
evaluation
Fig 5 represents the flow of our proposed model.
Underlined input sources are only for 8 input model. Both the
train data (that has been used to build the model) and a separate
test data has been run through the model. Fig 6 and 7 represent
actual and predictive output comparison. Green line denotes the
actual output while blue line signifies the predictive outcome.
Fig. 6 Performance of the training set that has been used to train the
network in 5 (left) and 8 (right) input model
0% 20% 40% 60% 80% 100%
A.N(Ahmed Nagar)
D.S(Darussalam)
G.T(Gabtoli)
J.H(J.Housing)
M.P(MP RMU)
M.S(Mazar Sharif)
R.N.I(RM Industry)
S.A.B(Shah Ali Bag)
S.B.J(S Buddizibi)
Sec-2 (Section-2)
Sec-7 (Section-7)
Sunday Monday Tuesday Wednesday Thursday Friday Saturday
2017 IEEE Region 10 Humanitarian Technology Conference (R10-HTC)21 - 23 Dec 2017, Dhaka, Bangladesh
695
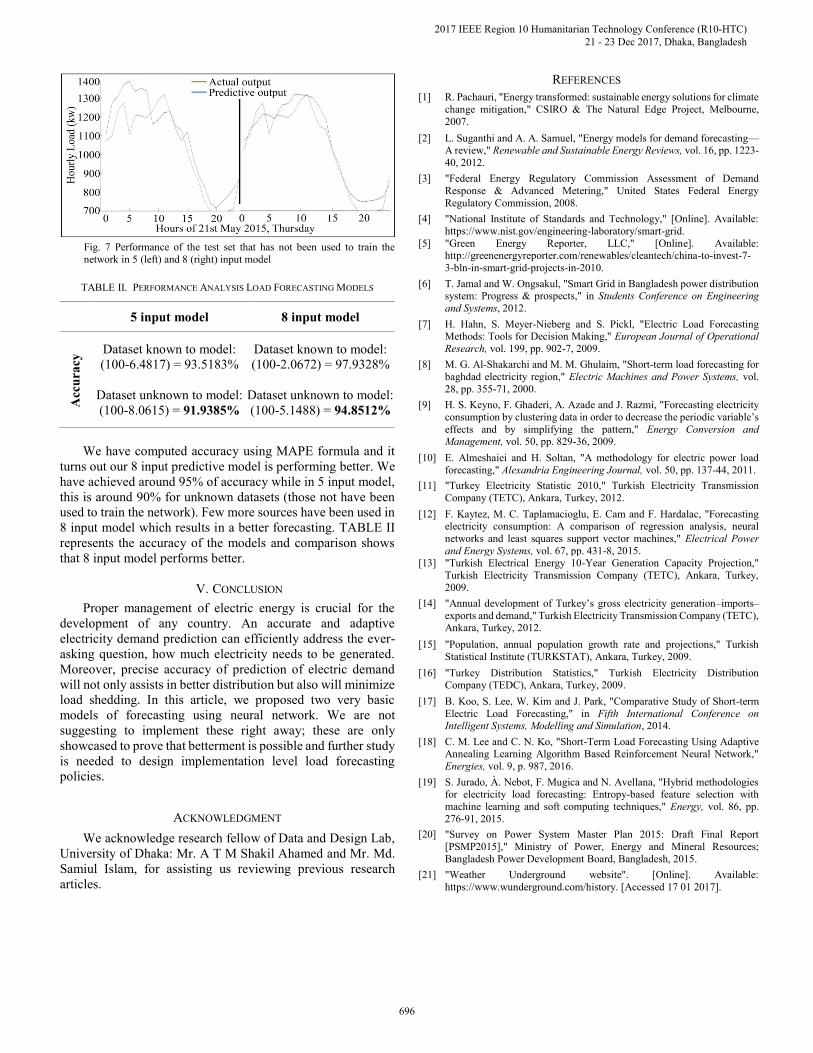
Fig. 7 Performance of the test set that has not been used to train the
network in 5 (left) and 8 (right) input model
TABLE II. PERFORMANCE ANALYSIS LOAD FORECASTING MODELS
5 input model 8 input model
Acc
ura
cy Dataset known to model:
(100-6.4817) = 93.5183%
Dataset unknown to model:
(100-8.0615) = 91.9385%
Dataset known to model:
(100-2.0672) = 97.9328%
Dataset unknown to model:
(100-5.1488) = 94.8512%
We have computed accuracy using MAPE formula and it
turns out our 8 input predictive model is performing better. We
have achieved around 95% of accuracy while in 5 input model,
this is around 90% for unknown datasets (those not have been
used to train the network). Few more sources have been used in
8 input model which results in a better forecasting. TABLE II
represents the accuracy of the models and comparison shows
that 8 input model performs better.
V. CONCLUSION
Proper management of electric energy is crucial for the
development of any country. An accurate and adaptive
electricity demand prediction can efficiently address the ever-
asking question, how much electricity needs to be generated.
Moreover, precise accuracy of prediction of electric demand
will not only assists in better distribution but also will minimize
load shedding. In this article, we proposed two very basic
models of forecasting using neural network. We are not
suggesting to implement these right away; these are only
showcased to prove that betterment is possible and further study
is needed to design implementation level load forecasting
policies.
ACKNOWLEDGMENT
We acknowledge research fellow of Data and Design Lab,
University of Dhaka: Mr. A T M Shakil Ahamed and Mr. Md.
Samiul Islam, for assisting us reviewing previous research
articles.
REFERENCES
[1] R. Pachauri, "Energy transformed: sustainable energy solutions for climate
change mitigation," CSIRO & The Natural Edge Project, Melbourne,
2007.
[2] L. Suganthi and A. A. Samuel, "Energy models for demand forecasting—A review," Renewable and Sustainable Energy Reviews, vol. 16, pp. 1223-
40, 2012.
[3] "Federal Energy Regulatory Commission Assessment of Demand
Response & Advanced Metering," United States Federal Energy
Regulatory Commission, 2008.
[4] "National Institute of Standards and Technology," [Online]. Available:
https://www.nist.gov/engineering-laboratory/smart-grid.
[5] "Green Energy Reporter, LLC," [Online]. Available: http://greenenergyreporter.com/renewables/cleantech/china-to-invest-7-
3-bln-in-smart-grid-projects-in-2010.
[6] T. Jamal and W. Ongsakul, "Smart Grid in Bangladesh power distribution system: Progress & prospects," in Students Conference on Engineering
and Systems, 2012.
[7] H. Hahn, S. Meyer-Nieberg and S. Pickl, "Electric Load Forecasting Methods: Tools for Decision Making," European Journal of Operational
Research, vol. 199, pp. 902-7, 2009.
[8] M. G. Al-Shakarchi and M. M. Ghulaim, "Short-term load forecasting for
baghdad electricity region," Electric Machines and Power Systems, vol.
28, pp. 355-71, 2000.
[9] H. S. Keyno, F. Ghaderi, A. Azade and J. Razmi, "Forecasting electricity
consumption by clustering data in order to decrease the periodic variable’s
effects and by simplifying the pattern," Energy Conversion and Management, vol. 50, pp. 829-36, 2009.
[10] E. Almeshaiei and H. Soltan, "A methodology for electric power load
forecasting," Alexandria Engineering Journal, vol. 50, pp. 137-44, 2011.
[11] "Turkey Electricity Statistic 2010," Turkish Electricity Transmission
Company (TETC), Ankara, Turkey, 2012.
[12] F. Kaytez, M. C. Taplamacioglu, E. Cam and F. Hardalac, "Forecasting electricity consumption: A comparison of regression analysis, neural
networks and least squares support vector machines," Electrical Power
and Energy Systems, vol. 67, pp. 431-8, 2015. [13] "Turkish Electrical Energy 10-Year Generation Capacity Projection,"
Turkish Electricity Transmission Company (TETC), Ankara, Turkey,
2009.
[14] "Annual development of Turkey’s gross electricity generation–imports–
exports and demand," Turkish Electricity Transmission Company (TETC), Ankara, Turkey, 2012.
[15] "Population, annual population growth rate and projections," Turkish
Statistical Institute (TURKSTAT), Ankara, Turkey, 2009.
[16] "Turkey Distribution Statistics," Turkish Electricity Distribution Company (TEDC), Ankara, Turkey, 2009.
[17] B. Koo, S. Lee, W. Kim and J. Park, "Comparative Study of Short-term
Electric Load Forecasting," in Fifth International Conference on Intelligent Systems, Modelling and Simulation, 2014.
[18] C. M. Lee and C. N. Ko, "Short-Term Load Forecasting Using Adaptive
Annealing Learning Algorithm Based Reinforcement Neural Network,"
Energies, vol. 9, p. 987, 2016.
[19] S. Jurado, À. Nebot, F. Mugica and N. Avellana, "Hybrid methodologies for electricity load forecasting: Entropy-based feature selection with
machine learning and soft computing techniques," Energy, vol. 86, pp.
276-91, 2015.
[20] "Survey on Power System Master Plan 2015: Draft Final Report
[PSMP2015]," Ministry of Power, Energy and Mineral Resources;
Bangladesh Power Development Board, Bangladesh, 2015.
[21] "Weather Underground website". [Online]. Available:
https://www.wunderground.com/history. [Accessed 17 01 2017].
2017 IEEE Region 10 Humanitarian Technology Conference (R10-HTC)21 - 23 Dec 2017, Dhaka, Bangladesh
696
Related Documents