Am. J. Hum. Genet. 75:460–474, 2004 460 A Major Lung Cancer Susceptibility Locus Maps to Chromosome 6q23–25 J. E. Bailey-Wilson, 1,* C. I. Amos, 3,* S. M. Pinney, 4 G. M. Petersen, 5 M. de Andrade, 5 J. S. Wiest, 2 P. Fain, 6 A. G. Schwartz, 7 M. You, 8 W. Franklin, 6 C. Klein, 6 A. Gazdar, 9 H. Rothschild, 10 D. Mandal, 10 T. Coons, 11 J. Slusser, 5 J. Lee, 4 C. Gaba, 12 E. Kupert, 4 A. Perez, 4 X. Zhou, 3 D. Zeng, 3 Q. Liu, 3 Q. Zhang, 3 D. Seminara, 2 J. Minna, 9 and M. W. Anderson 4 1 National Human Genome Research Institute and 2 National Cancer Institute, National Institutes of Health, Bethesda, MD; 3 M. D. Anderson Cancer Center, Houston; 4 University of Cincinnati, Cincinnati; 5 Mayo Clinic College of Medicine, Rochester, MN; 6 University of Colorado, Denver; 7 Karmanos Cancer Institute, Detroit; 8 Washington University, St. Louis; 9 UT Southwestern Medical Center, Dallas; 10 Louisiana State University Health Sciences Center, New Orleans; 11 Saccomanno Research Institute, Grand Junction, CO; and 12 Medical College of Ohio, Toledo Lung cancer is a major cause of death in the United States and other countries. The risk of lung cancer is greatly increased by cigarette smoking and by certain occupational exposures, but familial factors also clearly play a major role. To identify susceptibility genes for familial lung cancer, we conducted a genomewide linkage analysis of 52 extended pedigrees ascertained through probands with lung cancer who had several first-degree relatives with the same disease. Multipoint linkage analysis, under a simple autosomal dominant model, of all 52 families with three or more individuals affected by lung, throat, or laryngeal cancer, yielded a maximum heterogeneity LOD score (HLOD) of 2.79 at 155 cM on chromosome 6q (marker D6S2436). A subset of 38 pedigrees with four or more affected individuals yielded a multipoint HLOD of 3.47 at 155 cM. Analysis of a further subset of 23 multige- nerational pedigrees with five or more affected individuals yielded a multipoint HLOD score of 4.26 at the same position. The 14 families with only three affected relatives yielded negative LOD scores in this region. A predivided samples test for heterogeneity comparing the LOD scores from the 23 multigenerational families with those from the remaining families was significant ( ). The 1-HLOD multipoint support interval from the multigener- P p .007 ational families extends from C6S1848 at 146 cM to 164 cM near D6S1035, overlapping a genomic region that is deleted in sporadic lung cancers as well as numerous other cancer types. Parametric linkage and variance- components analysis that incorporated effects of age and personal smoking also supported linkage in this region, but with somewhat diminished support. These results localize a major susceptibility locus influencing lung cancer risk to 6q23–25. Introduction There are more individuals who die from lung cancer than from breast, colon, and prostate cancer combined, with an estimated 173,700 new cases and 160,440 deaths expected in the United States in 2004 (Jemal et al. 2004). The overall 5-year survival rate of lung cancer is 15% (Jemal et al. 2004). Advances in the detection and treatment of this disease have only resulted in a marginal improvement in mortality rates. In the last 50 years, lung cancer incidence increased by 249%, and mortality increased by 259% (Welch et al. 2000). Received May 6, 2004; accepted for publication June 30, 2004; electronically published July 21, 2004. Address for correspondence and reprints: Dr. Marshall Anderson, Department of Environmental Health, University of Cincinnati Med- ical Center, Kettering Laboratory, ML-56, 3223 Eden Avenue, Cin- cinnati, Ohio 45267-0056. E-mail: [email protected] * The first two authors contributed equally to this article. 2004 by The American Society of Human Genetics. All rights reserved. 0002-9297/2004/7503-0011$15.00 Cancer of the lung has frequently been cited as an example of a malignancy that is solely determined by the environment (Doll and Peto 1981; Blot and Frau- meni 1996). The risks associated with cigarette smoking (Burch 1980; Doll and Peto 1981; Carbone 1992; Doll et al. 1994; Blot and Fraumeni 1996) and certain oc- cupations, such as mining (Seaton 1984), shipbuilding, and petroleum refining (Blot and Fraumeni 1976; Blot et al. 1979; Gottlieb and Steadman 1979) are well es- tablished. There is little doubt that the majority of lung cancer cases are attributable to cigarette smoking and other behavioral and environmental risk factors (Beck- ett 1993). However, numerous studies also suggest the involvement of genetic risk factors. Investigators have long hypothesized that individuals differ in their susceptibility to environmental insults (Motulsky 1957; Heath 1958; Friberg 1959). More than 40 years ago, Tokuhata and Lilienfeld (1963) pro- vided epidemiologic evidence for familial aggregation of lung cancer after accounting for personal smoking, which suggested the possible interaction of genes,

Welcome message from author
This document is posted to help you gain knowledge. Please leave a comment to let me know what you think about it! Share it to your friends and learn new things together.
Transcript
Am. J. Hum. Genet. 75:460–474, 2004
460
A Major Lung Cancer Susceptibility Locus Maps to Chromosome 6q23–25J. E. Bailey-Wilson,1,* C. I. Amos,3,* S. M. Pinney,4 G. M. Petersen,5 M. de Andrade,5J. S. Wiest,2 P. Fain,6 A. G. Schwartz,7 M. You,8 W. Franklin,6 C. Klein,6 A. Gazdar,9H. Rothschild,10 D. Mandal,10 T. Coons,11 J. Slusser,5 J. Lee,4 C. Gaba,12 E. Kupert,4 A. Perez,4X. Zhou,3 D. Zeng,3 Q. Liu,3 Q. Zhang,3 D. Seminara,2 J. Minna,9 and M. W. Anderson4
1National Human Genome Research Institute and 2National Cancer Institute, National Institutes of Health, Bethesda, MD; 3M. D. AndersonCancer Center, Houston; 4University of Cincinnati, Cincinnati; 5Mayo Clinic College of Medicine, Rochester, MN; 6University of Colorado,Denver; 7Karmanos Cancer Institute, Detroit; 8Washington University, St. Louis; 9UT Southwestern Medical Center, Dallas; 10Louisiana StateUniversity Health Sciences Center, New Orleans; 11Saccomanno Research Institute, Grand Junction, CO; and 12Medical College of Ohio,Toledo
Lung cancer is a major cause of death in the United States and other countries. The risk of lung cancer is greatlyincreased by cigarette smoking and by certain occupational exposures, but familial factors also clearly play a majorrole. To identify susceptibility genes for familial lung cancer, we conducted a genomewide linkage analysis of 52extended pedigrees ascertained through probands with lung cancer who had several first-degree relatives with thesame disease. Multipoint linkage analysis, under a simple autosomal dominant model, of all 52 families with threeor more individuals affected by lung, throat, or laryngeal cancer, yielded a maximum heterogeneity LOD score(HLOD) of 2.79 at 155 cM on chromosome 6q (marker D6S2436). A subset of 38 pedigrees with four or moreaffected individuals yielded a multipoint HLOD of 3.47 at 155 cM. Analysis of a further subset of 23 multige-nerational pedigrees with five or more affected individuals yielded a multipoint HLOD score of 4.26 at the sameposition. The 14 families with only three affected relatives yielded negative LOD scores in this region. A predividedsamples test for heterogeneity comparing the LOD scores from the 23 multigenerational families with those fromthe remaining families was significant ( ). The 1-HLOD multipoint support interval from the multigener-P p .007ational families extends from C6S1848 at 146 cM to 164 cM near D6S1035, overlapping a genomic region thatis deleted in sporadic lung cancers as well as numerous other cancer types. Parametric linkage and variance-components analysis that incorporated effects of age and personal smoking also supported linkage in this region,but with somewhat diminished support. These results localize a major susceptibility locus influencing lung cancerrisk to 6q23–25.
Introduction
There are more individuals who die from lung cancerthan from breast, colon, and prostate cancer combined,with an estimated 173,700 new cases and 160,440deaths expected in the United States in 2004 (Jemal etal. 2004). The overall 5-year survival rate of lung canceris 15% (Jemal et al. 2004). Advances in the detectionand treatment of this disease have only resulted in amarginal improvement in mortality rates. In the last 50years, lung cancer incidence increased by 249%, andmortality increased by 259% (Welch et al. 2000).
Received May 6, 2004; accepted for publication June 30, 2004;electronically published July 21, 2004.
Address for correspondence and reprints: Dr. Marshall Anderson,Department of Environmental Health, University of Cincinnati Med-ical Center, Kettering Laboratory, ML-56, 3223 Eden Avenue, Cin-cinnati, Ohio 45267-0056. E-mail: [email protected]
* The first two authors contributed equally to this article.� 2004 by The American Society of Human Genetics. All rights reserved.
0002-9297/2004/7503-0011$15.00
Cancer of the lung has frequently been cited as anexample of a malignancy that is solely determined bythe environment (Doll and Peto 1981; Blot and Frau-meni 1996). The risks associated with cigarette smoking(Burch 1980; Doll and Peto 1981; Carbone 1992; Dollet al. 1994; Blot and Fraumeni 1996) and certain oc-cupations, such as mining (Seaton 1984), shipbuilding,and petroleum refining (Blot and Fraumeni 1976; Blotet al. 1979; Gottlieb and Steadman 1979) are well es-tablished. There is little doubt that the majority of lungcancer cases are attributable to cigarette smoking andother behavioral and environmental risk factors (Beck-ett 1993). However, numerous studies also suggest theinvolvement of genetic risk factors.
Investigators have long hypothesized that individualsdiffer in their susceptibility to environmental insults(Motulsky 1957; Heath 1958; Friberg 1959). Morethan 40 years ago, Tokuhata and Lilienfeld (1963) pro-vided epidemiologic evidence for familial aggregationof lung cancer after accounting for personal smoking,which suggested the possible interaction of genes,
Bailey-Wilson et al.: Lung Cancer Susceptibility Gene on 6q 461
shared environment, and common lifestyle factors in theetiology of lung cancer. Fraumeni et al. (1975) reportedan increased risk of lung cancer mortality in siblings ofprobands with lung cancer, and positive family historyhas consistently been found to be a risk factor for lungcancer in a number of case-control studies (reviewed inBailey-Wilson et al. 1998; Sellers and Bailey-Wilson1998; Etzel et al. 2003).
Genetic modeling studies have also suggested that fa-milial aggregation of lung cancer may be due to inher-itance of only a few genetic factors. Segregation analysesof Louisiana families gave evidence for inheritance of arare major autosomal gene that acts in conjunction withcigarette smoking to produce an earlier age at onset ofthe cancer (Sellers et al. 1990, 1991, 1992). Under thismodel, heterozygotes with the susceptibility allele andwith average levels of cigarette smoking had relativerisks of 14, 11.8, and 6.2 at age 50 years, 60 years, and70 years, respectively, compared with noncarriers whohad average levels of smoking. Additional segregationanalyses of these data examining cohort and polygeniceffects continued to indicate the effects of an allele oninherited susceptibility to lung cancer and also on riskfor a broader group of smoking-related cancers (lung,oral cavity, esophagus, nasopharynx, larynx, pancreas,bladder, kidney, and uterine cervix) after smoking wasallowed for (Chen et al. 1991; Bailey-Wilson et al.1992). Gauderman et al. (1997) applied a Gibbs sam-pling method to the same lung cancer data set and foundevidence for a dominant major locus with significanteffects of smoking, but no evidence of gene-environmentstatistical interaction on the logistic scale.
Similar findings were reported by Yang et al. (1999),who noted evidence for Mendelian codominant inher-itance with modifying effects of smoking and chronicbronchitis, using families of nonsmoking cases diag-nosed at ages 40–59 years. Daw et al. (in press) per-formed oligogenic segregation analysis of time to onsetof lung cancer on 12,000 families. The results of theirwork indicate the likely segregation of risk-conferringalleles at three or four genetic loci. The low number ofestimated loci strongly suggests that genetic linkagestudies could identify genetic factors for familial lungcancer (FLC).
On the basis of the evidence from these studies of theexistence of cancer susceptibility genes that may act inconjunction with cigarette smoking to increase risk oflung and other throat cancers, we performed a ge-nomewide-scan linkage study in families selected foraggregation of lung cancer. We considered lung, laryn-geal (ICD-9 161.0–161.9), oropharyngeal (ICD-9146.3–146.9), or hypopharyngeal (ICD 148.0–148.9)cancer, henceforth grouped together under the term“lung and throat (LT) cancer,” to be pleiotropic effects
of the same gene. The high case-fatality rate (15% 5-year survival) and low resection rate (25%) makes thestudy of families with lung cancer particularly chal-lenging, because it is difficult to collect adequate num-bers of biospecimens for DNA analysis. A multidisci-plinary collaborative effort was necessary to identifyand accrue large numbers of families with FLC to testthe hypothesis that there are genetic variants that greatlyincrease the risk of developing lung cancer. Recognizingthe complexity of modeling the impact of environmentalfactors for this complex disease, we made an a prioridecision that a simple autosomal dominant affected-only model would constitute our primary analytic strat-egy. Further analyses in which we also evaluated theevidence for linkage, allowing for the effects that smok-ing behavior, age, and sex have on the risk for lungcancer, were performed and are described.
Material and Methods
Data Collection
Data were collected by the FLC recruitment sites ofthe Genetic Epidemiology of Lung Cancer Consortium(GELCC): the University of Cincinnati, University ofColorado, Karmanos Cancer Institute, Saccomanno Re-search Institute, Louisiana State University Health Sci-ences Center, Mayo Clinic, and Medical College of Ohio.To date, of the 26,108 lung cancer cases screened atGELCC sites, 13.7% had at least one first-degree relativewith lung cancer. Following the initial family historyscreening process, we collected, from 3,541 probandsand/or their family representatives, data regarding ad-ditional persons affected with any cancers in the ex-tended family, vital status of affected individuals, avail-ability of archival tissue, and willingness of familymembers to participate in the study. Full pedigree de-velopment and biospecimen collection were performedon 771 families with three or more first-degree relativesaffected with lung cancer. Cancers were verified by med-ical records, pathology reports, cancer registry records,or death certificates for 69% of individuals affected withLT, and by reports of multiple family members for theother 31% of family members affected with LT. Else-where, studies have shown that reports from familymembers give high accuracy rates for lung cancer di-agnoses (Sellers et al. 1987; King et al. 2002). Only asmall percentage (∼11%) of these families had sufficientbiospecimens available to be informative for linkageanalysis, and 52 were genotyped. From these 52 families,we accrued 654 blood samples (595 from family mem-bers and 59 from spouses), 10 buccal cell samples, and78 archival blocks containing normal tissue. Archivalblocks of lung, throat, or laryngeal tumors were col-
462 Am. J. Hum. Genet. 75:460–474, 2004
lected from 61 family members, and blocks of othertumor types were collected from an additional 60 familymembers. Two families are African American, and onefamily has mixed racial composition (African American,Creole, and white); the remaining families are white.
Data were sent from each FLC collection site to thecentral phenotype-data management center in Cincin-nati, where they were reviewed, verified, and merged,prior to being transmitted to M. D. Anderson CancerCenter for creation of files for linkage analyses. TheCincinnati site developed a comprehensive database ofthe familial pedigrees with lung cancer, including infor-mation on family history, affection status, tissue acqui-sition, and clinical and epidemiologic data.
Sample Preparation and Genotyping
Blood, buccal cells, and archival biospecimens wereused as sources of DNA for genotyping family membersof the kindreds with lung cancer. DNA isolated fromblood has been genotyped at the Center for InheritedDisease Research (CIDR, a National Institutes ofHealth–supported core research facility), and DNA frombuccal cells and archival tissue and sputum were ge-notyped at the University of Cincinnati.
DNA from archival tissue for genotyping was ob-tained from 10 10-mm paraffin sections containing nor-mal tissue. The archival tissue blocks were examined atUT Southwestern Medical Center, and sections of nor-mal tissue were prepared for genotyping at the Universityof Cincinnati. We required the specimen to have at least50% normal cells for the global genotyping. DNA wasisolated from paraffin sections, and sputum sampleswere isolated by a modified Wright and Manos (1990)procedure, performed by incubating the tissue with 0.5mg/l of Proteinase K in 1# PCR buffer with NP-40 andTween 20 for 1 h at 55�C. This was followed by a 95�Cincubation for 10 min to inactivate the Proteinase K.Additionally, we included an extraction of the isolatedDNA with 24:1 (v:v) chloroform:isoamyl alcohol.DNA was isolated from the buccal cells and from wholeblood using the Puregene Kit (Gentra Systems) in ac-cordance with the manufacturer’s protocols.
The CIDR global genotyping set consisted of 392markers (15 families) or 388 markers (37 families). PCRamplifications using the primer set for each of the mark-ers were performed at CIDR and the University of Cin-cinnati. The standard protocol for PCR performed atCIDR can be found on the CIDR Web site. Conditionsfor PCR using archived DNA were similar to CIDR’sprotocol, but with a modification of an increase in thenumber of cycles to 35. All samples were amplified inan MJ Research Thermocycler. In brief, the cycles wereas follows: 95� for 12 min, for 1 cycle; 94� for 45 s, 55�for 1 min, and 72� for 1 min, for 10 cycles; then 89� for
1 min, 55� for 1 min, and 72� for 1 min, for an additional25 cycles; followed by a final extension at 72� for 10min. PCR amplifications were performed using a singlefluorescently labeled primer obtained from CIDR. Afterthe reactions, PCR products were resolved on an ABI3100 automated DNA sequencer and were analyzedwith genotype software. Because of the reduced amountsof genomic DNA in the archived samples, none of theamplification products were pooled prior to loadingonto the 96 wells of a plate for subsequent analysis.
Merging of Genotype Data Generated at CIDR andthe University of Cincinnati for Linkage Analyses
Assignment of alleles generated at CIDR and the Uni-versity of Cincinnati was accomplished by genotypingseveral samples in common for each gel (or plate) atboth facilities. These common samples included CEPHcontrols 1331-01 and 1331-02 as well as several lym-phocyte DNA samples from members of the familieswith FLC.
Our first step in evaluating the genetic data was toappropriately bin the allele lengths. To allow us to jointlyanalyze data across different platforms used at CIDRversus those used at the University of Cincinnati, we firstcompared the raw allele lengths for 16 subjects who hadbeen genotyped on both platforms. We next generateda linear regression to predict CIDR lengths from theUniversity of Cincinnati data and identified any errorsin the data as alleles that failed to satisfy the criterion:
,ˆdistance p abs (cosine [arctangent (b)] # [y � y]) ! 1where is the predicted value of a point. The predictionyof allele lengths from both centers routinely yielded anR2 value 199% for all but two markers (which had R2
values of 97% and 98%). However, the intercepts areroutinely different from 0, indicating a shift in allelelengths between labs, and the slope often varied from1, indicating that without regression adjustment, allelesat the extremes could have been misclassified.
Error Detection
The programs Relative (S.A.G.E. 2002) and PREST(McPeek and Sun 2000) were used to verify relationshipsamong individuals in the data. GAS (GAS 1998), SIB-PAIR (Duffy 2002), and PedCheck (O’Connell andWeeks 1998) were used to check for Mendelian incon-sistencies. All such errors were corrected by eliminatingthe genotypes indicated to have been most likely to causeerrors.
Linkage Analysis
Families were selected for the study only if they hadmultiple individuals (at least three) affected with lungcancer. However, for the purpose of the linkage analyses,persons were considered to be affected if they had an
Bailey-Wilson et al.: Lung Cancer Susceptibility Gene on 6q 463
LT cancer (resulting in a total of 241 affected personsin these 52 linkage families). Persons affected with othercancers were considered unaffected in these analyses.Marker allele frequencies were calculated separately andlinkage analyses were performed separately for the whiteAmerican and African American families, with the re-sults combined in overall tests of linkage.
Two-point parametric and multipoint parametric link-age tests were performed with the FASTLINK (Cot-tingham et al. 1993) and SIMWALK2 programs (Sobeland Lange 1996; Sobel et al. 2001), with the use of anautosomal dominant low-penetrance model under theassumption of a susceptibility allele frequency of 0.01,10% penetrance in gene carriers, and 1% penetrance innon–gene carriers. Because this model assumes a verylow penetrance for unaffected individuals, they can haveany of the genotypes with the probabilities not influ-enced by their phenotype, so that this model is virtuallyidentical to an affected-only parametric analysis (Ter-williger and Ott 1994). The nonzero sporadic rate fur-ther allows for individuals who have lung cancer duesolely to environmental exposures (i.e., cigarette smok-ing). Several studies have shown that approximately cor-rect models recover most of the available power in aparametric linkage analysis (Hodge et al. 1997; Green-berg et al. 1998; Abreu et al. 1999; Durner et al. 1999;Greenberg and Abreu 2001; Abreu et al. 2002). Since∼90% of the affected individuals in these pedigreessmoked cigarettes, a weighting of only the affected in-dividuals in this analysis has the effect of allowing forsmoking status and ignoring information from unaf-fected subjects. LOD scores under the assumption ofheterogeneity (HLODs) were computed for both two-point and multipoint analyses (Ott 1999).
We also performed several other types of analyses thatincorporated the effects of smoking, age, and sex intoour linkage study. Two-point parametric linkage analysiswas performed using LODLINK, from the StatisticalAnalysis for Genetic Epidemiology (S.A.G.E.) package.When using LODLINK, we assumed the best-fittingmodel from segregation analysis (Sellers et al. 1990), anautosomal codominant locus with susceptibility allelefrequency of 0.052, and penetrance functions that in-cluded age and cigarette smoking as covariates in themodel. Since the codominant susceptibility allele in thismodel is uncommon, predicted segregation of disease infamilies would appear similar to dominant inheritance.
The current implementation of LODLINK only allowstwo-point linkage analysis, yet it is well known thatmultipoint linkage analysis can be more powerful thantwo-point linkage, especially in situations where matingsare not fully informative (as in these families with largenumbers of unsampled deceased parents). The complex“gene-environment” model used in LODLINK has notyet been implemented in any multipoint linkage analysis
program. Therefore, to incorporate effects from smokingin multipoint analysis, we also used a method describedelsewhere (Shete et al. 2002) in which a liability class isdefined for each subject. To construct the liability classes,we used the same logistic model that was derived fromthe segregation analysis by Sellers et al. (1990) and thatwas used in the LODLINK analyses described above.
Nonparametric analyses also were performed withvariance-components methods. Two approaches wereused—one that incorporated age at onset and the otherthat used binary outcomes. Since LT cancer has a var-iable age-at-onset component, we can incorporate ageand other measured environmental risk factors by usingtime-to-event data within a linkage analysis framework.The rationale behind this approach is based on the as-sumption that if there is significant age-at-onset varia-bility, then the use of survival analysis techniques willprovide additional information in linkage studies. Weused mixed-effects Cox models (Amos et al. 2001; Ther-neau 2003; Pankratz et al., in press). This method madeit possible to simultaneously estimate fixed and randomeffects (of smoking and sex) on censored survival datawithout specifying the censored trait distribution. It alsoallowed us to retain the full flexibility of Cox regressionwhile exploiting the broad capabilities of variance-com-ponents models. For individuals who developed the dis-ease, the age at onset represented the observed time data.For those who were free of disease at the examinationor interview, their age at the time of the exam or inter-view was used as their observed data. These individualsrepresented censored observations. To determine the sig-nificance of the associations between age at onset andthe measured environmental risk factors and additionalgenetic factors, proportional hazards regression analyseswere performed with the S-Plus coxme function thatincorporates the multipoint identity by descent (IBD)calculated by SIMWALK2 (Sobel and Lange 1996; Sobelet al. 2001).
The second nonparametric approach used the vari-ance-components approach (binary option), as imple-mented in the SOLAR linkage package (Amos 1994;Almasy and Blangero 1998; Williams et al. 1999), toscan the genome for regions linked to the binary trait(affected and unaffected), with multipoint IBD calcu-lated by SIMWALK2 (Sobel and Lange 1996; Sobel etal. 2001).
We also have performed subset analyses on the fam-ilies with the most affected persons and with affectedpersons in two or more generations. Of the 52 families,38 met our initial inclusion criterion of having four ormore affected persons. A smaller subset of 23 familieshad five or more affected relatives in two or more gen-erations. This latter group may be most likely to reflectgenetic susceptibility due to inheritance of an autosomaldominant factor.
464 Am. J. Hum. Genet. 75:460–474, 2004
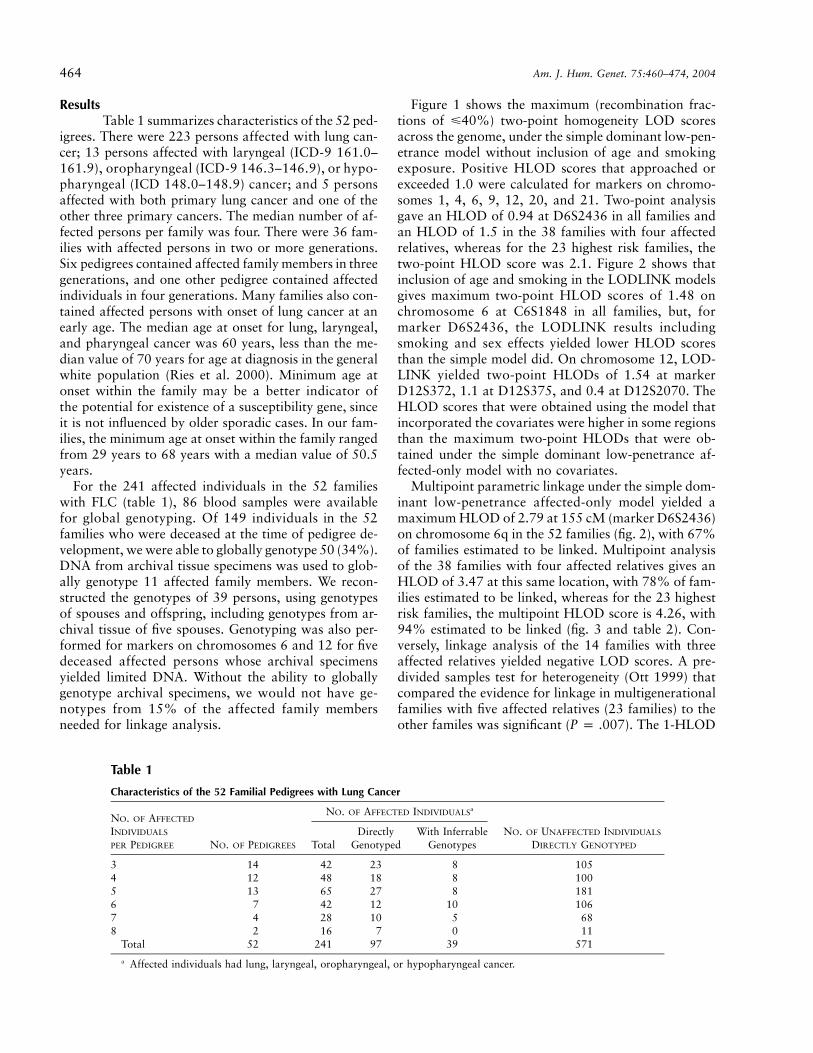
Table 1
Characteristics of the 52 Familial Pedigrees with Lung Cancer
NO. OF AFFECTED
INDIVIDUALS
PER PEDIGREE NO. OF PEDIGREES
NO. OF AFFECTED INDIVIDUALSa
NO. OF UNAFFECTED INDIVIDUALS
DIRECTLY GENOTYPEDTotalDirectly
GenotypedWith Inferrable
Genotypes
3 14 42 23 8 1054 12 48 18 8 1005 13 65 27 8 1816 7 42 12 10 1067 4 28 10 5 688 2 16 7 0 11
Total 52 241 97 39 571
a Affected individuals had lung, laryngeal, oropharyngeal, or hypopharyngeal cancer.
ResultsTable 1 summarizes characteristics of the 52 ped-
igrees. There were 223 persons affected with lung can-cer; 13 persons affected with laryngeal (ICD-9 161.0–161.9), oropharyngeal (ICD-9 146.3–146.9), or hypo-pharyngeal (ICD 148.0–148.9) cancer; and 5 personsaffected with both primary lung cancer and one of theother three primary cancers. The median number of af-fected persons per family was four. There were 36 fam-ilies with affected persons in two or more generations.Six pedigrees contained affected family members in threegenerations, and one other pedigree contained affectedindividuals in four generations. Many families also con-tained affected persons with onset of lung cancer at anearly age. The median age at onset for lung, laryngeal,and pharyngeal cancer was 60 years, less than the me-dian value of 70 years for age at diagnosis in the generalwhite population (Ries et al. 2000). Minimum age atonset within the family may be a better indicator ofthe potential for existence of a susceptibility gene, sinceit is not influenced by older sporadic cases. In our fam-ilies, the minimum age at onset within the family rangedfrom 29 years to 68 years with a median value of 50.5years.
For the 241 affected individuals in the 52 familieswith FLC (table 1), 86 blood samples were availablefor global genotyping. Of 149 individuals in the 52families who were deceased at the time of pedigree de-velopment, we were able to globally genotype 50 (34%).DNA from archival tissue specimens was used to glob-ally genotype 11 affected family members. We recon-structed the genotypes of 39 persons, using genotypesof spouses and offspring, including genotypes from ar-chival tissue of five spouses. Genotyping was also per-formed for markers on chromosomes 6 and 12 for fivedeceased affected persons whose archival specimensyielded limited DNA. Without the ability to globallygenotype archival specimens, we would not have ge-notypes from 15% of the affected family membersneeded for linkage analysis.
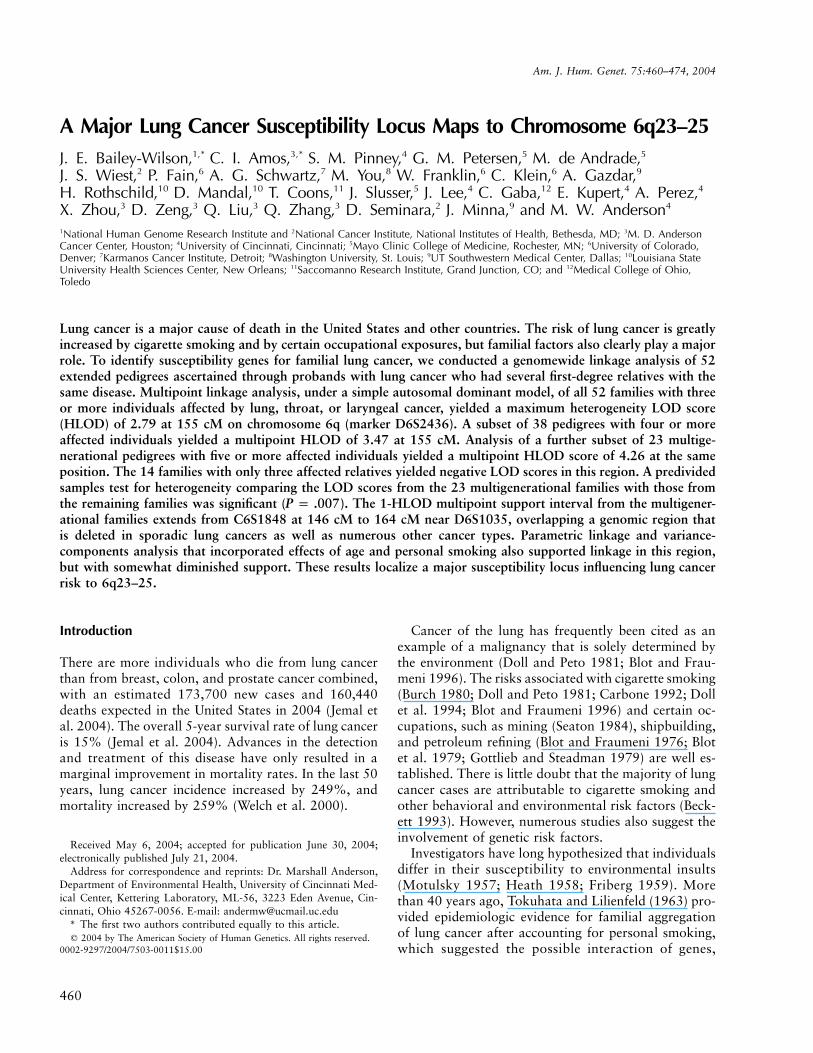
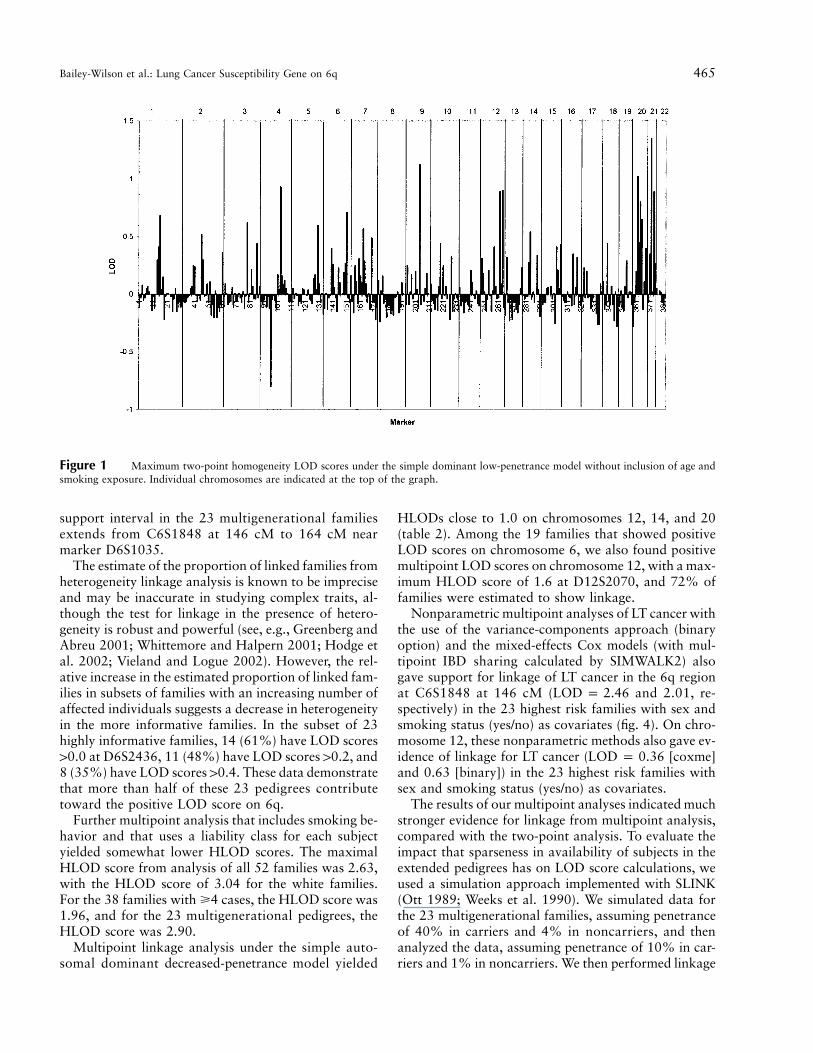
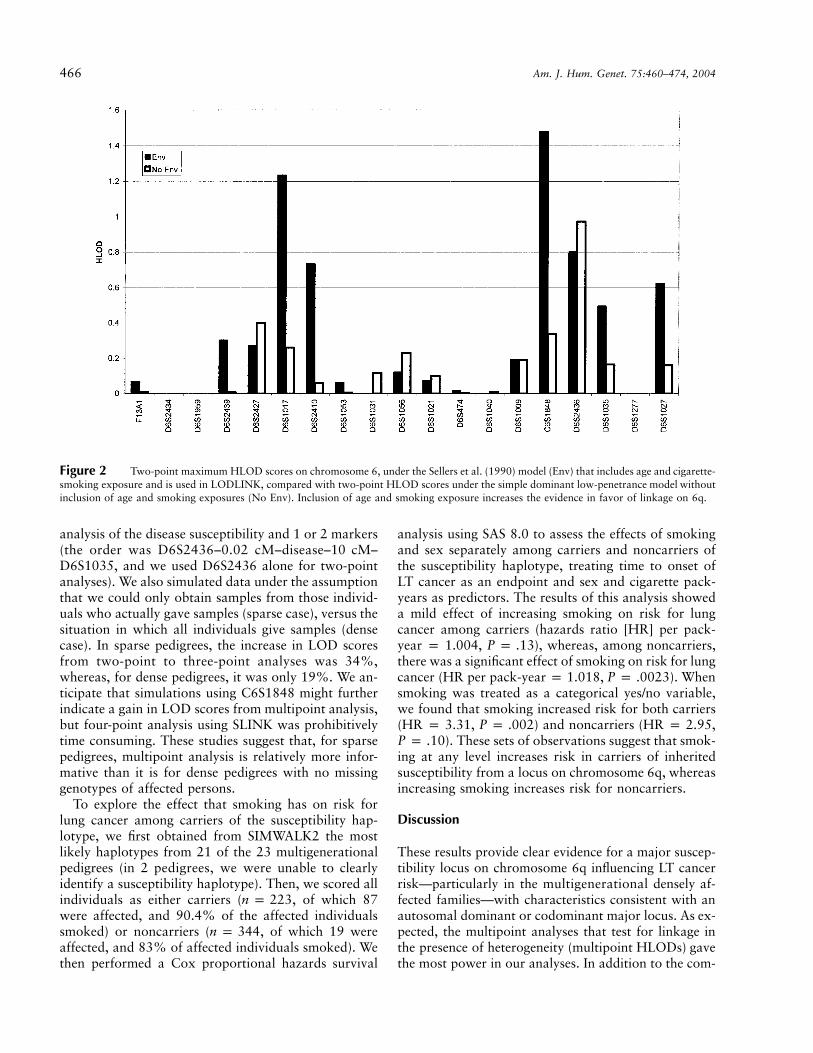
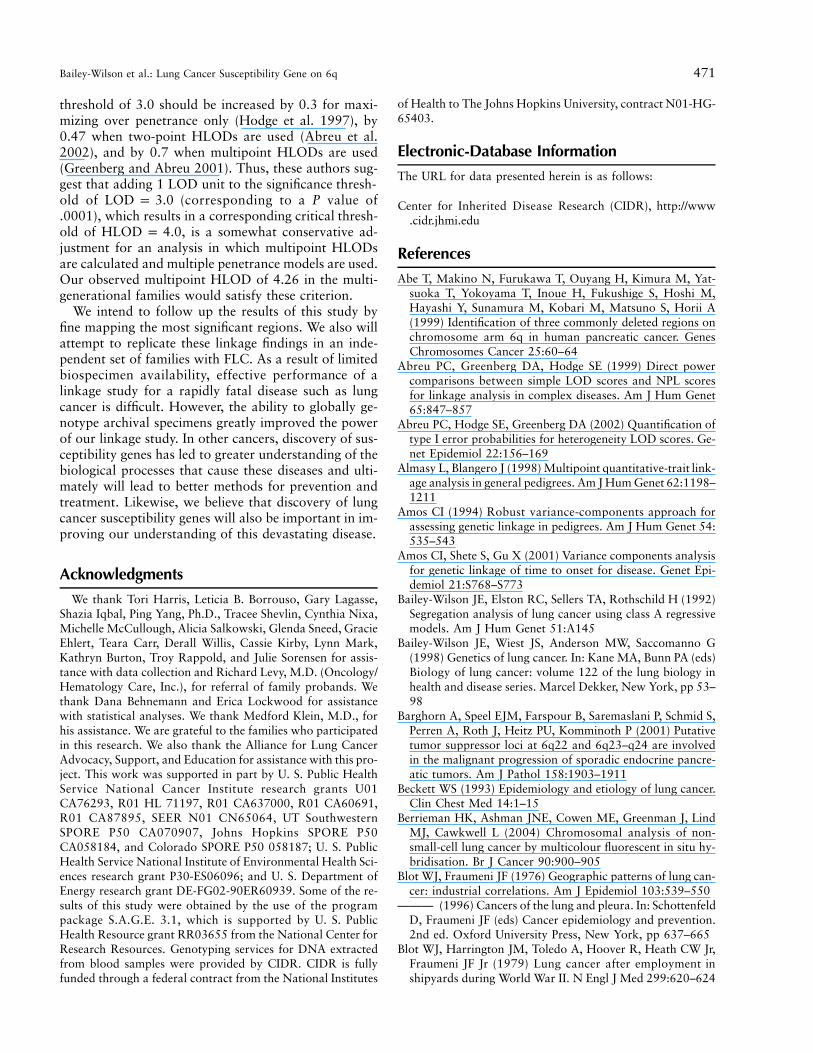
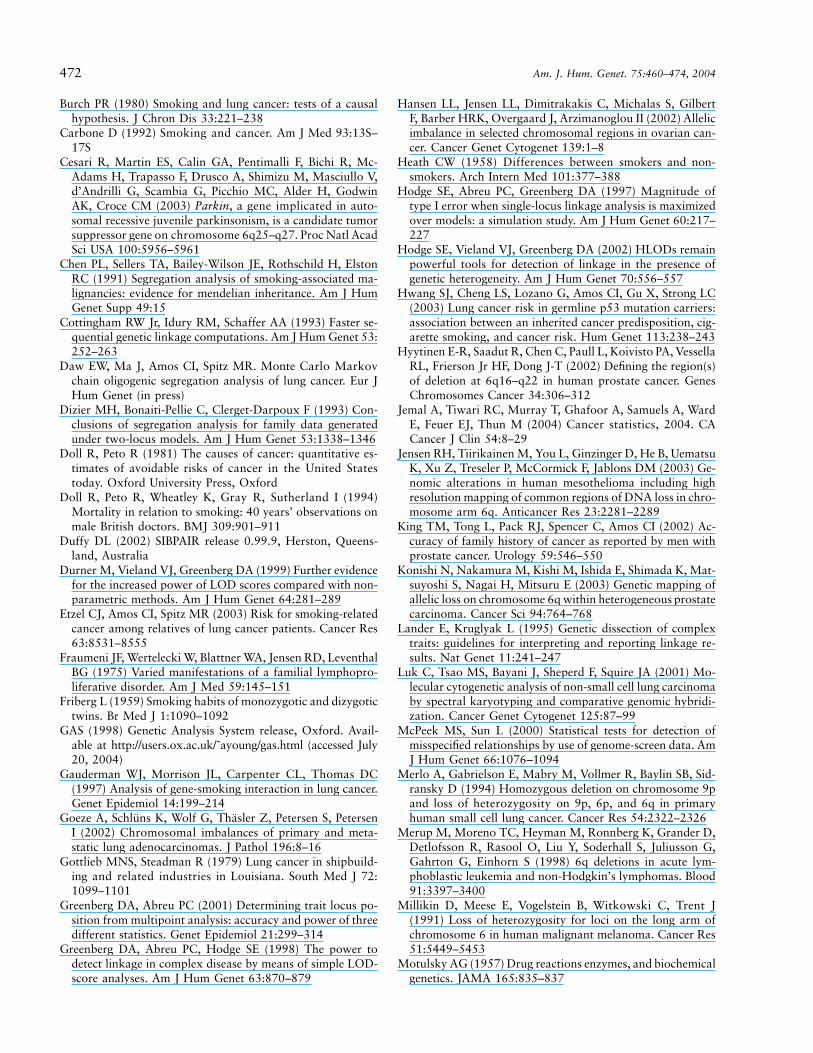
Figure 1 shows the maximum (recombination frac-tions of �40%) two-point homogeneity LOD scoresacross the genome, under the simple dominant low-pen-etrance model without inclusion of age and smokingexposure. Positive HLOD scores that approached orexceeded 1.0 were calculated for markers on chromo-somes 1, 4, 6, 9, 12, 20, and 21. Two-point analysisgave an HLOD of 0.94 at D6S2436 in all families andan HLOD of 1.5 in the 38 families with four affectedrelatives, whereas for the 23 highest risk families, thetwo-point HLOD score was 2.1. Figure 2 shows thatinclusion of age and smoking in the LODLINK modelsgives maximum two-point HLOD scores of 1.48 onchromosome 6 at C6S1848 in all families, but, formarker D6S2436, the LODLINK results includingsmoking and sex effects yielded lower HLOD scoresthan the simple model did. On chromosome 12, LOD-LINK yielded two-point HLODs of 1.54 at markerD12S372, 1.1 at D12S375, and 0.4 at D12S2070. TheHLOD scores that were obtained using the model thatincorporated the covariates were higher in some regionsthan the maximum two-point HLODs that were ob-tained under the simple dominant low-penetrance af-fected-only model with no covariates.
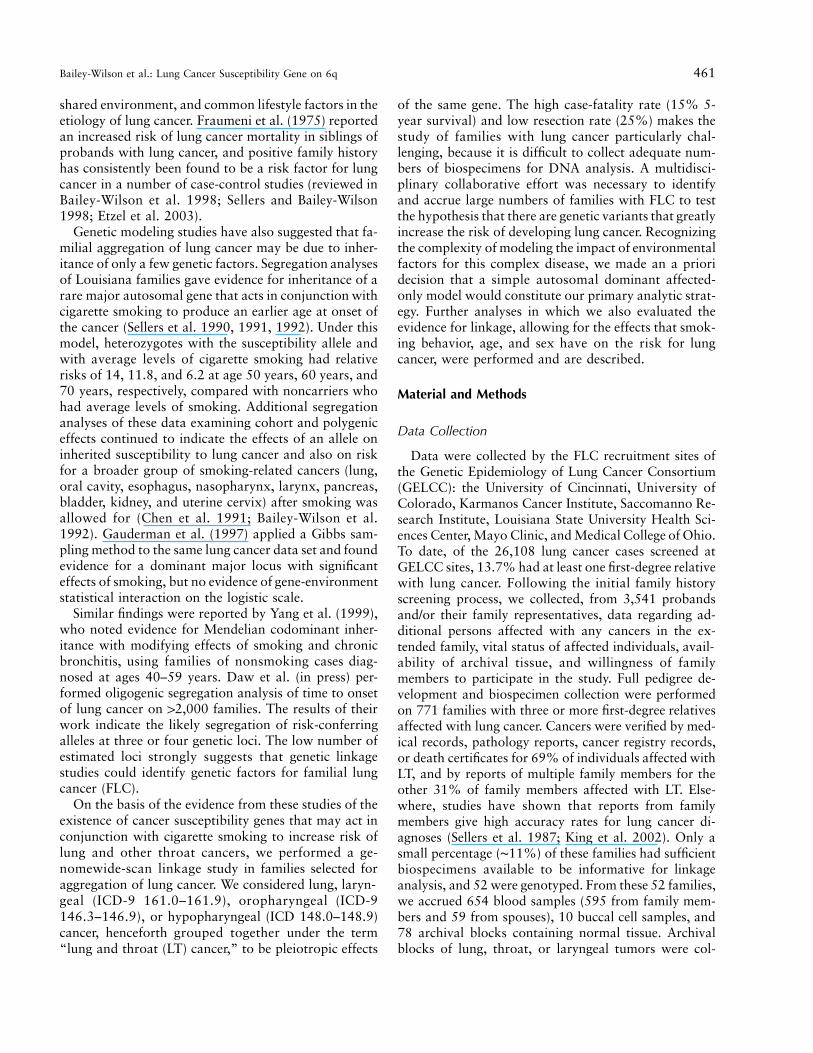
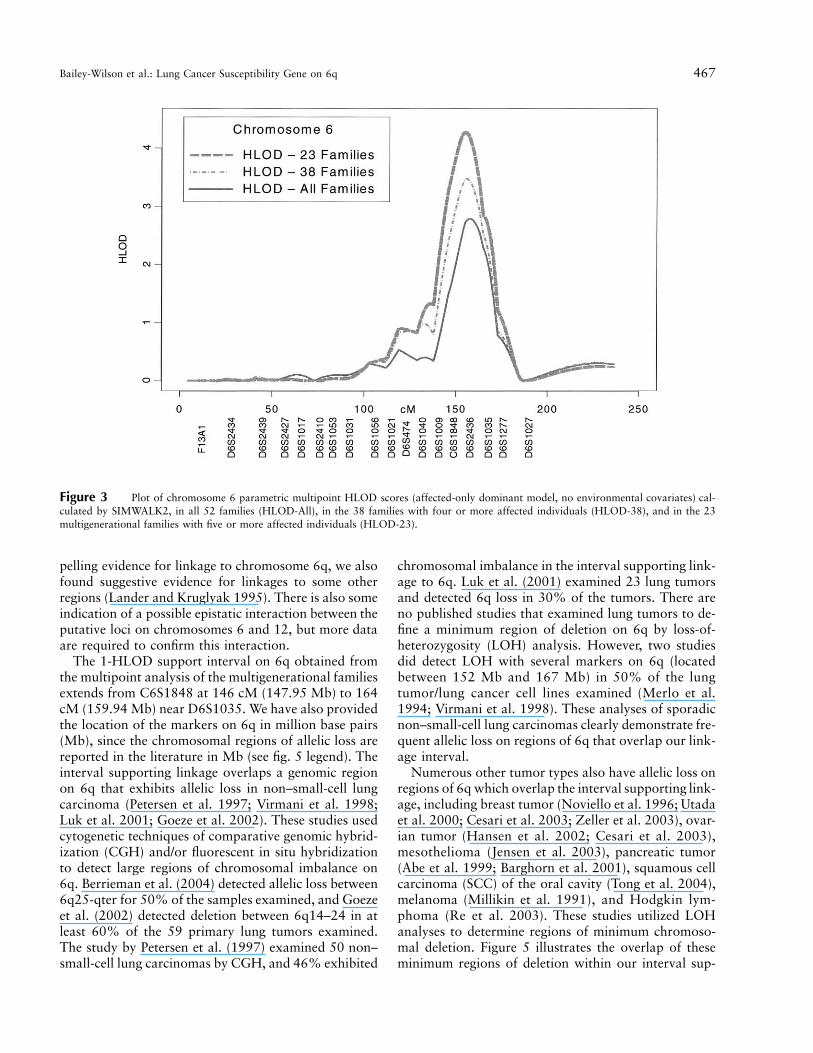
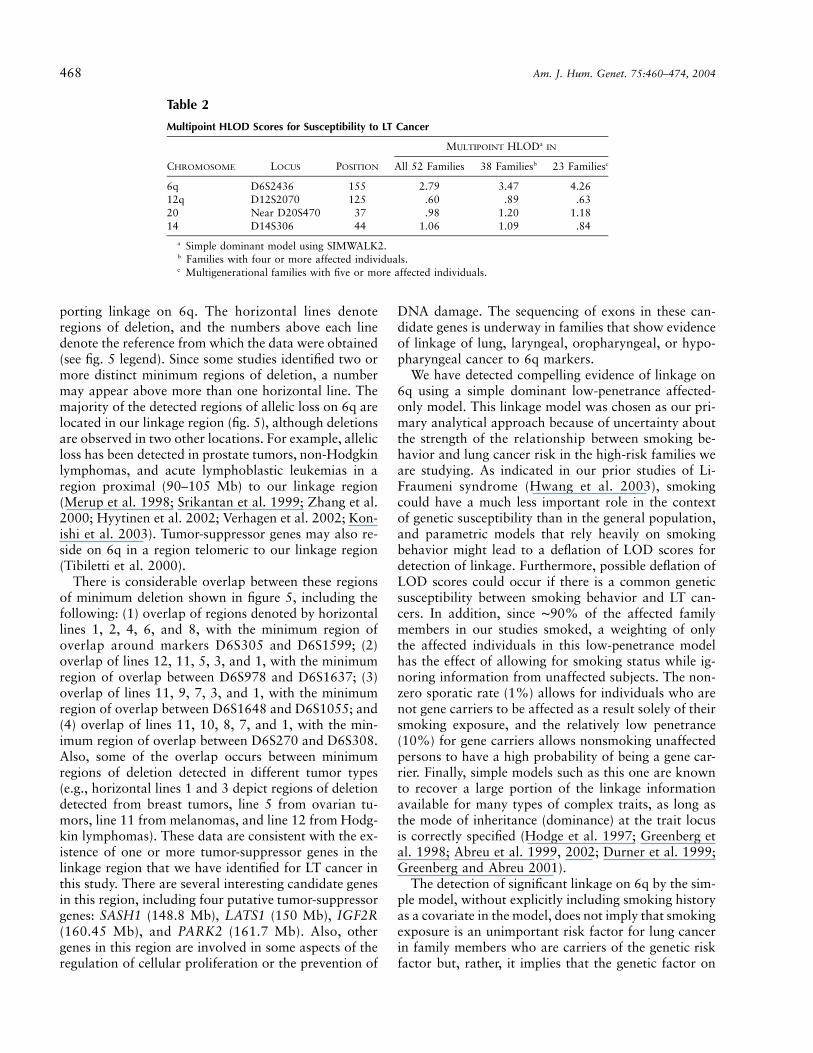
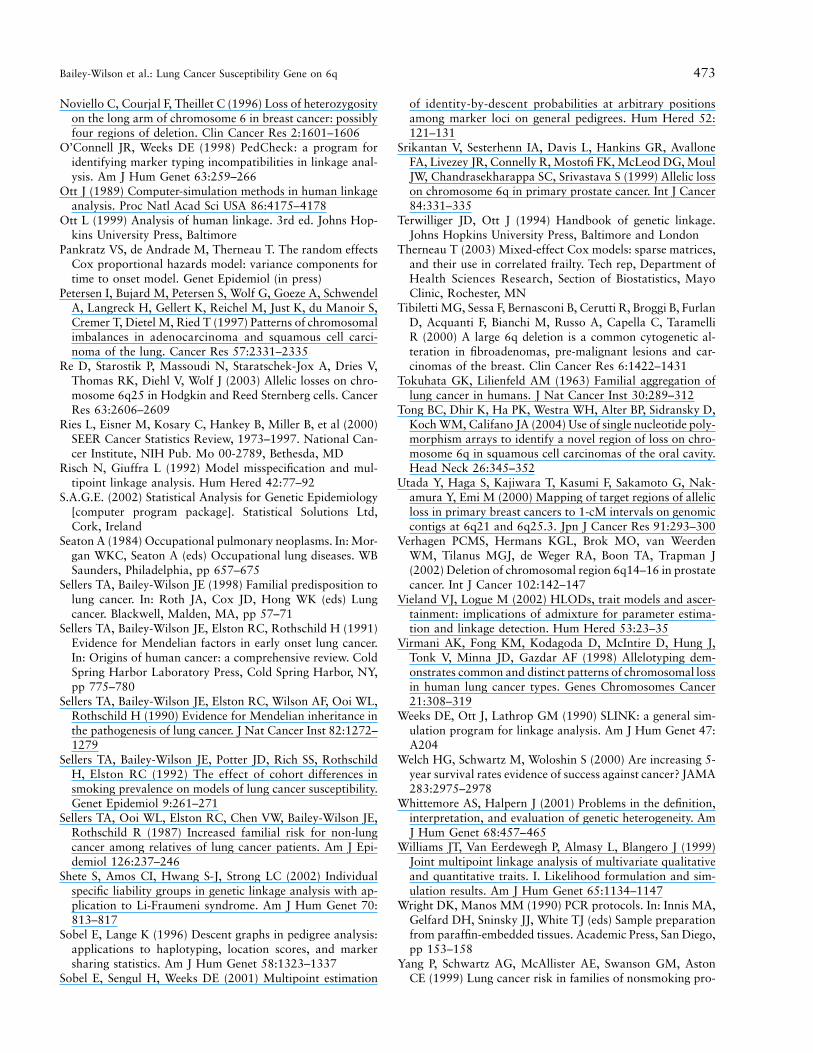
Multipoint parametric linkage under the simple dom-inant low-penetrance affected-only model yielded amaximum HLOD of 2.79 at 155 cM (marker D6S2436)on chromosome 6q in the 52 families (fig. 2), with 67%of families estimated to be linked. Multipoint analysisof the 38 families with four affected relatives gives anHLOD of 3.47 at this same location, with 78% of fam-ilies estimated to be linked, whereas for the 23 highestrisk families, the multipoint HLOD score is 4.26, with94% estimated to be linked (fig. 3 and table 2). Con-versely, linkage analysis of the 14 families with threeaffected relatives yielded negative LOD scores. A pre-divided samples test for heterogeneity (Ott 1999) thatcompared the evidence for linkage in multigenerationalfamilies with five affected relatives (23 families) to theother familes was significant ( ). The 1-HLODP p .007
Bailey-Wilson et al.: Lung Cancer Susceptibility Gene on 6q 465
Figure 1 Maximum two-point homogeneity LOD scores under the simple dominant low-penetrance model without inclusion of age andsmoking exposure. Individual chromosomes are indicated at the top of the graph.
support interval in the 23 multigenerational familiesextends from C6S1848 at 146 cM to 164 cM nearmarker D6S1035.
The estimate of the proportion of linked families fromheterogeneity linkage analysis is known to be impreciseand may be inaccurate in studying complex traits, al-though the test for linkage in the presence of hetero-geneity is robust and powerful (see, e.g., Greenberg andAbreu 2001; Whittemore and Halpern 2001; Hodge etal. 2002; Vieland and Logue 2002). However, the rel-ative increase in the estimated proportion of linked fam-ilies in subsets of families with an increasing number ofaffected individuals suggests a decrease in heterogeneityin the more informative families. In the subset of 23highly informative families, 14 (61%) have LOD scores10.0 at D6S2436, 11 (48%) have LOD scores 10.2, and8 (35%) have LOD scores 10.4. These data demonstratethat more than half of these 23 pedigrees contributetoward the positive LOD score on 6q.
Further multipoint analysis that includes smoking be-havior and that uses a liability class for each subjectyielded somewhat lower HLOD scores. The maximalHLOD score from analysis of all 52 families was 2.63,with the HLOD score of 3.04 for the white families.For the 38 families with �4 cases, the HLOD score was1.96, and for the 23 multigenerational pedigrees, theHLOD score was 2.90.
Multipoint linkage analysis under the simple auto-somal dominant decreased-penetrance model yielded
HLODs close to 1.0 on chromosomes 12, 14, and 20(table 2). Among the 19 families that showed positiveLOD scores on chromosome 6, we also found positivemultipoint LOD scores on chromosome 12, with a max-imum HLOD score of 1.6 at D12S2070, and 72% offamilies were estimated to show linkage.
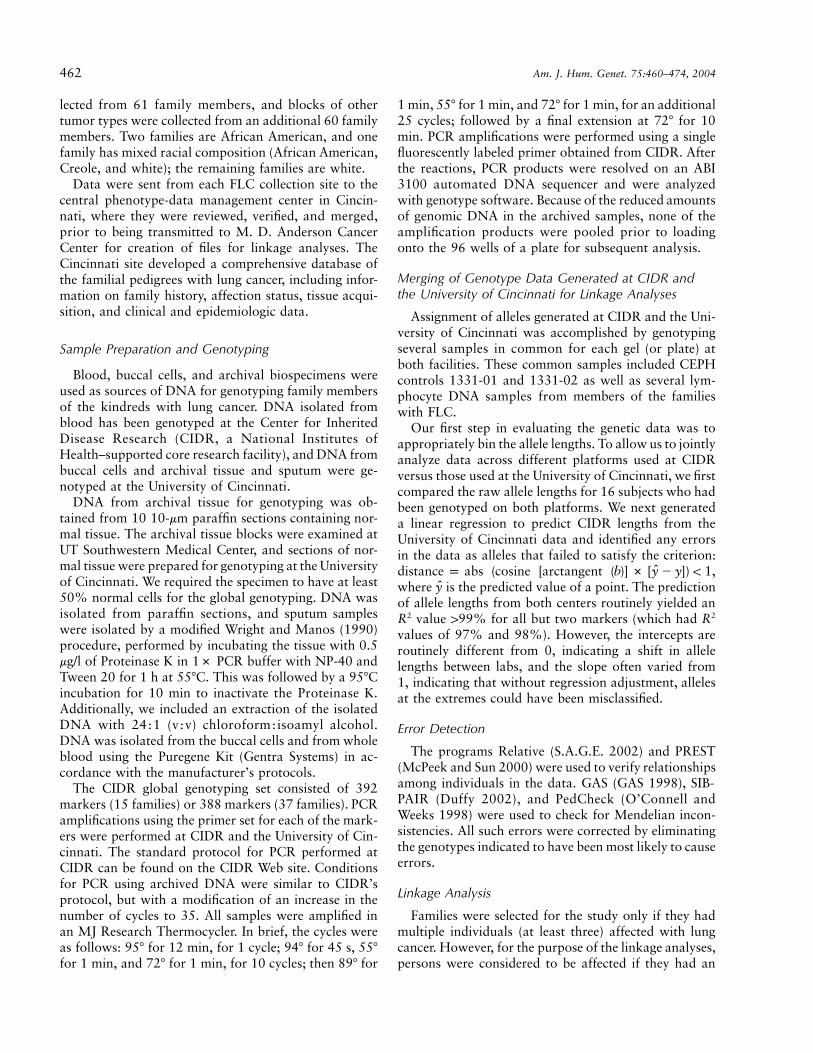
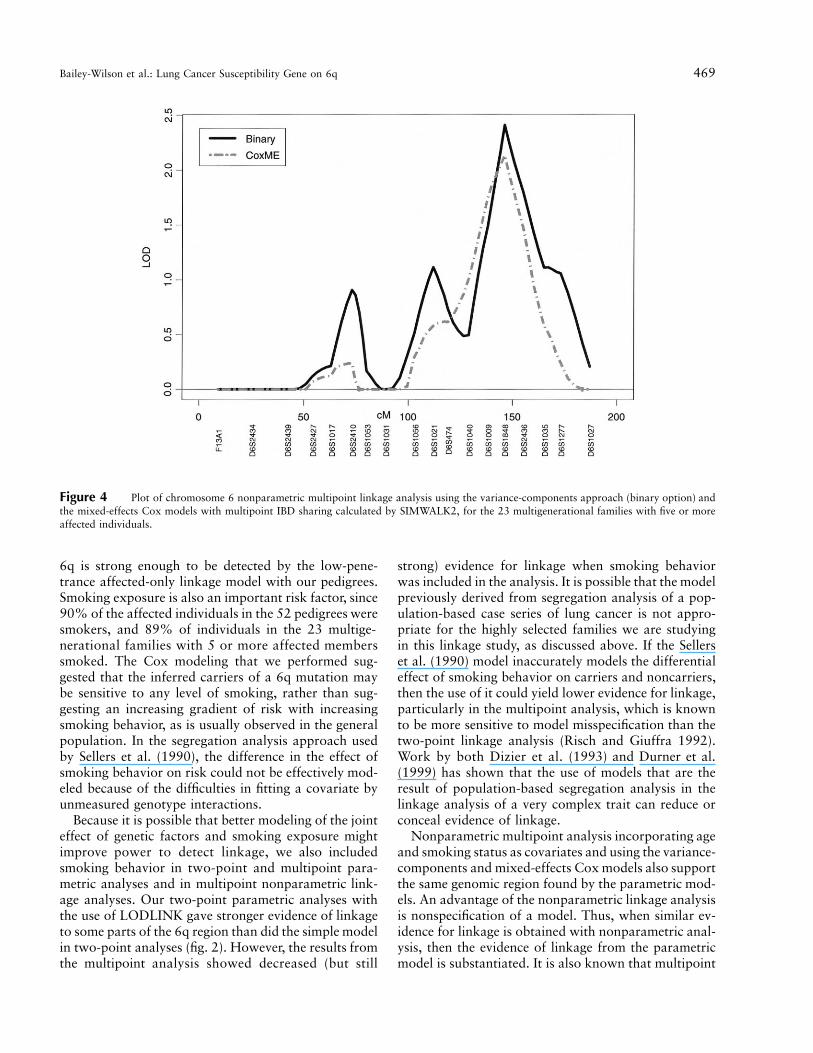
Nonparametric multipoint analyses of LT cancer withthe use of the variance-components approach (binaryoption) and the mixed-effects Cox models (with mul-tipoint IBD sharing calculated by SIMWALK2) alsogave support for linkage of LT cancer in the 6q regionat C6S1848 at 146 cM ( and 2.01, re-LOD p 2.46spectively) in the 23 highest risk families with sex andsmoking status (yes/no) as covariates (fig. 4). On chro-mosome 12, these nonparametric methods also gave ev-idence of linkage for LT cancer ( [coxme]LOD p 0.36and 0.63 [binary]) in the 23 highest risk families withsex and smoking status (yes/no) as covariates.
The results of our multipoint analyses indicated muchstronger evidence for linkage from multipoint analysis,compared with the two-point analysis. To evaluate theimpact that sparseness in availability of subjects in theextended pedigrees has on LOD score calculations, weused a simulation approach implemented with SLINK(Ott 1989; Weeks et al. 1990). We simulated data forthe 23 multigenerational families, assuming penetranceof 40% in carriers and 4% in noncarriers, and thenanalyzed the data, assuming penetrance of 10% in car-riers and 1% in noncarriers. We then performed linkage
466 Am. J. Hum. Genet. 75:460–474, 2004
Figure 2 Two-point maximum HLOD scores on chromosome 6, under the Sellers et al. (1990) model (Env) that includes age and cigarette-smoking exposure and is used in LODLINK, compared with two-point HLOD scores under the simple dominant low-penetrance model withoutinclusion of age and smoking exposures (No Env). Inclusion of age and smoking exposure increases the evidence in favor of linkage on 6q.
analysis of the disease susceptibility and 1 or 2 markers(the order was D6S2436–0.02 cM–disease–10 cM–D6S1035, and we used D6S2436 alone for two-pointanalyses). We also simulated data under the assumptionthat we could only obtain samples from those individ-uals who actually gave samples (sparse case), versus thesituation in which all individuals give samples (densecase). In sparse pedigrees, the increase in LOD scoresfrom two-point to three-point analyses was 34%,whereas, for dense pedigrees, it was only 19%. We an-ticipate that simulations using C6S1848 might furtherindicate a gain in LOD scores from multipoint analysis,but four-point analysis using SLINK was prohibitivelytime consuming. These studies suggest that, for sparsepedigrees, multipoint analysis is relatively more infor-mative than it is for dense pedigrees with no missinggenotypes of affected persons.
To explore the effect that smoking has on risk forlung cancer among carriers of the susceptibility hap-lotype, we first obtained from SIMWALK2 the mostlikely haplotypes from 21 of the 23 multigenerationalpedigrees (in 2 pedigrees, we were unable to clearlyidentify a susceptibility haplotype). Then, we scored allindividuals as either carriers ( , of which 87n p 223were affected, and 90.4% of the affected individualssmoked) or noncarriers ( , of which 19 weren p 344affected, and 83% of affected individuals smoked). Wethen performed a Cox proportional hazards survival
analysis using SAS 8.0 to assess the effects of smokingand sex separately among carriers and noncarriers ofthe susceptibility haplotype, treating time to onset ofLT cancer as an endpoint and sex and cigarette pack-years as predictors. The results of this analysis showeda mild effect of increasing smoking on risk for lungcancer among carriers (hazards ratio [HR] per pack-year p 1.004, ), whereas, among noncarriers,P p .13there was a significant effect of smoking on risk for lungcancer (HR per pack-year p 1.018, ). WhenP p .0023smoking was treated as a categorical yes/no variable,we found that smoking increased risk for both carriers(HR p 3.31, ) and noncarriers (HR p 2.95,P p .002
). These sets of observations suggest that smok-P p .10ing at any level increases risk in carriers of inheritedsusceptibility from a locus on chromosome 6q, whereasincreasing smoking increases risk for noncarriers.
Discussion
These results provide clear evidence for a major suscep-tibility locus on chromosome 6q influencing LT cancerrisk—particularly in the multigenerational densely af-fected families—with characteristics consistent with anautosomal dominant or codominant major locus. As ex-pected, the multipoint analyses that test for linkage inthe presence of heterogeneity (multipoint HLODs) gavethe most power in our analyses. In addition to the com-
Bailey-Wilson et al.: Lung Cancer Susceptibility Gene on 6q 467
Figure 3 Plot of chromosome 6 parametric multipoint HLOD scores (affected-only dominant model, no environmental covariates) cal-culated by SIMWALK2, in all 52 families (HLOD-All), in the 38 families with four or more affected individuals (HLOD-38), and in the 23multigenerational families with five or more affected individuals (HLOD-23).
pelling evidence for linkage to chromosome 6q, we alsofound suggestive evidence for linkages to some otherregions (Lander and Kruglyak 1995). There is also someindication of a possible epistatic interaction between theputative loci on chromosomes 6 and 12, but more dataare required to confirm this interaction.
The 1-HLOD support interval on 6q obtained fromthe multipoint analysis of the multigenerational familiesextends from C6S1848 at 146 cM (147.95 Mb) to 164cM (159.94 Mb) near D6S1035. We have also providedthe location of the markers on 6q in million base pairs(Mb), since the chromosomal regions of allelic loss arereported in the literature in Mb (see fig. 5 legend). Theinterval supporting linkage overlaps a genomic regionon 6q that exhibits allelic loss in non–small-cell lungcarcinoma (Petersen et al. 1997; Virmani et al. 1998;Luk et al. 2001; Goeze et al. 2002). These studies usedcytogenetic techniques of comparative genomic hybrid-ization (CGH) and/or fluorescent in situ hybridizationto detect large regions of chromosomal imbalance on6q. Berrieman et al. (2004) detected allelic loss between6q25-qter for 50% of the samples examined, and Goezeet al. (2002) detected deletion between 6q14–24 in atleast 60% of the 59 primary lung tumors examined.The study by Petersen et al. (1997) examined 50 non–small-cell lung carcinomas by CGH, and 46% exhibited
chromosomal imbalance in the interval supporting link-age to 6q. Luk et al. (2001) examined 23 lung tumorsand detected 6q loss in 30% of the tumors. There areno published studies that examined lung tumors to de-fine a minimum region of deletion on 6q by loss-of-heterozygosity (LOH) analysis. However, two studiesdid detect LOH with several markers on 6q (locatedbetween 152 Mb and 167 Mb) in 50% of the lungtumor/lung cancer cell lines examined (Merlo et al.1994; Virmani et al. 1998). These analyses of sporadicnon–small-cell lung carcinomas clearly demonstrate fre-quent allelic loss on regions of 6q that overlap our link-age interval.
Numerous other tumor types also have allelic loss onregions of 6q which overlap the interval supporting link-age, including breast tumor (Noviello et al. 1996; Utadaet al. 2000; Cesari et al. 2003; Zeller et al. 2003), ovar-ian tumor (Hansen et al. 2002; Cesari et al. 2003),mesothelioma (Jensen et al. 2003), pancreatic tumor(Abe et al. 1999; Barghorn et al. 2001), squamous cellcarcinoma (SCC) of the oral cavity (Tong et al. 2004),melanoma (Millikin et al. 1991), and Hodgkin lym-phoma (Re et al. 2003). These studies utilized LOHanalyses to determine regions of minimum chromoso-mal deletion. Figure 5 illustrates the overlap of theseminimum regions of deletion within our interval sup-
468 Am. J. Hum. Genet. 75:460–474, 2004
Table 2
Multipoint HLOD Scores for Susceptibility to LT Cancer
CHROMOSOME LOCUS POSITION
MULTIPOINT HLODa IN
All 52 Families 38 Familiesb 23 Familiesc
6q D6S2436 155 2.79 3.47 4.2612q D12S2070 125 .60 .89 .6320 Near D20S470 37 .98 1.20 1.1814 D14S306 44 1.06 1.09 .84
a Simple dominant model using SIMWALK2.b Families with four or more affected individuals.c Multigenerational families with five or more affected individuals.
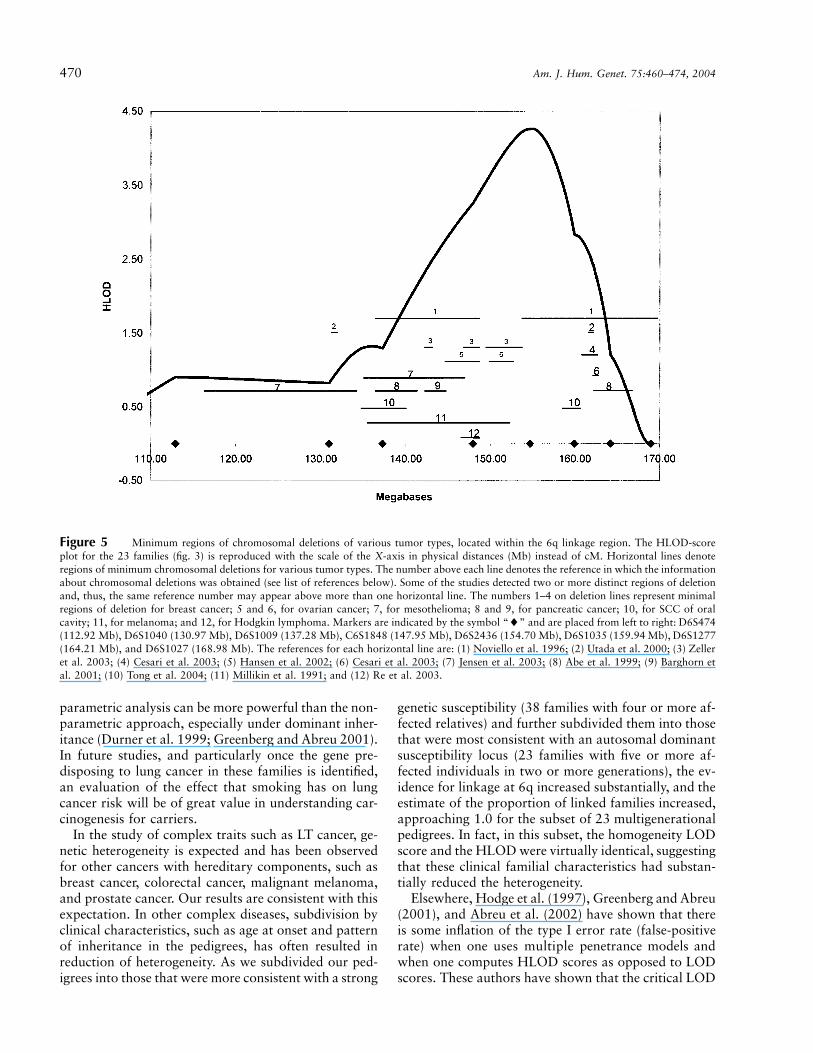
porting linkage on 6q. The horizontal lines denoteregions of deletion, and the numbers above each linedenote the reference from which the data were obtained(see fig. 5 legend). Since some studies identified two ormore distinct minimum regions of deletion, a numbermay appear above more than one horizontal line. Themajority of the detected regions of allelic loss on 6q arelocated in our linkage region (fig. 5), although deletionsare observed in two other locations. For example, allelicloss has been detected in prostate tumors, non-Hodgkinlymphomas, and acute lymphoblastic leukemias in aregion proximal (90–105 Mb) to our linkage region(Merup et al. 1998; Srikantan et al. 1999; Zhang et al.2000; Hyytinen et al. 2002; Verhagen et al. 2002; Kon-ishi et al. 2003). Tumor-suppressor genes may also re-side on 6q in a region telomeric to our linkage region(Tibiletti et al. 2000).
There is considerable overlap between these regionsof minimum deletion shown in figure 5, including thefollowing: (1) overlap of regions denoted by horizontallines 1, 2, 4, 6, and 8, with the minimum region ofoverlap around markers D6S305 and D6S1599; (2)overlap of lines 12, 11, 5, 3, and 1, with the minimumregion of overlap between D6S978 and D6S1637; (3)overlap of lines 11, 9, 7, 3, and 1, with the minimumregion of overlap between D6S1648 and D6S1055; and(4) overlap of lines 11, 10, 8, 7, and 1, with the min-imum region of overlap between D6S270 and D6S308.Also, some of the overlap occurs between minimumregions of deletion detected in different tumor types(e.g., horizontal lines 1 and 3 depict regions of deletiondetected from breast tumors, line 5 from ovarian tu-mors, line 11 from melanomas, and line 12 from Hodg-kin lymphomas). These data are consistent with the ex-istence of one or more tumor-suppressor genes in thelinkage region that we have identified for LT cancer inthis study. There are several interesting candidate genesin this region, including four putative tumor-suppressorgenes: SASH1 (148.8 Mb), LATS1 (150 Mb), IGF2R(160.45 Mb), and PARK2 (161.7 Mb). Also, othergenes in this region are involved in some aspects of theregulation of cellular proliferation or the prevention of
DNA damage. The sequencing of exons in these can-didate genes is underway in families that show evidenceof linkage of lung, laryngeal, oropharyngeal, or hypo-pharyngeal cancer to 6q markers.
We have detected compelling evidence of linkage on6q using a simple dominant low-penetrance affected-only model. This linkage model was chosen as our pri-mary analytical approach because of uncertainty aboutthe strength of the relationship between smoking be-havior and lung cancer risk in the high-risk families weare studying. As indicated in our prior studies of Li-Fraumeni syndrome (Hwang et al. 2003), smokingcould have a much less important role in the contextof genetic susceptibility than in the general population,and parametric models that rely heavily on smokingbehavior might lead to a deflation of LOD scores fordetection of linkage. Furthermore, possible deflation ofLOD scores could occur if there is a common geneticsusceptibility between smoking behavior and LT can-cers. In addition, since ∼90% of the affected familymembers in our studies smoked, a weighting of onlythe affected individuals in this low-penetrance modelhas the effect of allowing for smoking status while ig-noring information from unaffected subjects. The non-zero sporatic rate (1%) allows for individuals who arenot gene carriers to be affected as a result solely of theirsmoking exposure, and the relatively low penetrance(10%) for gene carriers allows nonsmoking unaffectedpersons to have a high probability of being a gene car-rier. Finally, simple models such as this one are knownto recover a large portion of the linkage informationavailable for many types of complex traits, as long asthe mode of inheritance (dominance) at the trait locusis correctly specified (Hodge et al. 1997; Greenberg etal. 1998; Abreu et al. 1999, 2002; Durner et al. 1999;Greenberg and Abreu 2001).
The detection of significant linkage on 6q by the sim-ple model, without explicitly including smoking historyas a covariate in the model, does not imply that smokingexposure is an unimportant risk factor for lung cancerin family members who are carriers of the genetic riskfactor but, rather, it implies that the genetic factor on
Bailey-Wilson et al.: Lung Cancer Susceptibility Gene on 6q 469
Figure 4 Plot of chromosome 6 nonparametric multipoint linkage analysis using the variance-components approach (binary option) andthe mixed-effects Cox models with multipoint IBD sharing calculated by SIMWALK2, for the 23 multigenerational families with five or moreaffected individuals.
6q is strong enough to be detected by the low-pene-trance affected-only linkage model with our pedigrees.Smoking exposure is also an important risk factor, since90% of the affected individuals in the 52 pedigrees weresmokers, and 89% of individuals in the 23 multige-nerational families with 5 or more affected memberssmoked. The Cox modeling that we performed sug-gested that the inferred carriers of a 6q mutation maybe sensitive to any level of smoking, rather than sug-gesting an increasing gradient of risk with increasingsmoking behavior, as is usually observed in the generalpopulation. In the segregation analysis approach usedby Sellers et al. (1990), the difference in the effect ofsmoking behavior on risk could not be effectively mod-eled because of the difficulties in fitting a covariate byunmeasured genotype interactions.
Because it is possible that better modeling of the jointeffect of genetic factors and smoking exposure mightimprove power to detect linkage, we also includedsmoking behavior in two-point and multipoint para-metric analyses and in multipoint nonparametric link-age analyses. Our two-point parametric analyses withthe use of LODLINK gave stronger evidence of linkageto some parts of the 6q region than did the simple modelin two-point analyses (fig. 2). However, the results fromthe multipoint analysis showed decreased (but still
strong) evidence for linkage when smoking behaviorwas included in the analysis. It is possible that the modelpreviously derived from segregation analysis of a pop-ulation-based case series of lung cancer is not appro-priate for the highly selected families we are studyingin this linkage study, as discussed above. If the Sellerset al. (1990) model inaccurately models the differentialeffect of smoking behavior on carriers and noncarriers,then the use of it could yield lower evidence for linkage,particularly in the multipoint analysis, which is knownto be more sensitive to model misspecification than thetwo-point linkage analysis (Risch and Giuffra 1992).Work by both Dizier et al. (1993) and Durner et al.(1999) has shown that the use of models that are theresult of population-based segregation analysis in thelinkage analysis of a very complex trait can reduce orconceal evidence of linkage.
Nonparametric multipoint analysis incorporating ageand smoking status as covariates and using the variance-components and mixed-effects Cox models also supportthe same genomic region found by the parametric mod-els. An advantage of the nonparametric linkage analysisis nonspecification of a model. Thus, when similar ev-idence for linkage is obtained with nonparametric anal-ysis, then the evidence of linkage from the parametricmodel is substantiated. It is also known that multipoint
470 Am. J. Hum. Genet. 75:460–474, 2004
Figure 5 Minimum regions of chromosomal deletions of various tumor types, located within the 6q linkage region. The HLOD-scoreplot for the 23 families (fig. 3) is reproduced with the scale of the X-axis in physical distances (Mb) instead of cM. Horizontal lines denoteregions of minimum chromosomal deletions for various tumor types. The number above each line denotes the reference in which the informationabout chromosomal deletions was obtained (see list of references below). Some of the studies detected two or more distinct regions of deletionand, thus, the same reference number may appear above more than one horizontal line. The numbers 1–4 on deletion lines represent minimalregions of deletion for breast cancer; 5 and 6, for ovarian cancer; 7, for mesothelioma; 8 and 9, for pancreatic cancer; 10, for SCC of oralcavity; 11, for melanoma; and 12, for Hodgkin lymphoma. Markers are indicated by the symbol “�” and are placed from left to right: D6S474(112.92 Mb), D6S1040 (130.97 Mb), D6S1009 (137.28 Mb), C6S1848 (147.95 Mb), D6S2436 (154.70 Mb), D6S1035 (159.94 Mb), D6S1277(164.21 Mb), and D6S1027 (168.98 Mb). The references for each horizontal line are: (1) Noviello et al. 1996; (2) Utada et al. 2000; (3) Zelleret al. 2003; (4) Cesari et al. 2003; (5) Hansen et al. 2002; (6) Cesari et al. 2003; (7) Jensen et al. 2003; (8) Abe et al. 1999; (9) Barghorn etal. 2001; (10) Tong et al. 2004; (11) Millikin et al. 1991; and (12) Re et al. 2003.
parametric analysis can be more powerful than the non-parametric approach, especially under dominant inher-itance (Durner et al. 1999; Greenberg and Abreu 2001).In future studies, and particularly once the gene pre-disposing to lung cancer in these families is identified,an evaluation of the effect that smoking has on lungcancer risk will be of great value in understanding car-cinogenesis for carriers.
In the study of complex traits such as LT cancer, ge-netic heterogeneity is expected and has been observedfor other cancers with hereditary components, such asbreast cancer, colorectal cancer, malignant melanoma,and prostate cancer. Our results are consistent with thisexpectation. In other complex diseases, subdivision byclinical characteristics, such as age at onset and patternof inheritance in the pedigrees, has often resulted inreduction of heterogeneity. As we subdivided our ped-igrees into those that were more consistent with a strong
genetic susceptibility (38 families with four or more af-fected relatives) and further subdivided them into thosethat were most consistent with an autosomal dominantsusceptibility locus (23 families with five or more af-fected individuals in two or more generations), the ev-idence for linkage at 6q increased substantially, and theestimate of the proportion of linked families increased,approaching 1.0 for the subset of 23 multigenerationalpedigrees. In fact, in this subset, the homogeneity LODscore and the HLOD were virtually identical, suggestingthat these clinical familial characteristics had substan-tially reduced the heterogeneity.
Elsewhere, Hodge et al. (1997), Greenberg and Abreu(2001), and Abreu et al. (2002) have shown that thereis some inflation of the type I error rate (false-positiverate) when one uses multiple penetrance models andwhen one computes HLOD scores as opposed to LODscores. These authors have shown that the critical LOD
Bailey-Wilson et al.: Lung Cancer Susceptibility Gene on 6q 471
threshold of 3.0 should be increased by 0.3 for maxi-mizing over penetrance only (Hodge et al. 1997), by0.47 when two-point HLODs are used (Abreu et al.2002), and by 0.7 when multipoint HLODs are used(Greenberg and Abreu 2001). Thus, these authors sug-gest that adding 1 LOD unit to the significance thresh-old of (corresponding to a P value ofLOD p 3.0.0001), which results in a corresponding critical thresh-old of , is a somewhat conservative ad-HLOD p 4.0justment for an analysis in which multipoint HLODsare calculated and multiple penetrance models are used.Our observed multipoint HLOD of 4.26 in the multi-generational families would satisfy these criterion.
We intend to follow up the results of this study byfine mapping the most significant regions. We also willattempt to replicate these linkage findings in an inde-pendent set of families with FLC. As a result of limitedbiospecimen availability, effective performance of alinkage study for a rapidly fatal disease such as lungcancer is difficult. However, the ability to globally ge-notype archival specimens greatly improved the powerof our linkage study. In other cancers, discovery of sus-ceptibility genes has led to greater understanding of thebiological processes that cause these diseases and ulti-mately will lead to better methods for prevention andtreatment. Likewise, we believe that discovery of lungcancer susceptibility genes will also be important in im-proving our understanding of this devastating disease.
Acknowledgments
We thank Tori Harris, Leticia B. Borrouso, Gary Lagasse,Shazia Iqbal, Ping Yang, Ph.D., Tracee Shevlin, Cynthia Nixa,Michelle McCullough, Alicia Salkowski, Glenda Sneed, GracieEhlert, Teara Carr, Derall Willis, Cassie Kirby, Lynn Mark,Kathryn Burton, Troy Rappold, and Julie Sorensen for assis-tance with data collection and Richard Levy, M.D. (Oncology/Hematology Care, Inc.), for referral of family probands. Wethank Dana Behnemann and Erica Lockwood for assistancewith statistical analyses. We thank Medford Klein, M.D., forhis assistance. We are grateful to the families who participatedin this research. We also thank the Alliance for Lung CancerAdvocacy, Support, and Education for assistance with this pro-ject. This work was supported in part by U. S. Public HealthService National Cancer Institute research grants U01CA76293, R01 HL 71197, R01 CA637000, R01 CA60691,R01 CA87895, SEER N01 CN65064, UT SouthwesternSPORE P50 CA070907, Johns Hopkins SPORE P50CA058184, and Colorado SPORE P50 058187; U. S. PublicHealth Service National Institute of Environmental Health Sci-ences research grant P30-ES06096; and U. S. Department ofEnergy research grant DE-FG02-90ER60939. Some of the re-sults of this study were obtained by the use of the programpackage S.A.G.E. 3.1, which is supported by U. S. PublicHealth Resource grant RR03655 from the National Center forResearch Resources. Genotyping services for DNA extractedfrom blood samples were provided by CIDR. CIDR is fullyfunded through a federal contract from the National Institutes
of Health to The Johns Hopkins University, contract N01-HG-65403.
Electronic-Database Information
The URL for data presented herein is as follows:
Center for Inherited Disease Research (CIDR), http://www.cidr.jhmi.edu
References
Abe T, Makino N, Furukawa T, Ouyang H, Kimura M, Yat-suoka T, Yokoyama T, Inoue H, Fukushige S, Hoshi M,Hayashi Y, Sunamura M, Kobari M, Matsuno S, Horii A(1999) Identification of three commonly deleted regions onchromosome arm 6q in human pancreatic cancer. GenesChromosomes Cancer 25:60–64
Abreu PC, Greenberg DA, Hodge SE (1999) Direct powercomparisons between simple LOD scores and NPL scoresfor linkage analysis in complex diseases. Am J Hum Genet65:847–857
Abreu PC, Hodge SE, Greenberg DA (2002) Quantification oftype I error probabilities for heterogeneity LOD scores. Ge-net Epidemiol 22:156–169
Almasy L, Blangero J (1998) Multipoint quantitative-trait link-age analysis in general pedigrees. Am J Hum Genet 62:1198–1211
Amos CI (1994) Robust variance-components approach forassessing genetic linkage in pedigrees. Am J Hum Genet 54:535–543
Amos CI, Shete S, Gu X (2001) Variance components analysisfor genetic linkage of time to onset for disease. Genet Epi-demiol 21:S768–S773
Bailey-Wilson JE, Elston RC, Sellers TA, Rothschild H (1992)Segregation analysis of lung cancer using class A regressivemodels. Am J Hum Genet 51:A145
Bailey-Wilson JE, Wiest JS, Anderson MW, Saccomanno G(1998) Genetics of lung cancer. In: Kane MA, Bunn PA (eds)Biology of lung cancer: volume 122 of the lung biology inhealth and disease series. Marcel Dekker, New York, pp 53–98
Barghorn A, Speel EJM, Farspour B, Saremaslani P, Schmid S,Perren A, Roth J, Heitz PU, Komminoth P (2001) Putativetumor suppressor loci at 6q22 and 6q23–q24 are involvedin the malignant progression of sporadic endocrine pancre-atic tumors. Am J Pathol 158:1903–1911
Beckett WS (1993) Epidemiology and etiology of lung cancer.Clin Chest Med 14:1–15
Berrieman HK, Ashman JNE, Cowen ME, Greenman J, LindMJ, Cawkwell L (2004) Chromosomal analysis of non-small-cell lung cancer by multicolour fluorescent in situ hy-bridisation. Br J Cancer 90:900–905
Blot WJ, Fraumeni JF (1976) Geographic patterns of lung can-cer: industrial correlations. Am J Epidemiol 103:539–550
——— (1996) Cancers of the lung and pleura. In: SchottenfeldD, Fraumeni JF (eds) Cancer epidemiology and prevention.2nd ed. Oxford University Press, New York, pp 637–665
Blot WJ, Harrington JM, Toledo A, Hoover R, Heath CW Jr,Fraumeni JF Jr (1979) Lung cancer after employment inshipyards during World War II. N Engl J Med 299:620–624
472 Am. J. Hum. Genet. 75:460–474, 2004
Burch PR (1980) Smoking and lung cancer: tests of a causalhypothesis. J Chron Dis 33:221–238
Carbone D (1992) Smoking and cancer. Am J Med 93:13S–17S
Cesari R, Martin ES, Calin GA, Pentimalli F, Bichi R, Mc-Adams H, Trapasso F, Drusco A, Shimizu M, Masciullo V,d’Andrilli G, Scambia G, Picchio MC, Alder H, GodwinAK, Croce CM (2003) Parkin, a gene implicated in auto-somal recessive juvenile parkinsonism, is a candidate tumorsuppressor gene on chromosome 6q25–q27. Proc Natl AcadSci USA 100:5956–5961
Chen PL, Sellers TA, Bailey-Wilson JE, Rothschild H, ElstonRC (1991) Segregation analysis of smoking-associated ma-lignancies: evidence for mendelian inheritance. Am J HumGenet Supp 49:15
Cottingham RW Jr, Idury RM, Schaffer AA (1993) Faster se-quential genetic linkage computations. Am J Hum Genet 53:252–263
Daw EW, Ma J, Amos CI, Spitz MR. Monte Carlo Markovchain oligogenic segregation analysis of lung cancer. Eur JHum Genet (in press)
Dizier MH, Bonaiti-Pellie C, Clerget-Darpoux F (1993) Con-clusions of segregation analysis for family data generatedunder two-locus models. Am J Hum Genet 53:1338–1346
Doll R, Peto R (1981) The causes of cancer: quantitative es-timates of avoidable risks of cancer in the United Statestoday. Oxford University Press, Oxford
Doll R, Peto R, Wheatley K, Gray R, Sutherland I (1994)Mortality in relation to smoking: 40 years’ observations onmale British doctors. BMJ 309:901–911
Duffy DL (2002) SIBPAIR release 0.99.9, Herston, Queens-land, Australia
Durner M, Vieland VJ, Greenberg DA (1999) Further evidencefor the increased power of LOD scores compared with non-parametric methods. Am J Hum Genet 64:281–289
Etzel CJ, Amos CI, Spitz MR (2003) Risk for smoking-relatedcancer among relatives of lung cancer patients. Cancer Res63:8531–8555
Fraumeni JF, Wertelecki W, Blattner WA, Jensen RD, LeventhalBG (1975) Varied manifestations of a familial lymphopro-liferative disorder. Am J Med 59:145–151
Friberg L (1959) Smoking habits of monozygotic and dizygotictwins. Br Med J 1:1090–1092
GAS (1998) Genetic Analysis System release, Oxford. Avail-able at http://users.ox.ac.uk/˜ayoung/gas.html (accessed July20, 2004)
Gauderman WJ, Morrison JL, Carpenter CL, Thomas DC(1997) Analysis of gene-smoking interaction in lung cancer.Genet Epidemiol 14:199–214
Goeze A, Schluns K, Wolf G, Thasler Z, Petersen S, PetersenI (2002) Chromosomal imbalances of primary and meta-static lung adenocarcinomas. J Pathol 196:8–16
Gottlieb MNS, Steadman R (1979) Lung cancer in shipbuild-ing and related industries in Louisiana. South Med J 72:1099–1101
Greenberg DA, Abreu PC (2001) Determining trait locus po-sition from multipoint analysis: accuracy and power of threedifferent statistics. Genet Epidemiol 21:299–314
Greenberg DA, Abreu PC, Hodge SE (1998) The power todetect linkage in complex disease by means of simple LOD-score analyses. Am J Hum Genet 63:870–879
Hansen LL, Jensen LL, Dimitrakakis C, Michalas S, GilbertF, Barber HRK, Overgaard J, Arzimanoglou II (2002) Allelicimbalance in selected chromosomal regions in ovarian can-cer. Cancer Genet Cytogenet 139:1–8
Heath CW (1958) Differences between smokers and non-smokers. Arch Intern Med 101:377–388
Hodge SE, Abreu PC, Greenberg DA (1997) Magnitude oftype I error when single-locus linkage analysis is maximizedover models: a simulation study. Am J Hum Genet 60:217–227
Hodge SE, Vieland VJ, Greenberg DA (2002) HLODs remainpowerful tools for detection of linkage in the presence ofgenetic heterogeneity. Am J Hum Genet 70:556–557
Hwang SJ, Cheng LS, Lozano G, Amos CI, Gu X, Strong LC(2003) Lung cancer risk in germline p53 mutation carriers:association between an inherited cancer predisposition, cig-arette smoking, and cancer risk. Hum Genet 113:238–243
Hyytinen E-R, Saadut R, Chen C, Paull L, Koivisto PA, VessellaRL, Frierson Jr HF, Dong J-T (2002) Defining the region(s)of deletion at 6q16–q22 in human prostate cancer. GenesChromosomes Cancer 34:306–312
Jemal A, Tiwari RC, Murray T, Ghafoor A, Samuels A, WardE, Feuer EJ, Thun M (2004) Cancer statistics, 2004. CACancer J Clin 54:8–29
Jensen RH, Tiirikainen M, You L, Ginzinger D, He B, UematsuK, Xu Z, Treseler P, McCormick F, Jablons DM (2003) Ge-nomic alterations in human mesothelioma including highresolution mapping of common regions of DNA loss in chro-mosome arm 6q. Anticancer Res 23:2281–2289
King TM, Tong L, Pack RJ, Spencer C, Amos CI (2002) Ac-curacy of family history of cancer as reported by men withprostate cancer. Urology 59:546–550
Konishi N, Nakamura M, Kishi M, Ishida E, Shimada K, Mat-suyoshi S, Nagai H, Mitsuru E (2003) Genetic mapping ofallelic loss on chromosome 6q within heterogeneous prostatecarcinoma. Cancer Sci 94:764–768
Lander E, Kruglyak L (1995) Genetic dissection of complextraits: guidelines for interpreting and reporting linkage re-sults. Nat Genet 11:241–247
Luk C, Tsao MS, Bayani J, Sheperd F, Squire JA (2001) Mo-lecular cytogenetic analysis of non-small cell lung carcinomaby spectral karyotyping and comparative genomic hybridi-zation. Cancer Genet Cytogenet 125:87–99
McPeek MS, Sun L (2000) Statistical tests for detection ofmisspecified relationships by use of genome-screen data. AmJ Hum Genet 66:1076–1094
Merlo A, Gabrielson E, Mabry M, Vollmer R, Baylin SB, Sid-ransky D (1994) Homozygous deletion on chromosome 9pand loss of heterozygosity on 9p, 6p, and 6q in primaryhuman small cell lung cancer. Cancer Res 54:2322–2326
Merup M, Moreno TC, Heyman M, Ronnberg K, Grander D,Detlofsson R, Rasool O, Liu Y, Soderhall S, Juliusson G,Gahrton G, Einhorn S (1998) 6q deletions in acute lym-phoblastic leukemia and non-Hodgkin’s lymphomas. Blood91:3397–3400
Millikin D, Meese E, Vogelstein B, Witkowski C, Trent J(1991) Loss of heterozygosity for loci on the long arm ofchromosome 6 in human malignant melanoma. Cancer Res51:5449–5453
Motulsky AG (1957) Drug reactions enzymes, and biochemicalgenetics. JAMA 165:835–837
Bailey-Wilson et al.: Lung Cancer Susceptibility Gene on 6q 473
Noviello C, Courjal F, Theillet C (1996) Loss of heterozygosityon the long arm of chromosome 6 in breast cancer: possiblyfour regions of deletion. Clin Cancer Res 2:1601–1606
O’Connell JR, Weeks DE (1998) PedCheck: a program foridentifying marker typing incompatibilities in linkage anal-ysis. Am J Hum Genet 63:259–266
Ott J (1989) Computer-simulation methods in human linkageanalysis. Proc Natl Acad Sci USA 86:4175–4178
Ott L (1999) Analysis of human linkage. 3rd ed. Johns Hop-kins University Press, Baltimore
Pankratz VS, de Andrade M, Therneau T. The random effectsCox proportional hazards model: variance components fortime to onset model. Genet Epidemiol (in press)
Petersen I, Bujard M, Petersen S, Wolf G, Goeze A, SchwendelA, Langreck H, Gellert K, Reichel M, Just K, du Manoir S,Cremer T, Dietel M, Ried T (1997) Patterns of chromosomalimbalances in adenocarcinoma and squamous cell carci-noma of the lung. Cancer Res 57:2331–2335
Re D, Starostik P, Massoudi N, Staratschek-Jox A, Dries V,Thomas RK, Diehl V, Wolf J (2003) Allelic losses on chro-mosome 6q25 in Hodgkin and Reed Sternberg cells. CancerRes 63:2606–2609
Ries L, Eisner M, Kosary C, Hankey B, Miller B, et al (2000)SEER Cancer Statistics Review, 1973–1997. National Can-cer Institute, NIH Pub. Mo 00-2789, Bethesda, MD
Risch N, Giuffra L (1992) Model misspecification and mul-tipoint linkage analysis. Hum Hered 42:77–92
S.A.G.E. (2002) Statistical Analysis for Genetic Epidemiology[computer program package]. Statistical Solutions Ltd,Cork, Ireland
Seaton A (1984) Occupational pulmonary neoplasms. In: Mor-gan WKC, Seaton A (eds) Occupational lung diseases. WBSaunders, Philadelphia, pp 657–675
Sellers TA, Bailey-Wilson JE (1998) Familial predisposition tolung cancer. In: Roth JA, Cox JD, Hong WK (eds) Lungcancer. Blackwell, Malden, MA, pp 57–71
Sellers TA, Bailey-Wilson JE, Elston RC, Rothschild H (1991)Evidence for Mendelian factors in early onset lung cancer.In: Origins of human cancer: a comprehensive review. ColdSpring Harbor Laboratory Press, Cold Spring Harbor, NY,pp 775–780
Sellers TA, Bailey-Wilson JE, Elston RC, Wilson AF, Ooi WL,Rothschild H (1990) Evidence for Mendelian inheritance inthe pathogenesis of lung cancer. J Nat Cancer Inst 82:1272–1279
Sellers TA, Bailey-Wilson JE, Potter JD, Rich SS, RothschildH, Elston RC (1992) The effect of cohort differences insmoking prevalence on models of lung cancer susceptibility.Genet Epidemiol 9:261–271
Sellers TA, Ooi WL, Elston RC, Chen VW, Bailey-Wilson JE,Rothschild R (1987) Increased familial risk for non-lungcancer among relatives of lung cancer patients. Am J Epi-demiol 126:237–246
Shete S, Amos CI, Hwang S-J, Strong LC (2002) Individualspecific liability groups in genetic linkage analysis with ap-plication to Li-Fraumeni syndrome. Am J Hum Genet 70:813–817
Sobel E, Lange K (1996) Descent graphs in pedigree analysis:applications to haplotyping, location scores, and markersharing statistics. Am J Hum Genet 58:1323–1337
Sobel E, Sengul H, Weeks DE (2001) Multipoint estimation
of identity-by-descent probabilities at arbitrary positionsamong marker loci on general pedigrees. Hum Hered 52:121–131
Srikantan V, Sesterhenn IA, Davis L, Hankins GR, AvalloneFA, Livezey JR, Connelly R, Mostofi FK, McLeod DG, MoulJW, Chandrasekharappa SC, Srivastava S (1999) Allelic losson chromosome 6q in primary prostate cancer. Int J Cancer84:331–335
Terwilliger JD, Ott J (1994) Handbook of genetic linkage.Johns Hopkins University Press, Baltimore and London
Therneau T (2003) Mixed-effect Cox models: sparse matrices,and their use in correlated frailty. Tech rep, Department ofHealth Sciences Research, Section of Biostatistics, MayoClinic, Rochester, MN
Tibiletti MG, Sessa F, Bernasconi B, Cerutti R, Broggi B, FurlanD, Acquanti F, Bianchi M, Russo A, Capella C, TaramelliR (2000) A large 6q deletion is a common cytogenetic al-teration in fibroadenomas, pre-malignant lesions and car-cinomas of the breast. Clin Cancer Res 6:1422–1431
Tokuhata GK, Lilienfeld AM (1963) Familial aggregation oflung cancer in humans. J Nat Cancer Inst 30:289–312
Tong BC, Dhir K, Ha PK, Westra WH, Alter BP, Sidransky D,Koch WM, Califano JA (2004) Use of single nucleotide poly-morphism arrays to identify a novel region of loss on chro-mosome 6q in squamous cell carcinomas of the oral cavity.Head Neck 26:345–352
Utada Y, Haga S, Kajiwara T, Kasumi F, Sakamoto G, Nak-amura Y, Emi M (2000) Mapping of target regions of allelicloss in primary breast cancers to 1-cM intervals on genomiccontigs at 6q21 and 6q25.3. Jpn J Cancer Res 91:293–300
Verhagen PCMS, Hermans KGL, Brok MO, van WeerdenWM, Tilanus MGJ, de Weger RA, Boon TA, Trapman J(2002) Deletion of chromosomal region 6q14–16 in prostatecancer. Int J Cancer 102:142–147
Vieland VJ, Logue M (2002) HLODs, trait models and ascer-tainment: implications of admixture for parameter estima-tion and linkage detection. Hum Hered 53:23–35
Virmani AK, Fong KM, Kodagoda D, McIntire D, Hung J,Tonk V, Minna JD, Gazdar AF (1998) Allelotyping dem-onstrates common and distinct patterns of chromosomal lossin human lung cancer types. Genes Chromosomes Cancer21:308–319
Weeks DE, Ott J, Lathrop GM (1990) SLINK: a general sim-ulation program for linkage analysis. Am J Hum Genet 47:A204
Welch HG, Schwartz M, Woloshin S (2000) Are increasing 5-year survival rates evidence of success against cancer? JAMA283:2975–2978
Whittemore AS, Halpern J (2001) Problems in the definition,interpretation, and evaluation of genetic heterogeneity. AmJ Hum Genet 68:457–465
Williams JT, Van Eerdewegh P, Almasy L, Blangero J (1999)Joint multipoint linkage analysis of multivariate qualitativeand quantitative traits. I. Likelihood formulation and sim-ulation results. Am J Hum Genet 65:1134–1147
Wright DK, Manos MM (1990) PCR protocols. In: Innis MA,Gelfard DH, Sninsky JJ, White TJ (eds) Sample preparationfrom paraffin-embedded tissues. Academic Press, San Diego,pp 153–158
Yang P, Schwartz AG, McAllister AE, Swanson GM, AstonCE (1999) Lung cancer risk in families of nonsmoking pro-

474 Am. J. Hum. Genet. 75:460–474, 2004
bands: heterogeneity by age at diagnosis. Genet Epidemiol17:253–273
Zeller C, Hinzmann B, Seitz S, Prokoph H, Burkhard-GoettgesE, Fisher J, Jandrig B, Schwarz L-E, Rosenthal A, ScherneckS (2003) SASH1: a candidate tumor suppressor gene onchromosome 6q24.3 is downregulated in breast cancer. On-
cogene 22:2972–2983Zhang Y, Matthlessen P, Harder S, Siebert R, Castoldi G, Ca-
lasanz J, Wong KF, Rosenwald A, Ott G, Atkin NB, Schle-gelberger B (2000) A 3-cM commonly deleted region in 6q21in leukemias and lymphomas delineated by florescence insitu hybridization. Genes Chromosomes Cancer 27:52–58
Related Documents