electronics Article A Loose-Coupled Fusion of Inertial and UWB Assisted by a Decision-Making Algorithm for Localization of Emergency Responders André G. Ferreira 1, * , Duarte Fernandes 1 , André P. Catarino 2 , Ana M. Rocha 2 and João L. Monteiro 1 1 Algoritmi Center, University of Minho, 4800-058 Guimarães, Portugal; [email protected] (D.F.); [email protected] (J.L.M.) 2 Center of Textile Science and Technology, University of Minho, 4800-058 Guimarães, Portugal; [email protected] (A.P.C.); [email protected] (A.M.R.) * Correspondence: [email protected]; Tel.: +351-915-478-637 Received: 1 November 2019; Accepted: 29 November 2019; Published: 2 December 2019 Abstract: Combining different technologies is gaining significant popularity among researchers and industry for the development of indoor positioning systems (IPSs). These hybrid IPSs emerge as a robust solution for indoor localization as the drawbacks of each technology can be mitigated or even eliminated by using complementary technologies. However, fusing position estimates from different technologies is still very challenging and, therefore, a hot research topic. In this work, we pose fusing the ultrawideband (UWB) position estimates with the estimates provided by a pedestrian dead reckoning (PDR) by using a Kalman filter. To improve the IPS accuracy, a decision-making algorithm was developed that aims to assess the usability of UWB measurements based on the identification of non-line-of-sight (NLOS) conditions. Three different data fusion algorithms are tested, based on three different time-of-arrival positioning algorithms, and experimental results show a localization accuracy of below 1.5 m for a 99th percentile. Keywords: data fusion; emergency responders; indoor positioning system (IPS); loose-coupled position fusion; UWB; unstructured environments 1. Introduction Indoor localization is a fast-growing field of research that is attracting both academia and industry worldwide. With the recent advances in this field, new application areas demanding high accurate indoor positioning systems (IPSs) are emerging. Examples of such applications are positioning of employees in industrial environments and emergency responders’ operations, 3D motion detection, patient monitoring, and logistics. Among these, emergency responders’ positioning is regarded as one of the most difficult and challenging application scenarios. The surrounding environment is harsh, highly dynamic, covers vast operative areas, and is unstructured [1–7]. Traditionally, two leading technologies are used for indoor localization, radio transceivers (e.g., Wi-Fi, Bluetooth, ultrawideband—UWB) and inertial measurement units (IMUs). However, both technologies have some limitations that severely impact the IPS performance. On the one hand, the low availability and stability (i.e., received signal strength—RSS—fluctuation and the non-line-of-sight—NLOS—impact on time-of-arrival—ToA—methods) of radio frequency (RF) signals in indoor environments are the main limitations of the radio signal-based IPSs. On the other hand, the intrinsic drift associated with the sensors that make up an IMU degrades the accuracy of the position estimate over time. To overcome these limitations, several researchers proposed IPSs that Electronics 2019, 8, 1463; doi:10.3390/electronics8121463 www.mdpi.com/journal/electronics

Welcome message from author
This document is posted to help you gain knowledge. Please leave a comment to let me know what you think about it! Share it to your friends and learn new things together.
Transcript
electronics
Article
A Loose-Coupled Fusion of Inertial and UWBAssisted by a Decision-Making Algorithm forLocalization of Emergency Responders
André G. Ferreira 1,* , Duarte Fernandes 1 , André P. Catarino 2 , Ana M. Rocha 2 andJoão L. Monteiro 1
1 Algoritmi Center, University of Minho, 4800-058 Guimarães, Portugal; [email protected] (D.F.);[email protected] (J.L.M.)
2 Center of Textile Science and Technology, University of Minho, 4800-058 Guimarães, Portugal;[email protected] (A.P.C.); [email protected] (A.M.R.)
* Correspondence: [email protected]; Tel.: +351-915-478-637
Received: 1 November 2019; Accepted: 29 November 2019; Published: 2 December 2019 �����������������
Abstract: Combining different technologies is gaining significant popularity among researchers andindustry for the development of indoor positioning systems (IPSs). These hybrid IPSs emerge as arobust solution for indoor localization as the drawbacks of each technology can be mitigated or eveneliminated by using complementary technologies. However, fusing position estimates from differenttechnologies is still very challenging and, therefore, a hot research topic. In this work, we posefusing the ultrawideband (UWB) position estimates with the estimates provided by a pedestrian deadreckoning (PDR) by using a Kalman filter. To improve the IPS accuracy, a decision-making algorithmwas developed that aims to assess the usability of UWB measurements based on the identificationof non-line-of-sight (NLOS) conditions. Three different data fusion algorithms are tested, based onthree different time-of-arrival positioning algorithms, and experimental results show a localizationaccuracy of below 1.5 m for a 99th percentile.
Keywords: data fusion; emergency responders; indoor positioning system (IPS); loose-coupledposition fusion; UWB; unstructured environments
1. Introduction
Indoor localization is a fast-growing field of research that is attracting both academia and industryworldwide. With the recent advances in this field, new application areas demanding high accurateindoor positioning systems (IPSs) are emerging. Examples of such applications are positioning ofemployees in industrial environments and emergency responders’ operations, 3D motion detection,patient monitoring, and logistics. Among these, emergency responders’ positioning is regarded as oneof the most difficult and challenging application scenarios. The surrounding environment is harsh,highly dynamic, covers vast operative areas, and is unstructured [1–7].
Traditionally, two leading technologies are used for indoor localization, radio transceivers(e.g., Wi-Fi, Bluetooth, ultrawideband—UWB) and inertial measurement units (IMUs). However,both technologies have some limitations that severely impact the IPS performance. On the onehand, the low availability and stability (i.e., received signal strength—RSS—fluctuation and thenon-line-of-sight—NLOS—impact on time-of-arrival—ToA—methods) of radio frequency (RF) signalsin indoor environments are the main limitations of the radio signal-based IPSs. On the other hand,the intrinsic drift associated with the sensors that make up an IMU degrades the accuracy of theposition estimate over time. To overcome these limitations, several researchers proposed IPSs that
Electronics 2019, 8, 1463; doi:10.3390/electronics8121463 www.mdpi.com/journal/electronics
Electronics 2019, 8, 1463 2 of 21
combine both approaches in a single solution. In a hybrid IPS, the two subsystems (radio signal- andIMU-based) calculate the first responder’s position independently, and then a data fusion algorithmfuses both position data to provide a single position estimate. Data fusion has proven to be an essentialtool to enhance the performance of localization systems in both indoor and outdoor scenarios. With theright combination of positioning technologies, data fusion approaches revealed to be effective inproviding both short- and long-term position accuracy. This is an essential criterion for the emergencyresponders as their missions cover vast operational areas and for long periods [1].
In the literature, it is common to find different data fusion algorithms to fuse position estimatescomputed by IMU- and radio-based technologies. The data fusion on localization starts with the fusionof GPS and inertial sensors. The works in [8,9] rely on a Kalman filter (KF) to fuse the data obtainedfrom a GPS receiver and inertial sensors. Since GPS signals are not available in indoor environments,other radio-based technologies have been used to perform data fusion. Deng et al. proposed anextended Kalman filter (EKF) to fuse Wi-Fi RSS with the smartphone inertial sensors [10]. In the workof Masiero et al., the Wi-Fi RSS is also fused with the smartphone inertial sensors, but they rely on aparticle filter for the data fusion [11]. The geometrical information of the building is also used in thedata fusion process. In the work of Waqar et al., a Bayes filter is used to fuse the motion informationacquired from a smartphone and the Wi-Fi fingerprinting [12]. Fischer et al. proposed an EKF to fusethe position estimates from a PDR system and ultrasonic beacons [13]. An EKF is also used in theworks [14,15] to fuse inertial data with UWB measurements. Yang et al. proposed an EKF to fuse thesmartphone inertial sensors with the data of an acoustic localization system [16]. A finite impulseresponse (FIR) filter is proposed by Zhao et al. to fuse inertial and UWB measurements [17].
From the above works on data fusion for localization, the KF stands out as the most usedmethod by researchers on the field. The popularity of the KF relies on the fact that it requires lowcomputational resources, provides real-time localization and accurate position estimation. For thesereasons, in this work, a KF is used to combine the position information obtained from the UWBand PDR systems. Like the approach in [16], data fusion is performed in two stages. In the firststage, the UWB measurements are analyzed to determine the usability of the UWB position estimate.The usability of the UWB measurements is assessed based on the NLOS identification that relies onchannel impulse response (CIR) parameters, and the identification is performed based on a randomforest model. In the second stage, the position estimates of both systems are fused using a KF. The maincontributions of this work are the following:
• Development and integration of a hybrid IPS into a fully-functional personal protective equipment(PPE) that besides the position estimation is capable of monitoring physiological and environmentalparameter and provides bi-directional communication between the emergency responder and theincident commander;
• A loose-coupled IMU/UWB position fusion based on a KF with different ToA-based positioningalgorithms, which can compensate the ToA NLOS effect and IMU error accumulation problem;
• Assess the performance of the data fusion algorithm by using three different ToA-based positioningalgorithms for the UWB position estimate;
• Development of a decision-making algorithm to assess the usability of the UWB data for the datafusion process.
The paper is organized as follows. Section 2 presents the proposed framework. This includes thearchitecture of the PROTACTICAL cyber–physical system (CPS), the pedestrian dead reckoning (PDR)method, the UWB positioning algorithms, the decision-making algorithm used to assess the usabilityof UWB position data, and the algorithm developed to fuse both position data. The experimentalanalysis and related discussion are reported in Section 3. Finally, Section 4 concludes the paper.
Electronics 2019, 8, 1463 3 of 21
2. The PROTACTICAL Positioning Framework
In this section, the different components that make up the IPS of the PROTACTICAL CPS aredescribed. Firstly, an overview of the PROTACTICAL CPS is provided, followed by a brief description ofall system components. Then, the different subsystems of the hybrid IPS designed for the PROTACTICALCPS are introduced, namely: the pedestrian dead reckoning (PDR), the UWB positioning, the algorithmfor the usability analysis of the UWB data, and the algorithm that fuses both positioning estimates.
2.1. The PROTACTICAL Cyber–Physical System
The PROTACTICAL CPS is a smart personal protective equipment that was designed to enhancefirefighters’ occupational health, safety, situational awareness, and comfort. It is capable of monitoringphysiological and environmental parameters, locating and tracking firefighters, and detecting,in real-time, life-threating scenarios [18–21].
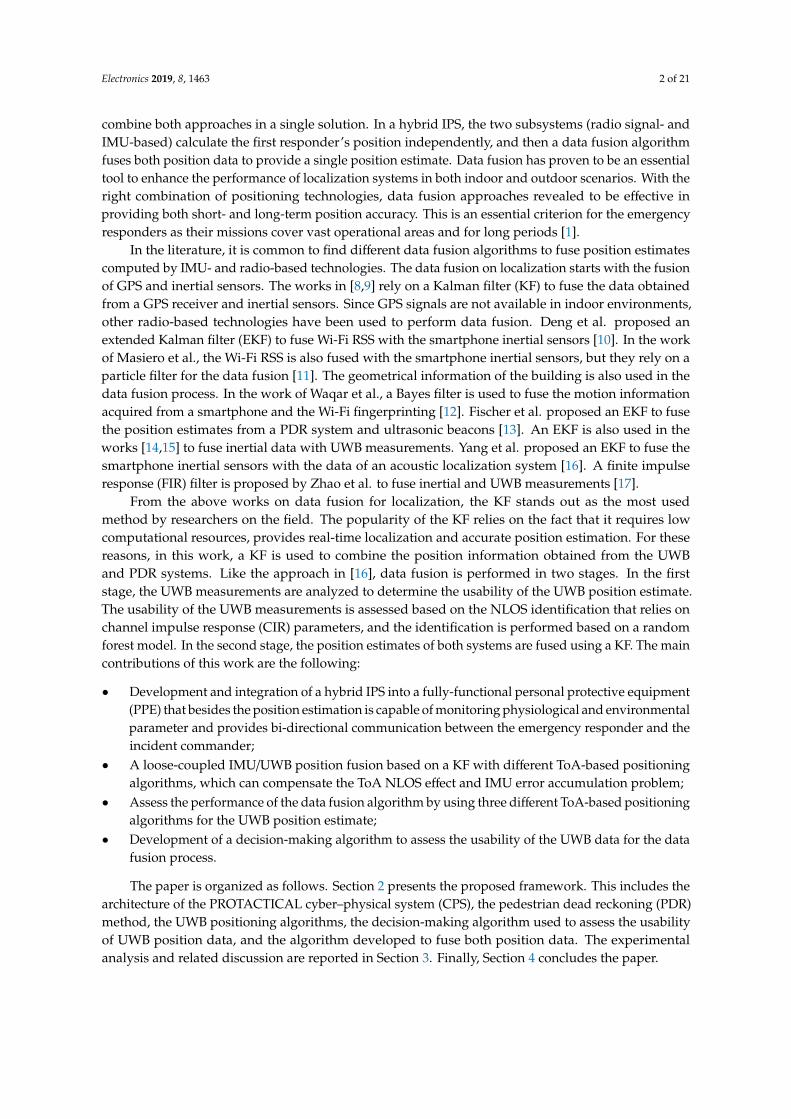
The PROTACTICAL CPS is based on a three-tier architecture (Figure 1). Tier one consists ofa wireless body sensor network (WBSN)—WBSN-PROTACTICAL—that comprises several nodes:PROTACTICAL, designed to locate the firefighter and monitor physiological and environmentalparameters, and a network coordinator (Gateway-PROTACTICAL). The WBSN-PROTACTICAL isbased on ZigBee technology. The complete list of nodes that compose the WBSN-PROTACTICAL,as well as the corresponding monitored parameters is shown in Table 1.
Electronics 2019, 8, x FOR PEER REVIEW 3 of 21
In this section, the different components that make up the IPS of the PROTACTICAL CPS are described. Firstly, an overview of the PROTACTICAL CPS is provided, followed by a brief description of all system components. Then, the different subsystems of the hybrid IPS designed for the PROTACTICAL CPS are introduced, namely: the pedestrian dead reckoning (PDR), the UWB positioning, the algorithm for the usability analysis of the UWB data, and the algorithm that fuses both positioning estimates.
2.1. The PROTACTICAL Cyber–Physical System
The PROTACTICAL CPS is a smart personal protective equipment that was designed to enhance firefighters’ occupational health, safety, situational awareness, and comfort. It is capable of monitoring physiological and environmental parameters, locating and tracking firefighters, and detecting, in real-time, life-threating scenarios [18–21].
The PROTACTICAL CPS is based on a three-tier architecture (Figure 1). Tier one consists of a wireless body sensor network (WBSN)—WBSN-PROTACTICAL—that comprises several nodes: PROTACTICAL, designed to locate the firefighter and monitor physiological and environmental parameters, and a network coordinator (Gateway-PROTACTICAL). The WBSN-PROTACTICAL is based on ZigBee technology. The complete list of nodes that compose the WBSN-PROTACTICAL, as well as the corresponding monitored parameters is shown in Table 1.
Figure 1. PROTACTICAL cyber–physical system’s Architecture.
Tier two is the CPS network—ad hoc-PROTACTICAL—and is responsible for the bidirectional communication between the emergency responders and the incident commander. The CPS network is based on an ad-hoc routing principle, and the coverage of this network is expanded through the use of forward-PROTACTICAL as the emergency responders enter a building. This network is based on Wi-Fi technology.
Table 1. Nodes and monitored parameters within the wireless body sensor network (WBSN)-PROTACTICAL.
Node Garment Monitored Parameters 1 Shirt Heart rate 2 Shirt Sweat detection and inner temperature (back) 3 Shirt Breathing rate 4 Coat Heat flux across the coat, inner temperature (front), and inactivity/fall detection 5 Coat CO, CO2, environmental temperature, and relativity humidity 6 Boot inactivity and relative position 7 Coat inactivity, panic event, and user feedback
Gateway Coat absolute position (GPS), indoor location (UWB+PDR), environmental temperature
Figure 1. PROTACTICAL cyber–physical system’s Architecture.
Table 1. Nodes and monitored parameters within the wireless body sensor network(WBSN)-PROTACTICAL.
Node Garment Monitored Parameters
1 Shirt Heart rate2 Shirt Sweat detection and inner temperature (back)3 Shirt Breathing rate4 Coat Heat flux across the coat, inner temperature (front), and inactivity/fall detection5 Coat CO, CO2, environmental temperature, and relativity humidity6 Boot inactivity and relative position7 Coat inactivity, panic event, and user feedback
Gateway Coat absolute position (GPS), indoor location (UWB+PDR), environmental temperature
Tier two is the CPS network—ad hoc-PROTACTICAL—and is responsible for the bidirectionalcommunication between the emergency responders and the incident commander. The CPS network isbased on an ad-hoc routing principle, and the coverage of this network is expanded through the use
Electronics 2019, 8, 1463 4 of 21
of forward-PROTACTICAL as the emergency responders enter a building. This network is based onWi-Fi technology.
Finally, tier three is the base station PROTACTICAL, which is responsible for storing anddisplaying the acquired information, managing the network, and triggering distress messages towardsthe emergency responders if a life-threatening event is detected.
2.2. The Pedestrian Dead Reckoning Subsystem
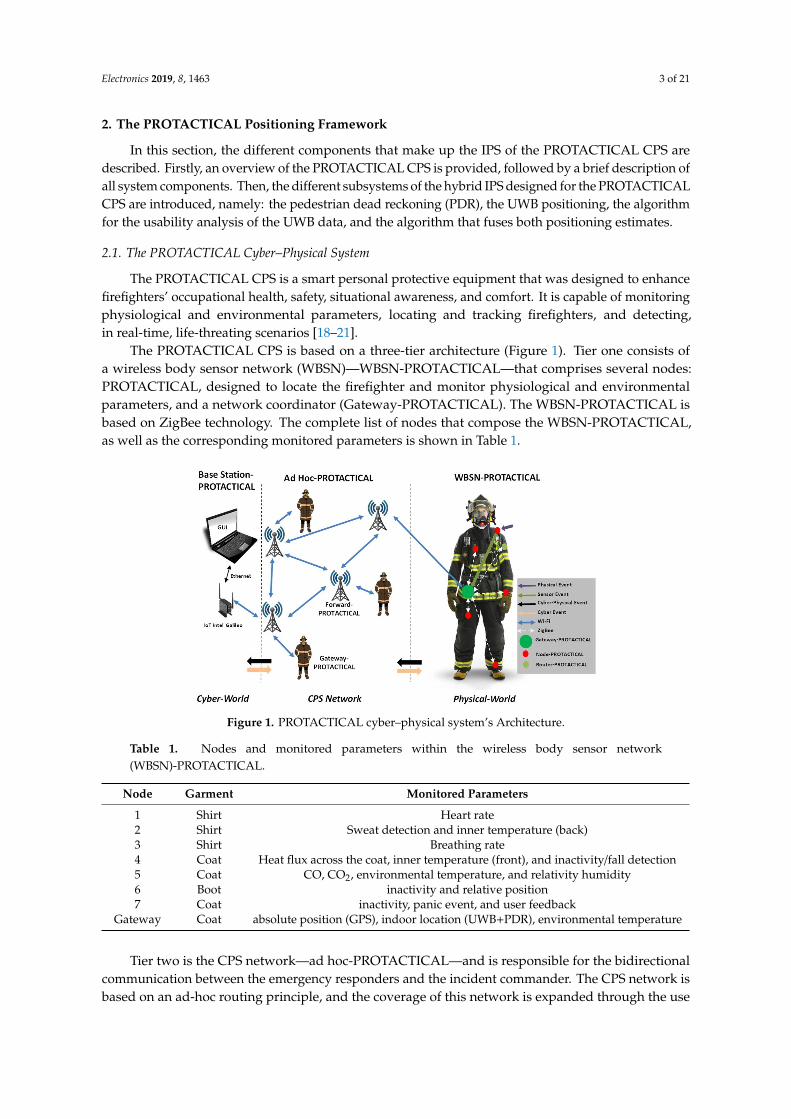
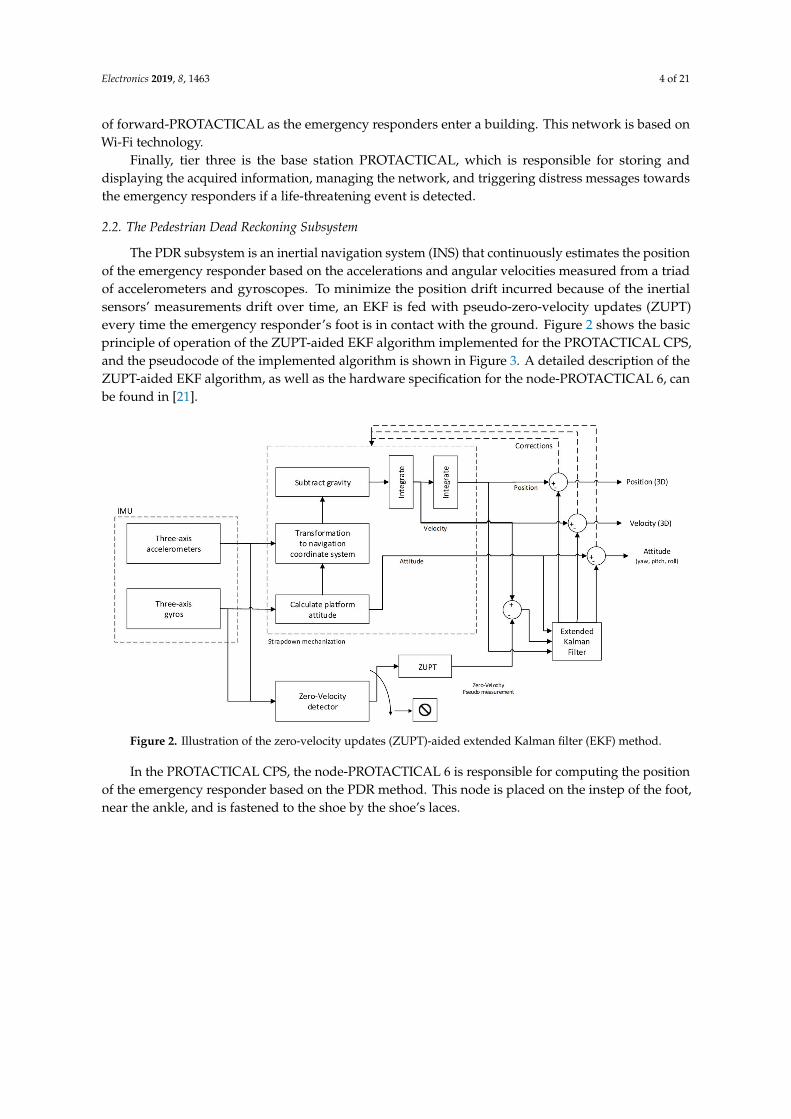
The PDR subsystem is an inertial navigation system (INS) that continuously estimates the positionof the emergency responder based on the accelerations and angular velocities measured from a triadof accelerometers and gyroscopes. To minimize the position drift incurred because of the inertialsensors’ measurements drift over time, an EKF is fed with pseudo-zero-velocity updates (ZUPT)every time the emergency responder’s foot is in contact with the ground. Figure 2 shows the basicprinciple of operation of the ZUPT-aided EKF algorithm implemented for the PROTACTICAL CPS,and the pseudocode of the implemented algorithm is shown in Figure 3. A detailed description of theZUPT-aided EKF algorithm, as well as the hardware specification for the node-PROTACTICAL 6, canbe found in [21].
Electronics 2019, 8, x FOR PEER REVIEW 4 of 21
Finally, tier three is the base station PROTACTICAL, which is responsible for storing and displaying the acquired information, managing the network, and triggering distress messages towards the emergency responders if a life-threatening event is detected.
2.2. The Pedestrian Dead Reckoning Subsystem
The PDR subsystem is an inertial navigation system (INS) that continuously estimates the position of the emergency responder based on the accelerations and angular velocities measured from a triad of accelerometers and gyroscopes. To minimize the position drift incurred because of the inertial sensors’ measurements drift over time, an EKF is fed with pseudo-zero-velocity updates (ZUPT) every time the emergency responder’s foot is in contact with the ground. Figure 2 shows the basic principle of operation of the ZUPT-aided EKF algorithm implemented for the PROTACTICAL CPS, and the pseudocode of the implemented algorithm is shown in Figure 3. A detailed description of the ZUPT-aided EKF algorithm, as well as the hardware specification for the node-PROTACTICAL 6, can be found in [21].
Figure 2. Illustration of the zero-velocity updates (ZUPT)-aided extended Kalman filter (EKF) method.
In the PROTACTICAL CPS, the node-PROTACTICAL 6 is responsible for computing the position of the emergency responder based on the PDR method. This node is placed on the instep of the foot, near the ankle, and is fastened to the shoe by the shoe’s laces.
Figure 2. Illustration of the zero-velocity updates (ZUPT)-aided extended Kalman filter (EKF) method.
In the PROTACTICAL CPS, the node-PROTACTICAL 6 is responsible for computing the positionof the emergency responder based on the PDR method. This node is placed on the instep of the foot,near the ankle, and is fastened to the shoe by the shoe’s laces.
Electronics 2019, 8, 1463 5 of 21
Electronics 2019, 8, x FOR PEER REVIEW 5 of 21
Figure 3. Pseudocode for the ZUPT-aided EKF algorithm implemented for the pedestrian dead reckoning PDR subsystem.
2.3. UWB Positioning Subsystem
The DW1000 chip developed by DecaWave (Dublin, Ireland) is a UWB transceiver compliant with the IEEE802.15.4-2011 standard that revolutionized the UWB market as they provide very accurate ranging measurements at low transceiver cost (approx. €25 per unit) [22]. These UWB transceivers perform ranging measurements based on the two-way ranging (TWR) technique, which is a variant of the time-of-arrival technique. In the proposed system, the tag node is responsible for starting the ranging procedure and the anchor for computing the respective distance. The DW1000 UWB transceivers are configured to operate on channel four (500-MHz bandwidth with a center frequency of 3993.6 MHz), preamble length of 1024, and a data rate of 110 kb/s.
Based on the ranging measurements provided by the DW1000 UWB transceiver, the position of the emergency responder is calculated by three ToA-based positioning algorithms, namely: the analytical method, the nonlinear least-squares method based on a first-order Taylor expansion (for abbreviation we will refer to this algorithm as “Taylor series”), and the EKF. These algorithms were selected as they have different complexity and are designed to address different issues on localization. The analytical method is the simplest localization method with less computational requirements. However, the number of possible ranging measurement combinations has to be known
Figure 3. Pseudocode for the ZUPT-aided EKF algorithm implemented for the pedestrian deadreckoning PDR subsystem.
2.3. UWB Positioning Subsystem
The DW1000 chip developed by DecaWave (Dublin, Ireland) is a UWB transceiver compliant withthe IEEE802.15.4-2011 standard that revolutionized the UWB market as they provide very accurateranging measurements at low transceiver cost (approx. €25 per unit) [22]. These UWB transceiversperform ranging measurements based on the two-way ranging (TWR) technique, which is a variantof the time-of-arrival technique. In the proposed system, the tag node is responsible for startingthe ranging procedure and the anchor for computing the respective distance. The DW1000 UWBtransceivers are configured to operate on channel four (500-MHz bandwidth with a center frequencyof 3993.6 MHz), preamble length of 1024, and a data rate of 110 kb/s.
Based on the ranging measurements provided by the DW1000 UWB transceiver, the position of theemergency responder is calculated by three ToA-based positioning algorithms, namely: the analyticalmethod, the nonlinear least-squares method based on a first-order Taylor expansion (for abbreviation wewill refer to this algorithm as “Taylor series”), and the EKF. These algorithms were selected as they havedifferent complexity and are designed to address different issues on localization. The analytical method
Electronics 2019, 8, 1463 6 of 21
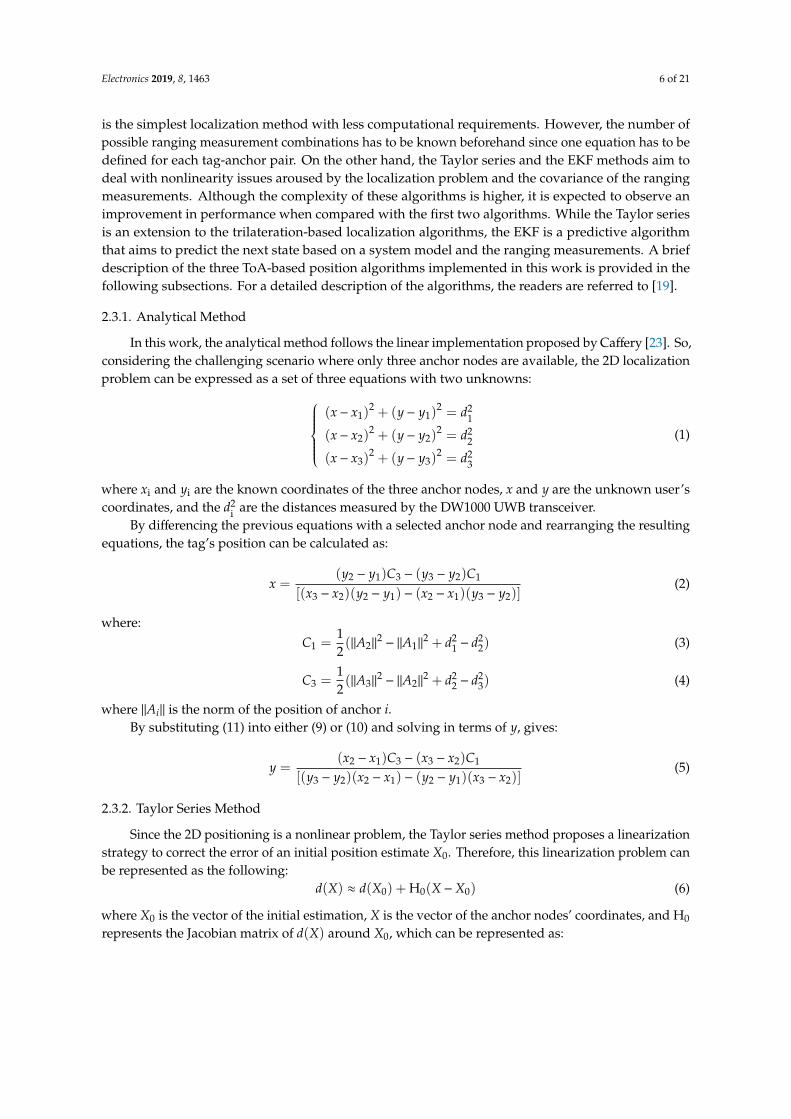
is the simplest localization method with less computational requirements. However, the number ofpossible ranging measurement combinations has to be known beforehand since one equation has to bedefined for each tag-anchor pair. On the other hand, the Taylor series and the EKF methods aim todeal with nonlinearity issues aroused by the localization problem and the covariance of the rangingmeasurements. Although the complexity of these algorithms is higher, it is expected to observe animprovement in performance when compared with the first two algorithms. While the Taylor seriesis an extension to the trilateration-based localization algorithms, the EKF is a predictive algorithmthat aims to predict the next state based on a system model and the ranging measurements. A briefdescription of the three ToA-based position algorithms implemented in this work is provided in thefollowing subsections. For a detailed description of the algorithms, the readers are referred to [19].
2.3.1. Analytical Method
In this work, the analytical method follows the linear implementation proposed by Caffery [23]. So,considering the challenging scenario where only three anchor nodes are available, the 2D localizationproblem can be expressed as a set of three equations with two unknowns:
(x− x1)2 + (y− y1)
2 = d21
(x− x2)2 + (y− y2)
2 = d22
(x− x3)2 + (y− y3)
2 = d23
(1)
where xi and yi are the known coordinates of the three anchor nodes, x and y are the unknown user’scoordinates, and the d2
i are the distances measured by the DW1000 UWB transceiver.By differencing the previous equations with a selected anchor node and rearranging the resulting
equations, the tag’s position can be calculated as:
x =(y2 − y1)C3 − (y3 − y2)C1
[(x3 − x2)(y2 − y1) − (x2 − x1)(y3 − y2)](2)
where:C1 =
12(‖A2‖
2− ‖A1‖
2 + d21 − d2
2) (3)
C3 =12(‖A3‖
2− ‖A2‖
2 + d22 − d2
3) (4)
where ‖Ai‖ is the norm of the position of anchor i.By substituting (11) into either (9) or (10) and solving in terms of y, gives:
y =(x2 − x1)C3 − (x3 − x2)C1
[(y3 − y2)(x2 − x1) − (y2 − y1)(x3 − x2)](5)
2.3.2. Taylor Series Method
Since the 2D positioning is a nonlinear problem, the Taylor series method proposes a linearizationstrategy to correct the error of an initial position estimate X0. Therefore, this linearization problem canbe represented as the following:
d(X) ≈ d(X0) + H0(X −X0) (6)
where X0 is the vector of the initial estimation, X is the vector of the anchor nodes’ coordinates, and H0
represents the Jacobian matrix of d(X) around X0, which can be represented as:
Electronics 2019, 8, 1463 7 of 21
H0 =
∂d1∂x
∂d1∂y
∂d2∂x
∂d2∂y
. . .∂dn∂x
∂dn∂y
X=X0
=
x0 − x1r1
y0 − y1r1
x0 − x2r2
y0 − y2r2
. . .x0 − xn
rn
y0 − ynrn
(7)
where ri =
√(x0 − xi)
2 + (y0 − yi)2.
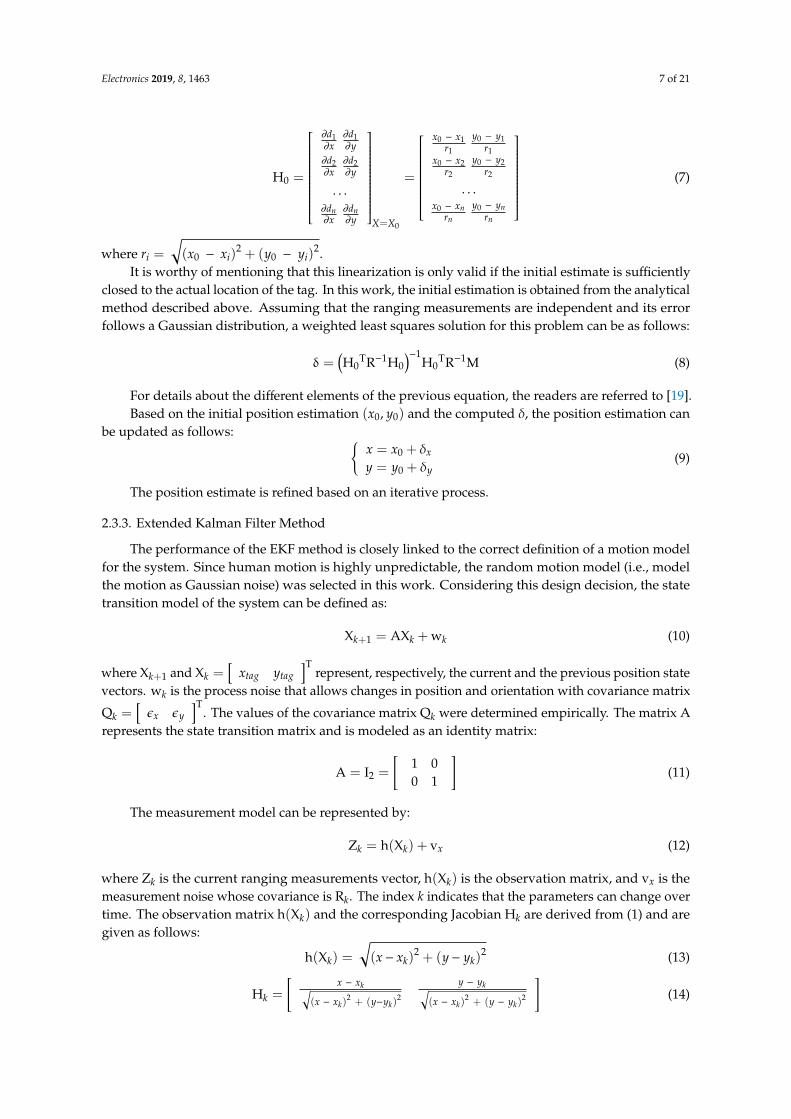
It is worthy of mentioning that this linearization is only valid if the initial estimate is sufficientlyclosed to the actual location of the tag. In this work, the initial estimation is obtained from the analyticalmethod described above. Assuming that the ranging measurements are independent and its errorfollows a Gaussian distribution, a weighted least squares solution for this problem can be as follows:
δ =(H0
TR−1H0)−1
H0TR−1M (8)
For details about the different elements of the previous equation, the readers are referred to [19].Based on the initial position estimation (x0, y0) and the computed δ, the position estimation can
be updated as follows: {x = x0 + δx
y = y0 + δy(9)
The position estimate is refined based on an iterative process.
2.3.3. Extended Kalman Filter Method
The performance of the EKF method is closely linked to the correct definition of a motion modelfor the system. Since human motion is highly unpredictable, the random motion model (i.e., modelthe motion as Gaussian noise) was selected in this work. Considering this design decision, the statetransition model of the system can be defined as:
Xk+1 = AXk + wk (10)
where Xk+1 and Xk =[
xtag ytag]T
represent, respectively, the current and the previous position statevectors. wk is the process noise that allows changes in position and orientation with covariance matrix
Qk =[εx εy
]T. The values of the covariance matrix Qk were determined empirically. The matrix A
represents the state transition matrix and is modeled as an identity matrix:
A = I2 =
[1 00 1
](11)
The measurement model can be represented by:
Zk = h(Xk) + vx (12)
where Zk is the current ranging measurements vector, h(Xk) is the observation matrix, and vx is themeasurement noise whose covariance is Rk. The index k indicates that the parameters can change overtime. The observation matrix h(Xk) and the corresponding Jacobian Hk are derived from (1) and aregiven as follows:
h(Xk) =
√(x− xk)
2 + (y− yk)2 (13)
Hk =
[x − xk√
(x − xk)2 + (y−yk)
2
y − yk√(x − xk)
2 + (y − yk)2
](14)
Electronics 2019, 8, 1463 8 of 21
Based on the models described above, the EKF estimates the tag position based on two differentstages: prediction and update. These two stages are described in detail on [19].
2.4. Usability Analysis of UWB Position Data
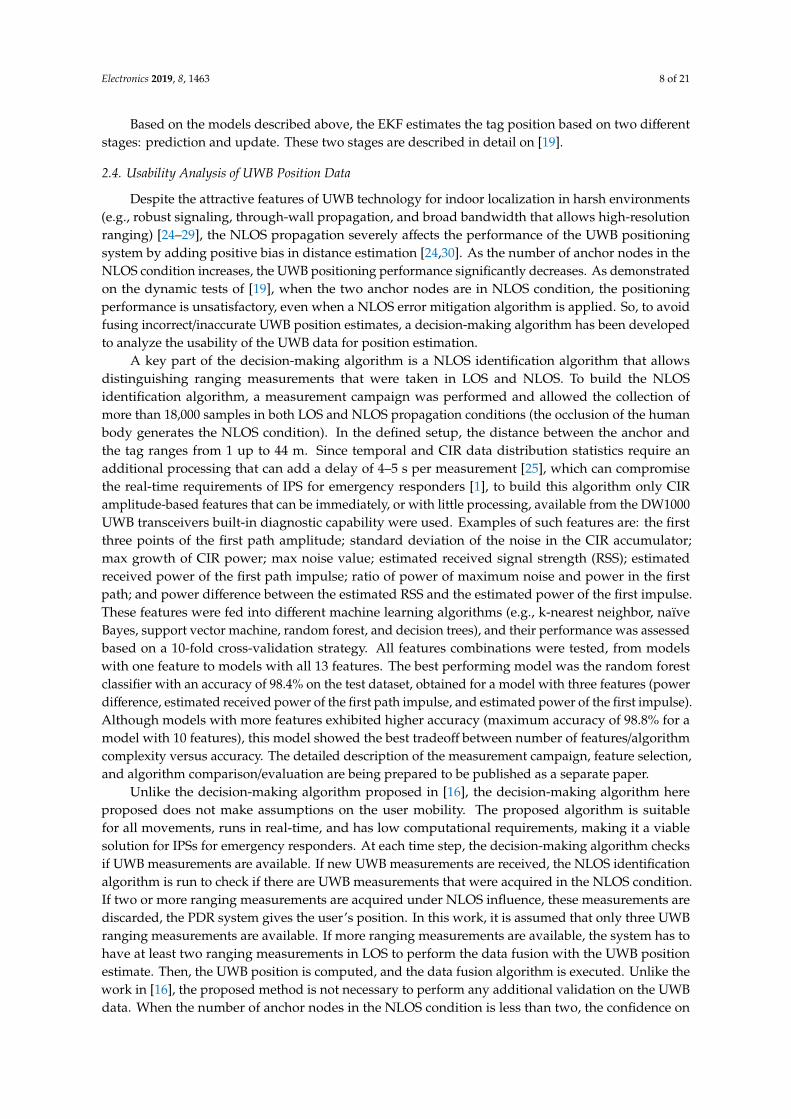
Despite the attractive features of UWB technology for indoor localization in harsh environments(e.g., robust signaling, through-wall propagation, and broad bandwidth that allows high-resolutionranging) [24–29], the NLOS propagation severely affects the performance of the UWB positioningsystem by adding positive bias in distance estimation [24,30]. As the number of anchor nodes in theNLOS condition increases, the UWB positioning performance significantly decreases. As demonstratedon the dynamic tests of [19], when the two anchor nodes are in NLOS condition, the positioningperformance is unsatisfactory, even when a NLOS error mitigation algorithm is applied. So, to avoidfusing incorrect/inaccurate UWB position estimates, a decision-making algorithm has been developedto analyze the usability of the UWB data for position estimation.
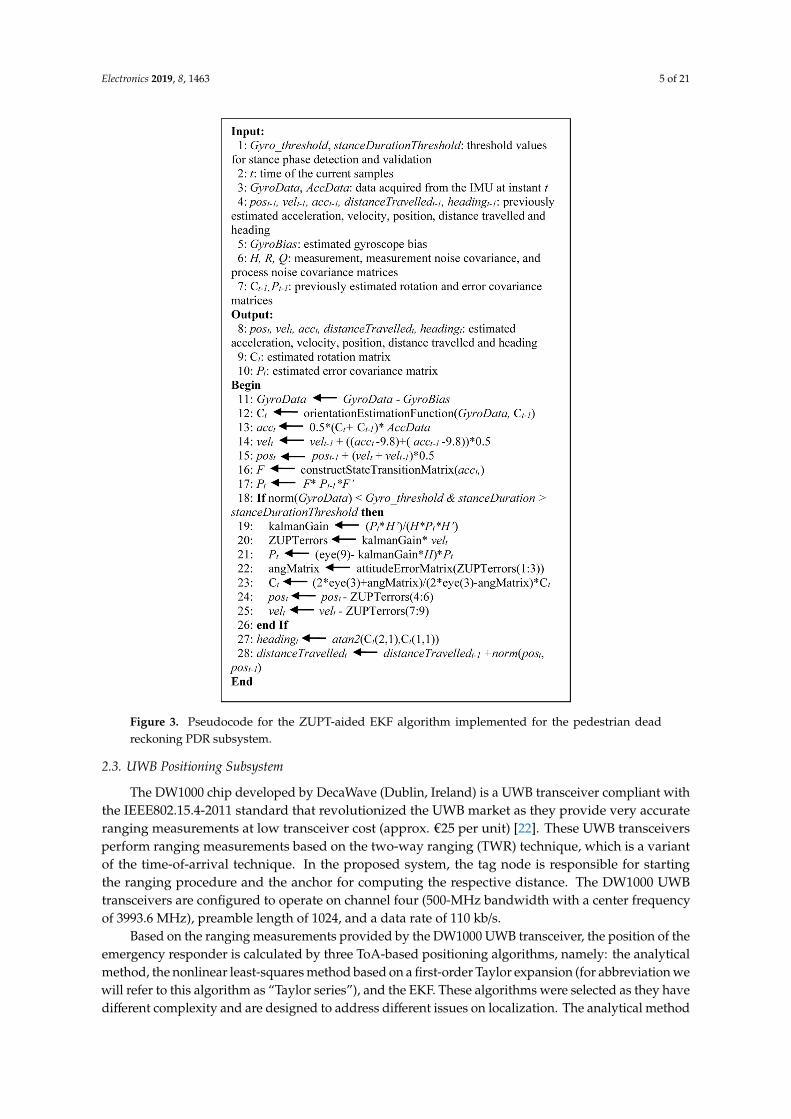
A key part of the decision-making algorithm is a NLOS identification algorithm that allowsdistinguishing ranging measurements that were taken in LOS and NLOS. To build the NLOSidentification algorithm, a measurement campaign was performed and allowed the collection ofmore than 18,000 samples in both LOS and NLOS propagation conditions (the occlusion of the humanbody generates the NLOS condition). In the defined setup, the distance between the anchor andthe tag ranges from 1 up to 44 m. Since temporal and CIR data distribution statistics require anadditional processing that can add a delay of 4–5 s per measurement [25], which can compromisethe real-time requirements of IPS for emergency responders [1], to build this algorithm only CIRamplitude-based features that can be immediately, or with little processing, available from the DW1000UWB transceivers built-in diagnostic capability were used. Examples of such features are: the firstthree points of the first path amplitude; standard deviation of the noise in the CIR accumulator;max growth of CIR power; max noise value; estimated received signal strength (RSS); estimatedreceived power of the first path impulse; ratio of power of maximum noise and power in the firstpath; and power difference between the estimated RSS and the estimated power of the first impulse.These features were fed into different machine learning algorithms (e.g., k-nearest neighbor, naïveBayes, support vector machine, random forest, and decision trees), and their performance was assessedbased on a 10-fold cross-validation strategy. All features combinations were tested, from modelswith one feature to models with all 13 features. The best performing model was the random forestclassifier with an accuracy of 98.4% on the test dataset, obtained for a model with three features (powerdifference, estimated received power of the first path impulse, and estimated power of the first impulse).Although models with more features exhibited higher accuracy (maximum accuracy of 98.8% for amodel with 10 features), this model showed the best tradeoff between number of features/algorithmcomplexity versus accuracy. The detailed description of the measurement campaign, feature selection,and algorithm comparison/evaluation are being prepared to be published as a separate paper.
Unlike the decision-making algorithm proposed in [16], the decision-making algorithm hereproposed does not make assumptions on the user mobility. The proposed algorithm is suitablefor all movements, runs in real-time, and has low computational requirements, making it a viablesolution for IPSs for emergency responders. At each time step, the decision-making algorithm checksif UWB measurements are available. If new UWB measurements are received, the NLOS identificationalgorithm is run to check if there are UWB measurements that were acquired in the NLOS condition.If two or more ranging measurements are acquired under NLOS influence, these measurements arediscarded, the PDR system gives the user’s position. In this work, it is assumed that only three UWBranging measurements are available. If more ranging measurements are available, the system has tohave at least two ranging measurements in LOS to perform the data fusion with the UWB positionestimate. Then, the UWB position is computed, and the data fusion algorithm is executed. Unlike thework in [16], the proposed method is not necessary to perform any additional validation on the UWBdata. When the number of anchor nodes in the NLOS condition is less than two, the confidence on
Electronics 2019, 8, 1463 9 of 21
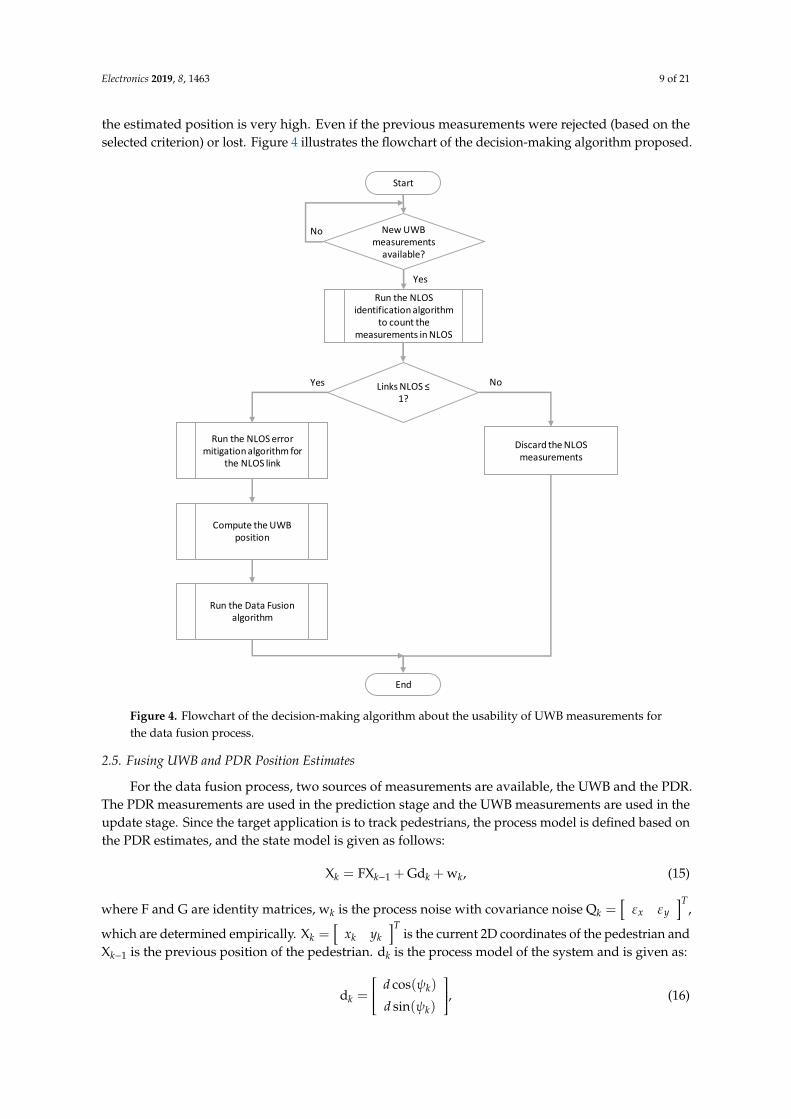
the estimated position is very high. Even if the previous measurements were rejected (based on theselected criterion) or lost. Figure 4 illustrates the flowchart of the decision-making algorithm proposed.Electronics 2019, 8, x FOR PEER REVIEW 9 of 21
Figure 4. Flowchart of the decision-making algorithm about the usability of UWB measurements for the data fusion process.
2.5. Fusing UWB and PDR Position Estimates
For the data fusion process, two sources of measurements are available, the UWB and the PDR. The PDR measurements are used in the prediction stage and the UWB measurements are used in the update stage. Since the target application is to track pedestrians, the process model is defined based on the PDR estimates, and the state model is given as follows:
X = FX + Gd + w , (15)
where F and G are identity matrices, w is the process noise with covariance noise Q = [휀 휀 ] , which are determined empirically. X = [푥 푦 ] is the current 2D coordinates of the pedestrian and X is the previous position of the pedestrian. d is the process model of the system and is given as:
d = 푑 cos(휓 )푑 sin(휓 ) , (16)
where 푑 and 휓 are the step length and walking direction at the time step 푘, respectively. These estimates are obtained based on the PDR system described in section II.B.
When the UWB measurements are available, the position of the user is computed based on one of the methods proposed in Section 2.3, and the measurement model is given as:
Z = HX + v , (17)
where H is an identity matrix and v is the measurement noise with covariance matrix R =
Start
New UWB measurements
available?
No
Run the NLOS identification algorithm
to count the measurements in NLOS
Yes
Links NLOS ≤ 1?
Run the NLOS error mitigation algorithm for
the NLOS link
Compute the UWB position
Run the Data Fusion algorithm
Yes
Discard the NLOS measurements
End
No
Figure 4. Flowchart of the decision-making algorithm about the usability of UWB measurements forthe data fusion process.
2.5. Fusing UWB and PDR Position Estimates
For the data fusion process, two sources of measurements are available, the UWB and the PDR.The PDR measurements are used in the prediction stage and the UWB measurements are used in theupdate stage. Since the target application is to track pedestrians, the process model is defined based onthe PDR estimates, and the state model is given as follows:
Xk = FXk−1 + Gdk + wk, (15)
where F and G are identity matrices, wk is the process noise with covariance noise Qk =[εx εy
]T,
which are determined empirically. Xk =[
xk yk]T
is the current 2D coordinates of the pedestrian andXk−1 is the previous position of the pedestrian. dk is the process model of the system and is given as:
dk =
d cos(ψk)
d sin(ψk)
, (16)
Electronics 2019, 8, 1463 10 of 21
where d andψk are the step length and walking direction at the time step k, respectively. These estimatesare obtained based on the PDR system described in Section 2.2.
When the UWB measurements are available, the position of the user is computed based on one ofthe methods proposed in Section 2.3, and the measurement model is given as:
Zk = HXk + vk, (17)
where H is an identity matrix and vk is the measurement noise with covariance matrix Rk =[εx εy
]T.
When a stance phase is detected, the prediction equations are applied:
X−k = FXk−1 + Gdk, (18)
P−k = FPk−1FT + Q, (19)
Similarly, when the UWB estimates are available, the update equations can be applied:
Kk = P−k HT(HP−k HT + Rk
)−1, (20)
Xk = X−k + Kk(Zk −HX−k
), (21)
Pk = (I−KkH)P−k , (22)
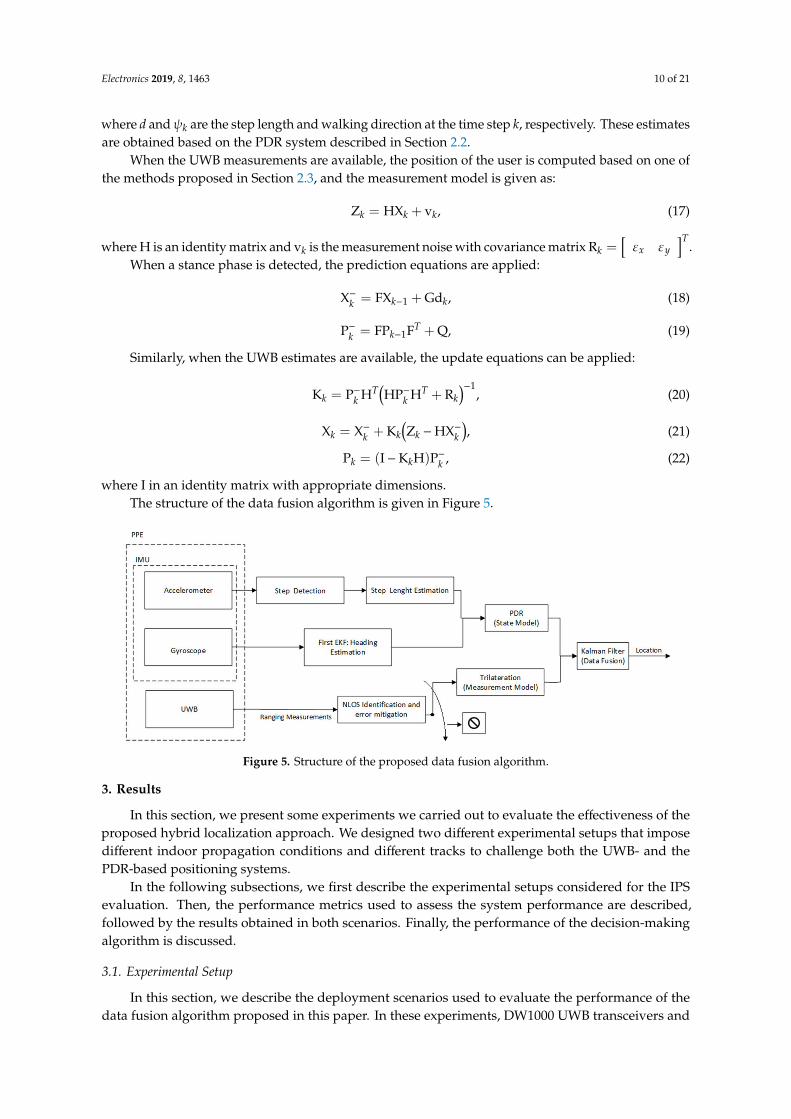
where I in an identity matrix with appropriate dimensions.The structure of the data fusion algorithm is given in Figure 5.
Electronics 2019, 8, x FOR PEER REVIEW 10 of 21
[휀 휀 ] . When a stance phase is detected, the prediction equations are applied:
X = FX + Gd , (18)
P = FP F + Q, (19)
Similarly, when the UWB estimates are available, the update equations can be applied:
K = P H (HP H + R ) , (20)
X = X + K (Z − HX ), (21)
P = (I − K H)P , (22)
where I in an identity matrix with appropriate dimensions. The structure of the data fusion algorithm is given in Figure 5.
Figure 5. Structure of the proposed data fusion algorithm.
3. Results
In this section, we present some experiments we carried out to evaluate the effectiveness of the proposed hybrid localization approach. We designed two different experimental setups that impose different indoor propagation conditions and different tracks to challenge both the UWB- and the PDR-based positioning systems.
In the following subsections, we first describe the experimental setups considered for the IPS evaluation. Then, the performance metrics used to assess the system performance are described, followed by the results obtained in both scenarios. Finally, the performance of the decision-making algorithm is discussed.
3.1. Experimental Setup
In this section, we describe the deployment scenarios used to evaluate the performance of the data fusion algorithm proposed in this paper. In these experiments, DW1000 UWB transceivers and custom made IMU [21] are used to collect, respectively, the ToA-based ranging measurements and the inertial data needed to run the UWB positioning and the ZUPT-aided EKF algorithms, which are then used by the data fusion algorithm.
For the UWB positioning subsystem, two types of nodes were considered, anchor, and tag nodes. Both nodes were identical in terms of hardware. The anchor nodes were placed on a tripod at an antenna height of 1.33 m, and their position was known. The tag was responsible for starting the ranging message with an anchor node, computing the corresponding distance between the nodes, acquiring the channel propagation parameters necessary for NLOS identification, and logging this data to a computer through a USB connection. The tag node repeated this process continuously for
Figure 5. Structure of the proposed data fusion algorithm.
3. Results
In this section, we present some experiments we carried out to evaluate the effectiveness of theproposed hybrid localization approach. We designed two different experimental setups that imposedifferent indoor propagation conditions and different tracks to challenge both the UWB- and thePDR-based positioning systems.
In the following subsections, we first describe the experimental setups considered for the IPSevaluation. Then, the performance metrics used to assess the system performance are described,followed by the results obtained in both scenarios. Finally, the performance of the decision-makingalgorithm is discussed.
3.1. Experimental Setup
In this section, we describe the deployment scenarios used to evaluate the performance of thedata fusion algorithm proposed in this paper. In these experiments, DW1000 UWB transceivers and
Electronics 2019, 8, 1463 11 of 21
custom made IMU [21] are used to collect, respectively, the ToA-based ranging measurements and theinertial data needed to run the UWB positioning and the ZUPT-aided EKF algorithms, which are thenused by the data fusion algorithm.
For the UWB positioning subsystem, two types of nodes were considered, anchor, and tag nodes.Both nodes were identical in terms of hardware. The anchor nodes were placed on a tripod at anantenna height of 1.33 m, and their position was known. The tag was responsible for starting theranging message with an anchor node, computing the corresponding distance between the nodes,acquiring the channel propagation parameters necessary for NLOS identification, and logging thisdata to a computer through a USB connection. The tag node repeated this process continuously forall anchor nodes available, starting from anchor one to anchor n, where n was the number of anchornodes available. This cycle was repeated until the user completes the predefined path.
For the PDR subsystem, the IMU raw data was collected at a frequency of 100 Hz and sent to alaptop via ZigBee for later processing. The full scale of the triaxial accelerometers and gyroscopes wasset to 16 g and 2000 ◦/s, respectively. These ranges were chosen to guarantee that the sensor output doesnot saturate during the experiments. To guarantee that the system complied with the IPS requirementsof emergency responders [1], only a minimalist calibration was performed. i.e., at the beginning ofthe experiment, the user was standing still for 30 s to calculate the gyroscope bias (by averaging thegyroscope’s outputs) and the sensor was powered on for several minutes before the data collection tohandle the temperature effect.
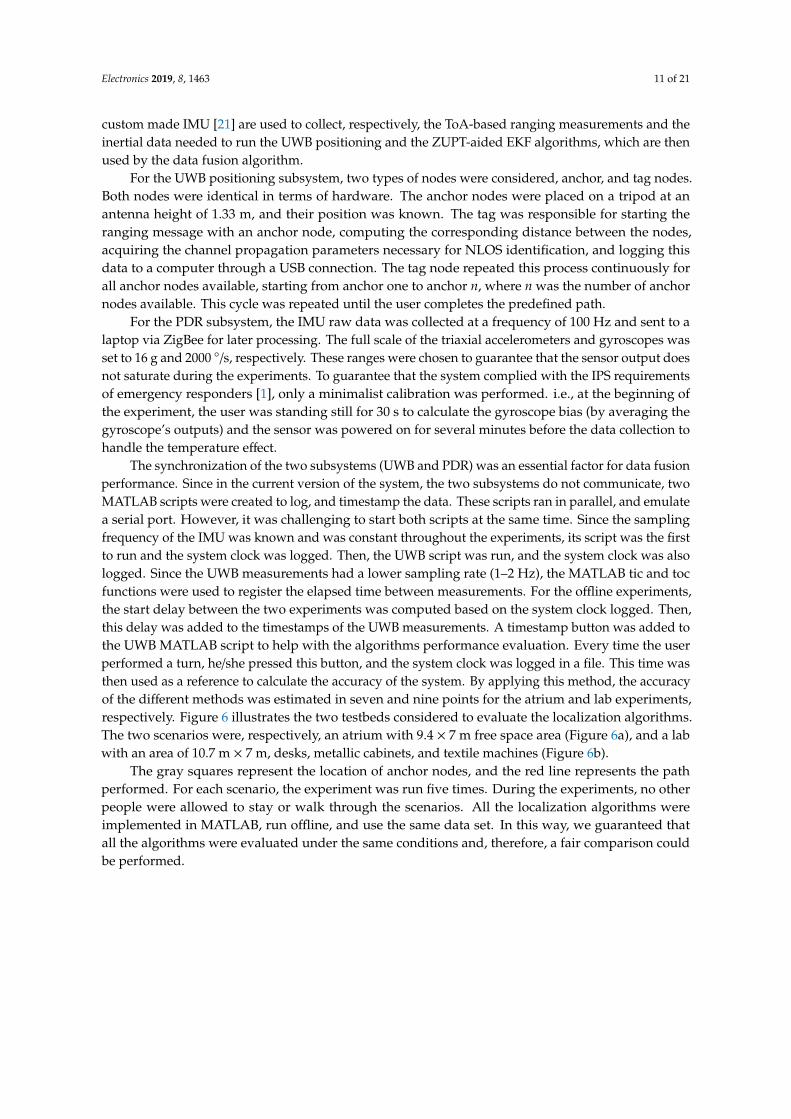
The synchronization of the two subsystems (UWB and PDR) was an essential factor for data fusionperformance. Since in the current version of the system, the two subsystems do not communicate, twoMATLAB scripts were created to log, and timestamp the data. These scripts ran in parallel, and emulatea serial port. However, it was challenging to start both scripts at the same time. Since the samplingfrequency of the IMU was known and was constant throughout the experiments, its script was the firstto run and the system clock was logged. Then, the UWB script was run, and the system clock was alsologged. Since the UWB measurements had a lower sampling rate (1–2 Hz), the MATLAB tic and tocfunctions were used to register the elapsed time between measurements. For the offline experiments,the start delay between the two experiments was computed based on the system clock logged. Then,this delay was added to the timestamps of the UWB measurements. A timestamp button was added tothe UWB MATLAB script to help with the algorithms performance evaluation. Every time the userperformed a turn, he/she pressed this button, and the system clock was logged in a file. This time wasthen used as a reference to calculate the accuracy of the system. By applying this method, the accuracyof the different methods was estimated in seven and nine points for the atrium and lab experiments,respectively. Figure 6 illustrates the two testbeds considered to evaluate the localization algorithms.The two scenarios were, respectively, an atrium with 9.4 × 7 m free space area (Figure 6a), and a labwith an area of 10.7 m × 7 m, desks, metallic cabinets, and textile machines (Figure 6b).
The gray squares represent the location of anchor nodes, and the red line represents the pathperformed. For each scenario, the experiment was run five times. During the experiments, no otherpeople were allowed to stay or walk through the scenarios. All the localization algorithms wereimplemented in MATLAB, run offline, and use the same data set. In this way, we guaranteed thatall the algorithms were evaluated under the same conditions and, therefore, a fair comparison couldbe performed.
Electronics 2019, 8, 1463 12 of 21
Electronics 2019, 8, x FOR PEER REVIEW 11 of 21
all anchor nodes available, starting from anchor one to anchor n, where n was the number of anchor nodes available. This cycle was repeated until the user completes the predefined path.
For the PDR subsystem, the IMU raw data was collected at a frequency of 100Hz and sent to a laptop via ZigBee for later processing. The full scale of the triaxial accelerometers and gyroscopes was set to 16 g and 2000 ˚/s, respectively. These ranges were chosen to guarantee that the sensor output does not saturate during the experiments. To guarantee that the system complied with the IPS requirements of emergency responders [1], only a minimalist calibration was performed. i.e., at the beginning of the experiment, the user was standing still for 30s to calculate the gyroscope bias (by averaging the gyroscope’s outputs) and the sensor was powered on for several minutes before the data collection to handle the temperature effect.
The synchronization of the two subsystems (UWB and PDR) was an essential factor for data fusion performance. Since in the current version of the system, the two subsystems do not communicate, two MATLAB scripts were created to log, and timestamp the data. These scripts ran in parallel, and emulate a serial port. However, it was challenging to start both scripts at the same time. Since the sampling frequency of the IMU was known and was constant throughout the experiments, its script was the first to run and the system clock was logged. Then, the UWB script was run, and the system clock was also logged. Since the UWB measurements had a lower sampling rate (1–2 Hz), the MATLAB tic and toc functions were used to register the elapsed time between measurements. For the offline experiments, the start delay between the two experiments was computed based on the system clock logged. Then, this delay was added to the timestamps of the UWB measurements. A timestamp button was added to the UWB MATLAB script to help with the algorithms performance evaluation. Every time the user performed a turn, he/she pressed this button, and the system clock was logged in a file. This time was then used as a reference to calculate the accuracy of the system. By applying this method, the accuracy of the different methods was estimated in seven and nine points for the atrium and lab experiments, respectively. Figure 6 illustrates the two testbeds considered to evaluate the localization algorithms. The two scenarios were, respectively, an atrium with 9.4 × 7 m free space area (Figure 6a), and a lab with an area of 10.7 m × 7 m, desks, metallic cabinets, and textile machines (Figure 6b).
(a)
Electronics 2019, 8, x FOR PEER REVIEW 12 of 21
(b)
Figure 6. Illustration of the experimental setup in: (a) atrium; (b) lab.
The gray squares represent the location of anchor nodes, and the red line represents the path performed. For each scenario, the experiment was run five times. During the experiments, no other people were allowed to stay or walk through the scenarios. All the localization algorithms were implemented in MATLAB, run offline, and use the same data set. In this way, we guaranteed that all the algorithms were evaluated under the same conditions and, therefore, a fair comparison could be performed.
3.2. Performance Metrics
The performance assessment of the proposed data fusion algorithm was based on the following performance metrics: accuracy and total distance travelled.
3.2.1. Accuracy
In this work, the accuracy is defined as the Euclidean distance between the estimated position and the coordinates of the reference points. The reference points corresponded to the turns that the user had to perform in each scenario. The accuracy (퐸 ) is computed as follows:
퐸 = (푥 − 푥 ) + (푦 − 푦 ) , (23)
where (푥 , 푦 ) are the Cartesian coordinates estimated by the localization algorithm, and (푥 , 푦 ) are the correct Cartesian coordinates of the reference points. The accuracy metric is presented as a cumulative distribution function (CDF) to give a better representation of the performance achieved by the different algorithms. For each CDF plot, we consider the accuracy computed for each reference point and all the track repetitions.
3.2.2. Total Distance Error
The total distance error (퐸 ) is computed as follows:
퐸 = ∑ 퐷 , − 퐷 , (24)
where 푛 is the number of experiments performed, 퐷 , is the total distance travelled estimated at trial i, and 퐷 is the exact total distance. For total distance for the atrium and lab scenarios is 29.04 and 22.64 m, respectively.
3.3. Experimental Results
In this section, the proposed data fusion algorithm is evaluated and compared with the UWB and PDR systems. Three different ToA-based positioning algorithms are tested for the calculation of the UWB position in the data fusion process.
Figure 6. Illustration of the experimental setup in: (a) atrium; (b) lab.
3.2. Performance Metrics
The performance assessment of the proposed data fusion algorithm was based on the followingperformance metrics: accuracy and total distance travelled.
3.2.1. Accuracy
In this work, the accuracy is defined as the Euclidean distance between the estimated positionand the coordinates of the reference points. The reference points corresponded to the turns that theuser had to perform in each scenario. The accuracy (Eacc) is computed as follows:
Eacc =
√(xEst − xActual)
2 + (yEst − yActual)2, (23)
where (xEst, yEst) are the Cartesian coordinates estimated by the localization algorithm,and (xActual, yActual) are the correct Cartesian coordinates of the reference points. The accuracy metric ispresented as a cumulative distribution function (CDF) to give a better representation of the performanceachieved by the different algorithms. For each CDF plot, we consider the accuracy computed for eachreference point and all the track repetitions.
3.2.2. Total Distance Error
The total distance error (EDT) is computed as follows:
EDT =1n
∑n
i=1
∣∣∣De,i −DT∣∣∣, (24)
Electronics 2019, 8, 1463 13 of 21
where n is the number of experiments performed, De,i is the total distance travelled estimated at triali, and DT is the exact total distance. For total distance for the atrium and lab scenarios is 29.04 and22.64 m, respectively.
3.3. Experimental Results
In this section, the proposed data fusion algorithm is evaluated and compared with the UWB andPDR systems. Three different ToA-based positioning algorithms are tested for the calculation of theUWB position in the data fusion process.
3.3.1. Atrium Experiments
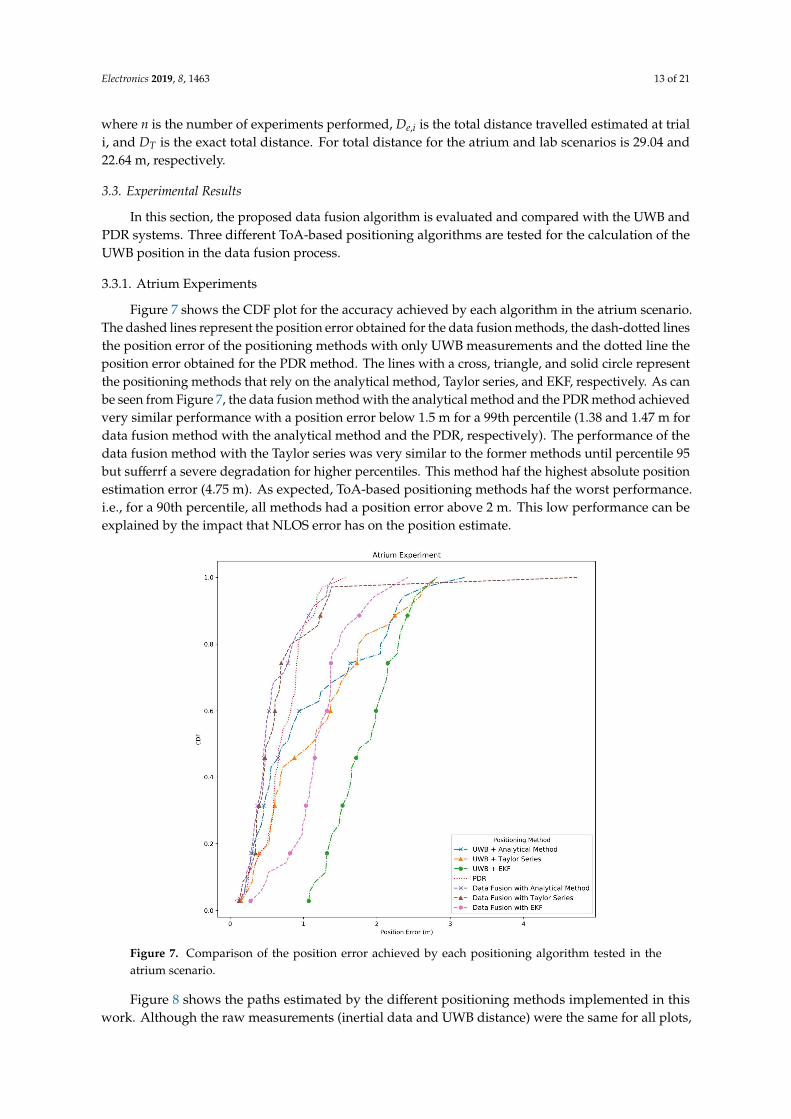
Figure 7 shows the CDF plot for the accuracy achieved by each algorithm in the atrium scenario.The dashed lines represent the position error obtained for the data fusion methods, the dash-dotted linesthe position error of the positioning methods with only UWB measurements and the dotted line theposition error obtained for the PDR method. The lines with a cross, triangle, and solid circle representthe positioning methods that rely on the analytical method, Taylor series, and EKF, respectively. As canbe seen from Figure 7, the data fusion method with the analytical method and the PDR method achievedvery similar performance with a position error below 1.5 m for a 99th percentile (1.38 and 1.47 m fordata fusion method with the analytical method and the PDR, respectively). The performance of thedata fusion method with the Taylor series was very similar to the former methods until percentile 95but sufferrf a severe degradation for higher percentiles. This method haf the highest absolute positionestimation error (4.75 m). As expected, ToA-based positioning methods haf the worst performance.i.e., for a 90th percentile, all methods had a position error above 2 m. This low performance can beexplained by the impact that NLOS error has on the position estimate.
Electronics 2019, 8, x FOR PEER REVIEW 13 of 21
3.3.1. Atrium Experiments
Figure 7 shows the CDF plot for the accuracy achieved by each algorithm in the atrium scenario. The dashed lines represent the position error obtained for the data fusion methods, the dash-dotted lines the position error of the positioning methods with only UWB measurements and the dotted line the position error obtained for the PDR method. The lines with a cross, triangle, and solid circle represent the positioning methods that rely on the analytical method, Taylor series, and EKF, respectively. As can be seen from Figure 7, the data fusion method with the analytical method and the PDR method achieved very similar performance with a position error below 1.5 m for a 99th percentile (1.38 and 1.47 m for data fusion method with the analytical method and the PDR, respectively). The performance of the data fusion method with the Taylor series was very similar to the former methods until percentile 95 but sufferrf a severe degradation for higher percentiles. This method haf the highest absolute position estimation error (4.75 m). As expected, ToA-based positioning methods haf the worst performance. i.e., for a 90th percentile, all methods had a position error above 2 m. This low performance can be explained by the impact that NLOS error has on the position estimate.
Figure 7. Comparison of the position error achieved by each positioning algorithm tested in the atrium scenario.
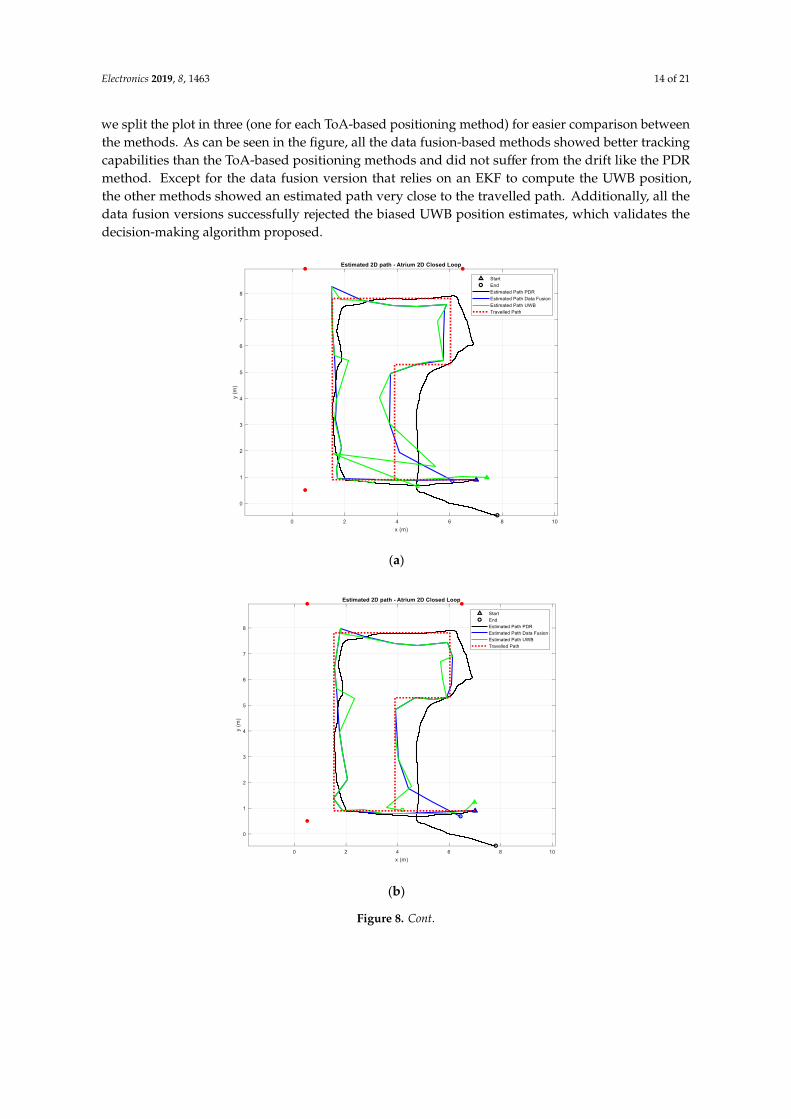
Figure 8 shows the paths estimated by the different positioning methods implemented in this work. Although the raw measurements (inertial data and UWB distance) were the same for all plots, we split the plot in three (one for each ToA-based positioning method) for easier comparison between the methods. As can be seen in the figure, all the data fusion-based methods showed better tracking capabilities than the ToA-based positioning methods and did not suffer from the drift like the PDR method. Except for the data fusion version that relies on an EKF to compute the UWB position, the other methods showed an estimated path very close to the travelled path. Additionally, all the data fusion versions successfully rejected the biased UWB position estimates, which validates the decision-making algorithm proposed.
Figure 7. Comparison of the position error achieved by each positioning algorithm tested in theatrium scenario.
Figure 8 shows the paths estimated by the different positioning methods implemented in thiswork. Although the raw measurements (inertial data and UWB distance) were the same for all plots,
Electronics 2019, 8, 1463 14 of 21
we split the plot in three (one for each ToA-based positioning method) for easier comparison betweenthe methods. As can be seen in the figure, all the data fusion-based methods showed better trackingcapabilities than the ToA-based positioning methods and did not suffer from the drift like the PDRmethod. Except for the data fusion version that relies on an EKF to compute the UWB position,the other methods showed an estimated path very close to the travelled path. Additionally, all thedata fusion versions successfully rejected the biased UWB position estimates, which validates thedecision-making algorithm proposed.Electronics 2019, 8, 1463 14 of 21
(a)
(b)
Figure 8. Cont.
Electronics 2019, 8, 1463 15 of 21Electronics 2019, 8, 1463 15 of 21
(c)
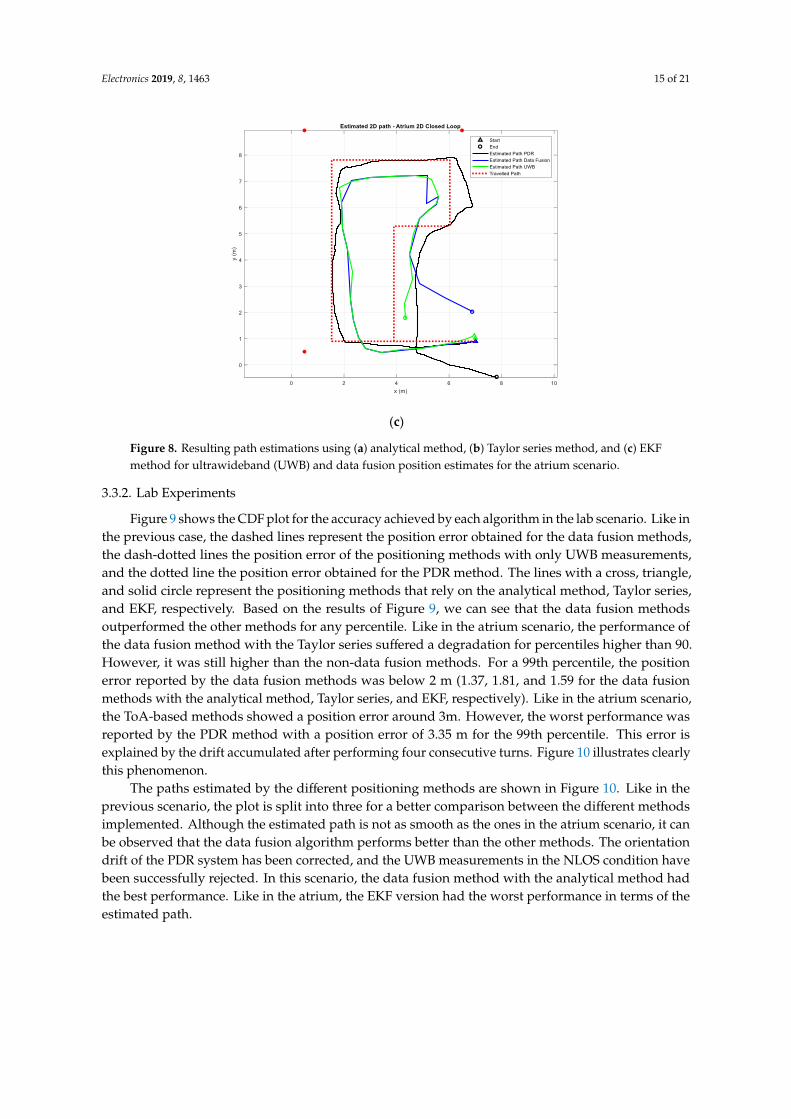
Figure 8. Resulting path estimations using (a) analytical method, (b) Taylor series method, and (c)
EKF method for ultrawideband (UWB) and data fusion position estimates for the atrium scenario.
3.3.2. Lab Experiments
Figure 9 shows the CDF plot for the accuracy achieved by each algorithm in the lab scenario.
Like in the previous case, the dashed lines represent the position error obtained for the data fusion
methods, the dash-dotted lines the position error of the positioning methods with only UWB
measurements, and the dotted line the position error obtained for the PDR method. The lines with a
cross, triangle, and solid circle represent the positioning methods that rely on the analytical method,
Taylor series, and EKF, respectively. Based on the results of Figure 9, we can see that the data fusion
methods outperformed the other methods for any percentile. Like in the atrium scenario, the
performance of the data fusion method with the Taylor series suffered a degradation for percentiles
higher than 90. However, it was still higher than the non-data fusion methods. For a 99th percentile,
the position error reported by the data fusion methods was below 2 m (1.37, 1.81, and 1.59 for the
data fusion methods with the analytical method, Taylor series, and EKF, respectively). Like in the
atrium scenario, the ToA-based methods showed a position error around 3m. However, the worst
performance was reported by the PDR method with a position error of 3.35 m for the 99th percentile.
This error is explained by the drift accumulated after performing four consecutive turns. Figure 10
illustrates clearly this phenomenon.
Figure 8. Resulting path estimations using (a) analytical method, (b) Taylor series method, and (c) EKFmethod for ultrawideband (UWB) and data fusion position estimates for the atrium scenario.
3.3.2. Lab Experiments
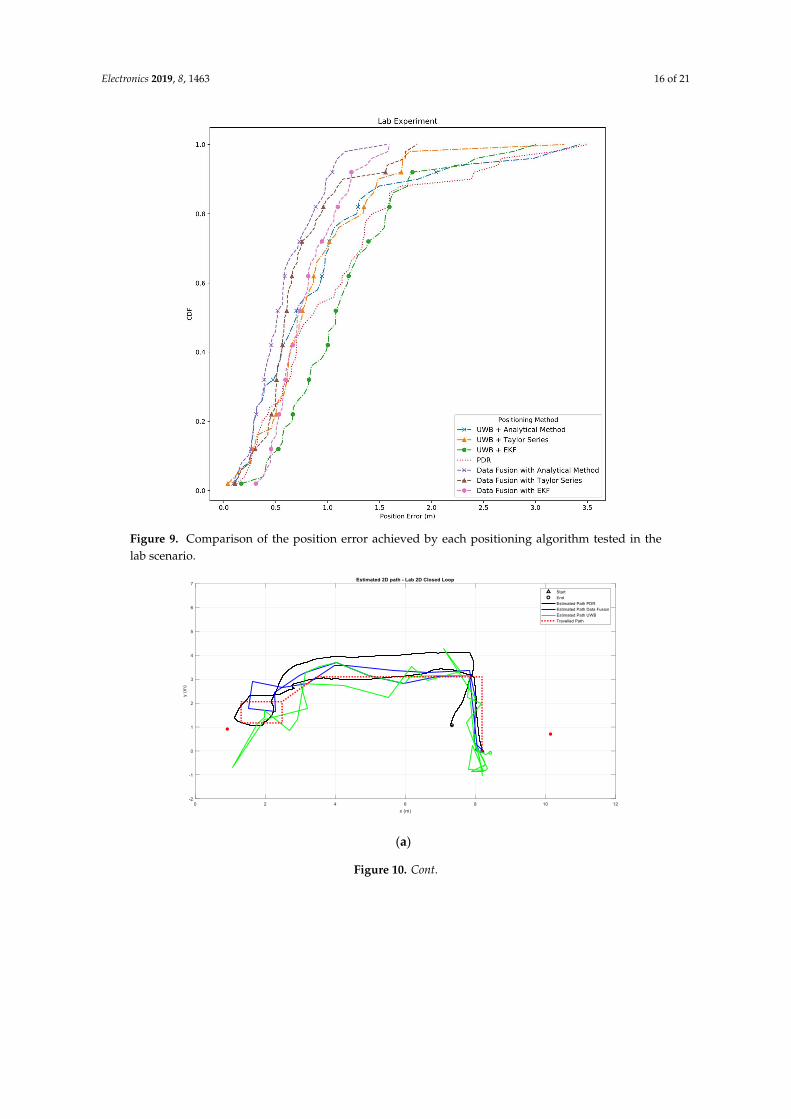
Figure 9 shows the CDF plot for the accuracy achieved by each algorithm in the lab scenario. Like inthe previous case, the dashed lines represent the position error obtained for the data fusion methods,the dash-dotted lines the position error of the positioning methods with only UWB measurements,and the dotted line the position error obtained for the PDR method. The lines with a cross, triangle,and solid circle represent the positioning methods that rely on the analytical method, Taylor series,and EKF, respectively. Based on the results of Figure 9, we can see that the data fusion methodsoutperformed the other methods for any percentile. Like in the atrium scenario, the performance ofthe data fusion method with the Taylor series suffered a degradation for percentiles higher than 90.However, it was still higher than the non-data fusion methods. For a 99th percentile, the positionerror reported by the data fusion methods was below 2 m (1.37, 1.81, and 1.59 for the data fusionmethods with the analytical method, Taylor series, and EKF, respectively). Like in the atrium scenario,the ToA-based methods showed a position error around 3m. However, the worst performance wasreported by the PDR method with a position error of 3.35 m for the 99th percentile. This error isexplained by the drift accumulated after performing four consecutive turns. Figure 10 illustrates clearlythis phenomenon.
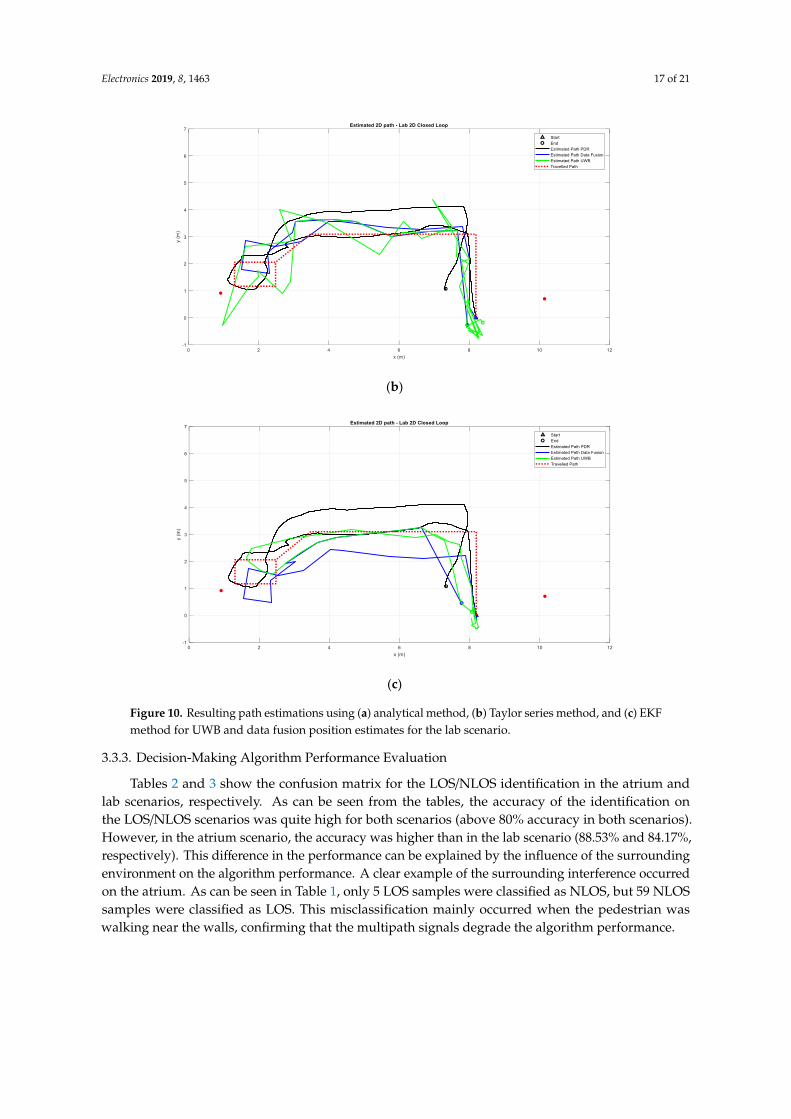
The paths estimated by the different positioning methods are shown in Figure 10. Like in theprevious scenario, the plot is split into three for a better comparison between the different methodsimplemented. Although the estimated path is not as smooth as the ones in the atrium scenario, it canbe observed that the data fusion algorithm performs better than the other methods. The orientationdrift of the PDR system has been corrected, and the UWB measurements in the NLOS condition havebeen successfully rejected. In this scenario, the data fusion method with the analytical method hadthe best performance. Like in the atrium, the EKF version had the worst performance in terms of theestimated path.
Electronics 2019, 8, 1463 16 of 21Electronics 2019, 8, x FOR PEER REVIEW 16 of 21
Figure 9. Comparison of the position error achieved by each positioning algorithm tested in the lab scenario.
The paths estimated by the different positioning methods are shown in Figure 10. Like in the previous scenario, the plot is split into three for a better comparison between the different methods implemented. Although the estimated path is not as smooth as the ones in the atrium scenario, it can be observed that the data fusion algorithm performs better than the other methods. The orientation drift of the PDR system has been corrected, and the UWB measurements in the NLOS condition have been successfully rejected. In this scenario, the data fusion method with the analytical method had the best performance. Like in the atrium, the EKF version had the worst performance in terms of the estimated path.
(a)
0 2 4 6 8 10 12x (m)
-2
-1
0
1
2
3
4
5
6
7
y (m
)
Estimated 2D path - Lab 2D Closed Loop
StartEndEstimated Path PDREstimated Path Data FusionEstimated Path UWBTravelled Path
Figure 9. Comparison of the position error achieved by each positioning algorithm tested in thelab scenario.
Electronics 2019, 8, 1463 16 of 21
Figure 9. Comparison of the position error achieved by each positioning algorithm tested in the lab
scenario.
The paths estimated by the different positioning methods are shown in Figure 10. Like in the
previous scenario, the plot is split into three for a better comparison between the different methods
implemented. Although the estimated path is not as smooth as the ones in the atrium scenario, it can
be observed that the data fusion algorithm performs better than the other methods. The orientation
drift of the PDR system has been corrected, and the UWB measurements in the NLOS condition have
been successfully rejected. In this scenario, the data fusion method with the analytical method had
the best performance. Like in the atrium, the EKF version had the worst performance in terms of the
estimated path.
(a)
Figure 10. Cont.
Electronics 2019, 8, 1463 17 of 21Electronics 2019, 8, 1463 17 of 21
(b)
(c)
Figure 10. Resulting path estimations using (a) analytical method, (b) Taylor series method, and (c)
EKF method for UWB and data fusion position estimates for the lab scenario.
3.3.3. Decision-Making Algorithm Performance Evaluation
Table 2 and Table 3 show the confusion matrix for the LOS/NLOS identification in the atrium
and lab scenarios, respectively. As can be seen from the tables, the accuracy of the identification on
the LOS/NLOS scenarios was quite high for both scenarios (above 80% accuracy in both scenarios).
However, in the atrium scenario, the accuracy was higher than in the lab scenario (88.53% and 84.17%,
respectively). This difference in the performance can be explained by the influence of the surrounding
environment on the algorithm performance. A clear example of the surrounding interference
occurred on the atrium. As can be seen in Table 1, only 5 LOS samples were classified as NLOS, but
59 NLOS samples were classified as LOS. This misclassification mainly occurred when the pedestrian
was walking near the walls, confirming that the multipath signals degrade the algorithm
performance.
Figure 10. Resulting path estimations using (a) analytical method, (b) Taylor series method, and (c) EKFmethod for UWB and data fusion position estimates for the lab scenario.
3.3.3. Decision-Making Algorithm Performance Evaluation
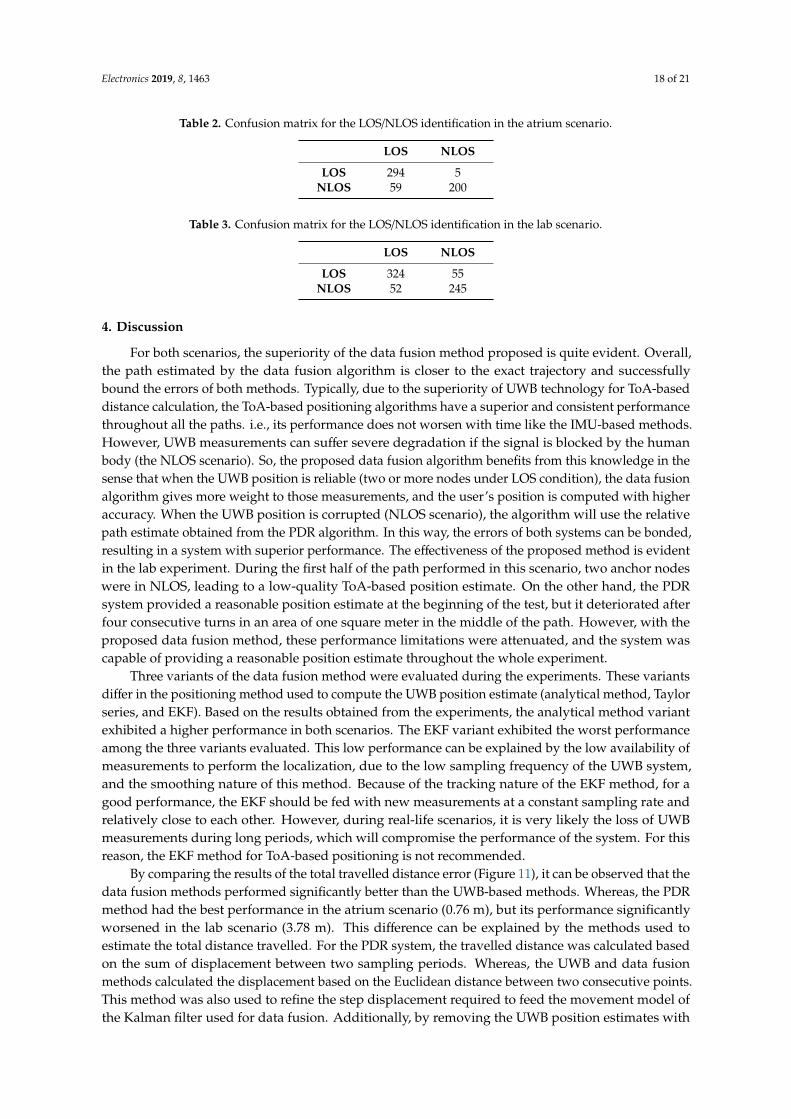
Tables 2 and 3 show the confusion matrix for the LOS/NLOS identification in the atrium andlab scenarios, respectively. As can be seen from the tables, the accuracy of the identification onthe LOS/NLOS scenarios was quite high for both scenarios (above 80% accuracy in both scenarios).However, in the atrium scenario, the accuracy was higher than in the lab scenario (88.53% and 84.17%,respectively). This difference in the performance can be explained by the influence of the surroundingenvironment on the algorithm performance. A clear example of the surrounding interference occurredon the atrium. As can be seen in Table 1, only 5 LOS samples were classified as NLOS, but 59 NLOSsamples were classified as LOS. This misclassification mainly occurred when the pedestrian waswalking near the walls, confirming that the multipath signals degrade the algorithm performance.
Electronics 2019, 8, 1463 18 of 21
Table 2. Confusion matrix for the LOS/NLOS identification in the atrium scenario.
LOS NLOS
LOS 294 5NLOS 59 200
Table 3. Confusion matrix for the LOS/NLOS identification in the lab scenario.
LOS NLOS
LOS 324 55NLOS 52 245
4. Discussion
For both scenarios, the superiority of the data fusion method proposed is quite evident. Overall,the path estimated by the data fusion algorithm is closer to the exact trajectory and successfullybound the errors of both methods. Typically, due to the superiority of UWB technology for ToA-baseddistance calculation, the ToA-based positioning algorithms have a superior and consistent performancethroughout all the paths. i.e., its performance does not worsen with time like the IMU-based methods.However, UWB measurements can suffer severe degradation if the signal is blocked by the humanbody (the NLOS scenario). So, the proposed data fusion algorithm benefits from this knowledge in thesense that when the UWB position is reliable (two or more nodes under LOS condition), the data fusionalgorithm gives more weight to those measurements, and the user’s position is computed with higheraccuracy. When the UWB position is corrupted (NLOS scenario), the algorithm will use the relativepath estimate obtained from the PDR algorithm. In this way, the errors of both systems can be bonded,resulting in a system with superior performance. The effectiveness of the proposed method is evidentin the lab experiment. During the first half of the path performed in this scenario, two anchor nodeswere in NLOS, leading to a low-quality ToA-based position estimate. On the other hand, the PDRsystem provided a reasonable position estimate at the beginning of the test, but it deteriorated afterfour consecutive turns in an area of one square meter in the middle of the path. However, with theproposed data fusion method, these performance limitations were attenuated, and the system wascapable of providing a reasonable position estimate throughout the whole experiment.
Three variants of the data fusion method were evaluated during the experiments. These variantsdiffer in the positioning method used to compute the UWB position estimate (analytical method, Taylorseries, and EKF). Based on the results obtained from the experiments, the analytical method variantexhibited a higher performance in both scenarios. The EKF variant exhibited the worst performanceamong the three variants evaluated. This low performance can be explained by the low availability ofmeasurements to perform the localization, due to the low sampling frequency of the UWB system,and the smoothing nature of this method. Because of the tracking nature of the EKF method, for agood performance, the EKF should be fed with new measurements at a constant sampling rate andrelatively close to each other. However, during real-life scenarios, it is very likely the loss of UWBmeasurements during long periods, which will compromise the performance of the system. For thisreason, the EKF method for ToA-based positioning is not recommended.
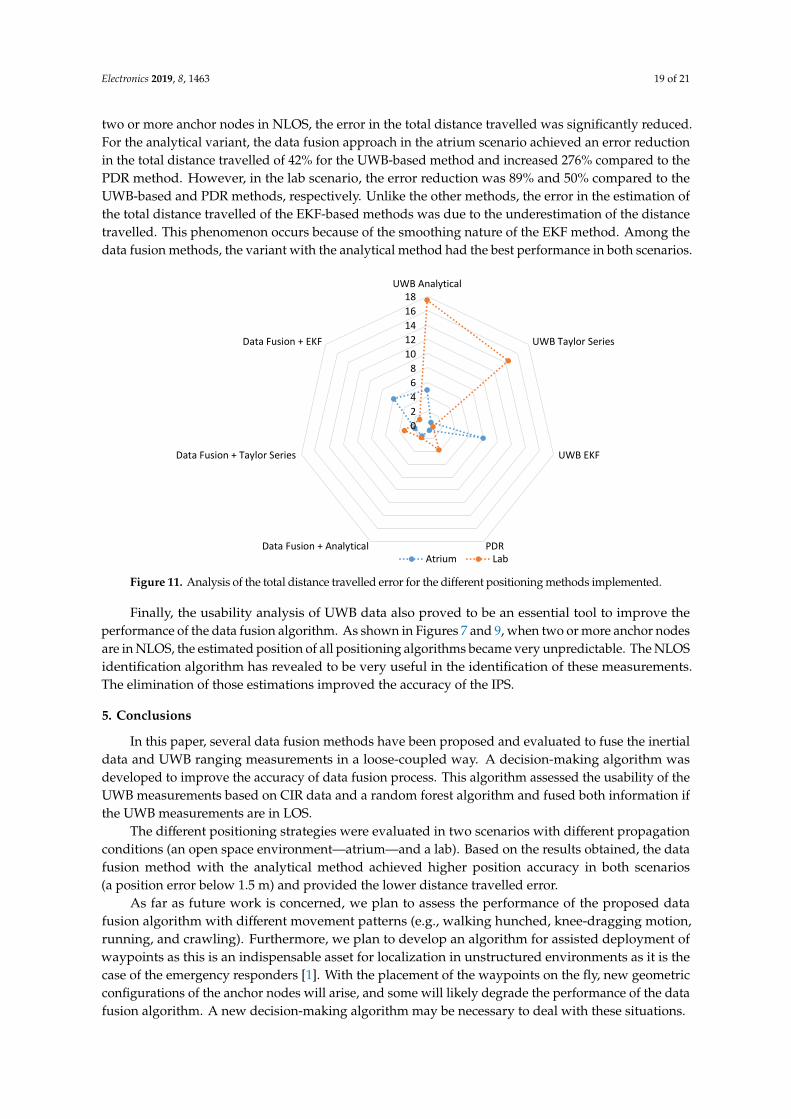
By comparing the results of the total travelled distance error (Figure 11), it can be observed that thedata fusion methods performed significantly better than the UWB-based methods. Whereas, the PDRmethod had the best performance in the atrium scenario (0.76 m), but its performance significantlyworsened in the lab scenario (3.78 m). This difference can be explained by the methods used toestimate the total distance travelled. For the PDR system, the travelled distance was calculated basedon the sum of displacement between two sampling periods. Whereas, the UWB and data fusionmethods calculated the displacement based on the Euclidean distance between two consecutive points.This method was also used to refine the step displacement required to feed the movement model ofthe Kalman filter used for data fusion. Additionally, by removing the UWB position estimates with
Electronics 2019, 8, 1463 19 of 21
two or more anchor nodes in NLOS, the error in the total distance travelled was significantly reduced.For the analytical variant, the data fusion approach in the atrium scenario achieved an error reductionin the total distance travelled of 42% for the UWB-based method and increased 276% compared to thePDR method. However, in the lab scenario, the error reduction was 89% and 50% compared to theUWB-based and PDR methods, respectively. Unlike the other methods, the error in the estimation ofthe total distance travelled of the EKF-based methods was due to the underestimation of the distancetravelled. This phenomenon occurs because of the smoothing nature of the EKF method. Among thedata fusion methods, the variant with the analytical method had the best performance in both scenarios.
Electronics 2019, 8, x FOR PEER REVIEW 19 of 21
was significantly reduced. For the analytical variant, the data fusion approach in the atrium scenario achieved an error reduction in the total distance travelled of 42% for the UWB-based method and increased 276% compared to the PDR method. However, in the lab scenario, the error reduction was 89% and 50% compared to the UWB-based and PDR methods, respectively. Unlike the other methods, the error in the estimation of the total distance travelled of the EKF-based methods was due to the underestimation of the distance travelled. This phenomenon occurs because of the smoothing nature of the EKF method. Among the data fusion methods, the variant with the analytical method had the best performance in both scenarios.
Figure 11. Analysis of the total distance travelled error for the different positioning methods implemented.
Finally, the usability analysis of UWB data also proved to be an essential tool to improve the performance of the data fusion algorithm. As shown in Figures 7 and 9, when two or more anchor nodes are in NLOS, the estimated position of all positioning algorithms became very unpredictable. The NLOS identification algorithm has revealed to be very useful in the identification of these measurements. The elimination of those estimations improved the accuracy of the IPS.
5. Conclusions
In this paper, several data fusion methods have been proposed and evaluated to fuse the inertial data and UWB ranging measurements in a loose-coupled way. A decision-making algorithm was developed to improve the accuracy of data fusion process. This algorithm assessed the usability of the UWB measurements based on CIR data and a random forest algorithm and fused both information if the UWB measurements are in LOS.
The different positioning strategies were evaluated in two scenarios with different propagation conditions (an open space environment—atrium—and a lab). Based on the results obtained, the data fusion method with the analytical method achieved higher position accuracy in both scenarios (a position error below 1.5 m) and provided the lower distance travelled error.
As far as future work is concerned, we plan to assess the performance of the proposed data fusion algorithm with different movement patterns (e.g., walking hunched, knee-dragging motion, running, and crawling). Furthermore, we plan to develop an algorithm for assisted deployment of waypoints as this is an indispensable asset for localization in unstructured environments as it is the case of the emergency responders [1]. With the placement of the waypoints on the fly, new geometric configurations of the anchor nodes will arise, and some will likely degrade the performance of the data fusion algorithm. A new decision-making algorithm may be necessary to deal with these situations.
02468
1012141618
UWB Analytical
UWB Taylor Series
UWB EKF
PDRData Fusion + Analytical
Data Fusion + Taylor Series
Data Fusion + EKF
Atrium Lab
Figure 11. Analysis of the total distance travelled error for the different positioning methods implemented.
Finally, the usability analysis of UWB data also proved to be an essential tool to improve theperformance of the data fusion algorithm. As shown in Figures 7 and 9, when two or more anchor nodesare in NLOS, the estimated position of all positioning algorithms became very unpredictable. The NLOSidentification algorithm has revealed to be very useful in the identification of these measurements.The elimination of those estimations improved the accuracy of the IPS.
5. Conclusions
In this paper, several data fusion methods have been proposed and evaluated to fuse the inertialdata and UWB ranging measurements in a loose-coupled way. A decision-making algorithm wasdeveloped to improve the accuracy of data fusion process. This algorithm assessed the usability of theUWB measurements based on CIR data and a random forest algorithm and fused both information ifthe UWB measurements are in LOS.
The different positioning strategies were evaluated in two scenarios with different propagationconditions (an open space environment—atrium—and a lab). Based on the results obtained, the datafusion method with the analytical method achieved higher position accuracy in both scenarios(a position error below 1.5 m) and provided the lower distance travelled error.
As far as future work is concerned, we plan to assess the performance of the proposed datafusion algorithm with different movement patterns (e.g., walking hunched, knee-dragging motion,running, and crawling). Furthermore, we plan to develop an algorithm for assisted deployment ofwaypoints as this is an indispensable asset for localization in unstructured environments as it is thecase of the emergency responders [1]. With the placement of the waypoints on the fly, new geometricconfigurations of the anchor nodes will arise, and some will likely degrade the performance of the datafusion algorithm. A new decision-making algorithm may be necessary to deal with these situations.
Electronics 2019, 8, 1463 20 of 21
Author Contributions: A.G.F., A.P.C., A.M.R., and J.L.M. conceived and designed the experiments; A.G.F. andD.F. performed the experiments; A.G.F. and A.P.C. analyzed the data; J.L.M. provided hardware devices; A.G.F.wrote the paper.
Funding: This work has been partially supported by FCT – Fundação para a Ciência e Tecnologia within theProject Scope: UID/CEC/00319/2019 and Project UID/CTM/00264/2019 of 2C2T—Centro de Ciência e TecnologiaTêxtil, funded by National Founds through FCT/MCTES. The work of A. G. Ferreira and D. Fernandes wassupported by the FCT under Grant SFRH/BD/91477/2012 and Grant SFRH/BD/92082/2012.
Conflicts of Interest: The authors declare no conflict of interest.
References
1. Ferreira, A.F.G.; Fernandes, D.M.A.; Catarino, A.P.; Monteiro, J.L. Localization and Positioning Systems forEmergency Responders: A Survey. IEEE Commun. Surv. Tutor. 2017, 19, 2836–2870. [CrossRef]
2. Femminella, M.; Reali, G. A Zero-Configuration Tracking System for First Responders Networks. IEEE Syst. J.2017, 11, 2917–2928. [CrossRef]
3. Curone, D.; Secco, E.L.; Tognetti, A.; Loriga, G.; Dudnik, G.; Risatti, M.; Whyte, R.; Bonfiglio, A.; Magenes, G.Smart Garments for Emergency Operators: The ProeTEX Project. IEEE Trans. Inf. Technol. Biomed. 2010, 14,694–701. [CrossRef] [PubMed]
4. Fuchs, C.; Aschenbruck, N.; Martini, P.; Wieneke, M. Indoor tracking for mission critical scenarios: A survey.Pervasive Mob. Comput. 2011, 7, 1–15. [CrossRef]
5. Fischer, C.; Gellersen, H. Location and Navigation Support for Emergency Responders: A Survey.IEEE Pervasive Comput. 2010, 9, 38–47. [CrossRef]
6. Rantakokko, J.; Strömbäck, P.; Andersson, P. Foot-and knee-mounted INS for firefighter localization.In Proceedings of the 2014 International Technical Meeting of the Institute of Navigation, San Diego, CA,USA, 27–29 January 2014; pp. 145–153.
7. Faramondi, L.; Inderst, F.; Pascucci, F.; Setola, R.; Delprato, U. An enhanced indoor positioning system forfirst responders. In Proceedings of the 2013 International Conference on Indoor Positioning and IndoorNavigation, Montbeliard-Belfort, France, 28–31 October 2013; pp. 1–8.
8. Qi, H.; Moore, J.B. Direct Kalman filtering approach for GPS/INS integration. IEEE Trans. Aerosp. Electron. Syst.2002, 38, 687–693.
9. Chu, H.-J.; Tsai, G.-J.; Chiang, K.-W.; Duong, T.-T. GPS/MEMS INS Data Fusion and Map Matching in UrbanAreas. Sensors 2013, 13, 11280–11288. [CrossRef] [PubMed]
10. Deng, Z.-A.; Hu, Y.; Yu, J.; Na, Z. Extended Kalman Filter for Real Time Indoor Localization by Fusing WiFiand Smartphone Inertial Sensors. Micromachines 2015, 6, 523–543. [CrossRef]
11. Masiero, A.; Guarnieri, A.; Pirotti, F.; Vettore, A. A Particle Filter for Smartphone-Based Indoor PedestrianNavigation. Micromachines 2014, 5, 1012–1033. [CrossRef]
12. Waqar, W.; Chen, Y.; Vardy, A. Incorporating user motion information for indoor smartphone positioning insparse Wi-Fi environments. In Proceedings of the 17th ACM International Conference on Modeling, Analysisand Simulation of Wireless and Mobile Systems-MSWiM, Montreal, QC, Canada, 21–26 September 2014;pp. 267–274.
13. Fischer, C.; Muthukrishnan, K.; Hazas, M. SLAM for Pedestrians and Ultrasonic Landmarks in EmergencyResponse Scenarios. In Advances in Computers; Zelkowitz, M.V., Ed.; Academic Press: Burlington, Germany,2011; Volume 81, pp. 103–160.
14. Olsson, F.; Rantakokko, J.; Nygards, J. Cooperative localization using a foot-mounted inertial navigationsystem and ultrawideband ranging. In Proceedings of the 2014 International Conference on IndoorPositioning and Indoor Navigation (IPIN), Busan, Korea, 27–30 October 2014; pp. 122–131.
15. Kok, M.; Hol, J.D.; Schon, T.B. Indoor Positioning Using Ultrawideband and Inertial Measurements.IEEE Trans. Veh. Technol. 2015, 64, 1293–1303. [CrossRef]
16. Yang, H.; Zhang, R.; Bordoy, J.; Höflinger, F.; Li, W.; Schindelhauer, C.; Reindl, L. Smartphone-BasedIndoor Localization System Using Inertial Sensor and Acoustic Transmitter/Receiver. IEEE Sens. J. 2016, 16,8051–8061. [CrossRef]
17. Zhao, S.; Huang, B.; Liu, F. Localization of Indoor Mobile Robot Using Minimum Variance Unbiased FIRFilter. IEEE Trans. Autom. Sci. Eng. 2018, 15, 410–419. [CrossRef]

Electronics 2019, 8, 1463 21 of 21
18. Fernandes, D.; Ferreira, A.; Mendes, J.; Cabral, J. A wireless body sensor network based on dynamic powercontrol and opportunistic packet scheduling mechanisms. In Proceedings of the 2015 IEEE InternationalConference on Industrial Technology (ICIT), Seville, Spain, 17–19 March 2015; pp. 2160–2165.
19. Ferreira, A.; Fernandes, D.; Catarino, A.; Monteiro, J. Performance Analysis of ToA-Based PositioningAlgorithms for Static and Dynamic Targets with Low Ranging Measurements. Sensors 2017, 17, 1915.[CrossRef] [PubMed]
20. Fernandes, D.; Gomes, T.; Ferreira, A.; Abrishambaf, R.; Cabral, J.; Monteiro, J.L.; Rocha, A. On-body signalpropagation in WBANs for firefighters personal protective equipment: Statistical characterization andperformance assessment. In Proceedings of the IEEE International Conference on Industrial Technology,Toronto, ON, Canada, 22–25 March 2017.
21. Ferreira, A.G.; Fernandes, D.; Monteiro, J.; Catarino, A.P.; Rocha, A.M. A Pedestrian Positioning SystemIntegrated into a Cyber-Physical System for Emergency Responders’ Monitoring. In Proceedings ofthe 2018 International Conference on Indoor Positioning and Indoor Navigation (IPIN), Nantes, France,24–27 September 2018; pp. 206–212.
22. Decawave. 2014. Available online: http://www.decawave.com (accessed on 16 August 2017).23. Caffery, J.J. A new approach to the geometry of TOA location. In Proceedings of the Vehicular Technology
Conference Fall 2000. IEEE VTS Fall VTC2000. 52nd Vehicular Technology Conference (Cat. No.00CH37152),Boston, MA, USA, 24–28 September 2000; Volume 4, pp. 1943–1949.
24. Marano, S.; Gifford, W.; Wymeersch, H.; Win, M. NLOS identification and mitigation for localization basedon UWB experimental data. IEEE J. Sel. Areas Commun. 2010, 28, 1026–1035. [CrossRef]
25. Silva, B.; Hancke, G.P. IR-UWB-Based Non-Line-of-Sight Identification in Harsh Environments: Principlesand Challenges. IEEE Trans. Ind. Inform. 2016, 12, 1188–1195. [CrossRef]
26. Savic, V.; Ferrer-Coll, J.; Angskog, P.; Chilo, J.; Stenumgaard, P.; Larsson, E.G. Measurement Analysis andChannel Modeling for TOA-Based Ranging in Tunnels. IEEE Trans. Wirel. Commun. 2015, 14, 456–467.[CrossRef]
27. Dardari, D.; Conti, A.; Ferner, U.; Giorgetti, A.; Win, M.Z. Ranging with Ultrawide Bandwidth Signals inMultipath Environments. Proc. IEEE 2009, 97, 404–426. [CrossRef]
28. Shen, Y.; Win, M. On the accuracy of localization systems using wideband antenna arrays. IEEE Trans. Commun.2010, 58, 270–280. [CrossRef]
29. Kilic, Y.; Ali, A.J.; Meijerink, A.; Bentum, M.J.; Scanlon, W.G. The effect of human-body shadowing on indoorUWB TOA-based ranging systems. In Proceedings of the 2012 9th Workshop on Positioning, Navigation andCommunication, Dresden, Germany, 15–16 March 2012; pp. 126–130.
30. He, J.; Geng, Y.; Liu, F.; Xu, C. CC-KF: Enhanced TOA Performance in Multipath and NLOS Indoor ExtremeEnvironment. IEEE Sens. J. 2014, 14, 3766–3774.
© 2019 by the authors. Licensee MDPI, Basel, Switzerland. This article is an open accessarticle distributed under the terms and conditions of the Creative Commons Attribution(CC BY) license (http://creativecommons.org/licenses/by/4.0/).
Related Documents