A Look at the 1940 Census 1

Welcome message from author
This document is posted to help you gain knowledge. Please leave a comment to let me know what you think about it! Share it to your friends and learn new things together.
Transcript

A Look at the 1940 Census
1

For Reference by C-SPAN (not display)
Major Innovations of the 1940
Census First census to:
– include a question on wages and income (under the heading on “income”)
– to ask extra questions of a 5 percent sample of the population. (two people on each page)
– designate a special day for counting transients (T-Night) April 8-9
– include a coverage and content research program following the census
– include a census of housing.
2

For Reference only
Census Sample Survey • Procedures designed by W.
Edwards Deming and Morris
Hansen
• Asked most frequently of people
falling on lines 14 and 29
• Supplementary questions included
– Parents’ place of birth
– Veterans status
– If person had a Social Security card
– Usual occupation and industry
– Age at first marriage
– Number of children ever born
• The implications for 2012
– Many new questions on some people
– Parents’ place of birth had been
available on everyone from the 1930
census
To reconcile exploding demand for new
questions with a public balking at
answering and technology straining to
make that many tabulations:
3

U.S. Population in Millions:1940 to 2050
Census Projections
Source: U.S. Census Bureau, 1940 to 2010 Decennial Censuses; 2008 National Population Projections 4

5

6

7

8

Population Distribution by Race: 1940-2010
2.4 2.9 3.0 3.9 5.5 6.2
1.5 2.9 3.8 5.0
9.8 10.0 10.5 11.1 11.7
12.1 12.3
12.6
89.8 89.5 88.6 87.5 83.0 80.3 75.1 72.4
0
10
20
30
40
50
60
70
80
90
100
1940 1950 1960 1970 1980 1990 2000* 2010*
White
Black or AfricanAmerican
American Indianand Alaska Native
Asian and NativeHawaiian and OtherPacific Islander
Some Other Race
Two or More Races
*Data are shown for the White, Black or African American, American Indian and Alaska Native, Asian and
Native Hawaiian and Other Pacific Islander, and Some Other Race alone populations.
Source: U.S. Census Bureau, decennial census of population, 1940 to 2010. 9

Population Distribution by Hispanic Origin: 1970-2010
4.5 6.4 9.0 12.5 16.3
95.5 93.6 91.0 87.5 83.7
0
10
20
30
40
50
60
70
80
90
100
1970 1980 1990 2000 2010
Not Hispanicor Latino
Hispanic orLatino
Source: U.S. Census Bureau, decennial census of population, 1970 (5-percent
sample), 1980 to 2010. 10
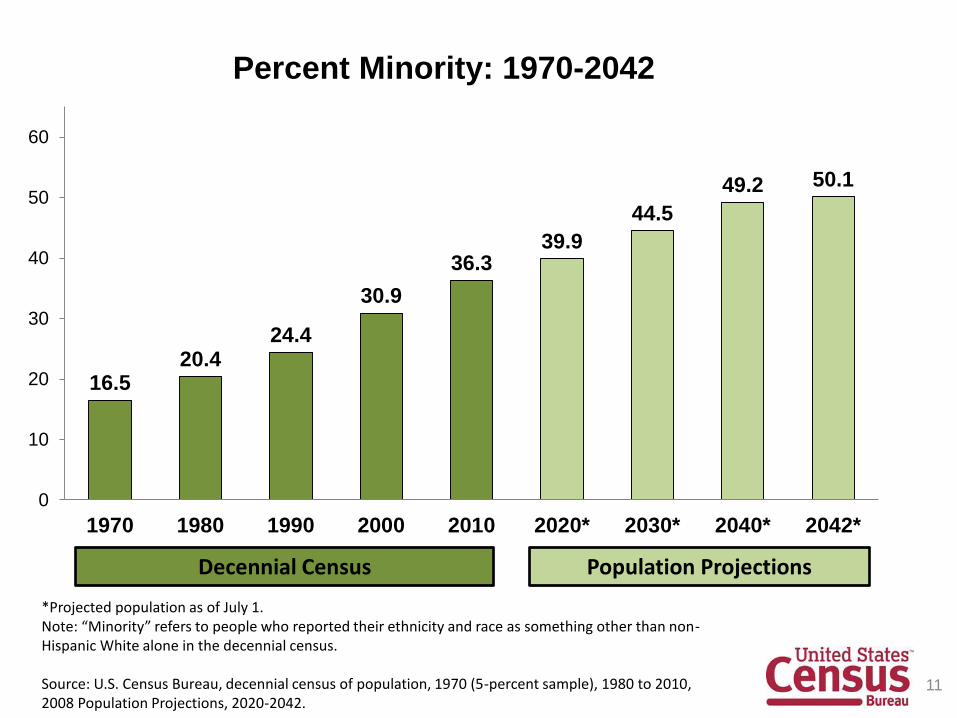
Percent Minority: 1970-2042
16.5 20.4
24.4
30.9
36.3 39.9
44.5
49.2 50.1
0
10
20
30
40
50
60
1970 1980 1990 2000 2010 2020* 2030* 2040* 2042*
Population Projections
*Projected population as of July 1. Note: “Minority” refers to people who reported their ethnicity and race as something other than non-Hispanic White alone in the decennial census. Source: U.S. Census Bureau, decennial census of population, 1970 (5-percent sample), 1980 to 2010, 2008 Population Projections, 2020-2042.
Decennial Census
11

Age Distribution: 1940 and 2010
30.6
24.0
42.8
36.5
19.8
26.4
6.8
13.0
0% 20% 40% 60% 80% 100%
1940
2010
Percentage
Under 18
18-44
45-64
65+
Sources: U.S. Census Bureau, 1940 Census and 2010 Census. 12

Median Age: 1940-2050
1940 1950 1960 1970 1980 1990 2000 2010 2020 2030 2040 2050
Total 29.0 30.2 29.5 28.1 30.0 32.9 35.3 37.2 37.7 38.7 38.9 39.0
Male 29.1 29.9 28.7 26.8 28.8 31.7 34.0 35.8 36.5 37.5 37.7 37.8
Female 29.0 30.5 30.3 29.3 31.2 34.1 36.5 38.5 38.9 39.9 40.2 40.2
0.0
5.0
10.0
15.0
20.0
25.0
30.0
35.0
40.0
45.0
Me
dia
n A
ge
Sources: U.S. Census Bureau, decennial census of population, 1940 to 2010
U.S. Census Bureau, 2020-2050 Projections of the Population by Age and Sex
(NP2008-T12) 13

14
Average Household Size: 1940 and 2010
3.7
2.6
0
1
2
3
4
1940 2010
Nu
mb
er
of
pe
op
le
Source: U.S. Census Bureau, 1940 and 2010 Censuses.

Percent of Households that are Family
Households: 1940 and 2010
90
66
0
10
20
30
40
50
60
70
80
90
100
1940 2010
Pe
rce
nt
Source: U.S, Census Bureau, 1940 and 2010 Censuses.
15

Percent of Family Households with Female
Householder, no Husband Present: 1940 and 2010
11
20
0
5
10
15
20
25
1940 2010
Pe
rce
nt
Source: U.S. Census Bureau, 1940 and 2010 Censuses. 16

Percent of Households with One
Person: 1940 and 2010
8
27
0
5
10
15
20
25
30
1940 2010
Source: U.S, Census Bureau, Decennial Census
17

18
Marital Status, Males 15 Years
and Over: 1940 and 2010
33 35
61
52
1
10
4 3
0
10
20
30
40
50
60
70
1940 2010
Never married
Married
Divorced
Widowed
Source: U.S. Census Bureau, 1940 Census, and 2010 American Community Survey.

19
Marital Status, Females 15 Years
and Over: 1940 and 2010
26 29
61
50
2
12 12 9
0
10
20
30
40
50
60
70
1940 2010
Never married
Married
Divorced
Widowed
Source: U.S. Census Bureau, 1940 Census and 2010 American Community Survey.

Percent of Population 25 Years & Over Who Completed
High School; Percentage Who Completed a Bachelor’s
Degree: 1940, 1970, and 2010
Source: U.S. Census Bureau,1940 and 1970 Censuses, and the 2010
American Community Survey
24
5
52
11
86
28
0
10
20
30
40
50
60
70
80
90
100
Completed high school or more Bachelor's degree or more
Perc
en
t
1940
1970
2010
20

Percent of People 16 Years and Over
in the Labor Force, by Sex: 1940 and 2010
55
83
27
64 70
59
0
10
20
30
40
50
60
70
80
90
Total Men Women
Perc
en
t
1940
2010
Source: U.S. Census Bureau,1940 and 1970 Censuses, and the 2010 American
Community Survey 21

Percent of Employed People
in Selected Industries: 1940 and 2010
21 23
17 19
2
10
14
48
0
10
20
30
40
50
60
Agriculture,forestry, fishing,
mining
Manufacturing Wholesale andretail trade
Services
Perc
en
t
1940
2010
Source: U.S. Census Bureau, 1940 Census and 2010 American Community Survey
22

Percent Distribution of Employed People by
Class of Worker: 1940 and 2010
63
8
20
3 5
78
15
6
0.1 0
10
20
30
40
50
60
70
80
90
Private Government Self employed Unpaid familyworkers
On publicemergency
work
Perc
en
t
1940
2010
Source: U.S. Census Bureau, 1940 Census and 2010 American Community Survey 23

Female to Male Wage and Salary Ratio: 1939
and 2010
0.62
0.73
0.00
0.10
0.20
0.30
0.40
0.50
0.60
0.70
1939 2010
Rati
o
Source: U.S. Census Bureau, 1940 Census and 2011 Current Population Survey
Annual, Social, and Economic Supplement. 24

U.S. Homeownership Rates:
1900 to 2010
47 46 46 48
44
55
62 63 64 64 66 65
0
10
20
30
40
50
60
70
1900 1910 1920 1930 1940 1950 1960 1970 1980 1990 2000 2010
Perc
en
t
Source: U.S. Census Bureau, 1940 Census of Housing. 25

State Homeownership Rates: 1940
Homeownership Rate
not a state
under 50.0
50.0 to 59.9
60.0 or more
Source: U.S. Census Bureau, 1940 Census of Housing 26

State Homeownership Rates: 2010
Homeownership Rate
not a state
under 50.0
50.0 to 59.9
60.0 or more
Source: U.S. Census Bureau, 2010 Census of Housing 27
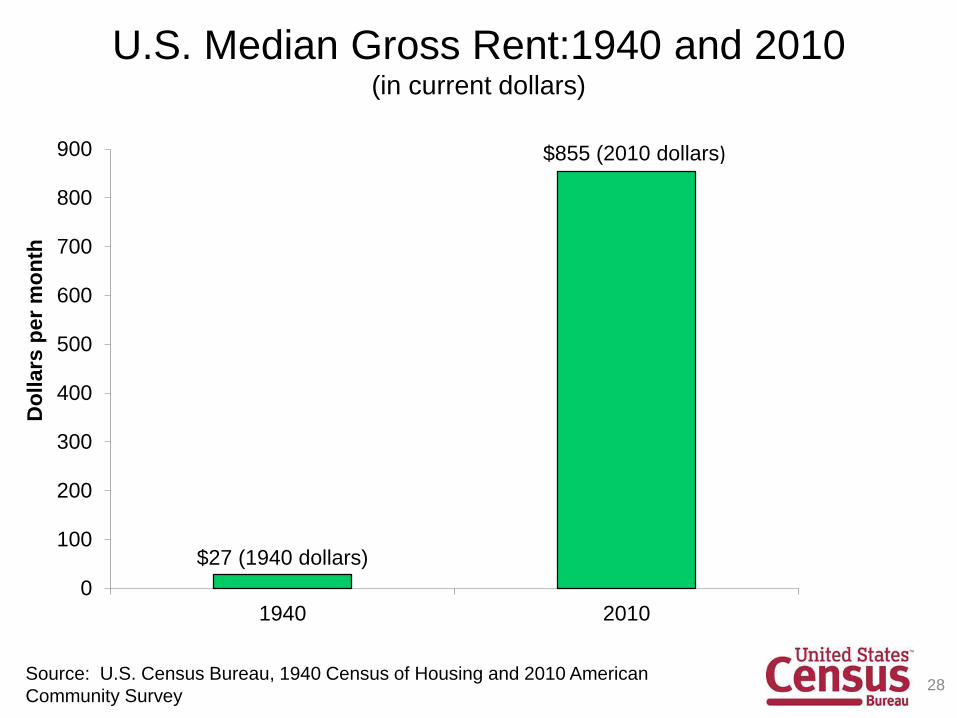
U.S. Median Gross Rent:1940 and 2010 (in current dollars)
$27 (1940 dollars)
0
100
200
300
400
500
600
700
800
900
1940 2010
Do
llars
per
mo
nth
$855 (2010 dollars)
Source: U.S. Census Bureau, 1940 Census of Housing and 2010 American
Community Survey 28

http://1940census.archives.gov
29

1940 Census Questions
• Where did you live on April 1, 1935
• What were your wages or salary for 1939
• What was your highest level of education
• Supplemental schedule
30

31
32

Finding Someone on the Census
• There is no name index yet
• Enumeration district maps
• Enumeration district descriptions
33
Related Documents