ORIGINAL INVESTIGATION A longitudinal VBM study in paediatric obsessive–compulsive disorder at 2-year follow-up after cognitive behavioural therapy CHAIM HUYSER 1,2 , ODILE A. VAN DEN HEUVEL 3,4 , LIDEWIJ WOLTERS 1,2 , ELSE DE HAAN 1,2 , RAMON LINDAUER 1,2 & DICK J. VELTMAN 3 1 Department of Child and Adolescent Psychiatry, University of Amsterdam, AMC, Amsterdam, The Netherlands, 2 De Bascule, Academic Center Child and Adolescent Psychiatry, Amsterdam, The Netherlands, 3 Department of Psychiatry, VU University Medical Center, Amsterdam, The Netherlands, and 4 Department of Anatomy & Neurosciences,VU University Medical Center, Amsterdam, The Netherlands Abstract Objectives. To identify neurodevelopmental differences in regional brain volume between medication-free paediatric obsessive–compulsive disorder (OCD) patients and controls at 2-year follow-up after cognitive behavioural therapy. Methods. We assessed 17 medication-free paediatric OCD patients (mean age 13.8 years; SD 2.8; range 8.2–19.0) and 20 controls, matched on age and gender, with T1-weighted MR scans in a repeated measures design at three time points with intervals of 6 months and 2 years. Voxel based morphometry (VBM) was used to test whole brain voxel-wise for the effects of diagnosis and time on regional grey matter (GM) and white matter volumes. Results. GM volume of the orbitofrontal cortex showed a group time interaction effect, driven by an increase of GM volume over the whole time period in OCD patients and a decrease in controls. When splitting the groups in two age groups (8–12 and 13–19 years) this interaction effect was only seen in the youngest age group. Conclusions. Neuroimaging findings in paediatric OCD after 6 months of CBT in the GM volume of the orbital frontal cortex are still present at 2-year follow-up. Key words: Obsessive–compulsive disorder, children, brain imaging, brain development, orbital frontal cortex Introduction Paediatric obsessive–compulsive disorder (OCD) is characterized by obsessions and compulsions which start in childhood and continue in half of the patients into adulthood (Kolada et al. 1994). It has been hypothesized that neurodevelopmental changes in frontal-striatal circuits underlie the psychopathology of OCD (Rosenberg and Keshavan 1998). Although neuroimaging data support this hypothesis, brain regions outside the frontal-striatal circuit also seem to be involved in OCD (Huyser et al. 2009). Evidence for neurodevelopmental effects on the pathophysiology of OCD comes from cross-sectional data. Age-related differences in regional brain vol- umes between paediatric OCD patients and healthy controls (HC) have been described for the anterior cingulate cortex (ACC; Rosenberg and Keshavan 1998), dorsolateral prefrontal cortex (DLPFC; Gilbert et al. 2004), thalamus (Gilbert et al. 2000), and corpus callosum (Rosenberg et al. 1997). Functional MRI, using a conflict paradigm, showed aged-related activation of rostral ACC in paediatric OCD patients but not in HC (Huyser et al. 2011). During typical development of the brain, grey matter (GM) volume follows an inverted U-shaped pattern over time with large regional variations (Gogtay et al. 2004). In contrast, white matter (WM) volume shows a more or less linear increase during development, related to the increase in connectivity and integration of disparate neural circuitries (Lenroot et al. 2007). These differential develop- mental curves of WM and GM shape the long-life intimate reciprocal interactions between neurons, glial cells, and myelin within the neural circuits (Giedd and Rapoport 2010). GM density reaches its peak first in the primary sensorimotor areas, Correspondence: Chaim Huyser, Child and Adolescent Psychiatrist, De Bascule, Postbox 303, 1115 ZG Duivendrecht, The Netherlands. Tel: 20 5663383. Fax: 20 8901010. E-mail: [email protected] (Received 28 February 2013; accepted 20 June 2013) The World Journal of Biological Psychiatry, 2013; Early Online: 1–10 ISSN 1562-2975 print/ISSN 1814-1412 online © 2013 Informa Healthcare DOI: 10.3109/15622975.2013.819122 World J Biol Psychiatry Downloaded from informahealthcare.com by 62.177.225.250 on 10/14/13 For personal use only.

Welcome message from author
This document is posted to help you gain knowledge. Please leave a comment to let me know what you think about it! Share it to your friends and learn new things together.
Transcript

ORIGINAL INVESTIGATION
A longitudinal VBM study in paediatric obsessive – compulsive disorder at 2-year follow-up after cognitive behavioural therapy
CHAIM HUYSER 1,2 , ODILE A. VAN DEN HEUVEL 3,4 , LIDEWIJ WOLTERS 1,2 , ELSE DE HAAN 1,2 , RAMON LINDAUER 1,2 & DICK J. VELTMAN 3
1 Department of Child and Adolescent Psychiatry, University of Amsterdam, AMC, Amsterdam, The Netherlands, 2 De Bascule, Academic Center Child and Adolescent Psychiatry, Amsterdam, The Netherlands, 3 Department of Psychiatry, VU University Medical Center, Amsterdam, The Netherlands, and 4 Department of Anatomy & Neurosciences, VU University Medical Center, Amsterdam, The Netherlands
Abstract Objectives. To identify neurodevelopmental differences in regional brain volume between medication-free paediatric obsessive – compulsive disorder (OCD) patients and controls at 2-year follow-up after cognitive behavioural therapy. Methods. We assessed 17 medication-free paediatric OCD patients (mean age 13.8 years; SD � 2.8; range 8.2 – 19.0) and 20 controls, matched on age and gender, with T1-weighted MR scans in a repeated measures design at three time points with intervals of 6 months and 2 years. Voxel based morphometry (VBM) was used to test whole brain voxel-wise for the effects of diagnosis and time on regional grey matter (GM) and white matter volumes. Results. GM volume of the orbitofrontal cortex showed a group � time interaction effect, driven by an increase of GM volume over the whole time period in OCD patients and a decrease in controls. When splitting the groups in two age groups (8 – 12 and 13 – 19 years) this interaction effect was only seen in the youngest age group. Conclusions. Neuroimaging fi ndings in paediatric OCD after 6 months of CBT in the GM volume of the orbital frontal cortex are still present at 2-year follow-up.
Key words: Obsessive – compulsive disorder , children , brain imaging , brain development , orbital frontal cortex
Introduction
Paediatric obsessive – compulsive disorder (OCD) is characterized by obsessions and compulsions which start in childhood and continue in half of the patients into adulthood (Kolada et al. 1994). It has been hypothesized that neurodevelopmental changes in frontal-striatal circuits underlie the psychopathology of OCD (Rosenberg and Keshavan 1998). Although neuroimaging data support this hypothesis, brain regions outside the frontal-striatal circuit also seem to be involved in OCD (Huyser et al. 2009).
Evidence for neurodevelopmental effects on the pathophysiology of OCD comes from cross-sectional data. Age-related differences in regional brain vol-umes between paediatric OCD patients and healthy controls (HC) have been described for the anterior cingulate cortex (ACC; Rosenberg and Keshavan 1998), dorsolateral prefrontal cortex (DLPFC;
Gilbert et al. 2004), thalamus (Gilbert et al. 2000), and corpus callosum (Rosenberg et al. 1997). Functional MRI, using a confl ict paradigm, showed aged-related activation of rostral ACC in paediatric OCD patients but not in HC (Huyser et al. 2011).
During typical development of the brain, grey matter (GM) volume follows an inverted U-shaped pattern over time with large regional variations (Gogtay et al. 2004). In contrast, white matter (WM) volume shows a more or less linear increase during development, related to the increase in connectivity and integration of disparate neural circuitries (Lenroot et al. 2007). These differential develop-mental curves of WM and GM shape the long-life intimate reciprocal interactions between neurons, glial cells, and myelin within the neural circuits (Giedd and Rapoport 2010). GM density reaches its peak fi rst in the primary sensorimotor areas,
Correspondence: Chaim Huyser, Child and Adolescent Psychiatrist, De Bascule, Postbox 303, 1115 ZG Duivendrecht, The Netherlands. Tel: � 20 5663383. Fax: � 20 8901010. E-mail: [email protected]
(Received 28 February 2013 ; accepted 20 June 2013 )
The World Journal of Biological Psychiatry, 2013; Early Online: 1–10
ISSN 1562-2975 print/ISSN 1814-1412 online © 2013 Informa HealthcareDOI: 10.3109/15622975.2013.819122
Wor
ld J
Bio
l Psy
chia
try
Dow
nloa
ded
from
info
rmah
ealth
care
.com
by
62.1
77.2
25.2
50 o
n 10
/14/
13Fo
r pe
rson
al u
se o
nly.

2 C. Huyser et al.
Methods
Subjects
Twenty-nine OCD patients (mean age � 13.78 years, SD � 2.58, range 8.2 – 19.0; 18 girls and 11 boys) were recruited from the outpatient depart-ment of our specialized centre for children and ado-lescents with OCD. Inclusion criteria were age between 8 and 19 years, diagnosis of OCD with a Yale – Brown Obsessive Compulsive Scale-Child ver-sion (CY-BOCS) score of at least 16 and OCD symptoms existing at least 6 months. Exclusion cri-teria were IQ below 80, use of psychotropic medica-tion in the past month, recent state of the art CBT, major comorbid psychiatric illness (Psychosis or bipolar disorders) or presence of metal in or at the body. Also, 29 controls, pair-wise matched for age and gender (mean age � 13.6 years, SD � 2.73, range 8.7 – 18.8; 18 girls and 11 boys), were recruited (for demographic characteristics, see Table I). Fol-lowing baseline measurements (T0), all patients were treated with 16 weekly sessions of protocolized CBT (Haan and Wolters 2009). Treatment sessions were conducted by trained and registered cognitive behavioural psychotherapists, who were supervised by the authors of the manual (EdH, LW), and con-sisted of exposure with response prevention and cognitive therapy suited to the needs of the patients. After 16 sessions of CBT patients ( N � 26) were rescanned (T1); controls ( N � 27) were also res-canned after a similar time period.
After 2 years naturalistic follow-up 19 patients and 20 controls were rescanned (T2), two scans of the patients had to be discarded because of technical problems (ghosting and movement artifacts). Between post-CBT (T1) and follow up (T2) eight out of 17 patients continued with CBT sessions (mean number of sessions 10.6, SD 15.8, range 6 – 43) of whom four patients got medication as well (two sertraline, one clomipramine and one risperidon).
From the seven patients who dropped out at 2-year follow-up, two had braces, the other fi ve refused res-canning. The seven controls who dropped out either refused (fi ve) or had braces (two).
The study was approved by the Ethical Committee of the Academic Medical Center in Amsterdam (MEC 06/053#06.17.0749) and all patients, controls and their parents gave written informed consent.
Measurements
Diagnostic assessments were performed by senior clinicians using a semi-structured interview (Anxiety and Depression Inventory Schedule, Child and Parents ’ version (ADIS C/P; Silverman WK 1996). OCD symptoms and severity were investigated with
whereas higher-order association areas such as the dorsolateral prefrontal cortex, inferior parietal, and superior temporal gyrus, show their peak in GM density at a later age (Sowell et al. 2004). The cau-date nucleus, which also follows an inverted U-shaped developmental trajectory, and which is extensively connected to the prefrontal cortex, shows the same relatively late peak (Lenroot et al. 2007).
Aberrant developmental trajectories have been reported in several neurodevelopmental disorders. For example, longitudinal studies in ADHD report that the median age by which 50% of the investi-gated cortical regions attained peak thickness was 10.5 years for ADHD compared to 7.5 years for healthy controls (HC). The area with the greatest age difference was the middle prefrontal cortex, reaching peak thickness at 10.9 years in children with ADHD and 5.9 years in HC (Shaw et al. 2007). In autism, a large longitudinal study reported an early period of brain overgrowth followed by slowed growth in later childhood during which brain volume of controls catches up with autistic children (Courchesne et al. 2011). In childhood onset schizophrenia, progressive cortical GM loss during adolescence (Thompson et al. 2001), and delayed white matter development (Gogtay et al. 2008) have been found. In OCD, however, such longitudinal data are lacking. These fi ndings of aberrant developmental trajectories in psychiatric disorders may be regarded as either the underlying aetiological factor or as the plastic response to the disorder (Giedd and Rapoport 2010).
We recently reported increased volume of orbito-frontal GM and striatal WM after 6 months of cog-nitive behavioural therapy (CBT) in paediatric OCD (Huyser et al. 2012). These fi ndings sug-gested the involvement of frontal-striatal circuits in OCD and their plasticity in response to CBT. We conjectured that the OFC enlargement after CBT in OCD children might be explained as a compen-satory mechanism triggered by CBT against a back-ground of altered development of the more dorsal prefrontal regions.
The current prospective longitudinal study inves-tigates the development of regional brain volumes at 2-year follow-up. We hypothesized that the increase in orbitofrontal GM and striatal WM volumes after CBT would sustain at follow-up and relate to the course of disease. Considering the literature in other neurodevelopmental disorders such as ADHD and autism, showing aberrant trajectories in brain matu-ration, we expected different age-related time effects, later maturation effects in paediatric OCD patients compared to HC at 2-year follow-up.
Wor
ld J
Bio
l Psy
chia
try
Dow
nloa
ded
from
info
rmah
ealth
care
.com
by
62.1
77.2
25.2
50 o
n 10
/14/
13Fo
r pe
rson
al u
se o
nly.

Follow up VBM study in paediatric OCD 3
coronal three-dimensional gradient-echo T1-weighted sequence (fl ip angle 8 ° , repetition time � 9.69 ms; echo time � 4.60 ms, 182 slices, 256 � 256 pixels, voxel size 1 � 1 � 1.2 mm, fi eld of view 218 � 256 � 256 mm).
Data analysis
Demographic and clinical data were analyzed in SPSS (19.0), using two-way repeated measures ANOVA to examine time effects and two sample t -tests for comparisons at each time point. The level of signifi cance was set at P � 0.05 (two-tailed).
Imaging data were analyzed using Statistical Parametric Mapping software (SPM8, Wellcome Trust Centre for Neuroimaging, London, UK) implemented in Matlab 7.4.0. (Mathworks, Nattick, MA, USA). We used the VBM8 toolbox (http://dbm.neuro.uni-jena.de/vbm8/) with the longitudinal data approach batch.
After quality evaluation of the data, we manually reoriented the images to the anterior commissure. The VBM8 longitudinal batch has specifi c prepro-cessing steps for longitudinal data: each subject ’ s data is registered to the baseline image (or mean image) and spatial normalization parameters are estimated for the baseline image only and applied to all images (see Supplementary data Figure 1 available online at http://informahealthcare.com/doi/abs/10.3109/15622975.2013.819122). We used the
the CY-BOCS (Scahill et al. 1997) by one of the investigators (LHW). Depression and anxiety symp-toms were rated using the Childhood Depression Inventory (CDI; Kovacs 1985) and the State Trait Anxiety Inventory for children (STAI-C; Spielberger et al. 1973), respectively. Child Behavioural Check-list (CBCL; Achenbach and Edelbrock 1983) ratings were obtained to assess overall functioning and the OC scale (Nelson et al. 2001) derived from the CBCL was calculated to control for OCD symptoms in controls. Intelligence was assessed with the WISC-IV (Wechsler 2003) (age � 17) or WAIS (Wechsler 1997) (age � 17) with two subtests: block design and vocabulary. Since patients and controls were matched for age, the same numbers of patients and controls were assessed with either the WISC IV or the WAIS. Controls were screened for psychopa-thology using the CBCL, STAI-C and CDI. At rescanning (T1 and T2), the STAI-C state and CDI were again administered to all subjects, and the CY-BOCS to patients only.
MRI data acquisition
Imaging was performed on a 3.0 Tesla Intera MR system (Philips Medical Systems, Best, The Netherlands) with a six-channel SENSE head coil. Head immobilization was established using foam pads inside the coil. Anatomical imaging included a
Table I. Demographic and clinical characteristics of OCD patients and healthy controls.
Measurements Patients N � 17 Controls N � 20
Age Mean � 13.8, SD � 2.8 Range 8.2 – 19.0
Mean � 14.6, SD � 2.6 Range 8.7 – 18.8
Gender (f:m) 12:5 14:6Intelligence (WISC IV), T0 Block design 10.0 SD 2.6
Vocabulary 10.4 SD 2.1Block design 11.0 SD 2.8 Vocabulary 11.9 SD 1.5 §
Psychopathology (CBCL), T0 Internalizing 20,7 SD 8.2 Externalizing 13.4 SD 8.1 Total score 60,9 SD 19.5 OCS scale 9.8 SD 3.2
Internalizing 2,2 SD 2.8 † Externalizing 2.0 SD 2.5 † Total score 7.3 SD 7.1 † OCS scale 0.4 SD 0.6 †
Depression (CDI) T0 11.5 SD 6.5 T1 9.5 SD 6.8 T2 8.7 SD 7.2
4.8 SD 3.7 ‡
5.0 SD 3.8 5 § Anxiety (STAI-C) Trait T0 34.1 SD 6.5
State T0 33.7 SD 6.4 State T1 29.9 SD 4.2 State T2 30.3 SD 1.8 Trait T2 32.1 SD 9.9
Trait T0 27.2 SD 3.9 † State T0 29.3 SD 2.9 ‡ State T1 28.6 SD 2.9 State T2 32.3 SD 2.5 § Trait T2 25.2 SD 5.6 §
Time between scans T0T1 T1T2 T0T2
6.0 months (1.2) 24.1 months (1.2) 30.3 months (3.6)
6.2 months (1.7) 24.4 months (3.9) 30.6 months (3.6)
WISC-IV, Wechsler Intelligence Scale for Children; CBCL, Child Behavior Checklist; OCS scale, Obsessive – Compulsive Symptom Scale; CDI, Child Depression Inventory; STAI, State and Trait Anxiety Inventory. † P � 0.001; ‡ P � 0.01; § P � 0.05 patients vs. control subjects.
Wor
ld J
Bio
l Psy
chia
try
Dow
nloa
ded
from
info
rmah
ealth
care
.com
by
62.1
77.2
25.2
50 o
n 10
/14/
13Fo
r pe
rson
al u
se o
nly.

4 C. Huyser et al.
were made using a comparison-specifi c explicit opti-mal threshold GM and WM mask created using the Masking toolbox (Ridgway et al. 2009) in SPM8.
To analyse treatment effects we performed a repeated measures ANOVA with group as a between subjects factor and time as a within subject factor, separately for GM and WM. We performed a two sample t -test for comparison of patients and controls before (T0), after treatment (T1) or follow up (T2) and compared T0, T1 and T2 within group (patients or controls), separately for GM and WM. CY-BOCS scores were correlated separately with regional GM and WM volumes at the different time points using multiple regression analysis. Change in CY-BOCS scores (delta CY-BOCS) were correlated with change in GM and WM volume between T0 and T2 (images were calculated
“ modulated normalized ” and “ non-linear only ” options, resulting in tissue class images in alignment with the template, in which the voxel values are multiplied by the non linear components only. This allows comparing the absolute amount of tissue corrected for individual brain sizes. We used the TOM8 toolbox ( HYPERLINK “https://irc.cchmc.org/software/tom.php” https://irc.cchmc.org/software/tom.php) to customize the tissue probability maps for our age group. Before entering in the statistical analysis all images were smoothed using an 8-mm Gaussian kernel.
Data were analysed in the context of the General Linear Model of SPM8. To achieve maximal sensitiv-ity, to optimize voxel residual smoothness estima-tion, and to exclude false positives arising from non-GM or non-WM tissue, voxel-wise comparisons
Figure 1. (A) Volume changes of GM over time: Interaction effect for group over time in orbitofrontal cortex (cross-hairs) in a sagittal, coronal and axial plane. Volumes are shown at a P � 0.001 uncorrected with an extent threshold of 50 voxels. (B) GM volume of OFC in OCD and HC at the three different time points. Notice: X -axis at Y � 0.55. (C) GM Volume of OFC when split in two age groups (8 – 12 and 13 – 18 years) it becomes clear that the effects are only signifi cant in the younger age groups. Notice: X -axis at Y � 0.6.
Wor
ld J
Bio
l Psy
chia
try
Dow
nloa
ded
from
info
rmah
ealth
care
.com
by
62.1
77.2
25.2
50 o
n 10
/14/
13Fo
r pe
rson
al u
se o
nly.
Follow up VBM study in paediatric OCD 5
Results
The groups did not differ with respect to age, sex ratio, and handedness as listed in Table I. Intelligence scores on vocabulary but not on block design were signifi cantly higher for controls although all scores were within the normal range. Ratings on the OC scale of the CBCL, on the STAI (anxiety) and the CDI (depression) were signifi cantly higher in patients than in controls. After treatment STAI scores in OCD patients were no longer signifi cantly different from those in HC and at 2-year follow-up state anxiety scores were even slightly higher in controls.
Patients who dropped out at 2-year follow-up ( n � 9) did not differ from included patients on age, gender, symptom severity, and change in symptom severity after CBT ( P � 0.05).
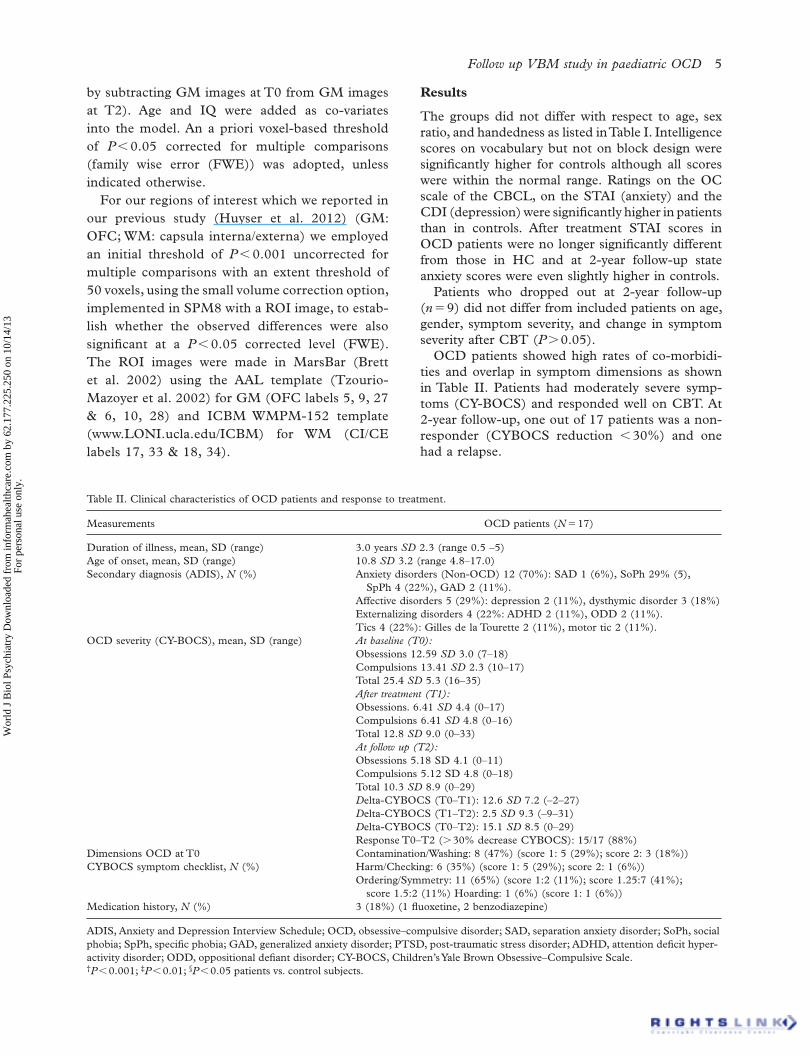
OCD patients showed high rates of co-morbidi-ties and overlap in symptom dimensions as shown in Table II. Patients had moderately severe symp-toms (CY-BOCS) and responded well on CBT. At 2-year follow-up, one out of 17 patients was a non-responder (CYBOCS reduction � 30%) and one had a relapse.
by subtracting GM images at T0 from GM images at T2). Age and IQ were added as co-variates into the model. An a priori voxel-based threshold of P � 0.05 corrected for multiple comparisons (family wise error (FWE)) was adopted, unless indicated otherwise.
For our regions of interest which we reported in our previous study (Huyser et al. 2012) (GM: OFC; WM: capsula interna/externa) we employed an initial threshold of P � 0.001 uncorrected for multiple comparisons with an extent threshold of 50 voxels, using the small volume correction option, implemented in SPM8 with a ROI image, to estab-lish whether the observed differences were also signifi cant at a P � 0.05 corrected level (FWE). The ROI images were made in MarsBar (Brett et al. 2002) using the AAL template (Tzourio-Mazoyer et al. 2002) for GM (OFC labels 5, 9, 27 & 6, 10, 28) and ICBM WMPM-152 template ( www.LONI.ucla.edu/ICBM ) for WM (CI/CE labels 17, 33 & 18, 34).
Table II. Clinical characteristics of OCD patients and response to treatment.
Measurements OCD patients ( N � 17)
Duration of illness, mean, SD (range) 3.0 years SD 2.3 (range 0.5 – 5)Age of onset, mean, SD (range) 10.8 SD 3.2 (range 4.8 – 17.0)Secondary diagnosis (ADIS), N (%) Anxiety disorders (Non-OCD) 12 (70%): SAD 1 (6%), SoPh 29% (5),
SpPh 4 (22%), GAD 2 (11%). Affective disorders 5 (29%): depression 2 (11%), dysthymic disorder 3 (18%) Externalizing disorders 4 (22%: ADHD 2 (11%), ODD 2 (11%). Tics 4 (22%): Gilles de la Tourette 2 (11%), motor tic 2 (11%).
OCD severity (CY-BOCS), mean, SD (range) At baseline (T0): Obsessions 12.59 SD 3.0 (7 – 18) Compulsions 13.41 SD 2.3 (10 – 17) Total 25.4 SD 5.3 (16 – 35) After treatment (T1): Obsessions. 6.41 SD 4.4 (0 – 17) Compulsions 6.41 SD 4.8 (0 – 16) Total 12.8 SD 9.0 (0 – 33) At follow up (T2): Obsessions 5.18 SD 4.1 (0 – 11) Compulsions 5.12 SD 4.8 (0 – 18) Total 10.3 SD 8.9 (0 – 29) D elta-CYBOCS (T0 – T1): 12.6 SD 7.2 ( – 2 – 27) D elta-CYBOCS (T1 – T2): 2.5 SD 9.3 ( – 9 – 31) D elta-CYBOCS (T0 – T2): 15.1 SD 8.5 (0 – 29) Response T0 – T2 ( � 30% decrease CYBOCS): 15/17 (88%)
Dimensions OCD at T0 CYBOCS symptom checklist, N (%)
Contamination/Washing: 8 (47%) (score 1: 5 (29%); score 2: 3 (18%)) Harm/Checking: 6 (35%) (score 1: 5 (29%); score 2: 1 (6%)) Ordering/Symmetry: 11 (65%) (score 1:2 (11%); score 1.25:7 (41%);
score 1.5:2 (11%) Hoarding: 1 (6%) (score 1: 1 (6%))Medication history, N (%) 3 (18%) (1 fl uoxetine, 2 benzodiazepine)
ADIS, Anxiety and Depression Interview Schedule; OCD, obsessive – compulsive disorder; SAD, separation anxiety disorder; SoPh, social phobia; SpPh, specifi c phobia; GAD, generalized anxiety disorder; PTSD, post-traumatic stress disorder; ADHD, attention defi cit hyper-activity disorder; ODD, oppositional defi ant disorder; CY-BOCS, Children ’ s Yale Brown Obsessive – Compulsive Scale. † P � 0.001; ‡ P � 0.01; § P � 0.05 patients vs. control subjects.
Wor
ld J
Bio
l Psy
chia
try
Dow
nloa
ded
from
info
rmah
ealth
care
.com
by
62.1
77.2
25.2
50 o
n 10
/14/
13Fo
r pe
rson
al u
se o
nly.

6 C. Huyser et al.
Z � 4.10, MNI 5, 29, – 20) (Figure 1a). Further analysis revealed that this interaction effect was driven by a volume increase in OCD patients and a volume decrease in HC, most prominent between T1 and T2 (see Figure 1b). There were no signifi cant whole-brain group � time interaction effects.
Controlling for age as a covariate did not change the effect ( Z � 4.0). In a post-hoc analysis, we found a trend for a negative correlation of age and change in GM between T1 and T2 of the OFC in patients ( r � – 0.476 sig. (two-tailed) P � 0.53). Splitting the groups on the basis of age (8 – 12 and 13 – 19 years) the group � time interaction effect for OFC volume remained signifi cant only in the younger age group ( k e 42, p FWE/SVC 0.011, Z � 3.67, MNI 6, 32, � 20), not in the older age group (Figure 1C).
OCD severity (CYBOCS scores) did not corre-late with regional GM volume at follow-up and changes in OCD severity (delta-CYBOCS) did not correlate with changes in GM volume between the time points.
Regional white matter
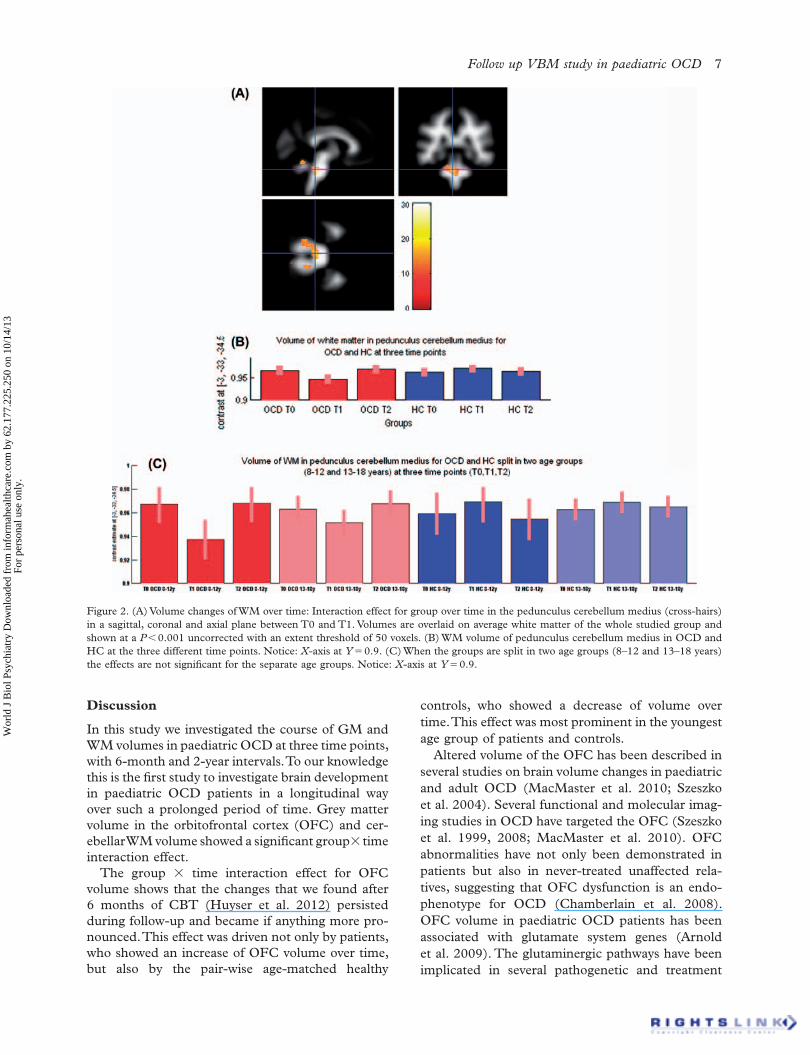
The repeated measure ANOVA revealed no interac-tion effect for our WM ROI, i.e. capsula interna and externa. However we did fi nd a whole-brain FWE-corrected signifi cant group � time interaction effect in the cerebellum (pedunculus cerebellaris medius) for the T0 – T1 interval ( k e 1284, p FWEcorr 0.011, Z � 5.02, MNI – 3 – 33 – 35) and for the T1 – T2 inter-val ( k e 2605, p FWEcorr 0.004, Z � 5.24, MNI – 3 – 33 – 35), but not for the T0 – T2 interval. Further explo-ration revealed that this effect was driven by a decrease of volume during the T0 – T1 interval and an increase of volume during the T1 – T2 interval in OCD patients relative to HC (see Figure 2AB). In a post hoc analysis, when we split the groups on the basis of age (8 – 12 and 13 – 19 years), this interaction effect group � time between T0 – T1 and T1 – T2 was for separate age groups no longer signifi cant (Figure 2C). OCD severity did not correlate with regional WM volume and changes in OCD severity did not correlate with changes in WM volume between the time points.
Global volumes
Volume of total GM, total WM and total brain volume (GM � WM � CSF) did not signifi cantly dif-fer between groups at any time point (see Table III). Repeated measures GLM on total brain volume showed a signifi cant increase of volume over time ( F � 9.681, P � 0.001) but no group � time interac-tion effect. When introducing gender, age and intel-ligence into the repeated measures GLM model as a covariate, there was a trend-signifi cant increase of total volume over time ( F � 3.387, P � 0.056) and a signifi cant effect for gender � time ( F � 3.631, P � 0.039), driven by more increase of volume over time in girls compared to boys, and age � time ( F � 5.779, P � 0.008), driven by more increase of volume over time at the younger age. There was no signifi cant intelligence (WISC Vocabulary) � time effect ( F � 0.866, P � 0.431).
For total GM volume, repeated measures GLM showed a trend-signifi cant effect of time ( F � 3.09, P � 0.052), but no group � time interaction effect ( F � 2.380, P � 0.103). When introducing gender, age and intelligence into the model as a covariate, the effect of time was no longer signifi cant ( F � 1.828, P � 0.178), but the effect of age � time was signifi -cant ( F � 4.837, P � 0.015), driven by more increase of volume over time at the younger age. There was no signifi cant gender � time ( F � 2.554, P � 0.095) or intelligence � time ( F � 0.466, P � 0.632) effect.
For total WM volume there was a strong effect of time ( F � 36.78, P � 0.001), but no group � time interaction effect ( F � 1.086, P � 3.343). When intro-ducing gender, age and intelligence into the model as a covariate, there was no longer an effect of time ( F � 1.077, P � 0.353), but a signifi cant effect for age � time ( F � 3.807, P � 0.034), driven by more increase of volume over time at the younger age. There was no signifi cant gender � time ( F � 0.882, P � 0.424) or intelligence � time ( F � 1.641, P � 0.211) effect.
Regional grey matter volume
The repeated measure ANOVA revealed a group � time interaction effect in our GM ROI, i.e. the orbitofrontal cortex (OFC) ( k e 84, p FWE/SVC 0.002,
Table III. Totals of global volumes at different time points in ml (SD).
OCD T0 OCD T1 OCD T2 HC T0 HC T1 HC T2
Total GM 695,16(47,04)
695,75 (48,03)
702,27 (49,46)
726,03 (60,65)
725,72 (59,49)
726,34 (59,62)
Total WM 464,42 (34,39)
466,57 (34,45)
474,99 (37,51)
482,06 (45,07)
484,13 (46,28)
489,74 (44,99)
Total brain volume 1455,31 (104,41)
1459,33 (104,43)
1477,03 (111,19)
1513,81 (125,84)
1517,65 (125,74)
1523,65(123,54)
Wor
ld J
Bio
l Psy
chia
try
Dow
nloa
ded
from
info
rmah
ealth
care
.com
by
62.1
77.2
25.2
50 o
n 10
/14/
13Fo
r pe
rson
al u
se o
nly.
Follow up VBM study in paediatric OCD 7
controls, who showed a decrease of volume over time. This effect was most prominent in the youngest age group of patients and controls.
Altered volume of the OFC has been described in several studies on brain volume changes in paediatric and adult OCD (MacMaster et al. 2010; Szeszko et al. 2004). Several functional and molecular imag-ing studies in OCD have targeted the OFC (Szeszko et al. 1999, 2008; MacMaster et al. 2010). OFC abnormalities have not only been demonstrated in patients but also in never-treated unaffected rela-tives, suggesting that OFC dysfunction is an endo-phenotype for OCD (Chamberlain et al. 2008). OFC volume in paediatric OCD patients has been associated with glutamate system genes (Arnold et al. 2009). The glutaminergic pathways have been implicated in several pathogenetic and treatment
Discussion
In this study we investigated the course of GM and WM volumes in paediatric OCD at three time points, with 6-month and 2-year intervals. To our knowledge this is the fi rst study to investigate brain development in paediatric OCD patients in a longitudinal way over such a prolonged period of time. Grey matter volume in the orbitofrontal cortex (OFC) and cer-ebellar WM volume showed a signifi cant group � time interaction effect.
The group � time interaction effect for OFC volume shows that the changes that we found after 6 months of CBT (Huyser et al. 2012) persisted during follow-up and became if anything more pro-nounced. This effect was driven not only by patients, who showed an increase of OFC volume over time, but also by the pair-wise age-matched healthy
Figure 2. (A) Volume changes of WM over time: Interaction effect for group over time in the pedunculus cerebellum medius (cross-hairs) in a sagittal, coronal and axial plane between T0 and T1. Volumes are overlaid on average white matter of the whole studied group and shown at a P � 0.001 uncorrected with an extent threshold of 50 voxels. (B) WM volume of pedunculus cerebellum medius in OCD and HC at the three different time points. Notice: X -axis at Y � 0.9. (C) When the groups are split in two age groups (8 – 12 and 13 – 18 years) the effects are not signifi cant for the separate age groups. Notice: X -axis at Y � 0.9.
Wor
ld J
Bio
l Psy
chia
try
Dow
nloa
ded
from
info
rmah
ealth
care
.com
by
62.1
77.2
25.2
50 o
n 10
/14/
13Fo
r pe
rson
al u
se o
nly.

8 C. Huyser et al.
ethical considerations. In the present study, regional brain volume changes were mainly observed in the younger (8 – 12 years) subgroup, which presumably should also be regarded in light of typical brain development. Cortical grey matter volume tends to follow an “ inverted U ” developmental course with volumes peaking at different times in different lobes. Frontal lobe grey matter reaches its maximal volume at 11.0 years in girls and 12.1 years in boys (Giedd et al. 1999). In the 8 – 12-years age group, brain plas-ticity is at its peak and interaction effects between typical and atypical development are likely to become most prominent.
The observed changes of regional OFC GM vol-ume could thus point at age-specifi c defects, that is, defects present at younger ages may not be present at older ages and vice versa, as has been demon-strated in autism (Courchesne et al. 2011). In autism, increased whole-brain volume apparently due to increased growth during early postnatal life is fol-lowed by a growth deceleration at later stages, changes in the frontal lobes being most prominent. In our study we did not fi nd any whole-brain volume differences but only more subtle regional frontal lobe grey matter differences compared with typical devel-oping children. Another explanation than age spe-cifi c defects could be a delay of maturation of the cerebrum, as demonstrated in ADHD (Shaw et al. 2007). In OCD in particular, a delay of maturation of the orbitofrontal regions would then explain the reported group � age effects.
In the current study, we were unable to observe at follow up a WM volume increase in bilateral stria-tum, as was present after CBT (Huyser et al. 2012). Presumably, this can be explained by a power prob-lem due to the smaller sample size at follow up. How-ever, we did fi nd an interaction effect in the WM of the pedunculus cerebellum medius where we found a decrease of volume after CBT which normalized at follow up. The cerebellum supposedly has a role in the control of thought, emotions, and other human intellectual functions in a fashion that is comparable to its implication in the control of movement (Vil-lanueva 2012). Theoretically, these functions can be linked with obsessions and compulsions. However, we have to be cautious with interpreting this result since it was neither found in our earlier study nor in other studies on paediatric OCD.
The current study is not without limitations. First, the rescanned patient sample is relatively small which did not allow for further investigations in symptom dimensions. Secondly, this is a naturalistic follow-up, some patients received still some CBT sessions or got medicated, hampering differentiation of treat-ment effects from developmental effects. Thirdly, we only included OCD patients and controls but no
models for paediatric OCD (MacMaster et al. 2008), and our fi nding of aberrant OFC development fi ts these hypotheses.
Treatment studies in OCD showed increased activity of the OFC after cognitive behavioural ther-apy or medication in OCD patients (Brody et al. 1998; Saxena et al. 1999; Zurowski et al. 2012). The OFC plays a key role in emotion processing, by rep-resenting the goals for action (Rolls 2004). Evans et al. (2004) speculated on the role of the OFC dur-ing typical development and the association with compulsive-like behaviours and the neurobiology of OCD. Our results support this relationship of aber-rant OFC development and obsessive – compulsive behaviour.
We also demonstrated that group differences are most pronounced at a younger age, indicating aber-rant brain development in OCD patients early in life. Rosenberg and Keshevan (1998) suggested that a developmentally mediated network dysplasia may underlie OCD. Such dysplasia in ventral prefrontal cortical circuits could become manifest clinically by disrupting brain functions subserving purposeful behaviours as seen in compulsive behaviours.
Our fi nding of an increase of OFC volume after CBT and a further increase after follow-up raises the question whether this change is the sustained effect of CBT or a developmental characteristic indepen-dent from treatment. In our previous study (Huyser et al. 2012) we did fi nd a correlation between the change in symptom severity and change of GM vol-ume. We suggested that this association could be due to the effect of CBT. However, we could not replicate this correlation at follow-up, probably due to power problems. The design of the study does not allow to distinguish between treatment effects and neurode-velopmental differences between groups since we did not include a untreated OCD group. The sustained OFC volume increase during follow-up in patients, as found in the current study, seems to point to a differential maturation of OFC in paediatric OCD compared to controls, most prominent at early age. This conclusion is supported by our fi nding that the group � time effect was partly driven by a decrease of OFC volume over time in healthy controls, which is in line with fi ndings of studies in typical brain development in which prefrontal regions decrease in volume during middle and late adolescence (Giedd and Rapoport 2010).
A third explanation could be that CBT and neu-rodevelopment interact with each other and that change in symptom severity enhances certain devel-opmental pathways in paediatric OCD patients. However this question can only be answered defi ni-tively if a non-treated paediatric OCD group would be included in a longitudinal design, which raises
Wor
ld J
Bio
l Psy
chia
try
Dow
nloa
ded
from
info
rmah
ealth
care
.com
by
62.1
77.2
25.2
50 o
n 10
/14/
13Fo
r pe
rson
al u
se o
nly.

Follow up VBM study in paediatric OCD 9
and adolescence: a longitudinal MRI study . Nat Neurosci 2 : 861 – 863 .
Giedd JN , Rapoport JL . 2010 . Structural MRI of pediatric brain development: what have we learned and where are we going? Neuron 67 : 728 – 734 .
Gilbert AR , Keshavan MS , Birmahamer B , Nutche B , Rosenberg DR . 2004 . Abnormal brain maturational trajectory in pediatric obsessive compulsive disorder: a pilot voxel-based morphometry study . Clin EEG Neurosci 35 : 223 .
Gilbert AR , Moore GJ , Keshavan MS , Paulson LA , Narula V , Mac Master FP , et al . 2000 . Decrease in thalamic volumes of pediatric patients with obsessive-compulsive disorder who are taking paroxetine . Arch Gen Psychiatry 57 : 449 – 456 .
Gogtay N , Giedd JN , Lusk L , Hayashi KM , Greenstein D , Vaituzis AC , et al . 2004 . Dynamic mapping of human cortical development during childhood through early adulthood . Proc Natl Acad Sci USA 101 : 8174 – 8179 .
Gogtay N , Lu A , Leow AD , Klunder AD , Lee AD , Chavez A , et al . 2008 . Three-dimensional brain growth abnormalities in childhood-onset schizophrenia visualized by using tensor-based morphometry . Proc Natl Acad Sci USA 105 : 15979 – 15984 .
Haan Ed , Wolters LH . 2009 . Behandeling van de dwangstoornis bij kinderen en adolescenten, Bedwing je dwang (Treatment of the obsessive compulsive disorder in children and adolescents, “ Tame your obsessions and compulsions ” ) . Houten, The Netherlands: Bohn Stafl eu van Loghum .
Huyser C , van den Heuvel OA , Wolters LH , Haan Ed , Boer F , Veltman DJ . 2012 . Increased orbital frontal gray matter volume after cognitive behavioral therapy in pediatric obsessive com-pulsive disorder . World J Biol Psych [Early online] , 1 – 13 .
Huyser C , Veltman DJ , Haan Ed , Boer F . 2009 . Paediatric obsessive-compulsive disorder, a neurodevelopmental disorder? Evidence from neuroimaging. Neurosci Biobehav Rev 33 : 818 – 830 .
Huyser C , Veltman DJ , Wolters LH , de HE , Boer F . 2011 . Developmental aspects of error and high-confl ict-related brain activity in pediatric obsessive-compulsive disorder: a fMRI study with a Flanker task before and after CBT . J Child Psychol Psychiatry 52 : 1251 – 1260 .
Kolada JL , Bland RC , Newman SC . 1994 . Epidemiology of psychiatric disorders in Edmonton . Obsessive-compulsive disorder. Acta Psychiatr Scand Suppl 376 : 24 – 35 .
Kovacs M . 1985 . The Children ’ s Depression, Inventory (CDI) . Psychopharmacol Bull 21(4) : 995 – 998 .
Lenroot RK , Gogtay N , Greenstein DK , Wells EM , Wallace GL , Clasen LS , et al . 2007 . Sexual dimorphism of brain deve-lopmental trajectories during childhood and adolescence . Neuroimage 36 : 1065 – 1073 .
MacMaster FP , O ’ Neill J , Rosenberg DR . 2008 . Brain imaging in pediatric obsessive-compulsive disorder . J Am Acad Child Adolesc Psychiatry 47 : 1262 – 1272 .
MacMaster FP , Vora A , Easter P , Rix C , Rosenberg D . 2010 . Orbital frontal cortex in treatment-naive pediatric obsessive-compulsive disorder . Psychiatry Res 181 : 97 – 100 .
Nelson EC , Hanna GL , Hudziak JJ , Botteron KN , Heath AC , Todd RD . 2001 . Obsessive-compulsive scale of the child behavior checklist: specifi city, sensitivity, and predictive power . Pediatrics 108 : E14 .
Ridgway GR , Omar R , Ourselin S , Hill DL , Warren JD , Fox NC . 2009 . Issues with threshold masking in voxel-based morphom-etry of atrophied brains . Neuroimage 44 : 99 – 111 .
Rolls ET . 2004 . The functions of the orbitofrontal cortex . Brain Cogn 55 : 11 – 29 .
Rosenberg DR , Keshavan MS . 1998 . A.E. Bennett Research Award. Toward a neurodevelopmental model of of obsessive—compulsive disorder. Biol Psychiatry 43 : 623 – 640 .
other patients groups, so the specifi city of our fi nd-ings is unclear. Also we had no OCD group without CBT treatment which hampers to distinguish between effects of CBT or abnormal development, however this is ethically not feasible. May be future studies could incorporate a patient group treated with medication or age matched untreated OCD patients at each time point (cross-sectional). Finally, our ROI results were only signifi cant after a small volume correction. Although this is an accepted method for hypothesis-driven analyses, it may increase the risk of type I errors, so that replication in a larger group is commendable.
Notwithstanding these limitations, the present results underscore the hypothesis of differential neu-rodevelopment in children with OCD, involving the ventral frontal and cerebellar regions and show that these changes after 6 months of treatment can be found 2 years later.
Acknowledgements
This study was supported by the University of Amsterdam and by Amsterdam Brain Imaging Platform (ABIP).
Statement of Interest
None to declare.
References
Achenbach TM , Edelbrock CS . 1983. Manual for the Child Behavior Checklist and Revised Child Behavior Profi le Ed. University of Vermont .
Arnold PD , MacMaster FP , Hanna GL , Richter MA , Sicard T , Burroughs E , et al . 2009 . Glutamate system genes associated with ventral prefrontal and thalamic volume in pediatric obsessive-compulsive disorder . Brain Imaging Behav 3 : 64 – 76 .
Brett M , Anton JL , Valabregue R , Poline JB . 2002 . Region of interest analysis using a SPM toolbox . Neuroimage 16 : 2 – 6 .
Brody AL , Saxena S , Schwartz JM , Stoessel PW , Maidment K , Phelps ME , Baxter LR Jr . 1998 . FDG-PET predictors of response to behavioral therapy and pharmacotherapy in obses-sive compulsive disorder . Psychiatry Res 84 : 1 – 6 .
Chamberlain SR , Menzies L , Hampshire A , Suckling J , Fineberg NA , del Campo N , et al . 2008 . Orbitofrontal dysfunc-tion in patients with obsessive-compulsive disorder and their unaffected relatives . Science 321 : 421 – 422 .
Courchesne E , Campbell K , Solso S . 2011 . Brain growth across the life span in autism: age-specifi c changes in anatomical pathology . Brain Res 1380 : 138 – 145 .
Evans DW , Lewis MD , Iobst E . 2004 . The role of the orbito-frontal cortex in normally developing compulsive-like behav-iors and obsessive-compulsive disorder . Brain Cogn 55 : 220 – 234 .
Giedd JN , Blumenthal J , Jeffries NO , Castellanos FX , Liu H , Zijdenbos A , et al . 1999 . Brain development during childhood
Wor
ld J
Bio
l Psy
chia
try
Dow
nloa
ded
from
info
rmah
ealth
care
.com
by
62.1
77.2
25.2
50 o
n 10
/14/
13Fo
r pe
rson
al u
se o
nly.
10 C. Huyser et al.
disorder: an optimized voxel-based morphometry study . Am J Psychiatry 165 : 1299 – 1307 .
Szeszko PR , MacMillan S , McMeniman M , Chen S , Baribault K , Lim KO , Ivey J , Rose M , Banerjee SP , Bhandari R , Moore GJ , Rosenberg DR . 2004 . Brain structural abnormalities in psycho-tropic drug-naive pediatric patients with obsessive-compulsive disorder . Am J Psychiatry 161 : 1049 – 1056 .
Szeszko PR , Robinson D , Alvir JM , Bilder RM , Lencz T , Ashtari M , et al . 1999 . Orbital frontal and amygdala volume reductions in obsessive-compulsive disorder . Arch Gen Psychiatry 56 : 913 – 919 .
Thompson PM , Vidal C , Giedd JN , Gochman P , Blumenthal J , Nicolson R , et al . 2001 . Mapping adolescent brain change reveals dynamic wave of accelerated gray matter loss in very early-onset schizophrenia . Proc Natl Acad Sci USA 98 : 11650 – 11655 .
Tzourio-Mazoyer N , Landeau B , Papathanassiou D , Crivello F , Etard O , Delcroix N , et al . 2002 . Automated anatomical labe-ling of activations in SPM using a macroscopic anatomical parcellation of the MNI MRI single-subject brain . Neuroimage 15 : 273 – 289 .
Villanueva R . 2012 . The cerebellum and neuropsychiatric disorders . Psychiatry Res 198 : 527 – 532 .
Wechsler D . 1997 . Manual for the Wechsler Adult Intelligence Scale. 3rd ed . San Antonio, TX: The Psychological Corporation .
Wechsler D . 2003 . Wechsler Intelligence Scale for Children. 4th ed. San Antonio, TX: The Psychological Corporation .
Zurowski B , Kordon A , Weber-Fahr W , Voderholzer U , Kuelz AK , Freyer T , et al . 2012 . Relevance of orbitofrontal neurochemistry for the outcome of cognitive-behavioural therapy in patients with obsessive-compulsive disorder . Eur Arch Psychiatry Clin Neurosci 262 : 617 – 624 .
Rosenberg DR , Keshavan MS , Dick EL , Bagwell WW , MacMaster FP , Birmaher B . 1997 . Corpus callosal mor-phology in treatment-naive pediatric obsessive compulsive disorder . Prog Neuropsychopharmacol Biol Psychiatry 21 : 1269 – 1283 .
Saxena S , Brody AL , Maidment KM , Dunkin JJ , Colgan M , Alborzian S , Phelps ME , Baxter LR Jr . 1999 . Localized orbitofrontal and subcortical metabolic changes and predictors of response to paroxetine treatment in obsessive-compulsive disorder . Neuropsychopharmacology 21 : 683 – 693 .
Scahill L , Riddle MA , Swiggin-Hardin M , Ort SI , King RA , Goodman WK , et al . 1997 . Children ’ s Yale-Brown Obsessive Compulsive Scale: reliability and validity . J Am Acad Child Adolesc Psychiatry 36 : 844 – 852 .
Shaw P , Eckstrand K , Sharp W , Blumenthal J , Lerch JP , Greenstein D , et al . 2007 . Attention-defi cit/hyperactivity disorder is characterized by a delay in cortical maturation . Proc Natl Acad Sci USA 104 : 19649 – 19654 .
Silverman WK AA . 1996 . The Anxiety Disorders Interview Schedule for Children for DSM-IV: (Child and Parent Versions) . San Antonio, TX: Psychological Corporation .
Sowell ER , Thompson PM , Leonard CM , Welcome SE , Kan E , Toga AW . 2004 . Longitudinal mapping of cortical thickness and brain growth in normal children . J Neurosci 24 : 8223 – 8231 .
Spielberger CD , Edwards CD , Montuori J , Lushene R . 1973 . Manual for the state-trait anxiety inventory for children . Palo Alto, CA: Consulting Psychologist Press .
Szeszko PR , Christian C , Macmaster F , Lencz T , Mirza Y , Taormina SP , et al . 2008 . Gray matter structural alterations in psychotropic drug-naive pediatric obsessive-compulsive
Supplementary data available online
Supplementary Figure 1.
Wor
ld J
Bio
l Psy
chia
try
Dow
nloa
ded
from
info
rmah
ealth
care
.com
by
62.1
77.2
25.2
50 o
n 10
/14/
13Fo
r pe
rson
al u
se o
nly.
Related Documents